1. Introduction
The urban environment contains large amounts of semantic data that can be gathered from textual components such as signs, business names, advertisements, and service markers. Those components communicate valuable information about the functions of buildings and other urban facilities, such as restaurants, retail stores, banks, and pharmacies. Panoramic street-level imagery generally displays much of the specified information. At the same time, current 3D city models created for digital twin applications are mainly generated from LiDAR point clouds, which primarily show the physical (geometric) structure of urban features. However, the city models offer little to no functional semantics, which are needed for urban analytics, navigation, resource management, and retrieval tasks [
1,
2,
3,
4].
Mapping urban environments has been greatly improved by Mobile Mapping Systems (MMSs), which capture a variety of multimodal urban data from a moving vehicle traveling along corridors, combining panoramic imagery and LiDAR point clouds. While the panoramic images provide wide, high-quality, visual detail of building facades and existing city infrastructure, the LiDAR point clouds provide a highly accurate three-dimensional (3D) geometric representation of the same area. Previous studies have shown that combining image-derived information with LiDAR geometry can improve understanding and semantic interpretation of urban scenes [
5,
6,
7,
8,
9]. However, these two datasets complement each other within an MMS since they are typically processed separately. Image analysis centers on visual interpretation, while LiDAR processing concentrates on geometric reconstruction and object segmentation. Bridging the gap between image-derived semantic information and LiDAR-based 3D geometry remains a major challenge in creating semantically enriched digital twins.
Recent advances in deep learning-based OCR have significantly improved systems’ ability to detect and read text in complex urban environments. Modern OCR systems can extract text from photos affected by perspective, lighting, or visual complexity. Additionally, OCR can identify various urban features, such as businesses, service providers, and their brands, in 360-degree street-level panoramas [
10,
11,
12]. However, most OCR-based data analysis occurs only within the image domain, resulting in text that lacks the spatial context needed for 3-D environments. Therefore, without methods for linking image data from OCR systems to spatial information from 3-D structures, the semantic content of images cannot be fully integrated into urban 3-D models.
However, LiDAR point clouds are becoming more essential as a main data source for mapping cities, monitoring infrastructure, and building digital models. Airborne and mobile LiDAR systems can accurately generate three-dimensional models of buildings, roads, trees, and other urban features [
1,
12]. However, they typically lack detailed semantic information about how buildings or facilities are used. Most current methods for improving point clouds rely primarily on geometric classification techniques to identify structured objects such as roofs, walls, and trees. Although these methods are generally good at determining the physical categories of objects, they often lack detailed functional semantic information, such as the type of business or the location of services, which is usually inferred from text on signs or in images.
Using text-based information from panoramic street-level imagery to improve LiDAR point clouds allows for the creation of urban 3D models with meaningful semantic data. To support this integration, a suitable geometric framework must be developed to convert pixel-level text detections from 2D images into 3D spatial coordinates. This task is especially challenging with panoramic images in equirectangular projection, because the image coordinates generally represent the best-fit spherical direction relative to the camera rather than a traditional perspective view. Therefore, camera orientation data must be used to establish a framework for accurately mapping pixel coordinates into spatial “rays” in a 3D coordinate system. Additionally, when multiple views from different cameras detect the same text, methods are needed to merge those detections into a single, consistent spatial location within the overall 3D scene.
This study introduces a systematic approach to transform text-based semantics into spatially referenced LiDAR data derived from panoramic street-level images. The method combines OCR, rule-based semantic classification, geometric back-projection, and multi-view spatial fusion. Detected text regions in panoramas are converted into viewing rays and intersected with the LiDAR point cloud to approximate facade locations. Data from various panoramas are then merged through confidence-weighted spatial clustering.
Beyond facility classification, the framework uses capitalization heuristics to directly identify business entity names by processing OCR tokens. This enables identification of specific businesses, as well as general facility classification types. Therefore, the generated semantic data becomes part of the LiDAR point cloud, resulting in a semantically enhanced three-dimensional urban model in which building facade surfaces are linked to functional attributes, as indicated by signage-related text.
In addition to semantic enrichment, the proposed framework adds interactive text-based queries within the LiDAR point cloud environment. End users can search for urban facilities by category (e.g., restaurants), by descriptive keywords (e.g., pizza), or by specific brand names (e.g., Decathlon). The framework then retrieves relevant detections and visualizes their spatial positions within the LiDAR point cloud. This process transforms the point cloud into a searchable semantic map of the urban area.
Compared with existing supervised methods, this proposed framework offers a deterministic, text-driven approach that links OCR-detected text from panoramic images to the geometry of LiDAR point clouds. It further applies back-projection to convert detected text areas into spatial viewing rays, enabling the localization of signage and businesses on building facades within LiDAR point clouds. Rather than developing a new OCR or segmentation model, the innovation lies in systematically integrating OCR on images, geometric back-projection, and multi-view fusion into a functional, queryable semantic mapping system. This process adds a searchable semantic layer to urban LiDAR models, enabling users to find urban facilities by type, keyword, or brand.
The main contributions of this work are summarized as follows:
A panoramic OCR framework that extracts textual information from street-level panoramic imagery using deep-learning-based text detection and recognition.
A rule-based semantic classification method that organizes OCR tokens into urban facility categories using a structured keyword taxonomy and confidence weighting.
A geometry-based back-projection method that transforms text detections in equirectangular panoramas into spatial viewing rays and localizes facade surfaces by intersecting them with LiDAR point clouds.
A multi-view semantic fusion approach that combines detections from multiple panoramas through confidence-weighted spatial clustering to generate stable semantic locations in 3D space.
A queryable semantic mapping system that allows text-based retrieval of urban facilities directly within a LiDAR-based 3D urban model.
Based on these contributions, the study explores the following research questions:
RQ1: How can textual information detected in panoramic street-level imagery be geometrically projected into LiDAR point clouds to achieve spatially accurate 3D semantic locations?
RQ2: What factors affect the spatial accuracy of projected detections when using equirectangular panoramic imagery and LiDAR ray intersection?
RQ3: How effectively can multi-view fusion combine OCR detections from multiple panoramas into consistent semantic representations within the 3D urban environment?
RQ4: To what extent can OCR-derived semantic information enable interactive text-based retrieval of urban facilities within a LiDAR-based 3D model?
In short, the goal of this work is to create a deterministic framework that links textual information extracted from panoramic imagery to LiDAR geometry, enabling semantic enrichment and query-based retrieval within three-dimensional urban point clouds.
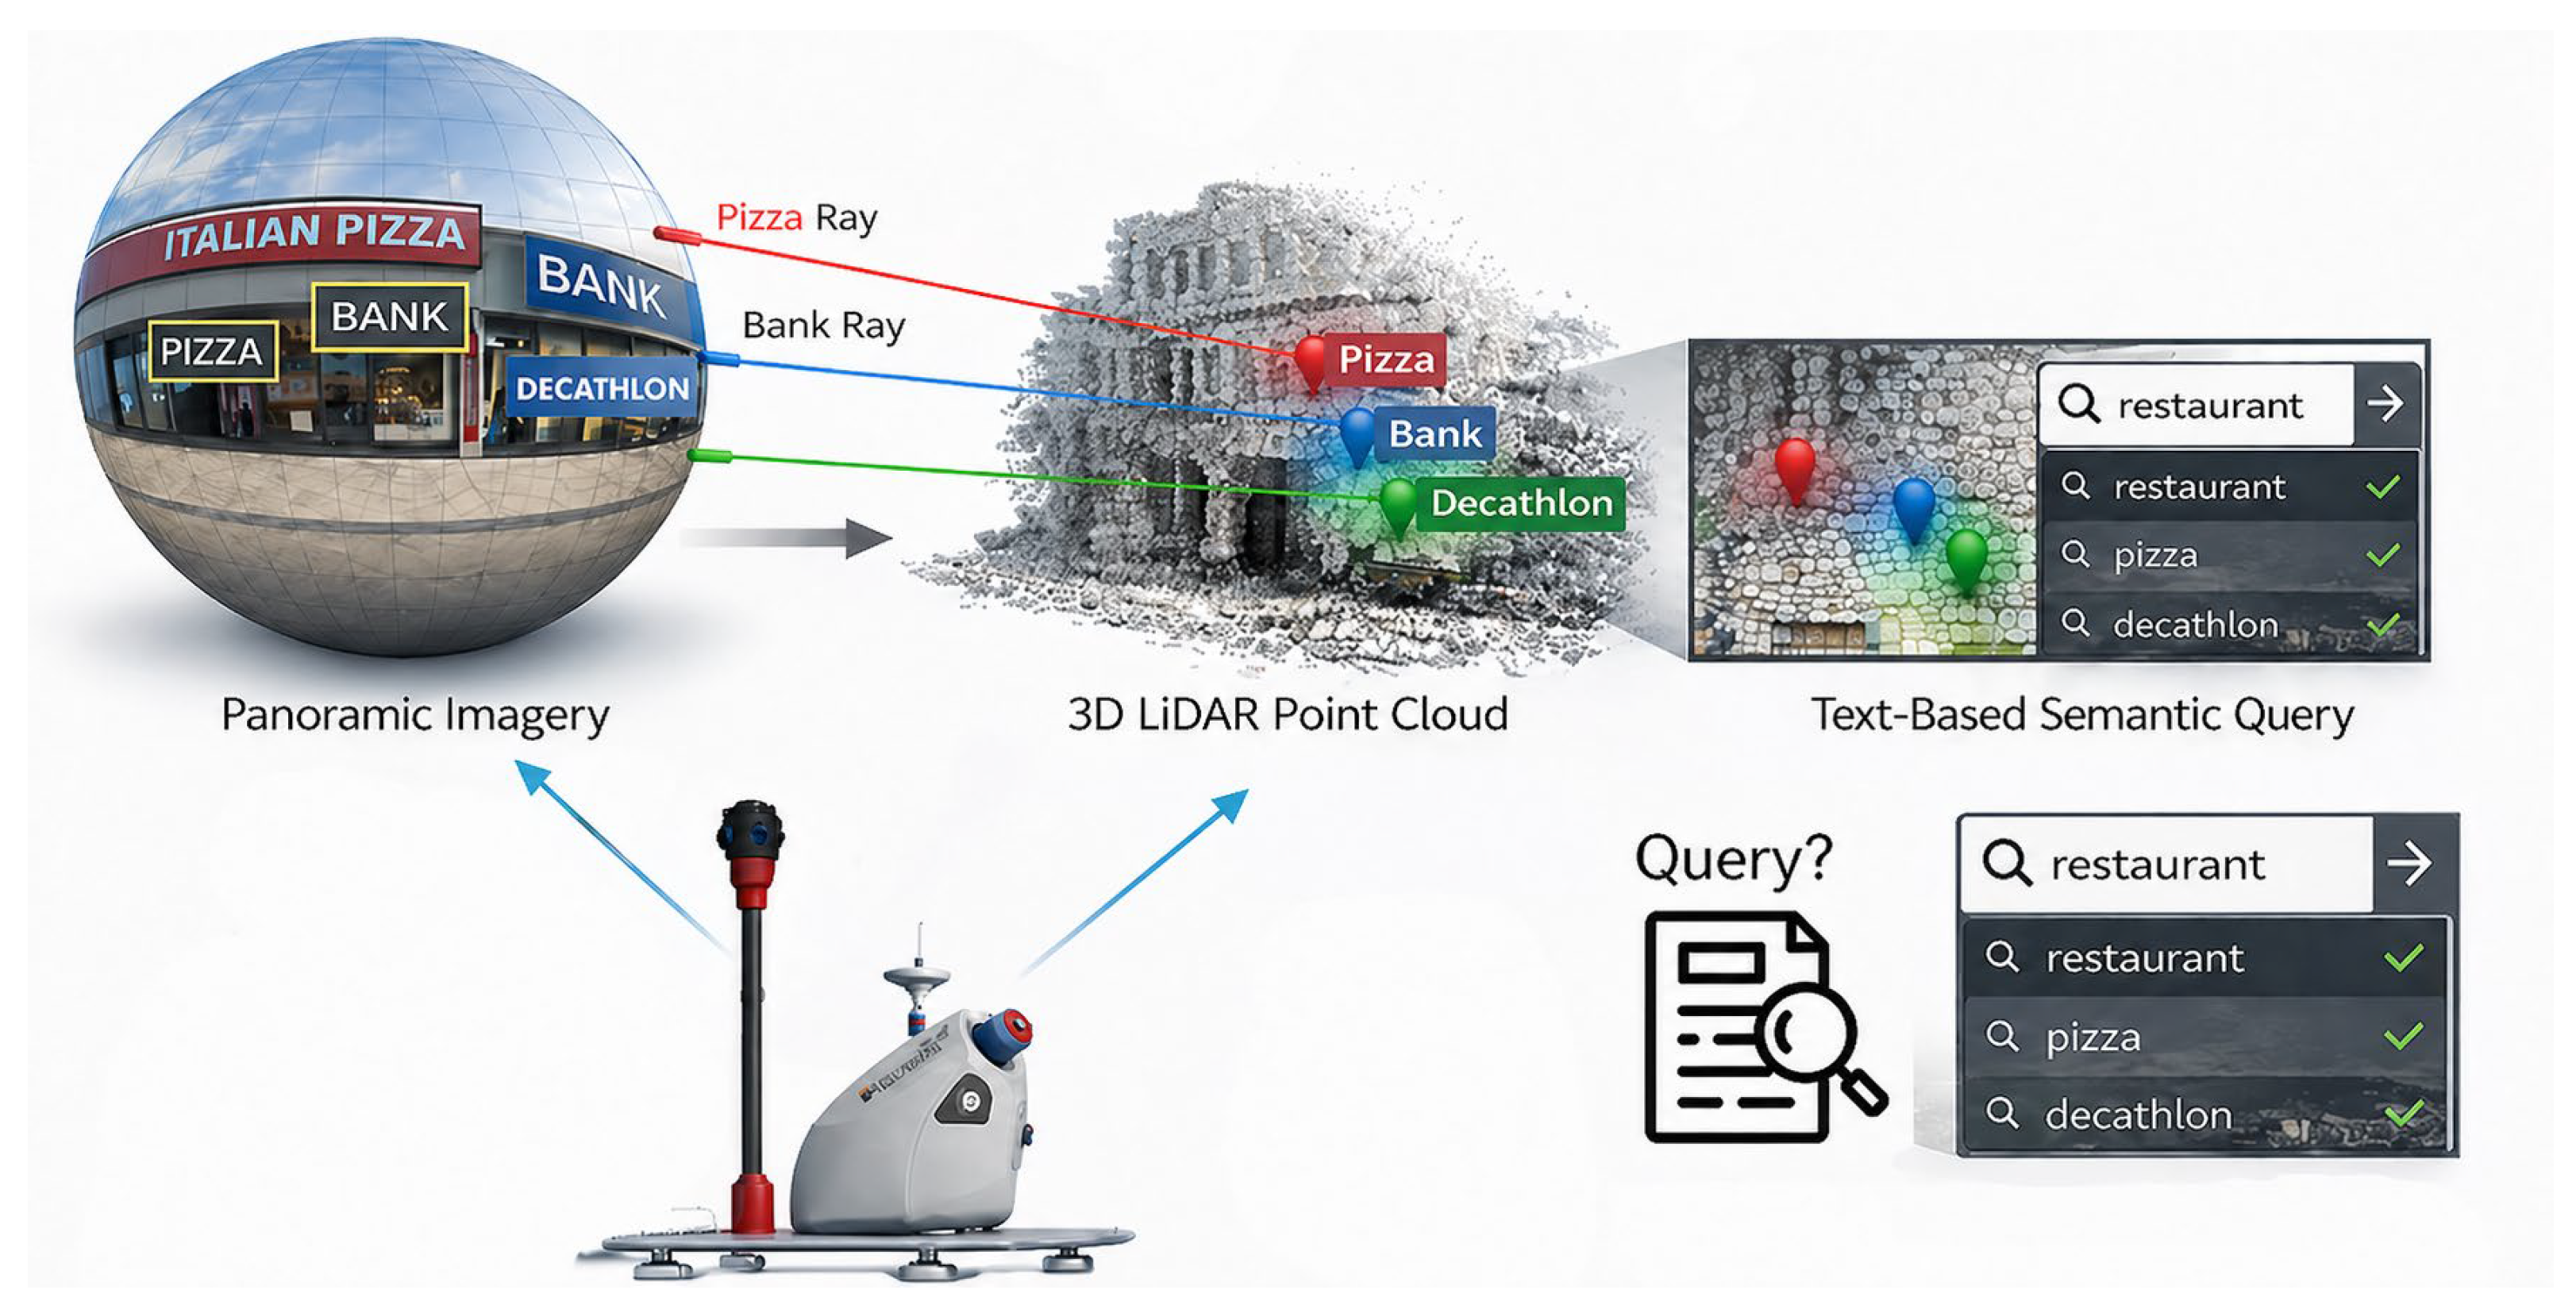
The overall concept of the proposed framework is illustrated in
Figure 1.
Overall, rather than treating OCR as a standalone image analysis task, this study views panoramic text as a source of geospatial semantics and presents a deterministic pipeline to establish these cues as stable, queryable entities within mobile-mapping LiDAR point clouds.
The rest of this paper is organized as follows:
Section 2 reviews related work on OCR in urban imagery, semantic enrichment of point clouds, and multimodal data fusion between images and LiDAR.
Section 3 outlines the proposed methodology, including panoramic OCR processing, semantic classification, geometry-based back-projection, LiDAR intersection, and multi-view semantic fusion.
Section 4 presents the experimental results and assesses the spatial consistency of the identified semantic locations.
Section 5 discusses the framework’s strengths, limitations, and possible extensions. Finally,
Section 6 summarizes the study and proposes directions for future research.
2. Related Work
2.1. Semantic Segmentation of LiDAR Point Clouds
Currently, semantic segmentation of LiDAR point clouds is widely used to understand urban environments. It involves recognizing structures such as buildings, roads, vegetation, and other infrastructure. Early methods mainly used manual, or “hand-crafted,” geometric feature descriptors and traditional machine-learning classifiers. In contrast, recent techniques apply deep learning neural networks that operate directly on LiDAR point clouds. Recent research has led to the development of more advanced models designed to improve feature extraction and contextual understanding; for example, Wang et al. [
12] combined fusion attention with multi-scale learning to improve urban airborne LiDAR data segmentation. Zhang et al. [
13] developed a dual-attention network to capture spatial and channel dependencies in airborne LiDAR datasets.
Recent studies have investigated transformer architectures for modeling long-range dependencies in urban scene environments. Xia et al. [
14] introduced PGFormer, a point cloud segmentation framework that integrates grouped Transformer layers with KPConv to capture both local and global features effectively. Li et al. [
15] introduced a projection-based technique that transforms LiDAR point clouds into structured data for CNN-based semantic segmentation.
The literature shows that multi-feature aggregation improves segmentation by integrating geometric, radiometric, and contextual data descriptors. Chen et al. [
16] showed that merging multiple features significantly boosts semantic classification in urban point clouds. The development of large annotated datasets has accelerated research. The SemanticKITTI dataset, created by [
6], is widely used as a benchmark in autonomous driving research. It provides detailed, labeled LiDAR sequences for semantic scene understanding. Similarly, the WHU-Urban3D dataset, created by Han et al. [
17], provides detailed annotations for urban LiDAR point clouds, facilitating semantic instance segmentation tasks.
Despite these improvements, semantic segmentation of LiDAR point clouds continues to encounter difficulties due to missing texture details, sparse and uneven point distributions, and inherent geometric uncertainties. As a result, recent studies often prefer multimodal approaches that combine LiDAR data with complementary image-based information, as mentioned in
Section 2.2.
2.2. Multimodal Fusion of LiDAR and Images
Multimodal fusion has shown great success in enhancing scene understanding by fusing LiDAR point clouds with image data. In addition to providing radiometric details such as color and texture, images enable semantic labeling of geometric structures. As a result, LiDAR point clouds that normally lack texture are improved both visually and semantically.
Many studies have investigated fusion methods that integrate LiDAR and image information. Ballouch et al. [
4] proposed an effective prior-level fusion method that combines point cloud data with semantic information obtained from images. Their approach significantly improved urban semantic segmentation, achieving up to 88% precision on the SensatUrban dataset. Other methods incorporate semantic and geometric features within unified deep learning frameworks.
Chen et al. [
5] introduced the PanoNet3D model that integrates semantic information from images with geometric LiDAR features for improving 3D object detection in autonomous driving. Similarly, Wu et al. [
6] developed the JoSS framework, which simultaneously processes LiDAR point clouds and camera images for semantic segmentation. This framework reported strong performance on large-scale LiDAR-camera datasets. However, it focuses on traditional semantic classes and does not use OCR-derived text cues as semantic entities for geometric localization and text-based queries in urban 3D environments.
In the same context, multi-view integration methods have also been investigated. Liu et al. [
7] developed MVG-Net, which integrates multi-view image data with LiDAR point-cloud segmentation networks to improve semantic classification accuracy. Shuai et al. [
8] introduced a geometry-injected, image-based segmentation method that uses LiDAR-derived geometric cues to guide semantic classification.
Although all the approaches mentioned above highlight the benefits of multimodal fusion, most rely on supervised deep learning models that require large, annotated datasets. Additionally, they primarily focus on visual appearance and geometric features, often overlooking the textual information commonly present in urban environments.
2.3. Urban Scene Modeling and Digital Twin Construction
The creation of smart city models and urban digital twins relies heavily on enriching point clouds with semantic information. Use cases such as navigation, urban planning, and infrastructure monitoring benefit from incorporating semantic data into 3D urban visualizations. Numerous studies have focused on integrating LiDAR data with Building Information Models (BIMs) to enhance urban digital modeling. An Urban GeoBIM framework that combines as-designed BIMs with semantic LiDAR point clouds was presented by Shao et al. [
18]. The goal of this merging model is to assist infrastructure management and construction monitoring.
To facilitate digital modeling of urban environments, additional research focuses on extracting geometric data from LiDAR datasets. A framework for digital modeling and geometric information extraction from LiDAR data gathered in road scenarios was introduced by Wang et al. [
1].
In heritage documentation, artificial intelligence methods have also been used to enrich architectural point clouds with semantic information. Buldo et al. [
2] showed that AI-based techniques can enrich the semantics of heritage point clouds, thereby creating more detailed digital representations of historic buildings.
Furthermore, Koszyk et al. [
3] examined the semantic segmentation-based integration of point clouds collected from mobile scanning platforms in urban areas, emphasizing the importance of semantic labeling for urban mapping workflows.
2.4. Text-Based Semantic Understanding in Urban Environments
Text found in urban environments, such as shop signs, brand names, advertisements, and street labels, serves as a valuable yet often underutilized source of semantic information. Extracting text from panoramic street-level imagery can greatly enhance urban scene understanding and create new opportunities for semantic queries in digital city models.
Early research by Babahajiani et al. [
19] examined urban scene modeling by combining street-view imagery with LiDAR point clouds. Their study showed that merging visual data with geometric information can significantly enhance urban scene comprehension.
More recently, Cohen et al. [
9] introduced TexLiDAR, a framework for automated text analysis in panoramic LiDAR datasets. Their work highlights the potential of incorporating textual data into LiDAR-based urban mapping systems. However, TexLiDAR primarily focuses on automating text comprehension in panoramic LiDAR data. In contrast, this research aims to transfer OCR-extracted text from panoramic street-level images to georeferenced mobile-mapping LiDAR point clouds to serve as queryable semantic facility markers.
Most recent research focuses either on semantic segmentation of point clouds or on image-based text recognition. Only a limited number of studies have addressed the integration of textual information from panoramic imagery into LiDAR-based 3D urban models. For example, Mai et al. [
10] examined 3D text localization from point clouds using virtual projections. Their approach focuses on recognizing and localizing text in projections derived from point clouds. In contrast, the proposed framework first detects text regions in equirectangular panoramic images and then projects them into LiDAR space using the known exterior orientation of the mobile mapping platform.
Additionally, Doi et al. [
11] investigated the automatic detection and 3D positioning of commercial signboards using 360° mobile mapping imagery. While our research is closely linked to signboard localization, it further expands the concept of [
11] by incorporating semantic facility categorization, business-name extraction, confidence-weighted multi-view fusion, and interactive text-based retrieval by category, keyword, and brand within the LiDAR point cloud. However, the use of OCR-derived textual cues from panoramic images to enrich LiDAR-based urban models remains relatively limited.
2.5. Research Gap
LiDAR semantic segmentation, multimodal fusion, and urban modeling have made significant progress. However, most existing methods still focus mainly on geometric or visual features, while the rich textual information present in urban scenes, such as storefront signs, brand names, and service descriptions, remains largely underused.
Although modern OCR techniques can effectively detect and interpret text in panoramic street-level imagery, this information is usually analyzed only in the image domain and is rarely linked to three-dimensional spatial data structures. In addition, many current multimodal fusion methods rely on supervised deep learning models that require large annotated datasets, which limits their practical applicability in many urban mapping scenarios. Consequently, a gap remains in the development of a practical, deterministic framework that systematically connects OCR-derived text from panoramic images to LiDAR point clouds and supports the semantic retrieval of urban facilities in 3D space. This gap is not just about missing OCR, signboard detection, or 3D text localization, as studies have already tackled parts of these issues. Instead, the key gap is the lack of an understandable end-to-end workflow that transforms OCR-extracted text from panoramic mobile-mapping images into facility-level semantic markers within LiDAR point clouds.
The contribution of this study is to combine panoramic OCR, rule-based semantic classification, equirectangular back-projection, facade-level LiDAR intersection, multi-view semantic fusion, and query-based retrieval into a unified, interpretable workflow. This approach produces searchable facility-level annotations from mobile-mapping LiDAR point clouds.
3. Methodology
This study presents a framework for extracting semantic data from mobile mapping systems equipped with street-level panoramic images and georeferenced LiDAR point clouds. The process combines OCR, rule-based semantic classification, geometry-driven back-projection, and fusion of multi-view spatial analysis. The main aim is to convert textual information visible in street panoramas (such as shop signs) into spatially anchored semantic labels within a 3D urban model.
The methodology consists of four main stages:
Text detection and recognition in panoramic imagery.
Semantic classification of detected text.
Geometry-based 3D ray projection from panoramas.
Multi-view spatial fusion and semantic mapping in LiDAR.
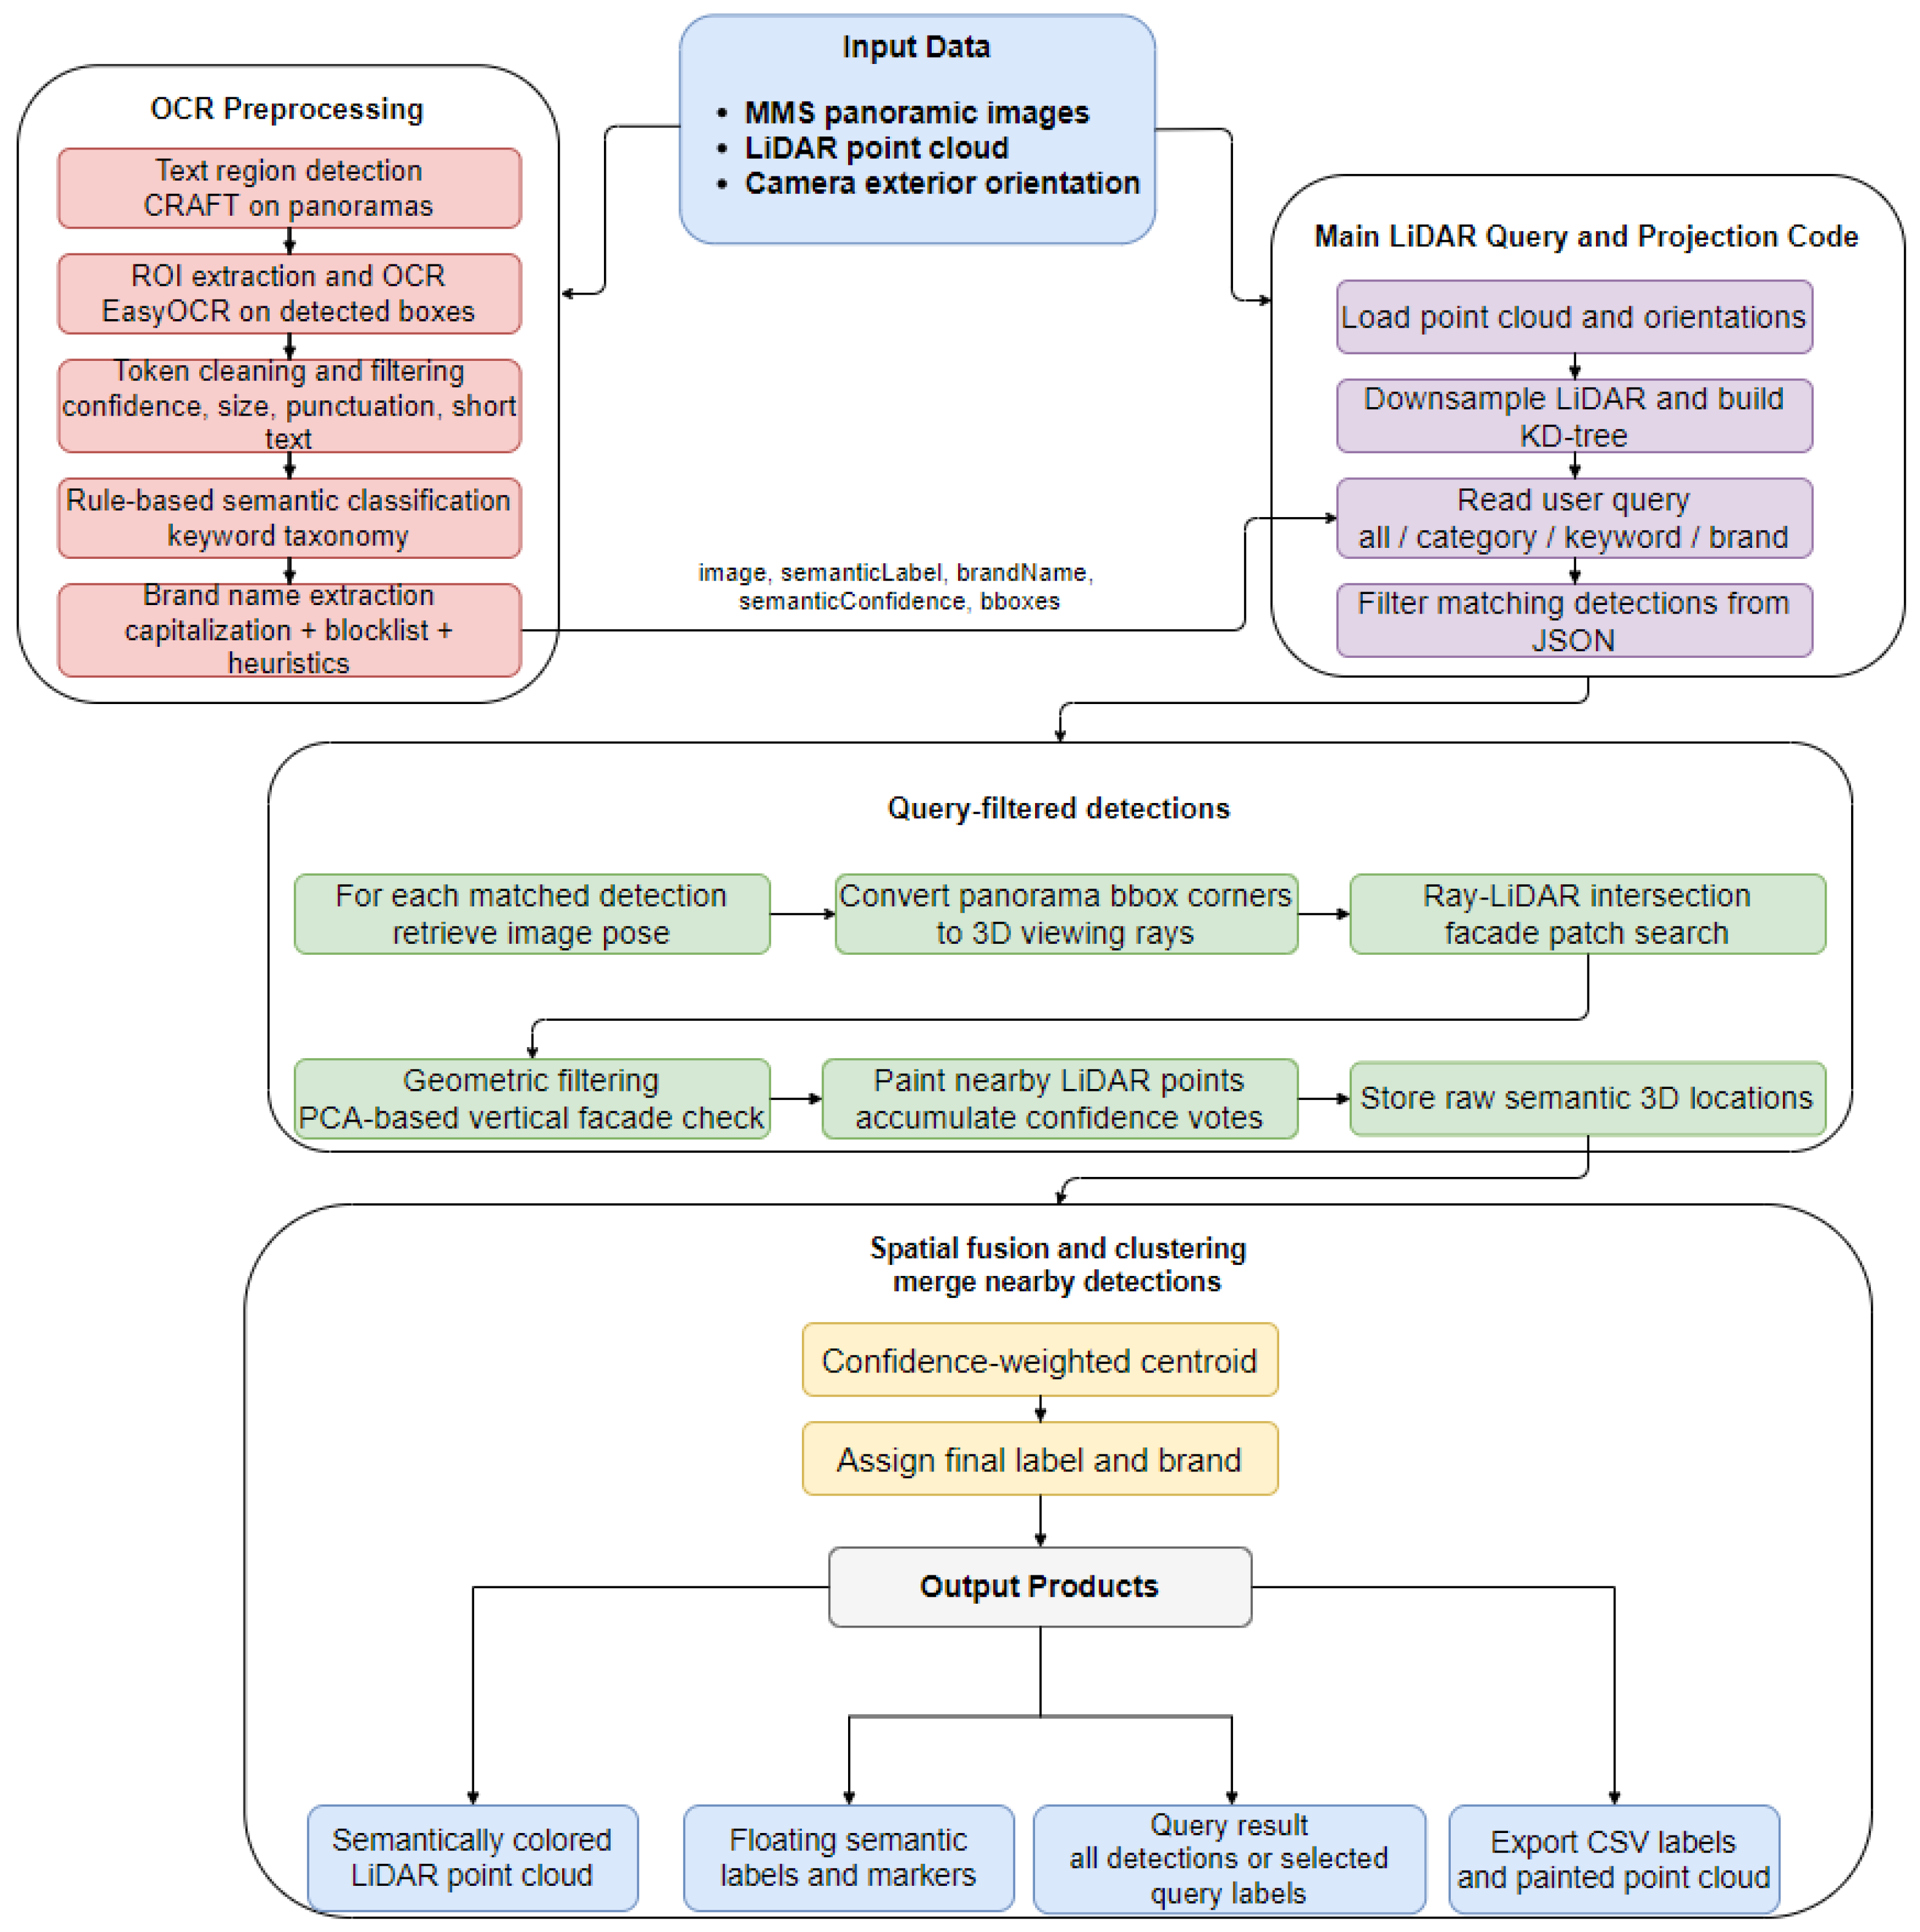
The overall workflow of the proposed framework is shown in
Figure 2. The method consists of four main modules: OCR-based semantic extraction from panoramic images; query-driven filtering and LiDAR preprocessing; geometry-based 3D localization of semantic detections; and spatial fusion for final semantic labeling and output generation. The colors used are blue for inputs and outputs, red for OCR semantic extraction, purple for LiDAR query and filtering, green for geometric 3D projection and localization, and yellow for spatial fusion and final semantic assignment.
3.1. Data Inputs
The framework requires three primary data sources:
- 1.
Street-level panoramic images captured by a mobile mapping system.
- 2.
Camera exterior orientation parameters for each panorama. These include the 3D camera center and full attitude info of roll, pitch, and heading angles. These 6-DoF pose parameters define the geometric relationship between the panoramic image sphere and the LiDAR point cloud coordinate system.
- 3.
A georeferenced LiDAR point cloud of the urban environment. This LiDAR dataset provides a dense spatial representation that includes geometric information.
3.2. Text Detection and Recognition
To extract textual data from panoramic images, a two-step process is applied: (1) identify potential text areas through detection, and (2) apply OCR. The first step locates text regions with the CRAFT text detector and draws a bounding box around the candidate area within the panoramic image. Next, a size filter is applied to eliminate noise and very small detections from the bounding box list. After identifying the valid text boxes, the corresponding image patches containing those boxes are extracted and processed through the EasyOCR OCR engine. The EasyOCR engine evaluates the extracted patches and provides two pieces of information: (1) the recognized text and (2) an associated confidence score, ranging from 0 to 1. Only detections with confidence and length above the thresholds are used. In summary, the output of this step will include:
This process is carried out for each panorama in the dataset.
It is worth mentioning that both the CRAFT text detector and the EasyOCR recognition engine depend on pretrained deep learning models. Although the geometric projection and semantic fusion stages are deterministic, the initial text extraction remains data-driven and is affected by the pretrained model’s limitations. In urban imagery, OCR performance suffers from equirectangular imagery distortion, oblique angles, small text, complex fonts, multilingual text, shadows, reflections, motion blur, and occlusions by pedestrians, vehicles, trees, or street furniture. Missed detections prevent semantic elements from being projected into the LiDAR point cloud, thereby lowering recall. Misrecognition can also lead to incorrect labels, propagating errors through classification, query, and fusion. Therefore, applying OCR confidence filtering and multi-view consistency should help reduce false detections, but cannot completely eliminate OCR errors.
3.3. Semantic Classification of Detected Text
Recognized text tokens are then classified into semantic categories that represent common urban facilities. The classification uses a rule-based matching system with curated keyword dictionaries. Each dictionary includes multilingual keywords linked to a specific semantic class (e.g., restaurant, supermarket, pharmacy). Examples include:
RESTAURANT: restaurant, cafe, pizza, grill, eetcafé.
SUPERMARKET: supermarket, market, Lidl, Jumbo.
BANK: bank, ATM, ING, Rabobank.
For each panorama, all detected tokens are compared to these keyword dictionaries. A semantic score is calculated based on the number of matches for each class:
where
is the recognized text token and
is the keyword set for class
.
The semantic class with the highest score is assigned to panorama detection, and a normalized confidence score is calculated based on the number of matches. This method offers a lightweight, interpretable semantic classification system that does not require supervised training data.
3.4. Geometry-Based Back-Projection from Panoramas
To incorporate textual detections into the 3D environment, each bounding box must be transformed into a spatial viewing direction originating from the panorama. For a panorama with the camera center at , a rotation matrix is constructed from the recorded roll, pitch, and heading angles. Together, the camera center and attitude angles define the 6-DoF pose parameters that specify the geometric relationship between the panoramic image and the LiDAR point cloud coordinate system. The matrix converts world coordinates into the camera reference frame.
Given a 3D point
, the camera coordinates are computed as
From the camera coordinates
, the spherical angles corresponding to an equirectangular panorama are calculated as
The spherical coordinates are then mapped to pixel coordinates
in the panorama:
where
and
denote the panorama width and height. For each bounding box, the four corners are converted into 3D viewing rays. These rays represent the spatial directions corresponding to the detected text region.
To back-project an OCR detection from the panorama into 3D space, the inverse equirectangular mapping is applied. For a pixel coordinate
, the corresponding longitude
and latitude/elevation angle
are computed as:
The corresponding unit viewing direction in the camera coordinate system
is then obtained as
where the sign convention follows the camera coordinate definition used in Equations (3) and (4). The viewing direction is transformed into the world/LiDAR coordinate system using the camera’s rotation matrix.
Thus, the 3D ray corresponding to the pixel
is expressed as
where
is the corresponding unit viewing direction in the world/LiDAR coordinate system,
is a 3D point along the ray. Since
in Equation (2) maps world coordinates to the camera frame,
is used to transform ray directions from the camera frame back to the world/LiDAR coordinate system.
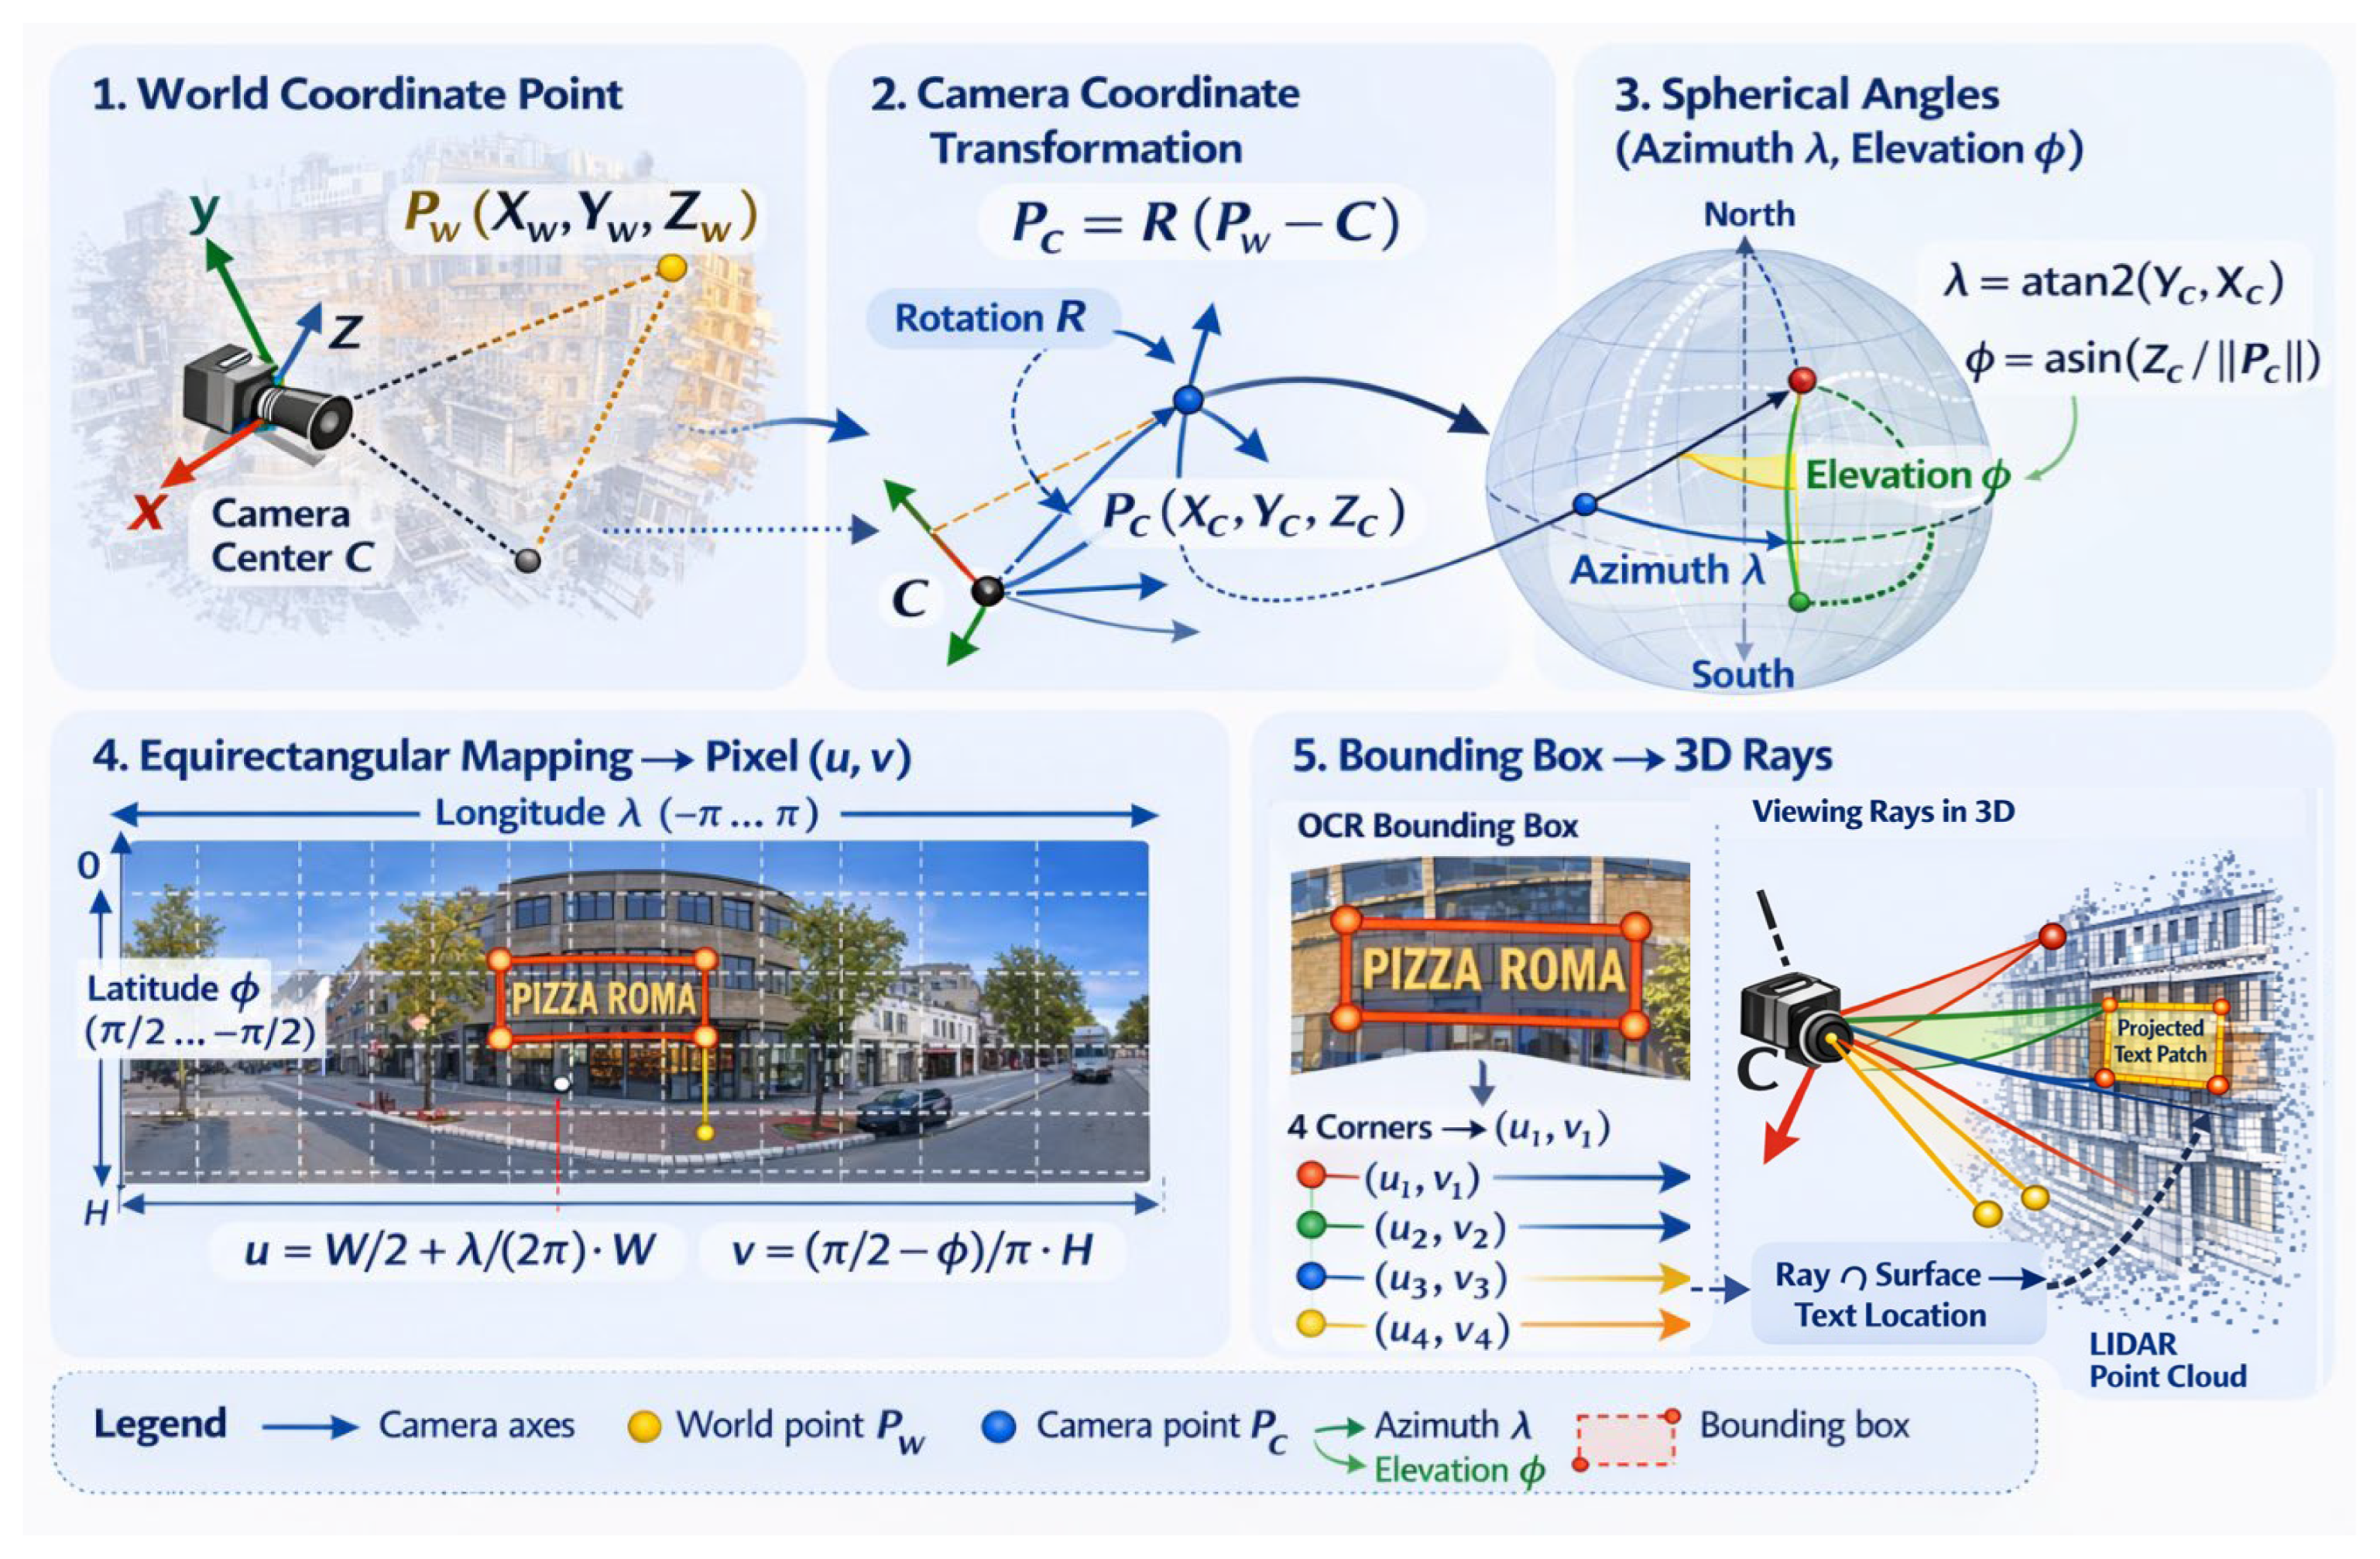
The geometric relationship between the world coordinate system, camera projection, spherical angles, and the equirectangular panorama mapping is illustrated in
Figure 3 (steps 1 to 4).
While rectilinear projections can reduce distortion, they require multiple views and additional transformations. Processing the panorama images directly offers complete 360° coverage and allows straightforward conversion to spherical rays for back-projection. The aim of this study is not to improve OCR performance but to present a geometric integration framework that connects panoramic image text detection to LiDAR point clouds. Direct panoramic image processing maintains a one-to-one correspondence between pixel coordinates and viewing directions, which simplifies the projection pipeline.
3.5. Intersection with the LiDAR Point Cloud
To physically locate a detected sign or text object, viewing rays intersect with the LiDAR point cloud, which is initially downsampled via voxel grid filtering to accelerate spatial queries. A KD-tree is constructed to enable efficient nearest-neighbor searches. For each viewing ray, candidate points along the ray are evaluated within a certain distance range. Points close to the ray and within a specified radius are considered potential intersections with building facades.
These points represent the spatial surface on which the detected text is located. Ray marching proceeds in two stages. A coarse pass steps along the ray at intervals of = 0.5 m within the range [, ] = [1, 80] m, collecting downsampled point cloud points within a hit radius = 0.2 m. The step with the highest point density serves as the seed position. A fine pass is then performed at = 0.05 m in a narrow window around the seed to refine the facade estimate. Points within a paint radius = 3.0 m of the identified patch are labeled with the semantic class color.
Strong keyword matches carry a weight of 2 to the semantic score, while weak keyword matches carry a weight of 1. Weak keywords detected with low OCR confidence are accepted only when they appear across multiple tokens, thereby reducing false positives.
It is important to note that an alternative method is to triangulate text locations by intersecting viewing rays from multiple panoramas that observe the same text instance. However, OCR detections correspond to extended text regions rather than exact point features, and bounding box centers can vary across images due to partial visibility or detection inconsistencies. Therefore, direct ray–ray intersection could lead to unstable estimates. Instead, the proposed framework intersects each viewing ray with the LiDAR-derived facade surface, providing a geometrically stable support for the detected text. Multi-view consistency is then achieved through spatial clustering of the projected detections.
Figure 3 summarizes these geometric projection steps.
3.6. Multi-View Detection Fusion
The same object may be detected in multiple panoramas. To prevent duplicate detections, a spatial fusion strategy is used. For each semantic class, the detected 3D locations are grouped based on horizontal distance. Detections within a set merge radius are considered to represent the same object. The combined location is calculated as a confidence-weighted centroid:
where
represents the detection location and
is the corresponding confidence score.
The final confidence of the merged detection is set to the maximum confidence among the contributing observations. This process consolidates multiple detections into a stable semantic location within the 3D scene. Spatial fusion is applied independently per semantic class to avoid cross-category merging. Within each class, detected centroids within a horizontal merge radius of = 8 m are clustered. This prevents detections of a restaurant on one side of the street from being merged with those of a restaurant farther along the same street.
3.7. Semantic Mapping and Visualization
Finally, the identified semantic locations are integrated into the LiDAR point cloud as geometry-aware semantic annotations. For each fused detection, the anchor point of the semantic annotation is defined by the merged semantic location , computed from the confidence-weighted centroid of the contributing projected detections. To align the annotation with the local scene geometry, neighboring LiDAR points around are selected, and a local facade plane is estimated using principal component analysis (PCA). The normal vector of this plane, denoted by , is used to define the outward direction of the facade.
The displayed semantic tag
is positioned with a small offset from the facade surface to avoid visual overlap with the point cloud. Its 3D anchor position is defined as
where
is the outward offset along the local facade normal,
is the vertical offset used to place the label above the detected facade region, and
is the vertical unit vector of the world coordinate system. In our experiments, fixed metric offsets were used for visualization, but these parameters can be adjusted based on point-cloud density, facade scale, or specific application needs.
The tag plane is oriented approximately parallel to the local facade plane. Its horizontal axis is defined by
and its vertical axis is defined by
Together, and define the local coordinate frame of the tag plane. The tag is assigned metric dimensions and , corresponding to its width and height in 3D space. These dimensions are only for visualization and displaying semantic annotations, as they do not alter the underlying projected semantic position. The final visualization shows a semantically enriched urban point cloud where OCR-derived text is spatially integrated and geometrically aligned with the 3D environment.
3.8. Interactive Semantic Query
To make the enriched point cloud more practical for use, the framework applies an interactive semantic query tool. End-users can search the dataset by facility category (e.g., “restaurant”), keyword (e.g., “pizza”), or business name (e.g., “Decathlon”). The proposed query engine compares the user input against the semanticLabel and brandName attributes stored in the OCR results. Keywords are managed with a taxonomy that links words to facility categories, while brand queries search directly for business names. Matching detections are projected onto the LiDAR point cloud and visualized as color-coded points with floating semantic labels, as will be shown in
Section 4. Nearby detections within the same facility are merged through spatial clustering to establish stable semantic locations. This feature enables text-based retrieval of urban facilities in the point cloud environment.
To reduce false semantic detections caused by reflections, windows, or temporary signage, a geometric filtering step is introduced based on local LiDAR surface orientation. For each projected detection, a local plane is fitted to neighboring LiDAR points using principal component analysis (PCA). Detections whose surface normals deviate from vertical facade orientation are discarded.
The query-driven semantic projection and spatial fusion process is summarized in Algorithm 2.
| Algorithm 2: Query-Based Semantic Projection and Fusion in LiDAR Space |
Load LiDAR point cloud P
Downsample P to obtain Pd
Construct KD-tree index for Pd
WHILE query session active DO
Read user query Q
Determine query type
category query
keyword query
brand query
Identify matching detections
H ← filter detections D according to Q
FOR each detection d ∈ H DO
Retrieve camera pose
C ← camera center
R ← rotation matrix
FOR each bounding box corner of d DO
Convert pixel coordinate to world ray
r ← panoPixelToWorldRay(u,v)
Perform ray–point cloud intersection
hit ← rayHitKD(C,r,Pd)
IF hit valid THEN
add hit to the facade patch
ENDIF
ENDFOR
Estimate detection centroid
centroid ← mean(facade patch points)
Paint nearby LiDAR points around the centroid
accumulate confidence votes
Store raw semantic location
ENDFOR
Cluster raw semantic locations by spatial distance
FOR each cluster DO
Compute the weighted centroid
Assign label and brand from the highest-confidence detection
Store merged semantic location
ENDFOR
Visualize semantic labels in the point cloud
Export semantic coordinates and colored point cloud
ENDWHILE |
4. Experiments and Results
This section assesses the proposed framework for transferring semantic information from panoramic images into a LiDAR point cloud. The experiments aim to determine whether textual information detected in street-level panoramas can be accurately projected into three-dimensional (3D) space and integrated into a georeferenced point cloud of the urban environment. The evaluation concentrates on three main aspects of the framework. First, the OCR performance is assessed, and the semantic classification stages are used to identify urban facilities and business names in panoramic images. Second, the geometric projection process is analyzed to determine whether detected text regions are spatially aligned with the correct facade locations in the LiDAR point cloud. Third, the effectiveness of the multi-view fusion strategy is evaluated by combining detections from multiple panoramas to produce consistent semantic locations in the 3D environment.
Two mobile mapping system datasets were acquired and georeferenced to provide panoramic imagery and LiDAR point cloud data for the same area. The datasets were obtained from different urban locations: one was a densely built commercial street suitable for OCR-based text detection and identification; the other was used for more general testing in a more variable urban area. Each dataset’s images were processed through an OCR workflow to detect and identify text, followed by using a rule-based system for semantic classification. The identified textual regions were projected into three-dimensional space using the geometry-based back-projection technique, and their potential locations on the building facade were determined by intersecting these projections with the associated LiDAR scans. Detections from multiple panoramas were fused to produce stable 3D semantic markers. Details on the datasets, implementation, and results are provided in the following subsections. The rationale for selection and the sensitivity implications of the main geometric and processing parameters are summarized in
Appendix A.
To enhance reproducibility and clarify the data specifications for both experiments,
Table 1 summarizes the key acquisition and processing parameters for the two mobile mapping datasets. This includes details about the panoramic imaging system, its resolution, the LiDAR scanner model, point cloud size, and downsampling settings.
4.1. Experiment 1 Setup
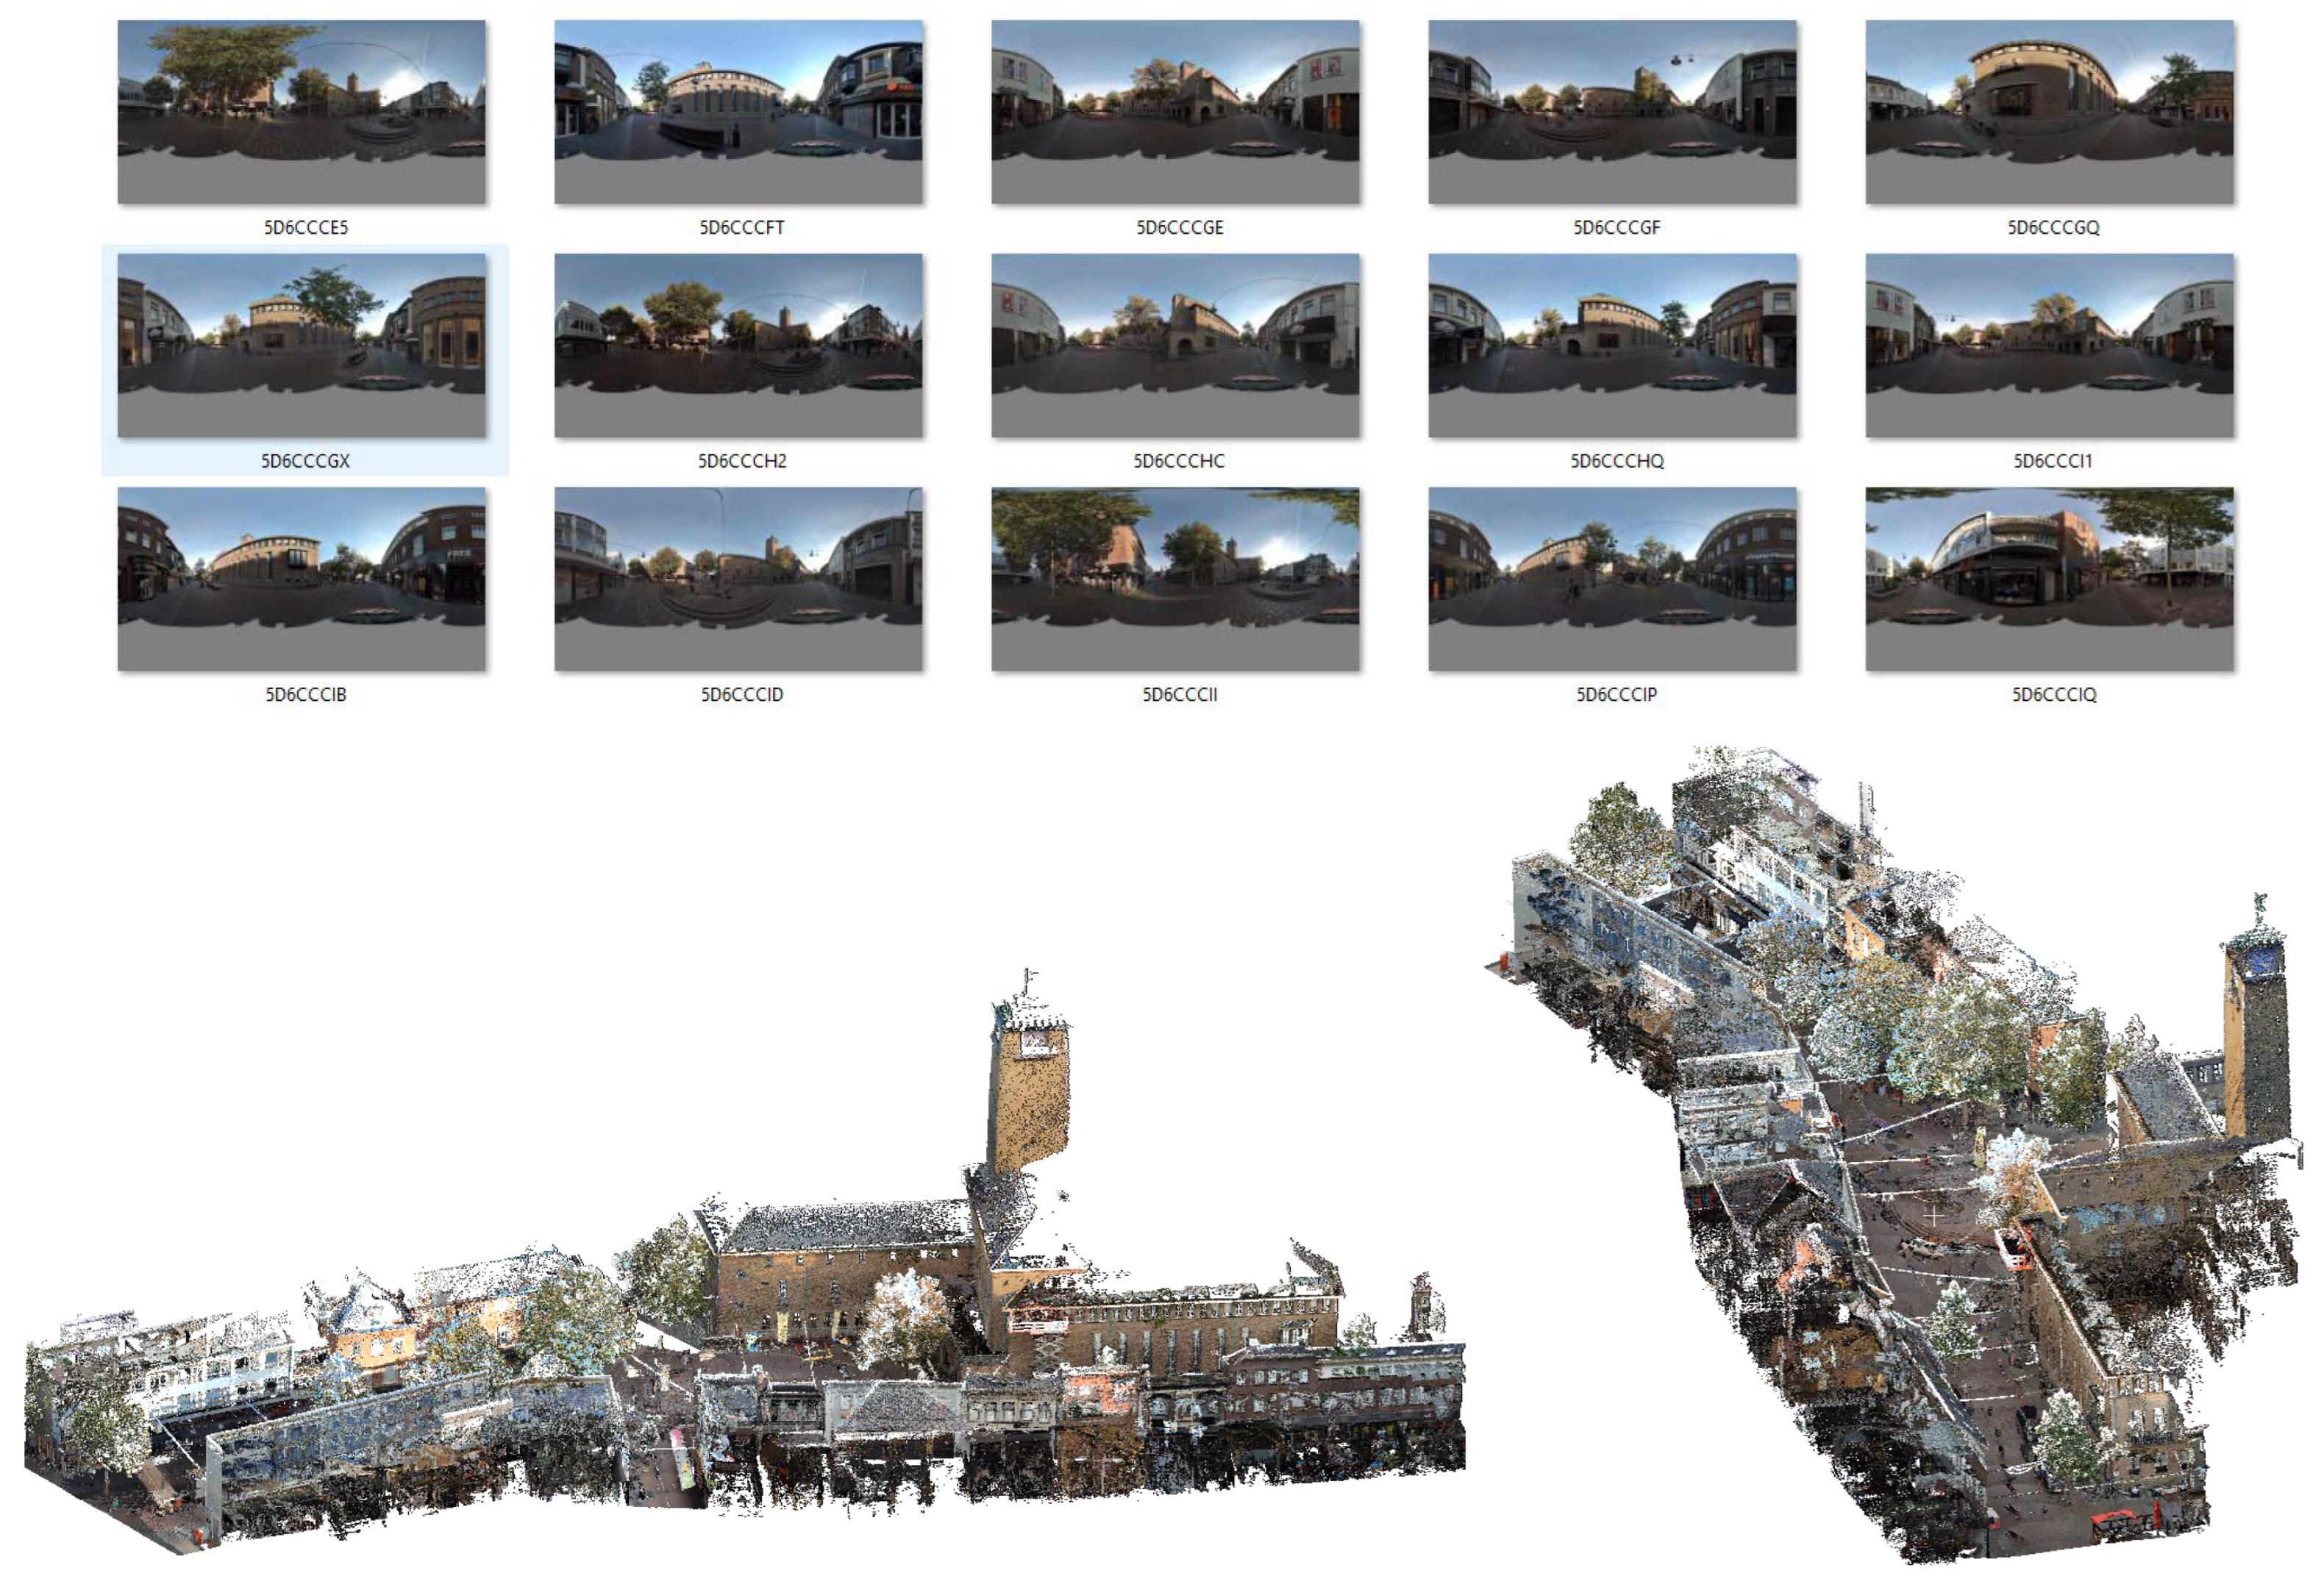
The experiments used a mobile mapping dataset collected in Enschede, the Netherlands. The dataset contains 65 georeferenced panoramic images taken from a CycloMedia mobile mapping platform (see
Figure 4). Each panorama is saved in an equirectangular projection at 4800 × 2400 pixels, providing a complete 360° horizontal view. The panoramic images are accurately georeferenced to a simultaneous HDL-32E LiDAR point cloud that was created using the Velodyne HDL-32E laser scanner; the LiDAR data is stored in the LAS format and contains a dense amount of three-dimensional measurements of the urban environment (e.g., building facades, street surfaces, vegetation, and streetscape elements). Since both the panoramic images and LiDAR point cloud originated from the same mobile mapping platform, they have a common georeferenced coordinate system. As a result, textual detections from the panoramas can be directly projected into the three-dimensional LiDAR environment without requiring any additional registration. The study area contains a commercial street environment with a variety of businesses (e.g., restaurants, clothing stores, retail stores). These conditions offer a suitable test scenario for evaluating OCR-based semantic extraction and its spatial integration into a LiDAR point cloud.
4.1.1. OCR Semantic Extraction Results
The OCR-based semantic extraction pipeline was applied to 65 panoramic images from the dataset. It identified text related to storefront signage and classified these into semantic facility groups following the rule-based taxonomy described in
Section 3. From the overall OCR semantic results at the panorama level, the pipeline detected 52 semantic instances across these images. These detections were grouped via spatial clustering, yielding 14 distinct facility locations within the study area. The identified facilities include typical urban commercial functions such as clothing stores, retail outlets, health and wellness services, and hospitality venues.
Table 2 summarizes the overall OCR extraction statistics.
Each detection was assigned a semantic confidence score between 0.5 and 1.0, based on the number and strength of keyword matches within the detected tokens. Stronger matches received a score of 1.0, while weaker, single-keyword matches were scored at 0.5. On average, the OCR pipeline generated about 0.80 semantic detections per panorama, reflecting multiple views of storefront signs from different angles during mobile capture mapping.
Panoramic imagery is especially effective for semantic extraction because storefront signage is visible from multiple angles along the route. This multi-angle perspective allows the system to recognize the same facility across different panoramas before merging the observations into a single spatial point. Visual verification confirmed that most of the detected facilities match the storefronts visible in the panoramic images, indicating that the OCR and semantic classification steps successfully extracted relevant urban semantic information.
To assess semantic extraction performance, the OCR detections were compared against a strict ground-truth set of 12 annotated facilities. Because the OCR output is stored per panorama, while the ground truth is organized per facility with grouped panorama identifiers, a detection was considered correct when its panorama belonged to a ground-truth facility and its semantic label matched the annotated category. Detections that did not satisfy both conditions were counted as incorrect when computing precision, recall, and F1-score. Under this evaluation, Experiment 1 achieved a precision of 0.385, a recall of 0.667, and an F1-score of 0.488. These values show that the system recovered a significant part of the annotated facilities. However, it also produced a noticeable number of extra detections, especially in dense storefront areas where repeated signage and visually similar shop fronts increased semantic confusion and ambiguity.
To assess the computational efficiency of the OCR semantic extraction stage, processing times were recorded for each module on the first experiment dataset. Initializing EasyOCR took 1.473 s. The entire OCR process took 349.586 s, averaging 5.378 s per panorama. Module-specific timing revealed that image reading took only 0.106 s per panorama, which is 2.0% of the total processing time. CRAFT text detection accounted for 1.596 s per panorama, or 29.7% of the total time. EasyOCR was the most time-consuming step, taking 3.651 s per panorama and accounting for 67.9% of the total OCR time. Semantic classification was minimal, taking just 0.016 s per panorama and constituting 0.3% of the overall runtime. These findings suggest that the OCR recognition stage, not the rule-based semantic classification, is the primary bottleneck in the image-based semantic extraction process.
To explicitly assess the interactive query feature for RQ4, a case study on query-based retrieval was performed using a manually verified subset of semantic detections from Experiment 1. The query tool allows searches by category, keyword, and brand, matching user input with the stored semanticLabel and brandName attributes. For each query, the system retrieves relevant semantic markers, projects them into the LiDAR point cloud, and compares the retrieved locations with manually verified relevant facilities. Metrics such as precision, recall, and F1-score are calculated from counts of correct retrievals, false positives, and false negatives.
Four representative queries were assessed: “restaurant” as a category query, “pizza” as a keyword query mapped to the restaurant class, “vanilia” as a brand query, and “clothing” as a category query. The clothing query successfully retrieved two relevant clothing retail facilities and achieved perfect scores with precision = 1.000, recall = 1.000, and F1-score = 1.000. In contrast, the restaurant, pizza, and vanilia queries each retrieved two locations, one relevant and one false positive, resulting in precision = 0.500, recall = 1.000, and F1-score = 0.667.
A particularly informative case is the query “vanilia”. Vanilia is a clothing-related business and was correctly retrieved once as CLOTHING_RETAIL. However, another detection containing the OCR text “vanilia atlanta” was incorrectly associated with the RESTAURANT class and was therefore counted as a false positive. This illustrates that the query functionality can successfully retrieve business names and facility types from the semantic LiDAR layer, but also that errors in OCR-based semantic classification may propagate into the query stage and reduce retrieval precision.
4.1.2. Spatial Projection and LiDAR Integration Results—Experiment 1
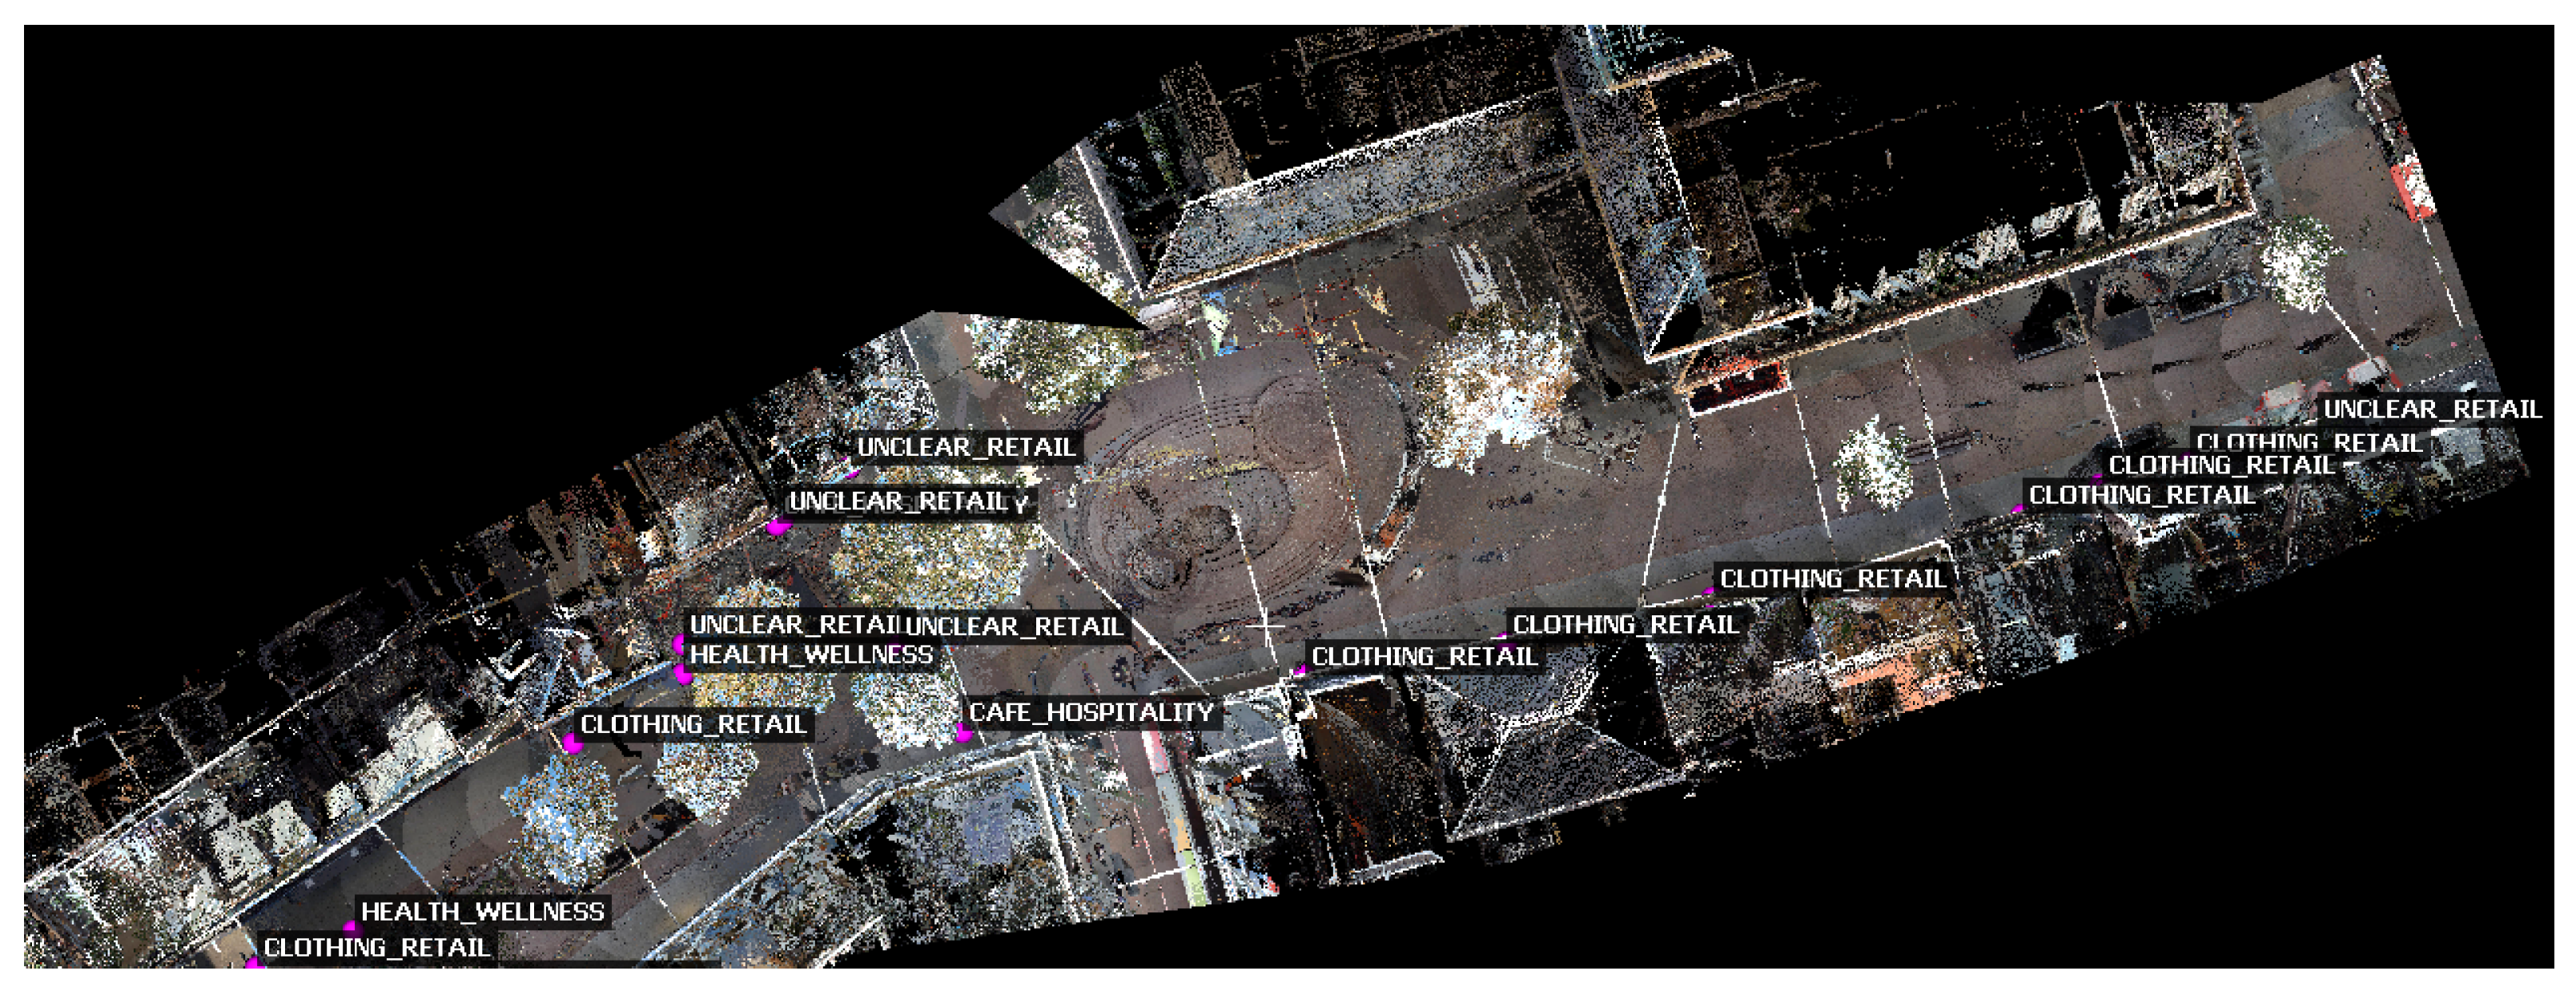
Semantic detections were successfully extracted, enabling us to identify the types and quantities of urban commercial facilities across 14 locations. Among these aggregated sites, clothing-related businesses were the most common (8 locations), followed by unclear retail facilities (3), health and wellness services (2), and café/hospitality-related facilities (1). The distribution of detected facilities aligns with the commercial characteristics of the study area, which typically has a high concentration of clothing establishments. After semantic extraction, the geometry-based back-projection method from
Section 3.4 was used to project each facility onto the LiDAR point cloud. Visualizations are created from LiDAR data to analyze their spatial distribution and alignment with building facades.
Figure 5 shows the distribution of all detected facilities within the point cloud, retrieved by querying “all,” which includes every semantic element. It displays various facilities, including clothing stores, restaurants, retail shops, and food outlets, along an urban street. Each projected facility is assigned a semantic category indicating its estimated facade location, derived from back-projected geometric OCR detections. A comparison of these labels with the actual store facade signs shows that the identified facilities generally correspond to their respective facades. This confirms the geometric plausibility of the back-projection methodology.
In addition to visualizing all detected facilities, the system supports interactive semantic queries that allow users to retrieve specific facility categories, service keywords, or brand names. A query can be made using a facility category (for example, clothing retail), a service keyword, or a brand name (for example, Vanilia or Doppio). When a query is executed, the system:
Filters the OCR detections according to the search criteria.
Retrieves the corresponding 3D semantic markers.
Highlights the associated LiDAR points in the scene.
This functionality transforms the LiDAR point cloud into a searchable and semantically enriched urban model.
Experiment 1 also evaluated the efficiency of the LiDAR projection and semantic query phases. The original Enschede point cloud, consisting of 23,785,635 points, was downsampled to 931,996 points using a 0.20 m voxel grid, yielding a 96.08% reduction. Loading all data took 101.420 s, including JSON reading, orientation loading, LAS loading, downsampling, KD-tree construction, index mapping from the downsampled to full data, and RGB color setup. The total time for the “all” query was 73.264 s, of which 71.117 s were spent on 3D projection and point painting. Other processes, including detection matching, panorama display, centroid merging, rendering, and file export, took 0.003 s, 1.533 s, 0.015 s, 0.563 s, and 0.027 s, respectively. These findings suggest that the main computational effort in the LiDAR semantic mapping process lies in geometric projection and point painting, whereas semantic matching, merging, visualization, and exporting are relatively lightweight.
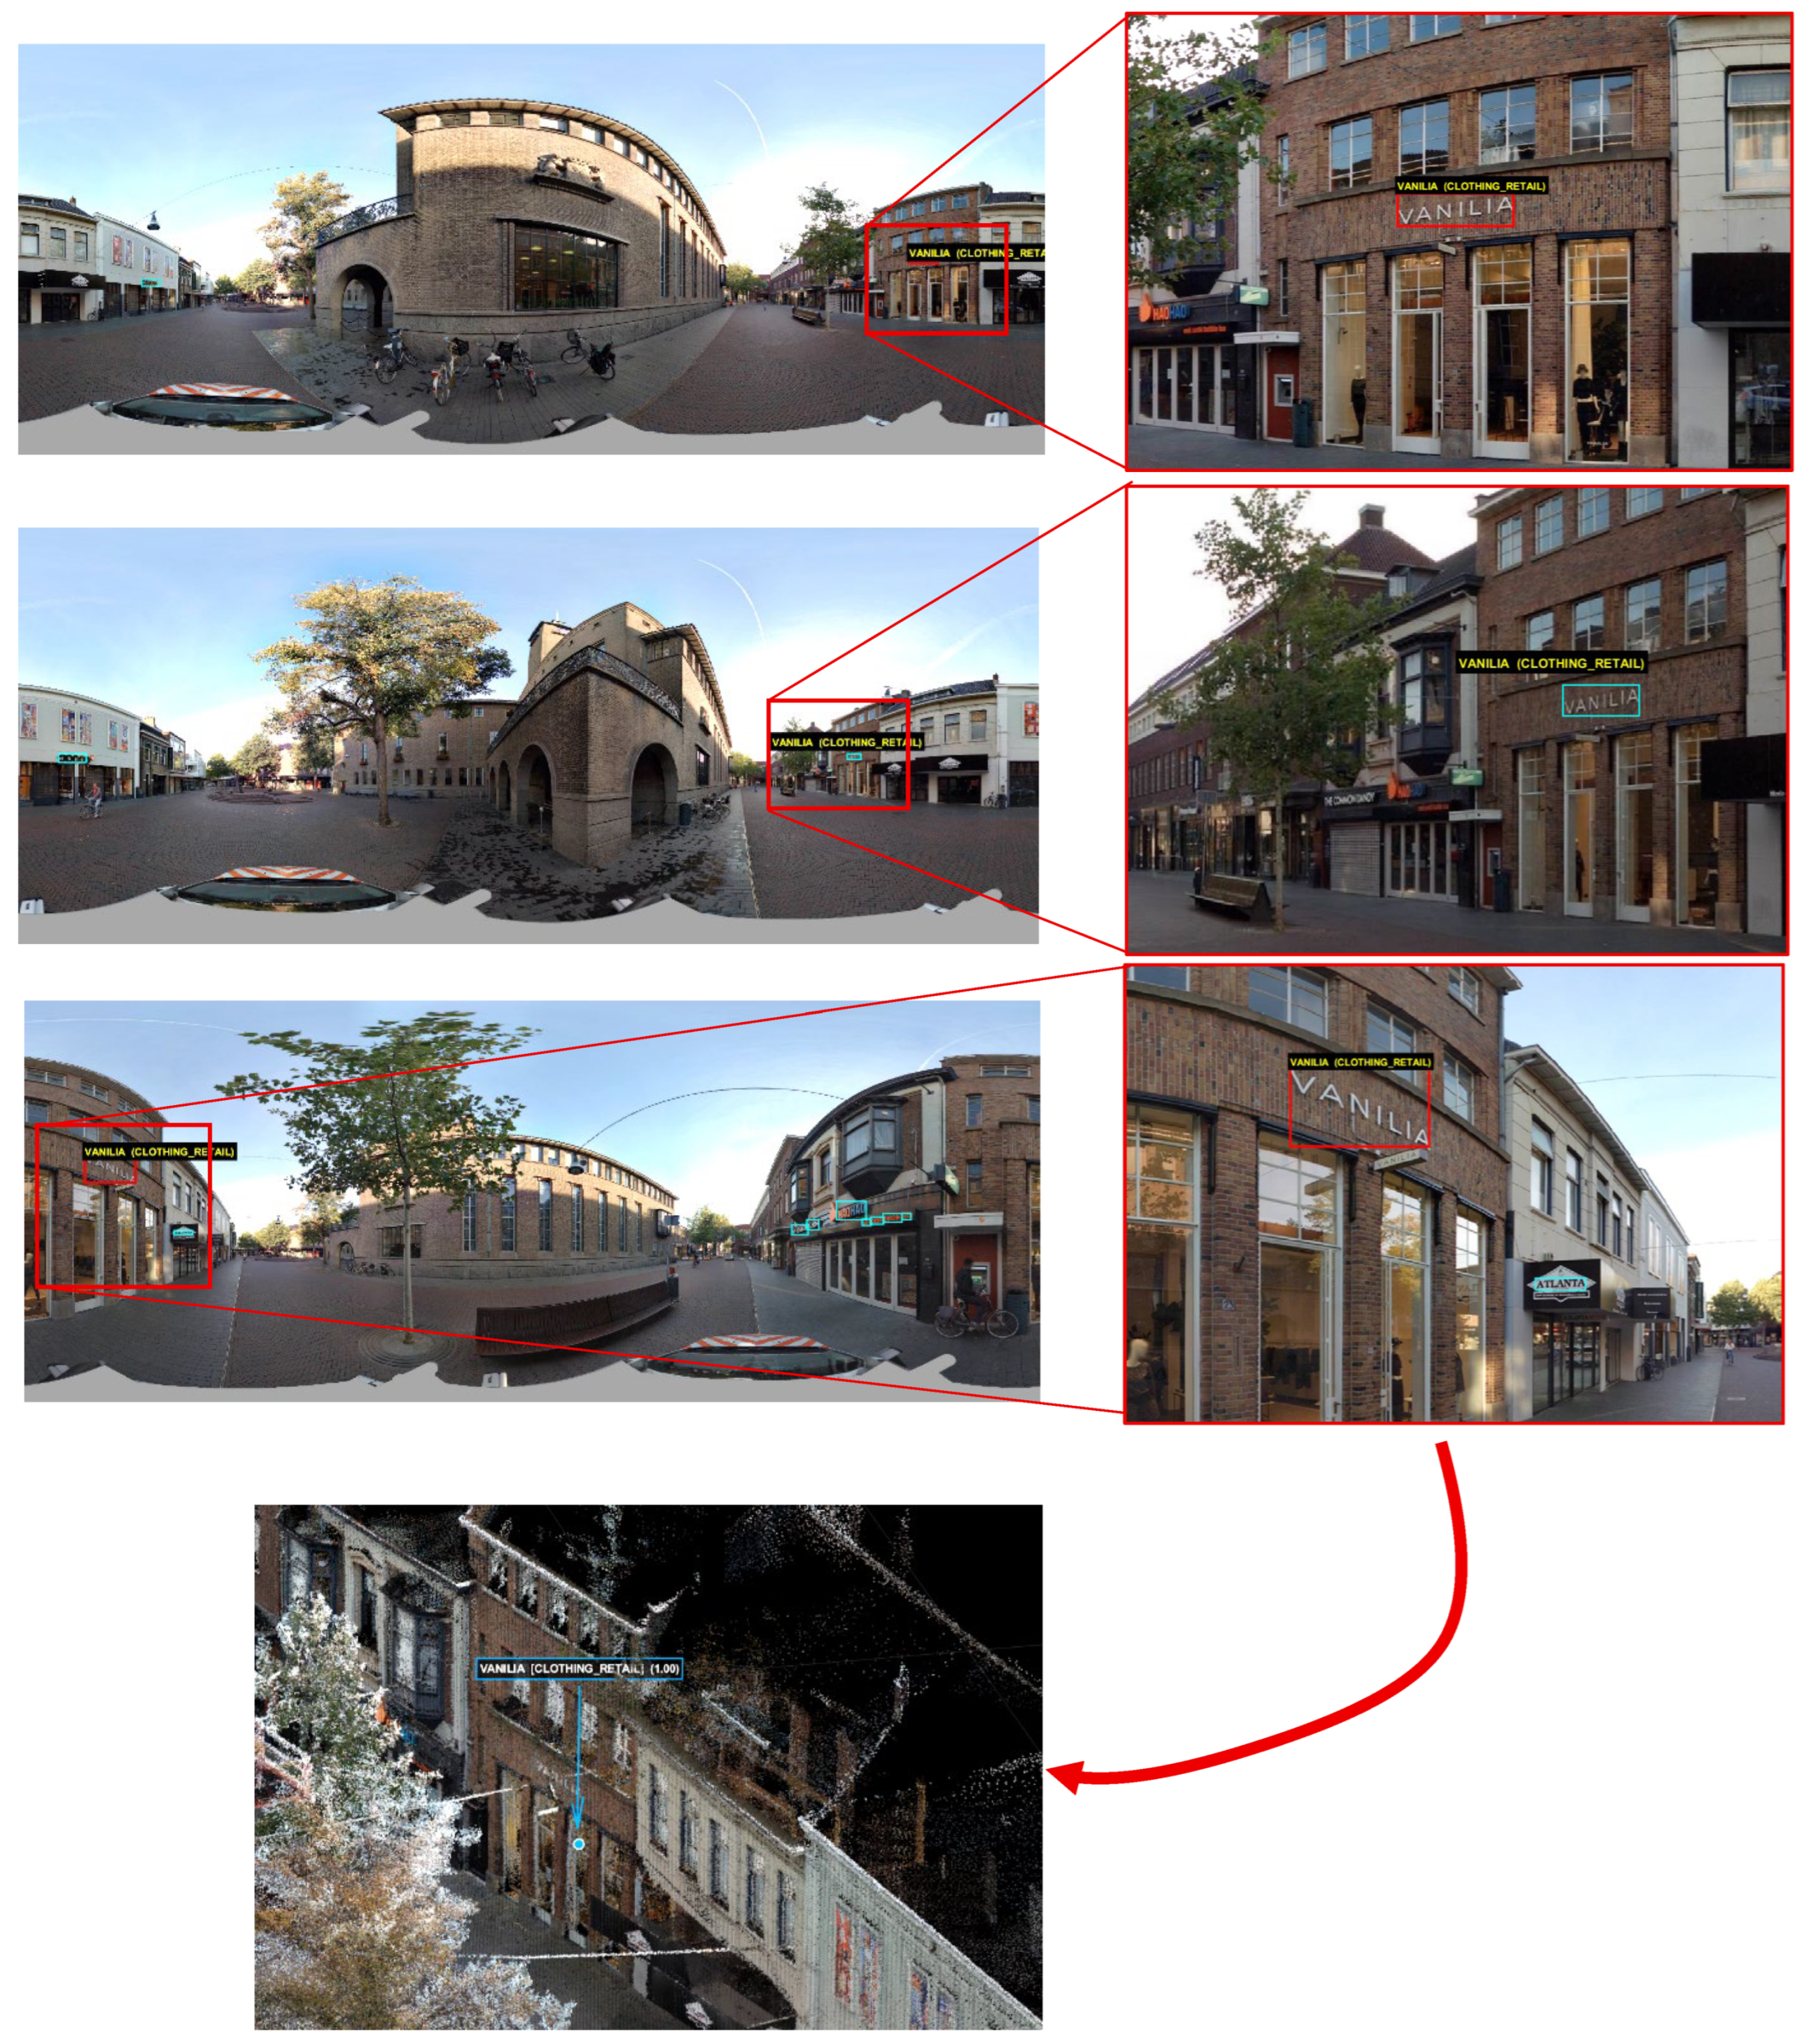
Figure 6 shows the proposed workflow for a single business, Vanilia, in Experiment 1. The storefront sign is detected in three panoramic images, and the OCR-derived semantic label is consistently assigned to CLOTHING_RETAIL. The enlarged insets highlight the detected text areas in each panorama. These detections from different views are then geometrically projected back into the LiDAR point cloud, where they help locate the corresponding semantic marker on the building facade. This example shows how repeated observations from various angles support reliable semantic localization in 3D space.
4.2. Experiment 2 Setup
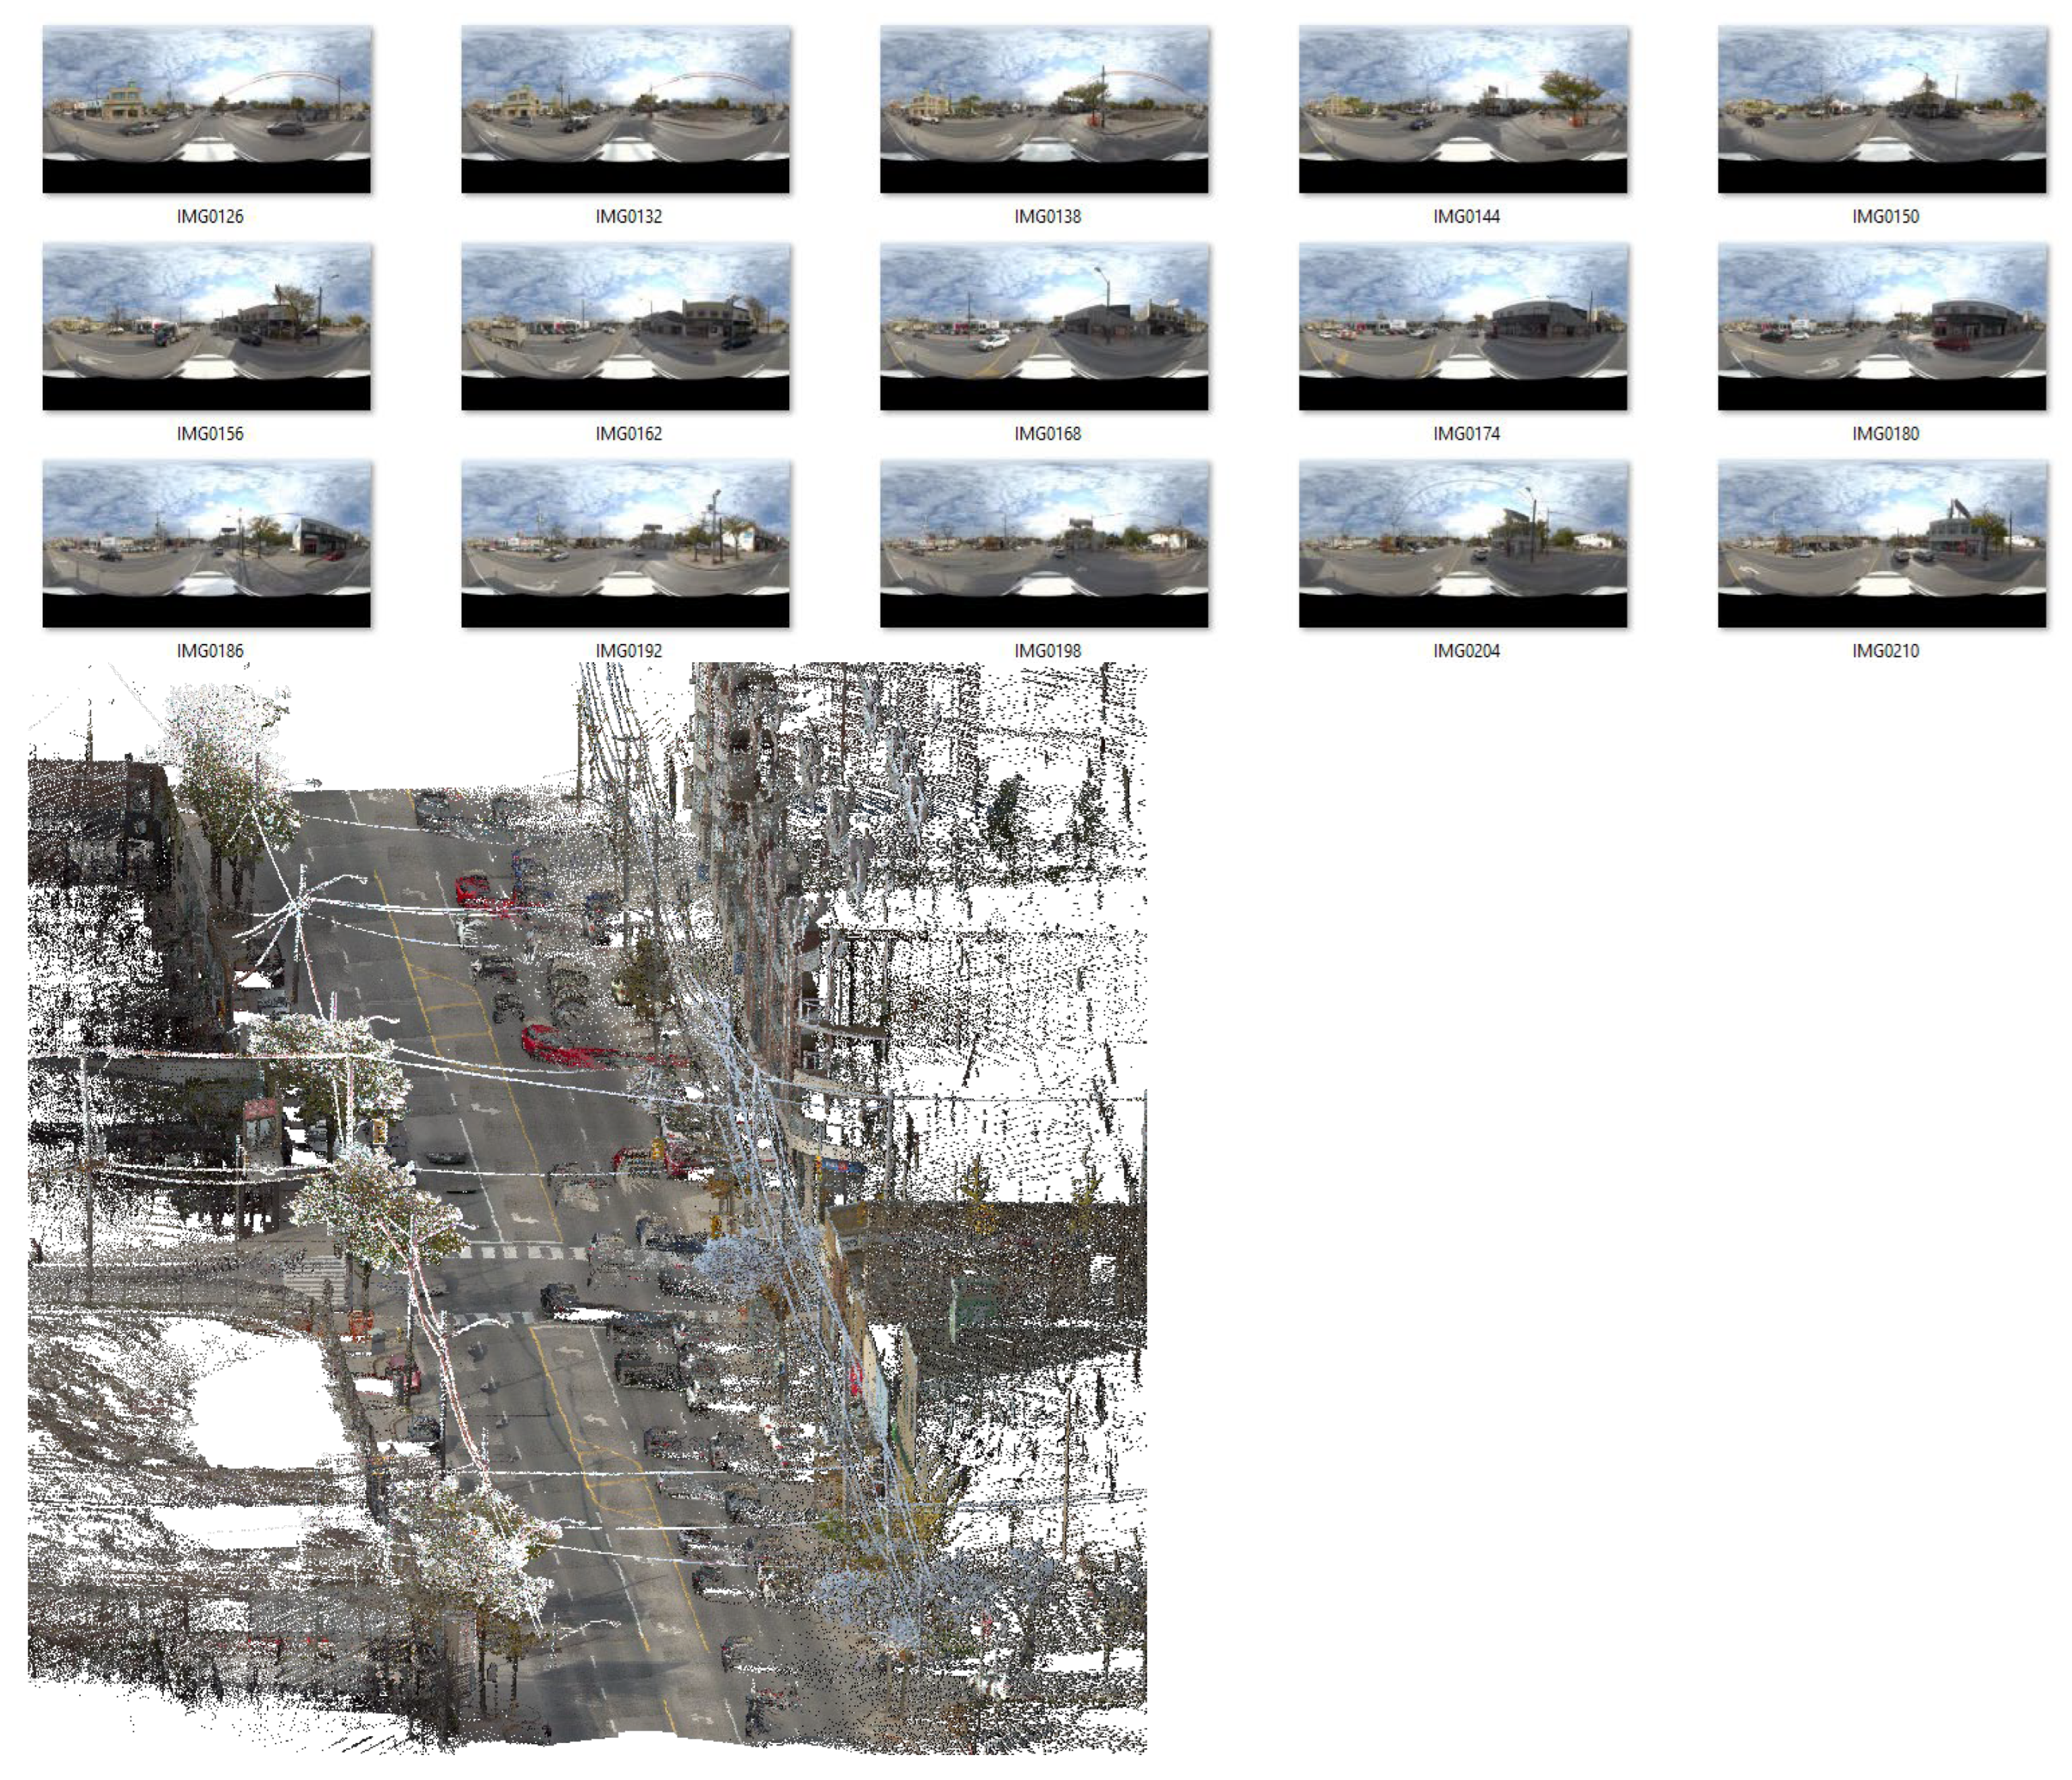
The second experiment used a dataset of Mobile Mapping Data collected over a selected urban area in the United States. It included 53 georeferenced panoramic photographs taken with the Maverick Mobile Mapping System, which is equipped with a Ladybug panoramic camera, as shown in their equirectangular projections in
Figure 7. All panoramic images were georeferenced to the corresponding LiDAR point cloud data, which was collected simultaneously using the Velodyne HDL-32E laser scanner. The LiDAR data, saved in LAS format, provides detailed 3D measurements of urban features such as buildings, street surfaces, parked vehicles, and trees. Since both data types originate from the same mapping platform, they share the same georeferenced coordinate system, aligning the panoramic images with the LiDAR point clouds. Unlike the first experiment on a dense commercial street, this larger urban dataset features wider streets and more substantial building setbacks. This change broadens the range of distances and introduces additional challenges for OCR and semantic analysis.
Adjustments were needed to ensure that the OCR framework functioned properly for this dataset. This included expanding the semantic keyword database to cover more terms related to U.S. commercial signage and modifying text detection and filtering thresholds to accommodate much larger viewing distances. These thresholds were empirically adjusted based on the expected size of the facade text. In this second dataset, wider streets and greater camera-to-facade distances made storefront signs appear smaller in the images than in Experiment 1. Consequently, the minimum bounding box size and filtering thresholds were adjusted to retain smaller yet still readable text regions. A selection of panoramas was examined, and candidate thresholds were qualitatively compared to ensure that valid storefront signs were preserved. This is applied while minimizing false positives, such as artifacts, reflections, and background textures. These thresholds represent a practical balance between recall and false positives. No OCR retraining or supervised optimization was performed; only preprocessing and filtering parameters were adapted to the new imaging geometry.
4.2.1. OCR Semantic Extraction Results (Experiment 2)
The OCR-based semantic extraction pipeline was applied to a second mobile mapping dataset consisting of 53 panoramic images captured by a Maverick mobile mapping system equipped with a Ladybug panoramic camera. Compared to the initial experiment, this dataset features a broader urban street environment in a U.S. city, offering a different urban context and signage setup. Using the OCR semantic results stored in the panorama-level JSON output, the pipeline generated 36 semantic detections that were evaluated against the ground-truth annotations. These detections relate to textual elements associated with storefront signage and business identifiers. They were categorized into semantic facility groups using the rule-based taxonomy and brand-extraction method described in
Section 3.3. The identified semantics include various urban facilities, such as retail, food-related businesses, personal services, and financial services. Overall, the system detected an average of 0.68 semantic elements per panorama (
Table 3), indicating lower semantic density than that observed on the busier commercial streets in Experiment 1. This difference likely results from the wider street geometry and increased viewing distance between the mobile mapping trajectory and building facades in the U.S. dataset, which reduces the visible size and clarity of storefront text in panoramic images. To measure how well the system extracted semantics, the OCR detections were compared to a strict ground-truth set of 26 annotated facilities. Since the OCR output is stored per panorama while the ground truth groups panorama identifiers by facility, a detection was considered correct if its panorama belonged to a ground-truth facility and its semantic label matched the annotated category. The ground-truth set was manually annotated for each facility by grouping panorama identifiers for the same real-world facility and assigning each group a reference semantic category.
Under this assessment, Experiment 2 achieved a precision of 0.778, a recall of 0.538, and an F1-score of 0.636. Compared to Experiment 1, this dataset showed significantly higher precision but lower recall, indicating that the detections were generally more reliable when produced. However, more ground-truth facilities were missed, probably because wider streets and larger facade setbacks reduced text visibility in the panoramas.
To assess the computational efficiency of the semantic query and 3D projection stages, runtimes for each module were recorded in Experiment 2. The original LiDAR point cloud, consisting of 14,754,651 points, was downsampled to 772,862 points with a 0.20 m voxel grid. The total data-loading process took 28.145 s, comprising 3.676 s for LAS loading and downsampling, 0.543 s for KD-tree construction, and 23.903 s for generating the full index map from the downsampled data. During semantic querying using all detected features, detections were matched and consolidated, resulting in a total query time of 279.392 s. The most time-consuming step was the 3D projection and point-painting, which took 278.504 s. Other steps of detection matching, centroid merging, rendering, and file export required only 0.003 s, 0.005 s, 0.744 s, and 0.024 s, respectively. These findings indicate that, in the larger U.S. point-cloud scene, the primary computational bottleneck is not semantic matching but the geometric projection and painting of OCR-based detections into the dense LiDAR point cloud.
4.2.2. Spatial Projection and LiDAR Integration Results—Experiment 2
After semantic extraction, the text elements were projected onto the LiDAR point cloud using the geometry-based back-projection method detailed in
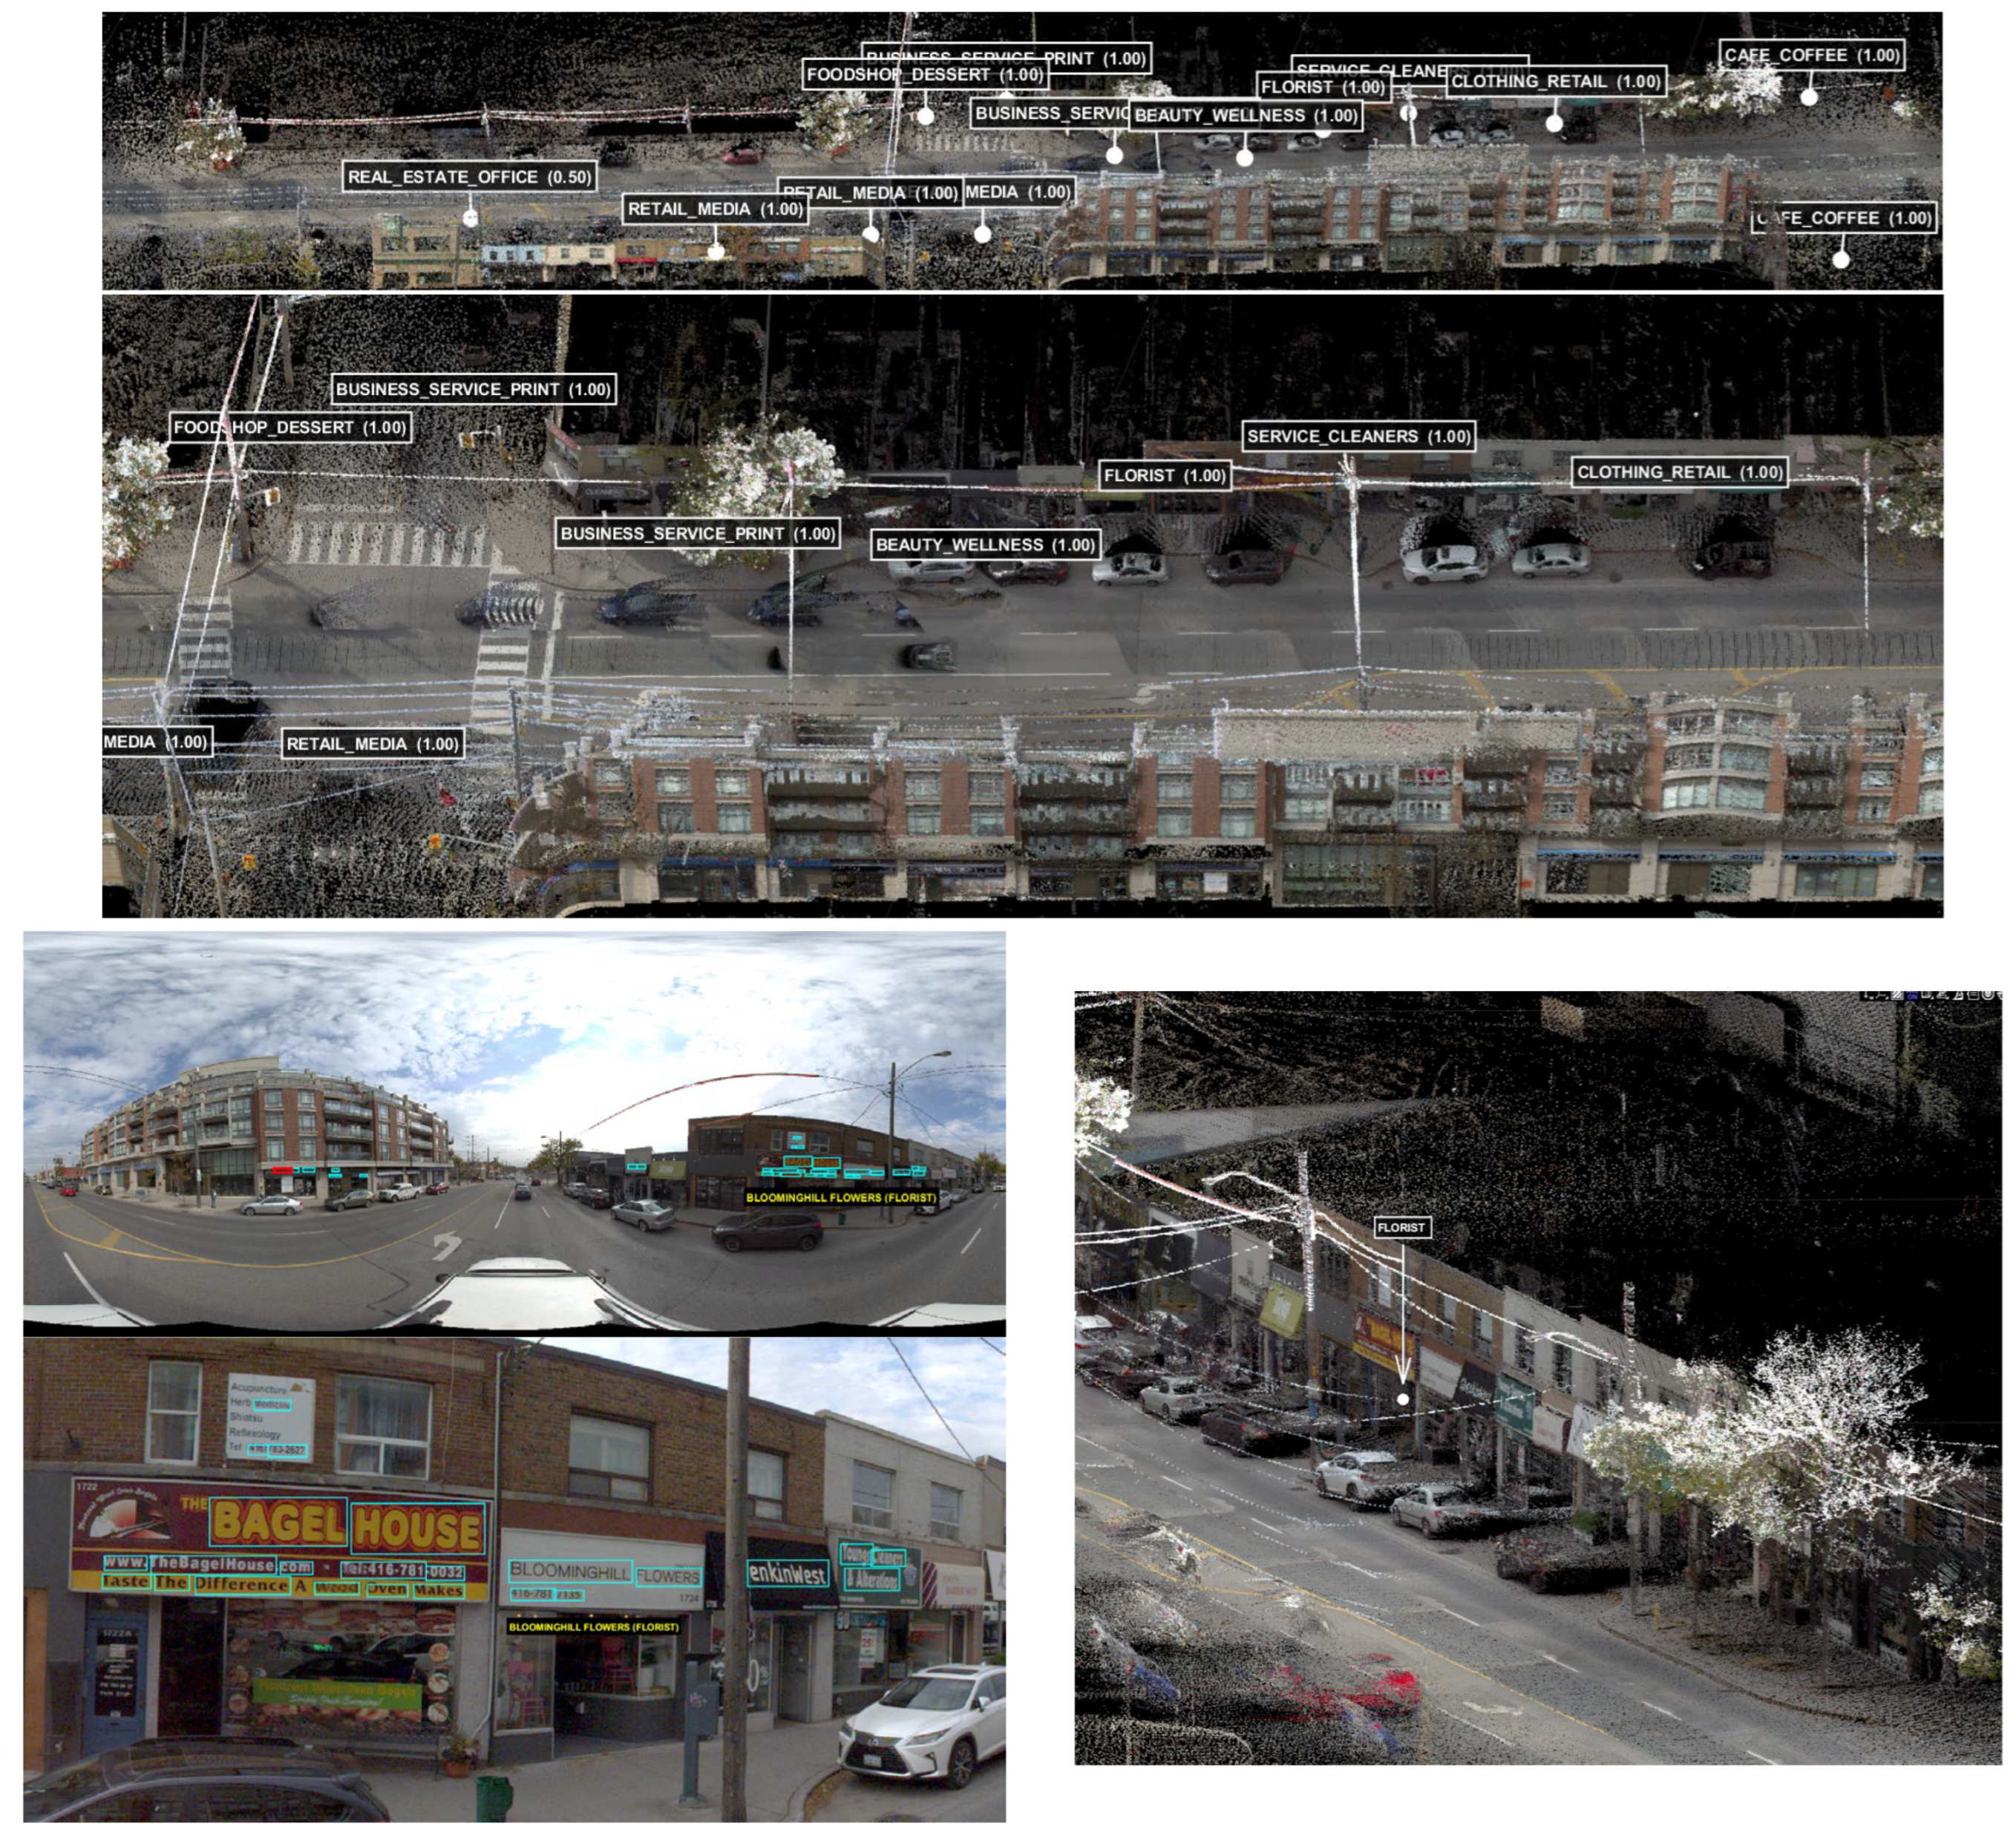
Section 3.4, as shown in
Figure 8. For each text region, the bounding box coordinates from the panoramic image were transformed into viewing rays starting at the panoramic camera’s center. These rays intersected with the LiDAR surface using the KD-tree ray-intersection approach to enable us to estimate the 3D facade location of each detected text.
Since the panoramic images and LiDAR data were captured simultaneously using the Maverick mobile mapping platform, both datasets are aligned in a shared georeferenced coordinate system. This direct spatial alignment removes the need for separate image-to-point-cloud registration and places the detected semantic elements directly within the LiDAR point cloud. The results of the projection indicate that most semantic detections are found on building facades along the street corridor. Visual checks confirm that the projected markers closely match the physical storefront locations visible in the panoramic images. Examples include detected businesses such as restaurants, florists, dry cleaners, beauty salons, and banks, all represented as semantic markers attached to facade surfaces in the point cloud. The facilities identified in the panoramas include “seafood dinner,” “Starbucks,” “Bloominghill Flowers,” and “National Bank,” showcasing the system’s ability to capture both service keywords and recognizable business names.
To improve spatial stability, detections from multiple panoramas were integrated using the spatial clustering approach outlined in
Section 3.5. This clustering is applied when multiple observations correspond to the same physical location. Their projected positions are then merged into a single semantic marker using confidence-weighted centroid estimation. This merging step reduces duplication from repeated detections across consecutive mobile-mapping frames and creates a stable representation of facility locations within the LiDAR model.
Figure 8 shows the spatial distribution of the projected semantic markers within the LiDAR point cloud when running the “all” query command. The figure also shows multiple facility categories distributed across the urban street environment, with markers placed at the corresponding facade locations where text signage is visible. The spatial alignment between the projected markers and the building surfaces provides qualitative evidence for the effectiveness of the geometric back-projection method.
In addition to visualizing all detected facilities, the system enables interactive semantic search within the three-dimensional urban model. Users can issue queries based on:
Facility category (e.g., restaurant).
Service keyword (e.g., flowers).
Brand name (e.g., Starbucks).
Once a user executes a query, the system filters OCR detections to those that meet the search criteria, along with their associated 3D semantic markers. After that, the associated LiDAR points are displayed in the scene, allowing users to identify the facilities they queried from their point cloud model. Therefore, this functionality creates a searchable, semantically annotated urban model from LiDAR point clouds, enabling end-user interactivity within the three-dimensional urban environment via text-based queries.
Both experiments in this paper indicate that semantic information from panoramic street-level imagery can enrich LiDAR point clouds when combined with panoramic OCR and geometry-based projection methods.
5. Discussion
The two experiments were designed to evaluate the proposed semantic extraction and projection framework on mobile mapping datasets collected in different urban environments and with different sensing systems. Experiment 1 used CycloMedia panoramic imagery and LiDAR data acquired in Enschede, the Netherlands, whereas Experiment 2 used panoramic imagery collected by a Maverick mobile mapping platform equipped with a Ladybug camera in an urban area in the United States. In both cases, the panoramic images and LiDAR point clouds were acquired simultaneously using a Velodyne HDL-32E scanner. This acquisition setup provided direct spatial correspondence between image observations and 3D geometry, avoiding the need for additional registration and allowing the projection framework to be tested under differing urban and sensor conditions.
The main contrast between the two experiments is linked to the visual characteristics of the datasets and their effect on OCR-based semantic extraction. Experiment 1 produced a higher number of semantically classified detections per panorama than Experiment 2. A likely reason is the denser commercial structure of the Enschede city-center dataset, where storefront signage is typically positioned close to the road and is therefore more visible from the trajectory of the mobile mapping platform. By comparison, the second dataset represents a more open urban layout with wider streets and larger building setbacks. As a result, signs occupy a smaller portion of the panoramic field of view, which makes text detection more difficult. This difference highlights the influence of acquisition geometry on the visibility and detectability of street-level text.
Despite these differences, the geometric back-projection stage typically maps text detections onto plausible building-facade regions within the LiDAR point cloud, as shown in
Figure 5 and
Figure 8. The experiments thus provide qualitative evidence supporting the validity of the equirectangular back-projection model for mapping panoramic image coordinates to 3D viewing rays. In addition, the Spatial Cluster Stage reduces duplicate detections from multiple panoramas and appears to improve the spatial consistency of the final facility locations, as described in
Section 3.6 and Algorithm 2. Overall, the findings suggest that using panoramic OCR alongside geometric projection is a promising and practical approach for adding semantic information from panoramic street-level imagery to LiDAR point clouds.
The current multi-view fusion strategy has a limitation in clustering, as it mainly relies on horizontal distance within each semantic class. This method does not explicitly consider local facade orientation or the physical size of the detected text region. As a result, in more complex urban scenes such as building corners, neighboring shop signs, or signs on different facade planes that are close horizontally, distance-based clustering may mistakenly combine separate text entities.
The experiments also highlight the conditions under which the proposed framework is effective and its limitations. A key factor is the rule-based semantic classification stage, in which OCR tokens are matched against the keyword taxonomy and brand database. The accuracy of classification depends heavily on the completeness and accuracy of the semantic dictionary. Facilities linked to recognizable keywords or well-known brands tend to be classified correctly. On the other hand, stylized brand names, abbreviations, or new names are more prone to stay unclassified or receive low-confidence labels.
Relying on pretrained OCR components like CRAFT and EasyOCR limits semantic extraction, especially in challenging conditions where signs are far away, tilted, distorted, shadowed, obstructed, or in stylized fonts. Languages not well supported by these models create additional problems. Accordingly, when detection and recognition fail, fewer semantic options are available, which can lead to more errors. This affects the accuracy of 3D projection, brand-name extraction, and query accuracy. Multi-view fusion can improve robustness by combining consistent detections from different panoramic views, but it cannot recover missed signs or fix systematic errors.
A related challenge is the linguistic diversity in real-world urban environments. Street signs often feature multiple languages, local naming conventions, or informal terms that may not be included in predefined keyword lists. While this study’s taxonomy incorporates English and Dutch terms, it can be enhanced by expanding it to include additional languages and regional expressions. Future work might address this by extending the taxonomy using external knowledge bases or by developing adaptive lexicons from extensive collections of urban text.
The comparison between the two datasets shows how imaging and acquisition conditions affect OCR-based semantic extraction. In Experiment 1, the Enschede dataset’s closer storefronts and denser commercial signage made the text appear larger in the panoramas, resulting in higher recall. In contrast, Experiment 2’s U.S. dataset had wider streets and larger building setbacks, which reduced the apparent size and clarity of facade text. This led to lower recall but more consistent detection, increasing precision. These results suggest that factors like imaging distance, facade setback, text size, and viewing angles play a significant role in OCR-based semantic extraction. Image resolution also matters, as higher resolution enhances character legibility, especially for distant signs. Nonetheless, resolution alone cannot compensate for signs that are strongly oblique, vertically oriented, slanted, curved, partially blocked, shadowed, reflected, or captured under poor lighting. Consequently, the framework works best when signage is large, visible, and close to the mobile mapping path, with reliability decreasing for distant, oblique, poorly lit, or obstructed signs.
The framework comprises modules with varying computational costs. Module-level runtime analysis reveals that the main bottleneck shifts across different processing stages. In Experiment 1, the OCR semantic extraction took 349.586 s to process 65 high-resolution panoramas, averaging 5.378 s per panorama. OCR was the biggest obstacle in image processing, taking 3.651 s per panorama and accounting for 67.9% of the total OCR time. CRAFT text detection followed, with 1.596 s per panorama, or 29.7%. During the LiDAR projection and semantic query stage in Experiment 1, the complete Enschede point cloud contained 23,785,635 points and was downsampled to 931,996 points using a 0.20 m voxel grid. Data loading took 101.420 s, and the full “all” query required 73.264 s, with 71.117 s spent on 3D projection and point painting. In Experiment 2, the point cloud had 14,754,651 points and was downsampled to 772,862 points with the same 0.20 m grid. Data loading took 28.145 s while the semantic query took 279.392 s, with 278.504 s on 3D projection and point painting. These findings show that OCR primarily dominates image-based semantic extraction, whereas dense point-cloud projection and point painting dominate LiDAR-based semantic mapping. Future improvements should focus on faster OCR processing and 3D point-cloud handling through batch processing, GPU acceleration, spatial tiling, adaptive downsampling, and parallel queries for rays or neighborhoods.
Despite these limitations, the proposed framework highlights the practical benefits of integrating text-derived semantics from street-level images with LiDAR geometry. This approach transforms point clouds from plain geometric data into rich urban representations capable of semantic labeling at the facility level and text-based queries. This functionality is valuable for urban digital twins, municipal asset inventories, infrastructure documentation, and location-aware information systems. Overall, the results demonstrate the potential of multimodal mobile mapping data to enable large-scale semantic urban modeling.
Additionally, the semantic extraction was quantitatively evaluated against annotated ground-truth facility data. The comparison between panorama-level detections and facility-level reference data revealed distinct error patterns across the datasets. Experiment 1 achieved higher recall (0.667) but lower precision (0.385), whereas Experiment 2 achieved higher precision (0.778) but lower recall (0.538). This indicates that dense commercial street corridors tend to support broader facility coverage, while wider streets and larger facade offsets yield fewer but cleaner detections. The first dataset enables more comprehensive semantic discovery, while the second emphasizes more accurate but selective identification.
The findings also provide direct answers to the research questions posed in
Section 1. For RQ1, the experiments show that textual information identified in panoramic images can be mapped into LiDAR space using the proposed equirectangular back-projection model. This process generates spatial rays that intersect facade regions, enabling 3D localization of signage. For RQ2, the findings show that projection reliability depends on factors such as viewing distance, facade orientation, and the apparent size of the text in the panorama. For RQ3, the clustering process detailed in Algorithm 2 successfully merges duplicate detections across panoramas, enhancing the spatial consistency of the semantic markers. For RQ4, the case study demonstrates that the OCR-based semantic layer allows users to interactively retrieve LiDAR point clouds by facility category, keyword, and brand name. The highest accuracy was achieved for “clothing,” with successful localization of relevant facilities. Queries such as “restaurant,” “pizza,” and “vanilia” also found targets, but each had one false positive. Notably, “Vanilia,” a clothing brand, was mistakenly linked to restaurants. This suggests that the query functions depend on OCR and semantic classification accuracy. While the query system works, its precision drops when semantic misclassification occurs.
6. Conclusions
This study presents an approach for integrating semantic data from panoramic images with LiDAR point clouds collected by mobile mapping systems. The method combines deep learning-based optical character recognition with a geometry-driven back-projection model that transforms text detections from equirectangular panoramas into spatial viewing rays intersecting LiDAR points. This technique enables localization of text elements, such as storefront signs and business identifiers, on building facades in a three-dimensional LiDAR point cloud. The semantic markers produced are then combined using a multi-view strategy, merging detections across multiple panoramas to accurately establish consistent facility positions within the point cloud.
The proposed framework was tested on two mobile mapping datasets from different urban areas, using various imaging setups and data collection methods under different conditions. The first experiment involved CycloMedia panoramic images and LiDAR data from Enschede, in the Netherlands, while the second used a Maverick mobile-mapping dataset with a Ladybug panoramic camera in a U.S. city. In both cases, panoramic images and LiDAR point clouds were captured simultaneously using a Velodyne HDL-32E scanner, enabling direct spatial alignment between the image data and the 3D geometry. The results indicate that the geometry-based back-projection method can localize text detections to plausible building-facade regions in the LiDAR point cloud. Furthermore, the multi-view clustering algorithm successfully merges repeated detections into consistent semantic markers representing individual urban features.
Both experiments demonstrate that the framework is applicable across various urban environments, although additional validation is still needed. The method adds a searchable semantic layer to LiDAR-based models of cities, enabling text-based searches within 3D scenes. A case study using queries showed that this layer can facilitate interactive retrieval of facilities from the LiDAR point cloud by category, keyword, and brand name, although the accuracy of these searches depends on the precision of OCR-based semantic classification. This feature is useful for digital twins, infrastructure inventories, and location-based data systems. Furthermore, the framework is fully interpretable and requires no training during geometric localization.
The framework is also more transparent and easier to interpret than black-box alternatives that rely on more complex learned mapping strategies. This approach shows how image-derived semantic information can be linked to 3D urban structures represented in LiDAR data.
Future work will aim to enhance the framework’s robustness and scalability. This involves extending the semantic taxonomy to include multilingual and knowledge-based vocabularies, refining facade-aware geometric filtering techniques, and developing orientation-aware multi-view fusion methods that utilize local facade normals and 3D bounding-box overlaps. Additional efforts will focus on controlled sensitivity analysis concerning image resolution, text size, viewing angle, lighting conditions, occlusion, and camera-to-facade distance. Runtime optimization will also be prioritized to support larger citywide digital-twin applications.