Article

Assessing Historical Shoreline Change and Forecasting Future Trends Along Monrovia’s Coastline, Liberia


1
Faculty of Sciences, Laboratory of Natural Resources and Sustainable Development, Ibn Tofail University, Kenitra 14000, Morocco
2
Earth Sciences Department, Faculty of Sciences, Ibn Tofail University, Kenitra 14000, Morocco
3
Department of Geology, Faculty of Science, University of Liberia, Monrovia 1000, Liberia
4
Pepperbird Aerial Services (PAS) and Lake Piso Solution, Monrovia 1000, Liberia
5
Civil Engineering Department, College of Engineering, Jouf University, Sakaka 72388, Saudi Arabia
6
Irrigation and Hydraulics Engineering Department, Faculty of Engineering, Mansoura University, Mansoura 35516, Egypt
*
Author to whom correspondence should be addressed.
Geomatics 2026, 6(1), 6; https://doi.org/10.3390/geomatics6010006
Submission received: 28 December 2025 / Revised: 11 January 2026 / Accepted: 12 January 2026 / Published: 21 January 2026

Abstract

Coastal settlements worldwide face increasing threats from erosion, and the Monrovia coastline in Liberia is no exception. This study investigates shoreline dynamics along a 20.5 km stretch of Monrovia’s coast, which is characterized by low-lying elevations, gentle slopes, and sandy beaches. Using Landsat satellite imagery (1986–2025), supported by Sentinel-2 MSI and qualitative validation drone data, we analyzed historical shoreline change with remote sensing and GIS techniques. Shorelines were extracted using a band-ratio thresholding method and quantified with the Digital Shoreline Analysis System (DSAS 5.0), applying end-point rate (EPR), linear regression rate (LRR), and net shoreline movement (NSM). Exploratory projections for 2036 and 2046 were generated using a Kalman Filter model integrated into DSAS. Results show maximum historical erosion rates of up to 3.8 m/yr and accretion rates of up to 5.9 m/yr, with shoreline retreat reaching 150 m and advance up to 194 m. Erosion hotspots are projected for Hotel Africa, Westpoint, New Kru Town, and the JFK–ELWA corridor, while areas near the St. Paul and Mesurado estuaries are expected to accrete. These findings confirm historical trends and suggest that Monrovia will continue to face significant shoreline change, with implications for natural habitats, infrastructure, land loss, and population displacement.

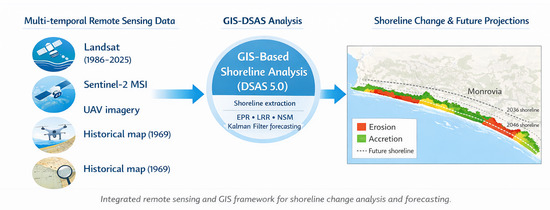
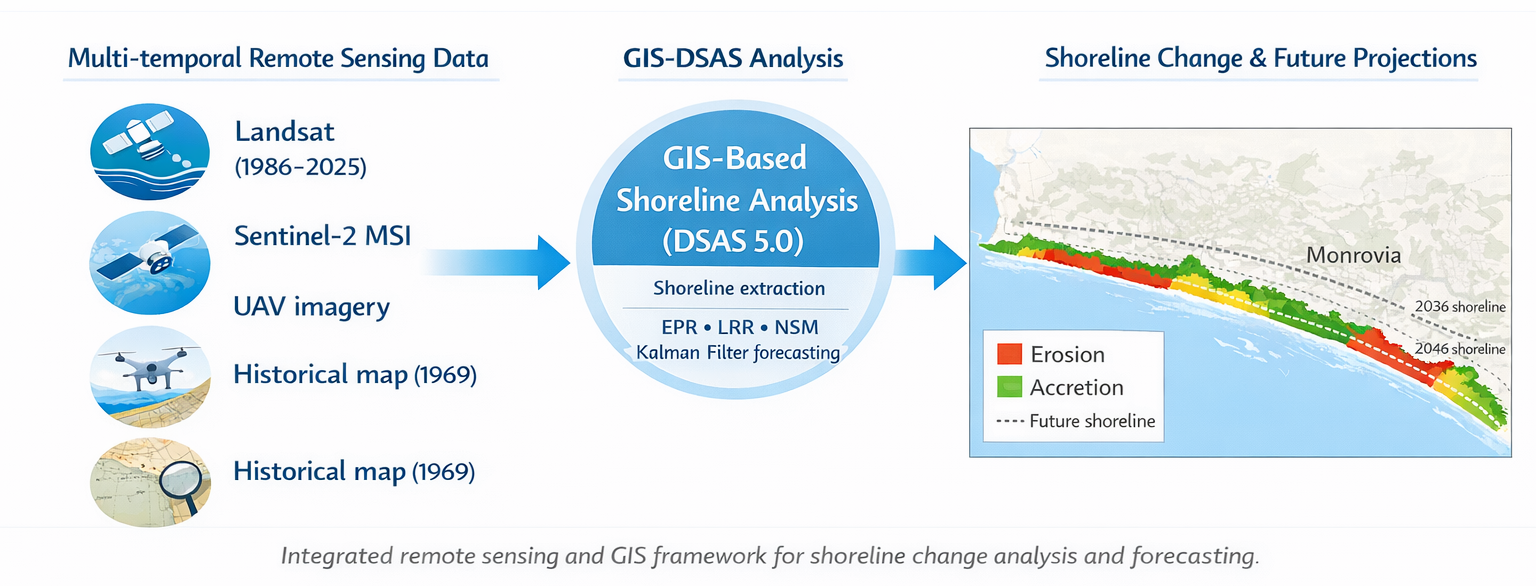
Graphical Abstract

1. Introduction

Coastlines are dynamic transitional zones shaped by the interaction of terrestrial and marine processes. They are continuously modified by storm surges, flooding, cyclones, tsunamis, wave action, tidal variations, and sea-level rise, resulting in alternating phases of erosion, accretion, and relative equilibrium [1,2,3]. Coastal erosion is now recognized as a global concern, with approximately 70–80% of the world’s sandy beaches experiencing retreat at rates ranging from centimeters to several meters per year, driven by both natural processes and human interventions [4,5]. Rapid population growth in coastal zones, together with urbanization, tourism expansion, and infrastructure development, further amplifies exposure and increases the socio-economic consequences of shoreline retreat [6,7].
In Liberia, coastal erosion represents a pressing environmental and development challenge. Approximately 58% of the population resides along the country’s 559 km coastline, much of which is low-lying and densely occupied by communities living in informal settlements [8,9,10]. Critical infrastructure, local markets, and livelihoods are increasingly threatened, as illustrated by the West Point settlement in Monrovia, where persistent shoreline retreat has resulted in recurrent land loss and population displacement [11,12,13]. National adaptation responses remain constrained by limited institutional capacity, weak coastal governance frameworks, and a lack of long-term, reliable coastal datasets—conditions exacerbated by the legacy of civil conflict and the 2014 Ebola epidemic [8,14].
Existing studies on shoreline dynamics in Liberia remain fragmented and largely short-term. Early investigations relied on aerial photographs and topographic surveys to document shoreline retreat between 1952 and 1969 in selected coastal cities [15]. More recent studies have employed satellite remote sensing techniques; for example, Landsat imagery was used to assess shoreline retreat between 1986 and 2015 for parts of the Liberian coast [14], while future shoreline positions under different climate scenarios were explored in subsequent modeling studies [16]. A decade-scale assessment (2008–2018) quantified shoreline retreat and projected future positions for 2050 and 2100 in selected coastal zones of Monrovia [17]. Other studies applied combined Landsat and Sentinel imagery over shorter intervals (2014–2017) [18] or relied on a single Sentinel-1 dataset to assess shoreline change along the entire Liberian coastline [19].
Although some of these studies integrated predictive modeling and field-based observations [17], their relatively short temporal coverage introduces substantial uncertainty when applied to long-term shoreline forecasting in data-scarce environments such as Liberia. Consequently, despite their value, existing analyses remain limited in spatial and temporal scope, highlighting the need for comprehensive, multi-decadal assessments that incorporate both historical trends and exploratory forecasting approaches.
Despite the growing global use of remote sensing and GIS technologies for shoreline monitoring, their application in West Africa—and particularly in Liberia—remains limited, both methodologically and temporally. Most previous studies are restricted to short observation periods, rely on single statistical metrics, or use a single satellite dataset, thereby limiting the ability to capture long-term shoreline behavior and increasing uncertainty in future shoreline assessments.
In this study, the analysis period spans from 1986—corresponding to a critical phase during the Liberian civil war and representing baseline shoreline conditions—to 2025, a period characterized by climate-change-related impacts such as sea-level rise, increased storm intensity, and rapid coastal urbanization in Monrovia. This extended temporal coverage enables the identification of persistent erosion and accretion patterns while reducing the influence of short-term shoreline variability on trend interpretation.
To address the identified gaps, this study adopts an integrated remote sensing and GIS-based methodological framework combining multiple shorelines change metrics and an exploratory forecasting approach. Shoreline change is quantified using the end-point rate (EPR) and linear regression rate (LRR), which provide robust long-term indicators of net shoreline movement, while future shoreline positions are explored using the Kalman Filter model implemented within the Digital Shoreline Analysis System (DSAS). This approach allows for uncertainty-aware trend interpretation rather than deterministic prediction.
Specifically, this study aims to (i) extract historical shorelines from multi-temporal Landsat imagery spanning 1986–2025 using a threshold-based band ratio method, complemented by manual shoreline interpretation from medium- and high-resolution Sentinel-2 and UAV orthomosaics for 2025; (ii) quantify shoreline change using EPR and LRR statistics within DSAS; (iii) generate exploratory shoreline projections for 2036 and 2046 using the Kalman Filter model; and (iv) contextualize the results through field observations, UAV surveys, and photographic evidence. By integrating long-term satellite analysis with exploratory forecasting and field-based interpretation, this study provides a comprehensive assessment of shoreline dynamics along the 20.5 km sandy coastline of Monrovia and offers evidence-based insights to support coastal erosion management, sea-level rise adaptation, and coastal hazard mitigation in Liberia.

2. Study Area

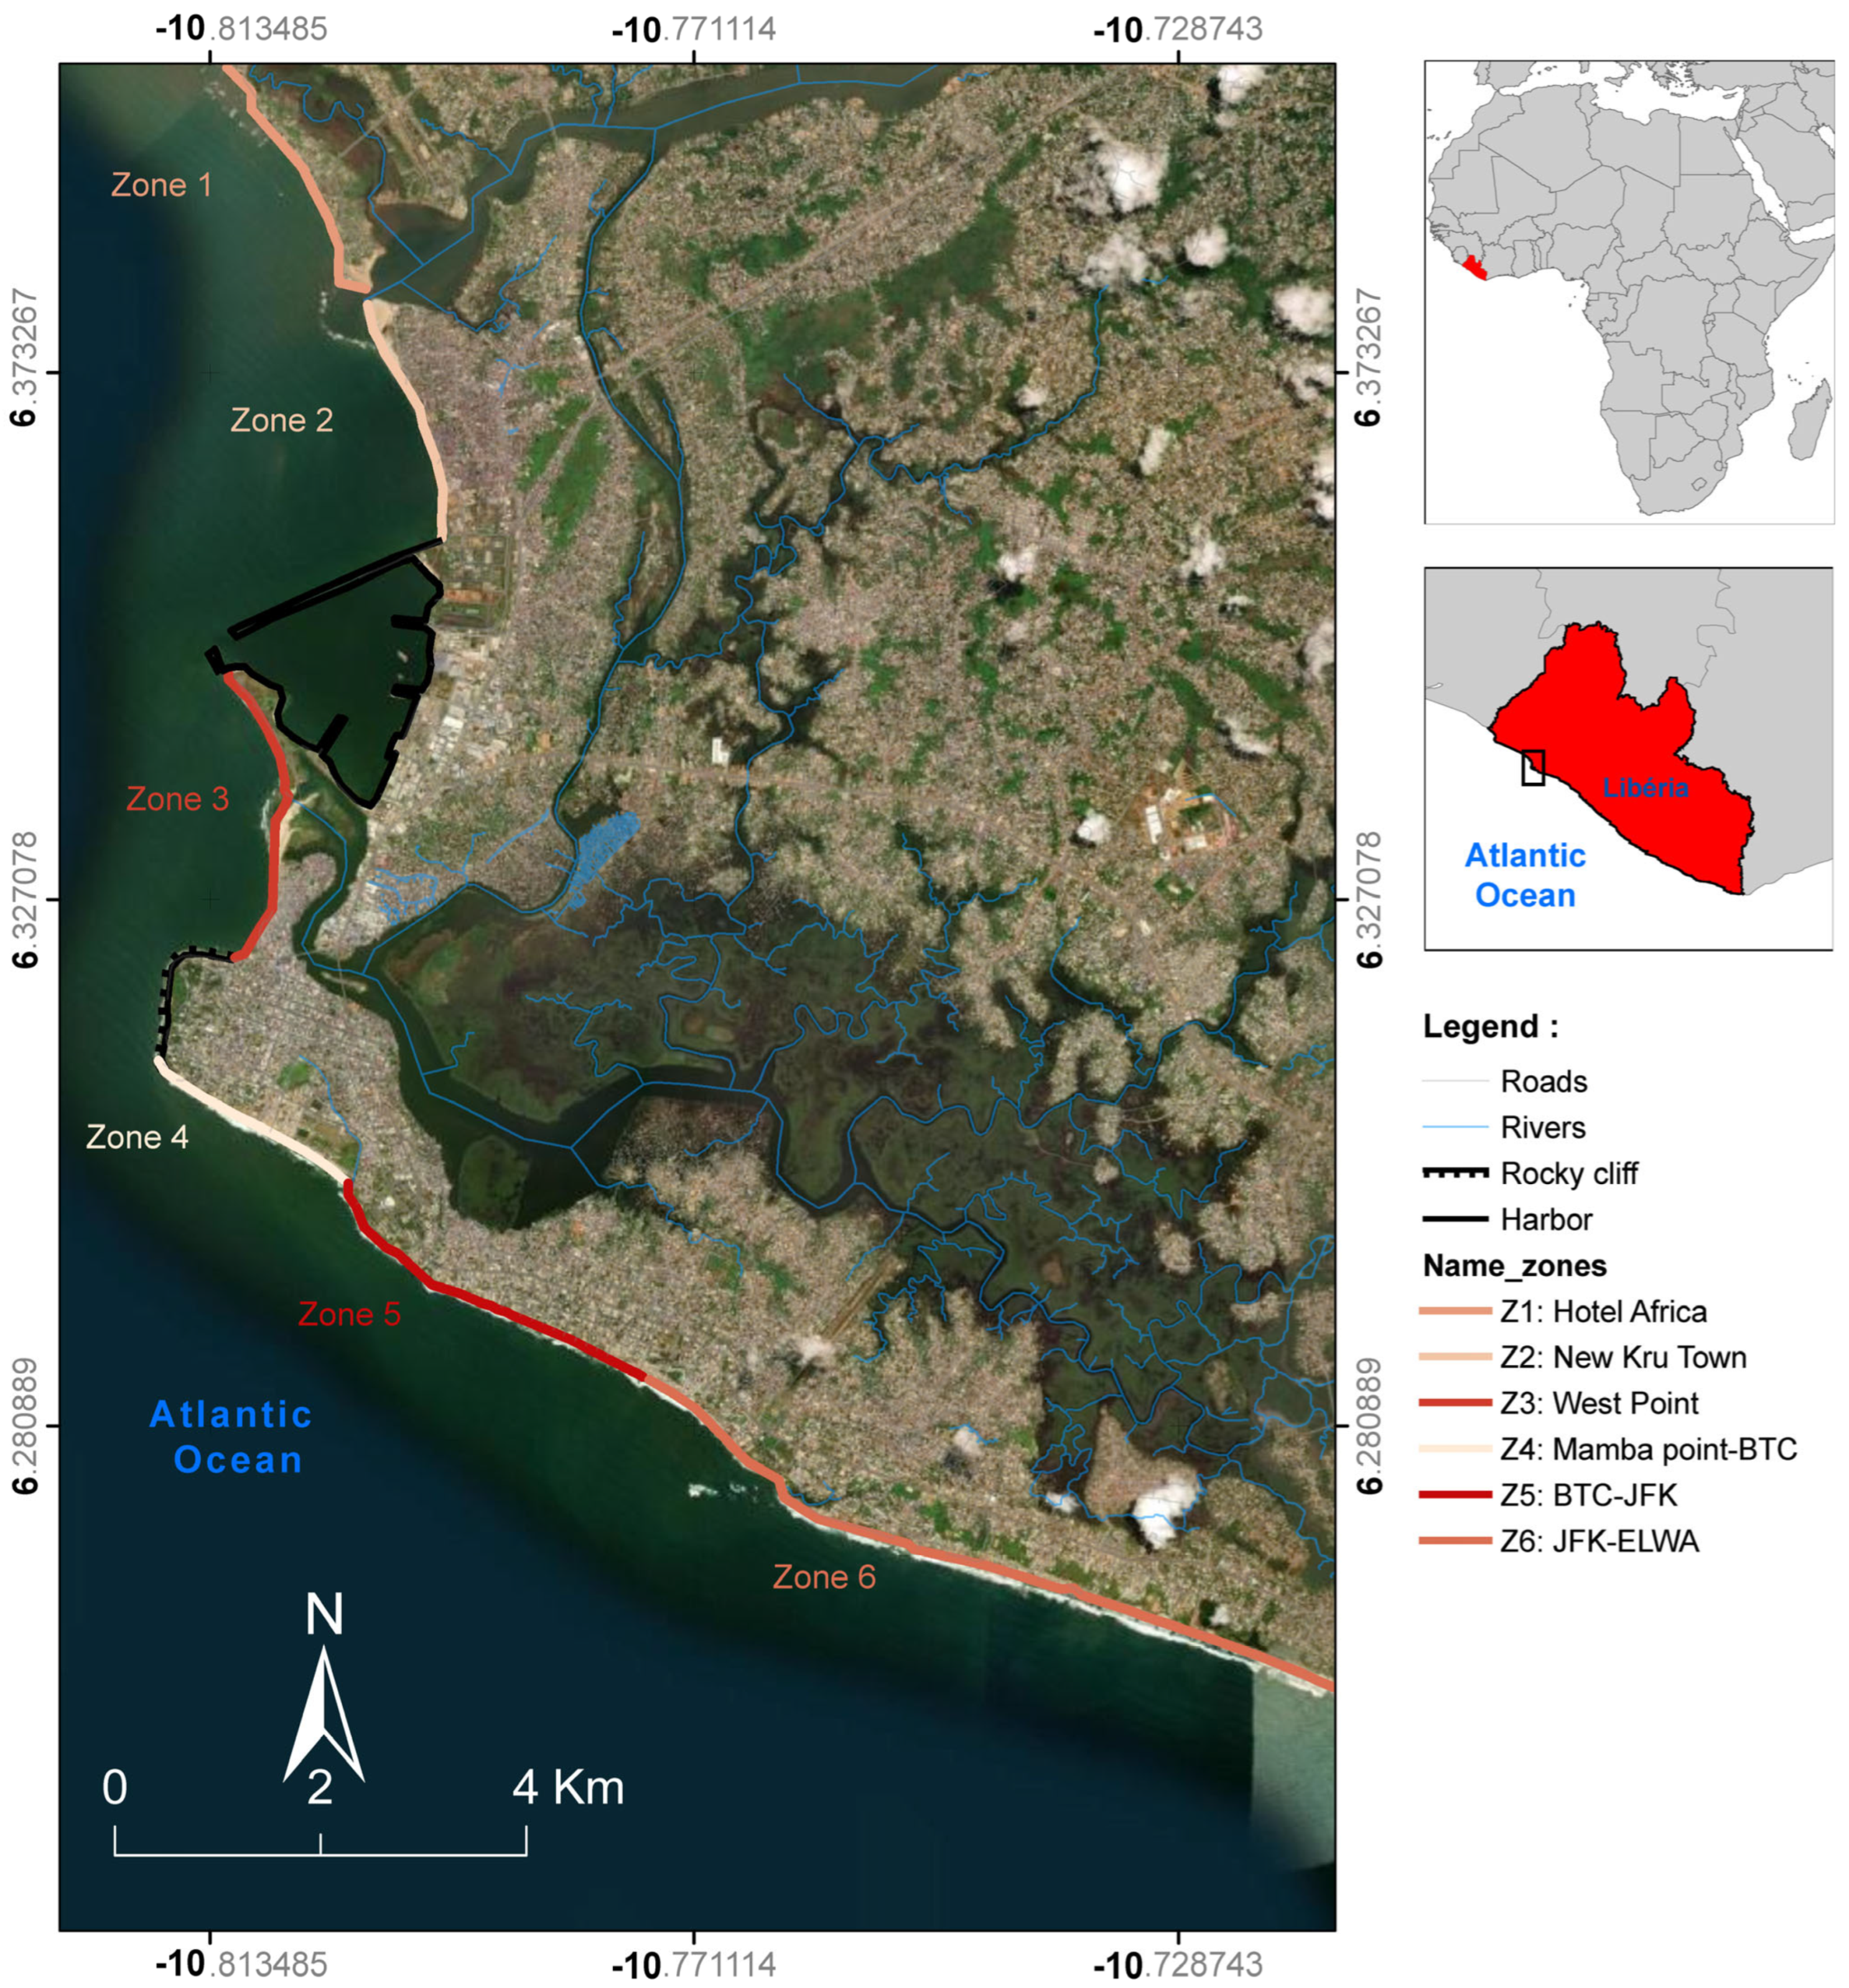
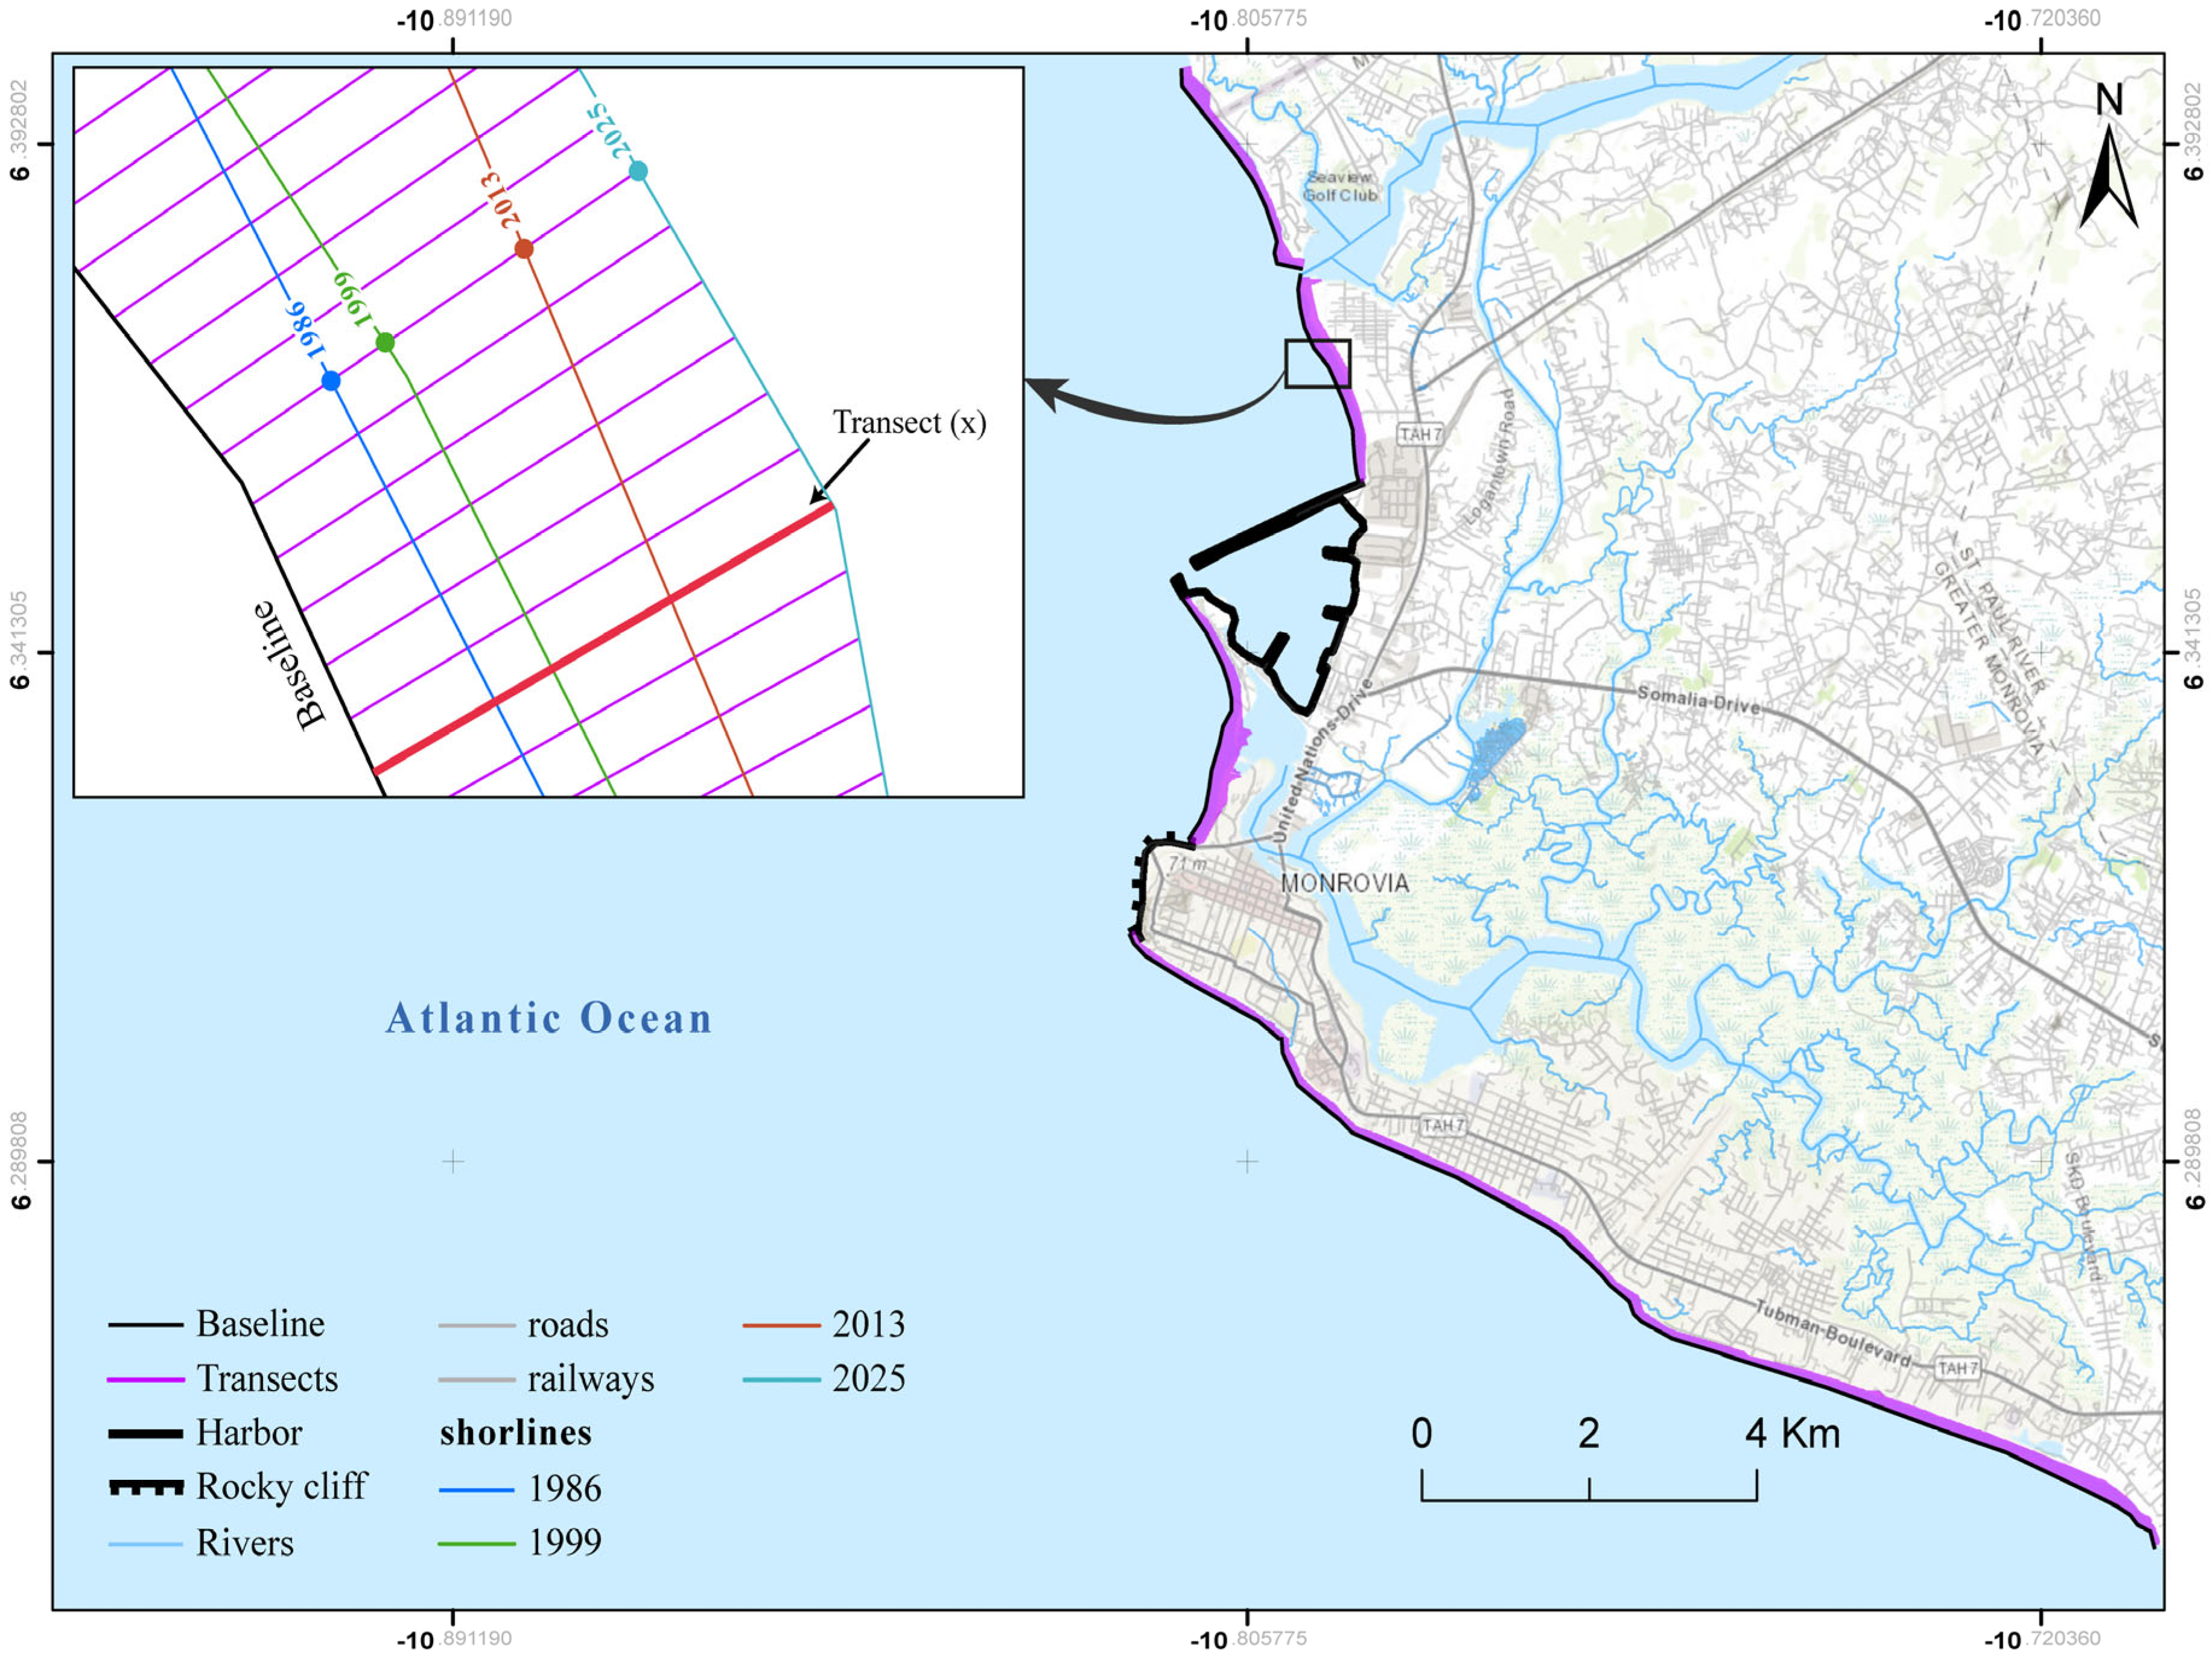
The Monrovia coastline extends approximately 20.5 km between 6°24′54″–6°15′20″ N latitude and 10°48′47″–10°42′44″ W longitude (Figure 1). Geomorphologically, the coast is characterized by sandy beaches, dunes, estuaries, rocky cliffs, lagoons, mangrove swamps, and the Freeport of Monrovia harbor complex. The granulometric of sandy beaches are mostly medium coarse sand in the lower parts of the beaches, while upper parts are dominated by coarse sand with in the offshore areas [17]. Also, the estuary areas are mostly dominated by very coarse sediments, while the Mesurado lagoon areas are characterized by fine sediments [17]. The beaches consist mainly of medium- to coarse-grained quartz sand with iron oxide staining that imparts a brownish-white coloration [20]. The climate is humid tropical, with two distinct seasons: a wet season from April to October and a dry season from November to March. Air temperatures range between 24.2 °C and 27 °C [21]. More recent data indicate that average monthly sea-surface temperatures near Monrovia have risen from approximately 27.5 °C to 28.9 °C in recent decades [22]. Rainfall is strongly seasonal, ranging from about 22 mm in January to over 380 mm in September, with coastal areas receiving the heaviest precipitation [23]. The study area experienced semi-diurnal tides with two high and two low waters per day, a prevailing southeast–northwest littoral drift, and a morphologically representative wave height of about 1.3 m. North of Cape Mesurado, waves approach the coast obliquely until refracted parallel to the shoreline [20]. The study area is of considerable socio-economic and ecological importance. Liberia’s coastline extends about 559 km, with nearly 58% of the national population residing along it, often in low-lying zones with informal housing [8,9,10]. The country’s population is estimated at 5.2 million [24], with nearly one-fifth concentrated within the Monrovia coastal corridor. Demographic projections indicate that Liberia’s population will increase to approximately 8.9 million by 2036 and 9.4 million by 2046 [25], which will intensify pressures on coastal resources and vulnerability to shoreline retreat.

3. Material and Methods

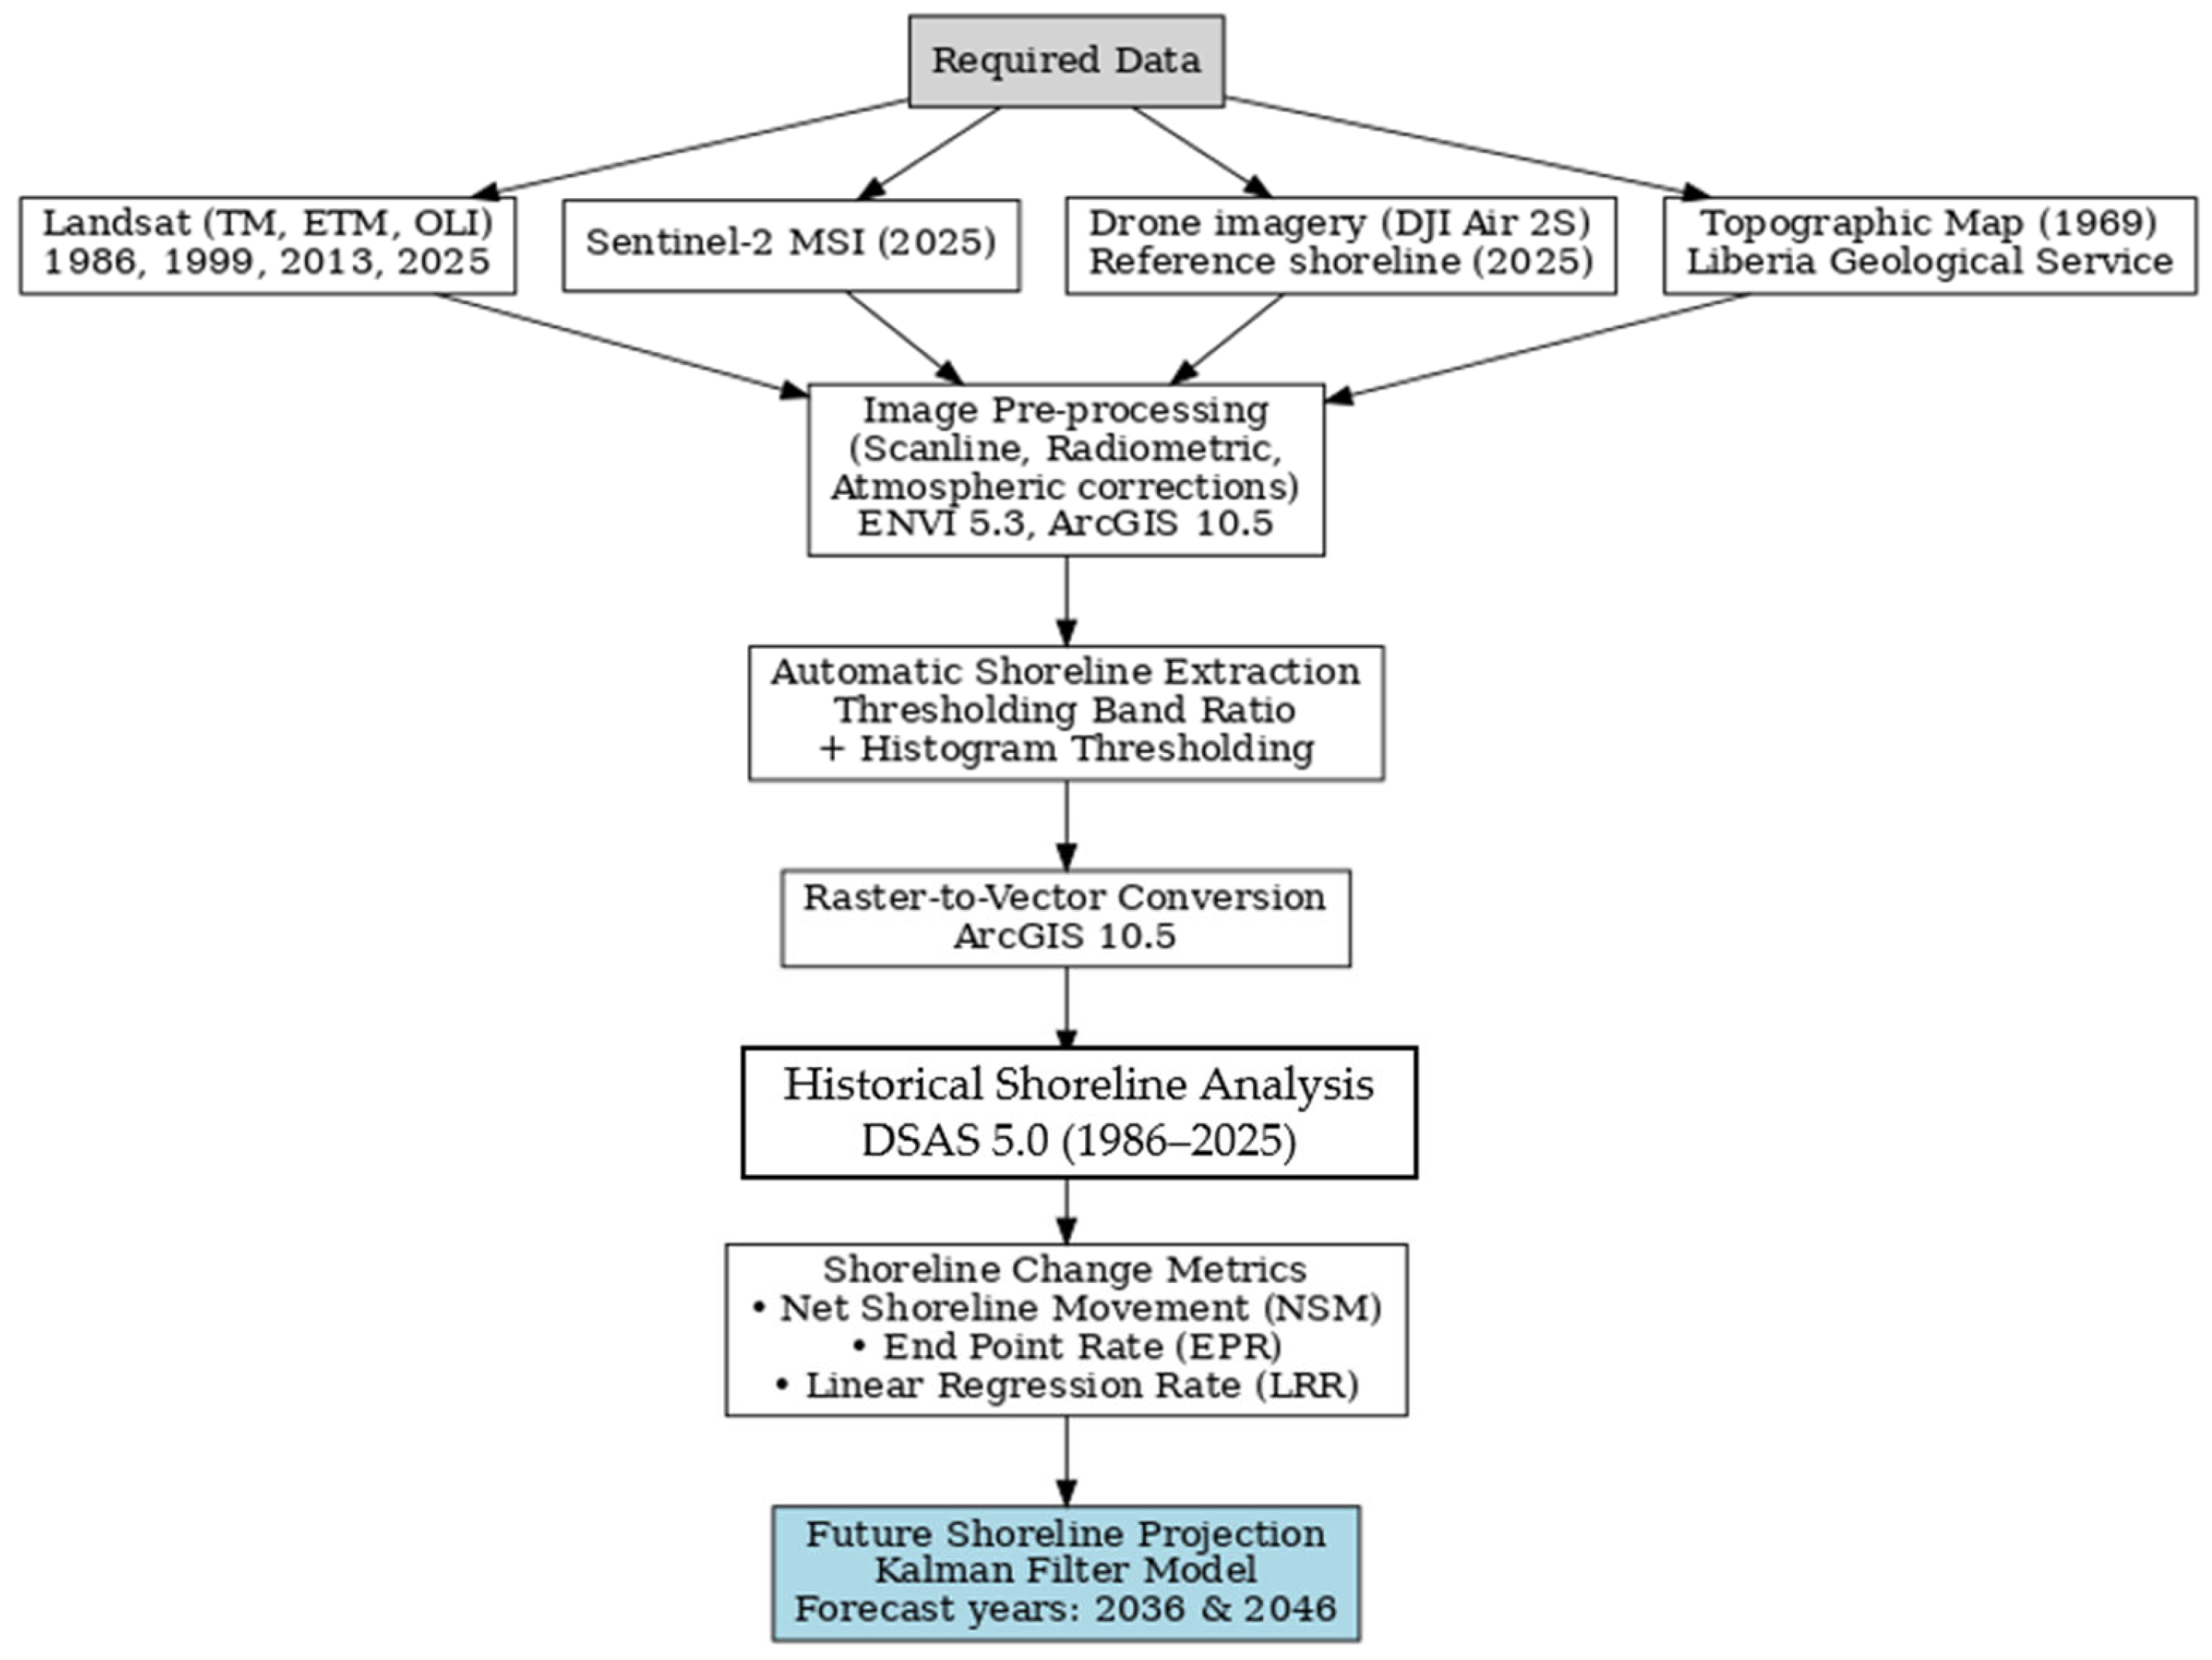
The methodological framework integrates remote sensing, GIS, and statistical modeling to extract, analyze, and forecast shoreline dynamics (Figure 2).

3.1. Shoreline Data and Sources

Multispectral Landsat imagery with 30 m resolution (TM, ETM, and OLI) spanning 1986–2025 was acquired from the USGS Earth Explorer. Sentinel-2 MSI imagery (10 m resolution) from 2025 was obtained through the Copernicus Open Access Hub, while qualitative validation’ aerial imagery orthomosaic of (DJI Air 2S, 1″ CMOS sensor SZ DJI Technology Co., Ltd., (Shenzhen, China) with a 2.4 μm pixel size and 2.7 cm Average Ground Sampling Distance (GSD)) was provided by Pepper-Bird Aerial Services (PAS). A 1969 historical topographic map (scale 1:7500) was obtained from the Liberia Geological Service under the Ministry of Mines and Energy of Liberia. Satellite Images were selected to less than 0.5% cloud cover and captured mostly during the dry season (December–March) to reduce tidal variability. Table 1 summarizes the characteristics of the imagery used. The 1969 topographic map was used exclusively for historical contextual reference and coastline comparison, not as a high-accuracy geodetic control source for modern shoreline extraction.
UAV imagery acquired in 2025 was processed to generate high-resolution orthomosaics primarily for visual interpretation and qualitative support. Due to the absence of high-precision GNSS-surveyed ground control points (RTK/PPK) and formally evaluated horizontal accuracy metrics, UAV-derived shorelines were not treated as absolute positional references.
Consequently, UAV data were not integrated into DSAS-based quantitative shoreline change rate calculations. Instead, they were used to support short-term field observations, identify local erosion features, and visually corroborate spatial patterns derived from satellite-based shoreline analysis.

3.2. Shoreline Positional Uncertainty Assessment

Shoreline positional uncertainty represents a fundamental constraint in shoreline change analysis, particularly when using multi-temporal satellite imagery of varying spatial resolutions. In this study, shoreline uncertainty was conservatively estimated by accounting for four primary components: (i) image spatial resolution, (ii) georeferencing accuracy, (iii) shoreline proxy uncertainty associated with the high-water line (HWL), and (iv) shoreline extraction and digitization error, following DSAS user guidelines and established coastal change literature.
For Landsat imagery (30 m spatial resolution), a conservative positional uncertainty range of ±20–30 m was adopted to reflect pixel size limitations, sensor geolocation errors, and variability in HWL interpretation. Sentinel-2 imagery (10 m resolution) was associated with lower, yet still conservative, uncertainty values ranging between ±10–15 m.
UAV-derived orthomosaics were not treated as absolute positional references; instead, they were used qualitatively to support short-term shoreline pattern interpretation due to the absence of high-precision GNSS-based ground control. Consequently, UAV shorelines were excluded from quantitative long-term rate calculations and were employed only for descriptive and comparative purposes.
Dataset-specific uncertainty values were incorporated into the DSAS uncertainty framework to compute confidence intervals for End Point Rate (EPR) and Linear Regression Rate (LRR) estimates. Shoreline change rates whose magnitudes approach or fall within the assigned uncertainty ranges were interpreted cautiously and discussed primarily as indicative spatial trends rather than precise quantitative displacement. This conservative uncertainty treatment ensures methodological transparency and avoids overinterpretation of medium-resolution shoreline change signals. Table 2 summarized shoreline positional uncertainty for different datasets.

3.3. Long-Term Shoreline Change Analysis (Landsat, 1986–2025)

Long-term shoreline change analysis in this study is based primarily on multi-temporal Landsat imagery spanning the period 1986–2025. Given the medium spatial resolution of Landsat data, results are interpreted in a trend-oriented manner, focusing on spatial patterns, persistence of erosion or accretion zones, and relative shoreline behavior rather than precise short-term displacement.

3.4. Short-Term High-Resolution Observations (Sentinel-2 and UAV)

Short-term shoreline observations were derived from higher-resolution Sentinel-2 imagery and UAV orthomosaics to support detailed spatial interpretation. Due to differences in spatial resolution and positional uncertainty, these datasets were not quantitatively merged with long-term Landsat-derived shoreline change rates. Instead, they were used to provide short-term contextual information, visual validation, and localized pattern assessment.

3.5. Shoreline Data Processing

Since shorelines are dynamic features, their delineation requires a consistent indicator. Following [26], we employed the High-Water Line (HWL) as the shoreline proxy, consistent with storm surge and tidal maxima [27]. Landsat images were pre-processed in ENVI version 5.3 Imagery with scanline error correction, radiometric calibration, and atmospheric adjustment. The 2025 Sentinel-2 was already preprocessed with less than 0.5% cloud cover. The 2025 aerial imagery orthomosaic geotiff was processed in WebODM version 2.8.1 software before importing to ArcGIS version 10.5 software for manual digitalization of the shoreline. All datasets were georeferenced to the 1969 topographic map using the UTM WGS 84 Zone 29N projection, with additional ground control points plotted to reduce distortions [28].

3.6. Automatic Shoreline Extraction

Shoreline extraction from medium-resolution satellite imagery is inherently challenging due to spectral overlap between land and water surfaces, particularly in turbid nearshore environments [29]. Several approaches have been proposed in the literature, including classification-based methods [30], spectral index techniques [31,32], and histogram thresholding approaches [1].
In this study, the Thresholding Band Ratio method was adopted due to its robustness and proven applicability in coastal environments [33,34]. The shoreline extraction procedure applied to medium-resolution imagery consisted of the following steps:
  • Histogram-based thresholding of Band 5 (near-infrared) was applied to separate land and water pixels into an initial binary image. Threshold values were determined empirically through histogram inspection and iterative visual assessment to ensure consistent water–land separation across different scenes.
  • Spectral band ratios (B2/B4 and B2/B5) were calculated, where ratio values greater than 1 indicate water surfaces and values lower than 1 correspond to land features, following the approach proposed by [1].
  • The resulting binary layers were logically multiplied to enhance classification robustness and reduce misclassification caused by mixed pixels, shadows, or turbid waters in the nearshore zone. This step improved shoreline continuity and minimized classification noise.
  • The final binary raster representing the water–land boundary was converted into vector format using ArcGIS 10.5, and the shoreline was extracted for subsequent DSAS analysis.
For the aerial imagery, shorelines were manually digitized using on-screen digitization tools to delineate a reference shoreline. Due to the absence of high-accuracy geodetic ground control, UAV-derived shorelines were used exclusively for qualitative interpretation and visual consistency checks, rather than for quantitative shoreline change rate calculations.

3.7. Historical Shoreline Change Analysis (1986–2025)

Shoreline change was quantified using the Digital Shoreline Analysis System (DSAS 5.0), integrated as an ArcGIS add-in. Shoreline and baseline layers were stored in a geodatabase and intersected with orthogonal transects to calculate rate-of-change statistics [35,36]. Three statistical metrics were employed:
  • Net Shoreline Movement (NSM): Distance between the earliest (1986) and latest (2025) shorelines (Equation (1)).
NSM = d1986d2025
  • End Point Rate (EPR): NSM divided by the time interval (Equation (2)).
EPR = d 1986 d 2025 t 1986 t 2025
  • Linear Regression Rate (LRR): Least squares regression applied to all shoreline positions along each transect [37,38].
In DSAS, confidence intervals associated with Linear Regression Rate (LRR) estimates are derived from regression statistics and represent the uncertainty of the fitted trend based on the defined shoreline positions and their associated uncertainties. In this study, conservative shoreline positional uncertainty values were assigned to each dataset and propagated within the DSAS framework. Consequently, confidence intervals are interpreted as indicators of relative statistical reliability rather than absolute positional accuracy, particularly for medium-resolution shoreline data. Following DSAS processing, a quality-control filtering step was applied to exclude transects with insufficient shoreline intersections or unreliable statistical outputs. As a result, the number of transects used for the forecasting analysis differs from the total number initially generated for historical shoreline assessment.

3.8. Potential Future Shoreline Trend (2035 and 2045)

Potential future shoreline trends were projected using the Kalman Filter model embedded in DSAS. This recursive method incorporates LRR as the baseline predictor and estimates shoreline change with associated uncertainty bands [36,39]. The model updates predicted shoreline positions by combining observed data with prior estimates, according to (Equation (3)):
Y ( t + Δ t ) = Y ( t ) + m × Δ t
where Y ( t ) is the shoreline position at time t , and m represents the shoreline change rate (m/yr). Forecasts were generated for 2036 (10 years) and 2046 (20 years). While effective, the approach does not account for all driving variables such as storm frequency or sediment supply, and results should therefore be interpreted as trend-based projections.

4. Results

Results are presented by distinguishing between long-term shoreline change trends derived from Landsat imagery and short-term high-resolution shoreline observations. This separation ensures consistency in interpretation and avoids direct quantitative comparison between datasets characterized by different spatial resolutions and uncertainty levels.
Shoreline change statistics derived using DSAS were primarily interpreted at the transect level and within relatively homogeneous coastal segments to preserve spatial variability along the study area. This approach allows localized erosion and accretion patterns to be identified without masking geomorphological and sedimentary differences between coastal zones.
Given the conservative uncertainty ranges associated with medium-resolution satellite imagery, shoreline change rates of low magnitude should be interpreted as indicative spatial trends rather than exact displacement values, while higher-magnitude erosion or accretion signals are considered more robust.
Although the study area is predominantly characterized by sandy beaches, the Monrovia coastline was subdivided into six distinct coastal zones corresponding to major settlement areas to facilitate zone-specific interpretation of shoreline behavior. These include Zone I (Hotel Africa), Zone II (New Kru Town), Zone III (West Point), Zone IV (Mamba Point–BTC), Zone V (BTC–JFK), and Zone VI (JFK–ELWA) (Figure 1). This zonation reflects differences in geomorphological setting, human pressure, and sedimentary conditions along the coast.
A total of 1285 shore-normal transects were generated along the 20.5 km coastline using the Digital Shoreline Analysis System (DSAS), enabling transect-level assessment of shoreline change variability within and between zones (Figure 3). Historical shoreline positions corresponding to the years 1986, 1999, 2013, and 2025 were analyzed to characterize long-term shoreline trends, while exploratory shoreline projections were generated for 2036 and 2046 using the Kalman Filter model implemented in DSAS.
Although a total of 1285 transects were initially generated along the Monrovia coastline, a subset of 1090 transects was retained for statistical analysis. Transects intersecting river mouths, data gaps, or areas with inconsistent shoreline geometry were excluded to ensure analytical robustness. As a result, transect numbering and zone boundaries in Table 3 reflect the filtered dataset used for shoreline change rate calculations, whereas Table 2 reports the initial transect generation.
Table 3 summarizes the historical shoreline change rates derived from the end-point rate (EPR) and linear regression rate (LRR) statistics, which are interpreted primarily in terms of relative spatial patterns and persistent erosion or accretion trends. Table 4 present the exploratory projections for 2036 and 2046, which are intended to support scenario-based coastal planning and risk awareness rather than to provide deterministic forecasts of future shoreline positions.

4.1. Historical Shoreline Changes Analysis (1986–2025)

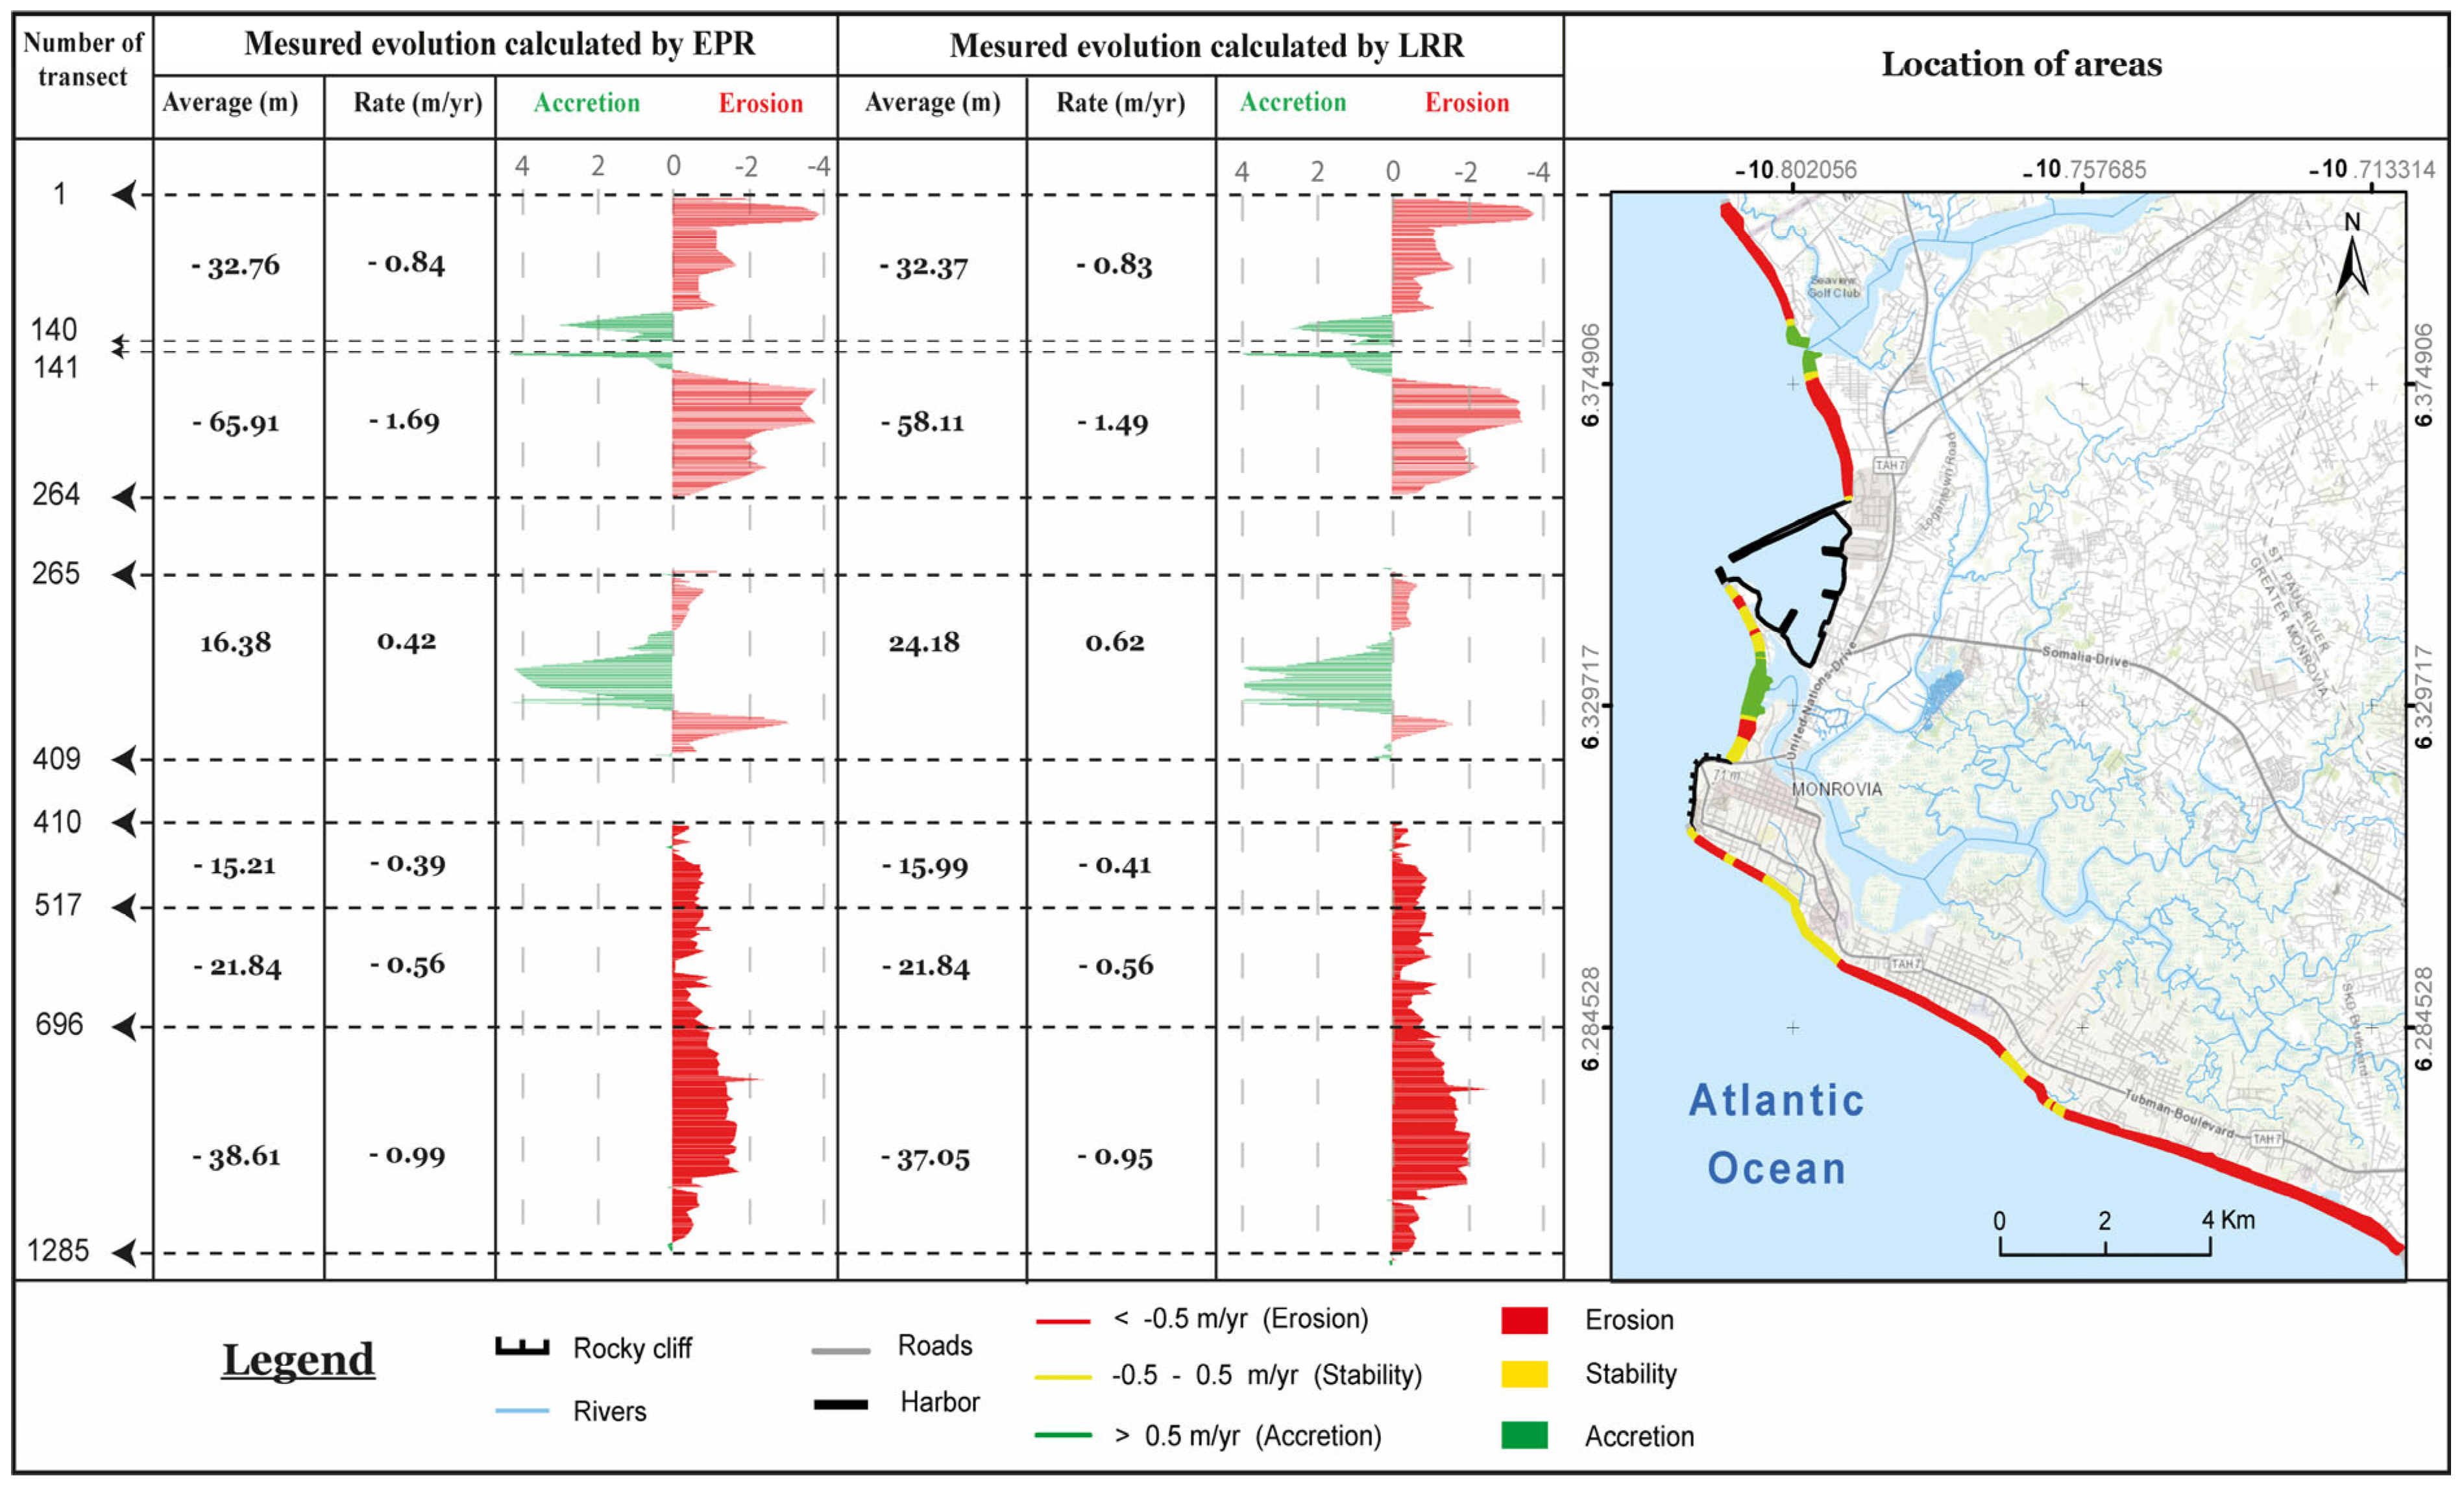
Historical analysis indicates significant variability between erosional and accretional zones. Aggregated shoreline change values reported for the entire coastline are presented as descriptive indicators intended to summarize general tendencies rather than to represent uniform shoreline behavior across all coastal zones. Shoreline change analysis indicates that zone-averaged retreat rates vary considerably along the study area, reflecting strong spatial heterogeneity in shoreline behavior (Table 2). Zones I, II, VI, and III exhibit predominantly erosional tendencies, with average retreat rates of −3.63 m/yr, −3.45 m/yr, −2.26 m/yr, and −1.60 m/yr, respectively. In contrast, localized accretional trends are observed within Zones II, III, and I, where maximum accretion rates reach 5.85 m/yr, 4.22 m/yr, and 2.61 m/yr, respectively (Figure 4). These values represent zone-specific averages derived from transect-level DSAS statistics and are interpreted in terms of relative spatial patterns rather than uniform shoreline behavior across the entire coastline.
The observed zone-specific patterns are consistent with documented sedimentary processes along the Monrovia coast. For instance, localized accretion in northern West Point is likely influenced by sediment supply from the Mesurado River and by the disruption of longshore sediment transport caused by the Freeport breakwaters, in agreement with observations reported by [40], who documented sediment accumulation following harbor expansion. Similarly, depositional trends identified in New Kru Town are consistent with findings by [14], who attributed localized accretion to sediment delivery from the St. Paul River. These interpretations highlight the role of riverine inputs and engineered structures in modulating shoreline change at the local scale.
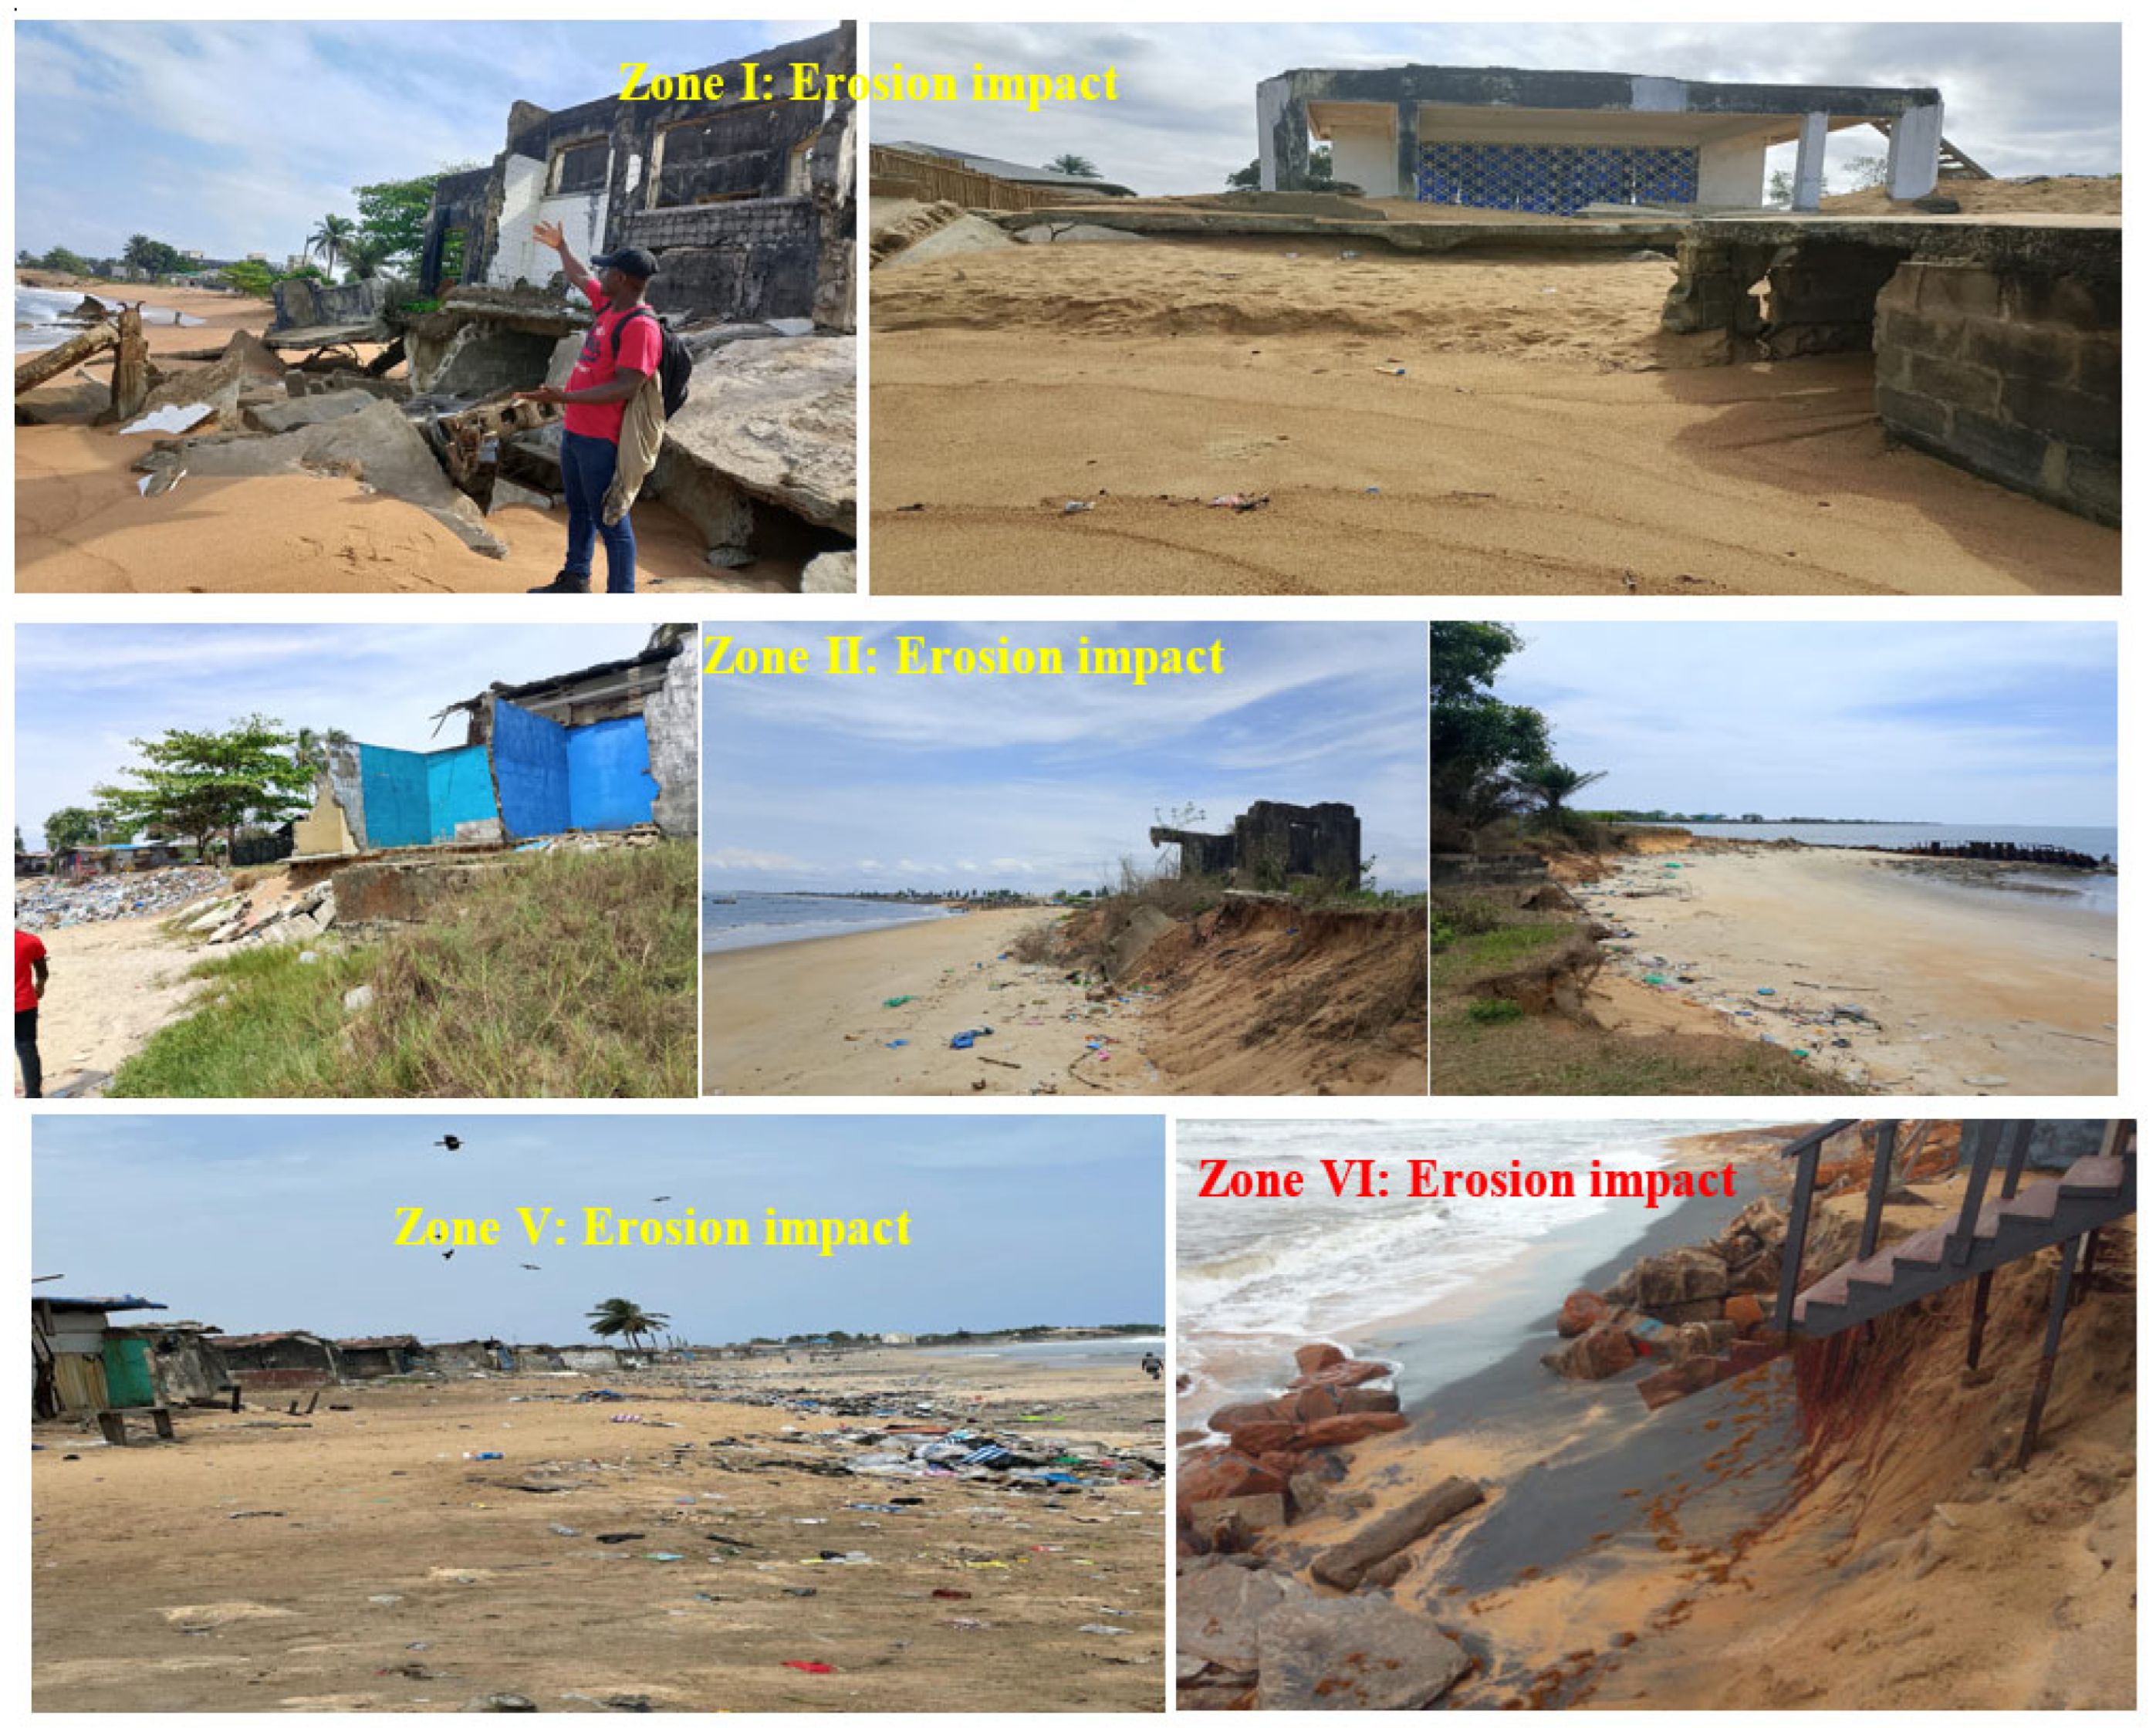
Conversely, severe erosion in Hotel Africa, New Kru Town and JFK–ELWA reflects long-term retreat as also reported in earlier studies. The survey in Ref. [15] documented continuous erosion in these segments, while Ref. [16] also projected retreat under climate change scenarios, particularly in the absence of protective infrastructure. The persistence of these erosional hotspots in the present study (Figure 5) confirms that natural drivers (sea-level rise, high-energy waves) and anthropogenic stressors (sand mining, mangrove clearance) are compounding long-term vulnerability.
The confidence intervals reported for LRR estimates should be interpreted in the context of data resolution and shoreline positional uncertainty and are primarily intended to support comparative assessment of shoreline change trends rather than precise quantification of shoreline displacement.

4.2. Zone-by-Zone Interpretation

  • Zone I (Hotel Africa): Strong erosion (−3.63 m/yr) combined with localized accretion. The observed retreat is consistent with [15,19], who reported progressive land loss in this segment.
  • Zone II (New Kru Town): Exhibited both high accretion (5.85 m/yr) and erosion (−3.45 m/yr). The duality reflects findings by [14], who described the influence of the St. Paul River on shoreline dynamics.
  • Zone III (West Point): Showed mixed patterns, with accretion in the north and erosion elsewhere. This agrees with [40], who highlighted the role of the Freeport breakwaters in altering sediment transport.
  • Zone IV (Mamba Point–BTC): Relatively stable, with modest erosion (−0.68 m/yr), confirming earlier observations by [17].
  • Zone V (BTC–JFK): Moderate erosion (−1.05 m/yr), consistent with [17], who identified BTC as a vulnerable yet less dynamic section compared to West Point and New Kru Town.
  • Zone VI (JFK–ELWA): Persistent erosion (−2.26 m/yr), matching findings by [17,18], which highlighted this area as one of the most threatened along the Monrovia shoreline.

4.3. Forecasted Shoreline Positions (2036 and 2046)

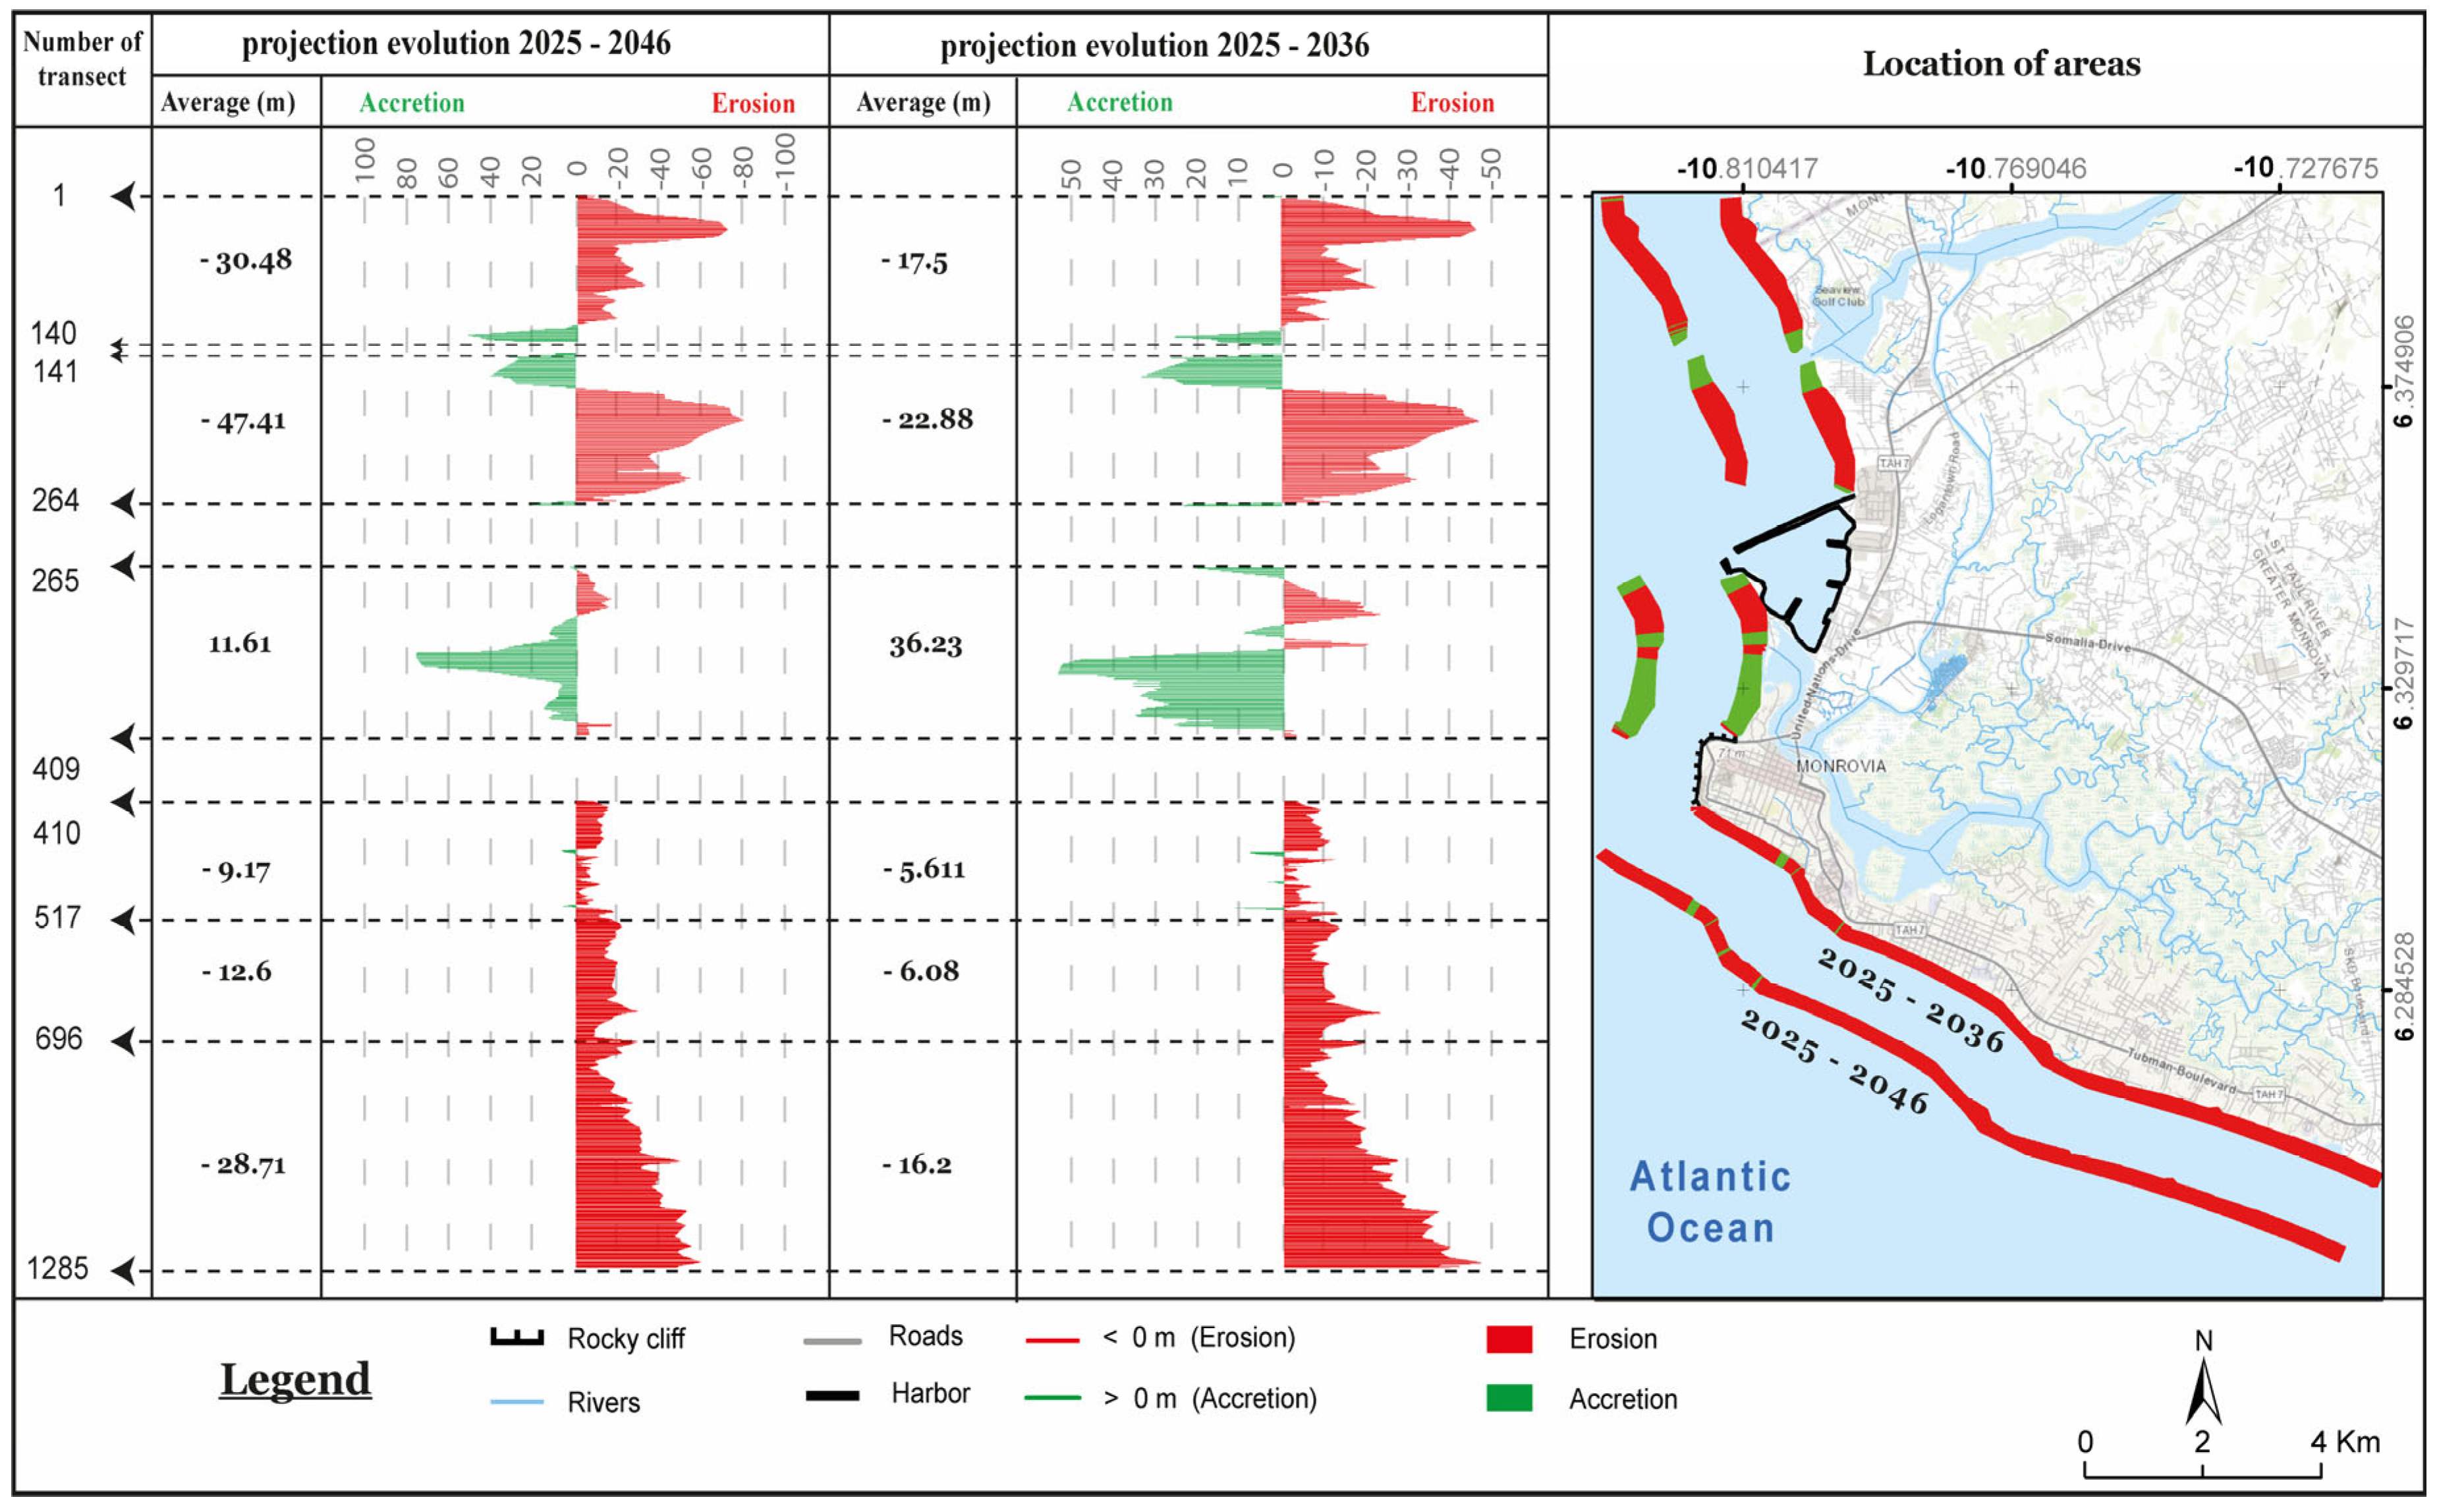
The shoreline projections generated using the Kalman Filter should be interpreted as exploratory scenarios illustrating potential future shoreline tendencies under the assumption of continued historical trends (see Figure 6). These projections do not account for dynamic coastal processes, sediment budgets, or future anthropogenic interventions and therefore should not be interpreted as deterministic projections. The Kalman Filter Model forecasts indicate a continuation of historical trends, with increasing erosion pressure in vulnerable zones. For 2036, the average erosion rate is projected at −7.7 m/yr, equivalent to a retreat of −85 m, while accretion averaged +50.9 m. The most severe erosion is expected in Zones I, II, and VI (−46 to −47 m), whereas Zones II and III in their northern parts are projected to experience significant accretion (+36 to +54 m).
By 2046, retreat is forecasted to intensify, with maximum values of −79.1 m (Zone II), −70.3 m (Zone I), and −60.1 m (Zone VI). Meanwhile, accretion may reach +78.2 m in Zone III and +50.2 m in Zone I. These findings reinforce earlier projections by [16,17], who predicted retreat under both RCP 4.5 and 8.5 scenarios, and extend them by integrating field validation.

4.4. Regional Comparison

The results from Monrovia are consistent with broader West African shoreline studies. Refs. [4,41], reported erosion rates of 1–3 m/yr and 2 m/yr, respectively, along Ghana’s shoreline. Ref. [42], recorded a maximum erosion rate of 5 m/yr along Togo’s shoreline. Ref. [43] calculated an average erosion rate of 3.56 m/yr along the coast of Senegal. Ref. [44] observe an average erosion rate of up to 2 m/yr along the entire Nigerian shoreline. Ref. [45] recorded an erosion rate of up to 4.5 m/yr along Benin’s coast. The observed dual pattern of erosion and accretion in Liberia, therefore, reflects regional coastal dynamics shaped by a combination of natural forcing and anthropogenic modification.

4.5. Implications of Observed Trends

The persistence of erosion in Zones I, II, and VI, combined with projected intensification by 2046, underscores the urgent need for adaptive coastal management. Comparisons with earlier studies show that hotspots identified decades ago (e.g., [14,15]) remain active, suggesting limited effectiveness of past interventions. While riverine sediment supply offers temporary relief in localized zones, long-term sustainability will require integrated strategies, including mangrove restoration, improved regulation of sand mining, and engineered defenses. Without such measures, Monrovia is likely to face escalating land loss, infrastructure damage, and community displacement in the coming decades.

5. Discussion

5.1. Key Findings and Interpretation

Shoreline change analysis confirmed that the Monrovia coastline is undergoing significant morphological alterations. Zone-based average shoreline changes rates indicate marked spatial variability along the study area between 1986 and 2025, with predominantly erosional trends observed in several zones (Table 3). Severe erosion was recorded in Zones I (Hotel Africa), II (New Kru Town), and VI (JFK–ELWA), while localized accretion occurred in Zones II and III, particularly near river mouths and areas influenced by harbor infrastructure. Exploratory projection with the Kalman Filter Model suggests that these patterns will persist and intensify by 2046, with maximum projected retreat of −79 m in New Kru Town and −70 m in Hotel Africa. In contrast, accretion is expected to continue in localized segments such as northern West Point, reaching up to +78 m.
The separation between long-term and short-term shoreline analyses allows the strengths of each dataset to be preserved, while acknowledging that precise shoreline change rates can only be confidently quantified where positional uncertainty is sufficiently constrained.

5.2. Comparison with Previous Studies

Our findings are consistent with earlier assessments of Liberia’s shoreline. The [15] survey reported erosion rates of 2.35–5.88 m/yr in New Kru Town and JFK–ELWA, which align with our historical results. Ref. [14] documented shoreline retreat of 2.3 m/yr between 1986 and 2015, slightly lower than our calculated rates, likely due to methodological differences and the inclusion of more recent imagery in this study. Similarly, Refs. [18,19] reported localized erosion rates of Liberia’s coastline using Landsat and Sentinel imagery, which are slightly over our results, probably due to the limited years considered, while [17] found retreat rates of up to 8.8 m/yr for a decade under high-emission (RCP 8.5) scenarios. The present study’s integration of field qualitative consistency through drone imagery and in situ surveys provides stronger ground-truth support for these trends.
Beyond Liberia, our results are comparable to regional West African studies. Refs. [4,41] reported erosion rates of 1–3 m/yr and 2 m/yr, respectively, along Ghana’s coastline. Reference [42] recorded a maximum erosion rate of 5 m/yr along Togo’s coastline. Ref. [43] calculated an average erosion rate of 3.56 m/yr along the coast of Senegal. Ref. [44] observe an average erosion rate of up to 2 m/yr along the entire Nigerian coastline. Ref. [45] recorded an erosion rate of up to 4.5 m/yr along Benin’s coast. This confirms that the dual processes of erosion and accretion documented in Monrovia reflect broader regional dynamics shaped by natural forcing and anthropogenic pressures. Comparatively, the Kalman Filter Model was used by both [46,47] along the Southeastern coastline of India and part of the Turkish coastline, respectively. Ref. [46] forecasted a shoreline retreat of 114 m, 160 m and shoreline gained of 260 m and 278 m for 2030 and 2040 respectively. With a maximum of up to 270 m retreat and 538 m of shoreline gained in certain areas. Similarly, Ref. [47] forecast shoreline retreat of up to 26.1 m and up to 55.8 m shoreline advancement by 2041. This shows the used of the Kalman Filter Model for effective shoreline retreat and accretion exploratory projection.

5.3. Drivers of Erosion and Accretion

The causes of Monrovia’s shoreline dynamics are both natural and human-induced. Key natural drivers include sea-level rise, high-energy wave exposure, tidal currents, and nearshore bathymetry [21,48]. Anthropogenic drivers include widespread sand mining, mangrove logging, and urban development, as well as the construction of breakwaters at the Freeport of Monrovia, which altered sediment transport pathways. Illegal logging has also contributed to mangrove degradation, reducing natural shoreline protection [49,50]. Population growth and rapid coastal urbanization exacerbate these pressures, placing vulnerable communities such as West Point and Hotel Africa at heigh.
The influence of natural and anthropogenic drivers varies spatially along the Monrovia coastline and is strongly zone-dependent. In Zone I (Hotel Africa), high erosion rates are primarily associated with strong wave exposure, narrow beach width, and the interruption of longshore sediment transport by existing coastal protection and harbor-related structures. These factors limit natural beach recovery and enhance shoreline retreat.
In Zone II (New Kru Town) and Zone III (West Point), localized accretion and erosion patterns reflect sediment inputs from the Mesurado River and the modification of littoral drift by port breakwaters, consistent with previous observations along this sector of the coast.
In Zone VI (JFK–ELWA), shoreline retreat is strongly influenced by anthropogenic pressures, particularly unregulated sand mining, mangrove clearance, and rapid coastal development. These activities reinforce natural drivers such as tidal dynamics and river–sea interactions near the St. Paul River mouth, leading to sediment deficit and reduced natural shoreline protection.
This zone-based interpretation highlights the need for spatially targeted management strategies rather than uniform coastal interventions.

5.4. Broader Context and Global Relevance

These findings align with global assessments of shoreline retreat under climate change. Ref. [48] projected that up to 50% of sandy coastlines worldwide may retreat by more than 100 m by 2100 under high-emission scenarios. Similarly, the [51] emphasized that West African coasts are highly vulnerable to sea-level rise and extreme events due to limited adaptive capacity. The Monrovia case study thus exemplifies the combined effects of global sea-level rise and local anthropogenic stressors, underscoring the urgent need for adaptive coastal management in low-income settings.

5.5. Implications for Coastal Management

The persistence of erosion hotspots in Hotel Africa, New Kru Town, and JFK–ELWA highlights priority areas for intervention. While localized accretion may offer short-term relief in West Point and New Kru Town, these gains are unlikely to offset long-term sea-level rise and storm surge impacts. Management strategies should therefore combine hard engineering measures (e.g., revetments, groynes) with nature-based solutions such as mangrove restoration and sediment management. Strengthening institutional capacity, regulating sand mining, and expanding community-based monitoring will also be critical for long-term resilience.

5.6. Limitations and Future Research

Despite providing one of the most comprehensive multi-decadal shoreline change assessments for the Monrovia coastline, this study has several limitations that should be considered when interpreting the results.
First, shoreline projections derived from the Kalman Filter in DSAS are trend-based and exploratory, assuming temporal stationarity and not accounting for abrupt processes such as extreme storms, flooding events, or future coastal interventions. Therefore, the projected shoreline positions should be interpreted as scenario-based indicators rather than deterministic forecasts.
Second, the long-term analysis relies mainly on medium-resolution Landsat imagery (30 m), which introduces inherent positional uncertainty in shoreline delineation. As a result, the findings are interpreted primarily in terms of relative spatial patterns and persistent erosion or accretion trends, rather than precise absolute rates at individual locations.
Third, UAV-derived orthomosaics were used exclusively for qualitative interpretation and visual support, and not as quantitative shoreline inputs, due to the absence of high-accuracy geodetic control (e.g., RTK/PPK GNSS). Consequently, UAV data were not treated as a higher-precision reference than satellite-derived shorelines.
Finally, sediment budgets and hydrodynamic processes were not explicitly quantified. Future research should integrate higher-resolution imagery, GNSS-supported UAV surveys, hydrodynamic–morphodynamic modeling, and climate projections (e.g., CMIP6 scenarios) to enhance process-based understanding and predictive capability.

6. Conclusions

This study presents a long-term GIS-based assessment of shoreline dynamics along the Monrovia coastline, integrating multi-decadal satellite imagery, DSAS-based shoreline metrics, and field observations within a data-scarce coastal context. The results demonstrate that transect-level and zone-specific analyses are essential, as spatially aggregated indicators may obscure localized shoreline behavior.
Analysis of Landsat imagery (1986–2025) reveals persistent erosion hotspots around Hotel Africa, New Kru Town, and the JFK–ELWA corridor, alongside localized accretion near river mouths and engineered coastal structures. These spatial patterns are consistent with field observations and known sedimentary processes.
Exploratory shoreline projections using the Kalman Filter indicate a continuation of historical trends under stationary assumptions. However, these projections are intended to support risk awareness and coastal planning, rather than to provide precise forecasts of future shoreline positions.
The persistence of erosion-prone segments highlights the urgent need for integrated coastal management in Monrovia. While natural drivers such as sea-level rise and wave climate remain dominant, human pressures—including sand mining, mangrove clearance, and rapid urban development—significantly exacerbate shoreline instability.
Overall, this research demonstrates the value of combining long-term satellite-based analysis with exploratory forecasting tools to inform adaptive coastal management in data-limited regions, while emphasizing the need for future integration of high-resolution monitoring and process-based modeling.
  • Recommended adaptive measures
Over the past four decades, Monrovia’s coastline has undergone persistent retreat, particularly in erosion hotspots such as Hotel Africa, New Kru Town, West Point, and JFK–ELWA. These changes are driven by a combination of natural processes, including sea-level rise, storm surges, and tidal dynamics, as well as anthropogenic pressures such as unregulated sand mining, mangrove clearance, and poorly planned coastal development [14,15,17,19]. Given that much of the population resides in low-lying areas with informal housing [10], urgent and integrated adaptive measures are required to safeguard communities, infrastructure, and ecosystems. The following strategies are recommended:
  • Establish a continuous shoreline monitoring program that integrates remote sensing, GIS-based analysis, and empirical field surveys. Regular reporting by national agencies would strengthen early warning systems and provide critical data for adaptive coastal planning.
  • Enforce existing laws against unregulated sand mining and mangrove logging, while developing new coastal regulations that establish buffer zones and restrict hazardous activities within a defined distance of the shoreline.
  • Integrate climate change adaptation strategies into all government agencies responsible for coastal zone management, urban planning, and infrastructure development. This mainstreaming ensures that future projects account for projected sea-level rise and shoreline retreat.
  • Implement coastal protection measures that combine hard engineering structures (revetments, groynes) with nature-based solutions (mangrove restoration, dune stabilization). This hybrid approach recognizes the dynamic nature of Monrovia’s coast and balances ecological sustainability with immediate protection needs [52].
  • Develop livelihood diversification programs, awareness campaigns, and community engagement initiatives to enhance social resilience. Building local capacity for rapid response and compliance will be critical for sustaining long term adaptation efforts. These adaptive strategies, if implemented collectively, would reduce vulnerability to coastal erosion and enhance the resilience of Liberia’s coastal communities in line with international best practices for climate adaptation [48,51]. As changes in the shoreline’s location may indicate either natural or anthropogenic factors in the nearby river catchments or along the beach [53], its position is a reflection of the coastal sediment budget.

Author Contributions

Conceptualization, T.B., A.A., Z.E. and A.M.; Methodology, T.K.W., Y.F. and A.M.; Software, T.K.W., Y.F., Z.E., J.C.L.M. and A.M.; Validation, T.K.W.; Investigation, A.A. and Y.F.; Resources, J.C.L.M. and G.K.F.; Writing—original draft, T.K.W. and Z.E.; Writing—review and editing, A.B. and A.M.; Revision of final draft, A.A. and A.B.; Project administration, G.K.F.; Funding acquisition, J.C.L.M. and G.K.F. All authors have read and agreed to the published version of the manuscript.

Funding

This research received no external funding.

Data Availability Statement

The raw data supporting the conclusions of this article will be made available by the authors on request.

Acknowledgments

During the preparation of this work, the authors used Chatgpt 5.0 in order to rephrase some sentences. After using this tool, the authors reviewed and edited the content as needed and take full responsibility for the content of the publication. The authors would like to sincerely acknowledge George H. Fahnbulleh and Isaac Vah Tukpah Jr., affiliated with Liberia Aerial Services (LAS), for kindly providing the UAV imagery used in this study at no cost. Their support significantly contributed to the field-based interpretation and qualitative validation of shoreline dynamics presented in this research.

Conflicts of Interest

The authors declare no conflicts of interest.

References

  1. Alesheikh, A.A.; Ghorbanali, A.; Nouri, N. Coastline change detection using remote sensing. Int. J. Environ. Sci. Technol. 2007, 4, 61–66. [Google Scholar] [CrossRef] [Scilit]
  2. Mukhopadhyay, A.; Mukherjee, S.; Hazra, S.; Mitra, D. Sea level rise and shoreline changes: A geoinformatics appraisal of chandipur coast, Orissa. Int. J. Geol. Earth Environ. Sci. 2011, 1, 9–17. [Google Scholar]
  3. Salghuna, N.N.; Bharathvaj, S.A. Shoreline Change Analysis for Northern Part of the Coromandel Coast. Aquat. Procedia 2015, 4, 317–324. [Google Scholar] [CrossRef] [Scilit]
  4. Addo, K.A.; Walkden, M.; Mills, J.P. Detection measurement prediction of shoreline recession in Accra Ghana. ISPRS J. Photogramm. Remote Sens. 2008, 63, 543–558. [Google Scholar] [CrossRef] [Scilit]
  5. Pilkey, O.H.; Hume, T. The shoreline erosion problem: Lessons from the past. Water Atmos. 2001, 9, 22–23. [Google Scholar]
  6. Kilibarda, Z.; Graves, N.; Dorton, M.; Dorton, R. Changes in beach gravel lithology caused by anthropogenic activities along the southern coast of Lake Michigan, U.S.A. Environ. Earth Sci. 2014, 71, 1249–1266. [Google Scholar] [CrossRef] [Scilit]
  7. Aangri, A.; Hakkou, M.; Krien, Y.; Benmohammadi, A. Predicting Shoreline Change for the Agadir Taghazout Coasts (Morocco). J. Coast. Res. 2022, 38, 937–950. [Google Scholar] [CrossRef] [Scilit]
  8. USAID. Liberia Climate Change Assessment. 2013. Available online: https://epa.gov.lr/epa-documents/liberia-climate-change-assessment/ (accessed on 11 January 2026).
  9. Nicholls, R.J.; Cazenave, A. Sea-Level Rise and Its Impact on Coastal Zones. Science 2010, 328, 1517–1520. [Google Scholar] [CrossRef] [Scilit]
  10. UN DESA. World Population Prospects 2015. 2015 Revision. Available online: https://esa.un.org/unpd/wpp/ (accessed on 20 January 2024).
  11. Global Environmental Facility. LDCF—Liberia—Enhancing Resilience of Vulnerable Coastal Areas to Climate Change Risks. 2010. Available online: https://www.thegef.org/newsroom/news/ldcf-liberia-enhancing-resilience-vulnerable-coastal-areas-climate-change-risks (accessed on 16 January 2025).
  12. Williams, M.R. Investigating the Impact of Coastal Erosion at Coastal Communities in Liberia. 2022. Available online: https://commons.wmu.se/all_dissertations/2094/ (accessed on 16 January 2025).
  13. MacDougall, C. Fearing the Tide in West Point, a Slum Already Swamped with Worry. The New York Times. 2016. Available online: https://nyti.ms/1Rk0FUa (accessed on 16 January 2024).
  14. Awange, J.L.; Saleem, A.; Konneh, S.S.; Goncalves, R.M.; Kiema, J.B.K.; Hu, K.X. Liberia’s coastal erosion vulnerability and LULC change analysis: Post-civil war and Ebola epidemic. Appl. Geogr. 2018, 101, 56–67. [Google Scholar] [CrossRef] [Scilit]
  15. JICA. Report on the Beach Erosion in the Republic of Liberia; Japan International Cooperation Agency: Tokyo, Japan, 1978.
  16. Mayson, J.C.L. The Present State of the Liberian Coast: Contributions to Coastal Vulnerability and Coastal Protection Master Plan. Master’s Thesis, Universitat Politècnica de Catalunya, Barcelona, Spain, 2018. [Google Scholar]
  17. CDR International BV. Provision of Consultancy Services for Engineering and Safeguards Assessment of Proposed Interventions in the Coastal Areas of the Monrovia Metropolitan Area (MMA) in Liberia. 2019. Available online: https://www.ungm.org/Public/Notice/70595 (accessed on 23 January 2023).
  18. Saleem, A.; Awange, J.L. Coastline shift analysis in data deficient regions: Exploiting the high spatio-temporal resolution Sentinel-2 products. CATENA 2019, 179, 6–19. [Google Scholar] [CrossRef] [Scilit]
  19. Foli, B.A.K.; Williams, I.K.; Boakye, A.A.; Azumah, D.M.Y.; Agyekum, K.A.; Wiafe, G. Earth observation services in support of West Africa’s blue economy: Coastal resilience and climate impacts. Remote Sens. Earth Syst. Sci. 2021, 5, 59–70. [Google Scholar] [CrossRef] [Scilit]
  20. Titus, J.G. Climate Changes and the Coast: Western Africa, the Americas, the Mediterranean Basin, and the Rest of Europe. In Miami Conference on Adaptive Responses to Sea Level Rise and Other Impacts of Global Climate Change: Changing Climate and the Coast; US Environmental Protection Agency: Washington, DC, USA, 1990; Volume 2. [Google Scholar]
  21. Wiles, D.L. Coastal Zone Vulnerability and Adaptation to Climate Change in Liberia. 2005. Available online: https://unfccc.int/files/national_reports/non-annex_i_natcom/meetings/application/pdf/20050419wiles.pdf (accessed on 28 January 2025).
  22. Temperature, W.S. Monrovia Sea Temperature. 2025. Available online: https://www.seatemperature.org/africa/liberia/monrovia.htm (accessed on 26 April 2025).
  23. LISGIS. Liberia Demographic and Health Survey 2013. 2014. Available online: https://dhsprogram.com/pubs/pdf/FR291/FR291.pdf (accessed on 28 January 2024).
  24. LIGIS. Liberia Population and Housing Census Final Results. 2022. Available online: https://lisgis.gov.lr/document/LiberiaCensus2022Report.pdf (accessed on 28 January 2024).
  25. World Population Projection. 2025. Available online: https://www.worldometers.info/world-population/liberia-population/ (accessed on 28 January 2025).
  26. Boak, E.H.; Turner, I.L. Shoreline Definition Detection: A Review. J. Coast. Res. 2005, 214, 688–703. [Google Scholar] [CrossRef] [Scilit]
  27. Mahapatra, M.; Ratheesh, R.; Rajawat, A.S. Shoreline Change Analysis along the Coast of South Gujarat India Using Digital Shoreline Analysis System. J. Indian Soc. Remote Sens. 2014, 42, 869–876. [Google Scholar] [CrossRef] [Scilit]
  28. El-Asmar, H.M.; Hereher, M.E. Change detection of the coastal zone east of the Nile Delta using remote sensing. Environ. Earth Sci. 2011, 62, 769–777. [Google Scholar] [CrossRef] [Scilit]
  29. Maiti, S.; Bhattacharya, A.K. Shoreline change analysis and its application to prediction: A remote sensing and statistics-based approach. Mar. Geol. 2009, 257, 11–23. [Google Scholar] [CrossRef] [Scilit]
  30. Muslim, A.M.; Ismail, K.I.; Khalil, I.; Razman, N.; Zain, K. Detection of shoreline changes at Kuala Terengganu, Malaysia, from multi-temporal satellite sensor imagery. In Proceedings of the 34th International Symposium on Remote Sensing of Environment—The GEOSS Era: Towards Operational Environmental Monitoring, Sydney, Australia, 10–15 April 2011. [Google Scholar]
  31. McFeeters, S.K. The use of the Normalized Difference Water Index (NDWI) in the delineation of open water features. Int. J. Remote Sens. 1996, 17, 1425–1432. [Google Scholar] [CrossRef] [Scilit]
  32. Xu, H. Modification of normalised difference water index (NDWI) to enhance open water features in remotely sensed imagery. Int. J. Remote Sens. 2006, 27, 3025–3033. [Google Scholar] [CrossRef] [Scilit]
  33. Masria, A.; Nadaoka, K.; Negm, A.; Iskander, M. Detection of Shoreline and Land Cover Changes around Rosetta Promontory, Egypt, Based on Remote Sensing Analysis. Land 2015, 4, 216–230. [Google Scholar] [CrossRef] [Scilit]
  34. Niya, A.K.; Alesheikh, A.A.; Soltanpor, M.; Kheirkhahzarkesh, M.M. Shoreline Change Mapping Using Remote Sensing and GIS. Int. J. Remote Sens. Appl. 2013, 3, 102–107. [Google Scholar]
  35. Himmelstoss, E.A.; Henderson, R.E.; Kratzmann, M.G.; Farris, A.S. Digital Shoreline Analysis System (DSAS) Version 5.0 User Guide; US Geological Survey: Reston, VA, USA, 2018. [CrossRef] [Scilit]
  36. Himmelstoss, E.A.; Henderson, R.E.; Kratzmann, M.G.; Farris, A.S. Digital Shoreline Analysis System (DSAS) Version 5.1 User Guide; US Geological Survey: Reston, VA, USA, 2021.
  37. Crowell, M.; Leatherman, S.P.; Buckley, M.K. Shoreline Change Rate Analysis: Long Term Versus Short Term Data. 1997. Available online: https://www.researchgate.net/publication/265928182 (accessed on 28 January 2025).
  38. Dolan, R.; Fenster, M.S.; Holme, S.J. Temporal Analysis of Shoreline Recession Accretion. J. Coast. Res. 1991, 7, 723–744. [Google Scholar]
  39. Long, J.W.; Plant, N.G. Extended Kalman Filter framework for forecasting shoreline evolution. Geophys. Res. Lett. 2012, 39, 2012GL052180. [Google Scholar] [CrossRef] [Scilit]
  40. Wilson, T.E. Republic of Liberia Coastal Zone’s Technology Needs Assessment for Climate Change Adaptation. 2019. Available online: https://ekmsliberia.info/wp-content/uploads/2020/12/tna-report-coastal-zone-liberia.pdf (accessed on 26 January 2024).
  41. Evadzi, P.I.K.; Zorita, E.; Hünicke, B. Quantifying predicting the contribution of sea-level rise to shoreline change in Ghana: Information for coastal adaptation strategies. J. Coast. Res. 2017, 33, 1283–1291. [Google Scholar] [CrossRef] [Scilit]
  42. Guerrera, F.; Martín-Martín, M.; Tramontana, M.; Nimon, B.; Kpémoua, K.E. Shoreline Changes and Coastal Erosion: The Case Study of the Coast of Togo (Bight of Benin, West Africa Margin). Geosciences 2021, 11, 40. [Google Scholar] [CrossRef] [Scilit]
  43. Sadio, M.; Sakho, I.; Seujip, M.S.; Gueye, A.; Diouf, M.B.; Deloffre, J. Multi-decadal dynamics of the Saloum River delta mouth in climate change context. J. Afr. Earth Sci. 2022, 187, 104451. [Google Scholar] [CrossRef] [Scilit]
  44. Oloyede, M.O.; Williams, A.B.; Ode, G.O.; Benson, N.U. Coastal Vulnerability Assessment: A Case Study of the Nigerian Coastline. Sustainability 2022, 14, 2097. [Google Scholar] [CrossRef] [Scilit]
  45. Balle, G.R.A.; Ahouansou, D.M.M.; Sintondji, L.C.O.; Agbossou, E.K. Analyses of Short-, Long-Term Shoreline Trends of the Southwest Benin Coast. J. Coast. Res. 2021, 37, 316–325. [Google Scholar] [CrossRef] [Scilit]
  46. Natarajan, L.; Sivagnanam, N.; Usha, T.; Chokkalingam, L.; Sundar, S.; Gowrappan, M.; Roy, P.D. Shoreline changes over last five decades and predictions for 2030 and 2040: A case study from Cuddalore, southeast coast of India. Earth Sci. Inform. 2021, 14, 1315–1325. [Google Scholar] [CrossRef] [Scilit]
  47. Kılar, H.; Aydın, O. Applying the kalman filter model to forecast shoreline positions: A case study in Şile, İstanbul. Türk Coğrafya Derg. 2024, 47–53. [Google Scholar] [CrossRef] [Scilit]
  48. Vousdoukas, M.I.; Ranasinghe, R.; Mentaschi, L.; Plomaritis, T.A.; Athanasiou, P.; Luijendijk, A.; Feyen, L. Sandy coastlines under threat of erosion. Nat. Clim. Change 2020, 10, 260–263. [Google Scholar] [CrossRef] [Scilit]
  49. UNDP. First State of the Environment Report for Liberia. 2006. Available online: https://docslib.org/doc/1501204/first-state-of-the-environment-report-for-liberia-2006-first-state-of-the-environment-report-for-liberia-2006 (accessed on 20 January 2025).
  50. UNEP. Desk Study on the Environment in Liberia; United Nations Environment Programme: Nairobi, Kenya, 2004. [Google Scholar]
  51. IPCC. The IPCC Special Report on Ocean and Cryosphere in a Changing Climate; Pörtner, H.-O., Roberts, D.C., Masson-Delmotte, V., Zhai, P., Tignor, M., Poloczanska, E., Mintenbeck, K., Alegría, A., Nicolai, M., Okem, A., et al., Eds.; Cambridge University Press: Cambridge, UK; New York, NY, USA, 2019; p. 755. [Google Scholar] [CrossRef] [Scilit]
  52. Rangel-Buitrago, N.G.; Anfuso, G.; Williams, A.T. Coastal erosion along the Caribbean coast of Colombia: Magnitudes, causes and management. Ocean Coast. Manag. 2015, 114, 129–144. [Google Scholar] [CrossRef] [Scilit]
  53. Belrhaba, T.; Hakkou, M.; Rey, T.; Aangri, A.; Krien, Y.; Elmostafa, Z.; Leone, F.; Benmohammadi, A. Shoreline Change and Climatic Variability along the Moulay Bousselham Coast (Moroccan Atlantic). J. Coast. Res. 2024, 40, 860–874. [Google Scholar] [CrossRef] [Scilit]
Figure 1. Location of the study area along the Monrovia coastline, Liberia.
Geomatics 06 00006 g001
Figure 2. Methodological flowchart summarizing the integrated approach: acquisition of satellite and aerial imagery, pre-processing and shoreline extraction, historical shoreline change analysis 1986–2025. Finally, shoreline exploratory projection was performed using the Kalman Filter algorithm implemented within the DSAS framework. It is important to note that this approach is trend-based and relies on simplifying assumptions, including the stationarity of historical shoreline behavior. When applied to long-term shoreline datasets derived from medium-resolution imagery, such as Landsat, the Kalman Filter primarily represents a statistical extrapolation of historical trends rather than a physically based projection of shoreline evolution.
Geomatics 06 00006 g002
Figure 3. Baseline, historical shorelines (1986, 1999, 2013, 2025), and transects (n = 1285) cast along the study area.
Geomatics 06 00006 g003
Figure 4. Historical shoreline changes rates (1986–2025) derived from the Linear Regression Rate (LRR) method across six coastal zones. Red (erosion), green (indicates accretion), and yellow (stability).
Geomatics 06 00006 g004
Figure 5. Field validation photographs showing evidence of coastal erosion, accretion, and community impacts along Monrovia’s shoreline.
Geomatics 06 00006 g005
Figure 6. Exploratory projection shoreline positions for 2036 and 2046 using the Kalman Filter Model. Results indicate persistence of erosion hotspots in Hotel Africa, New Kru Town, and JFK–ELWA, and localized accretion in West Point and New Kru Town.
Geomatics 06 00006 g006
Table 1. Characteristics of selected imagery. Landsat imagery 1986–2025 for the analysis and projection. The Sentinel-2 Aerial imagery 2025 were used as a reference.
Acquisition DataSatellite/SensorPixel Size/GSDPath/RowCoordinate System/DatumZonePurpose
21 January 1986Landsat_5/TM

30 m


200/056


UTM/WGS 84


29

Shoreline analysis and projection
10 February 1999Landsat_5/TM
25 December 2013Landsat_7/ETM
21 March 2025Landsat_8/OLI
3 March 2025Sentinel-2/MSI10 m-Reference shoreline
10 March 2025DJI Air 2S/1″ CMOS2.4 μm/2.7 cm-
Table 2. Assigned shoreline positional uncertainty for different datasets.
DatasetSpatial ResolutionAssigned Positional UncertaintyUsage in Analysis
Landsat (TM/ETM+/OLI)30 m±20–30 mLong-term trend analysis
Sentinel-210 m±10–15 mIntermediate-scale pattern assessment
UAV orthomosaics<0.1 mNot quantifiedQualitative support only
Table 3. Summary of historical shoreline change statistics LRR with 99.9% confidence interval.
Coastal ZonesZone I:
Hotel Africa
Zone II:
New Kru Town
Zone III:
West Point
Zone IV: Mambapoint-BTCZone V:
BTC-JFK
Zone VI:
JFK-ELWA
Number of transects140 (1–140)124 (141–264)145 (265–409)108 (410–517)178 (518–696)590 (697–1285)
shoreline length (Km)2.52.41.52.647.5
Average erosion (m/year)−1.51−2.33−0.85−0.51−1.1−1.42
Average accretion (m/year)1.7331.561.740.070.050.03
Maximum erosion (m/year)−3.63−3.45−1.6−0.68−1.05−2.26
Maximum accretion (m/year)2.615.854.220.090.060
Standard deviation of mobility (m/year)1.521.791.510.230.280.53
Total transects that record erosion1101016389176590
Total transects that record accretion3023801420
Average of all accretional rates1.511.631.550.040.050
Average of all erosional rates−1.47−2.2−0.56−0.48−0.56−0.95
Note: Zone-level average erosion and accretion rates are reported as arithmetic means computed independently for each coastal segment. No coastline-wide weighted average was calculated due to strong spatial heterogeneity in geomorphology and sediment dynamics. Therefore, the ‘Overall’ values should not be interpreted as representative shoreline-wide rates.
Table 4. Summary of the forecasted shoreline positions in 2036 and 2046 (erosion and accretion).
Coastal ZonesZone I:
Hotel Africa
Zone II:
New Kru Town
Zone III: West PointZone IV: Mambapoint-BTCZone V: BTC-JFKZone VI:
JFK-ELWA
Overall Cumulative Change (m)
Number of transects162 (1–162)106 (172–278)118 (430–548)102 (650–752)187 (753–940)149 (941–1090)1090
Coastline length (Km)2.52.41.52.647.520.5
Average erosion (2025–2036) (m)−20.5−21.8−9.8−5.6−9.08−18.2−85.1
Average accretion (2025–2036) (m)11.612.323.22.41.3050.9
Max erosion (2025–2036) (m)−46.3−47.3−22.2−13.4−23.47−47.2−199.9
Max accretion (2025–2036) (m)26.336.154.66.41.60125.0
Average erosion (2025–2046) (m)−34.4−39.4−10.6−8.1−13.6−29.7−136.2
Average accretion (2025–2046) (m)19.818.539.03.52.0082.8
Max erosion (2025–2046) (m)−70.3−79.1−18.8−19.2−30.6−60.1−278.1
Max accretion (2025–2046) (m)50.240.378.27.22.20177.9
Note: 1. Overall values represent cumulative shoreline displacement across all analyzed transects rather than averaged rates. 2. Transect numbering in this table corresponds to the filtered dataset used for DSAS statistical analysis and therefore differs from the initial transect numbering reported in Table 3.
Disclaimer/Publisher’s Note: The statements, opinions and data contained in all publications are solely those of the individual author(s) and contributor(s) and not of MDPI and/or the editor(s). MDPI and/or the editor(s) disclaim responsibility for any injury to people or property resulting from any ideas, methods, instructions or products referred to in the content.