Article

A Framework for 3D Flood Analysis Using an Open-Source Game Engine and Geospatial Data: A Case Study of the Bozkurt District of Kastamonu, Türkiye

by
Abdulkadir Ozturk
1,
Muhammed Enes Atik
2,
Mehmet Melih Koşucu
3 and
Saziye Ozge Atik
2,*
1
Informatics Institute, Istanbul Technical University, Istanbul 34469, Türkiye
2
Department of Geomatics Engineering, Faculty of Civil Engineering, Istanbul Technical University, Istanbul 34469, Türkiye
3
Hydraulics Laboratory, Department of Civil Engineering, Hydraulics Division, ITU Maslak Campus, Istanbul Technical University, Istanbul 34469, Türkiye
*
Author to whom correspondence should be addressed.
Geomatics 2025, 5(3), 46; https://doi.org/10.3390/geomatics5030046
Submission received: 22 July 2025 / Revised: 4 September 2025 / Accepted: 5 September 2025 / Published: 11 September 2025
(This article belongs to the Special Issue Open-Source Geoinformation Software Tools in Environmental Modelling)

Abstract

Floods are among the most destructive natural disasters and can devastate human life, infrastructure, and mobility in urban areas. It is necessary to develop a simulation model suitable for disaster management to prepare for flooding and facilitate rapid response interventions. The advantage of a three-dimensional (3D) geographic information system (GIS) is that it allows researchers to perform more successful spatial analyses than traditional two-dimensional (2D) systems. In this study, real-time 3D flood simulations were created for the Bozkurt district of Kastamonu, Türkiye, integrating GIS and game engine technologies. Land use land cover (LU/LC) map, digital elevation model (DEM), soil properties and climate data of the study region constitute the input data for the hydrological model. DEM and building footprints are also used to create 3D models of the buildings in the region. Through the Soil and Water Assessment Tool (SWAT) analysis, a hydrological model that included environmental factors such as precipitation, runoff, and soil erosion was created. The average flow rate for the same period, obtained from flow monitoring stations in the Bozkurt district, was 4.64 m3/s, while the flow rate obtained with the SWAT+ model was 4.12 m3/s. Using the flow parameters obtained with SWAT, 3D flood models were developed on Unreal Engine (UE). The flood simulation created with UE and the flood disaster experienced in 2021 in the region were compared on an area basis. The obtained simulation accuracy was 88%.

1. Introduction

“Disasters” are defined as natural or artificial events that seriously disrupt human activities in society or community and general life for a specific amount of time, causing human, economic, material and environmental losses [1]. These events also have a multifaceted impact on large populations in the region in which they occur [2]. Floods are among the biggest climate-related disasters, endangering cities and non-urban areas. The risk of floods is also increased by more intense rainfall and rising sea levels brought on by climate change [3]. Over the past three decades, there has been a significant increase in the prevalence of flood disasters worldwide [4]. Around the world, many people are also at risk from the damaging consequences of floods [5]. Floods caused by heavy rainfall and storms affect millions of people yearly, destroying homes and infrastructure and causing significant damage to economies.
Floods are characterized by the massive flow of large amounts of water from water bodies such as lakes, rivers, and oceans onto dry land [3]. They are among the most destructive natural disasters and can have profound impacts on human life, infrastructure, and mobility in urban areas [6]. Large modern cities are particularly vulnerable to flooding from extreme rainfall, as rapid runoff from concrete and asphalt surfaces easily overcomes rainwater harvesting infrastructure and urban drainage systems [7].
Anthropogenic impacts and land use patterns contribute to the occurrence of flood events, as well as the development of geomorphological features [8]. While natural factors, such as the physical structure of the basins, soil properties, and vegetation cover, determine the conditions of flood formation [9], human impacts, including urbanization, agricultural activities, and deforestation, accelerate this process or make it more destructive [10]. In basins with sloping and impermeable surfaces, surface runoff increases rapidly after rainfall, thereby increasing the risk of flooding [11]. Additionally, soil structure affects water infiltration capacity, which can lead to increased flooding. Surface runoff, particularly in areas with high clay content and impermeable soils, increases, which can lead to flooding. Factors such as changes in land use, urbanization, agricultural activities, and forest degradation are among the primary factors that increase flood risk [10]. Therefore, it is crucial that policies aimed at reducing flood risk be addressed with a basin-based management approach.
Therefore, it is crucial to assess the risk of flooding in an area to provide timely assistance to disaster victims, evacuate residential areas, and protect the city’s critical infrastructure. It is clear that more work on urban flood hazards and risks is needed to manage and mitigate the problem. Flood risk calculations and design criteria are made possible by geographic information systems (GIS). Various hydrological and hydraulic methods are available to assess urban flood risk. To prepare an effective response plan for flooding, it is essential to develop a simulation model tailored to the real environment [12]. Although general risk mapping is performed in most studies in the literature, there are few studies on flood modelling with game engines for instantaneous flood movement [13]. Especially in the response phase of the disaster management system, determining the real-time movement of floods is of vital importance.
The remarkable progress in hardware and software technology over the past few decades has significantly impacted 3D graphics technology. The widespread impact of this technology has again been evident in related industries, including gaming, film, and virtual reality (VR). The advantage of 3D GIS is that it allows researchers to perform spatial analysis with a degree of accuracy that cannot be achieved with a traditional 2D-based system. Especially in the fields of disaster management and meteorology, 3D GIS has significant potential.
The development of flood warning systems within the framework of disaster risk management, along with the use of innovative technologies such as digital twins, game engines, and 3D models for flood modelling studies, has become an interesting topic for researchers in recent years [14,15,16]. However, existing methods fall short in utilizing comprehensive data, accounting for hydrological parameters, and providing a dynamic flood model. The integration of hydrological modelling and game engines offers a promising solution for the dynamic, real-time simulation of flood scenarios. This study aims to create a realistic 3D flood simulation in game engines using hydrological and hydrodynamic parameters.
In this study, the aim was to create real-time flood simulations in the Bozkurt district of Kastamonu, Türkiye by using GIS and game engine technologies. A 3D model of the study area was produced, and a game engine was used to simulate the real-time movement of the flood. Thus, it will be possible to decide on which areas will be flooded at any time. Hydrological water modelling was performed to be suitable for a real flood scenario. It enables the flood risk to be presented visually and disaster planning to be carried out more successfully. The behaviour of flood waters was modelled from the first moment of the flood, and the course of the flood was predicted instantaneously. This study aims to develop a useful model by combining the capabilities of game engines and GIS in disaster preparedness and the measures to be taken. The fact that the simulation to be created uses a 3D model of the region as its base is an essential parameter in creating a realistic model. In this study, a novel contribution is made by calculating the water flow in the simulation using a hydrological model. The developments underlined in this study are as follows:
  • In flood modelling, the SWAT hydrological model was used to calculate river flow parameters in the study area. Thus, the movement of water in the simulation was physically based.
  • The Unreal Engine version 5.1.1 emerges as an advanced tool for disaster modelling thanks to its open-source software, advanced interface and large developer community.
  • Flood events and water movement were modelled in real-time with advanced game engines in a way close to reality.
  • Building data was obtained quickly and accurately for a region, thanks to maps and resources such as Open Street Map (OSM) created due to the crowdsourcing approach.

2. Literature Review

GIS plays a considerable role in flood calculations and water management. It is used to collect, store, analyze, and visualize geographic data. GIS is a valuable tool for identifying flood zones and analyzing watercourses, providing access to geographically precise data. Multi-criteria decision-making methods come to the forefront, especially when data from different sources are used together. Numerous studies utilizing GISfor flood analysis have been conducted in the literature. Amirebrahimi et al. [17] proposed a new data model based on building information models (BIM) and GIS and a new geography markup language (GML) profile. Manual submersion, 3D visualization and evaluation of a 3D model of a building after the flood were carried out. Levy and Liu [18] utilized the Sea Level Rise (SLR) class in conjunction with extended reality (XR) environments for flood risk management, leveraging 3D GIS and Open-Source 3D Graphics Cross-Platform Game Engines. They immersed a reality environment applied to SLR in the island archipelago of Hawaii, additionally showing student engagement at the early-stage and late-stage of California flooding scenarios.
Traditional methods have performed flood analysis based on data and many parameters. In the study published by Li et al. [19], they demonstrated the hazards that high volumes of water in dams could pose in a worst-case scenario through flood modelling. Suquet et al. [20] present an integrated flood risk management system which was designed using digital twin and remote sensing technologies. In a study published by Chen et al. [11], the flood risk assessment of Wuhan City in China was conducted using a multi-criteria analysis model developed with the AHP-Entropy method. Flood risk assessment maps of Nainital Region were created using AHP and GIS tools [21]. In another study, a flood risk assessment was conducted in Limbe City in Cameroon using the weighted sum method [22].
Flood visualization is the process of creating visual representations of flood events using various technologies. Since its inception, flood visualization has evolved significantly from the traditional hand-drawn methods used to develop flood maps by manually drawing flood boundaries on paper maps [23]. Along with GIS, digital flood maps have been developed, allowing flood data to be stored and analyzed in digital format [24]. However, early digital maps were often two-dimensional and could not provide detailed, immersive and interactive experiences [25]. It is beneficial to use 3D models to improve spatial representation and accuracy. Three-dimensional models also enable surface area calculations and multi-directional flow analyses. Three-dimensional modelling provides a closer approximation of real-world phenomena. Three-dimensional models offer a more comprehensive understanding of flood dynamics by accounting for the flow of water through buildings, urban infrastructure, and complex drainage systems [26]. Although physically based and data-driven modelling has enabled 3D analysis of flood data, its use requires specialized expertise [27]. Web-based flood mapping tools that make flood data more accessible to the public often present data in 2D format. State-of-the-art digital visualization tools in flood risk management have been significantly improved in recent years by incorporating advanced techniques such as virtual reality (VR), augmented reality (AR) and digital twin into flood risk management [28]. Sermet and Demir [29] developed a virtual reality model for task-based multi-option game teaching of necessary actions during disasters. The developed approach is a virtual reality framework that utilizes real-time and historical weather, disaster, and geographic data to create a 3D gaming environment for awareness and training on disaster preparedness and response. Skinner [30] created a curiosity-based game about the various effects of river flooding by simulating geomorphology and river flooding. Fujimi and Fujimara [31] presented a study to investigate public behaviour in numerous flash flood evacuation scenarios. Su [32] simulated flood impacts on the affected area and population. Mol et al. [33] created a simulation using a head-mounted imaging device to assess risk perception and reduce negative emotions. In these studies, flood simulations were handled with a limited approach. Yin et al. [14] created realistic digital twins of wetlands using Unreal Engine and prepared a base for flood analysis. The real environment was imported into the game engine using 3D models created using photogrammetric methods. However, the study area is limited, and the hydrological and hydrodynamic parameters used are uncertain. The focus of the study is on creating a digital twin. Demiray et al. [34] developed a web-based, interactive game environment called FloodGame, which includes 3D visuals and models. This platform simulates potential flood risks and is intended for disaster management and educational purposes. A detailed hydrological model was not included in the study. It appears that more studies addressing 3D modelling and hydrological modelling and presenting real-time flood simulation are needed. In studies where flood risk analysis is performed using 3D city models, similar to 2D GIS analyses, only the areas affected by the amount of water at a certain height are determined [35,36]. These studies present a static flood risk analysis rather than a dynamic flood model that incorporates hydrological models.

3. Materials and Methods

3.1. Study Area

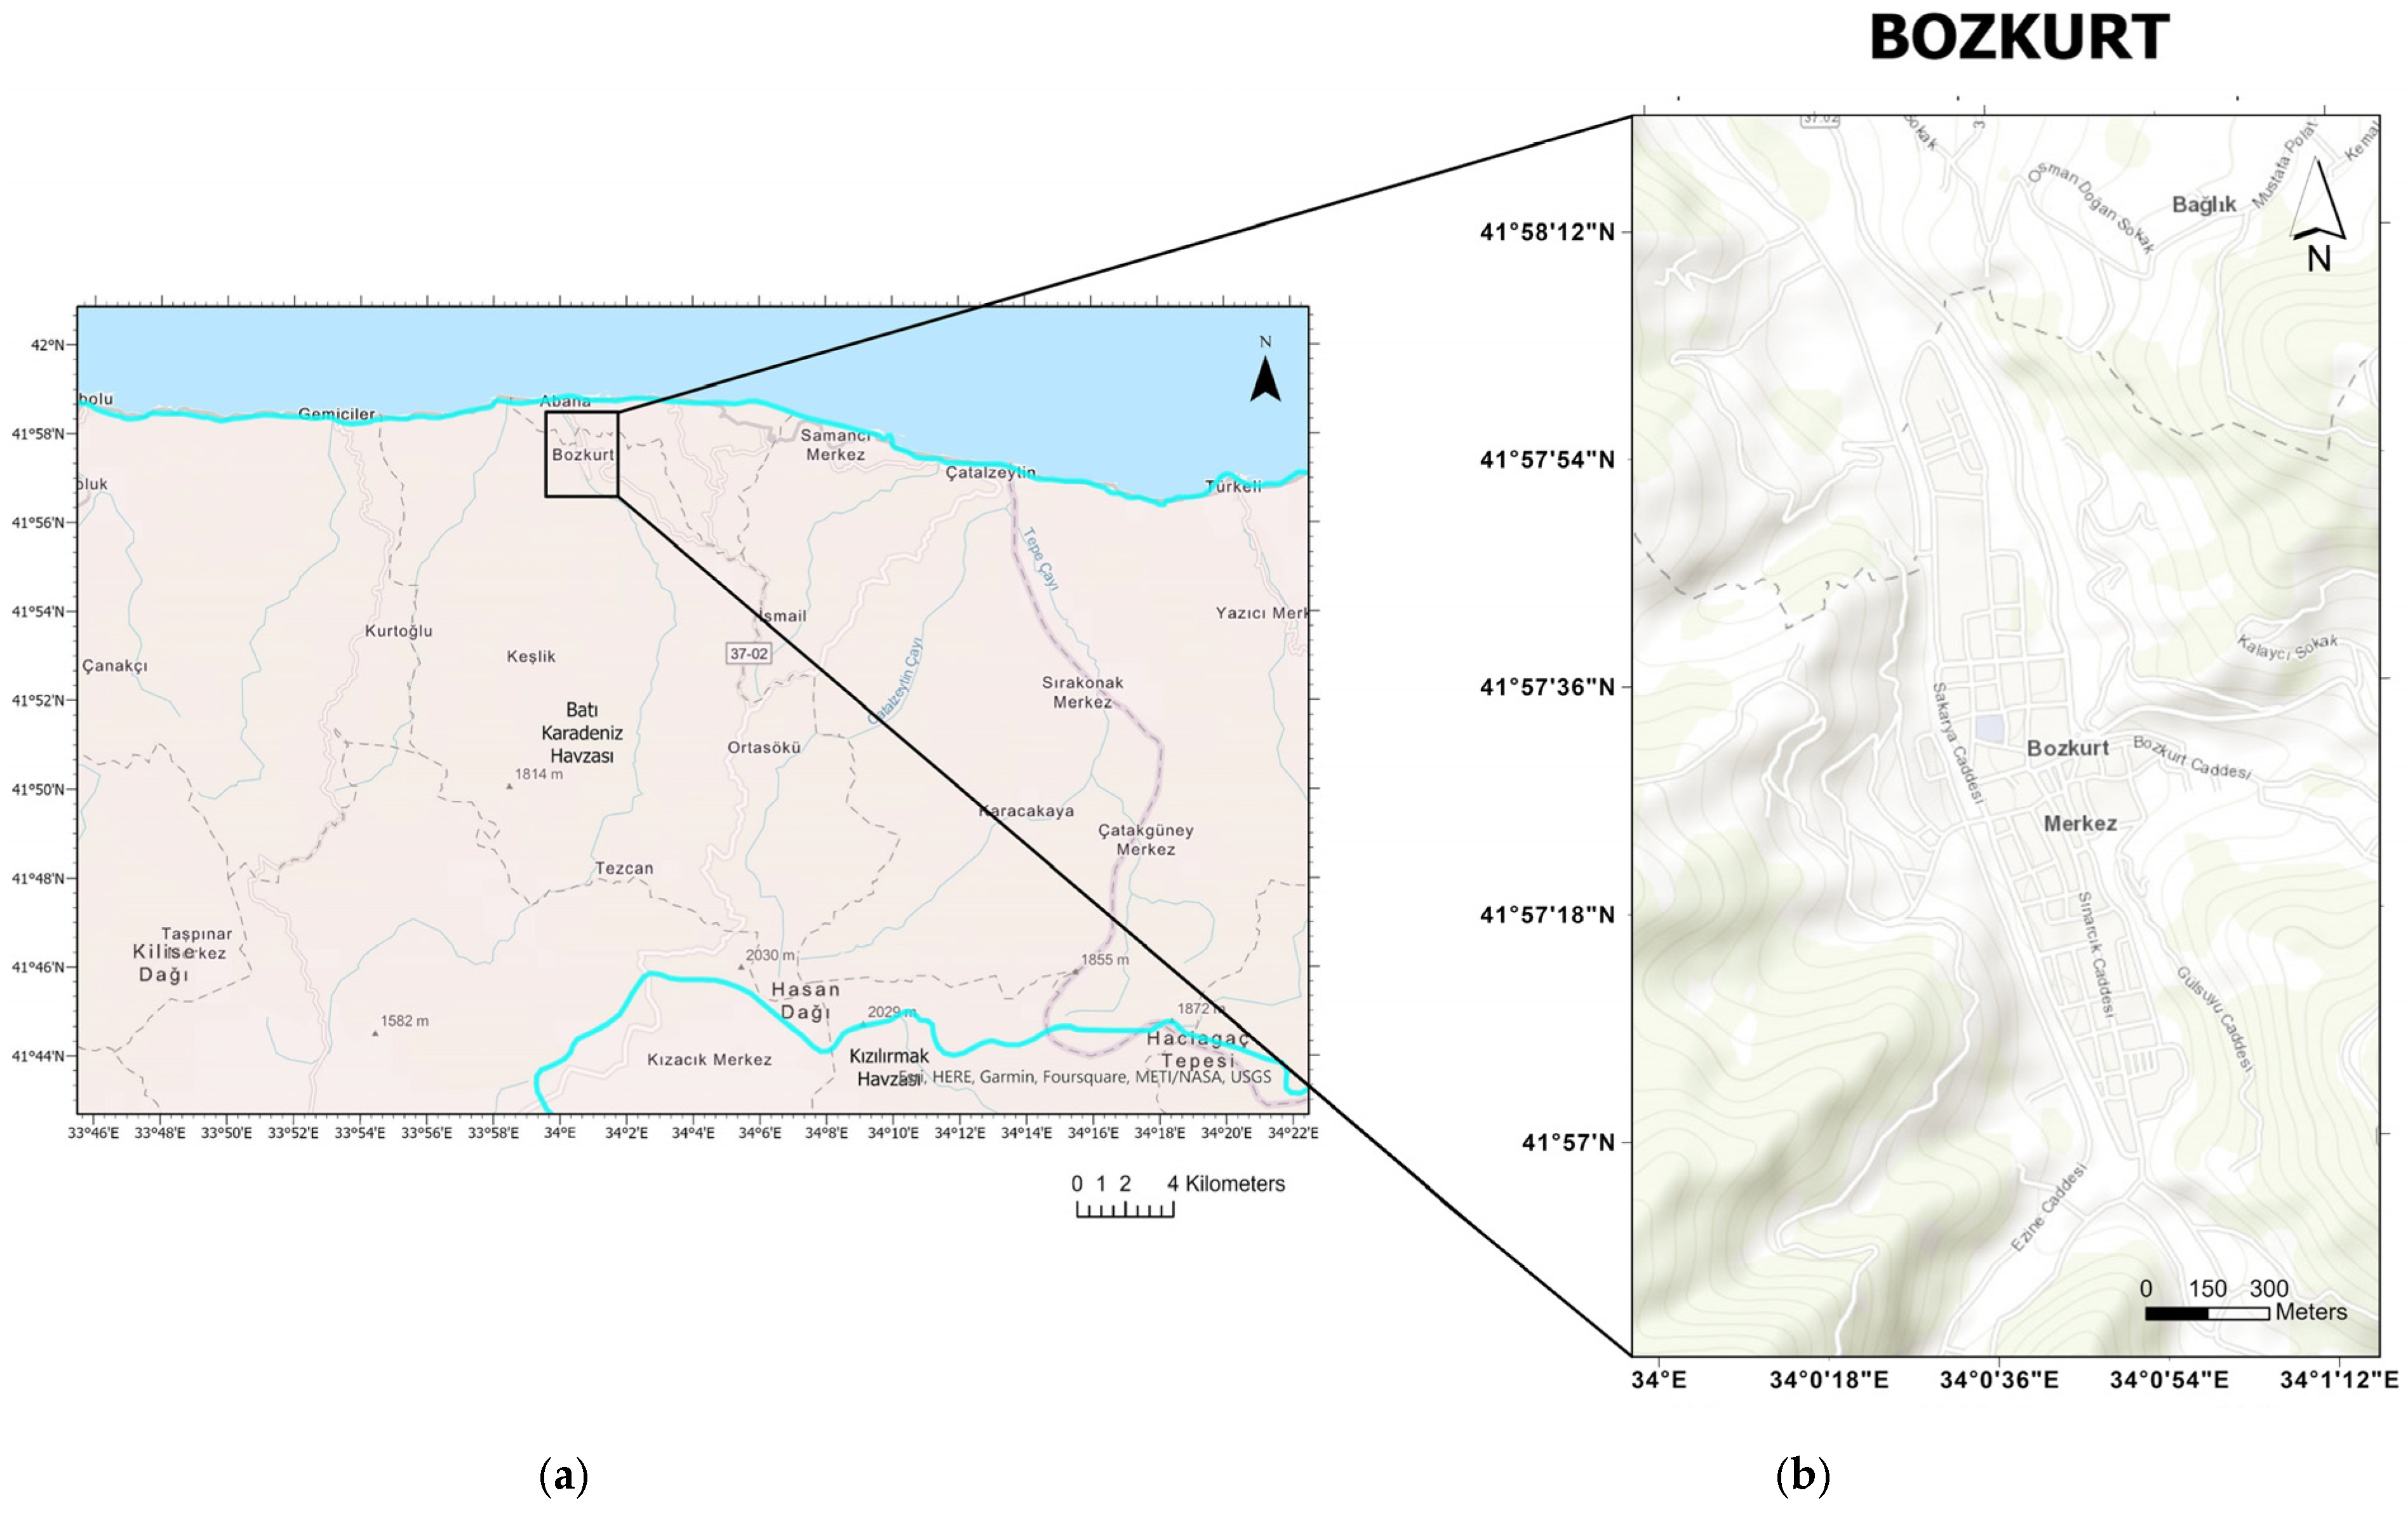
The Bozkurt district of Kastamonu province, Türkiye, which experienced an extreme flood disaster in 2021, was selected as the study area. Bozkurt district is located in the West Black Sea Basin (Figure 1), one of the 25 basins in Turkey. This basin constitutes about 3.7% of Turkey’s surface and has a drainage area of 28,855 km2. The Ezine Stream is surrounded by high-density residential and commercial areas on its east and west shores [37]. Bozkurt district (Figure 2) has a surface area of 296 km2 and is located in the north of the province, on the coast of the Black Sea. The district centre is located in the Ezine Stream valley, 2 km inland from the sea.
The western Black Sea basin has a land structure consisting largely of forested areas. Dense forest cover is dominant in the high parts of the basin. These forests reflect the characteristic vegetation of the Black Sea Region and generally consist of deciduous and coniferous tree species. Forested areas play an essential role in maintaining the ecosystem balance of the basin and regulating the water cycle. Forests reduce surface runoff, allowing water to be absorbed by the soil, thus reducing the risk of flooding. Furthermore, forest cover contributes to the topographic stability of the basin by preventing soil erosion.
The climate of the basin is under the influence of the Black Sea climate and receives abundant rainfall throughout the year. This precipitation is an important factor that increases the risk of flooding [38]. In addition, the geological structure and soil characteristics of the basin also affect the flow of water and groundwater levels. Climatic data for the study area between 2004 and 2024 were requested from the Turkish Meteorological General Directorate. Seasonal normals of Kastamonu province are shown in Table 1.

3.2. Data Used

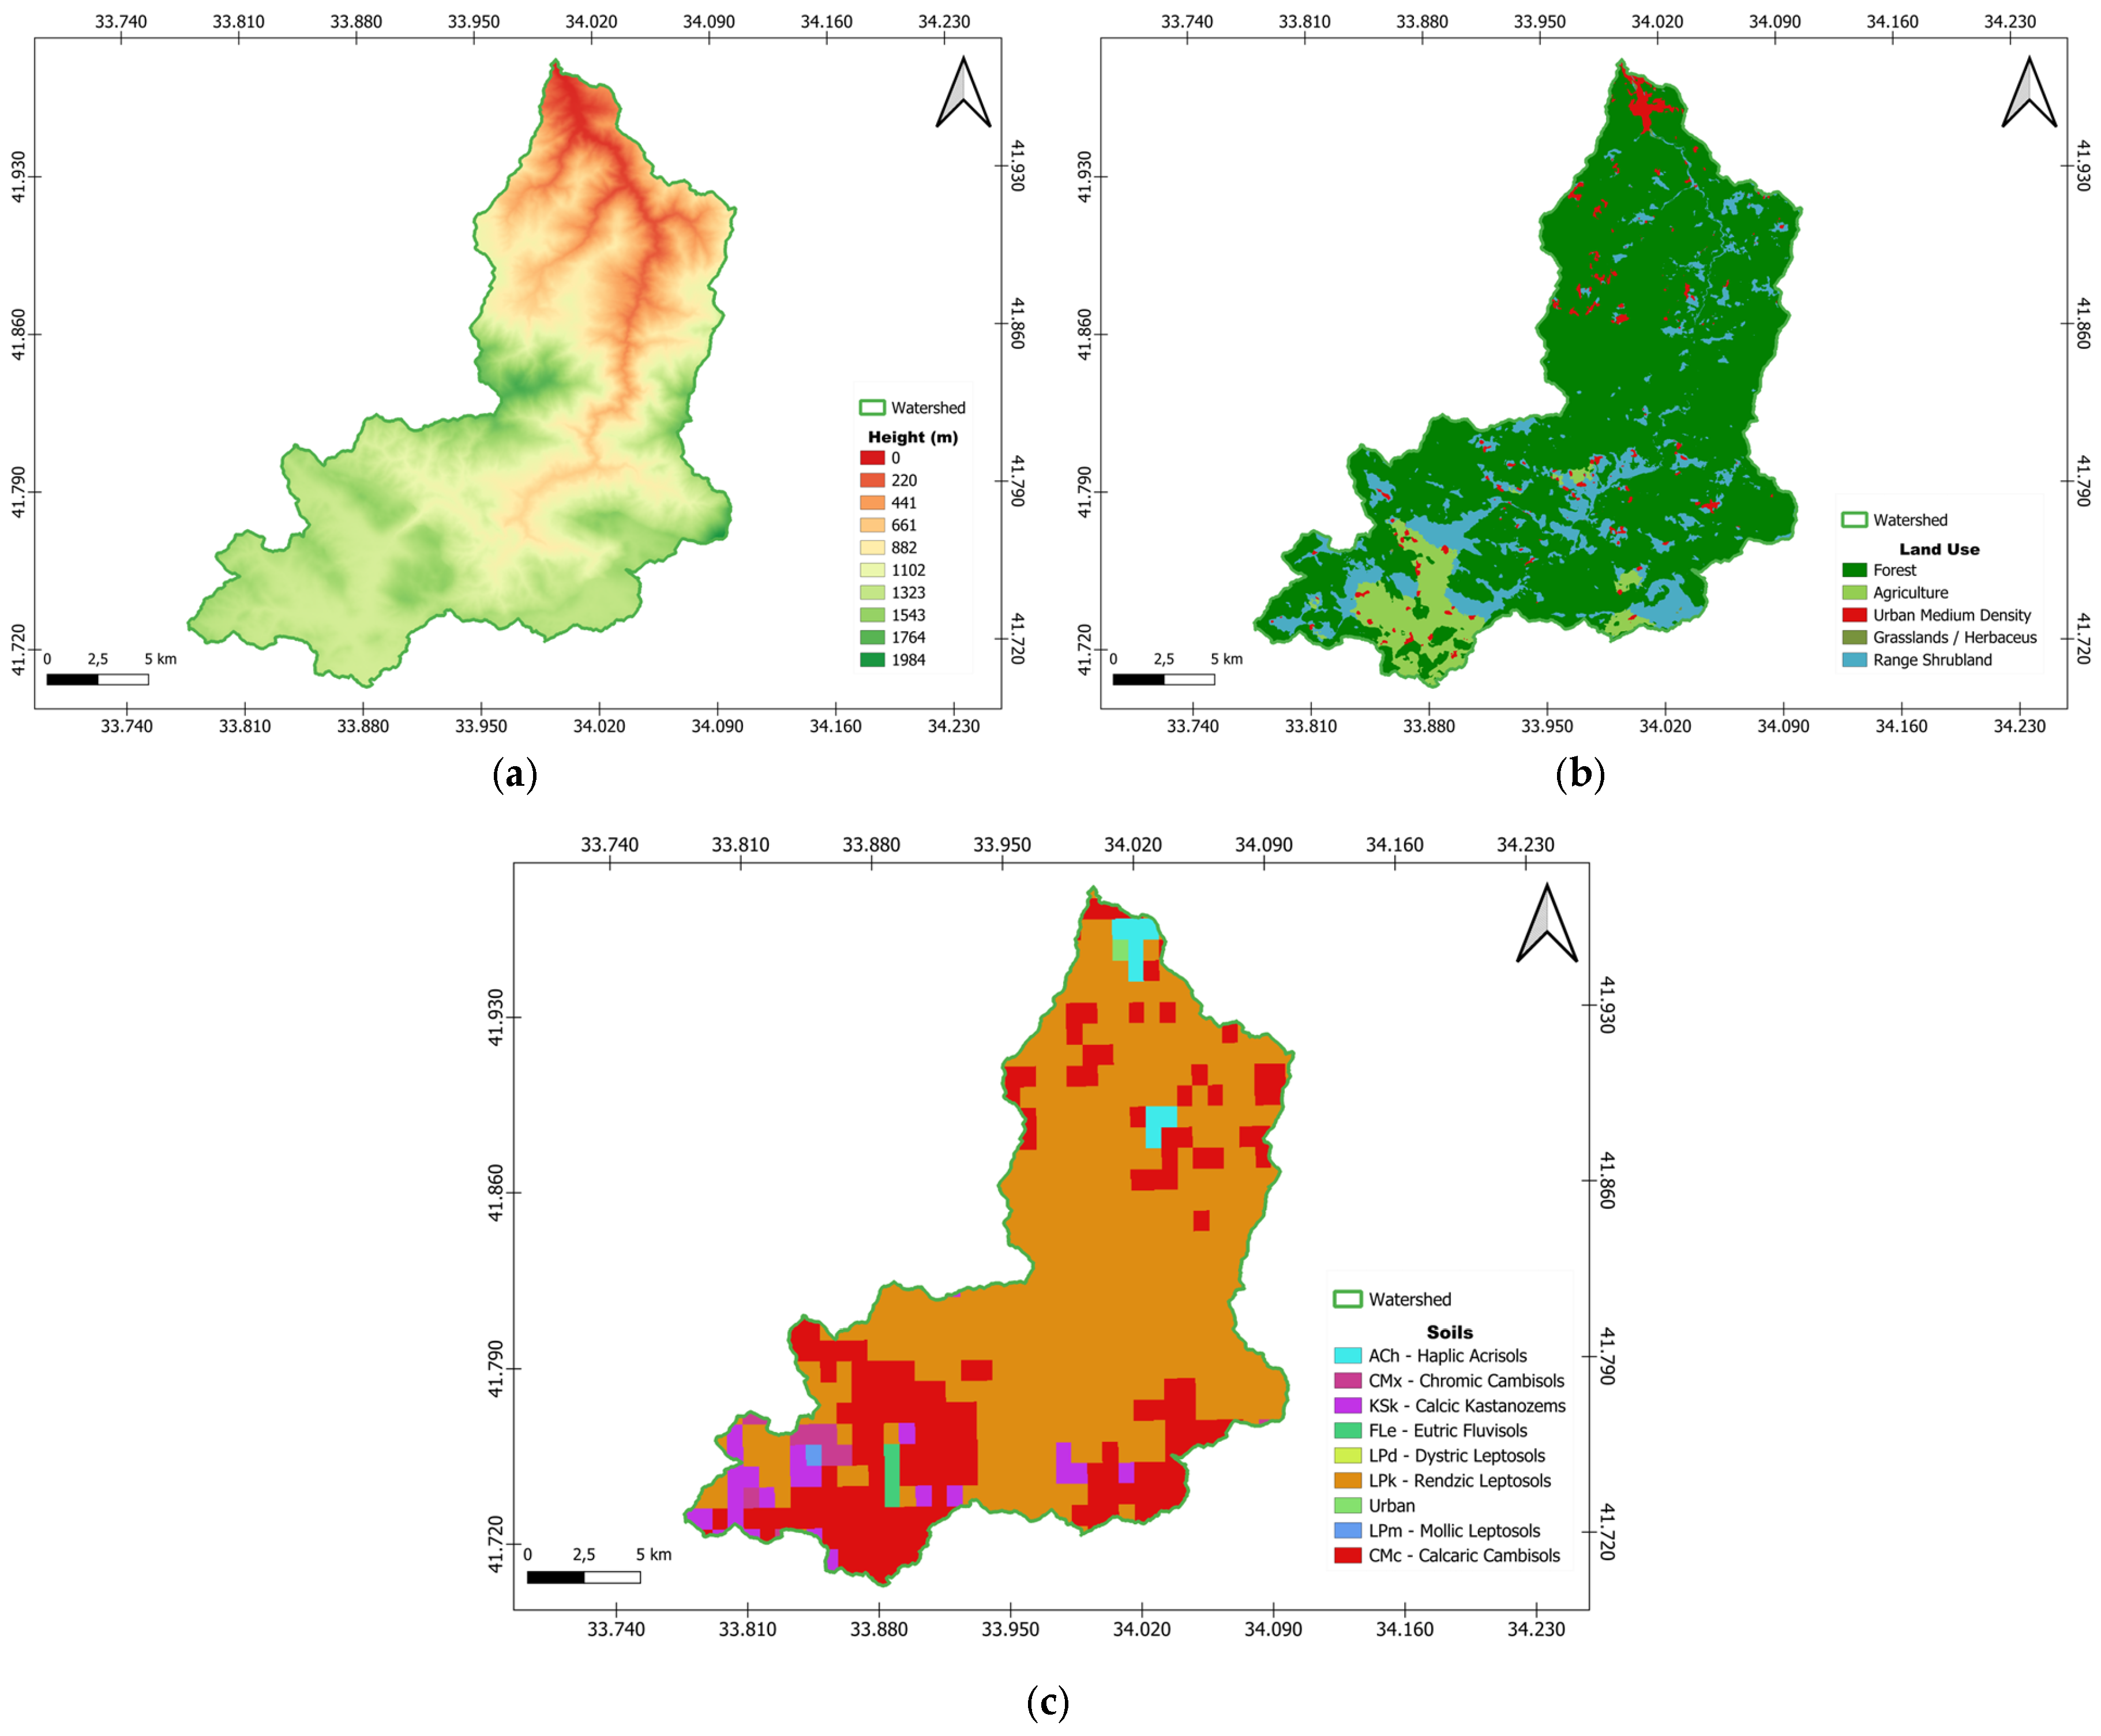
Rainfall, temperature, elevation, land use/land cover, slope, aspect, soil properties and moisture parameters were used for flood risk analysis, similar to previous studies [40]. Rainfall is the most crucial parameter for a flood. The amount of precipitation is the main factor in determining the frequency and severity of floods. Temperature data can change the physical properties of water as well as the evaporation of water, and these changes are effective in determining the total volume of water. Thanks to the digital elevation model (DEM), the flow paths and routes of the water can be determined. ALOS PALSAR data with 12.5 m spatial resolution will be used as a DEM source (Figure 3a). Generally, DEMs with 30 m spatial resolution were used for flood mapping [36,41]. The start and end points of the flood are the most important factors affecting the depth and velocity of the water. The 10 m spatial resolution LU/LC map produced by ESRI was used (Figure 3b). Accuracy analysis was performed using ESRI Land Cover data and Pleiades 1A satellite image covering the Bozkurt district centre and its surroundings. There are four land cover classes in the region. A total of 140 reference points were identified from these land cover classes. Ground truth data from the Pleiades imagery was compared with the ESRI Land Cover classes. The results showed that the overall accuracy of the ESRI Land Cover map was 92.8%. The soil properties parameter gives information on how much water will be absorbed by the soil. This is very low in concretized cities and increases the risk and severity of flooding. On the other hand, lands with trees and suitable soil structures can reduce the flood risk to a great extent. Humidity in the air is effective in precipitation formation. The soil properties map is taken from the Food and Agriculture Organization (FAO) [42]. This map was published in 2023, covering the whole world by combining various sources with a minimum resolution of 1 km (Figure 3c). The soil properties parameter gives information on how much of the water will be absorbed by the soil. This is very low in concretized cities and increases the risk and severity of flooding. On the other hand, lands with trees and suitable soil structure can reduce the flood risk to a great extent. Humidity in the air is effective in precipitation formation. As in previous studies [13], 3D city models are necessary for simulation. The most important component of a 3D model is building footprints [35]. The open-source OSM provides the geometric structure of buildings in the area. This increases the general applicability of the presented methodology. The data used in the study, their sources and resolution/scale information are presented in Table 2.
In the Ezine stream basin, the most common soil type is Lithosol (LPk), which accounts for 62.06% of the soils, and is characterized by stony, thin-profile soils with limited agricultural potential. Calcimorphic clay soils (CMcs) come second at 23.45%; these are more fertile and have high water-holding capacity. These soils tend to swell and crack, which can pose challenges to irrigation management. Other classes (Alluvial child (Ach), Kastanozem (KSk), Calcimorphic soils (CMxs), Fluvisol (FLe), Leptosol–dystric (LPd), Leptosol–calcaric (LPk), Leptosol–mollic (LPm)) are present in smaller amounts but are essential for agricultural and land use at the micro-level. Urban areas (URs) are limited to 0.17% [42]. This distribution indicates a geography dominated by natural rocky areas and mineral-rich soils, with low settlement impact.
The soil parameters used in the SWAT+ model and their descriptions are represented in Table 3. These parameters are used to describe the physical and chemical properties of the soil components of the SWAT+ model. Each parameter is critical in modelling soil water balance, erosion, plant water consumption and other hydrological processes. Among these, available water capacity, saturated hydraulic conductivity, and USLE erosion coefficient were calculated separately as they are not included in the table of properties given by FAO. Available water capacity and saturated hydraulic conductivity were calculated using the soil water characteristics tool in the ‘SPAW Hydrology’ software version 6.0 prepared by the United States Department of Agriculture.
The soil erosion coefficient was estimated using Equations (1) and (2), developed by Wischmeier and Smith [29] and revised by Renard et al. [30] to improve its accuracy and applicability in different climatic regions.
M = S i l t × 100 C l a y
K = 2.1 × M 1.14 × 10 4 × 12 a + 3.25 × b 2 + 2.5 × c 3 100
where M is the particle size parameter. S i l t is the percentage of silt (%) and very fine sand (0.1 to 0.05 mm). C l a y refers to the percentage of clay. a represents the percentage of organic content. b refers to the soil structure code used in soil classification. c is the profile permeability class.

3.3. Soil and Water Assessment Tool (SWAT)

Hydrological parameters are also needed to simulate flooding with UE. SWAT [43] was a basin-based hydrological model that simulated agriculture and water quality processes. SWAT, developed by the United States Department of Agriculture (USDA) in the 1990s, has the capacity to conduct long-term hydrological analyses in large-scale watersheds. The SWAT+ and LULC model setup allows for a more accurate representation of hydrological processes and a more detailed understanding and monitoring of the water cycle. Based on open-source satellite data, the SWAT+ model stands out as an essential tool for finding water balance parameters of ungauged basins [44].
The SWAT is a hydrological model specifically developed to estimate hydrological conditions, calculate past and present discharge and predict future conditions. The special feature of this model is the ability to calculate the basin boundaries and the water balance within the basin boundaries. It can divide the whole area into sub-basins and create the river route based on the user’s needs generated from each sub-basin’s DEM. This allows the user to know the discharge in each sub-basin, which significantly benefits spatial data analysis on discharge from regional basins. Regarding data calculation, the SWAT model considers hydrological processes, mainly using the water balance Equation (3) [45].
S W t = S W 0 + i = 1 t R d a y Q s u r f E a W s e e p Q q w
where i is the elapsed day, S W t is the final soil water content (mm), S W 0 is the initial soil water content (mm), t is the time (day), R d a y is the precipitation on the day i (mm), Q s u r f is the surface water content on day i (mm), E a is the evapotranspiration rate on day i (mm), W s e e p is the groundwater content on day i (mm) and Q q w is the groundwater return to discharge on day i (mm).
The separation of sub-basins in the SWAT model is a step used to divide a region into smaller sub-basins and to evaluate the hydrological processes of each sub-basin separately. This process is performed based on the topography and DEM of the catchment. Return period is a concept that helps to estimate how often a given discharge or flood will be exceeded over a given period. In this step, the return period of a given discharge level is calculated using historical discharge data and probability distributions. This calculation helps to determine how often a given design discharge will be exceeded and under what conditions it may occur. This step is critical for predicting floods and developing flood management strategies. Sub-catchment discharges from different return periods will be converted into a shapefile and added to the QGIS software version 3.34. The severity levels of floods will be classified into different ranges based on the maximum discharge and coloured accordingly on the map. The obtained maps and tables are used with UE.

3.4. Unreal Engine

3D representations of the world in games were used to provide plausible scenes. However, further developments in computer game engines have enabled developers to use them as a multi-platform for creating interactive visualizations. Recent studies show the use of game engines to visualize geographic data for many applications, such as building information modelling and archeology. The fact that game engines support various 3D data formats also allows the use of various topographic data. This potential can be utilized for crisis management [46] and interactive geographic design as high user interaction with large-scale topographic databases derived from different data sources.
Unreal Engine is an open-source game engine developed for 25 years. It contains advanced world, animation, character, physics and object creation tools that are related to what should be in a game. It also offers the user the opportunity to develop due to its C++ programming language support. The engine, which has become a standard in the game industry, is now being used in various fields.
The physics-based fluid simulation capabilities of Unreal Engine are particularly relevant for hydrological modelling applications. The engine incorporates computational fluid dynamics principles based on the Navier–Stokes equations, which govern the motion of viscous fluid substances The Navier–Stokes equations, which express the conservation of momentum in fluids, can be described as follows Equation (4):
u t +   u   ·     u =   p ρ +   ν   2 u + f
where u represents the velocity field (m/s), p is pressure (N/m2), ρ is fluid’s specific mass, ν is kinematic viscosity (m2/s), and f represents external accelerations such as gravity (m/s2). In Unreal Engine, fluid simulation is accomplished by solving the Navier–Stokes equations employing particle- and grid-based methods. Also, properties like turbulence and surface tension have a substantial impact on how fluid behaviour is indicated correctly.
The engine’s Niagara VFX system provides the computational framework to execute these physics-based simulations in real-time applications. Contemporary gaming engines, like as Unreal Engine, employ advanced numerical methods, including finite differences and cell-based particle techniques, to effectively resolve the discretized Navier–Stokes equations on GPU architectures. This computational framework facilitates the simulation of intricate fluid interactions with stiff limits, crucial for precise flood modelling in urban settings where water must accurately engage with structures, terrain, and infrastructure.
Unreal Engine works in accordance with the Niagara Operating Logic. Niagara VFX 4 [47] consists of basic structure; Systems, Emitters, Modules and Parameters. There are emitters within a Niagara System, modules within the emitter, and each component within this structure has its own parameters. Emitters are Unreal Engine actors that create meshes or particles with the desired properties in the designed world. An emitter has six basic elements. (1) Emitter Spawn: Determines the properties of the emitter when it is first created and what needs to be accomplished. (2) Emitter Update: It can be reconfigured for a specific period of time or triggered by events. (3) Particle Spawn: Determines the properties of the mesh or particle when it is first created, such as size, colour, position. (4) Particle Update: Here the behaviour of the created parts is controlled. When it hits something, when it is exposed to a force. (5) Event Handler: You can control reactions to specific events. (6) Render: It is the place where it is determined how the created particle or solid models will look.
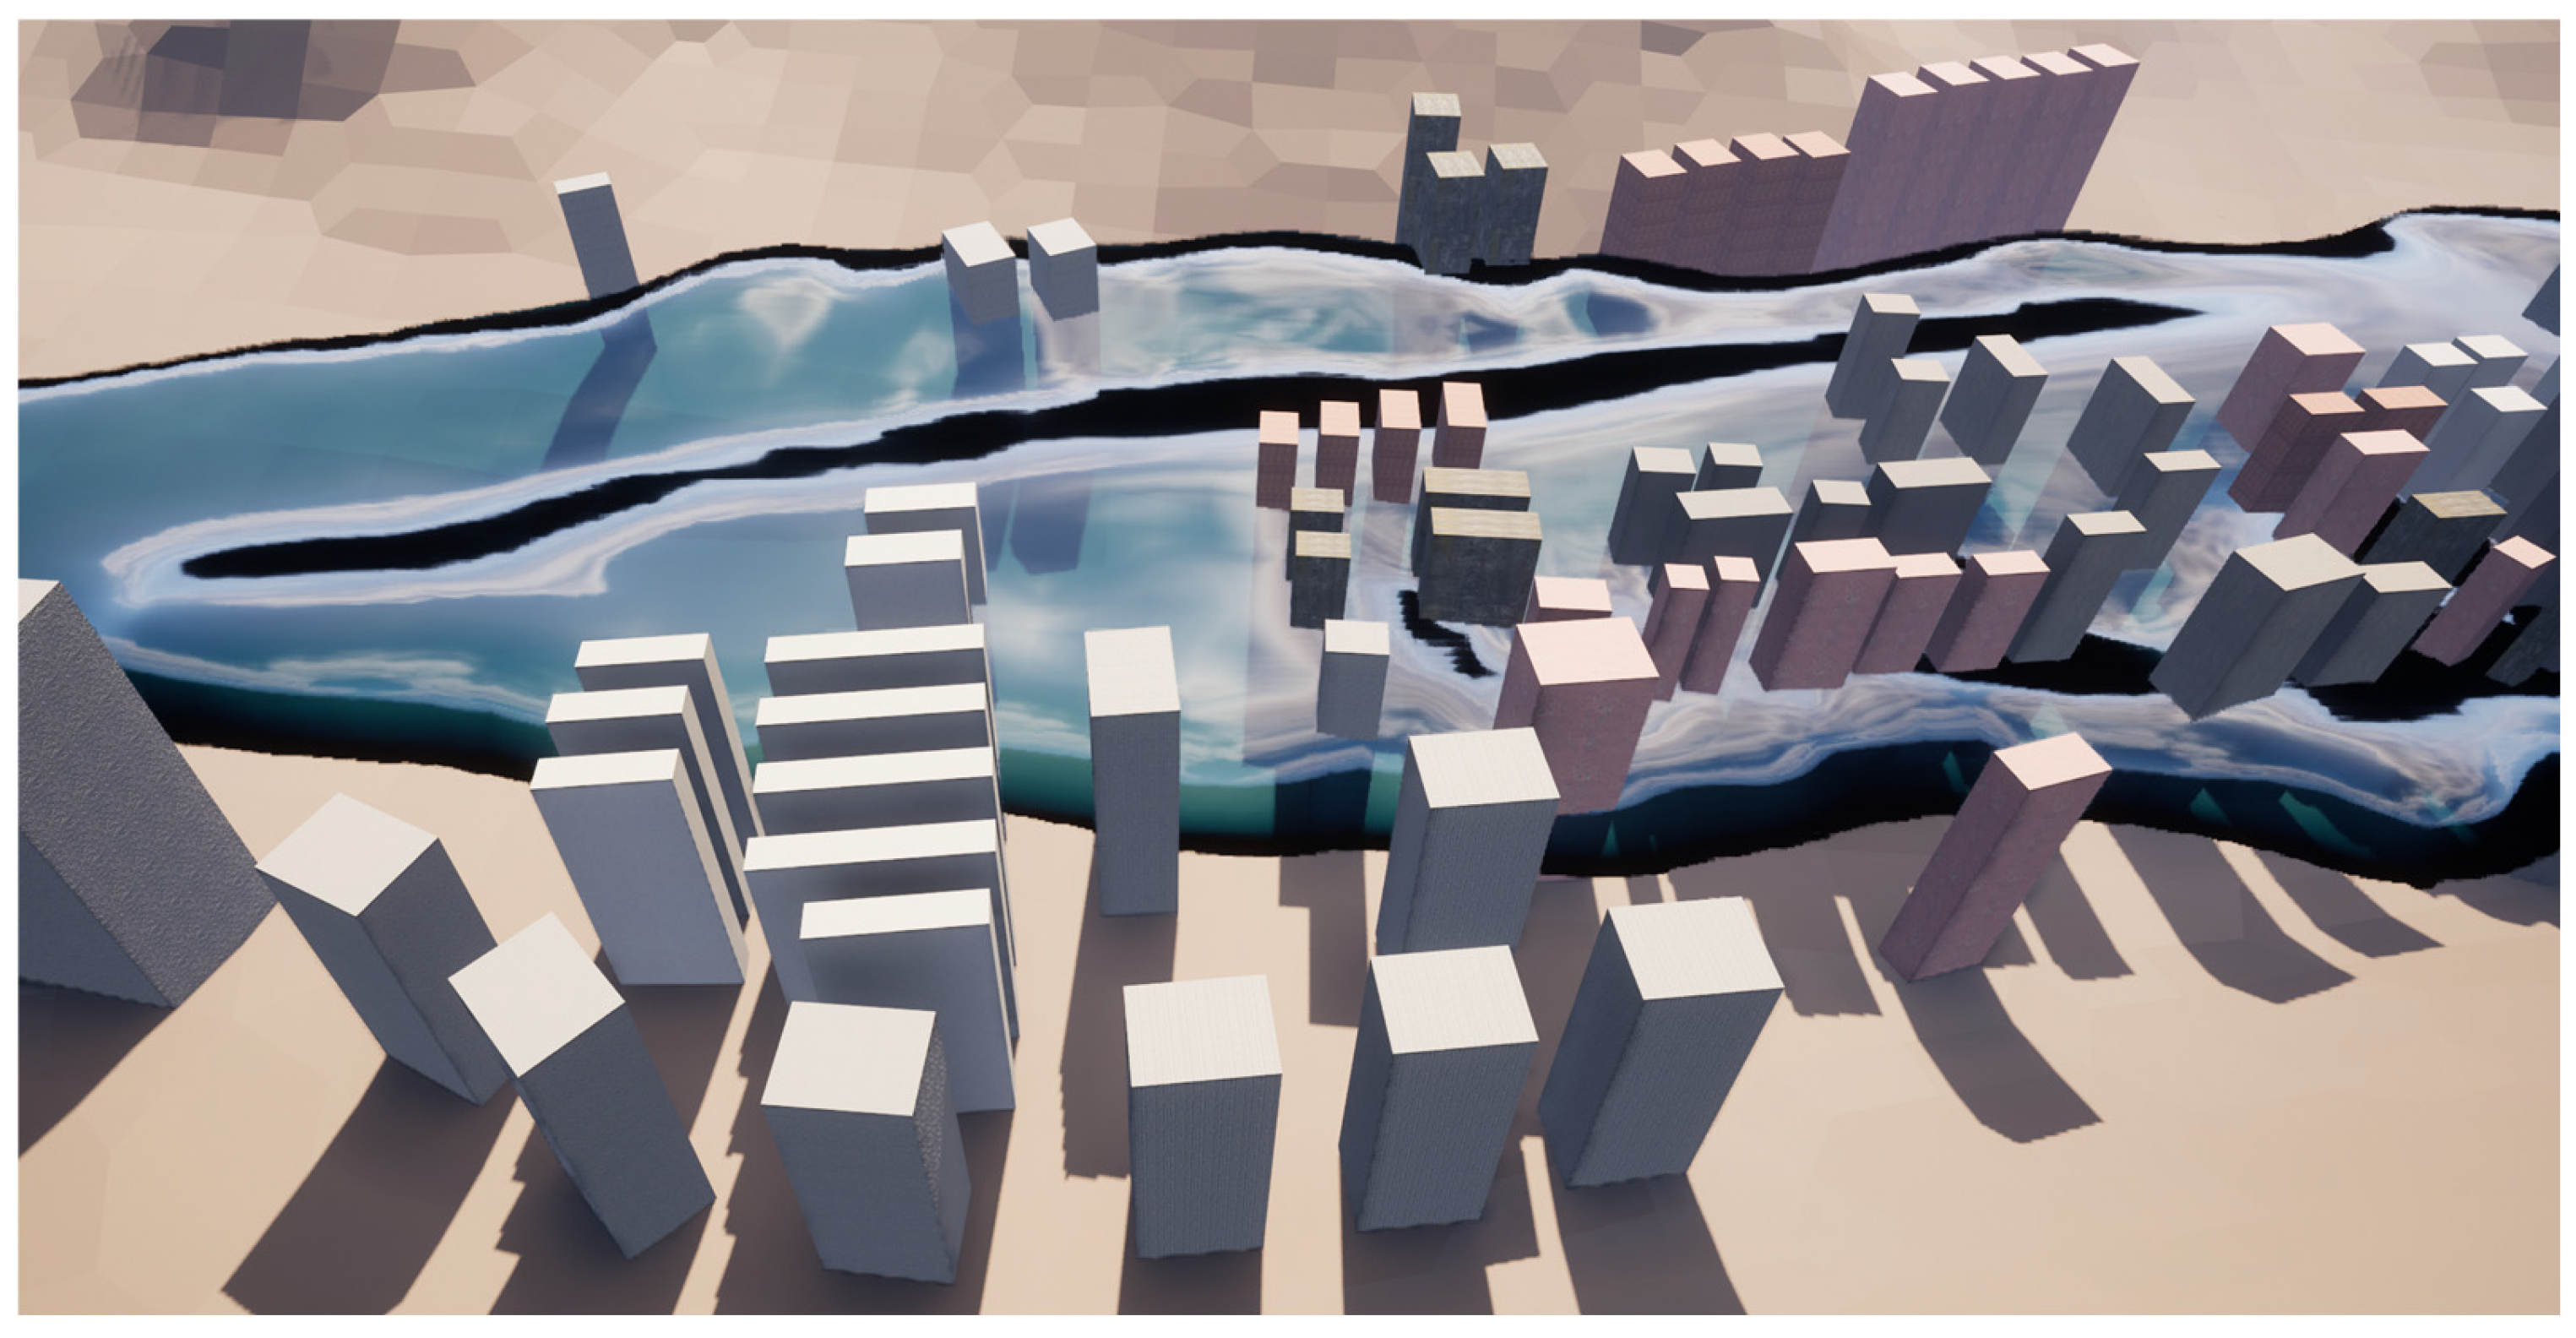
In this study, since a fluid-based structure is used, a solid model-generating emitter was designed. The amount of fluid and the relationship of the generated workspace model with other objects were regulated. In the last step, a realistically rendered water imagewas given to the fluid. The results of the SWAT hydrological modelling were used to ensure accuracy in the structure and propagation of the solid model to be produced in these steps. The workflow in Unreal Engine is presented in Figure 4.
In order to produce a 3D model in Unreal Engine, firstly, the DEM file obtained from ALOS PALSAR was imported into Unreal Engine as bare terrain. For this, the UE Landscaping plugin developed by Ludic Drive [48] was used. The mountainous region outside the city centre were created appropriately with procedural rendering tools available in Unreal Engine. These procedural methods enable realistic and diverse vegetation rendering within the project environment. Thus, it is possible to create a unique and impressive environment for each area. Buildings were rendered using the UE StreetMap plugin using OSM Buildings data.

4. Simulation Details

4.1. SWAT Hydrological Modelling

The data of the SWAT+ model was processed with the QSWAT plugin version 3.0.3 of QGIS. QSWAT has a three-step preparation process to ensure the model is ready for operation. Firstly, the geographical boundaries of the catchment and water flow routes are determined by specifying the DEM data and the water outlet point. Secondly, LU/LC and soil properties maps were added to hydrological model. Then, QSWAT creates the hydrological response units (HRUs) regions. Lastly, the SWAT Editor was run by importing the climate data.
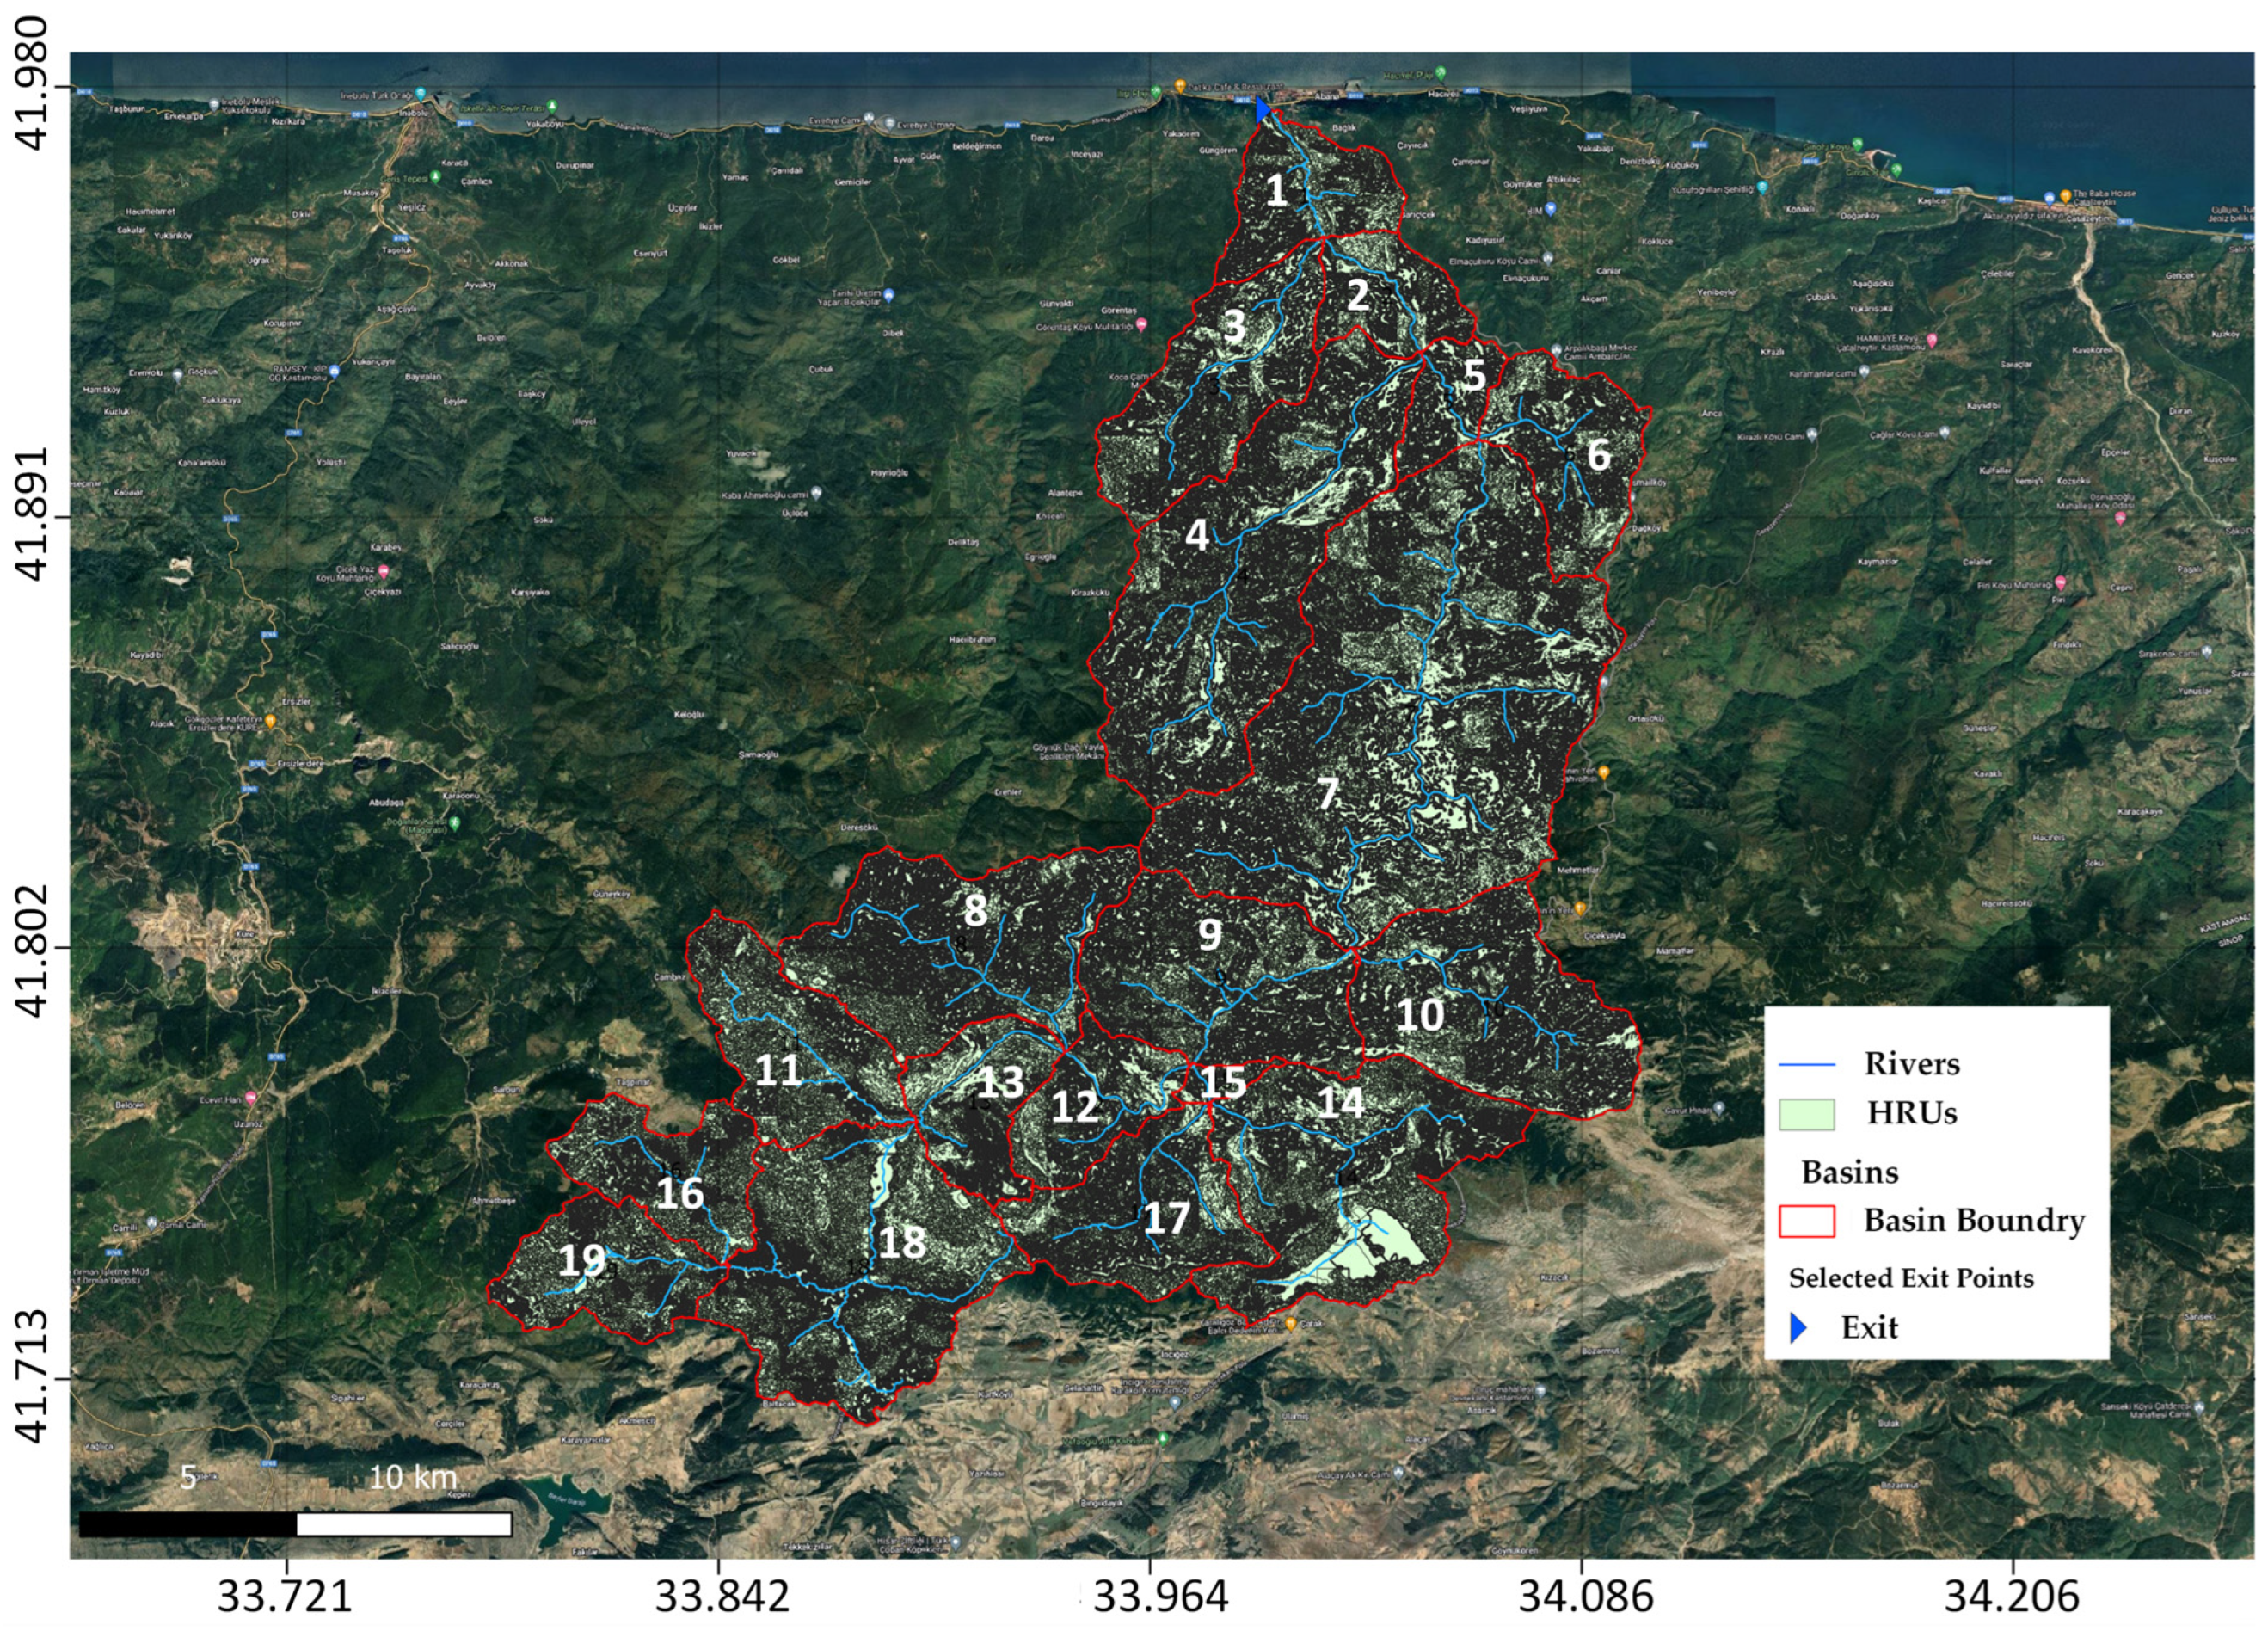
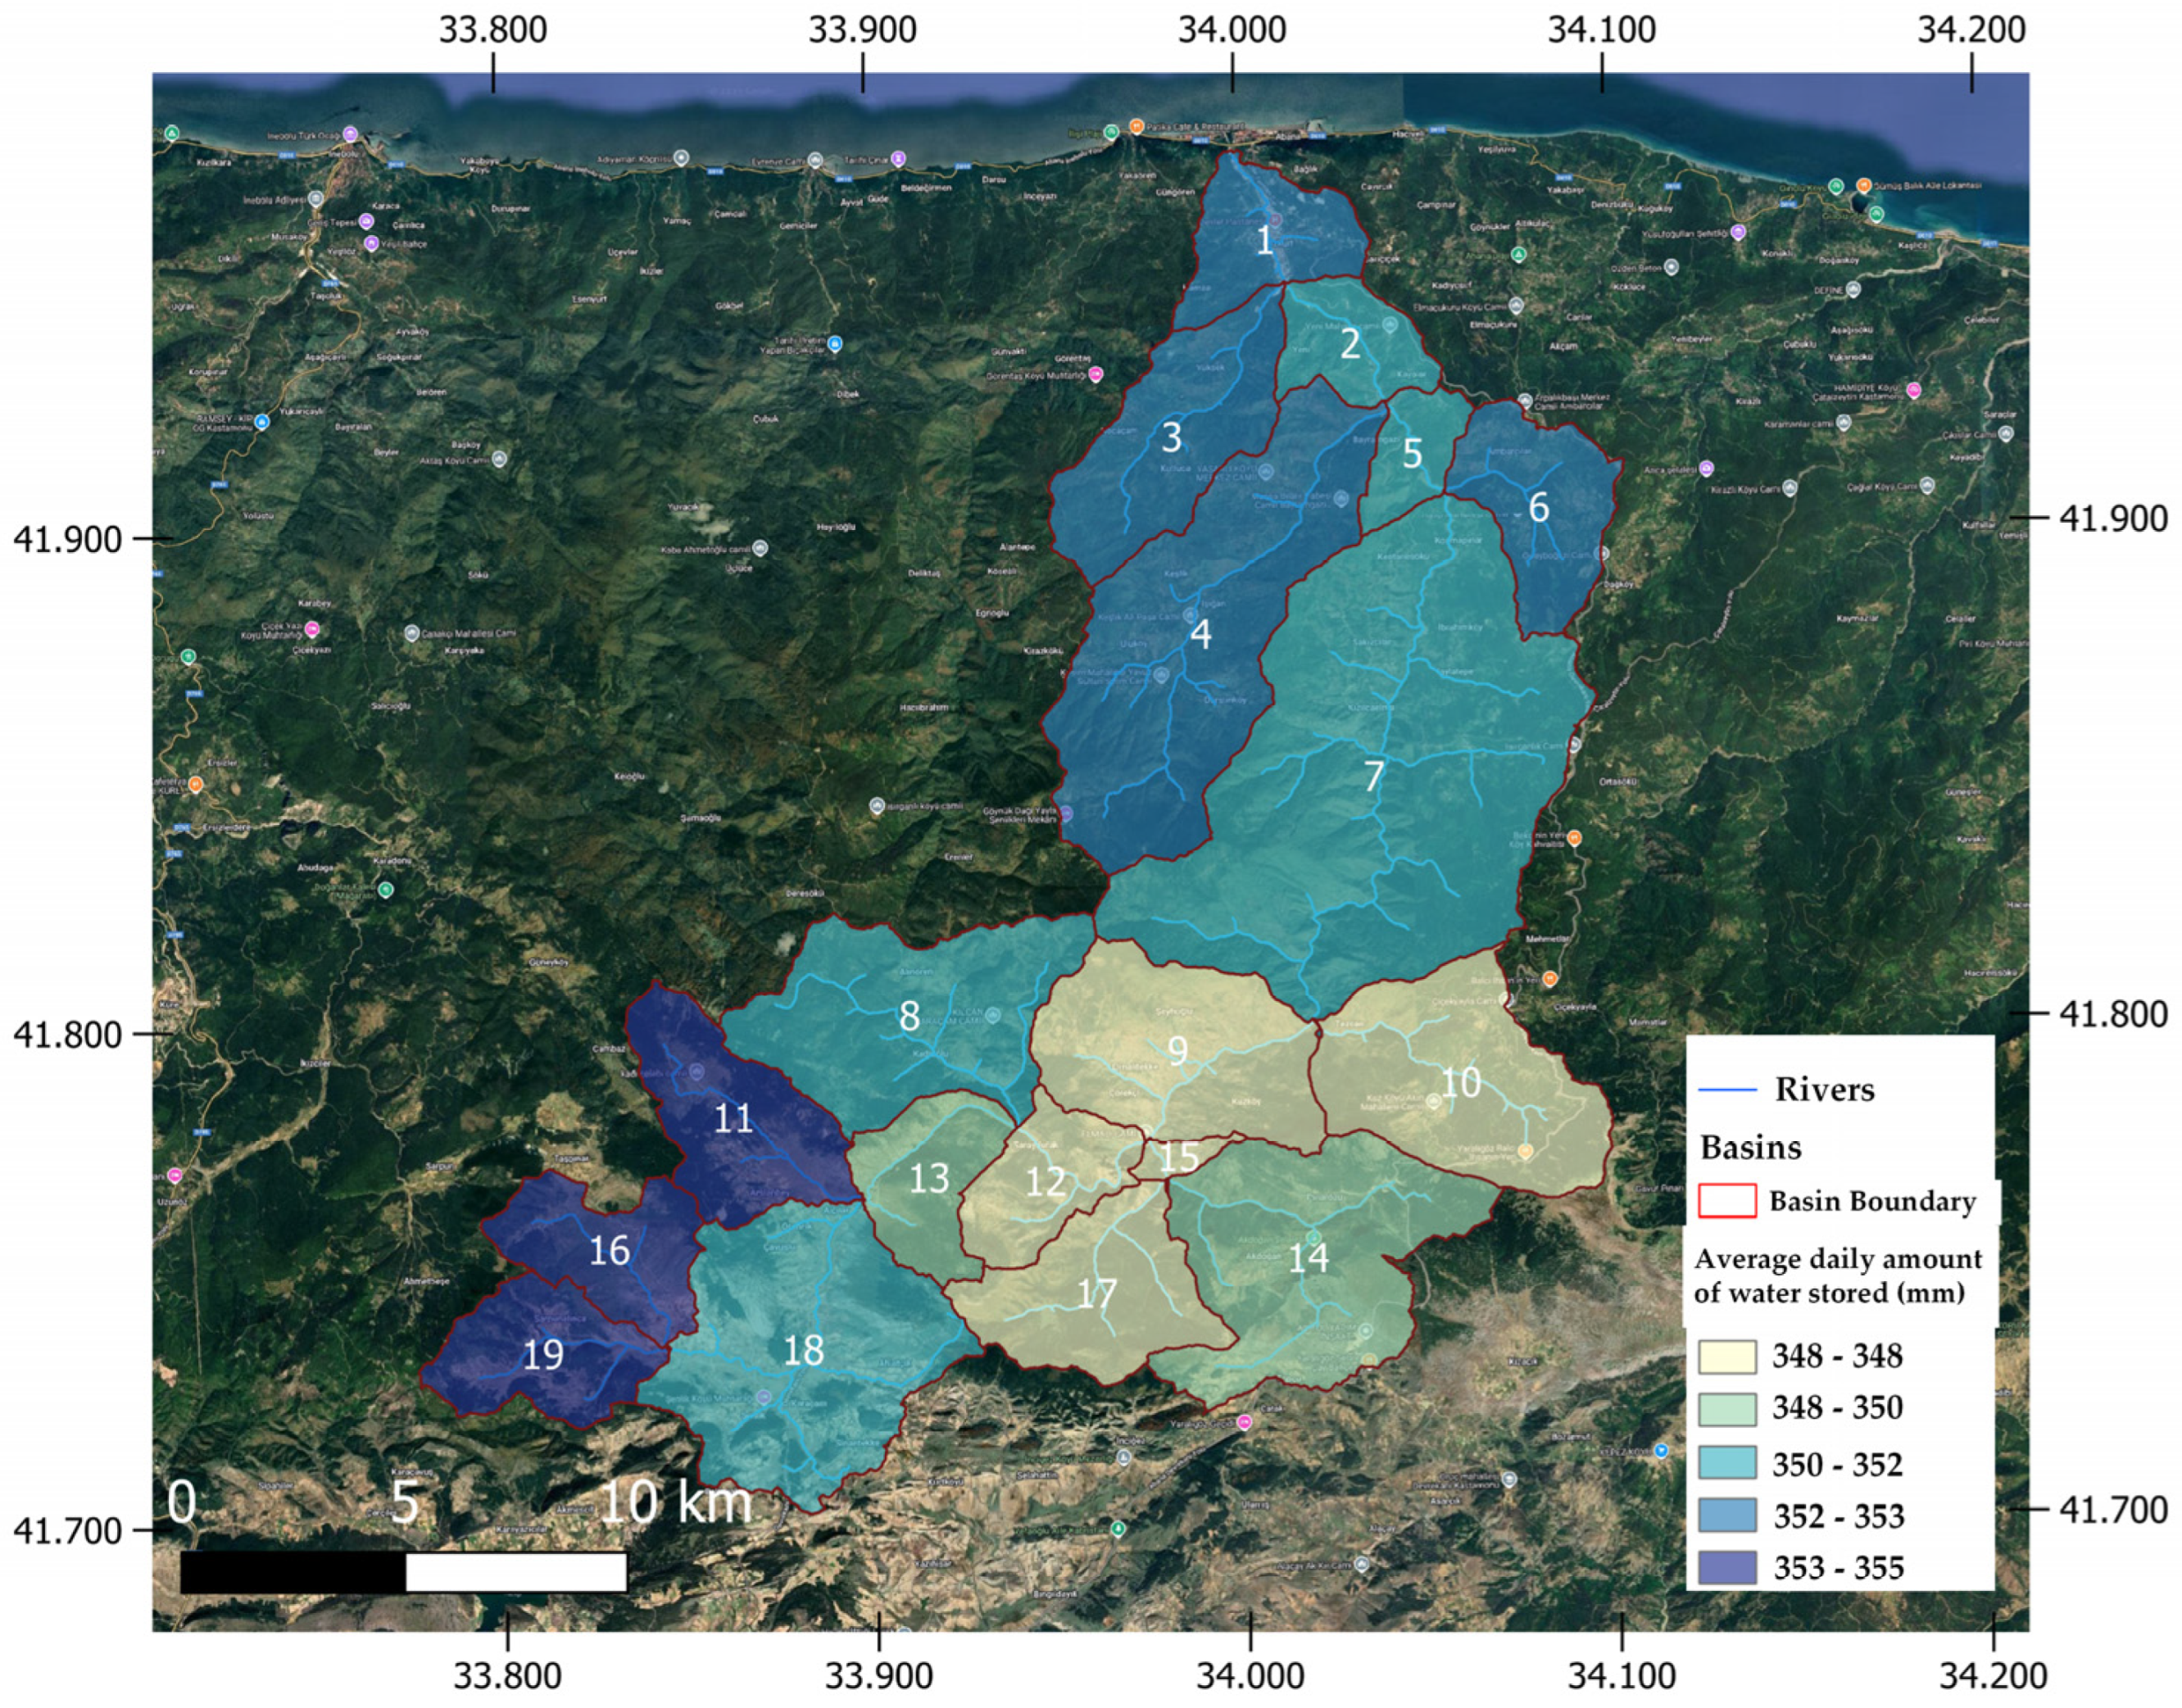
After the basin boundaries were determined using DEM data, basins, sub-basins and waterways. Thus, 19 sub-basins and 89 waterways were formed. HRUs are calculation areas produced by combining land use and soil properties. As a result of this calculation, 4301 HRUs were formed. The study area where the simulation was created is located in the 1st sub-basin (Figure 5).
Climate data were transferred into the model in two parts: seasonal normals and raw data. Seasonal normals are used to estimate missing data in the SWAT model and increase its accuracy. The most important parameters to be used in the study are the water balance in rivers and basins. These have been calculated on a daily, monthly, and annual basis. The parameters of the SWAT+ model are defined according to the standard SWAT+ database, which assigns values according to the soil, land use, topography and climate characteristics of the basin. The parameter ranges given in the model were used to represent the physical conditions of the basin. Additionally, parameters used in the database, such as climate, soil, and land use, were obtained from reliable sources and subjected to accuracy analysis. When the resulting flow and water balance values were input into Unreal Engine, the simulation results were then analyzed to verify the appropriateness of the parameter selections. This minimized potential bias resulting from parameter selection.

4.2. Unreal Engine Simulation

The Zibra Liquids plugin version 1.4 was used to make fluid modelling in UE more detailed and optimized. This plugin is an artificial intelligence-supported real-time fluid simulation plugin developed by Zibra.AI.
Due to Zibra Liquids’ artificial intelligence-supported collision (‘collusion’) meshing feature, it can create the exoskeleton of complex objects more accurately. At this stage, the limits within the UE and the plug-in should be considered. There is both a maximum particle limit that can be created on the UE side and a limit in terms of the mesh size that the artificial intelligence can analyze. These are set by the developers to achieve a stable simulation and minimum performance. These limits vary according to the features of the computer and application versions. The computer used has a processor with 6 cores and 12 logical cores that can reach a speed of 4.3 GHz, 64 GB RAM, and an RTX 3060 graphics card with 12 GB Video RAM from NVIDIA. Unreal Engine version 5.1.1 was used.
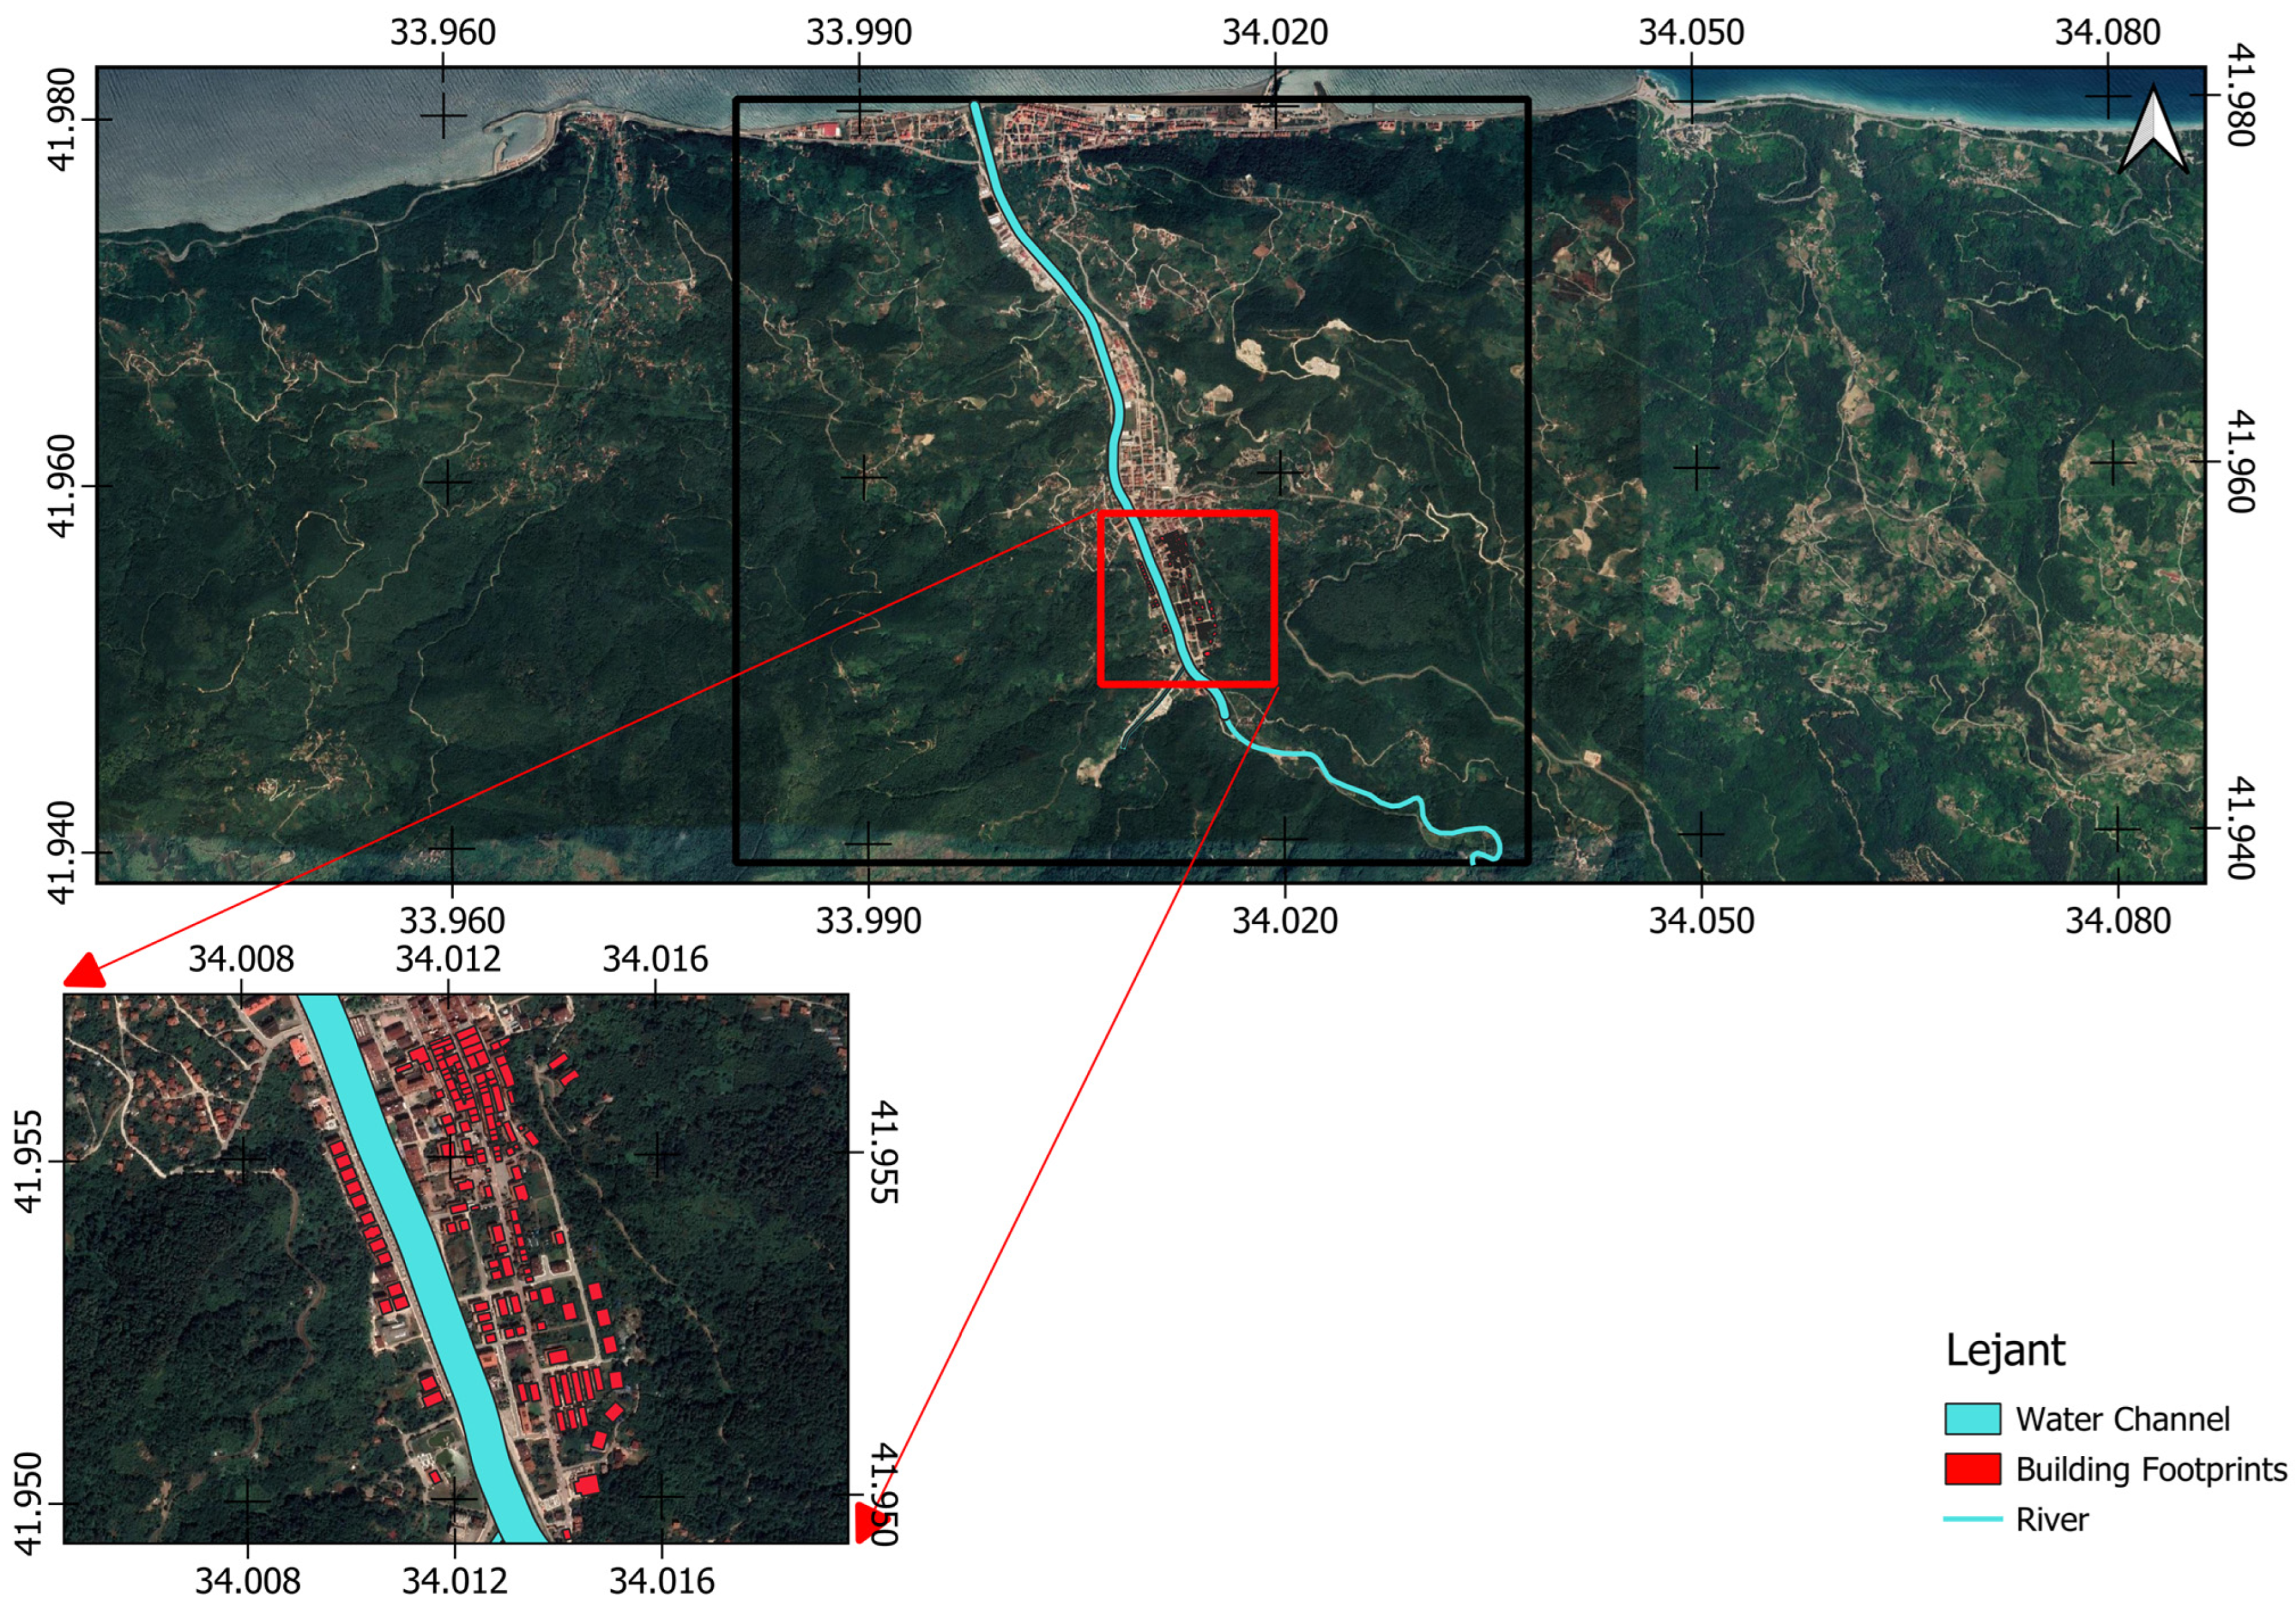
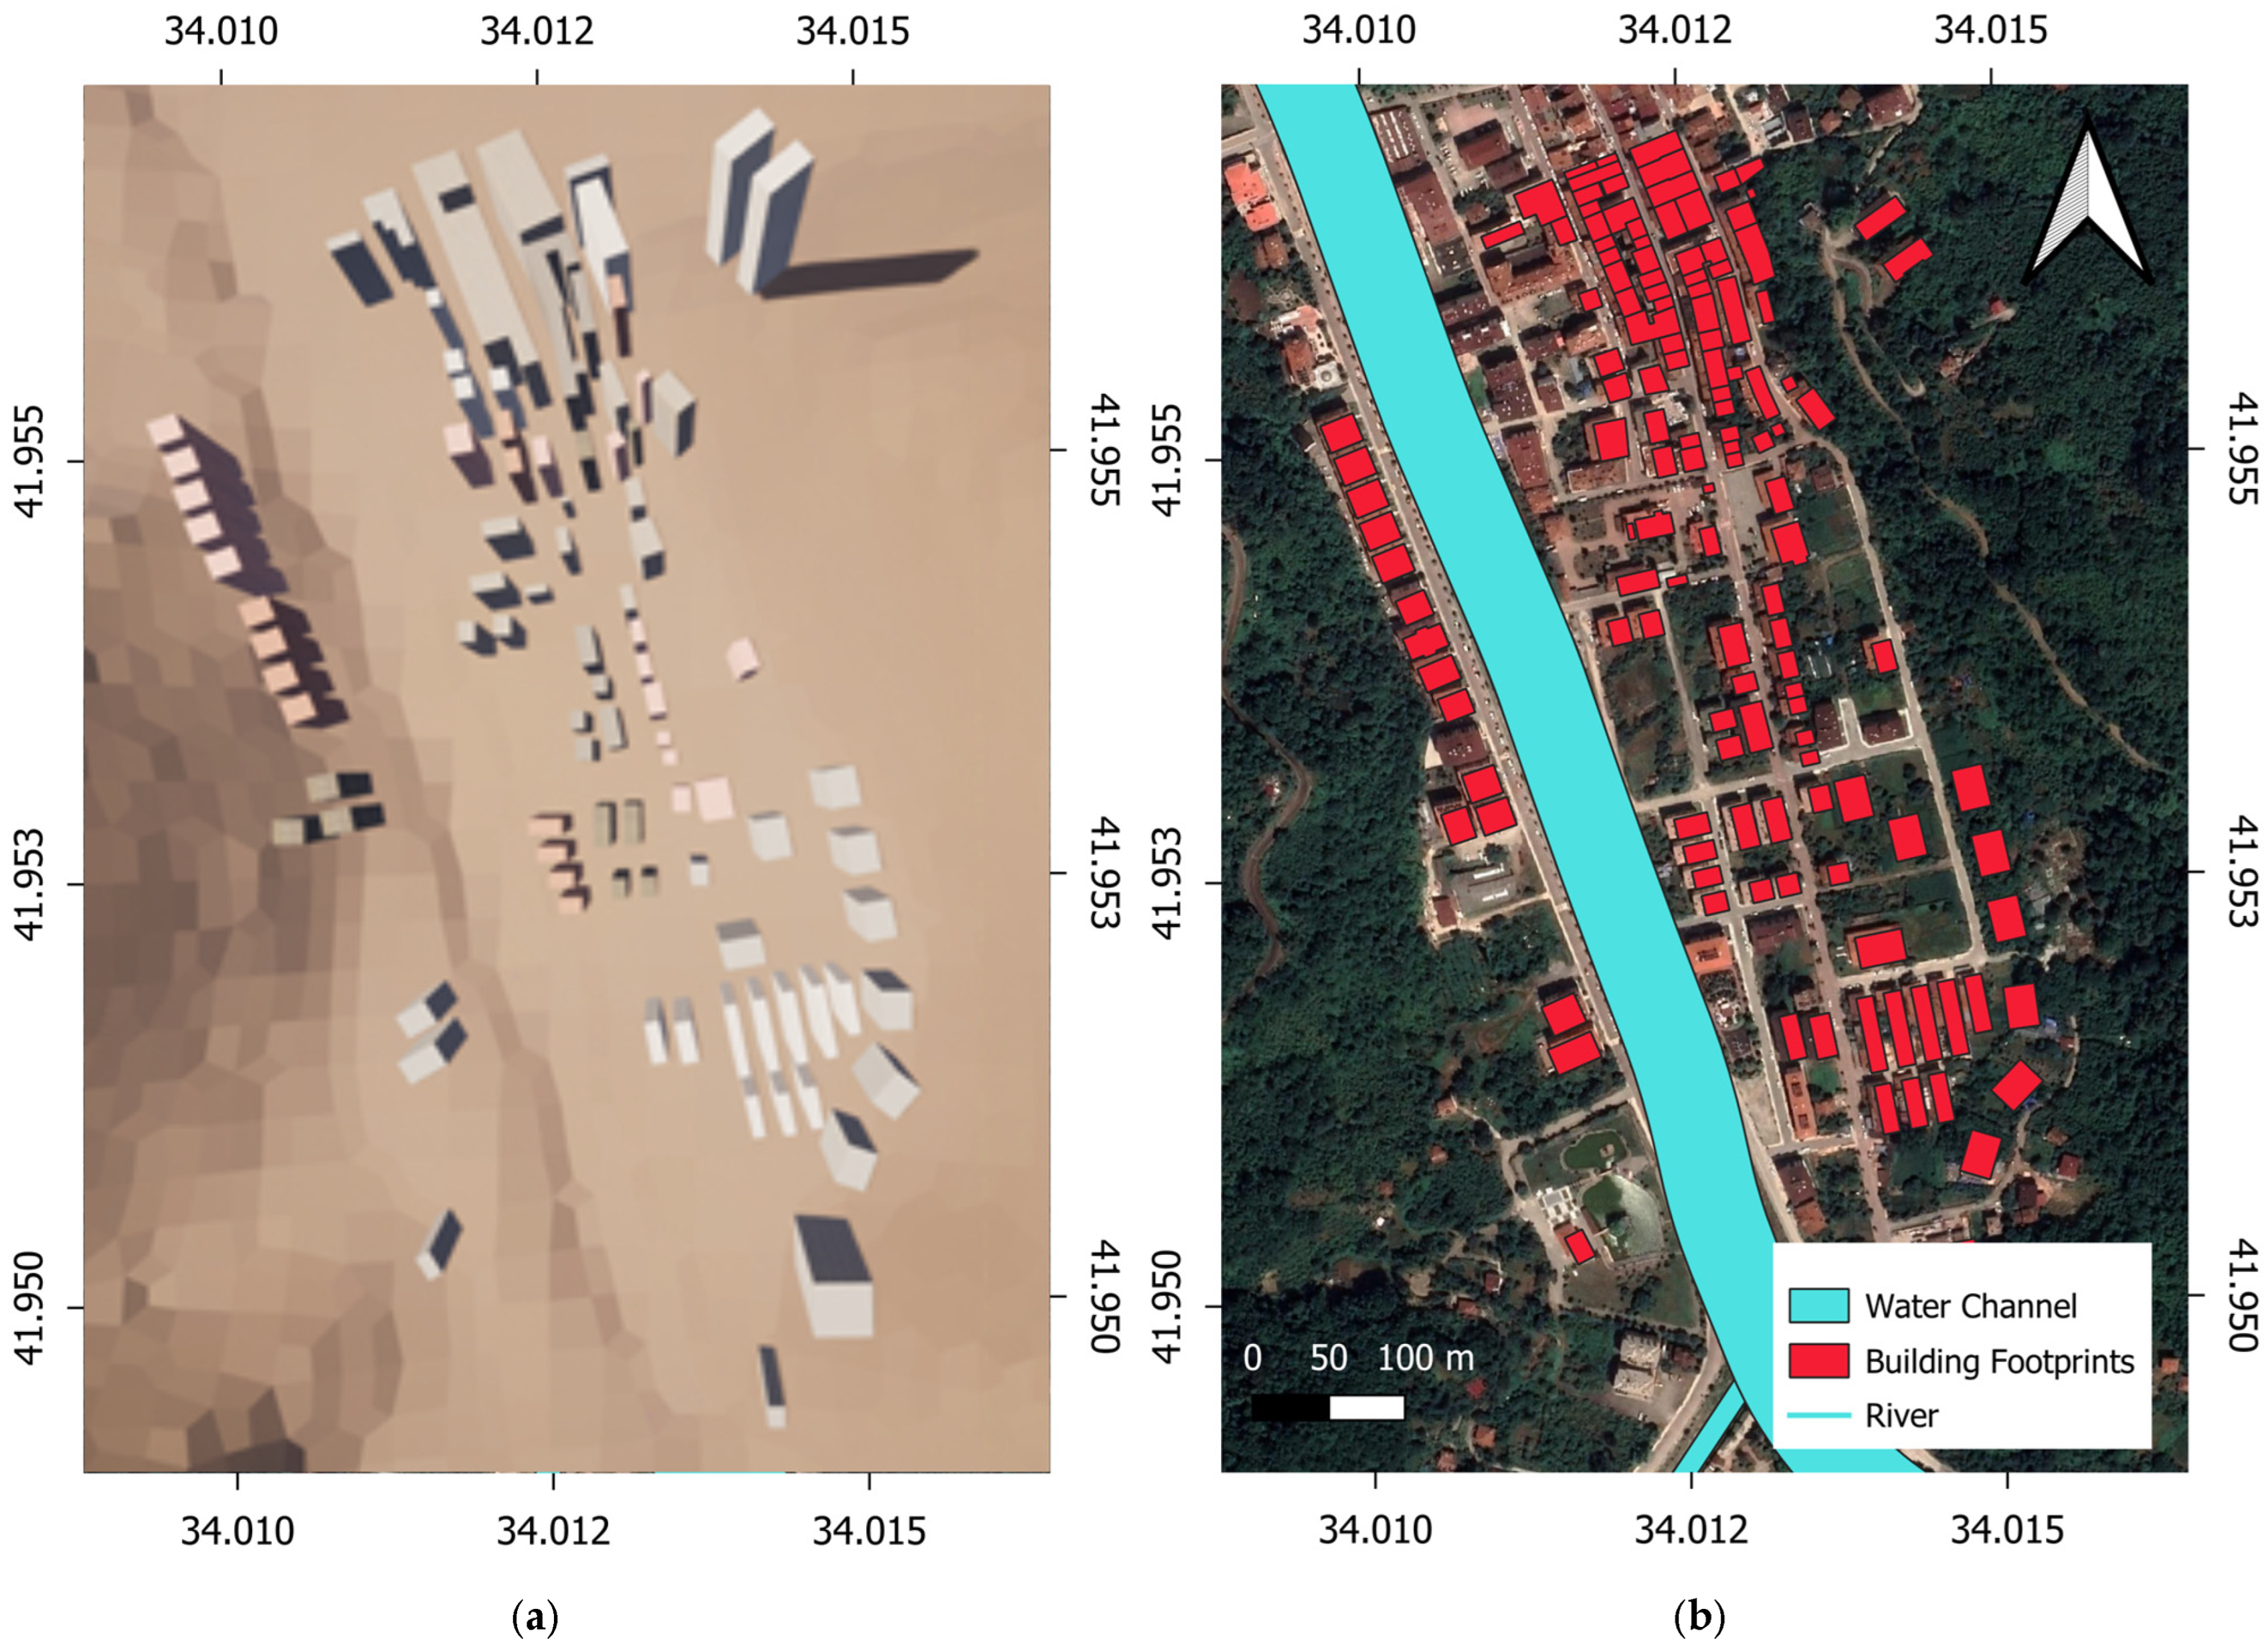
The data to be transferred into UE was edited with QGIS. With UE, Bozkurt district, which is located in the part of the Ezine River Basin that flows into the sea and experienced a flood disaster in 2021, was modelled in 3D. Then, considering the performance and software limits, the building data taken from OSM was cut to cover an area of 700 m from the basin entrance. These data were given to the Landscaping application, and the environment was created. The scale was selected as 0.4. These data and boundaries are shown in the map in Figure 6.
To use Libra liquids’ AI-supported mesh generator, the object to be sent must have volume, a shape and a surface without holes. For this, the terrain was recreated in 3D with the Blender software version 4.0. The DEM map with a resolution of 12.5 m was exported to create a 3D model of the terrain in Blender software.
Afterwards, it was made 3D by combining four edges with a flat surface added underneath. In the fluid add-on, point and surface boundaries were set for the object that could be analyzed by artificial intelligence. In order to comply with these boundaries, the resulting shape was modified with a “remesh” modification to both gain volume and meet the sufficient number of points and faces. The buildings and water channels were added to the distinct terrain model. Water channels refer to the natural path and branches of the Ezine stream. It was understood that the continuous water flow in the channel representing the Ezine stream was significant in terms of reference determination and liquid stability, and elements that added water at specific intervals were added. Water-adding elements were added to the ends of the two water channels from the basin to represent flood waters. A water-shedding border was added at the end of the city to prevent water accumulation (Figure 7).

5. Results

5.1. Results of SWAT Model

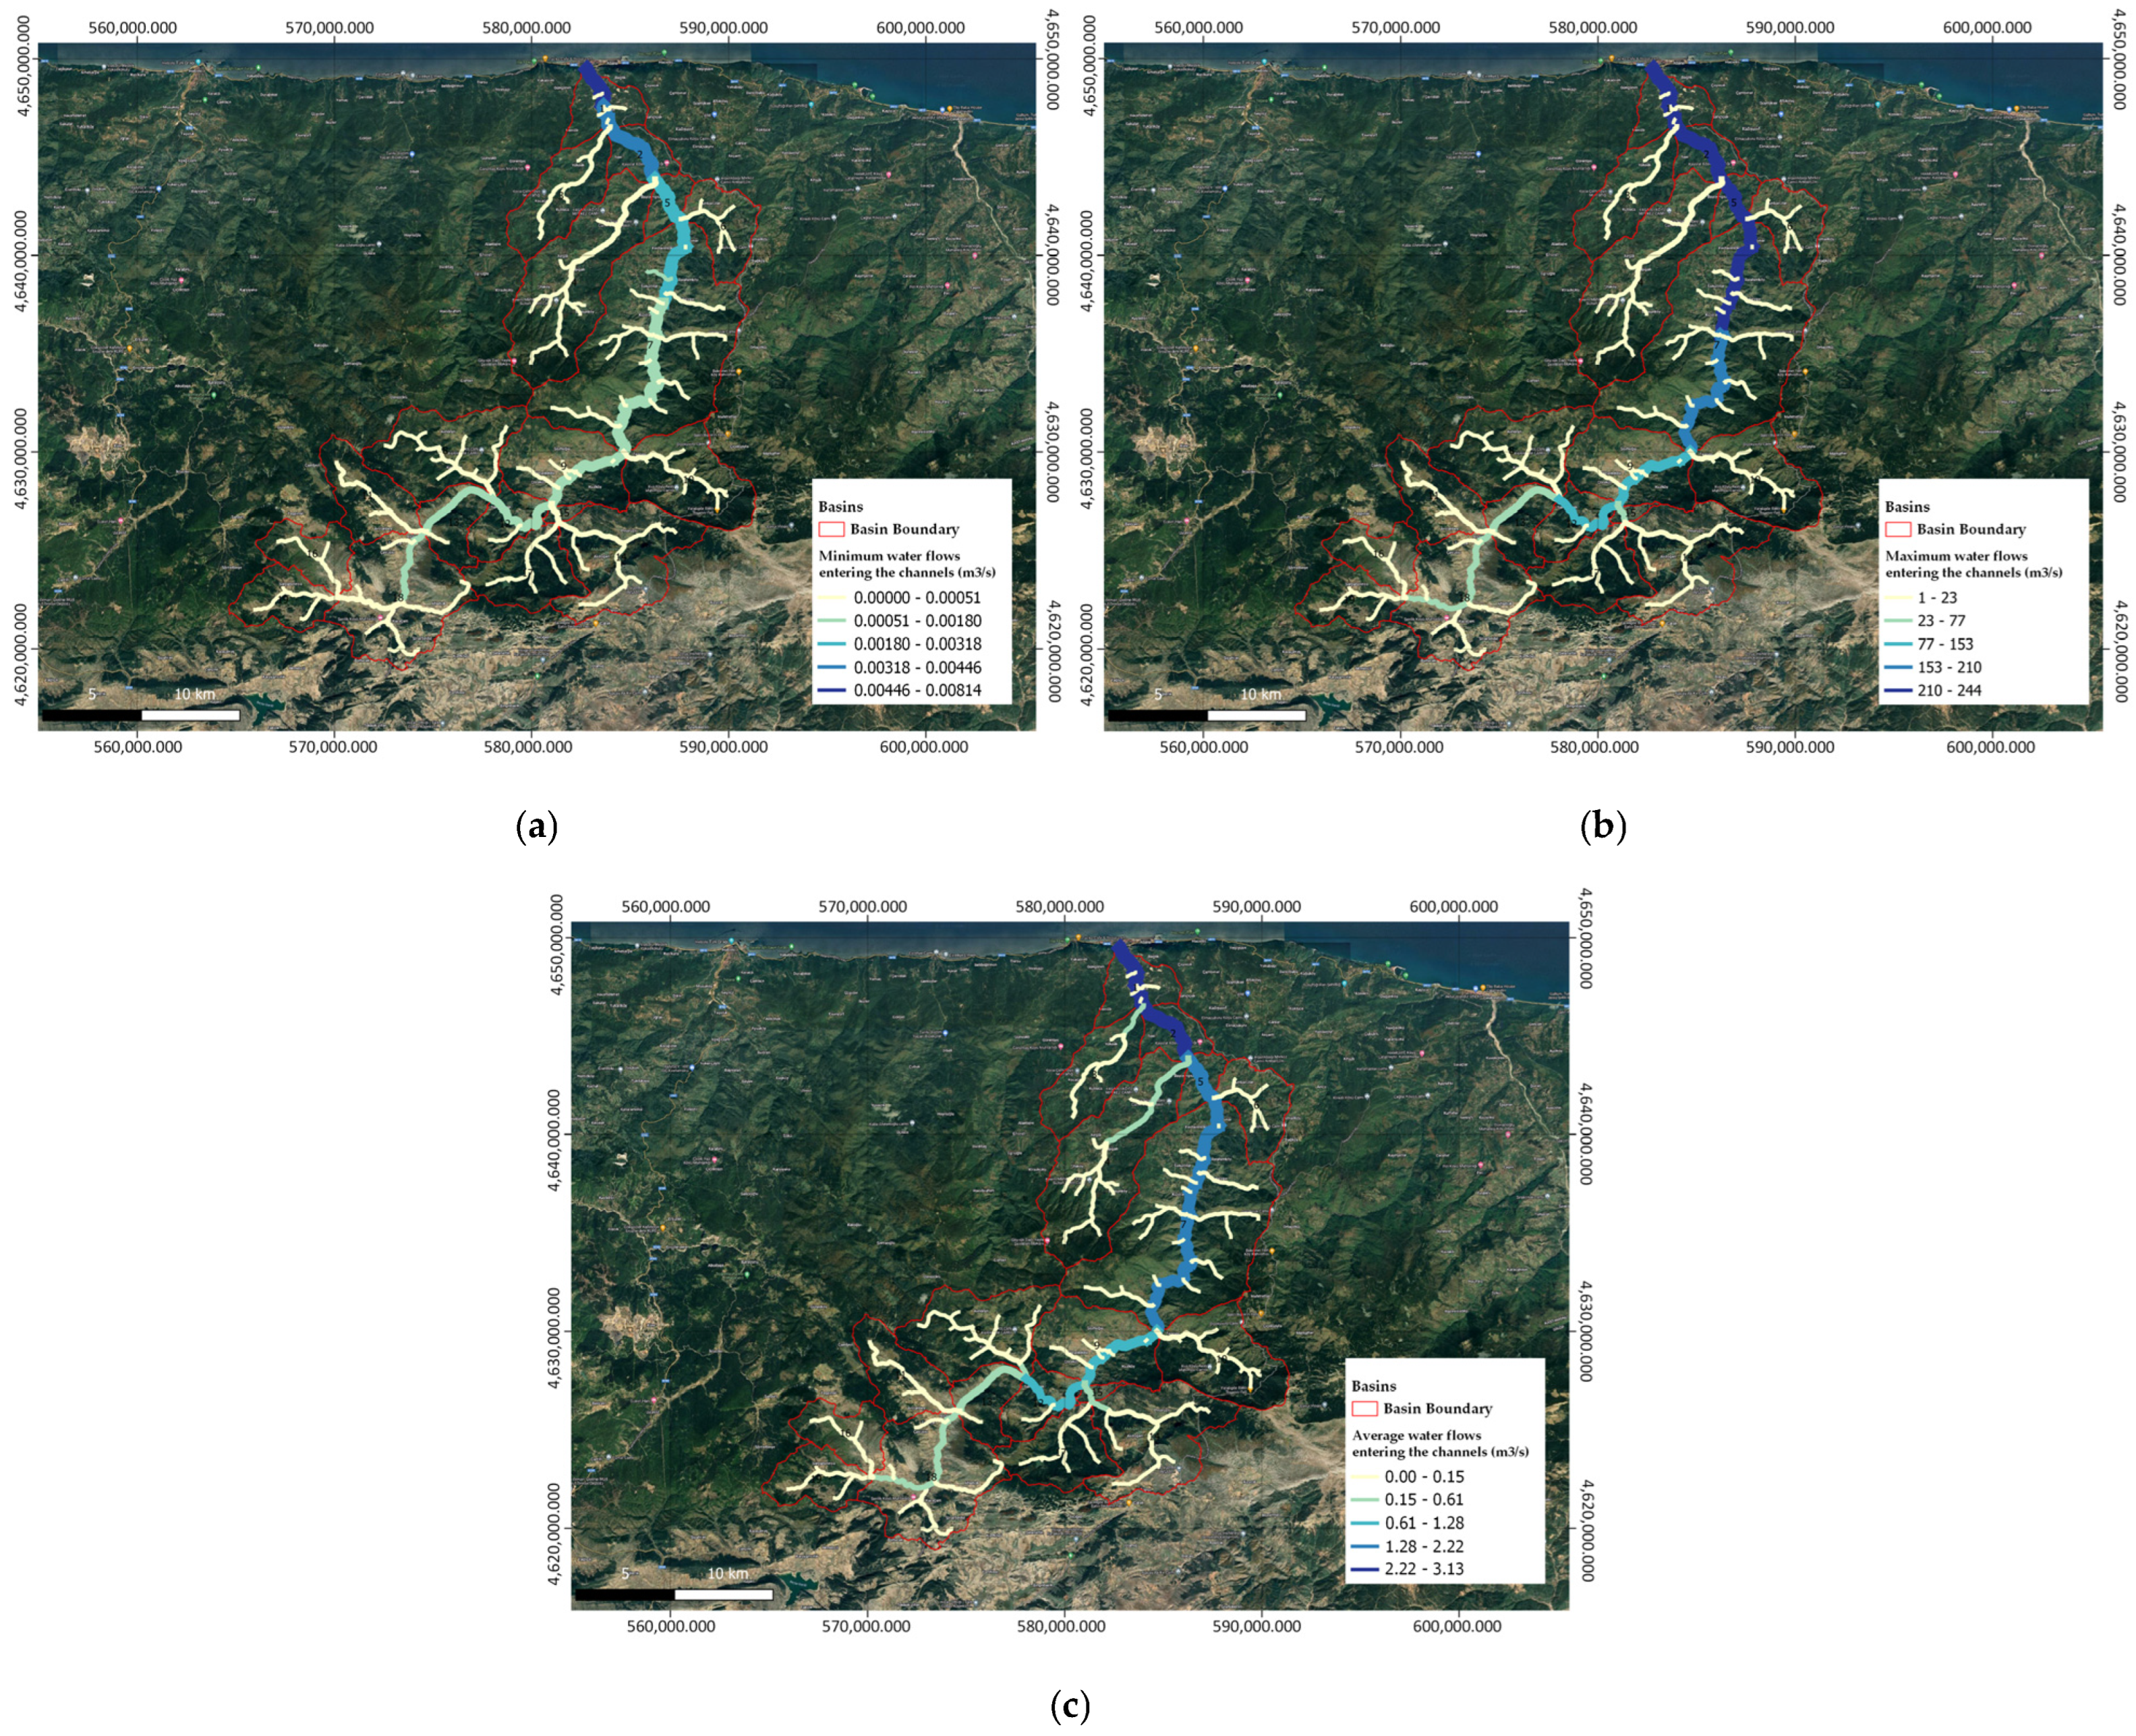
Due to the SWAT model, the basins and water balance were calculated on a monthly, daily, and annual basis. After the model was completed, tables containing the results according to the time intervals and calculation parameters were formed. On average, the daily water quantities in the sub-basins are as shown in the map in Figure 8. Sub-basin 1 was used in the visualization phase with UE. The hydrological parameters used in the calculations are also presented in Table 4. According to the results, the minimum, average and maximum results of the channel passing through Bozkurt district are 2.48, 4.12 and 5.81 m3/s, respectively. Water flow maps of the basin are given in Figure 9. The average flow rate for the same period, obtained from flow monitoring stations in the Bozkurt district, was 4.64 m3/s. The flow of 4.12 m3/s obtained with the SWAT+ model is consistent with the actual values. In addition, the climate model of the basin was produced by averaging the meteorological data (precipitation, temperature, humidity, sunshine, etc.) on a monthly basis.

5.2. Result of Unreal Engine Simulation

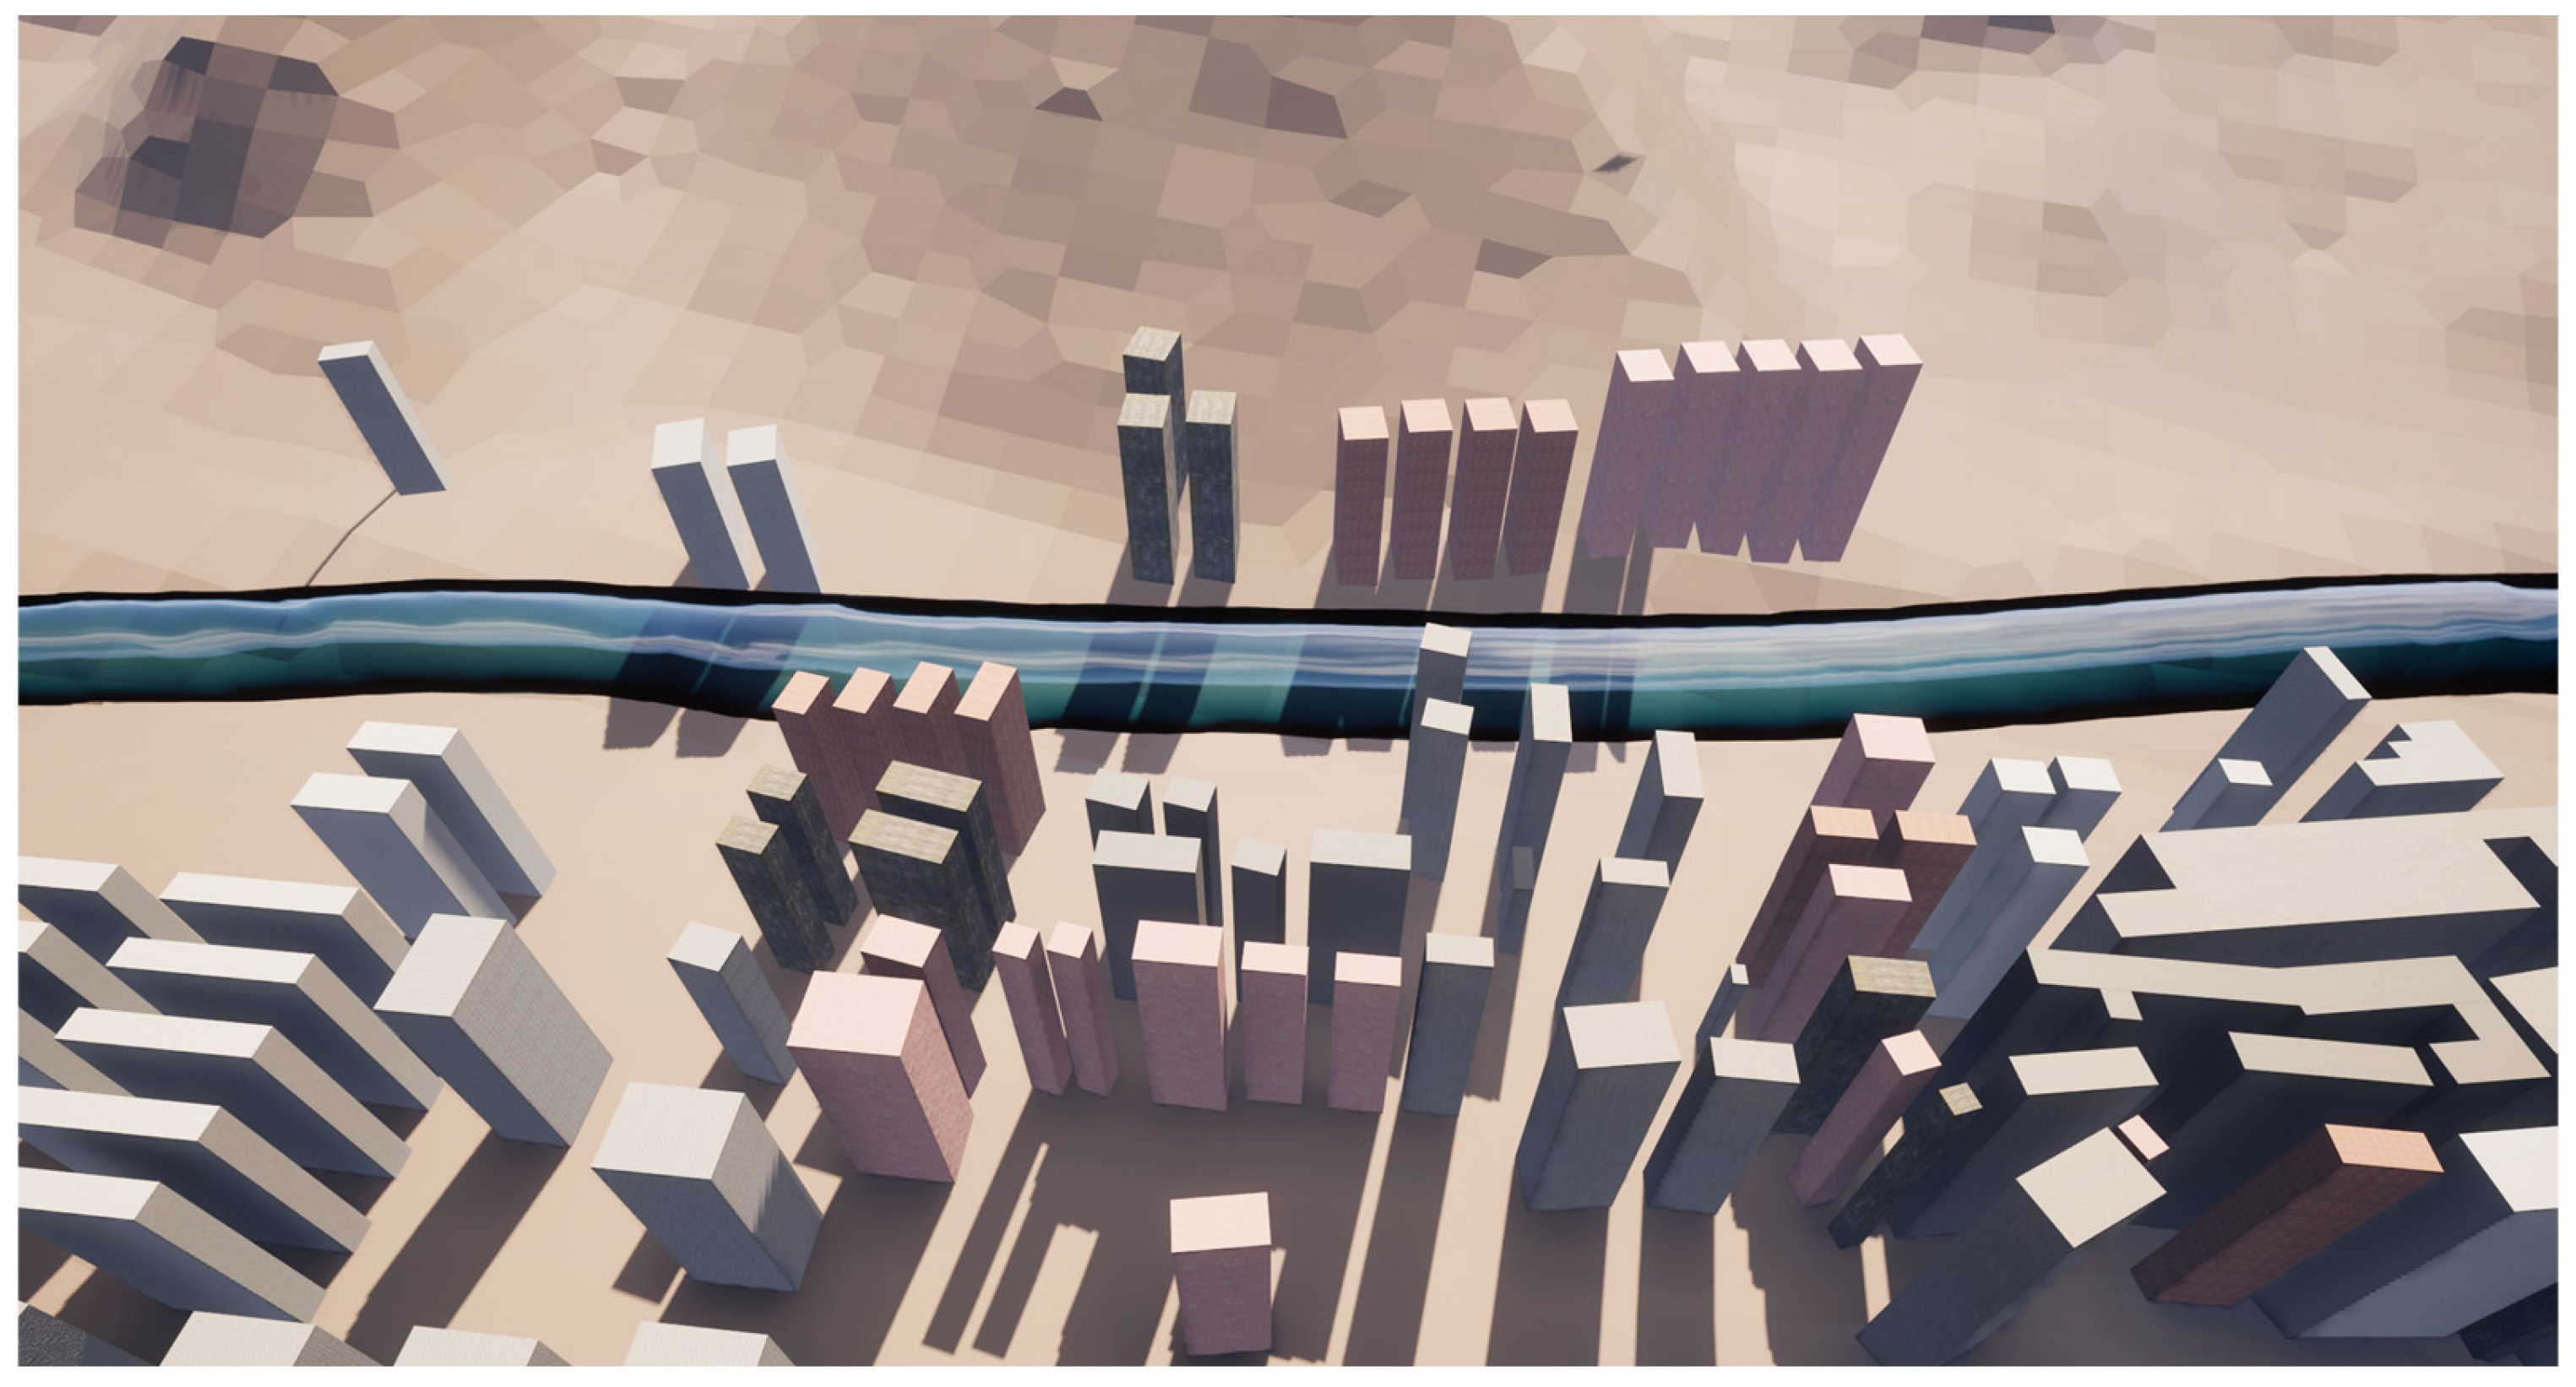
Two different scenarios were generated for the analysis of the developed model. (i) Normal non-flood flow, reference point; the presence of continuously flowing water in the existing water channel increases fluid stability. It also provides a volumetric and velocity connection between the real world and the simulation. (ii) Extra flows are formed by adding a flow rate similar to precipitation; at this stage, we can observe the rise in water more easily. The compatibility of multiple water sources in the game engine can be verified and observed. The figures of the water flow occurring in the simulation are presented in Figure 10 and Figure 11.
Hydrodynamic parameters were determined for modelling water flow within the UE. With these parameters, a realistic simulation of water is achieved. Appropriate parameters were determined by taking into account the hardware power and the efficient operation of the simulation. Relevant parameters and their explanations are presented in Table 5.
The results indicate that Unreal Engine, thanks to its visualization power as a game engine, can be used effectively in flood modelling. Determining parameters within the engine using a hydrological model allows for the creation of a physically based simulation, making it an effective tool for emergency response. The flood that occurs in case of extreme rainfall is compatible with the flood conditions occurring in the region.

5.3. Accuracy Assessment

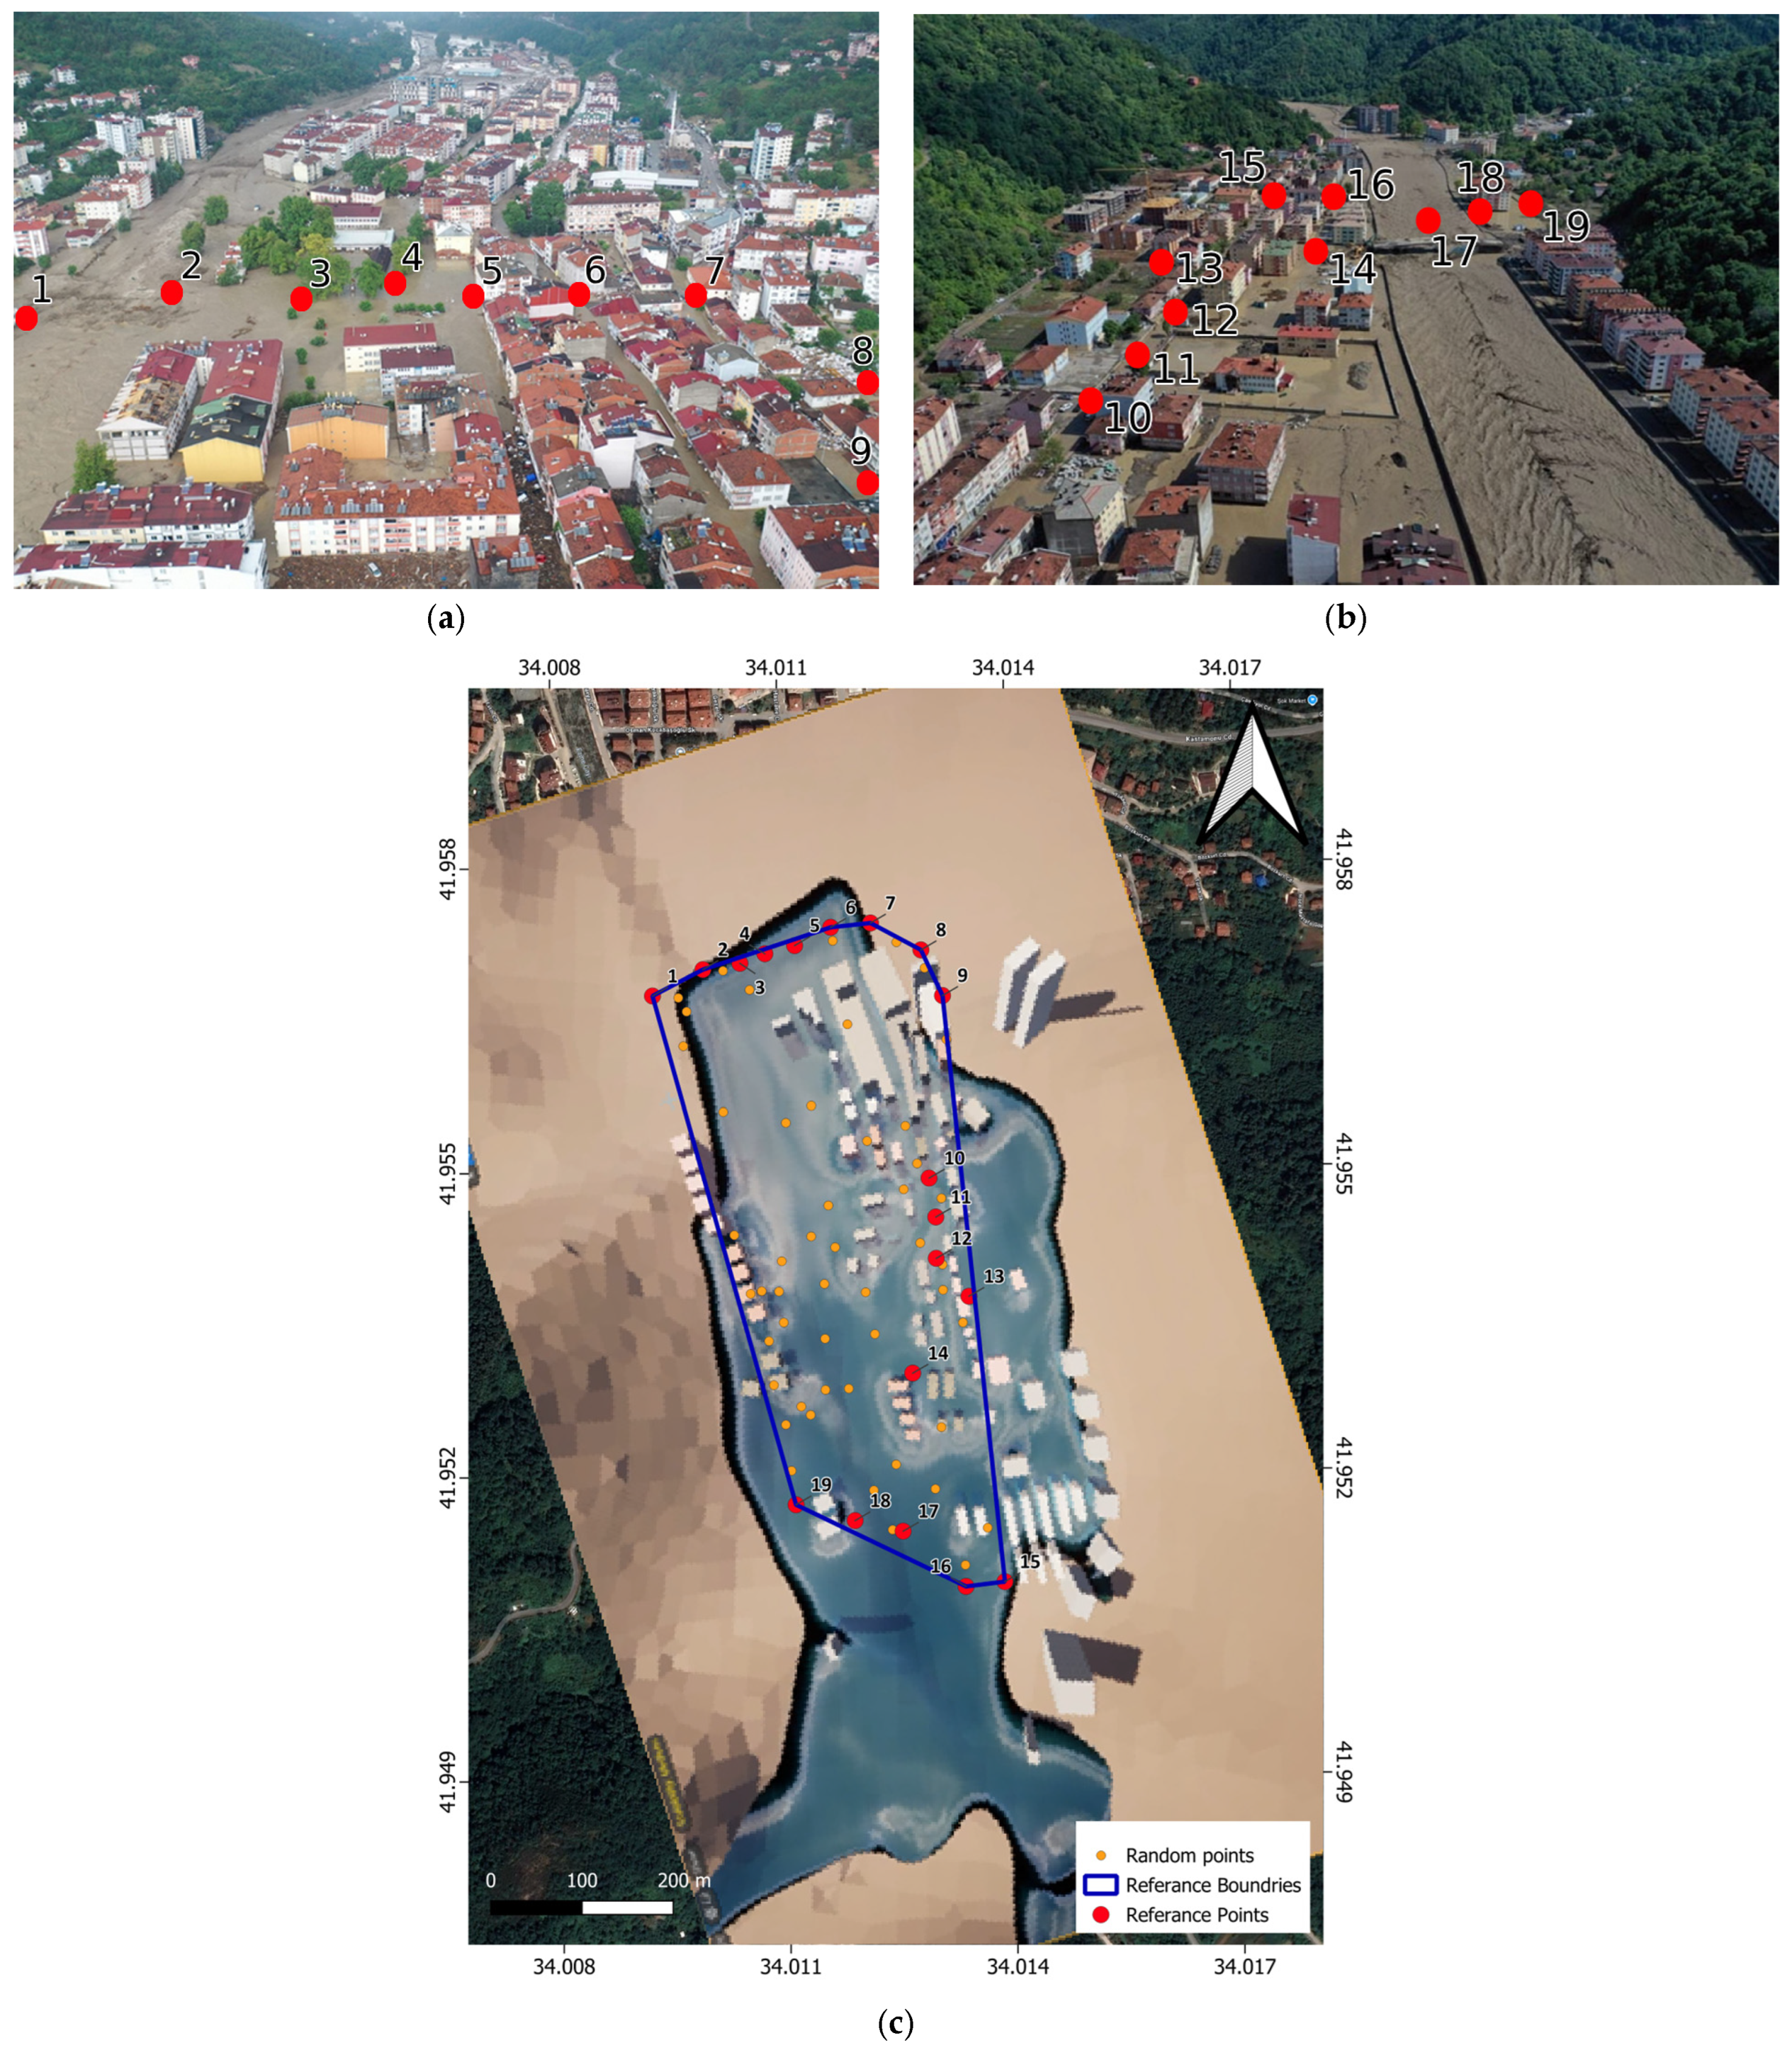
An analysis was conducted to assess the study’s proximity to reality. Accuracy analysis was performed on the distribution area based on the flood that occurred in Bozkurt, Kastamonu, Türkiye, in 2021. As the first step of the accuracy analysis study, news on the internet and images showing the flood were used to determine the boundaries of the area affected by the flood that occurred in the region in 2021. Volunteered geographic information (VGI) data from social media platforms, the points reached by the flood were carefully examined, and these points were marked on a map (Figure 12). A polygon was created from the border points reached by the flood using news images. This polygon represents the boundaries of the area affected by the flood. This step allowed the creation of a reference model based on real-world data to evaluate the accuracy of the simulation.
To evaluate the accuracy of the model created in Unreal Engine, a screenshot of this model was taken and transferred to QGIS. In QGIS, the screenshot of the model was geo-referenced and positioned correctly. Within the polygon created for the flood zone, 25 random points were created for each test. It was determined whether each of these points was within the flood zone. Analyzing these random points for each test is a method used to evaluate the model’s accuracy. A total of 10 tests were conducted and 25 random points were examined in each test. One of the tests performed is illustrated in Figure 12. It was determined whether these points were within the flood zone, and the number of incorrect points in each test was recorded.

6. Discussion

In the study, a realistic 3D flood simulation using the UE was created for Bozkurt, Kastamonu region, with the integration of a hydrological model with GIS. The generated 3D flood simulations improve integrated emergency management through efficient data use and visualization. The daily river flows of Ezine Stream obtained from the SWAT model were used for modelling the flow of water in UE.
Since the SWAT model was created for the entire Western Black Sea Basin, ALOS PALSAR and ESRI LULC maps were sufficient for large areas. Although lower spatial resolution (30 m) ASTER GDEM and SRTM data were preferred in previous studies [36], 12.5 m spatial resolution is appropriate since ALOS PALSAR is used to generate the topography in the UE flood simulation.
There are dynamic water flow model parameters in Unreal Engine software. However, SWAT hydrological model was used to customize these parameters for the study area. In contrast to studies that do not consider calculating climate and flow parameters [18], this study integrates climate, soil and terrain information for a realistic 3D flood model. Additionally, the effect of water collision on the buildings was added to the game engine to increase the realism of the model.
Figure 10 and Figure 11 shows visualizations of the water flow in Ezine Stream in the UE model in two scenarios. Since modelling water as a particle requires high hardware, generalization was applied to the water flow. However, this generalization did not reduce the consistency of the flood with the real situation, as can be seen from the 88% accuracy analysis.
Due to the simulation developed as a result of the study, it will be possible to determine which areas in the flood zone will be flooded from the first moment of the flood. Thus, it will be possible to prepare plans in advance for evacuating people in the flood zone in the most appropriate ways. Loss of time during the flood will be prevented. In this context, when the disaster management system is considered, the simulation to be developed will have a significant contribution in the preparation of appropriate evacuation and precaution plans at the “preparedness” stage. Thanks to the realistic simulations, the plans prepared in the “intervention” phase canbe implemented, and healthy coordination between the response teams can be ensured.
The open-source nature of most of the data used facilitates the integration of the developed model into crowdsourcing applications. Data readily available from sources such as ESRI Land Cover, FAO, OSM, and freely available DEMs allows for rapid production of topographic and thematic maps for the study area. Furthermore, Unreal Engine is open-source software, allowing the model to be easily expanded to any region using climate data, topographic and thematic maps, and 3D models. The proposed simulation model can be adapted for use by individuals with varying levels of technical expertise. Its GIS-based design enables the integration of various data layers, thereby expanding the application areas. It provides decision-makers with the opportunity to test mitigation strategies and complex decision-making scenarios through simulation. It also stands out as an effective educational tool for students and the wider public.
However, the presented study has some limitations. For stability and performance reasons, the game engine developers have added limits that cannot be changed from within the editor. These limits are directly related to the number of particles and the use of graphics card resources.

7. Conclusions

In this study, a flood simulation was developed using a game engine and GIS. The primary purpose of the study is to model flood risks more effectively and thus enable relevant institutions and society to be better prepared against floods.
Simulations have shown that the dynamic modelling and visualization capabilities of game engines, when combined with the geographic data processing power of GIS, are an important tool in flood risk analysis. The sandbox capabilities provided by the game engine offer the opportunity to modify model inputs and processes instantly. This feature has enabled users to quickly test different scenarios and observe how the system responds under various conditions. This has provided great accuracy and efficiency in creating flood risk maps and evaluating possible flood scenarios. The model proposed in this study has the potential to be used in studies on many goals and sub-goals, especially goals 13 (Climate action) and 17 (Sustainable Cities and Communities) among the United Nations (UN) Sustainable Development Goals (SDGs). Research conducted with these objectives is becoming increasingly common, and its significance is growing daily [50,51].
Due to the visualization power of game engines, flood scenarios can be effectively created. Accurately capturing climate data for any selected region will enable the creation of a flood simulation. The model presented in this study can be integrated into digital twin applications thanks to real-time data collected by IoT sensors. It can also enable disaster risk management experts to accurately generate potential scenarios for effective risk reduction and response. Furthermore, the powerful visual materials offered by game engines for public education can increase flood awareness and resilience.
The model developed in this study also offers significant benefits in the field of disaster management. The integration of game engines and GIS technologies contributes to the development of more effective and efficient disaster management strategies. The dynamic simulation and visualization capabilities offered by the model allow disaster scenarios to be tested in real time and the system’s reactions to being analyzed under different conditions. In this way, disaster response teams and decision-makers can take faster and more effective measures against natural disasters such as floods. Additionally, the integration of the model with VR and augmented reality (AR) technologies can increase the level of preparedness of communities against disasters by improving education and awareness in disaster management. Disaster risk management is a process that begins with the identification, analysis and evaluation of hazards and continues with the definition of opportunities, resources and priorities. This process is completed with the preparation and implementation of general policies, strategic plans, and implementation plans for creating disaster scenarios and the management of risk reduction. This technological combination has the potential to minimize the adverse effects of disasters by developing innovative approaches to disaster risk management. The recent use of satellite and UAV systems has increased in flood studies. The Surface Water and Ocean Topography (SWOT) satellite mission, which began operations in 2022, will provide comprehensive monitoring of rivers, lakes, reservoirs, and oceans. In future studies, SWOT data is expected to be effectively used in the validation and parameterization of hydrological models [52]. Additionally, artificial intelligence methods can be effectively utilized in risk analysis and damage assessment studies within the framework of emergency management systems [53]. As a result, the integration of game engines and GIS technologies offers an innovative and practical approach in flood simulations and risk analyses. The findings of this study have the potential to provide relevant institutions and researchers with new tools and methods in flood risk management. Future studies should be aimed at further developing this approach and investigating its applicability in different types of natural disasters.

Author Contributions

Conceptualization, M.E.A. and A.O.; methodology, M.E.A., A.O. and M.M.K.; software, A.O.; validation, M.E.A. and M.M.K.; formal analysis, A.O.; investigation, M.E.A., A.O., M.M.K. and S.O.A.; resources, M.E.A. and S.O.A.; data curation, A.O. and S.O.A.; writing—original draft preparation, M.E.A. and A.O.; writing—review and editing, M.M.K. and S.O.A.; visualization, A.O., M.M.K., and S.O.A.; supervision, M.E.A.; project administration, M.E.A.; funding acquisition, M.E.A. All authors have read and agreed to the published version of the manuscript.

Funding

This research was funded by The Scientific and Technological Research Council of Türkiye (TÜBİTAK), grant number 124Y058.

Institutional Review Board Statement

Not applicable.

Data Availability Statement

The data presented in this study are available on request from the corresponding author.

Acknowledgments

This study was prepared within the scope of the first author’s master’s thesis. We would like to thank the Turkish General Directorate of Meteorology for providing free data. The authors would like to thank the Istanbul Technical University Research Center for Satellite Communications and Remote Sensing (ITU-CSCRS) for their support in providing high-resolution satellite images.

Conflicts of Interest

The authors declare no conflicts of interest.

Abbreviations

The following abbreviations are used in this manuscript:
ARAugmented reality
2DTwo-dimensional
3DThree-dimensional
GMLGeography markup language
BIMBuilding information modelling
HRUsHydrological response units
FAOFood and Agriculture Organization
LULCLand use land cover
GISGeographic information systems
SDGsSustainable development goals
UEUnreal engine
UNUnited Nations
USDAUnited States Department of Agriculture
VRVirtual reality
SWATSoil and water assessment tool
OSMOpen street maps
XRExtended reality
VGIVolunteered geographic information

References

  1. United Nations Office for Disaster Risk Reduction Disaster Risk Reduction Terminology. Available online: https://www.undrr.org/drr-glossary/terminology (accessed on 5 February 2025).
  2. Atik, M.E.; Safi, O. Investigation of GIS-Based Analytical Hierarchy Process for Multi-Criteria Earthquake Risk Assessment: The Case Study of Kahramanmaras Province. Int. J. Environ. Geoinform. 2024, 11, 156–165. [Google Scholar] [CrossRef]
  3. Xu, K.; Zhuang, Y.; Bin, L.; Wang, C.; Tian, F. Impact Assessment of Climate Change on Compound Flooding in a Coastal City. J. Hydrol. 2023, 617, 129166. [Google Scholar] [CrossRef]
  4. Hdeib, R.; Abdallah, C.; Colin, F.; Brocca, L.; Moussa, R. Constraining Coupled Hydrological-Hydraulic Flood Model by Past Storm Events and Post-Event Measurements in Data-Sparse Regions. J. Hydrol. 2018, 565, 160–176. [Google Scholar] [CrossRef]
  5. Manzoor, Z.; Ehsan, M.; Khan, M.B.; Manzoor, A.; Akhter, M.M.; Sohail, M.T.; Hussain, A.; Shafi, A.; Abu-Alam, T.; Abioui, M. Floods and Flood Management and Its Socio-Economic Impact on Pakistan: A Review of the Empirical Literature. Front. Environ. Sci. 2022, 10, 1021862. [Google Scholar] [CrossRef]
  6. El-Haddad, B.A.; Youssef, A.M.; Pourghasemi, H.R.; Pradhan, B.; El-Shater, A.-H.; El-Khashab, M.H. Flood Susceptibility Prediction Using Four Machine Learning Techniques and Comparison of Their Performance at Wadi Qena Basin, Egypt. Nat. Hazards 2021, 105, 83–114. [Google Scholar] [CrossRef]
  7. Hossain Anni, A.; Cohen, S.; Praskievicz, S. Sensitivity of Urban Flood Simulations to Stormwater Infrastructure and Soil Infiltration. J. Hydrol. 2020, 588, 125028. [Google Scholar] [CrossRef]
  8. Hupp, C.R.; Pierce, A.R.; Noe, G.B. Floodplain Geomorphic Processes and Environmental Impacts of Human Alteration along Coastal Plain Rivers, USA. Wetlands 2009, 29, 413–429. [Google Scholar] [CrossRef]
  9. Kundzewicz, Z.W.; Kanae, S.; Seneviratne, S.I.; Handmer, J.; Nicholls, N.; Peduzzi, P.; Mechler, R.; Bouwer, L.M.; Arnell, N.; Mach, K.; et al. Flood Risk and Climate Change: Global and Regional Perspectives. Hydrol. Sci. J. 2014, 59, 1–28. [Google Scholar] [CrossRef]
  10. Feng, B.; Zhang, Y.; Bourke, R. Urbanization Impacts on Flood Risks Based on Urban Growth Data and Coupled Flood Models. Nat. Hazards 2021, 106, 613–627. [Google Scholar] [CrossRef]
  11. Hernández-Atencia, Y.; Peña, L.E.; Muñoz-Ramos, J.; Rojas, I.; Álvarez, A. Use of Soil Infiltration Capacity and Stream Flow Velocity to Estimate Physical Flood Vulnerability under Land-Use Change Scenarios. Water 2023, 15, 1214. [Google Scholar] [CrossRef]
  12. Wu, Y.; Peng, F.; Peng, Y.; Kong, X.; Liang, H.; Li, Q. Dynamic 3D Simulation of Flood Risk Based on the Integration of Spatio-Temporal GIS and Hydrodynamic Models. ISPRS Int. J. Geo-Inf. 2019, 8, 520. [Google Scholar] [CrossRef]
  13. Yang, B.; Ma, J.; Huang, G.; Cao, D. Development and Application of 3D Visualization Platform for Flood Evolution in Le’an River Basin of Wuyuan. IOP Conf. Ser. Earth Environ. Sci. 2021, 638, 012053. [Google Scholar] [CrossRef]
  14. Yin, W.; Hu, Q.; Liu, W.; Liu, J.; He, P.; Zhu, D.; Kornejady, A. Harnessing Game Engines and Digital Twins: Advancing Flood Education, Data Visualization, and Interactive Monitoring for Enhanced Hydrological Understanding. Water 2024, 16, 2528. [Google Scholar] [CrossRef]
  15. Purnomo, F.A.; Yoeseph, N.M.; Koesuma, S.; Hartono, R.; Ristania, S.; Riasti, B.K. Virtual Reality Flood Disaster with Variations of Water Levels in the Early Warning System. In Proceedings of the 2022 1st International Conference on Smart Technology, Applied Informatics, and Engineering (APICS), Surakarta, Indonesia, 23–24 August 2022; IEEE: Piscataway, NJ, USA, 2022; pp. 180–185. [Google Scholar]
  16. Kikuchi, N.; Fukuda, T.; Yabuki, N. How a Flooded City Can Be Visualized from Both the Air and the Ground with the City Digital Twin Approach, System Integration of Flood Simulation and Augmented Reality with Drones. In Proceedings of the 27th CAADRIA Conference, Sydney, Australia, 9–15 April 2022; CAADRIA: New Territories, Hong Kong SAR, China, 2022; pp. 607–616. [Google Scholar]
  17. Amirebrahimi, S.; Rajabifard, A.; Mendis, P.; Ngo, T. A BIM-GIS Integration Method in Support of the Assessment and 3D Visualisation of Flood Damage to a Building. J. Spat. Sci. 2016, 61, 317–350. [Google Scholar] [CrossRef]
  18. Levy, J.; Liu, D. Extended Reality (XR) Environments for Flood Risk Management with 3D GIS and Open Source 3D Graphics Cross-Platform Game Engines: Advances in Immersive Sea Level Rise Planning Technologies for Student Learning and Community Engagement. In Proceedings of the 7th ASRES International Conference on Intelligent Technologies, Jakarta, Indonesia, 16–18 December 2022; Arya, K.V., Tripathi, V.K., Rodriguez, C., Yusuf, E., Eds.; Lecture Notes in Networks and Systems. Springer Nature: Singapore, 2023; Volume 685, pp. 271–285, ISBN 978-981-99-1911-6. [Google Scholar]
  19. Li, G.; Shao, W.; Liu, J. Simulation Research of Dam Break Flood in Urban Area Based on TELEMAC-2D Model. In Proceedings of the 2022 International Conference on Information Technology, Communication Ecosystem and Management (ITCEM), Bangkok, Thailand, 19–21 December 2022; IEEE: Piscataway, NJ, USA, 2022; pp. 86–89. [Google Scholar]
  20. Suquet, R.R.; Nguyen, T.H.; Ricci, S.; Piacentini, A.; Bonassies, Q.; Fatras, C.; Lavergne, E.; Brunato, S.; Gaudissart, V.; Guzzonatto, E.; et al. The SCO-Flooddam Project: Towards a Digital Twin for Flood Detection, Prediction and Flood Risk Assessments. In Proceedings of the IGARSS 2023–2023 IEEE International Geoscience and Remote Sensing Symposium, Pasadena, CA, USA, 16–21 July 2023; IEEE: Piscataway, NJ, USA, 2023; pp. 1000–1003. [Google Scholar]
  21. Rai, K.; Mishra, N.; Sharma, A.K.; Mishra, S.; Dahale, P.P. Flood Risk Assessment Mapping of Nainital District Using GIS Tools. In Proceedings of the 2023 International Conference on Artificial Intelligence and Applications (ICAIA) Alliance Technology Conference (ATCON-1), Bangalore, India, 21–22 April 2023; IEEE: Piscataway, NJ, USA, 2023; pp. 1–5. [Google Scholar]
  22. Enomah, L.D.; Downs, J.; Mbaigoto, N.; Fonda, B.; Umar, M. Flood Risk Assessment in Limbe (Cameroon) Using a GIS Weighed Sum Method. Environ. Dev. Sustain. 2023, 26, 29725–29744. [Google Scholar] [CrossRef]
  23. Ma, C.; Zhao, Y.; AL-Dohuki, S.; Yang, J.; Ye, X.; Kamw, F.; Amiruzzaman, M. GTMapLens: Interactive Lens for Geo-Text Data Browsing on Map. Comput. Graph. Forum 2020, 39, 469–481. [Google Scholar] [CrossRef]
  24. Bakhtiari, V.; Piadeh, F.; Behzadian, K.; Kapelan, Z. A Critical Review for the Application of Cutting-Edge Digital Visualisation Technologies for Effective Urban Flood Risk Management. Sustain. Cities Soc. 2023, 99, 104958. [Google Scholar] [CrossRef]
  25. Macchione, F.; Costabile, P.; Costanzo, C.; De Santis, R. Moving to 3-D Flood Hazard Maps for Enhancing Risk Communication. Environ. Model. Softw. 2019, 111, 510–522. [Google Scholar] [CrossRef]
  26. Li, X.; Dellinger, G.; Erpicum, S.; Chen, L.; Yu, S.; Guiot, L.; Archambeau, P.; Pirotton, M.; Dewals, B. 2D and 3D Computational Modeling of Surface Flooding in Urbanized Floodplains: Modeling Performance for Various Building Layouts. Water Resour. Res. 2024, 60, e2023WR035149. [Google Scholar] [CrossRef]
  27. Towe, R.; Dean, G.; Edwards, L.; Nundloll, V.; Blair, G.; Lamb, R.; Hankin, B.; Manson, S. Rethinking Data-driven Decision Support in Flood Risk Management for a Big Data Age. J. Flood Risk Manag. 2020, 13, e12652. [Google Scholar] [CrossRef]
  28. Guo, K.; Guan, M.; Yu, D. Urban Surface Water Flood Modelling—A Comprehensive Review of Current Models and Future Challenges. Hydrol. Earth Syst. Sci. 2021, 25, 2843–2860. [Google Scholar] [CrossRef]
  29. Sermet, Y.; Demir, I. Flood Action VR: A Virtual Reality Framework for Disaster Awareness and Emergency Response Training. In Proceedings of the ACM SIGGRAPH 2019 Posters, Los Angeles, CA, USA, 28 July 2019; ACM: New York, NY, USA, 2019; pp. 1–2. [Google Scholar]
  30. Skinner, C. Flash Flood!: A SeriousGeoGames Activity Combining Science Festivals, Video Games, and Virtual Reality with Research Data for Communicating Flood Risk and Geomorphology. Geosci. Commun. 2020, 3, 1–17. [Google Scholar] [CrossRef]
  31. Fujimi, T.; Fujimura, K. Testing Public Interventions for Flash Flood Evacuation through Environmental and Social Cues: The Merit of Virtual Reality Experiments. Int. J. Disaster Risk Reduct. 2020, 50, 101690. [Google Scholar] [CrossRef]
  32. Su, W.-R.; Lin, Y.-J.; Huang, C.-H.; Yang, C.-H.; Tsai, Y.-F. 3D GIS Platform for Flood Wargame: A Case Study of New Taipei City, Taiwan. Water 2021, 13, 2211. [Google Scholar] [CrossRef]
  33. Mol, J.M.; Botzen, W.J.W.; Blasch, J.E. After the Virtual Flood: Risk Perceptions and Flood Preparedness after Virtual Reality Risk Communication. Judgm. Decis. Mak. 2022, 17, 189–214. [Google Scholar] [CrossRef]
  34. Demiray, B.Z.; Sermet, Y.; Yildirim, E.; Demir, I. FloodGame: An Interactive 3D Serious Game on Flood Mitigation for Disaster Awareness and Education. Environ. Model. Softw. 2025, 188, 106418. [Google Scholar] [CrossRef]
  35. Schröter, K.; Lüdtke, S.; Redweik, R.; Meier, J.; Bochow, M.; Ross, L.; Nagel, C.; Kreibich, H. Flood Loss Estimation Using 3D City Models and Remote Sensing Data. Environ. Model. Softw. 2018, 105, 118–131. [Google Scholar] [CrossRef]
  36. Zhi, G.; Liao, Z.; Tian, W.; Wu, J. Urban Flood Risk Assessment and Analysis with a 3D Visualization Method Coupling the PP-PSO Algorithm and Building Data. J. Environ. Manag. 2020, 268, 110521. [Google Scholar] [CrossRef]
  37. Kelesoglu, M.K.; Temur, R.; Gülbaz, S.; Memisoglu Apaydin, N.; Kazezyılmaz-Alhan, C.M.; Bozbey, I. Site Assessment and Evaluation of the Structural Damages after the Flood Disaster in the Western Black Sea Basin on August 11, 2021. Nat. Hazards 2023, 116, 587–618. [Google Scholar] [CrossRef]
  38. Tabari, H. Climate Change Impact on Flood and Extreme Precipitation Increases with Water Availability. Sci. Rep. 2020, 10, 13768. [Google Scholar] [CrossRef] [PubMed]
  39. Official Climate Statistics. Available online: https://www.mgm.gov.tr/veridegerlendirme/il-ve-ilceler-istatistik.aspx?k=H&m=KASTAMONU (accessed on 4 February 2025).
  40. Unal, A.; Camci, K.G.; Ersoy Tonyaloğlu, E. Mapping in Natural Disasters Using Multi-Criteria Decision Analysis: Flood Risk Case of Aydın Province. Ulisa J. Int. Stud. 2022, 6, 136–150. [Google Scholar]
  41. Azizian, A.; Brocca, L. Determining the Best Remotely Sensed DEM for Flood Inundation Mapping in Data Sparse Regions. Int. J. Remote Sens. 2020, 41, 1884–1906. [Google Scholar] [CrossRef]
  42. Food and Agriculture Organization of the United Nations (FAO). Harmonized World Soil Database v2.0. Available online: https://www.fao.org/soils-portal/data-hub/soil-maps-and-databases/harmonized-world-soil-database-v20/en/ (accessed on 19 July 2025).
  43. Arnold, J.G.; Srinivasan, R.; Muttiah, R.S.; Williams, J.R. Large Area Hydrologic Modeling and Assessment. JAWRA J. Am. Water Resour. Assoc. 1998, 34, 73–89. [Google Scholar] [CrossRef]
  44. Abate, B.Z.; Assefa, T.T.; Tigabu, T.B.; Abebe, W.B.; He, L. Hydrological Modeling of the Kobo-Golina River in the Data-Scarce Upper Danakil Basin, Ethiopia. Sustainability 2023, 15, 3337. [Google Scholar] [CrossRef]
  45. Guug, S.S.; Abdul-Ganiyu, S.; Kasei, R.A. Application of SWAT Hydrological Model for Assessing Water Availability at the Sherigu Catchment of Ghana and Southern Burkina Faso. HydroResearch 2020, 3, 124–133. [Google Scholar] [CrossRef]
  46. Tully, D.; Rhalibi, A.; Carter, C.; Sudirman, S. Hybrid 3D Rendering of Large Map Data for Crisis Management. ISPRS Int. J. Geo-Inf. 2015, 4, 1033–1054. [Google Scholar] [CrossRef]
  47. Unreal Engine Niagara Overview. Available online: https://dev.epicgames.com/documentation/en-us/unreal-engine/niagara-overview?application_version=4.27 (accessed on 2 April 2025).
  48. Ludic Drive Landscaping. Available online: https://unrealassetstore.com/product/landscaping/ (accessed on 4 February 2025).
  49. Müller, M.; Charypar, D.; Gross, M. Particle-Based Fluid Simulation for Interactive Applications. In Proceedings of the 2003 ACM SIGGRAPH/Eurographics Symposium on Computer Animation, San Diego, CA, USA, 26–27 July 2003; Eurographics Association: Goslar, Germany, 2003; pp. 154–159. [Google Scholar]
  50. Isiler, M.; Yanalak, M.; Atik, M.E.; Atik, S.O.; Duran, Z. A Semi-Automated Two-Step Building Stock Monitoring Methodology for Supporting Immediate Solutions in Urban Issues. Sustainability 2023, 15, 8979. [Google Scholar] [CrossRef]
  51. Atik, S.O.; Ipbuker, C. Building Extraction in VHR Remote Sensing Imagery Through Deep Learning. Fresenius Environ. Bull. 2022, 31, 8468–8473. [Google Scholar]
  52. Yao, J.; Xu, N.; Wang, M.; Gong, P.; Lu, H.; Cao, Y.; Tang, X.; Mo, F. Promoting Global Surface Water Monitoring Research with the SWOT Satellite. Innov. Geosci. 2024, 2, 100099. [Google Scholar] [CrossRef]
  53. Zhu, H.; Meng, J.; Yao, J.; Xu, N. Feasibility of Emergency Flood Traffic Road Damage Assessment by Integrating Remote Sensing Images and Social Media Information. ISPRS Int. J. Geo-Inf. 2024, 13, 369. [Google Scholar] [CrossRef]
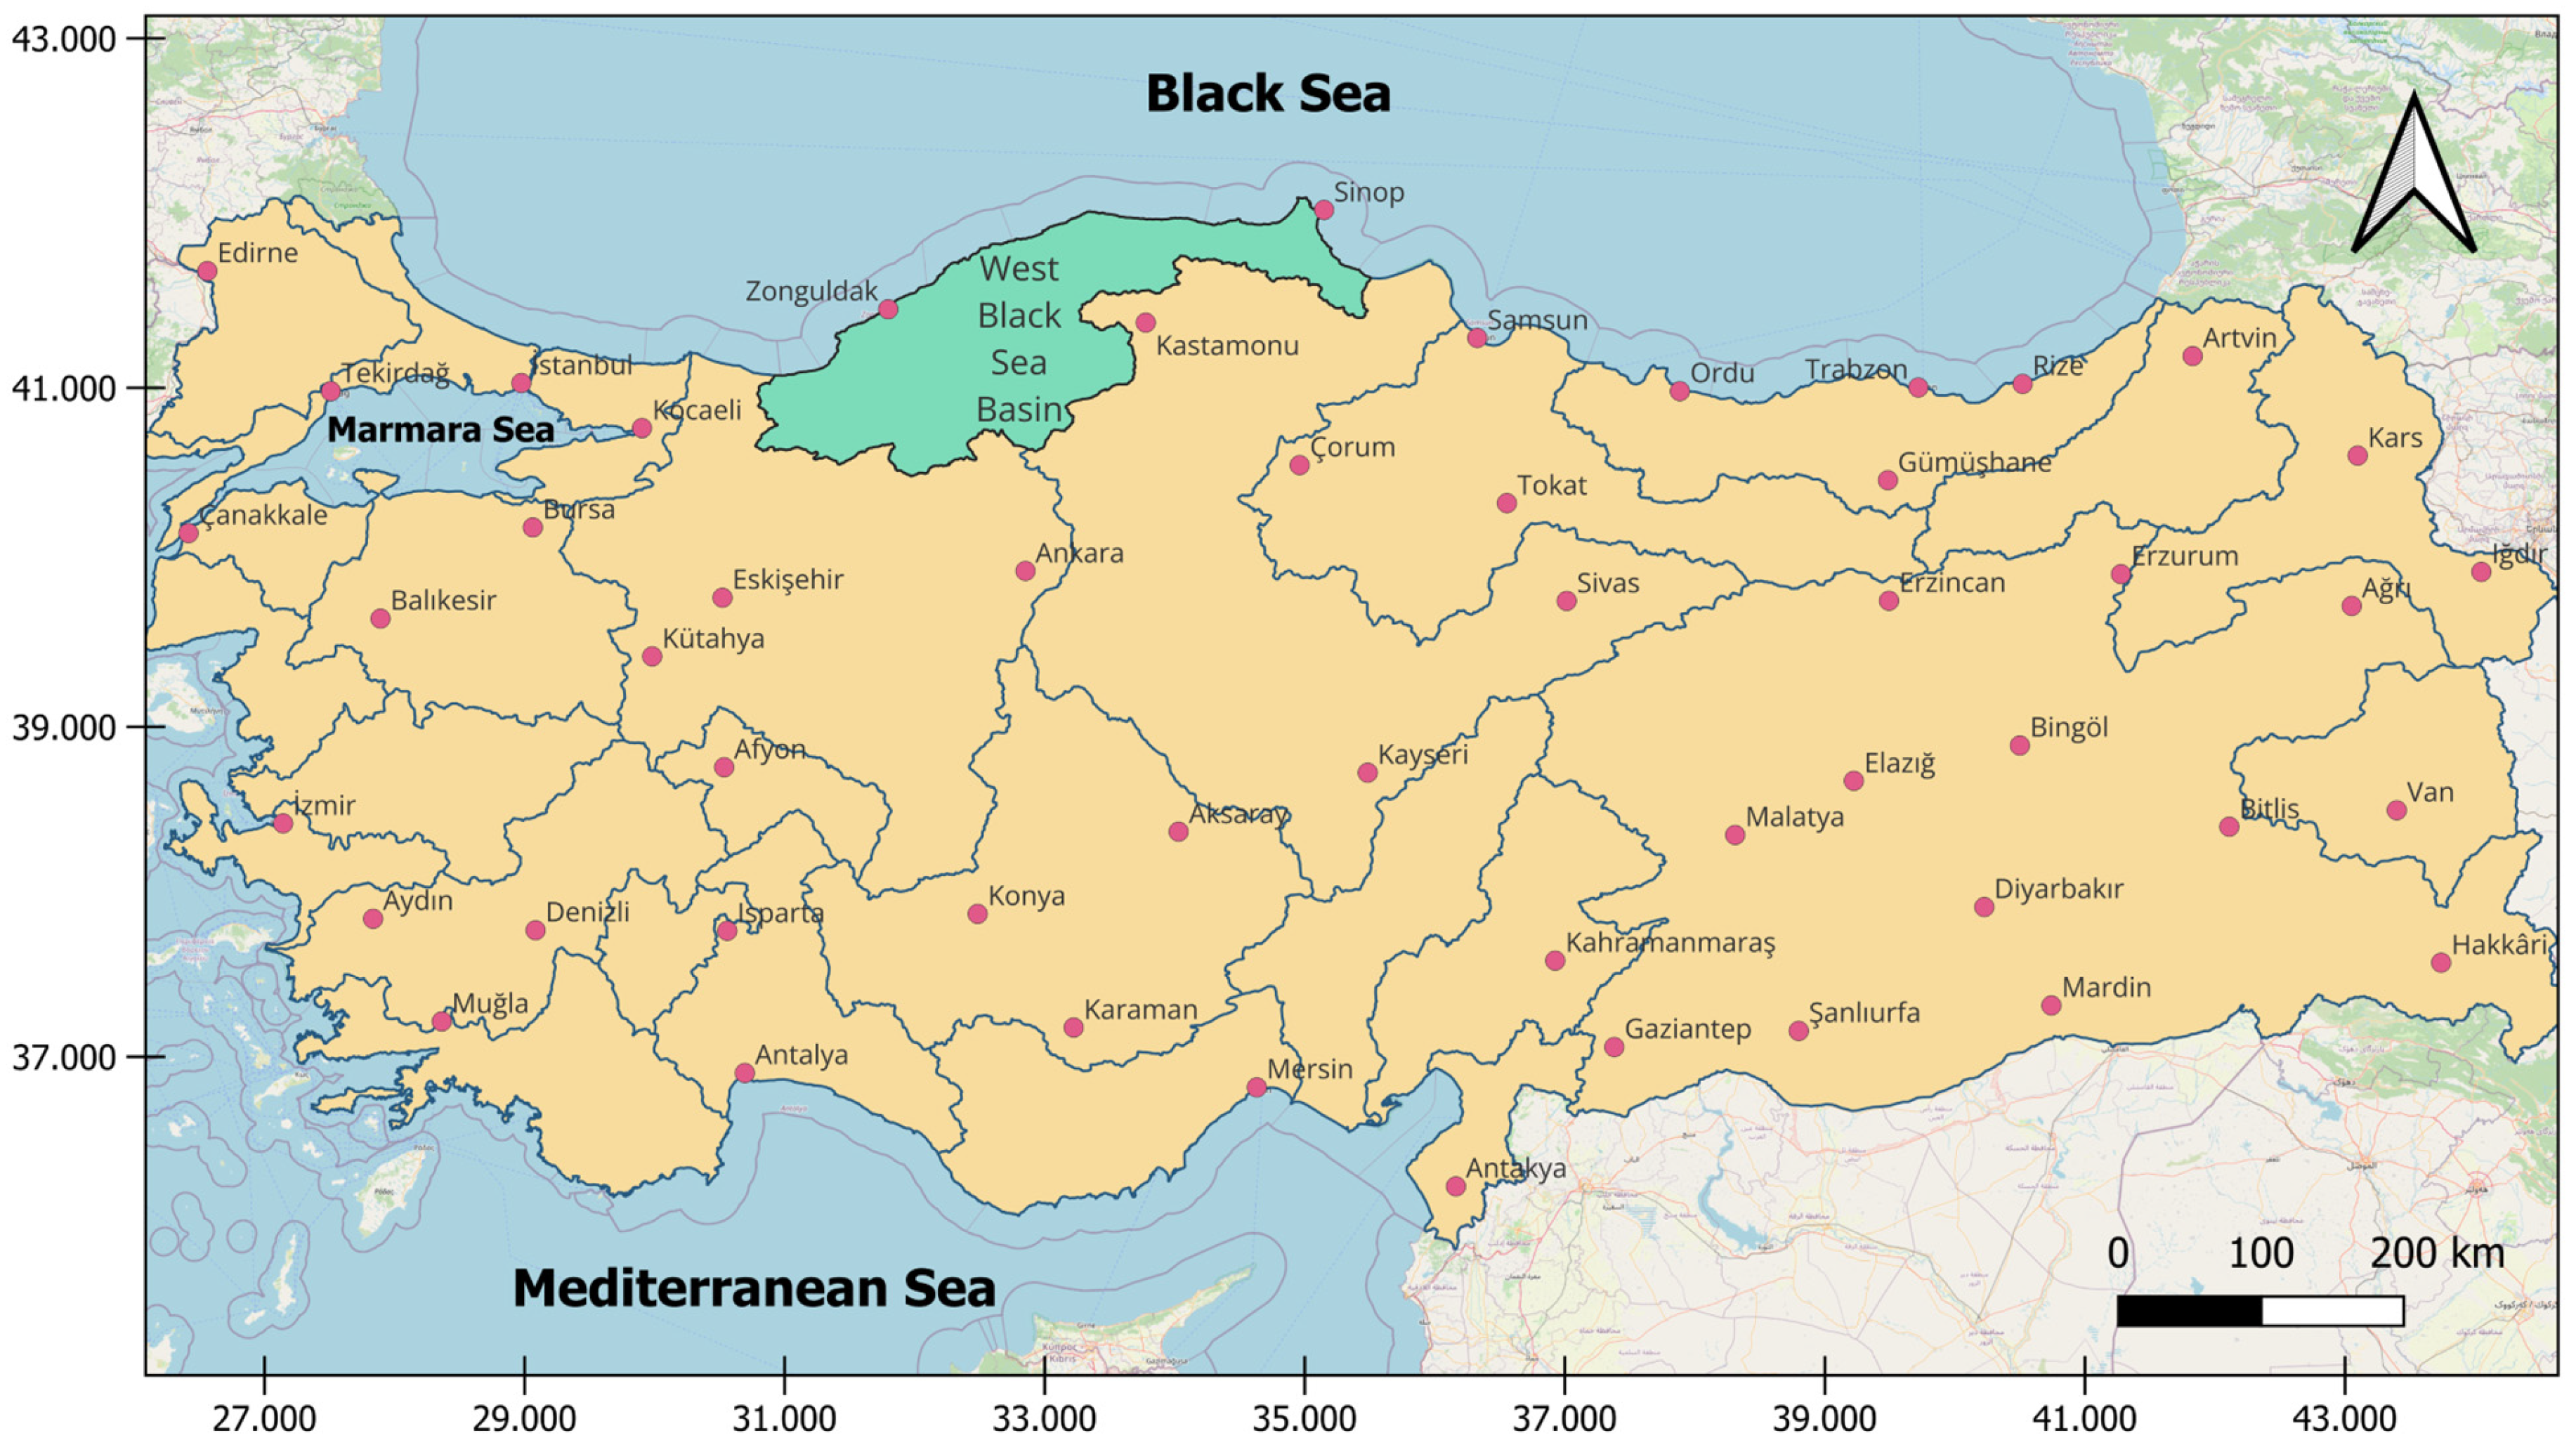
Figure 1. The location of the western Black Sea basin in Türkiye.
Geomatics 05 00046 g001
Figure 2. Western Black Sea basin and topographic map of the Bozkurt district. (a) Location of Bozkurt within the western Black Sea basin; (b) topographic map of Bozkurt centre.
Geomatics 05 00046 g002
Figure 3. Raster data used in the Ezine watershed. (a) DEM; (b) LULC map; (c) soil type map.
Geomatics 05 00046 g003
Figure 4. Unreal Engine Simulation workflow.
Geomatics 05 00046 g004
Figure 5. All HRUs and sub-basins generated in West Black Sea Basin. Sub-basin numbers are indicated with white numbers.
Geomatics 05 00046 g005
Figure 6. Visualization of the data transferred into Unreal Engine.
Geomatics 05 00046 g006
Figure 7. The vertical representations of the flood area. (a) Generated in the Unreal Engine; (b) The actual data.
Geomatics 05 00046 g007
Figure 8. Map of the average daily amount of water stored by basins. Sub-basin number are indicated with white numbers.
Geomatics 05 00046 g008
Figure 9. Water flow maps throughout the basin. (a) Minimum water flow; (b) Maximum water flow; (c) Average water flow.
Geomatics 05 00046 g009
Figure 10. Simulation of normal flow in Ezine River.
Geomatics 05 00046 g010
Figure 11. Extra flows caused by increased flow as a result of precipitation.
Geomatics 05 00046 g011
Figure 12. Determination of boundary points from flood images. (a) South-to-North view; (b) North-to-South view; (c) representation of selected points for accuracy analysis.
Geomatics 05 00046 g012
Table 1. Seasonal normals for Kastamonu province [39]. Seasonal normals were calculated using climate data for the study area between 2004 and 2024.
JanFebMarAprMayJunJulyAugSepOctNovDecYear
Average Temperature (°C)−0.61.14.89.514.217.720.520.516.211.24.90.710.1
Average Maximum Temperature (°C)3.66.911.517.021.725.328.829.124.618.711.24.816.9
Average Minimum Temperature (°C)−3.8−3.1−0.43.47.711.013.013.19.55.90.5−2.44.5
Average Sunshine Duration (hour)2.03.44.15.46.47.48.88.66.44.83.51.85.2
Average Number of Rainy Days12.2310.7712.3712.8014.4012.606.736.107.179.379.0712.07125.7
Average Monthly Total Rainfall (mm) 29.428.138.550.577.989.636.038.238.734.827.536.1525.3
Table 2. Base maps and data used for the modelling.
ParameterExplanationSourceData TypeSpatial Resolution/Scale
Amount of precipitationDaily precipitation amount.Turkish Meteorological General DirectoratePoint
TemperatureAverage temperature data by season.Turkish Meteorological General DirectoratePoint
Digital Elevation ModelHeight information of the terrain.NASARaster12.5 m
Building Heights and ModelsIncludes building heights and shapes.OSMVector
Land Use Land Cover MapLand use and land cover data.ESRI Land CoverRaster10 m
Soil PropertiesSoil types, hydraulic conductivity, water retention.FAORaster1 km
HumidityAverage humidity data by season.Turkish Meteorological General DirectoratePoint
Table 3. The soil parameters used in the SWAT+ model.
ParameterExplanation
SOL_Z (Soil Depth)Indicates the depth of each soil layer in millimetres.
SOL_BD (Soil Volume Weight)Expresses the volume weight of each soil layer in grams/cm3.
SOL_AWC (Available Water Capacity):Indicates the available water capacity (%) of each soil layer.
SOL_K (Saturated Hydraulic Conductivity):Expresses the saturated hydraulic conductivity of each soil layer in mm/h.
SOL_CBN (Soil Organic Carbon Content):Indicates the amount of organic carbon in each soil layer in %.
CLAY (Clay Content):Indicates the clay content in each soil layer in %.
SILT (Silt Content):Indicates the silt content in each soil layer in %.
SAND (Sand Content):Indicates the sand content in each soil layer in %.
ROCK (Rock Content):Indicates the rock content in each soil layer in %.
SOL_ALB (Soil Surface Albedo Value)Indicates the reflectivity of the soil surface.
USLE_K (USLE Erosion Coefficient)Specifies the soil erosion coefficient for the Universal Soil Loss Equation (USLE).
SOL_EC (Soil Electrical Conductivity)Indicates the salinity of each soil layer in dS/m.
Table 4. Hydrological parameters used in the SWAT+.
ParameterValue
Sub-basin area98.59 km2
Sub-basin perimeter length18.83 km
Total basin perimeter163.74 km
Stream length within the sub-basin3.15 km
Total basin area408.41 km2
Total stream length220.80 km
Table 5. Hydrodynamic parameters used in the UE simulation [49].
UE ParameterSymbolValueUnitExplanation
Gravityg9.81 (↓ Z)m s−2 It   applies   a   vertical   body   force   to   the   fluid   mass ;   the   Froude   number   F r   =   U / g   L defines the flow regime.
Particle Density ρ 01000kg m−3 The   fundamental   input   of   mass   conservation   t ρ + ρ u = 0   and   linear   EoS   p = k ρ ρ 0
Viscosityν1 × 10⁻⁶m2 s−1 The   momentum   diffusion   term   ν 2 u ;   the   turbulence   scale   is   evaluated   with   the   Reynolds   number   R e = U   L ν
Surface Tensionσ0.005N m−1 The   pressure   jump   Δ p   =   σ κ ;   Weber   number   W e = ρ U 2 L / σ descibes the small-scale wave behaviour.
Maximum Velocityumax2.0m s−1 Safety   buffer   for   Courant   condition   C = u   Δ t / Δ x 1 ; stability is maintained by trimming very large speeds.
Minimum Velocityumin0.01m s−1It decreases computational load by counting very low speeds as “0”.
Disclaimer/Publisher’s Note: The statements, opinions and data contained in all publications are solely those of the individual author(s) and contributor(s) and not of MDPI and/or the editor(s). MDPI and/or the editor(s) disclaim responsibility for any injury to people or property resulting from any ideas, methods, instructions or products referred to in the content.