1. Introduction
The
Moringa oleifera Lam., also commonly known as the horseradish or “drumstick” tree, is often referred to as a miracle multi-purpose tree due to, inter alia, its beneficial role in enhancing food and nutrition security, its use as livestock feed or as a soil ameliorant, its unique medicinal properties and use in alternative medicine, water purification abilities, and the fact that it is highly drought-tolerant [
1,
2,
3,
4,
5]. While
M. oleifera is native to the northern Indian sub-Himalayan belt, it is widely distributed and cultivated throughout the world due to its multiplicity and adaptability [
1,
2,
3,
4,
5].
From a South African perspective, the cultivation of
M. oleifera has steadily increased over the past decade, and interest in the crop continues to rise due to its potential to address food and nutrition insecurity, particularly in marginalized communities [
3]. Considering the growing interest in the large-scale cultivation of
M. oleifera, there is a need to improve upon the understanding of the optimal conditions required for its growth. Although
M. oleifera has been described as a drought-tolerant tree [
1], its biomass production in relation to water availability has not been well studied [
6].
Subsequently, the accurate estimation of
M. oleifera water use under varying growing conditions is required to improve upon and guide decision-making pertaining to the growth and management of this crop. There are several in situ-based approaches, such as scintillometry, eddy covariance, surface renewal, evaporation pans, and lysimetry, which can be utilized to measure crop water use [
7,
8]. However, these techniques are largely constrained by their limited spatio-temporal representation and implementation costs, which restrict their widespread application for crop water use estimation [
7,
8,
9,
10]. Remote sensing-based approaches present a viable alternative to traditional evapotranspiration (ET) estimation techniques and have featured quite prominently over the past couple of decades, particularly as the agricultural sector begins to embrace the fourth industrial revolution [
7,
8,
9,
11,
12].
While several remote sensing-based ET estimation techniques exist, methods based on the surface energy balance, such as the Surface Energy Balance System (SEBS), Surface Energy Balance Algorithm for Land (SEBAL), Mapping Evapotranspiration at High Spatial Resolution with Internalized Calibration (METRIC), Atmosphere–Land Exchange Inverse (ALEXI), Two-Source Surface Energy Balance (TSEB), and Operational Simplified Surface Energy Balance (SSEBop) models, are among the most frequently applied [
10,
13,
14,
15]. Despite these models being successfully applied in several studies to accurately estimate terrestrial fluxes and ET, they require sufficient user expertise, access to meteorological data, and computational resources to store and process large volumes of data [
8,
9,
10,
12,
16,
17].
To address these limitations, several studies have leveraged the processing capabilities of cloud computing infrastructure and access to readily available remote sensing and global meteorological data to develop semi-automated and automated open-access ET processing tools for expert and non-expert users alike [
8,
10,
17,
18,
19,
20,
21]. Among the various open-access ET processing tools, Earth Engine Evapotranspiration Flux (EEFlux) is arguably the most widely utilized and studied. EEFlux, also commonly referred to as METRIC-EEFlux, is a web-based automated version of the METRIC model which operates on the Google Earth Engine cloud computing platform (
https://eeflux-level1.appspot.com/, accessed on 3 November 2024). EEFlux is able to rapidly process individual (thermally equipped) Landsat scenes for any period between 1984 and the present day [
8,
9,
14]. Gridded-weather data from the North-American Land Data Assimilation System (NLDAS) for the United States of America or National Centers for Environmental Prediction Climate Forecast System Version 2 (CFSV2) for the rest of the world are used to calibrate the surface energy balance for each scene in order to provide 30 m spatial resolution estimates of ET and terrestrial variables such as land surface temperature, normalized difference vegetation index, and albedo for most regions throughout the world [
9].
Considering that detailed information on M. oleifera water use is not readily available and can be challenging to obtain, particularly in resource-poor regions, this study aims to explore the potential of utilizing EEFlux to acquire estimates of water use for M. oleifera grown commercially in a semi-arid region of South Africa.
The specific objectives of this study were to (i) measure M. oleifera crop evapotranspiration using an eddy covariance flux tower; (ii) compare the EEFlux ET estimates against in situ ET measurements to evaluate the accuracy of the modeled estimates; and (iii) ascertain whether this cloud-based remote sensing tool can be used to facilitate improved planning and management decisions pertaining to the water use of M. oleifera.
2. Materials and Methods
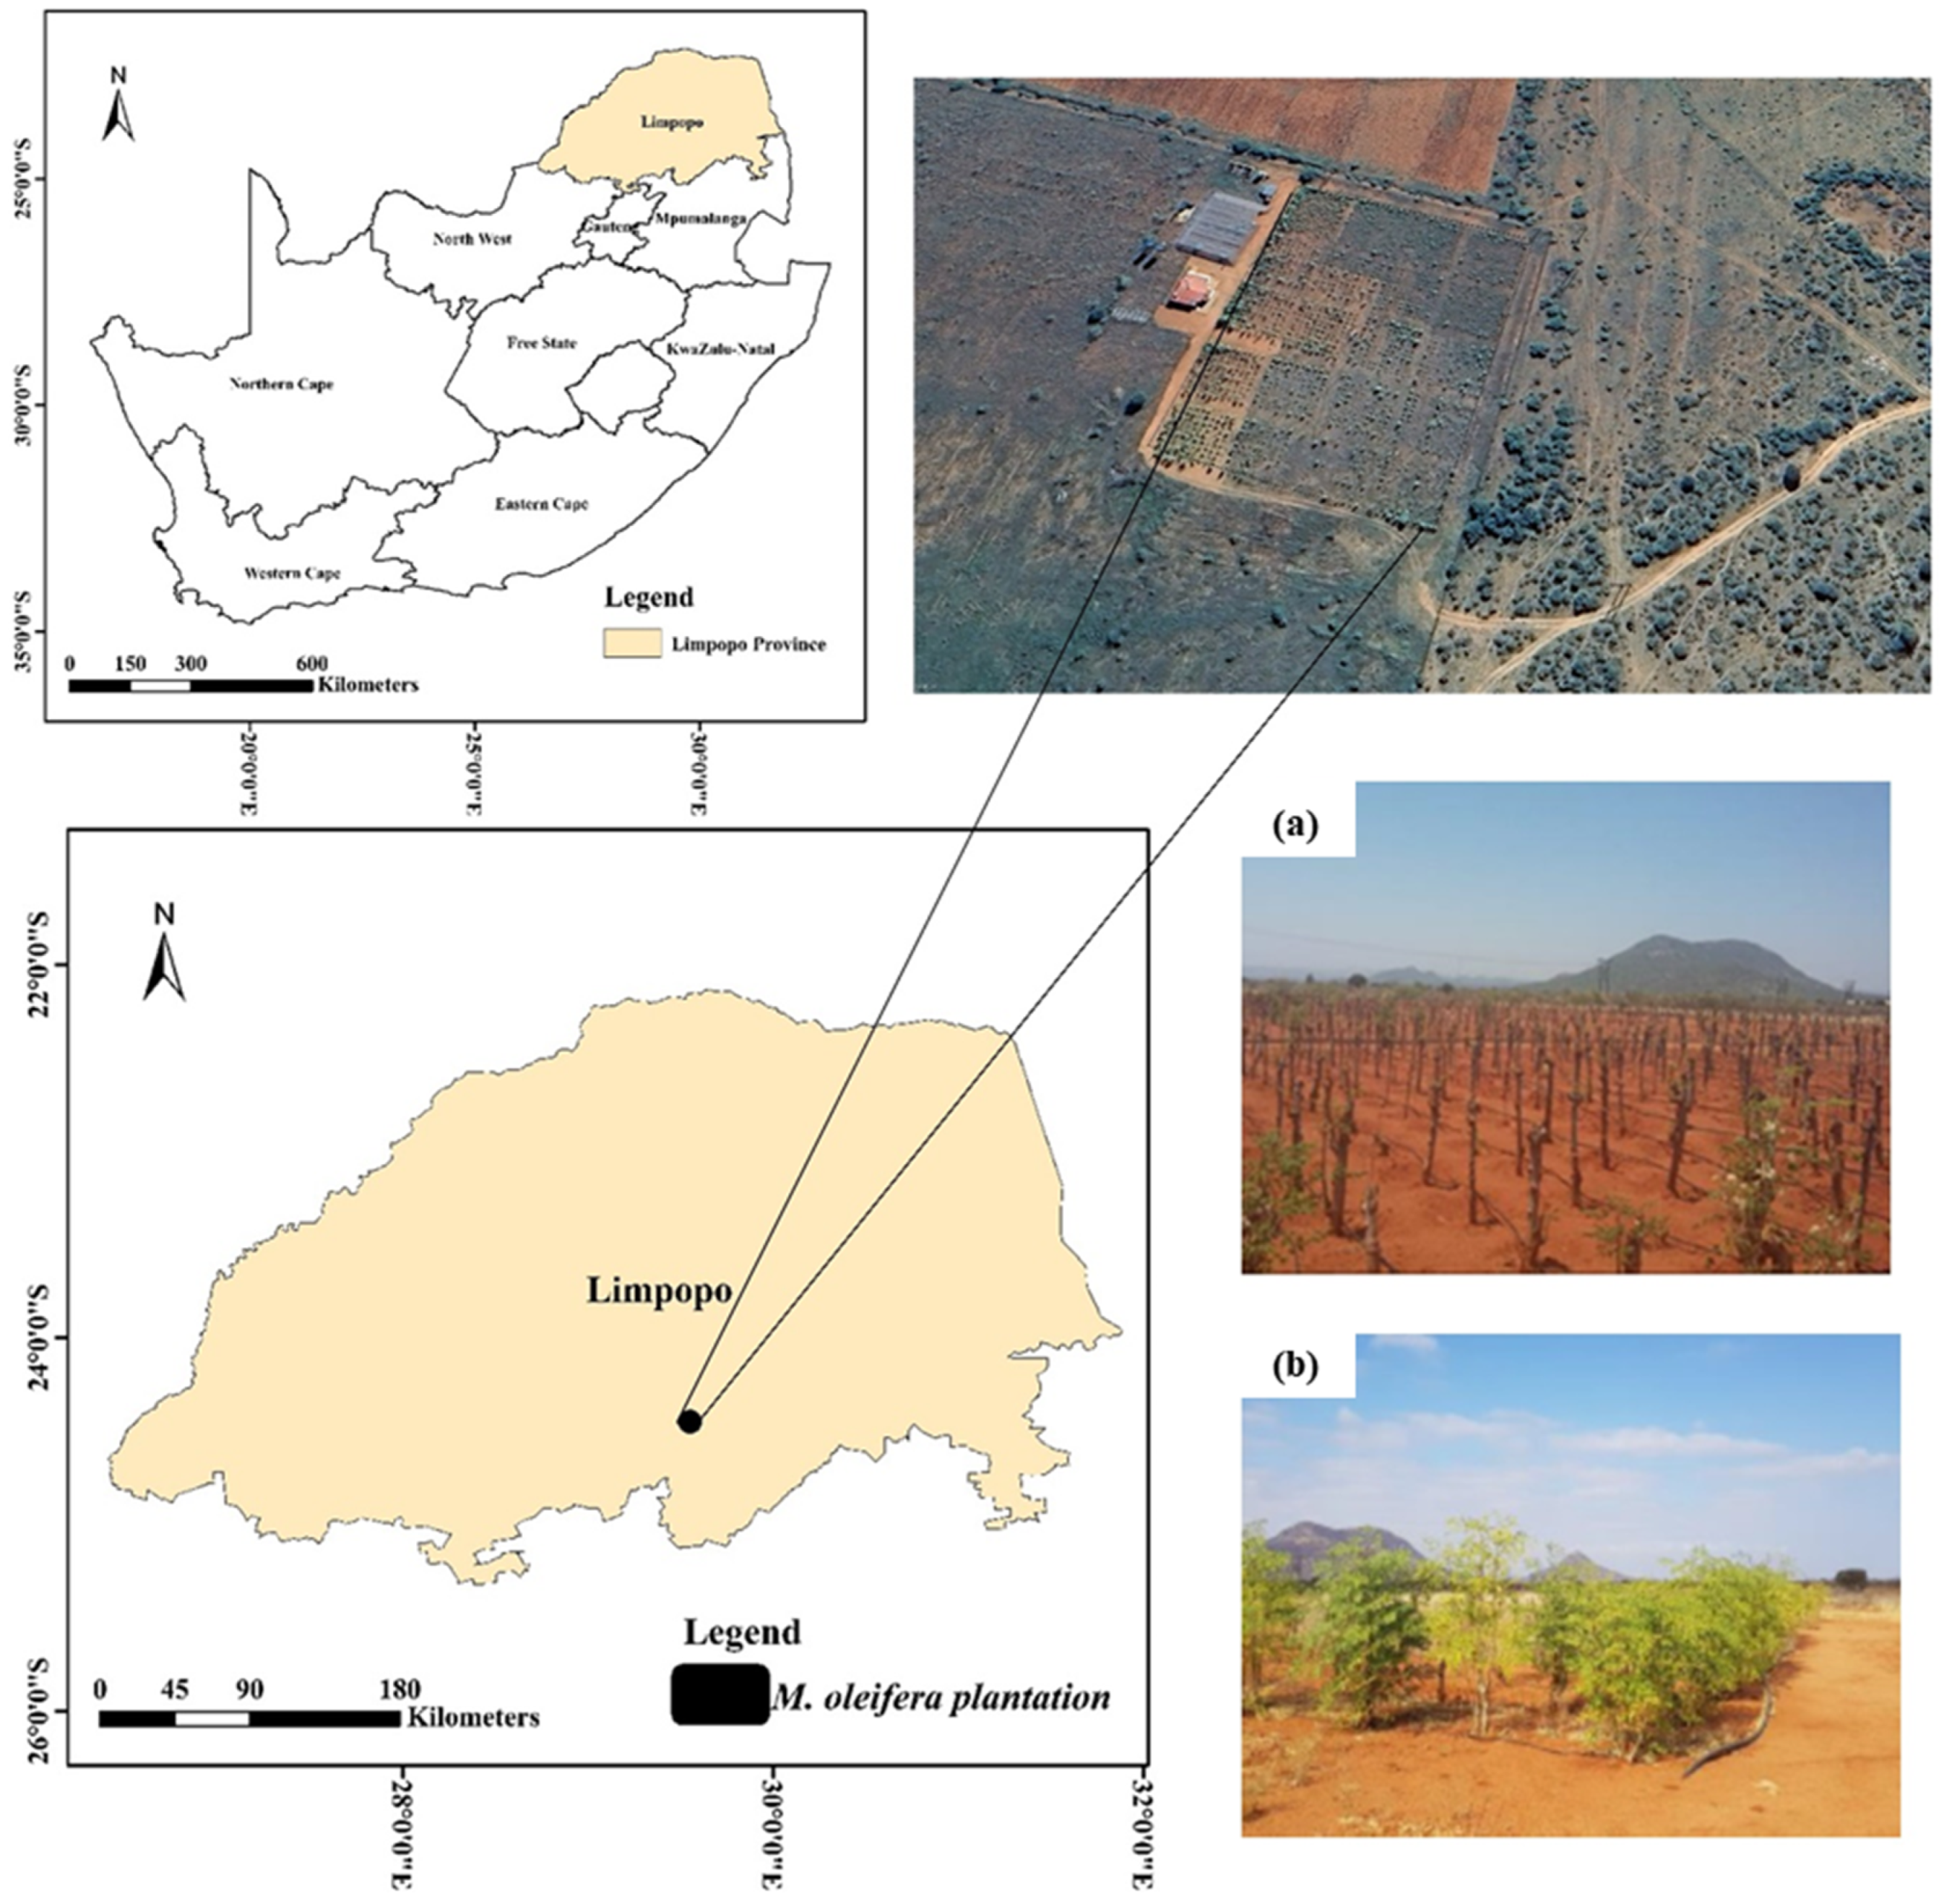
This study was conducted on a commercial farm in the village of Tooseng situated within the Capricorn District Municipality in the Limpopo Province of South Africa (
Figure 1). This region experiences a semi-arid climate with hot wet summers and mild dry winters. The mean annual precipitation (MAP) is approximately 650 mm and falls mainly within the summer months between November and January. The mean annual reference evapotranspiration generally exceeds MAP by approximately two-fold (1320 mm). The mean monthly minimum and maximum temperatures range from 1.65 to 16.71 and 20.40 to 28.32 °C, respectively. The
M. oleifera plantation (cultivar PKM-1) was established in 2013 and spans an area of approximately 1.4 ha (120 m × 120 m). The soil texture within the farm is a loamy sand, with 78–84% sand, 2–4% silt, and 14–18% clay. Trees were planted at a spacing of 2 m × 2 m and irrigated by means of a drip irrigation system, with one emitter per tree delivering 1.6 L.h
−1.
An eddy covariance (EC) flux tower was installed within the M. oleifera plantation (24°26′59″ S, 29°32′58″ E) to measure the components of the shortened energy balance (Equation (1)), crop ET, air temperature, relative humidity, wind speed, and direction for the period of 1 November 2022–31 May 2023. The EC system comprised an integrated EC 150 open-path H2O/CO2 gas analyzer and a three-dimensional sonic anemometer (EC 150; Campbell Scientific Inc., Logan, UT, USA). These sensors were mounted on a 6 m tower approximately 1.50 m above the M. oleifera canopy. Additional measurements included air temperature and relative humidity (Campbell Scientific Inc., Logan, UT, USA), net radiation (NR-Lite net radiometer; Kipp and Zonen, Delft, the Netherlands), soil heat flux (HFT-S, REBS, Seattle, WA, USA), soil temperature averaging probes (Campbell Scientific Inc., Logan, UT, USA), and volumetric water content sensors (CS616; Campbell Scientific Inc., Logan, UT, USA). The ground heat flux was determined using the calorimetric method which combines the soil heat flux measured at a depth of 0.08 m with the change in heat storage measured above the soil heat flux plates (0.02 and 0.06 m).
All measurements were captured by a CR5000 data logger (Campbell Scientific Inc., Logan, UT, USA) and sampled at a frequency of 10 Hz and then processed to produce 30 min averages. The 30 min data were then aggregated to provide daily estimates of ET (
ETEC), which were then used as a basis for comparison against the EEFlux ET estimates. The EEFlux platform (version 0.20.17) was utilized to access estimates of ET: (i) grass reference evapotranspiration (
ET0), which is a hypothetical reference surface for which evapotranspiration can be estimated using its known physiological characteristics and climatic data, and (ii) the fraction of grass reference evapotranspiration (
ET0F), which is similar to the grass reference-based crop coefficient and is used as a multiplying factor to relate the
ET0 to a crop of interest. Data were collected for the period corresponding to the in situ data collection period. To limit the effects of cloud contamination and scan-line correction errors (Landsat 7), only Landsat 8 and 9 Operational Land Imager (OLI) and Thermal Infrared Sensor (TIRS) Level 2 Collection 2 images (
n = 18) possessing 20% or less cloud cover were considered. In order to download the images for further analyses, users are only required to specify the date range and their region of interest. Thereafter, a list of available images and associated products is provided which the user can then select for download in a GeoTiff format. In total, 13 images were downloaded and analyzed. EEFlux estimates ET as a residual of the surface energy balance [
22,
23], according to Equation (1).
where
LE is the latent heat flux (W m
−2),
Rn is the net radiation (W m
−2),
G is the ground heat flux (W m
−2), and
H is the sensible heat flux (W m
−2).
The instantaneous ET at the time of satellite overpass (
ETinst) for each pixel is calculated according to Equation (2).
where
ETinst is in mm h
−1,
LEinst is the latent heat flux at the time of satellite overpass, λ is the latent heat of vaporization (J kg
−1), and ρ
w is the density of water (~1000 kg m
−3).
ET0F is determined as the ratio of
ETinst and the hourly grass reference evapotranspiration (
ET0Fh), according to Equation (3).
Assuming that
ET0F remains constant throughout the day, ET (mm d
−1) can be estimated according to Equation (4).
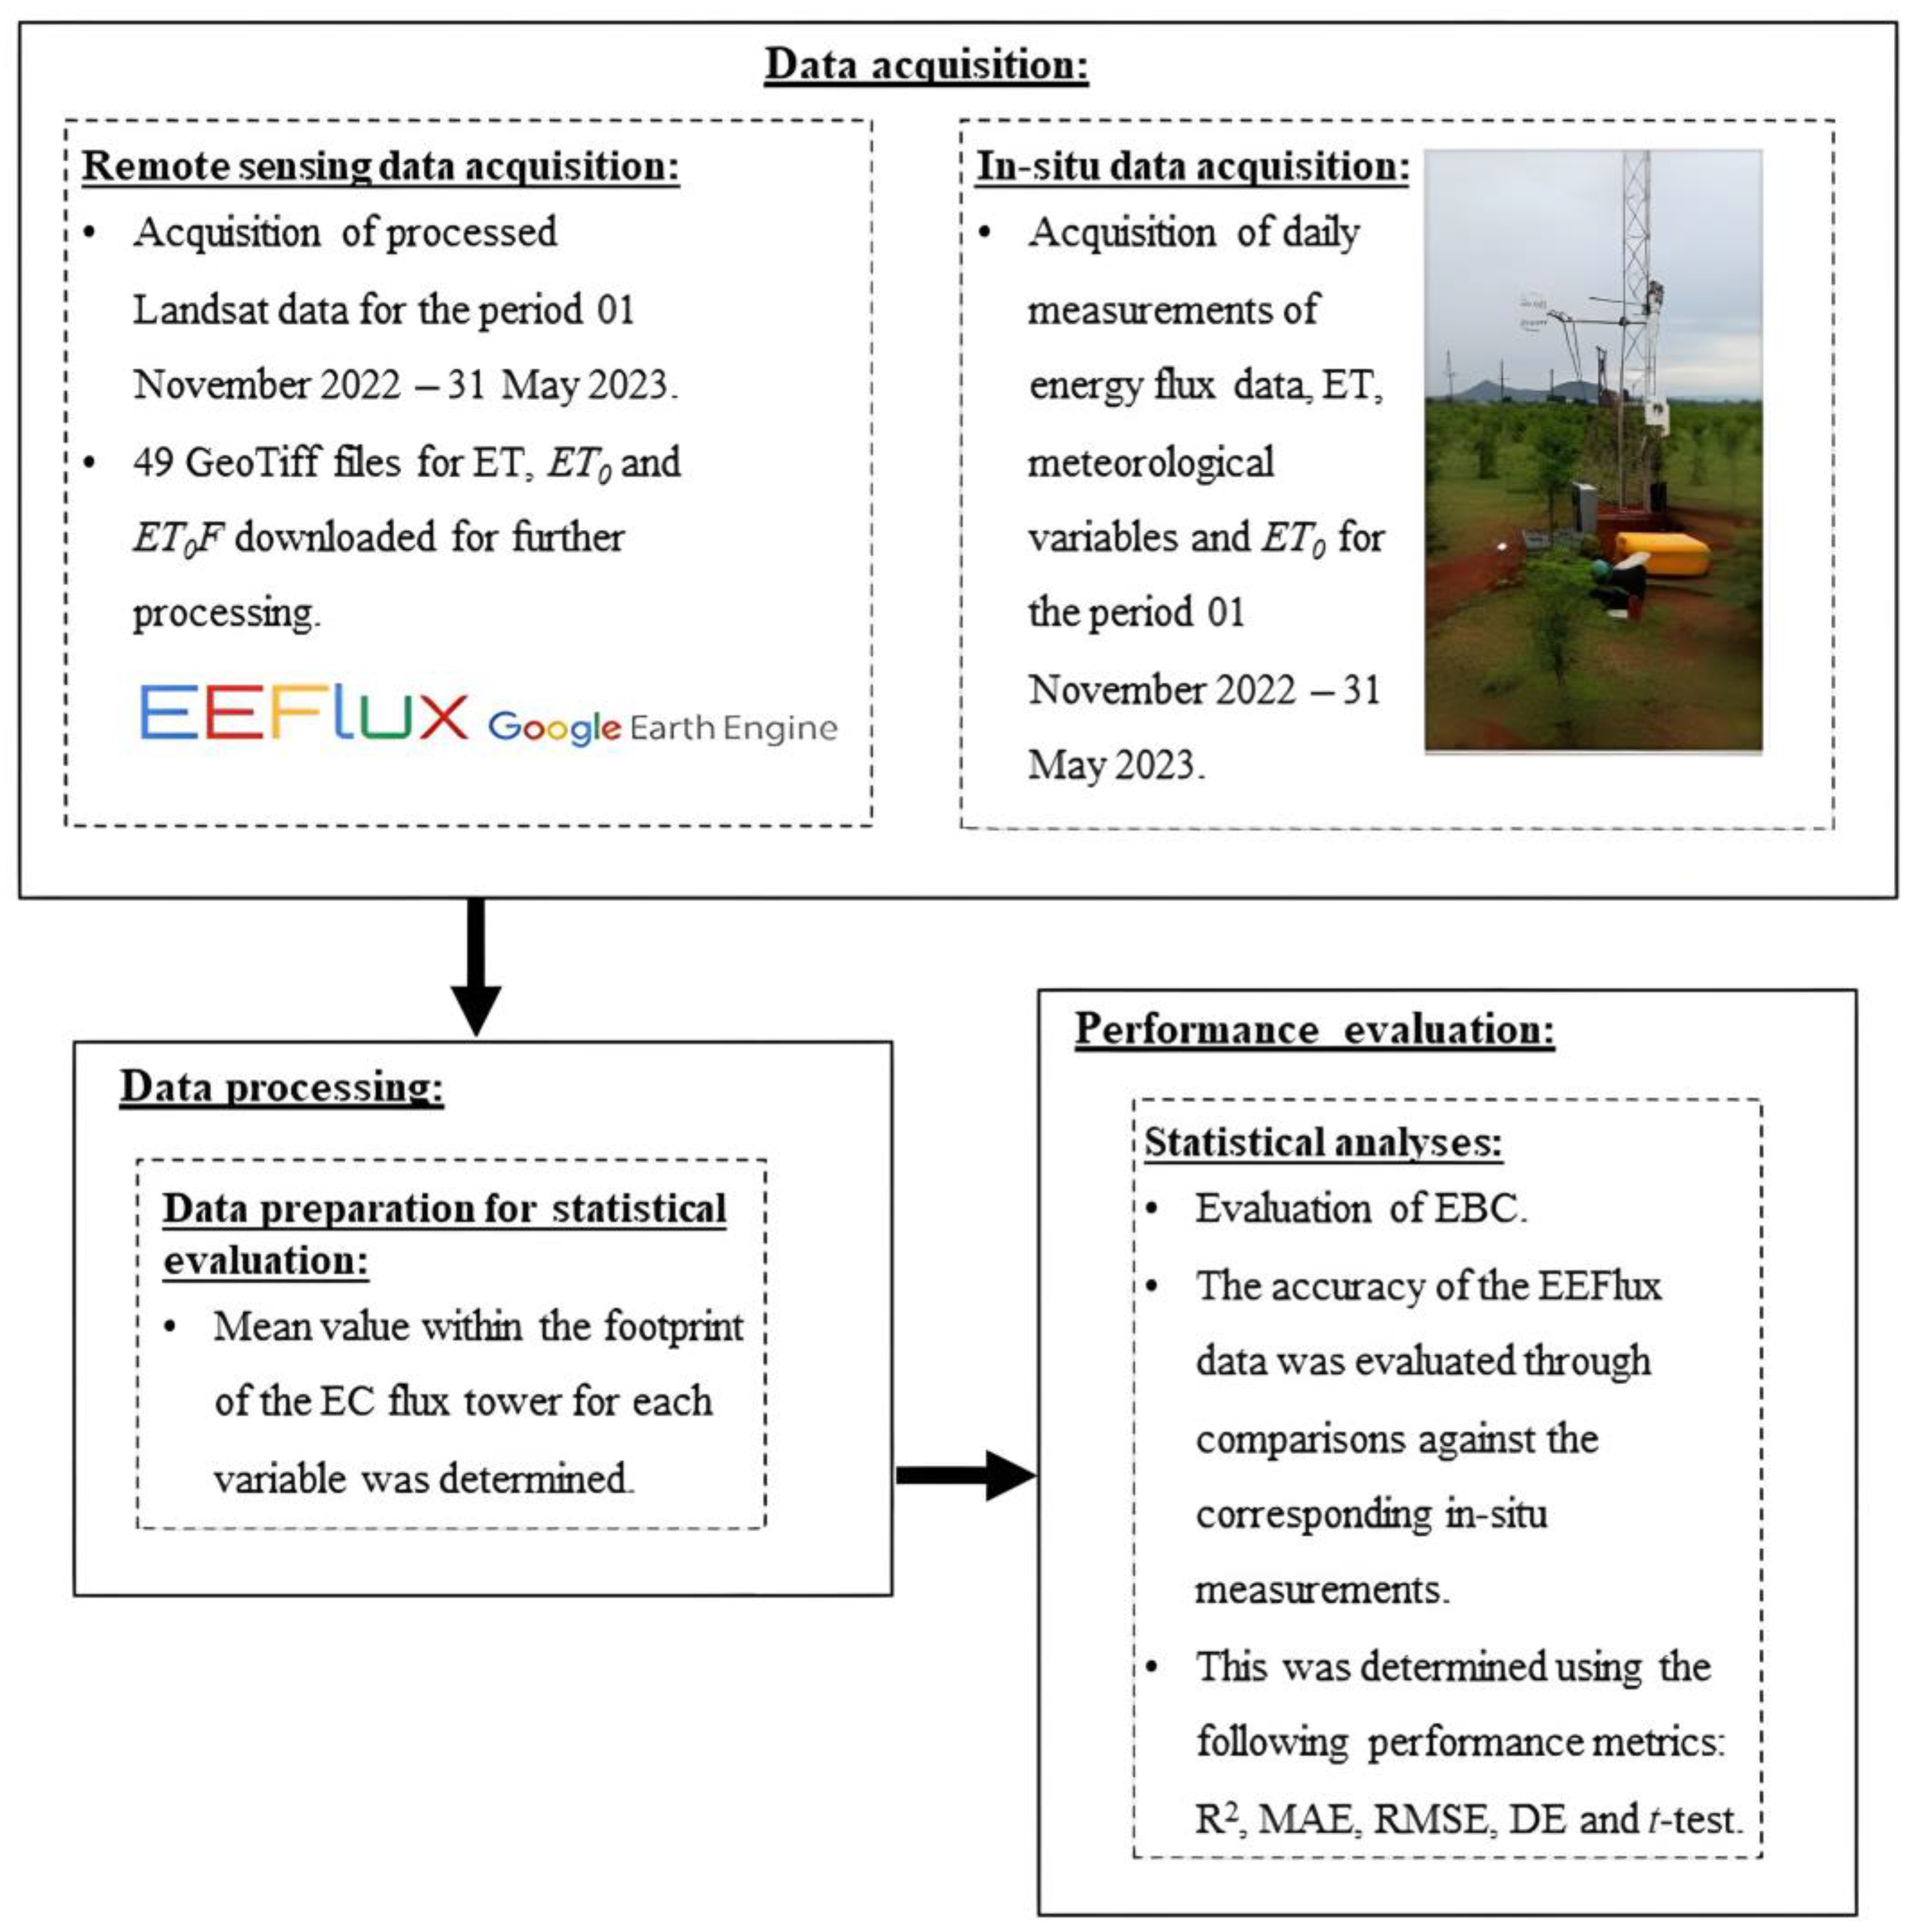
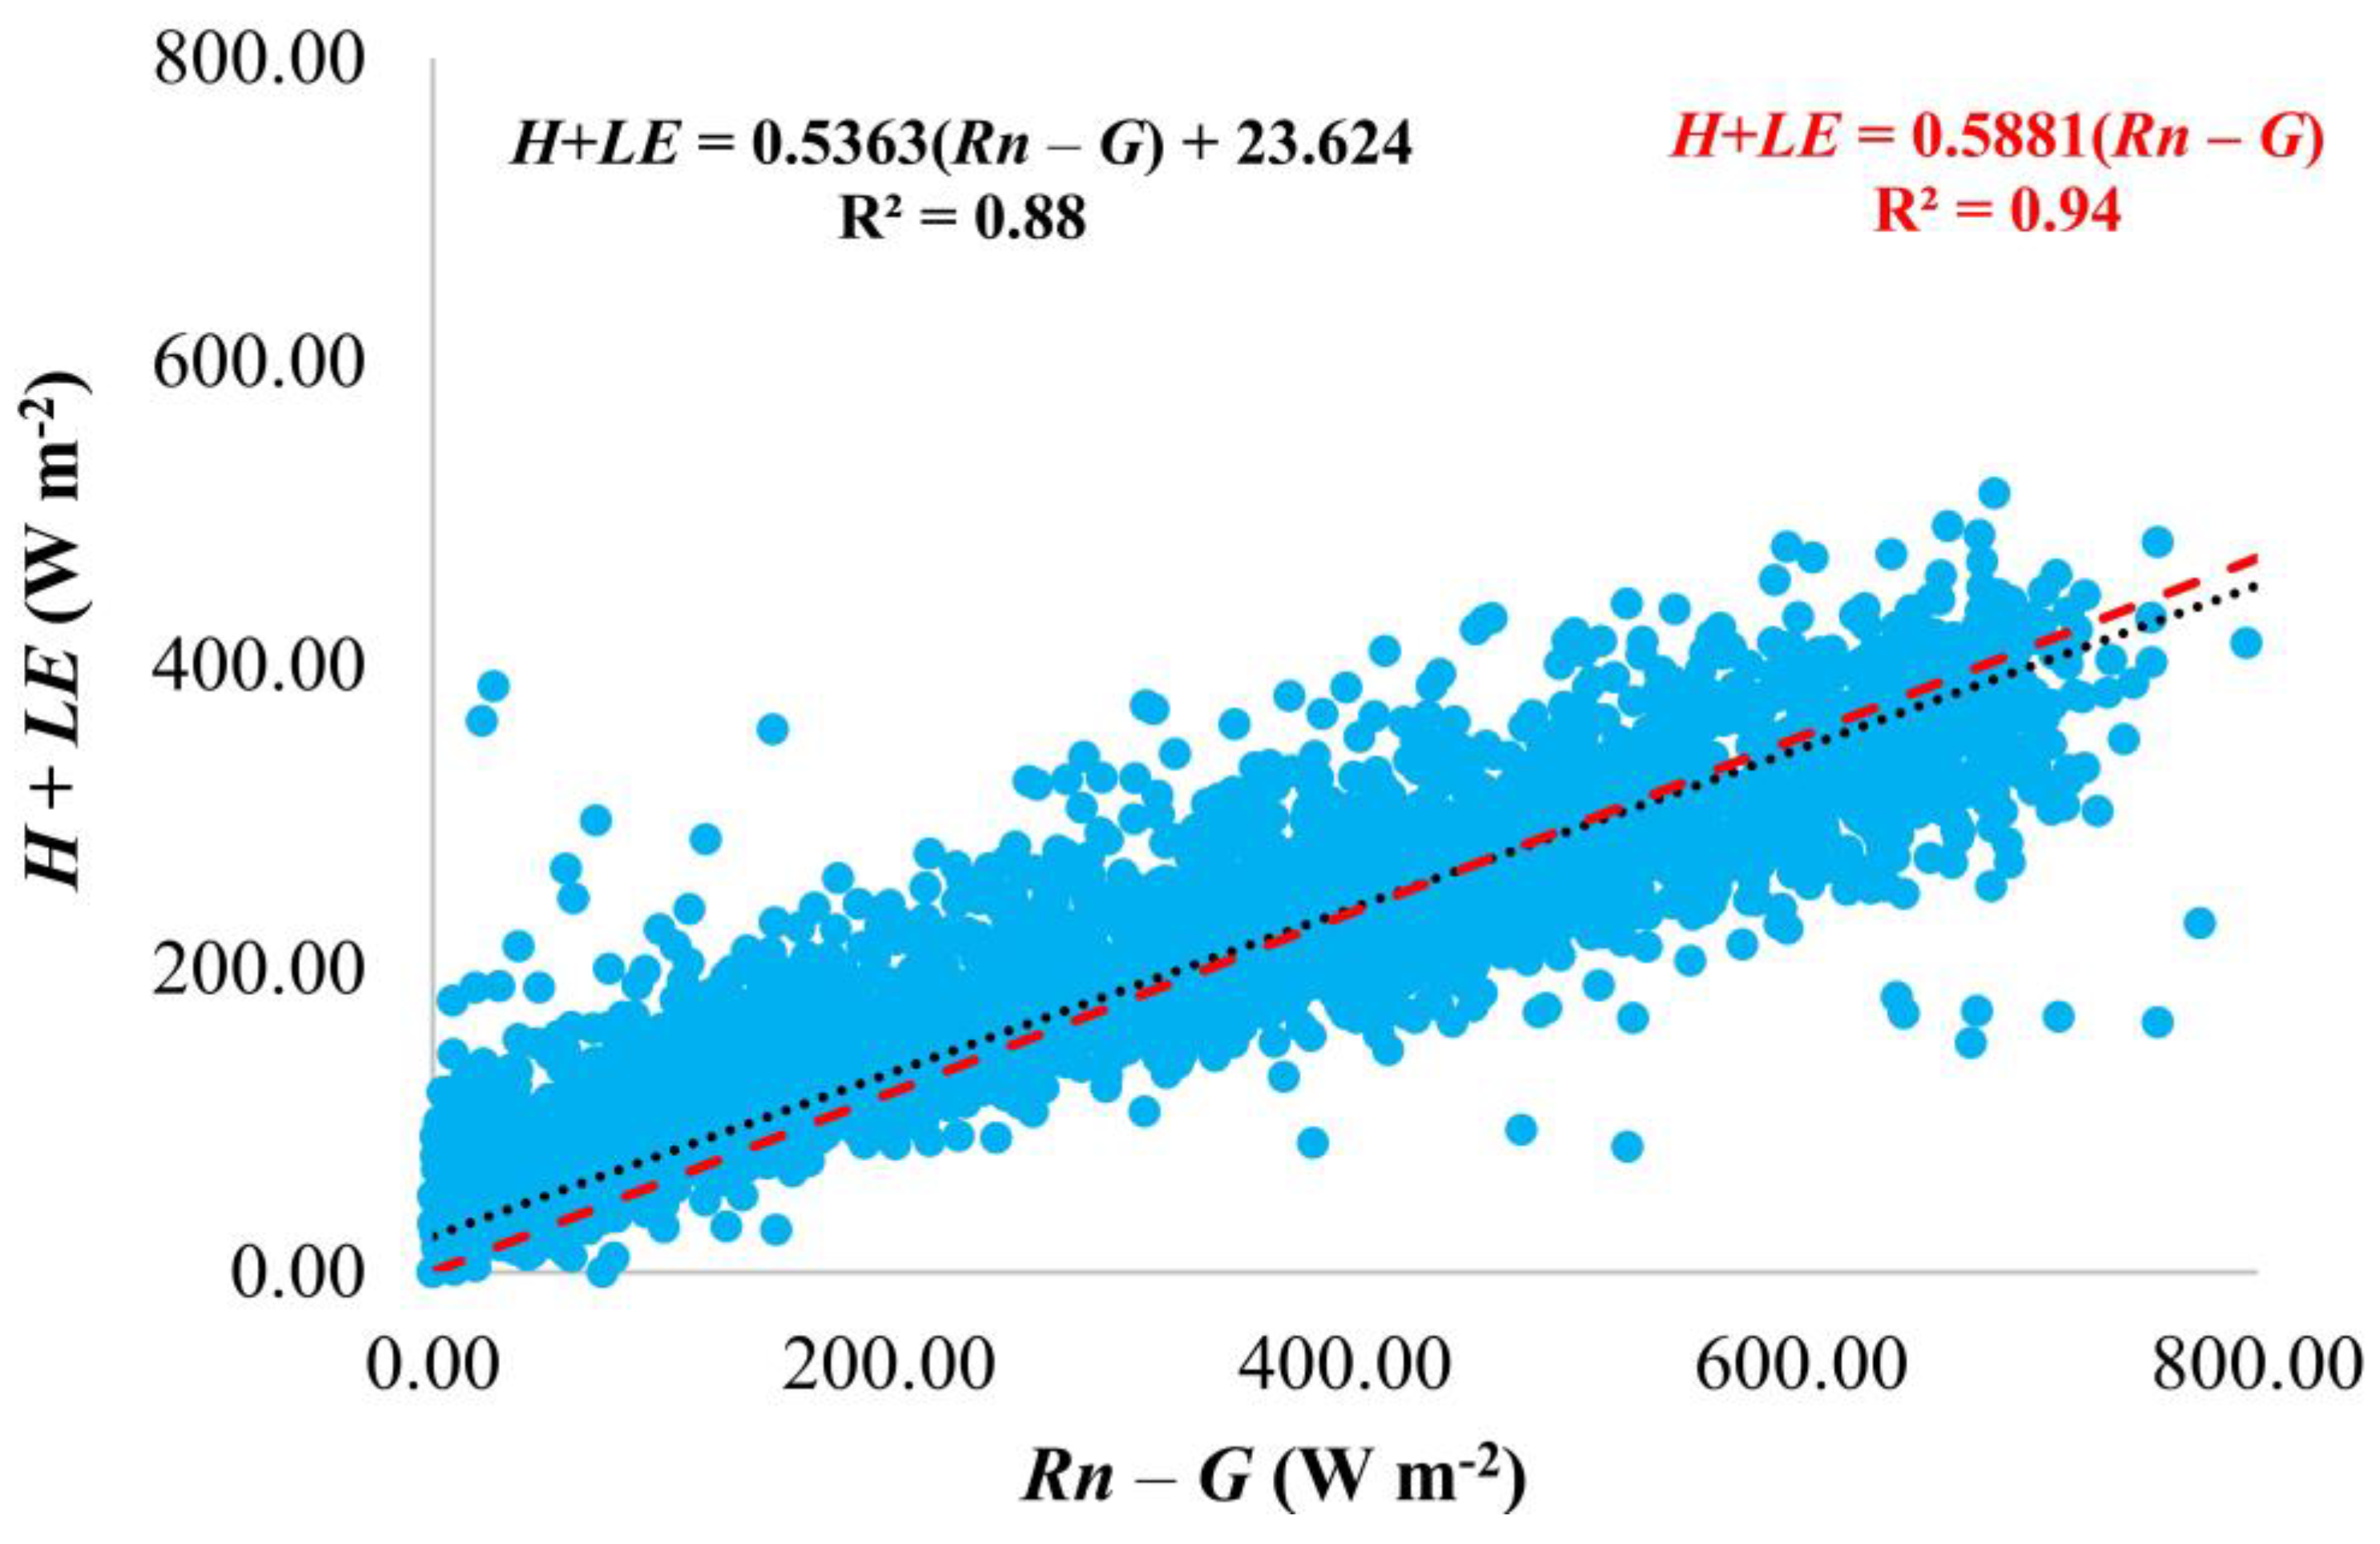
Following the acquisition of ET, ET0, and ET0F using EEFlux, the average value for each of these variables was determined within the area matching the approximate size of the EC flux tower footprint. In order to quantify the accuracy of the EC measurements, two statistical methods were employed to evaluate the energy balance closure (EBC). The first method involved performing a linear regression between the sum of the turbulent fluxes (H + LE) and the available energy (Rn − G). The coefficients of this regression (slope and intercept) are used to determine the degree of closure, with a straight line possessing a slope of 1 and passing through the origin, indicating perfect closure.
For this purpose, a linear regression was performed for the 30 min, as well as for the daily averages of the 30 min data. The second method which we employed to evaluate EBC was to determine the energy balance ratio (Equation (5)). The energy balance ratio (EBR) was determined for both the 30 min data and for the daily averages of the 30 min data, whereby an EBR of 1 indicates perfect closure.
The EEFlux estimates of ET (ET
EEFlux) and global
ET0 (
ET0global) were evaluated against the corresponding in situ measurements using the following performance metrics: coefficient of determination (R2), mean absolute error (MAE), root mean square error (RMSE), relative volume error (RVE), and
t-test (95% confidence level). A conceptual representation of the adopted methodology is shown in
Figure 2.
4. Discussion
The availability of open-access and open-source processing tools such as EEFlux can potentially provide spatially and temporally explicit data, which are crucial to guiding planning and decision-making pertaining to agricultural and water resource management practices [
9,
15]. Despite its global applicability and ease of application, it is of equal importance to quantify and understand the uncertainties associated with these tools and the accuracy of the data that they provide, especially at localized scales [
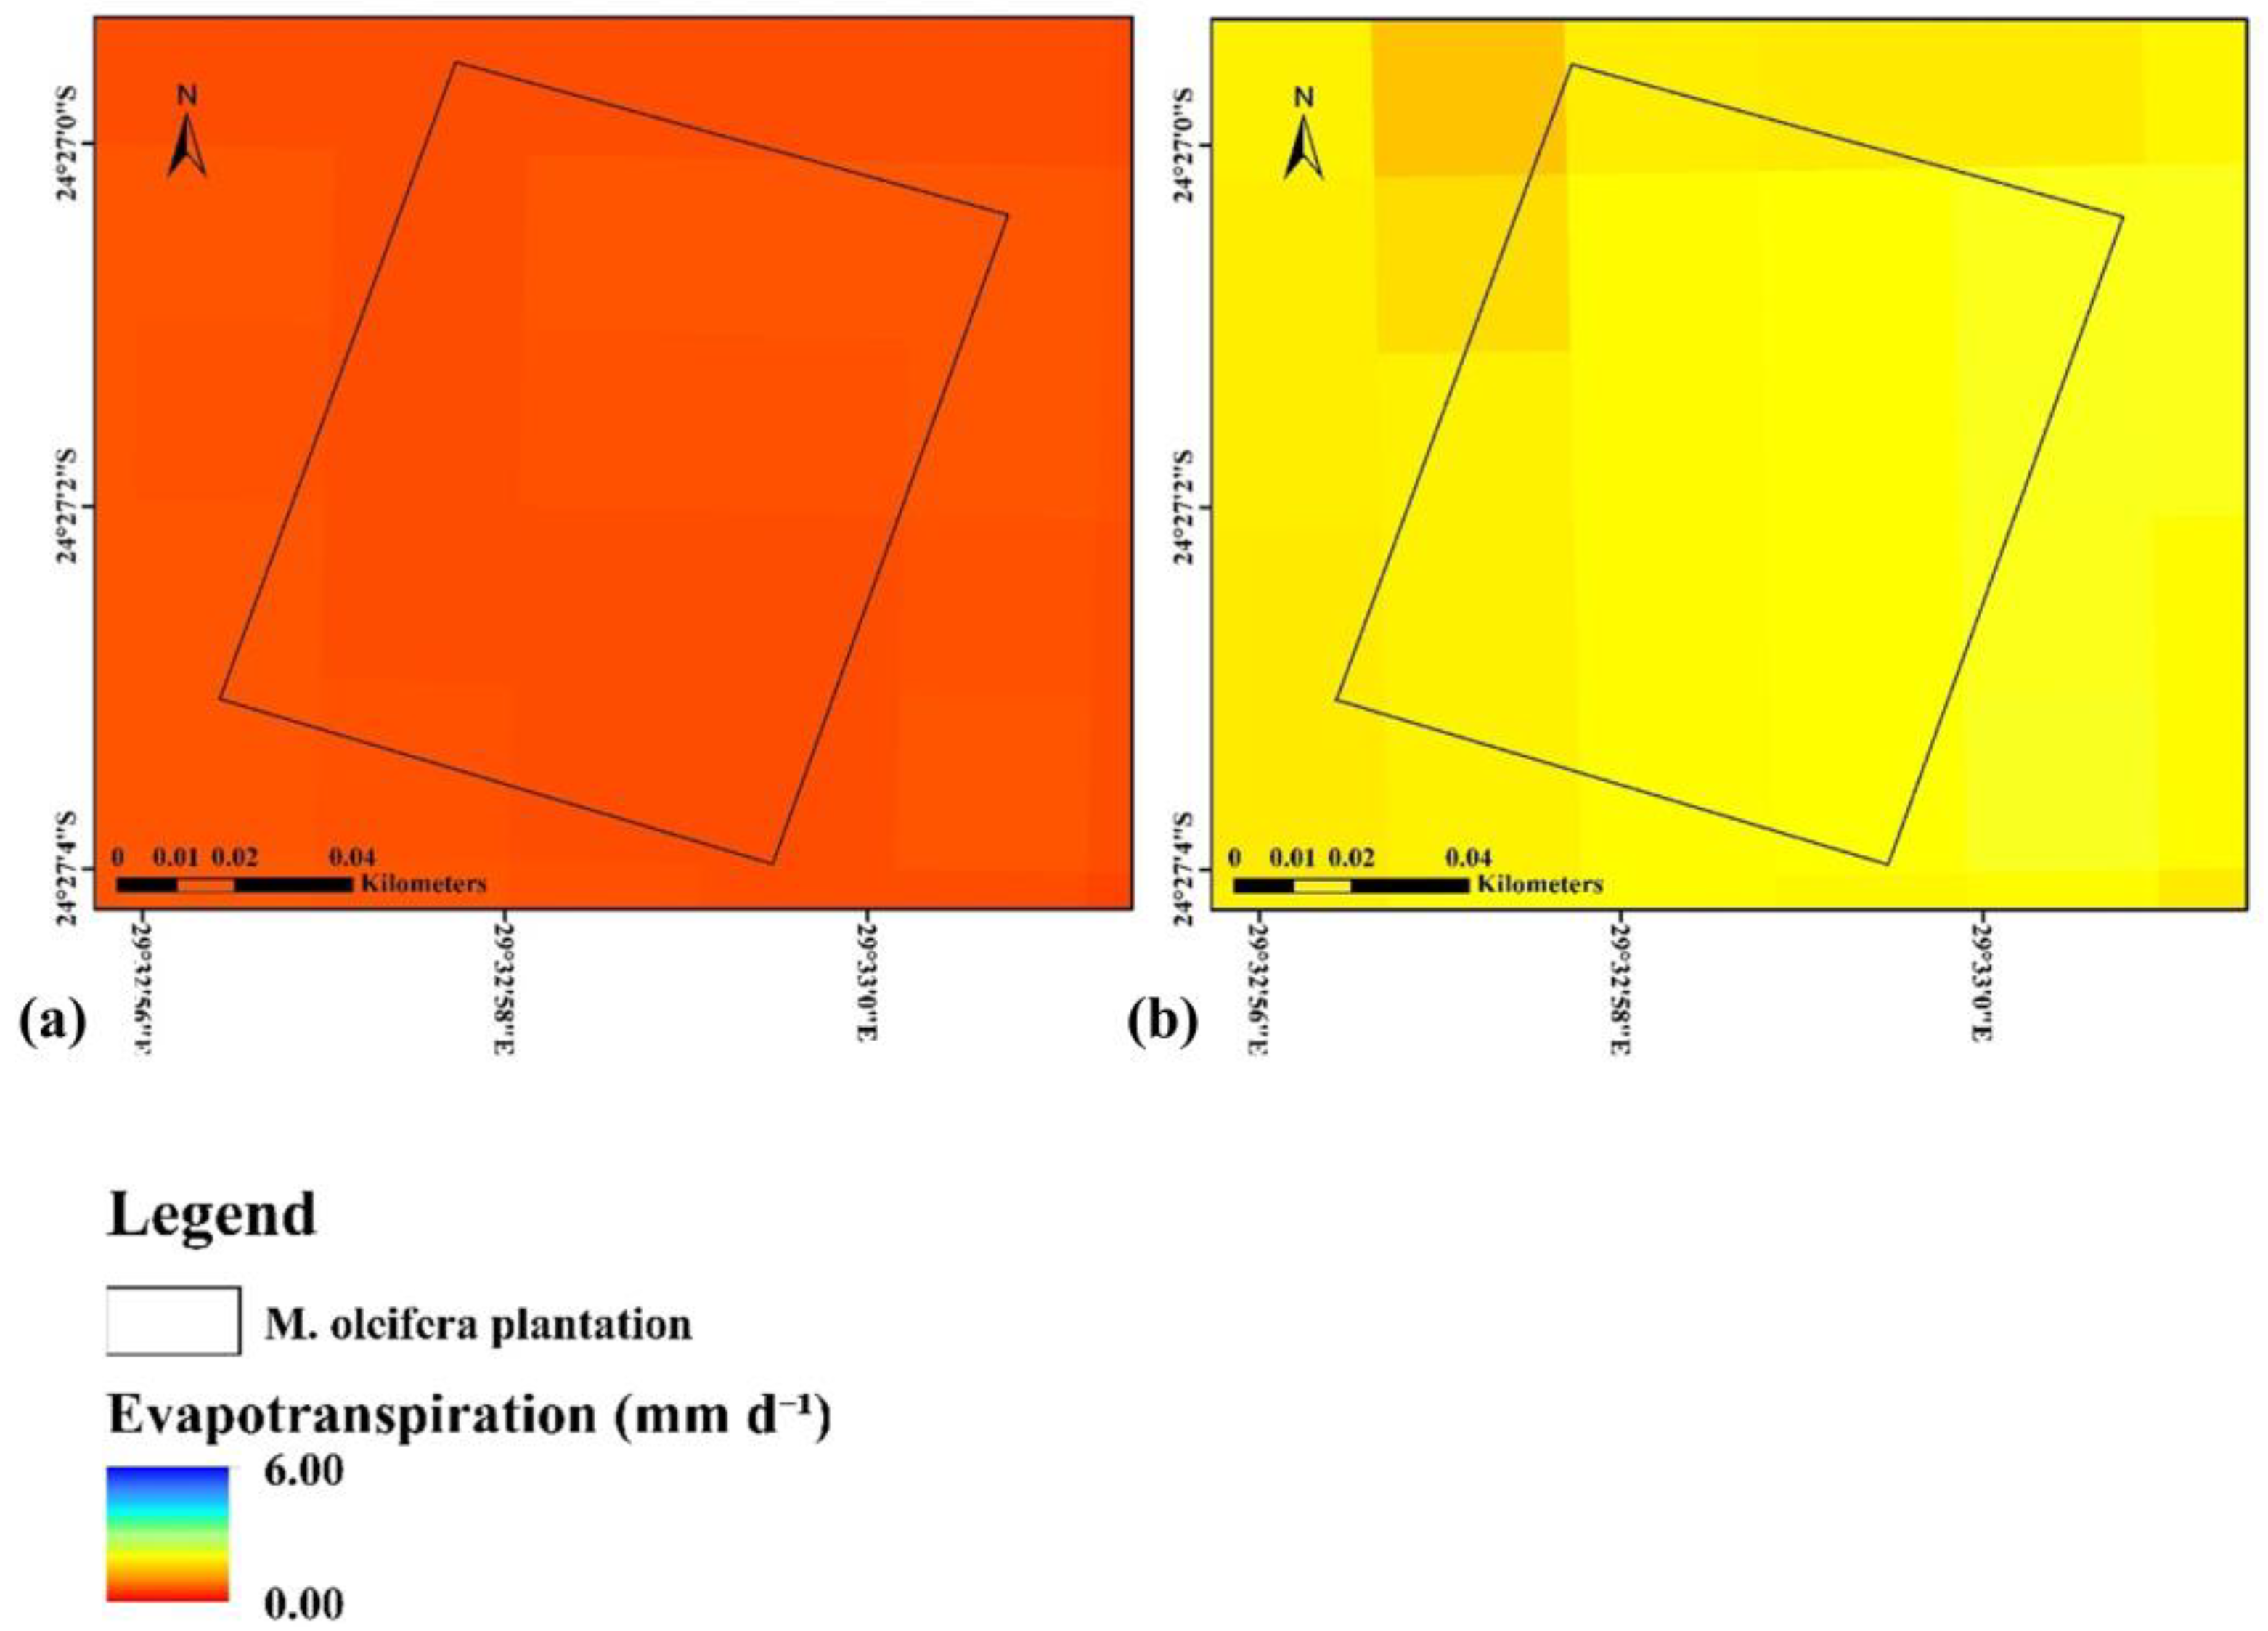
25]. To this end, in this study we compared the ET and
ET0 acquired through EEFlux against the corresponding in situ measurements.
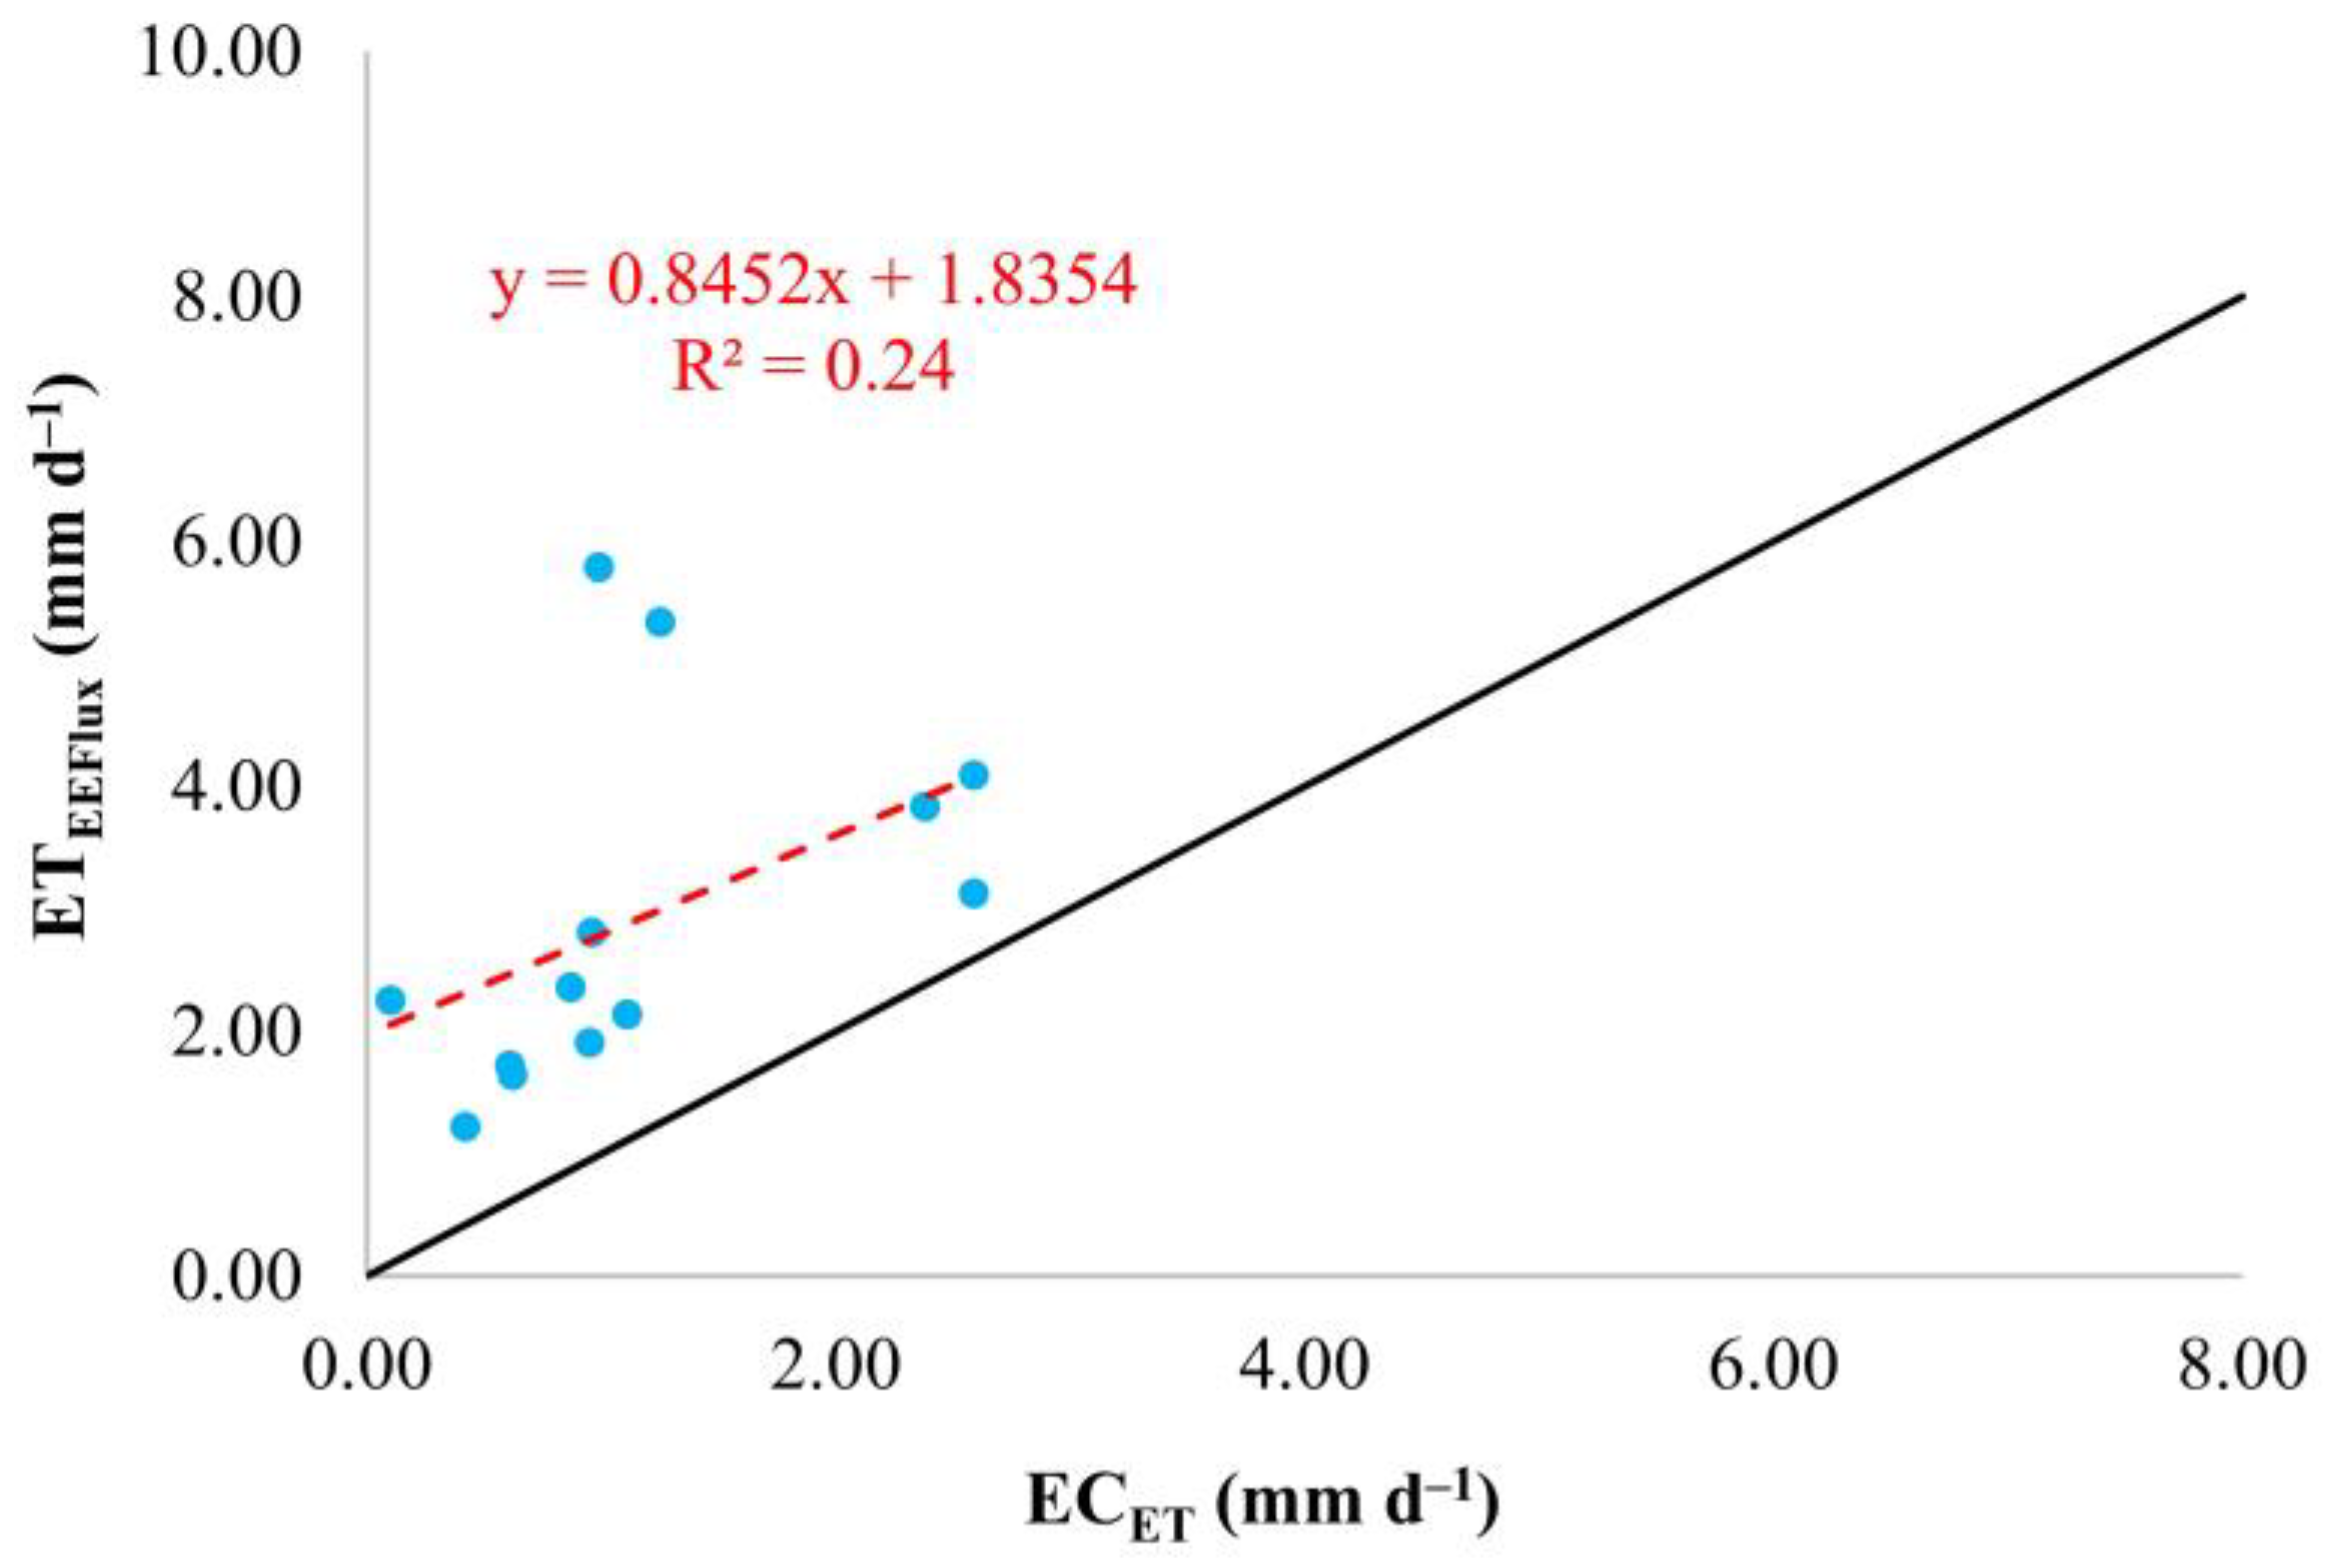
The results of these comparisons indicated that ET was largely and consistently overestimated by EEFlux, with the error in these estimates being generally larger than that reported in similar studies [
12,
14,
15]. For example, the aforementioned studies reported RMSE values ranging from 0.80 to 1.39 mm d
−1, whereas in this study, the RMSE was 2.03 mm d
−1. The larger discrepancies observed between the EC
ET and ET
EEFlux in this study may largely be a consequence of a lack of EBC for the EC flux tower measurements. EBC ranged from 0.59 to 0.68 depending on the method and time-step that were chosen for analysis. While the lack of closure can be partially attributed to our measurements not accounting for the energy used for photosynthesis and respiration or heat storage [
24], these values are typically negligible. Subsequently, an underestimation of the turbulent fluxes is the most likely cause of the relatively low EBC [
26], which is potentially due to instrumental errors, data processing errors, averaging time and low wind velocity, or turbulence development [
24,
26].
Considering that a portion of the unallocated energy may significantly contribute to
LE, the ET within our study site is potentially higher than what has been reported from the EC
ET measurements. Therefore, the margin of error between the EC
ET and ET
EEFlux estimates may actually be smaller and within a similar order of magnitude as that reported in the abovementioned studies. Factors such as model conceptualization and the use of global weather data may have further compounded the discrepancies between EC
ET and ET
EEFlux. During the period 17 December 2021–31 January 2022, the
M. oleifera plantation was invaded by bush crickets, which resulted in a complete loss of crop production. The crop was re-established at a later period just prior to the commencement of the in situ measurements. Subsequently, the crop was still within the formative stages of development, with a relatively underdeveloped and sparse canopy. Kadam et al. [
14] and Vázquez-Rodríguez et al. [
25] found that the largest errors in EEFlux estimates when compared with EC
ET were acquired during the early development and crop senescence or harvesting stages.
This may potentially be due to the model’s inability to adequately account for low crop transpiration and higher soil water evaporation during such conditions, which warrants further investigation. Vázquez-Rodríguez et al. [
25] also notes that the land use map used in EEFlux to quantify the sensible heat flux can significantly influence the accuracy of the ETa estimates, particularly when non-cropland regions are included in the ETa estimates or when there are major differences between the mapped land use verses the land use on the ground.
The use of gridded-weather data facilitates the application of EEFlux without the need for localized data and performing manual calibrations, as is required for employing the traditional METRIC model during the estimation of ET [
14]. While a satisfactory level of performance was attained for comparisons between
ET0 and
ET0global, the
ET0 derived from gridded-weather data was higher than that measured in situ.
The gridded-weather data used to calculate the
ET0global that is used in EEFlux are acquired from coarse spatial resolution (300 m) climate data, which may not adequately represent localized conditions, particularly in regions whereby there is high spatial variability in the climatic variables [
25]. Subsequently, this may have further contributed to the overestimation of ET
EEFlux. In addition to the aforementioned limitations, the relatively small sample size, some cloud contamination within the images, and sampling only during a select portion of the growing period are all factors which need to be considered when contextualizing the findings of this study. Moreover, our findings were only able to reveal temporal trends and potential biases (albeit for a limited period) at a single location and does not provide a comprehensive overview as to whether these trends and biases are potentially consistent across a larger geographic extent within the greater study area, whereby the spatial variability in the factors controlling ETa is likely to be more pronounced and influential on the accuracy of the ETa estimates [
27], as demonstrated by the findings of Salem et al. [
10] and Vázquez-Rodríguez et al. [
25].
While the performance of EEFlux in this study was less than satisfactory, this should not dissuade potential users from implementing this tool or other semi-automated or fully automated open-access ET processing tools. Instead, where possible, longer-term monitoring across biophysically diverse environments whilst also reducing the uncertainty of the measured values used for validation should be undertaken to allow for a more objective assessment of the strengths and limitations which these tools possess. Improving the estimation of
ET0F during particular growth phases through the development of automated adjustment approaches or affording users the option to include localized data if available within the platform can also help improve the accuracy of ETa estimates [
14]. Furthermore, Salem et al. [
10] demonstrated that machine learning-based approaches can be used to improve EEFlux ET
a estimates even in data-scarce environments.
5. Conclusions
The multi-purpose properties of M. oleifera have contributed to a growing interest in its cultivation throughout the world. However, with a lack of detailed water use information, it can prove challenging to optimally manage and grow the crop for its various intended uses. While traditional in situ monitoring methods can provide invaluable and accurate data to facilitate this process, their labor-intensive and costly nature make them poorly suited for widespread adoption and have also contributed to a gradual decline in monitoring networks, especially in developing regions.
Considering the potential which semi-automated or fully automated open-access ET processing tools possess, they are considered both pragmatic and viable options to acquire water use information. In this study, we evaluated the ability of the EEFlux platform to quantify the water use of M. oleifera and ascertain whether this tool could be used to facilitate improved planning and management decisions pertaining to its water use and cultivation. The results of these investigations demonstrated unsatisfactory levels of performance of EEFlux when compared with the corresponding in situ measurements; however, there were several factors which contributed to this outcome. Interest in the use of semi-automated or fully automated open-access ET processing tools is likely to grow, as they are able to increase the availability and accessibility to crucial information required to improve agricultural productivity and efficiency, as well as water resource management. It is imperative that further research is undertaken to better understand the strengths and limitations of these approaches, as well as identify how these techniques can potentially be refined to improve their performance. This will help promote confidence in their application, which in turn will allow for decision-makers to better understand how to best use the information provided by these tools.
Given that a lack of data often proves to be a hindrance to efficient and effective management, semi-automated and automated tools such as EEFlux can prove to be invaluable in facilitating well-informed data-driven management decisions within the agricultural and water resources sectors, particularly in resource-constrained environments.


