Article

Heat Transfer Characteristics of Horizontal Two-Phase Flow Boiling in Low-Pressure Low-Flow (LPLF) Conditions

Department of Mechanical Engineering, Kazuo Inamori School of Engineering, Alfred University, 1 Saxon Drive, Alfred, NY 14802, USA
*
Author to whom correspondence should be addressed.
Thermo 2025, 5(3), 33; https://doi.org/10.3390/thermo5030033
Submission received: 30 July 2025 / Revised: 8 September 2025 / Accepted: 15 September 2025 / Published: 18 September 2025

Abstract

To date, two-phase flow boiling has been extensively investigated for various working fluids and geometries, mainly under operating pressures and mass fluxes in the range of medium to high. However, very limited studies have been conducted, focusing on low-pressure low-flow (LPLF) conditions. Given insufficient experimental data available in the literature, most of the existing empirical correlations fail to properly predict boiling heat transfer coefficients (BHTCs) in LPLF conditions, highlighting the need for further experimental investigations. The present study experimentally investigates the heat transfer performance of single-phase and two-phase flow boiling of distilled water in a horizontal conventional tube at constant wall heat flux under LPLF conditions where the operating pressure is set to be subatmospheric and the mass flux ranges below 20 kg/m2-s. For the saturated flow boiling, the effects of mass flux and local vapor quality on the local BHTCs and Nusselt were evaluated, revealing that local BHTCs reach a peak at a certain range of vapor qualities between 55% and 75%, while increasing with the mass flux. It was also found that the impact of mass flux is stronger than that of vapor quality on the local BHTCs. The experimental results in the present study were then compared with several well-known empirical BHTC correlations in the literature to identify those with least deviations under the LPLF conditions. In contrast to single-phase flow, heat loss estimation and vapor quality measurement are known as one of the main error sources in characterizing heat transfer coefficients for two-phase flow boiling. Accordingly, the present study employs two approaches, in parallel, to reliably estimate heat losses, calibrate heat supplies, and measure local vapor qualities under the operating conditions investigated.

1. Introduction

Among the various forms of energy currently being used, a significant portion is generated into or by heat. In most industrial systems, heat is the main energy input for a system or accounts for most of the energy generated by a system. Due to the sharp growth in demand for energy throughout the world, techniques to enhance heat transfer performance and reduce energy loss by adopting more efficient processes have attracted a great deal of attention. The recent leap in heat dissipation rates of emerging advanced applications, coupled with the need for size reduction in cooling hardware, has made typical single-phase systems unable to meet this level of cooling requirements even with their maximum exploitable performance, which spurs a transition to phase-change thermal systems [1,2]. This trend encompasses applications generating high heat fluxes, such as thermal management in space, power electronics and microelectronics, heat exchangers for water desalination and hydrogen storage in vehicles, rocket engine nozzles, particle accelerators, nuclear fusion reactors, defense-sector laser and radar systems, and the advanced material processing [3,4,5,6]. The tremendous advantages of phase-change heat transfer systems are attributed to their ability to utilize both sensible and latent heats compared to the single-phase systems, which only exploit the sensible heat [7]. Condensation and boiling are typical forms of phase-change heat transfer processes by which enormous amounts of heat can be transferred from/to a fluid with a small temperature difference during these processes due to the use of latent heat. Given the combined effects of buoyant forces and surface tension, the systems with boiling and condensation processes exhibit dramatically higher heat transfer coefficients and performances than those with a single-phase process [8].
Horizontal flow boiling is commonly applied to shell-and-tube boilers, vapor-compression refrigeration systems, and fuel channels of pressurized heavy water nuclear reactors (PHWR). In the event of loss of coolant in pressurized heavy water reactors, the core fuel channels would face low mass velocity, flow stagnation, and reversal, posing a serious safety concern in terms of thermal management. Accordingly, investigating the horizontal flow boiling in PHWRs under low-pressure low-flow (LPLF) conditions plays a crucial role in understanding and predicting their nuclear core behavior to ensure thermal safety in unfavorable case scenarios such as the loss of coolant accidents [9,10]. The LPLF conditions are also widely applied to plate-type freshwater generators, used for desalination systems of marine plants and vessels [11]. Furthermore, these conditions can be applied to natural-circulation passive systems and compact cooling systems for thermal management purposes. LPLF conditions in thermal management systems are often referred to operating conditions where pressure ranges from subatmospheric to a few bars while the mass flux is often lower than 200 kg/m2-s, accompanied by a laminar or transitional flow regime.
To date, many studies have been undertaken empirically and numerically, focusing on the heat transfer characteristics of internal flow boiling for various working fluids, ranging from water to different refrigerants, at different tube sizes and orientations under operating pressures and mass fluxes, often varying from a medium to high range [12,13,14,15]. However, there are very limited experimental studies in the literature, mostly conducted under low-pressure or low-flow conditions. A large difference in density between steam and liquid at LPLF conditions causes a high slip ratio and fast gas expansion, leading to behaviors and mechanisms different from those of medium-to-high-pressure and flow conditions.
Baburajan et al. [9] measured the local boiling heat transfer coefficient (BHTC) and pressure drop in a horizontal tube under low-pressure low-flow conditions for the subcooled boiling region. They employed infra-red thermography to measure local wall temperature in order to estimate local single-phase and two-phase heat transfer coefficients of water at atmospheric pressure for a range of mass fluxes and inlet subcooling temperatures, ranging from 450 kg/m2-s to 935 kg/m2-s and from 29 °C to 70 °C, respectively. They found that for a given vapor quality, the subcooled boiling heat transfer coefficient and the wall temperature increase with the increase in heat flux. However, the fluid temperature remains constant. In addition, it was observed that as mass flux increased, both the single- and two-phase pressure drops increased.
Changhong et al. [16] conducted an experimental study on two-phase flow boiling heat transfer of distilled water in two vertical narrow annuli at high-pressure conditions and low-flow rates. It was revealed that the boiling heat transfer coefficients were independent of mass quality and mass flux, but were strongly dependent on the heat flux, indicating that the nucleate boiling regime has been the dominant mechanism. In addition, it was observed that the BHTC grew with the increase in heat flux. In another experimental study, Yan et al. [17,18] investigated the heat transfer of subcooled water flow boiling in a uniformly heated vertical circular tube with an ID of 9 mm under high heat flux and high mass flux (HHHM) operating conditions, which is commonly employed to the divertor cooling systems of the “international thermonuclear experimental reactors” (ITER).
In an empirical study conducted by Santini et al. [3], 1575 measurements (points) of peripherally averaged and axially local heat transfer coefficients during forced convection boiling of water in a 24 m long full-scale helically coiled tube were collected with experimental uncertainties between 5% and 20%. The experiments were performed under a pressure range between 2 MPa and 6 MPa, low mass flux, and low heat flux which are typical to the steam generators employed to the small modular reactors of nuclear power plants. As a result, BHTCs were found to depend on the heat flux and mass flux, implying that both nucleate boiling and convection contributed to the heat transfer process. In addition, it was concluded that the curvature effect on the flow boiling heat transfer has been negligible, so that BHTC in helical coils can be estimated through the existing correlations of straight tubes in practical applications. Nonetheless, most of correlations for straight tubes slightly underpredicted experimental data of helical coils.
Hardik and Prabhu [19,20] conducted experiments to characterize heat transfer performance of a diabatic two-phase water flow boiling under pressures above atmospheric (1 bar to 3 bar) with a mass flux ranging over 200 kg/m2-s and vapor qualities varying from 0% and 40%. Experiments were implemented with eight test sections composed of horizontal thin-walled stainless steel tubes with different tube IDs varying from 5.5 mm to 12 mm and different tube length ranging from 550 mm to 1000 mm. The effects of tube diameter, mass flux, and heat flux on the local BHTC and two-phase pressure drop were then studied. As reported, no change was observed in the slope of boiling curve during subcooled region. BHTCs in subcooled and nucleate boiling regimes were dependent on heat flux and independent of mass flux. However, mass flux influenced the convective boiling region as the higher mass fluxes contributed to higher BHTCs. It was also reported that tube diameter did not affect the wall and bulk fluid temperatures as well as BHTCs. In contrast, tube diameter was shown to have a significant impact on the two-phase pressure drop as it decreased remarkably with the increase in tube diameter for the same heat flux at a constant mass flux.
Due to the limited studies and insufficient experimental data, the vast majority of the existing empirical correlations are not capable of properly predicting BHTC in LPLF conditions, underscoring the need for further experimental investigations. The present study aims to experimentally investigate the effect of vapor quality and mass flux on the local heat transfer coefficient for two-phase flow boiling of water in a horizontal conventional tube at a constant wall heat flux under LPLF conditions where the operating pressure is set to be subatmospheric and the mass flux ranges below 20 kg/m2-s. The experimental results will then be compared with several well-known empirical correlations in the literature to identify those with least deviations for the LPLF conditions operated in this study.

2. Experimental Methodology

2.1. Test Apparatus

The experimental setup consists of copper tubes with an outer diameter of 0.5 inches (i.e., 12.7 mm). The test section is also composed of a horizontal copper tube of 98 cm long with inner and outer diameters of 0.43 inches (i.e., 10.9 mm) and 0.5 inches (i.e., 12.7 mm), respectively, wrapped around by a heating tape. The test section as well as the other parts of the test setup involved with heaters are fully insulated using three layers of different insulators to minimize the heat gain or heat loss during the experiments.
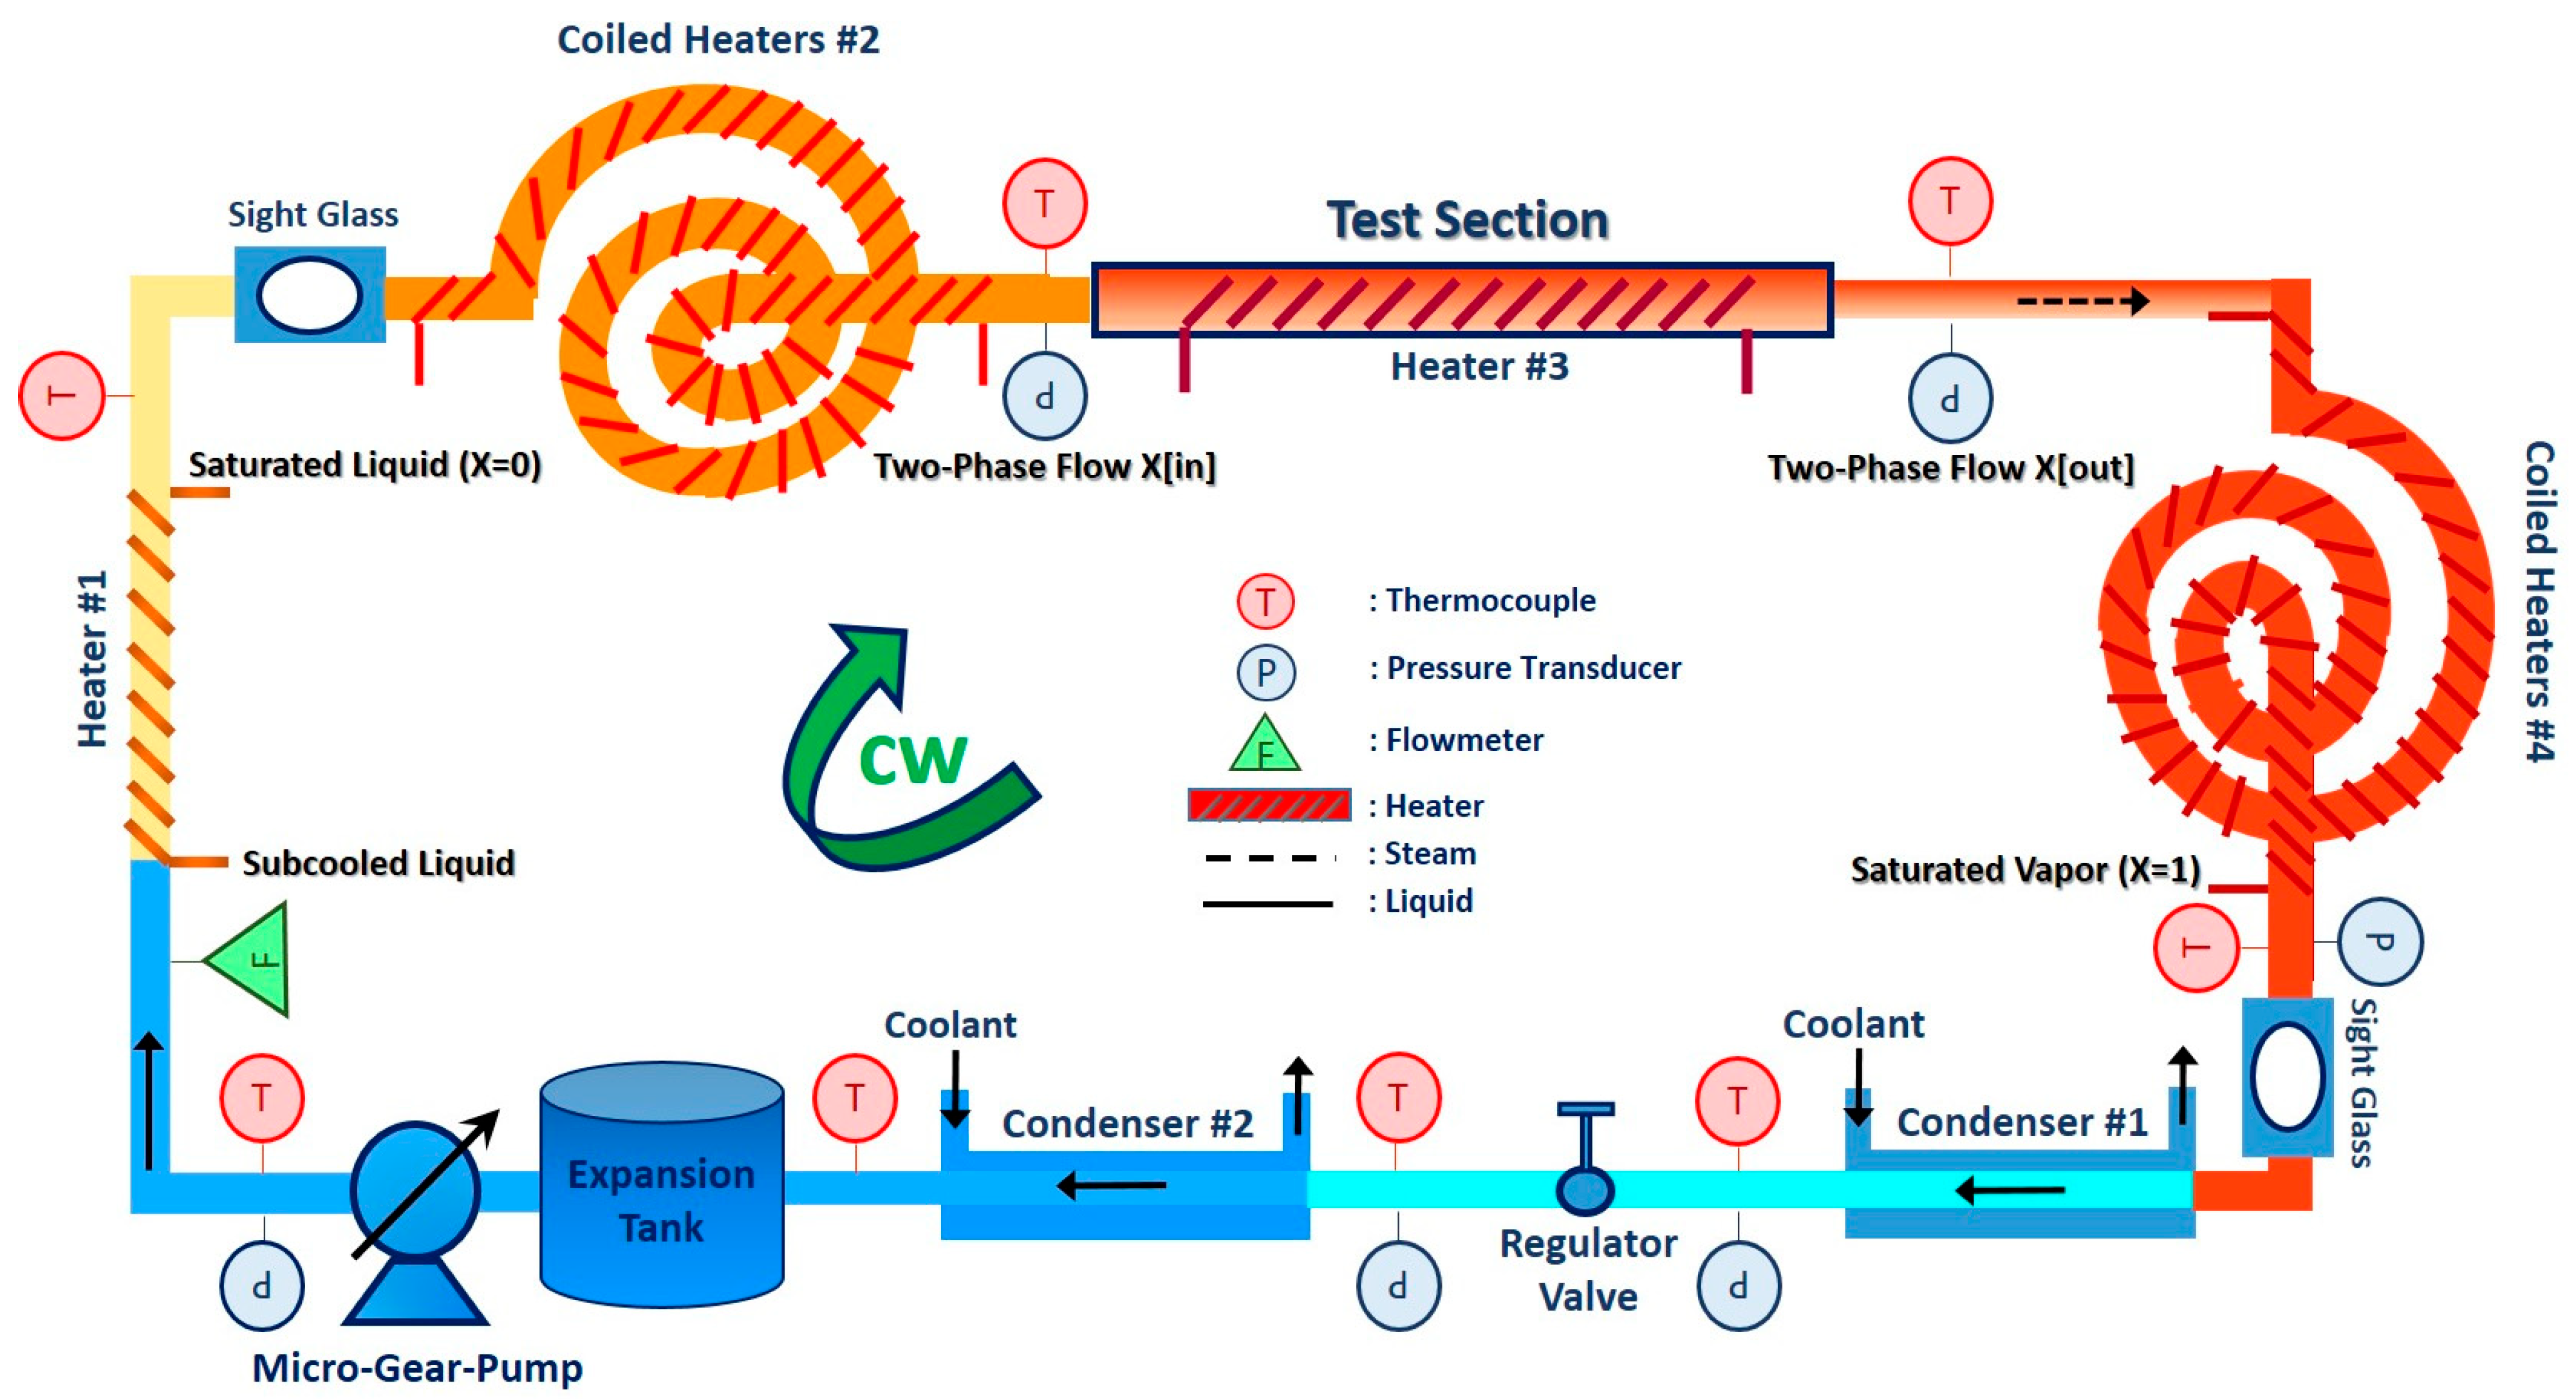
The compression and Yor-Lok fittings were utilized, along with Teflon tape and proper sealant, to connect and seal tubes, adapters and connectors—major components of the setup—and sensing instruments. The entire test apparatus was then evacuated using a vacuum pump to conduct long-term leak-check tests to examine if the system is air-leak-tight. The system was then charged with the distilled water under a rough vacuum to perform single-phase and two-phase flow experiments at pressures below the atmospheric pressure. The test apparatus is illustrated in Figure 1, whereas Figure 2 depicts its schematic, accompanied by the designated states of the working fluid in the cycle as well as by the mounted locations of sensing devices. A micro-gear pump equipped with an inverter motor is used to control the flow rate. Two customized tube-in-tube condensers and a pressure regulator are also utilized for the test apparatus to maintain steady-flow operating conditions in the cycle. Power controllers and monitors were engaged in the test apparatus to control heat supplies to reach the desired operating conditions as well as to adjust the vapor quality at the inlet and outlet of the test section, pre- and after-test sections. The auxiliary items such as shut-off valves and sight glasses were also added to the connecting tubes at various locations in the setup to enable a direct observation of flow states as well as to ease further modifications, disassembly, and reassembly of the setup.
A range of sensing instruments including thermocouples, pressure transducers, and a turbine flowmeter were also mounted to monitor and control the operating conditions within the tests through measuring the tube surface and fluid temperatures, pressures, and flow rate. All the precision instruments were then connected to a power supply and a data acquisition system to monitor and compile real-time data for further analysis. Table 1 represents a breakdown of the sensing devices, accompanied by their quantity in use, accuracy, and operating range.

2.2. Operating Conditions and Test Procedures

Table 2 summarizes the geometry of the test section, and the operating conditions set to perform the tests. As shown in Figure 2, the test apparatus can be tuned for both configurations in single-phase and two-phase flow. To ensure the results’ reliability and reproducibility, the tests were subject to be repeated three times for the given range of operating conditions.
The single-phase tests were conducted at the inlet pressure of 88 kPa for volumetric flow rates in the range of 50–110 mL/min, equivalent to mass fluxes in the range of 8–20 kg/m2-s. Using heater unit#1, the single-phase flow temperature at the inlet of the test article is set for 40 °C. Using heater unit#3, a range of constant heat fluxes proportional to mass fluxes are supplied to the compressed liquid flow to heat it up to 80 °C at the exit of the test section. This exit temperature was set to be securely lower than the saturation temperature at 88 kPa (i.e., 96 °C) to avoid any transition of single-phase flow into the saturation state.
The two-phase flow tests were then performed under the same range of pressure and mass fluxes as those for the single-phase flow. The mass flux range for both configurations lies within the laminar flow regime. At the outlet of the test section, the fluid is a two-phase flow with unknown vapor quality at the saturation temperature of 96 °C and the corresponding saturation pressure of 88 kPa, passing through the coiled heaters#4 to reach the known state of saturated vapor with quality of 1 (i.e., x = 100%) in order to measure unknown vapor quality at the outlet of the test section. The saturated vapor is then condensed in a tube-in-tube heat exchanger using cooling water to turn it to the state of saturated liquid (i.e., x = 0%). The flow temperature and pressure are set to drop through a regulator valve as well as a second tube-in-tube condenser to take the working fluid to the subcooled/compressed liquid state at the cycle’s low-pressure and low-temperature points of 76 kPa and 40 °C, respectively, prior to entering the pump in order to avoid cavitation. After having the liquid flow squeezed in the pump to the high-pressure of the cycle (i.e., 88 kPa), it is warmed up by heater#1 until reaching the saturated liquid state. Using coiled heater#2 located just before the test section, the saturated liquid flow turns to a two-phase flow with a vapor quality in the range of 30–60% at the inlet of the test section and is afterwards exposed to a constant wall heat flux supplied by heater#3 to reach higher vapor qualities at the outlet, and then keeps recirculated.

2.3. Data Reduction—Heat Transfer Parameters

By collecting raw data for surface temperatures ( T s u r f ), fluid temperatures ( T f l u i d ), fluid pressure (P), flow rate ( m ˙ ), and heating power supplied ( Q S u p p l ), the heat transfer performance parameters at different locations of the test section—including the inlet, middle, and the outlet–can be measured.
According to Newton’s cooling law, the following can be expressed:
Q t r a n s f = Q s u p p l Q l o s s = T s u r f T f l u i d R t o t
where Q t r a n s f stands for the actual amount of heat transferred to the flow, Q l o s s is the amount of heat loss to be estimated, and R t o t accounts for the total local thermal resistance at the test section.
Due to sensible heat, the energy balance for the liquid single-phase flow configuration is expressed as follows:
Q t r a n s f = m s p ˙   C p   T f l u i d , o u t T f l u i d , i n
whereas the latent heat exchanged in the test section for the configuration with the two-phase flow boiling is expressed as follows:
Q t r a n s f = m t p ˙   h x [ o u t ] h x [ i n ]
in which h x [ i n ] and h x [ o u t ] refer to the enthalpies of the two-phase flow for the vapor qualities at the inlet and outlet of the test section, respectively.
The total thermal resistance at different locations of the test section (i.e., the inlet, middle, and outlet) is composed of the conductive thermal resistance ( R c o n d ) and the convective thermal resistance ( R c o n v ) for either of the configurations, as shown below:
R t o t = R c o n d + R c o n v = ln O D I D 2 π   L t u b e   K t u b e + 1 H T C × A s
where HTC stands for an unknown value of the heat transfer coefficient at different locations of the test section for either of the configurations with single-phase flow or two-phase flow boiling.
After calculating the heat transfer coefficient, the Nusselt number (Nu) can be obtained as below:
N u = H T C × I D K f l u i d
The Reynolds number (Re) for the single-phase flow can also be computed as follows:
R e s p = G × I D μ l
The flow regime for the liquid phase or the gas phase of the internal two-phase flow boiling is determined by the Reynolds numbers for the liquid phase ( R e t p , l ) and the gas phase ( R e t p , g ), respectively, defined as follows:
R e t p , l = G l × I D μ l = 1 x   G   I D μ l
R e t p , g = G g × I D μ g = x G   I D μ g
where Gl and Gg stand for liquid-phase and gas-phase mass fluxes, and μ l and μ g accounts for liquid-phase and gas-phase dynamic viscosities, respectively.
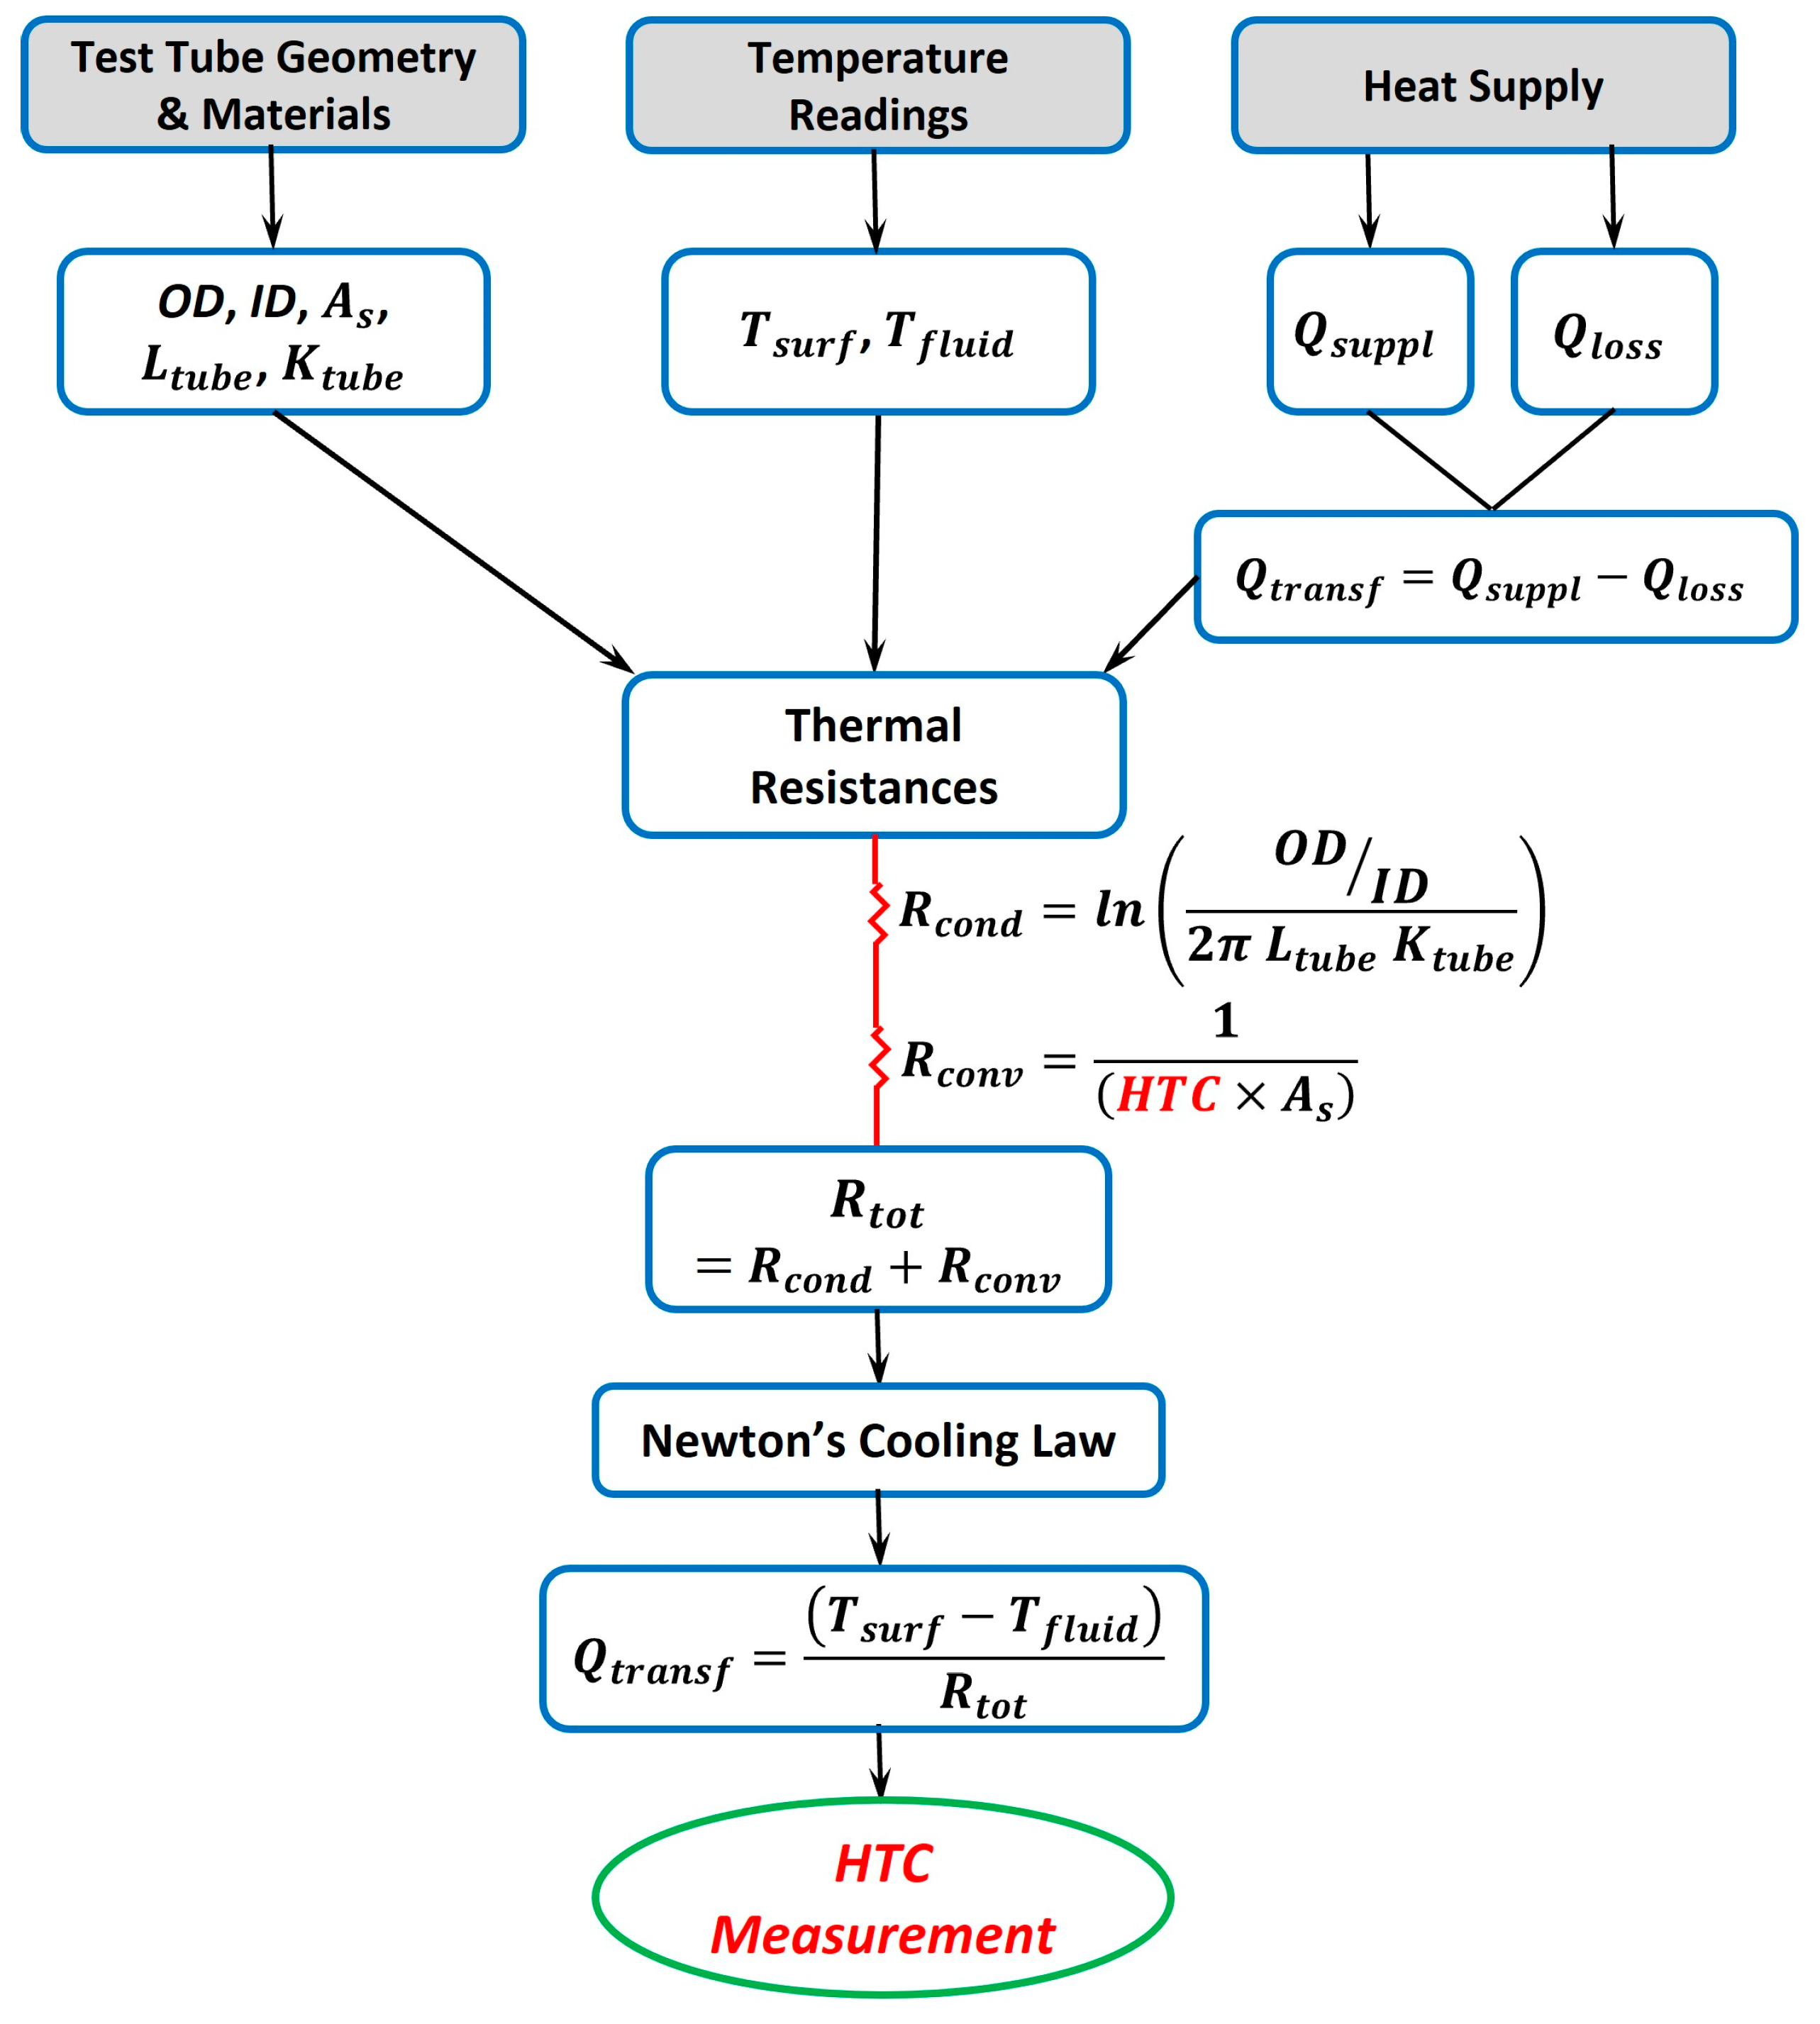
The flowchart represented in Figure 3 summarizes data reduction process to experimentally measure heat transfer coefficients at each mass flux tested.

2.4. Heat Loss Estimation

The measurement of local heat transfer coefficient in single-phase flow is not affected by heat loss estimation given the presence of sensible heat, influencing the local bulk fluid temperature where the actual heat transferred to the fluid is realized by executing an energy balance through flow rate and fluid temperature readings regardless of measuring the heat loss and calibrating the heat supplies. By contrast, the accurate estimation of heat loss in two-phase flow boiling plays a crucial role in reliable and accurate measurements of local vapor quality and the boiling heat transfer coefficient [10,21]. This is associated with the existence of latent heat in the phase-change heat transfer process, occurring at a constant saturation temperature while the fluid enthalpy increases proportionally with the increase in local vapor quality resulting from heat acquisition. Hence, inaccurate heat loss estimation and imprecise latent heat supply calibration compromises the reliability of heat transfer data and poses large uncertainties in the results.
In the present study, two experimental approaches are conducted to estimate heat loss and calibrate heat supply within flow boiling tests. In the first common approach, single-phase experiments are executed under a range of mass and heat fluxes to estimate a fixed average percentage of heat loss and calibrate heat supply for two-phase flow tests. In the second approach, the heat loss estimation and the correlation of heat supply calibration are extracted directly from the flow boiling tests.

2.4.1. Single-Phase-Based Heat Loss Approach

In the first approach, extensively applied in the literature [19,22,23], heating powers supplied experimentally ( Q s u p p l ) to the test article are observed to increase the liquid flow temperature between the inlet and outlet from 40 °C to 80 °C for a range of volumetric flow rates of 50–110 mL/min, which is equivalent to the range of mass fluxes 8–20 kg/m2-s. On the other hand, the actual or effective heat transferred to the single-phase flow ( Q t r a n s f ) can be computed using Equation (2). Accordingly, the heat losses corresponding to mass fluxes are the differences between Q t r a n s f and Q s u p p l . As represented in Figure 4, a correlation is thus developed by plotting Q t r a n s f versus Q s u p p l to calibrate heat supplies later for measurements of local vapor quality and boiling heat transfer coefficient.

2.4.2. Two-Phase-Based Heat Loss Approach

In the next approach, first introduced by Kabir, heat loss estimation and heat supply calibration are directly implemented through flow boiling experiments, providing more accuracy compared to the first common technique [10].
As depicted in Figure 2, the heat supplying units#2, 3, and 4 are engaged to provide the heat required to take the working fluid from the known saturated liquid state (x ≈ 0%) at the saturation temperature of 96 °C to another known state at the end of phase-change process, that is, saturated vapor (x ≈ 100%). To locate the saturated liquid state, the compressed liquid flow is slowly warmed up through heater#1 until a temperature reaches too close to the desired saturation temperature at the corresponding pressure. Similarly, to locate the saturated vapor state, heaters 2 to 4 are set to supply the latent heat for the saturated liquid until the two-phase flow reaches a slightly greater temperature than the saturation temperature, which is, indeed, the starting point of the superheated vapor state. In addition, by taking advantage of direct observations through sight glasses as well as a high-speed IR camera, the saturated liquid and vapor states are ensured by checking the lack of presence of vapor bubbles in the liquid stream and liquid droplet in the gas stream, respectively. The tests are then performed for a range of flow rates the same as those in the first approach. The total experimental latent heats supplied ( Q s u p p l ) to turn the saturated liquid flow to the saturated vapor are known for a range of flow rates whereas the theoretical latent heats required ( Q t r a n s f ) at the corresponding flow rates can be computed via Equation (3). The differences between these two parameters indicate the heat losses corresponding to the flow rates, from which a correlation is achieved to calibrate the experimental latent heat supplies for further measurements of two-phase flow boiling, as illustrated in Figure 5.

2.5. Local Vapor Quality Measurement

One of the parameters which remarkably impacts the local flow boiling heat transfer coefficient is vapor quality [21], underscoring the crucial role of vapor quality measurement in accurately and reliably characterizing the two-phase heat transfer coefficients.
After having the heat supplies calibrated for all the heaters in the test apparatus, local vapor qualities along the test section are measured by conducting the energy balance on the change in enthalpy of vaporization. The inlet vapor quality can therefore be measured and controlled via heater#2, positioned just prior to the test section in Figure 2, taking the fluid flow from the known state of saturated liquid (x = 0%) to the two-phase flow of a desired vapor quality at the inlet. However, the local vapor quality at the outlet can be measured either from heater#3 located at the test section using Equation (3) or from coiled heater#4 situated immediately after the test section, also called “after-heaters” in Figure 6, where the two-phase flow of unknown quality at the outlet is turned to the known state of saturated vapor (x = 1), using the following expression:
Q t r a n s f = ( Q s u p p l Q l o s s ) = m t p ˙ h g ( x = 1 ) h x [ o u t ]
This is important to note that the outlet quality measured from the test section using Equation (3) incorporates accumulated errors arising from the earlier measurement of inlet quality [21]. The outlet quality measurement through Equation (3) reflects uncertainties due to measurements of fluid temperature and pressure, flow rate, and heat supply calibration for the test section heater, accompanied additionally by the earlier error in measurement of vapor quality at the inlet (x[in]), leading to error accumulation in the outlet quality measurement. Accordingly, Equation (9) is preferred to measuring the outlet quality with the aid of calibrated coiled heater#4 (i.e., after-heaters).
Figure 6 illustrates the local quality measured at the test section outlet against mass flux for a given range of inlet vapor qualities from 30% to 50% at a constant saturation temperature under a constant wall heat flux of 17 kW/m2. As clearly shown in this figure, the outlet quality decreases with the increase in mass flux at the same inlet quality and heat flux. By contrast, the outlet quality increases as the inlet quality increases from 30% to 50% at the same mass and heat fluxes.
Additionally, Figure 6 concurrently represents the measured outlet vapor qualities derived both from the test section heater using Equation (3) and the after-heaters using Equation (9) where the quality measurements differ up to virtually 3% for the same operating conditions. As discussed earlier, the outlet quality measurements through the after-heaters (upper curves) are found to be more accurate due to the absence of error accumulation from the earlier measurements of inlet qualities.

2.6. Experimental Uncertainty Propagation

To investigate the uncertainty propagation analysis, the following correlation is employed [10]:
U R = i = 1 n R V i   U V i 2
where UR and UVi represent the uncertainties affiliated with the parameter R and the independent variable Vi, respectively. In addition, “n” accounts for the number of independent variables.
Accordingly, Equations (11) and (12) are developed based on Equation (10) to compute the overall experimental uncertainties for the main heat transfer parameters, including heat transfer coefficient and Nusselt, sourced in the inherent measurement errors for tube diameter, test section length, mass flow rate, fluid flow pressure, bulk fluid temperature, surface temperature, and heat transferred to the fluid.
δ ( H T C ) H T C = δ Q t r a n s Q t r a n s 2 + δ ( I D ) I D 2 + δ L L 2 + δ ( T ) T 2 1 2
δ ( N u ) N u = δ Q t r a n s Q t r a n s 2 + δ L L 2 + δ ( T ) T 2 1 2
Table 3 summarizes the uncertainty propagation for the experimental results reported in this study. Taking the cumulative effect of random and systematic errors into account for calculating uncertainties as well as considering the test reproducibility, the attained range of uncertainties reflects acceptable reliability of the tests performed in the present study.

3. Results and Discussions

3.1. Single-Phase Flow Heat Transfer Results

Figure 7 represents the variations in local heat transfer coefficients (HTC) at the inlet, middle, and outlet of the test section with mass flux for the liquid single-phase flow. As shown in this figure, all experiments at each of the operating conditions have been repeated three times to ensure reproducibility. For a flow rate range of 50–110 mL/min (corresponding to mass flux range of 8–20 kg/m2-s) and a corresponding heat flux range of 5–9 kW/m2 with keeping temperatures constant at the inlet and outlet, the Reynolds number at the outlet ranges from 279 to 600, indicating a laminar regime (<Recr = 2300).
As shown in Figure 7, heat transfer coefficients at the inlet of the test section are found to be larger than those at the outlet for a given range of mass fluxes. This is due to the thermal entrance region at the inlet of the test section where the single-phase flow is still neither thermally nor hydrodynamically fully developed. As a result of having a thermally developing flow in the entrance region, the thermal boundary layer is extremely thin which causes larger values of heat transfer coefficients compared to those of the outlet where the flow is both thermally and hydrodynamically fully developed.
The hydrodynamic ( x f d ,   h y d ) and thermal ( x f d ,   t h ) entry lengths for a laminar flow in a circular tube can be obtained, respectively, as follows [8]:
x f d ,   h y d D 0.05   R e D
x f d ,   t h D 0.05   R e D   P r
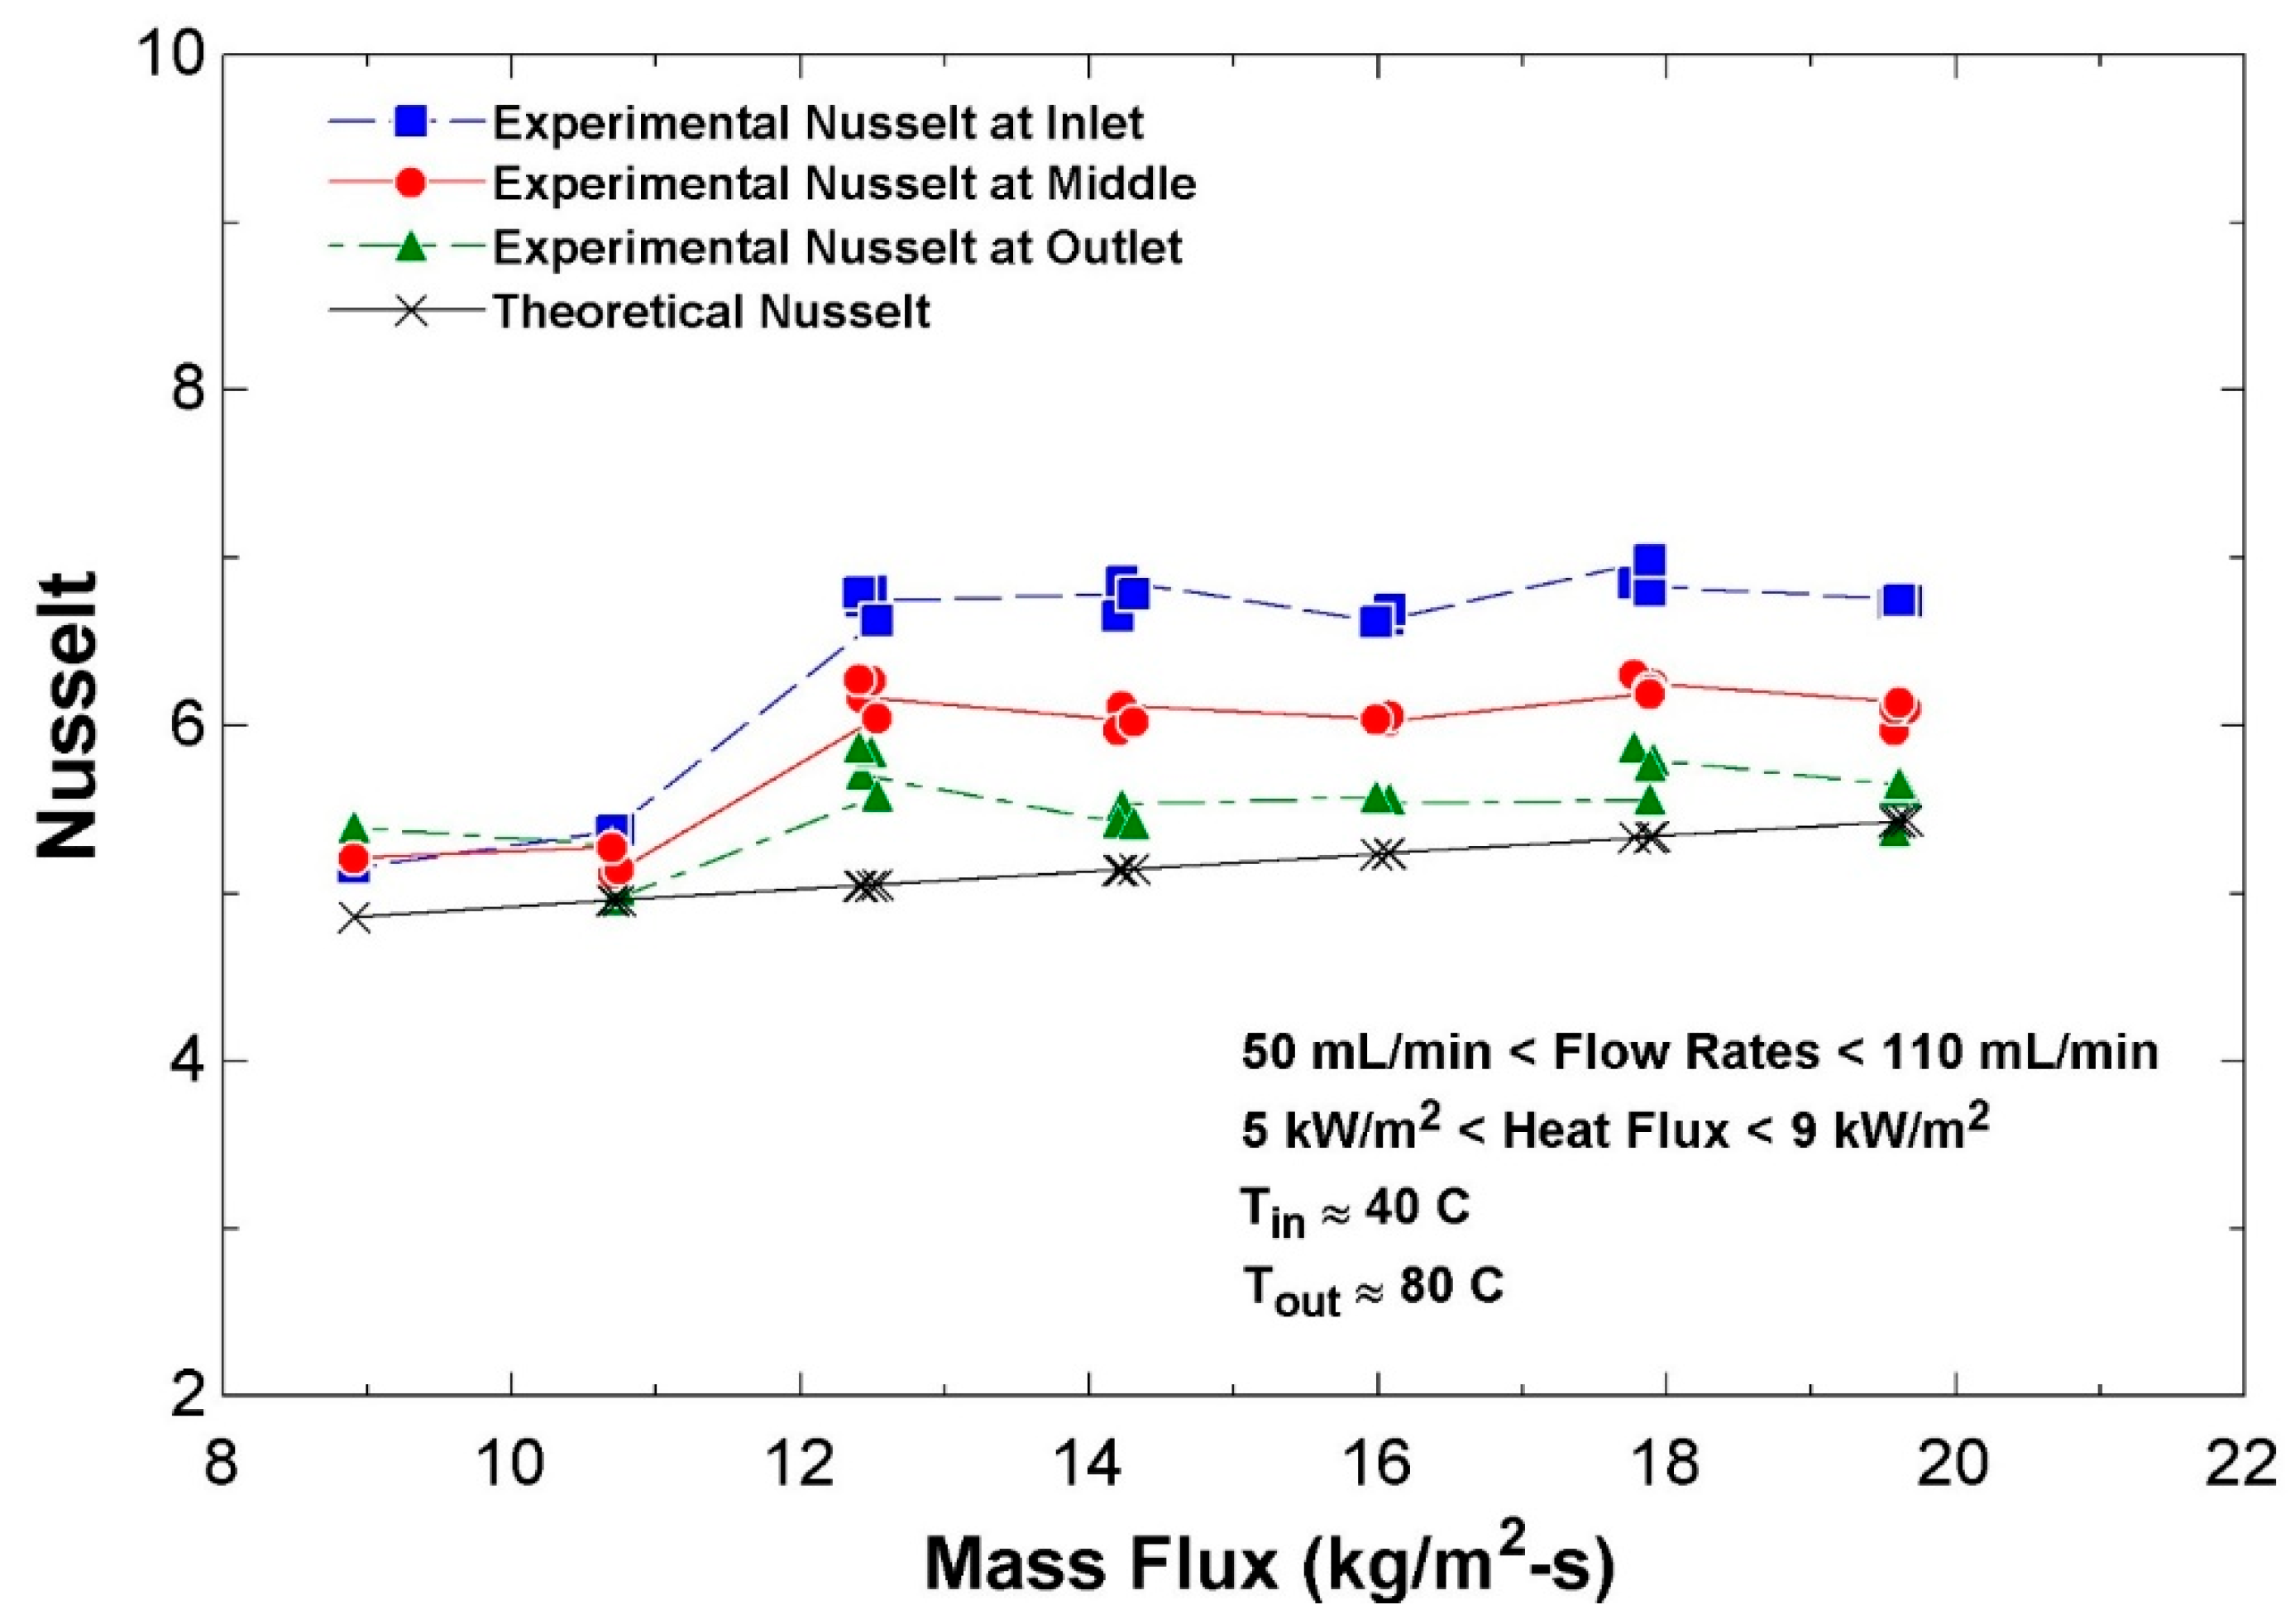
While the hydrodynamic entry length ranges from 8 cm to 18 cm for a given range of mass fluxes in the test section, the thermal entry length ranges from 31 cm to 72 cm. Note that the length of the test section is 98 cm where the outlet section is situated and exposed to the fully developed conditions. Since the working fluid is water (Pr > 1), the hydrodynamic boundary layer develops more quickly than the thermal boundary layer x f d ,   t h > x f d ,   h y d . As represented in Figure 7, HTC at the same mass fluxes decrease consistently along the test tube from the inlet, to the middle, and to outlet as the thermal boundary layer develops. After thermally reaching fully developed conditions (at the lengths greater than x f d ,   t h ), HTC in the laminar flow is independent of tube length (x), reaching a constant value. Figure 7 also illustrates that HTCs at the inlet and middle increase slightly with the increase in mass flux. However, HTC at the outlet where the laminar flow is fully developed remains fairly constant with the change in mass flux as HTC varies from 330 to 355 W/m2-K. The variations in local Nusselt with mass flux in laminar regime are also displayed in Figure 8, following trends similar to those revealed and discussed for HTCs in Figure 7 since the local Nusselt is proportional to the local HTC, and is obtained directly from it via Equation (5).

Comparison of Single-Phase Results with Literature

To compare the experimental results represented in Figure 7 and Figure 8, the following equation proposed by Hausen in [24] is used as a theoretical model for a developing laminar flow with the thermal boundary conditions of constant wall heat flux:
N u ¯ = N u ¯ +   K 1   R e Pr D z 1 + K 2 R e Pr D z n
where N u ¯ is the local Nusselt number from which the local heat transfer coefficient can be derived, N u ¯ = 4.36 , K 1 = 0.036 , K 2 = 0.0011 , n = 1 , D is the tube diameter, and z accounts for the distance from the inlet of the tube.
Figure 9 shows deviations of the experimental HTCs from the theoretical model [24], Equation (15). As represented in this figure, the HTC errors are mostly found to be smaller at the middle than those at the outlet. While the HTC errors at the middle of the test section range from 3% to less than 25%, the errors at the outlet range from 6% to less than 25% for a given range of mass fluxes in the laminar regime.

3.2. Two-Phase Flow Heat Transfer Results

3.2.1. Effect of Vapor Quality

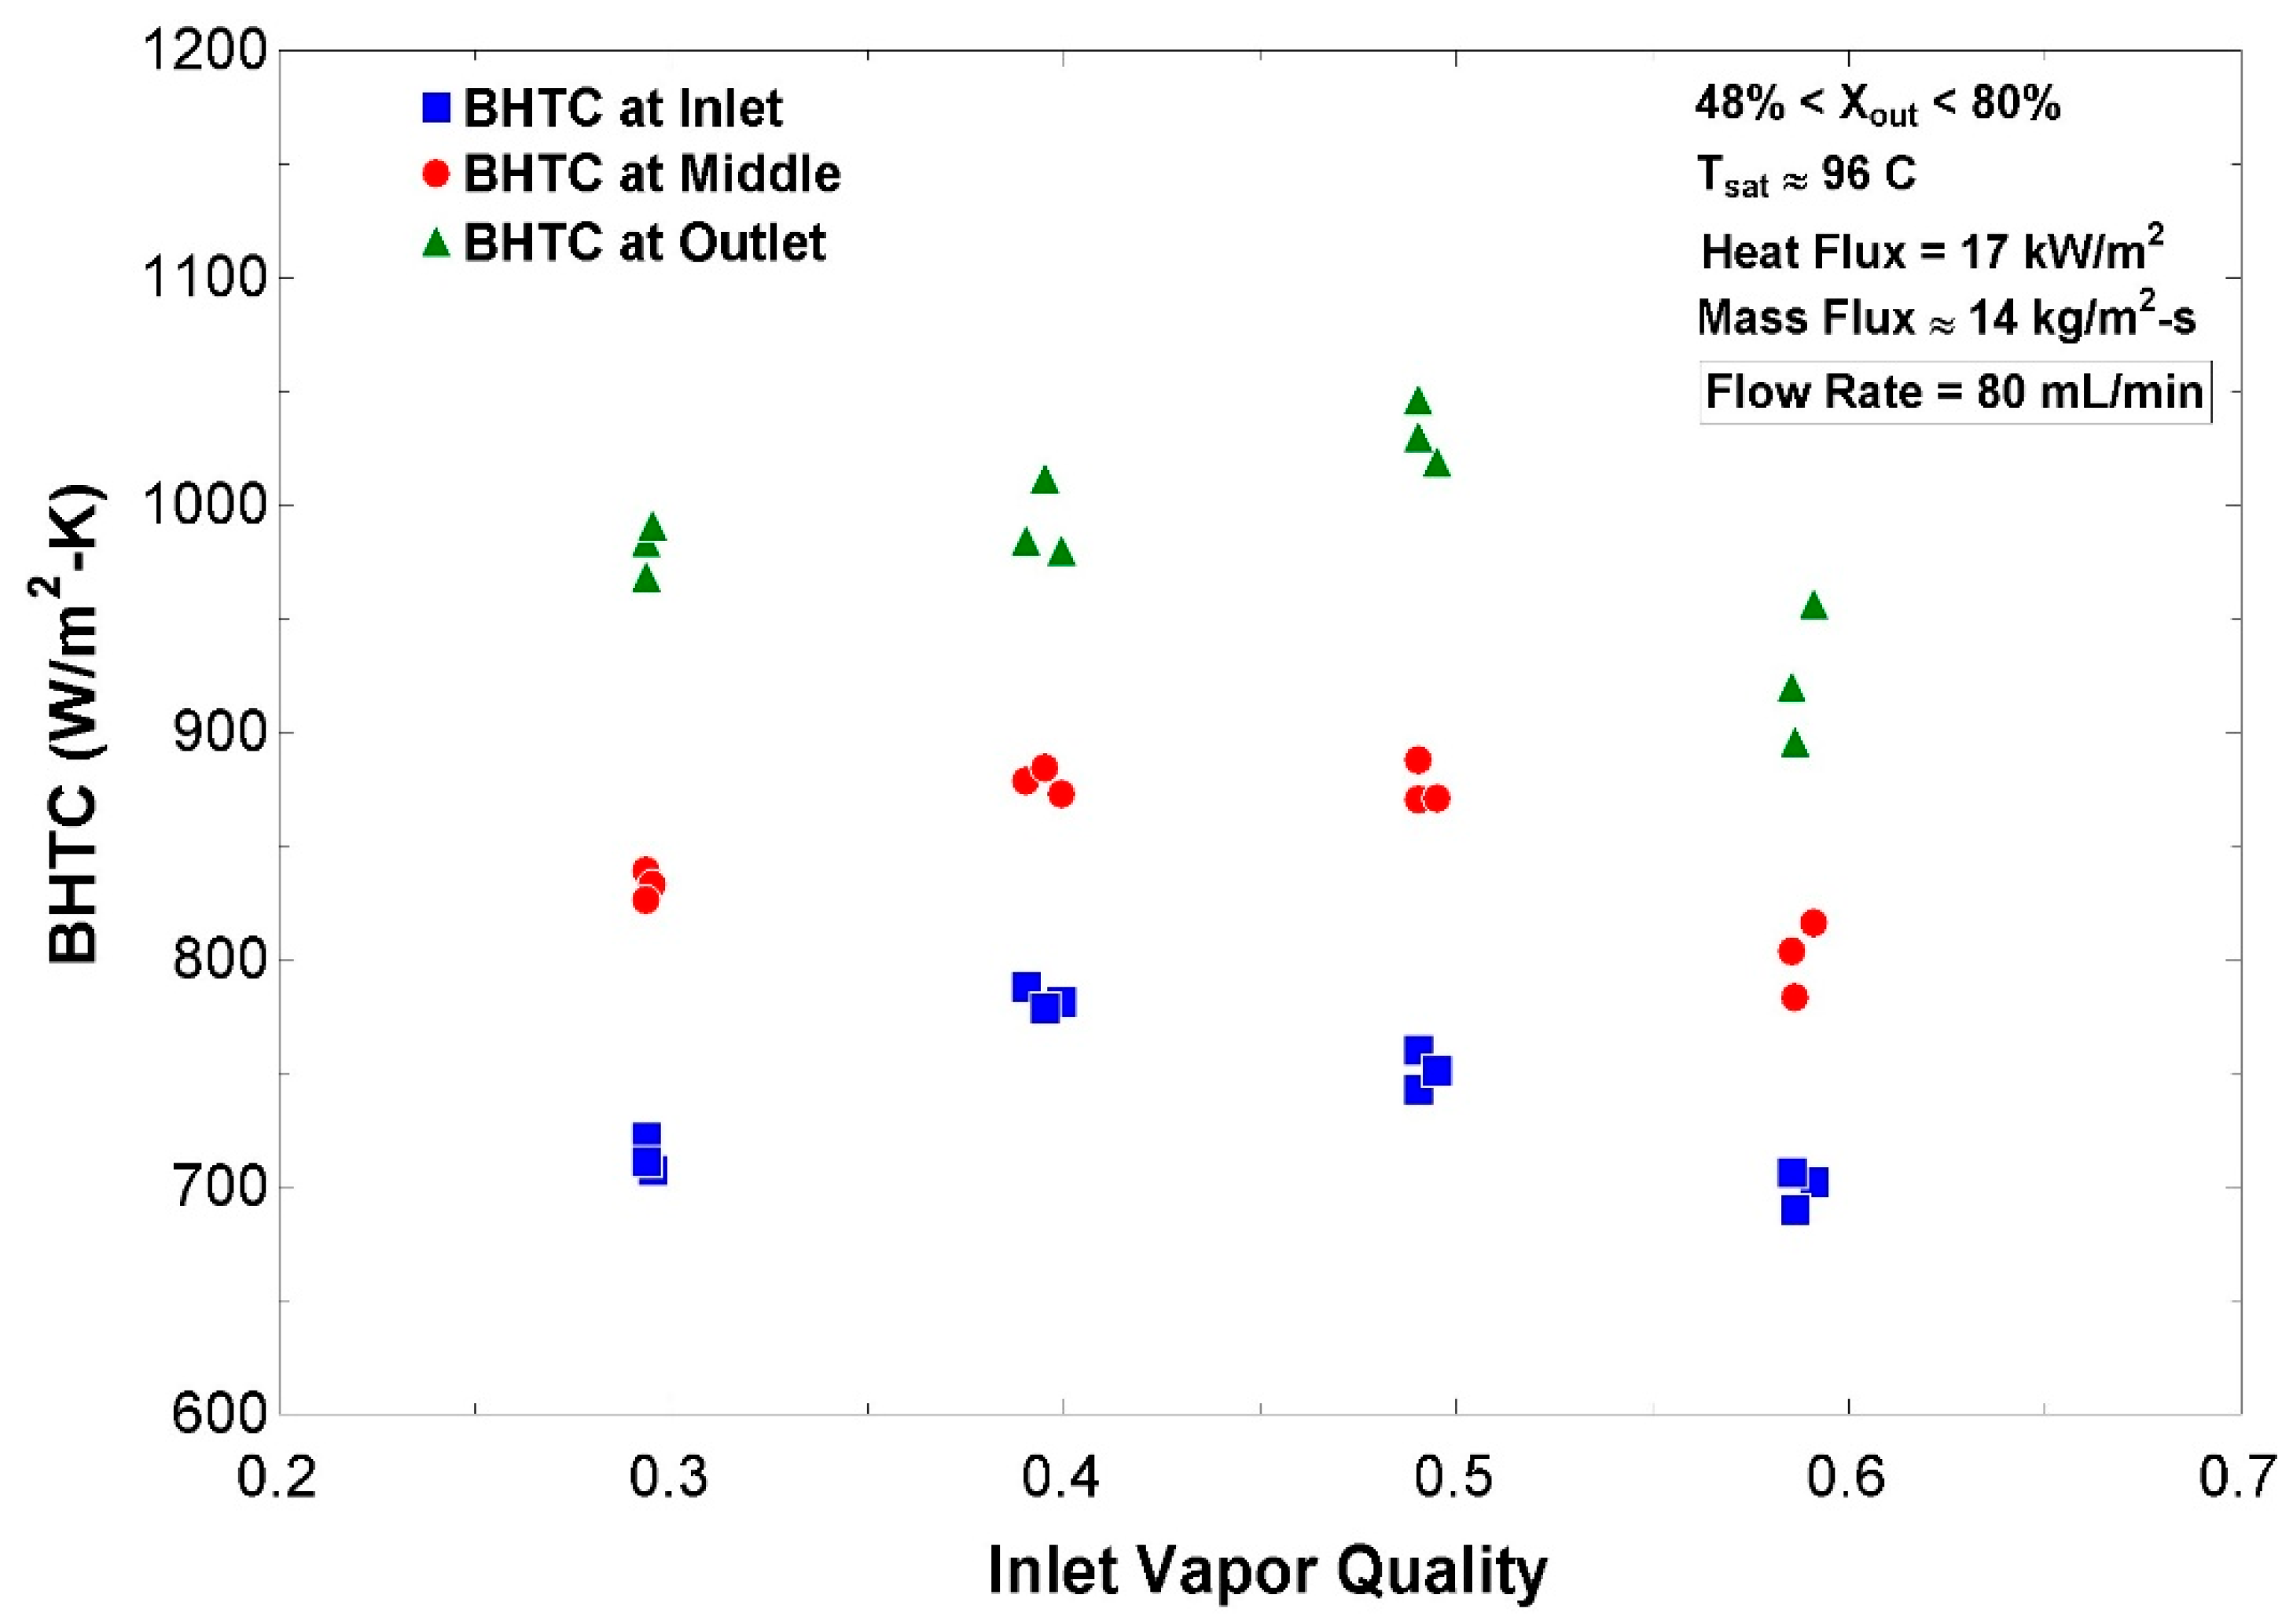
Figure 10 shows the variations in local boiling heat transfer coefficient (BHTC) with local vapor quality for a given range of qualities at the inlet of the test section at a constant saturation temperature of 96 °C, constant wall heat flux of 17 kW/m2, and constant flow rate of 80 mL/min. For all the experimented operating conditions with a range of mass fluxes and vapor qualities, the local liquid-phase Reynolds numbers (Retp,l) are found to be always less than 1000; whereas, the local gas-phase Reynolds numbers (Retp,g) are always higher than 2300, that is, the critical Reynolds number for the internal flow. This indicates that, while the liquid phase of the flow boiling is laminar, the gas phase lies in the turbulent regime. As the local vapor quality increases, the liquid-phase Reynold decreases whereas the gas-phase Reynold increases. According to the flow pattern map developed by Wojtan et al. [25] for two-phase flow boiling in a horizontal smooth tube with the inner diameter of 11 mm (i.e., the same size and orientation as the present study), the flow pattern in the present study is found to be stratified over the experimented range of mass fluxes and vapor qualities at the constant heat flux of 17 kW/m2.
As represented in Figure 10, the local vapor qualities at the middle and outlet range from 39% to 69% and from 48% to 80%, respectively, for a variety of vapor qualities from 30% to 60% at the inlet of the test section. The local BHTCs at the inlet, middle, and outlet of test section reached a peak at certain inlet vapor qualities between 40% and 50%. As shown in this figure, the local BHTCs at the middle and outlet are maximized at 888 W/m2-K and 1050 W/m2-K for the inlet quality of 50% where their corresponding local vapor qualities are 59% and 69%, respectively. A similar trend of BHTC reaching a peak with local vapor quality can also be observed through the BHTC correlations proposed by Shah [26], Kandlikar [27], Kandlikar et al. [28], and Bertsch et al. [29] when the operating conditions experimented in the present study are engaged. In flow boiling of water at low mass fluxes in plain horizontal tubes, the local heat transfer coefficient is commonly observed to peak at intermediate vapor qualities of approximately 50–80%. This behavior arises from the coexistence of a sufficiently thin liquid film that continues to wet the heated wall while a high-velocity vapor core induces strong interfacial shear and turbulence, thereby enhancing liquid film renewal and evaporation efficiency. At lower vapor qualities, heat transfer is limited by the dominance of nucleate boiling with comparatively lower convective contributions, whereas at higher vapor qualities, progressive thinning and eventual dryout of the liquid film reduce wall wetting, causing a deterioration in heat transfer performance. The balance between vigorous evaporation, interfacial turbulence, and wall wetting thus explains the peak in BHTC observed in this vapor quality regime [8,27]. Therefore, the smallest BHTCs in saturated two-phase flow region exist at vapor qualities beyond the aforementioned range of 50–80%, owing to the low thermal conductivity of the vapor relative to that of the liquid.
As vividly seen in Figure 10, for the same inlet quality and the same mass flux, the local BHTCs increase along the test section as local vapor quality increases, so that the BHTCs at the outlet are found to be greater than those at the middle and inlet.
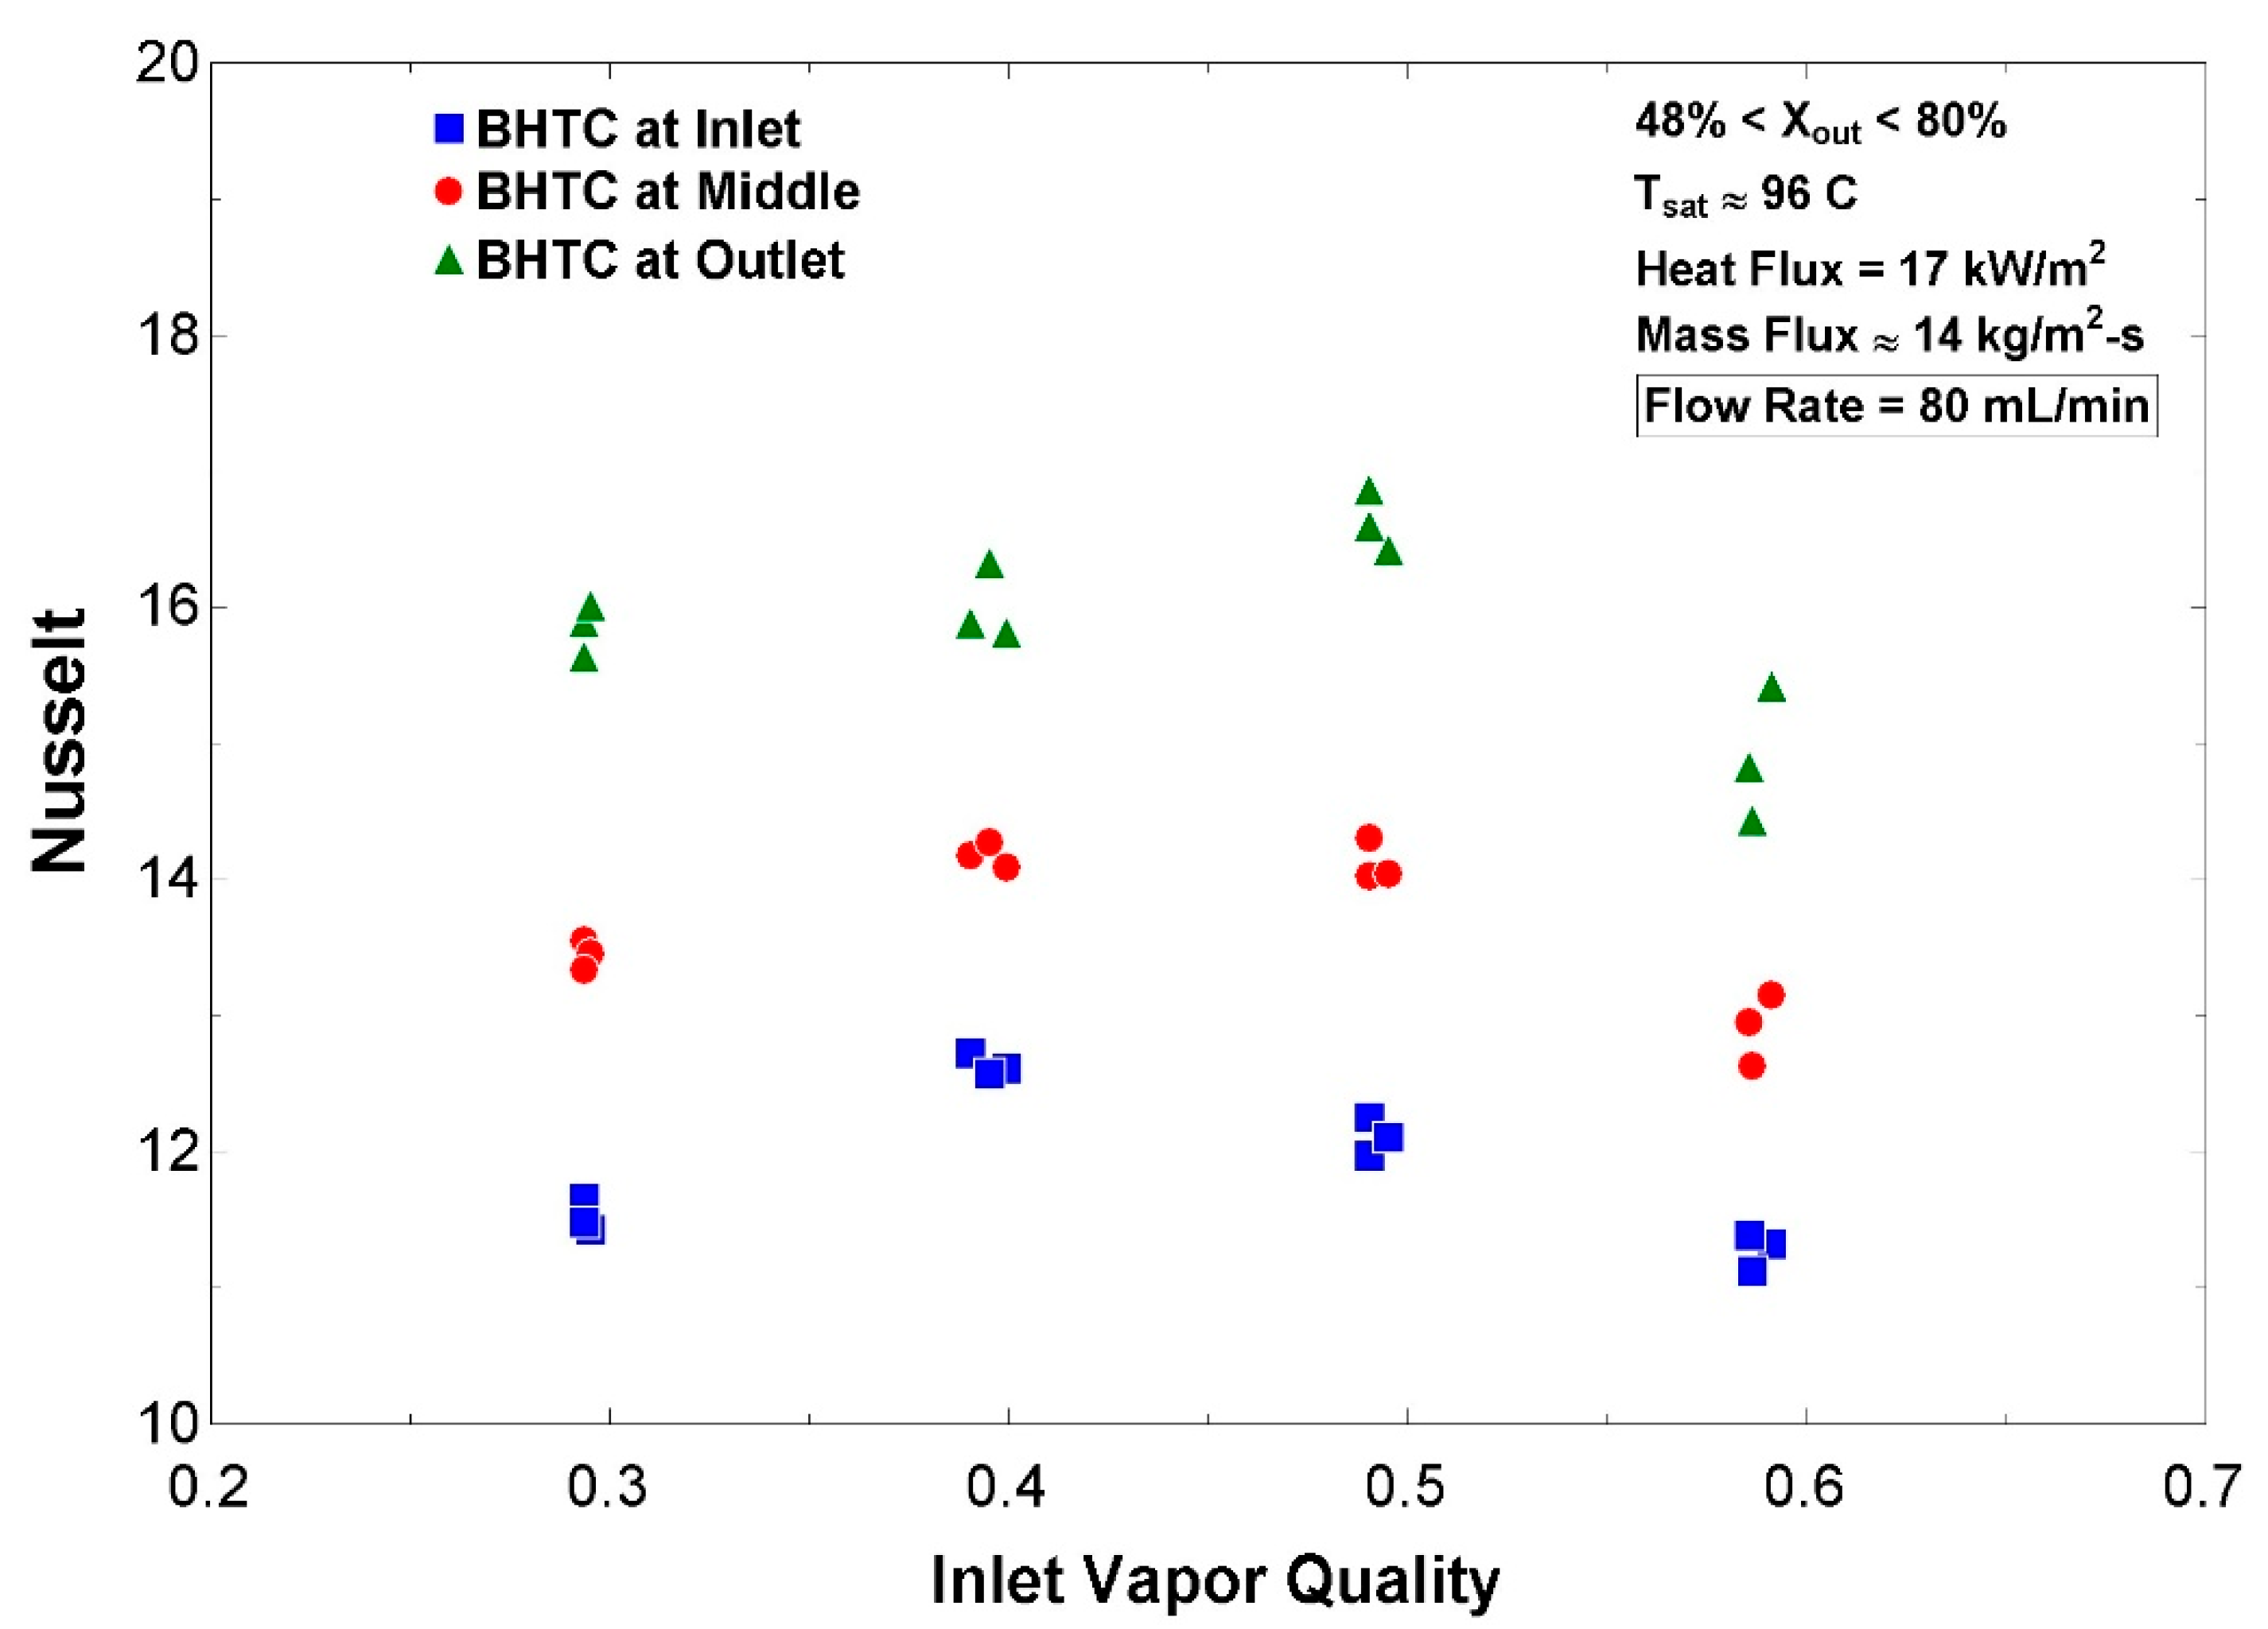
Figure 11 represents the variations in local Nusselt with local vapor quality for a range of vapor qualities at the inlet of the test section. Being directly proportional to the local BHTC, the local Nusselt follows a similar trend to the local BHTC variations with local quality, so that the local Nusselt at the outlet is maximized up to 16.5 for an inlet quality of 50%, corresponding to an outlet quality of 69%.

3.2.2. Effect of Mass Flux

Figure 12 illustrates the variations in local BHTC with mass flux at the given constant saturation temperature and wall heat flux for the constant vapor quality of 40% at test section inlet. As mass flux increases, local BHTCs at the inlet, middle, and outlet are found to increase. As shown in this figure, the local BHTC at the outlet increases from nearly 850 to 1050 W/m2-K with an increase in flow rate from 50 to 100 mL/min for a constant inlet quality of 40%. For the same mass flux and the same inlet vapor quality, the local BHTCs increase along the test section as local quality increases, leading the BHTCs at the outlet to be greater than those at the middle and inlet.
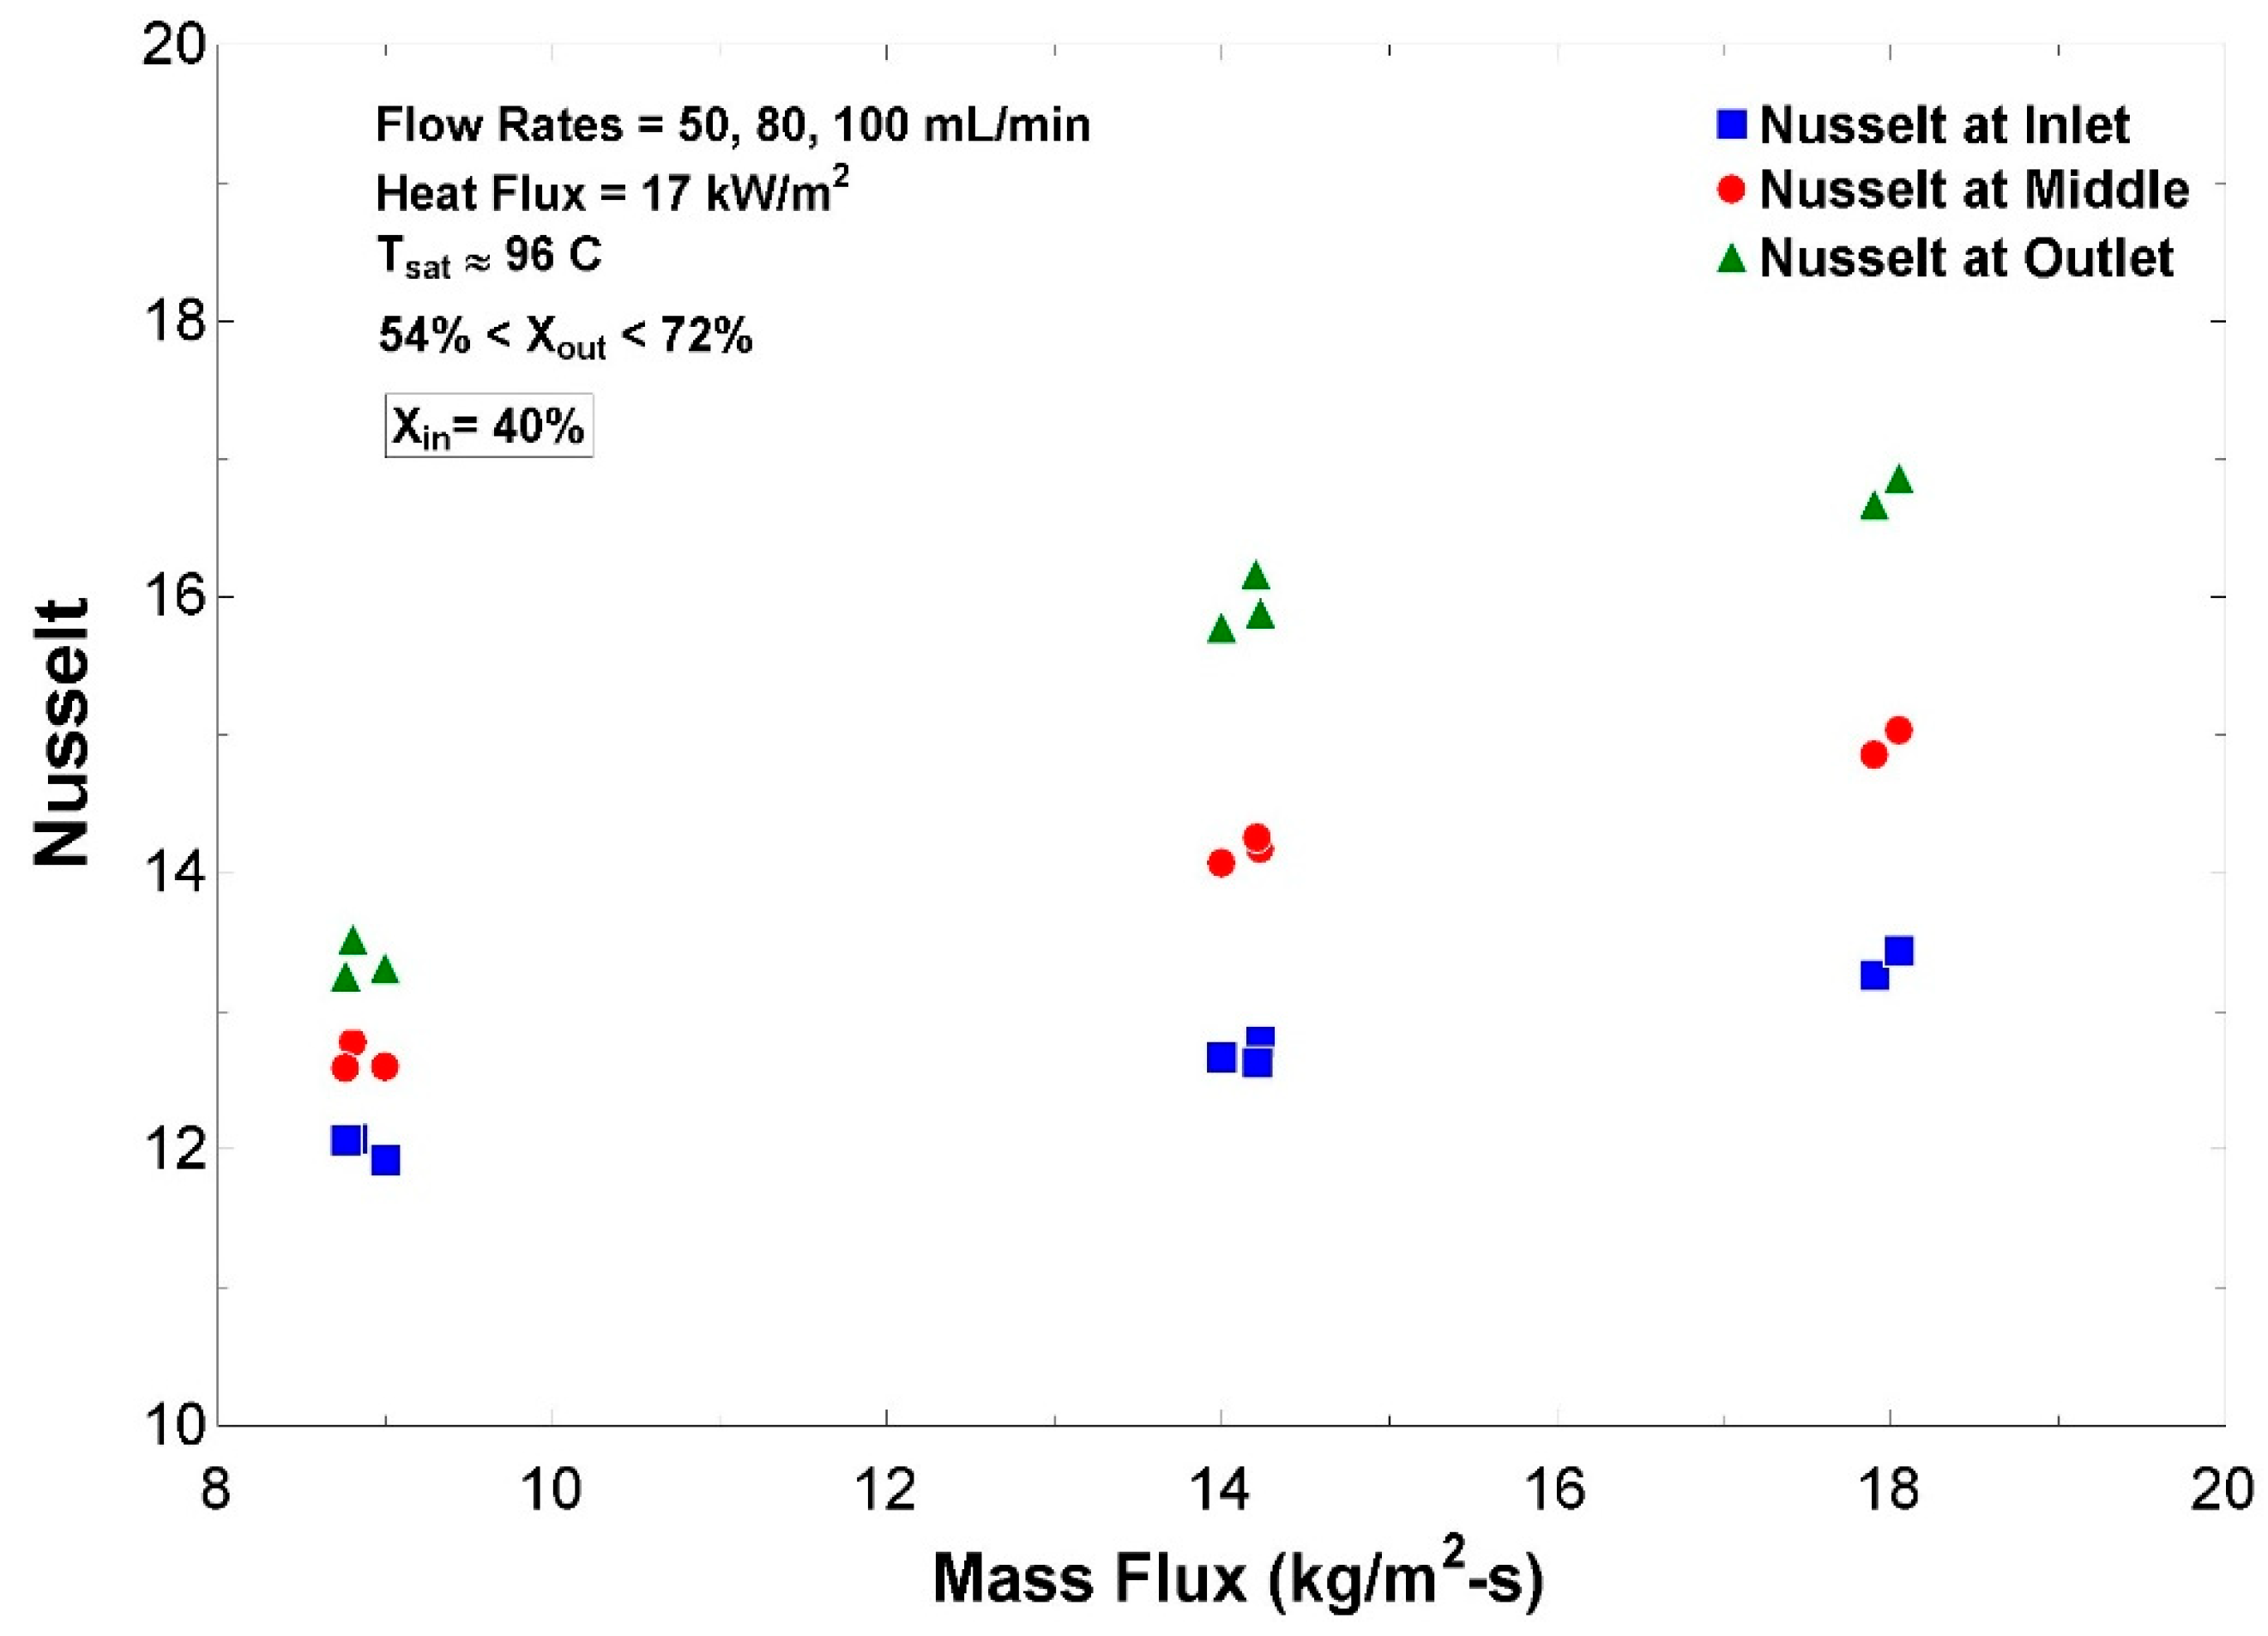
As represented in Figure 13, local Nusselt follows the same increasing trend of local BHTC variations with mass flux. The local Nusselt at the outlet increases from 13.2 to virtually 17 (a change of 3.8) over the given range of mass fluxes for a constant inlet quality while the amplitude of changes in local Nusselt at the outlet with vapor quality is almost 1.5, as reflected in Figure 11. Accordingly, by comparing the average rates of Nusselt changes using N u G G m a x = 3.8 9 / 18 = 7.6 and N u x x m a x = 1.5 0.3 / 0.6 = 3 from Figure 11 and Figure 13, respectively, it is revealed that the mass flux has a stronger effect than that of vapor quality on the heat transfer parameters of BHTC and Nusselt under the LPLF operating conditions.

3.2.3. Comparison of Two-Phase Results with the Literature

For comparison purposes, nine empirical correlations from the literature [26,27,28,29,30,31,32,33,34] are used to predict local BHTCs as a function of vapor quality and mass flux for saturated two-phase flow boiling of water in horizontal conventional tubes for the operating conditions conducted in the present study. This analysis reveals that the vast majority of the existing empirical correlations fail to accurately predict BHTCs under LPLF conditions, leading to substantial overestimation of BHTCs. However, the correlation introduced by Gungor and Winterton [31] is the only empirical correlation which predicts the experimental results in the present study with reasonable accuracy.
Figure 14 compares BHTCs at the outlet between the present study and several empirical correlations at a constant saturation temperature, constant wall heat flux, constant mass flux, and a given range of vapor qualities at the inlet from 30% to 60% where their corresponding local qualities at the outlet range from 48% to 80%, respectively. Under these operating conditions, the correlations by Shah [26], Kandlikar [27], Kandlikar et al. [28], and Bertsch et al. [29] showed a trend similar to the present study in variations in BHTC outlet with vapor quality. The BHTC outlet in the present study reached a peak at the inlet quality of 50% (corresponding outlet quality of 69%). Similarly, the correlations proposed in [26,27,28,29] predict the BHTC to maximize at inlet qualities between 40% (corresponding outlet quality of 59%) and 50% (corresponding outlet quality of 69%). While the other correlations by Gungor and Winterton (1986) [30], Liu and Winterton [32], Wattelet et al. [33], and Fang et al. [34] exhibited an increasing trend in BHTCs with vapor quality, the correlation by Gungor and Winterton (1987) [31] predicts the BHTC to take a decreasing trend with vapor quality.
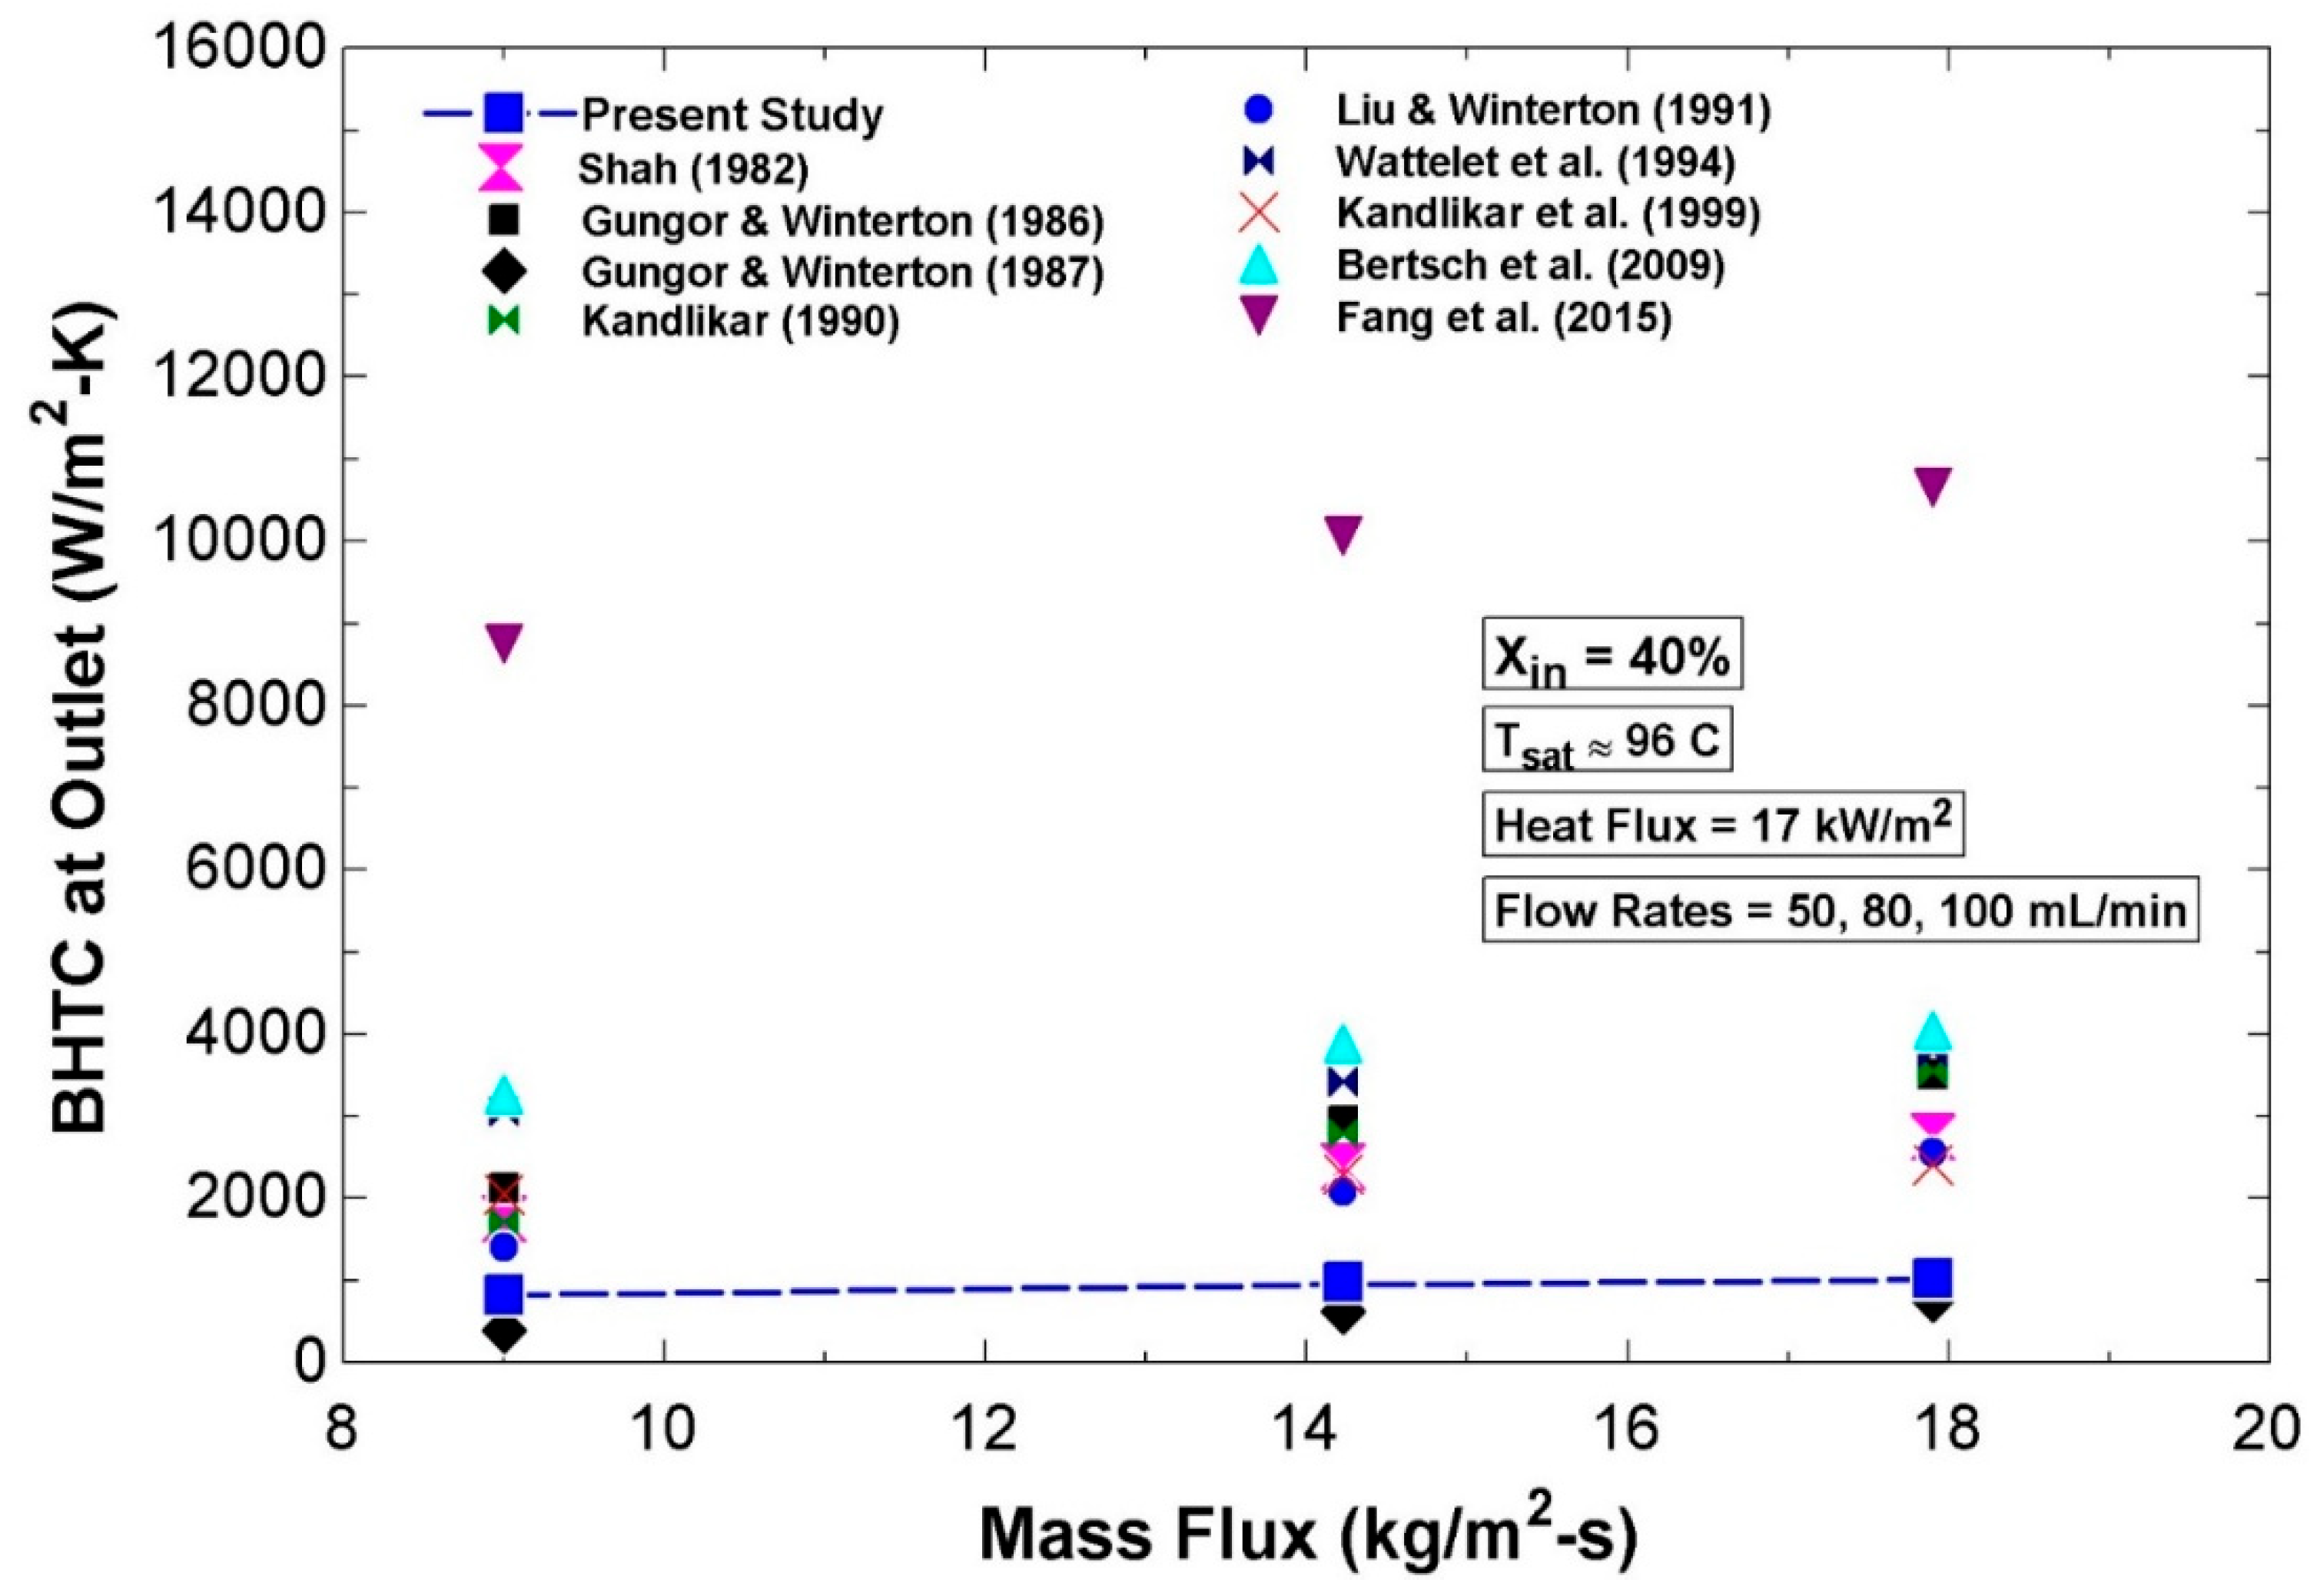
Figure 15 compares BHTCs at the outlet between the present study and nine empirical correlations for a constant inlet quality of 40% and a given range of mass fluxes from 9 to 18 kg/m2-s where their corresponding local qualities at the outlet range from 70% to 55%, respectively. Similarly to the trend found by the present experimental results, all the correlations predict the BHTCs to increase as mass flux increases.
As represented in Figure 14 and Figure 15, three correlations by Bertsch et al. [29], Wattelet et al. [33], and Fang et al. [34] significantly overestimate the BHTCs. This can be traced to the applicability and validity range of these correlations, such that the correlation by Wattelet et al. was derived from R-12 and R-134a refrigerant data whereas the correlations by Bertsch et al. and Fang et al. are applicable to mini- and microchannels with hydraulic diameters less than 3 mm and mass fluxes greater than 20 kg/m2-s.
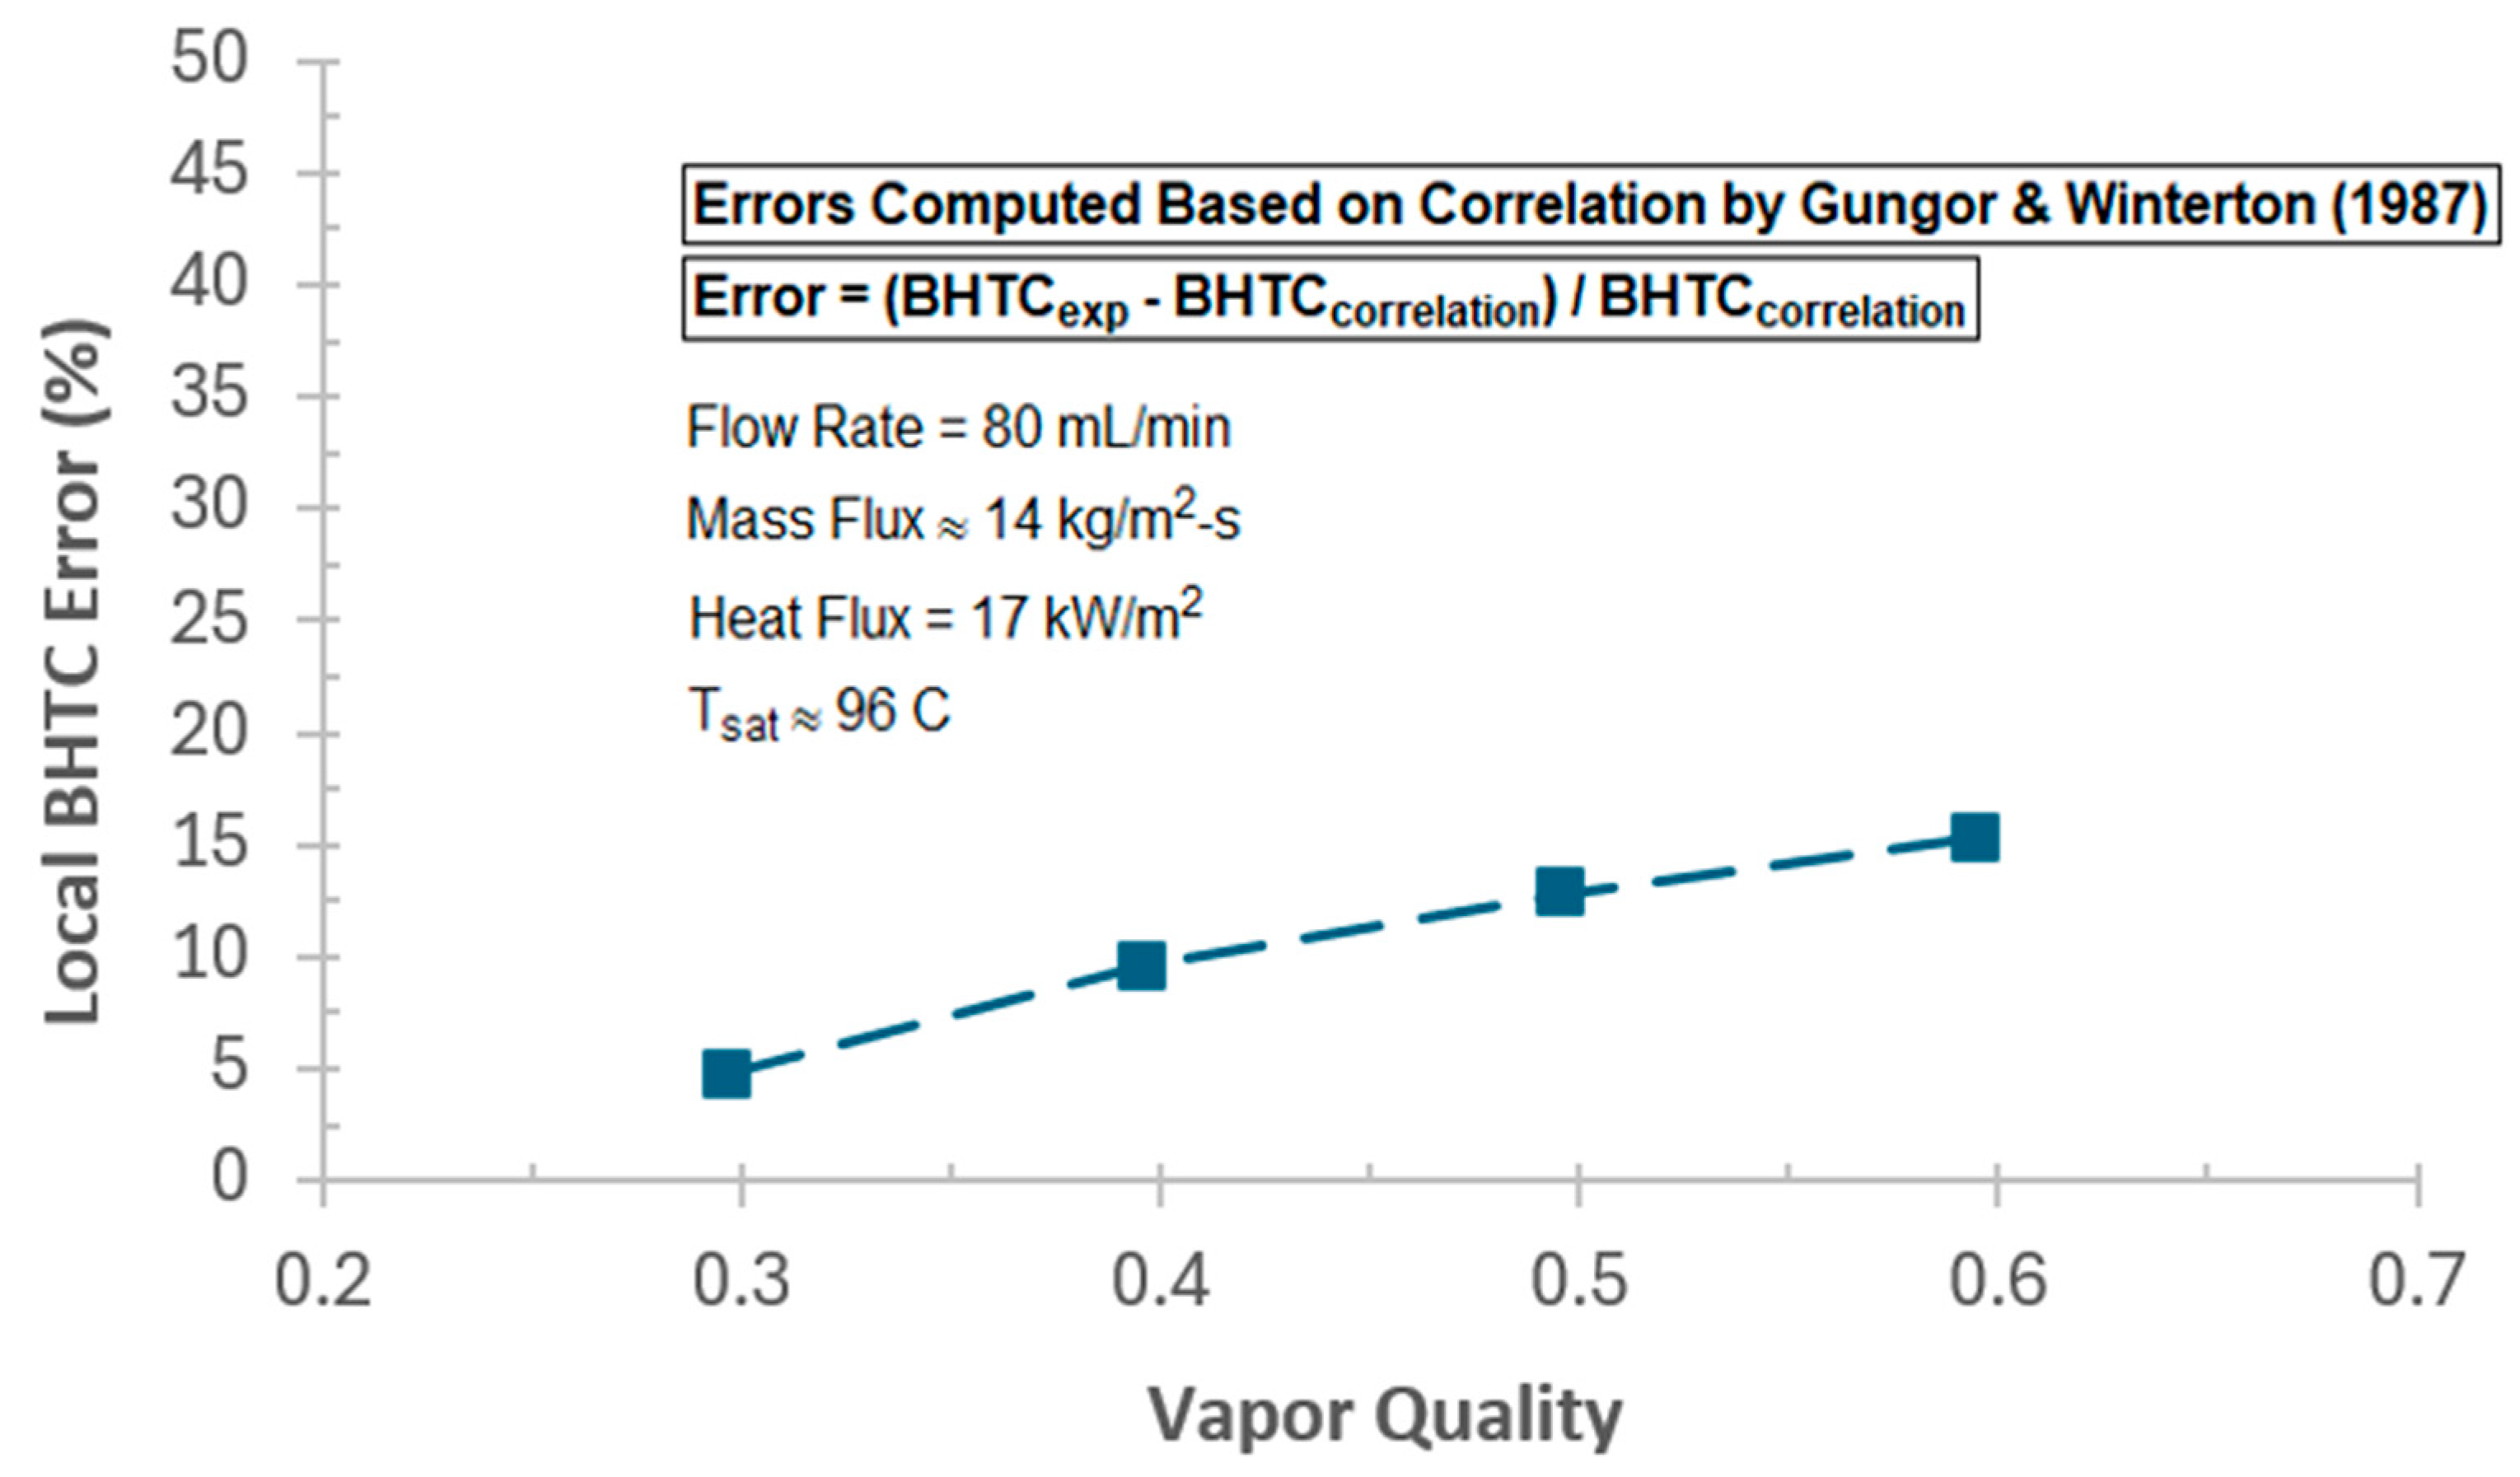
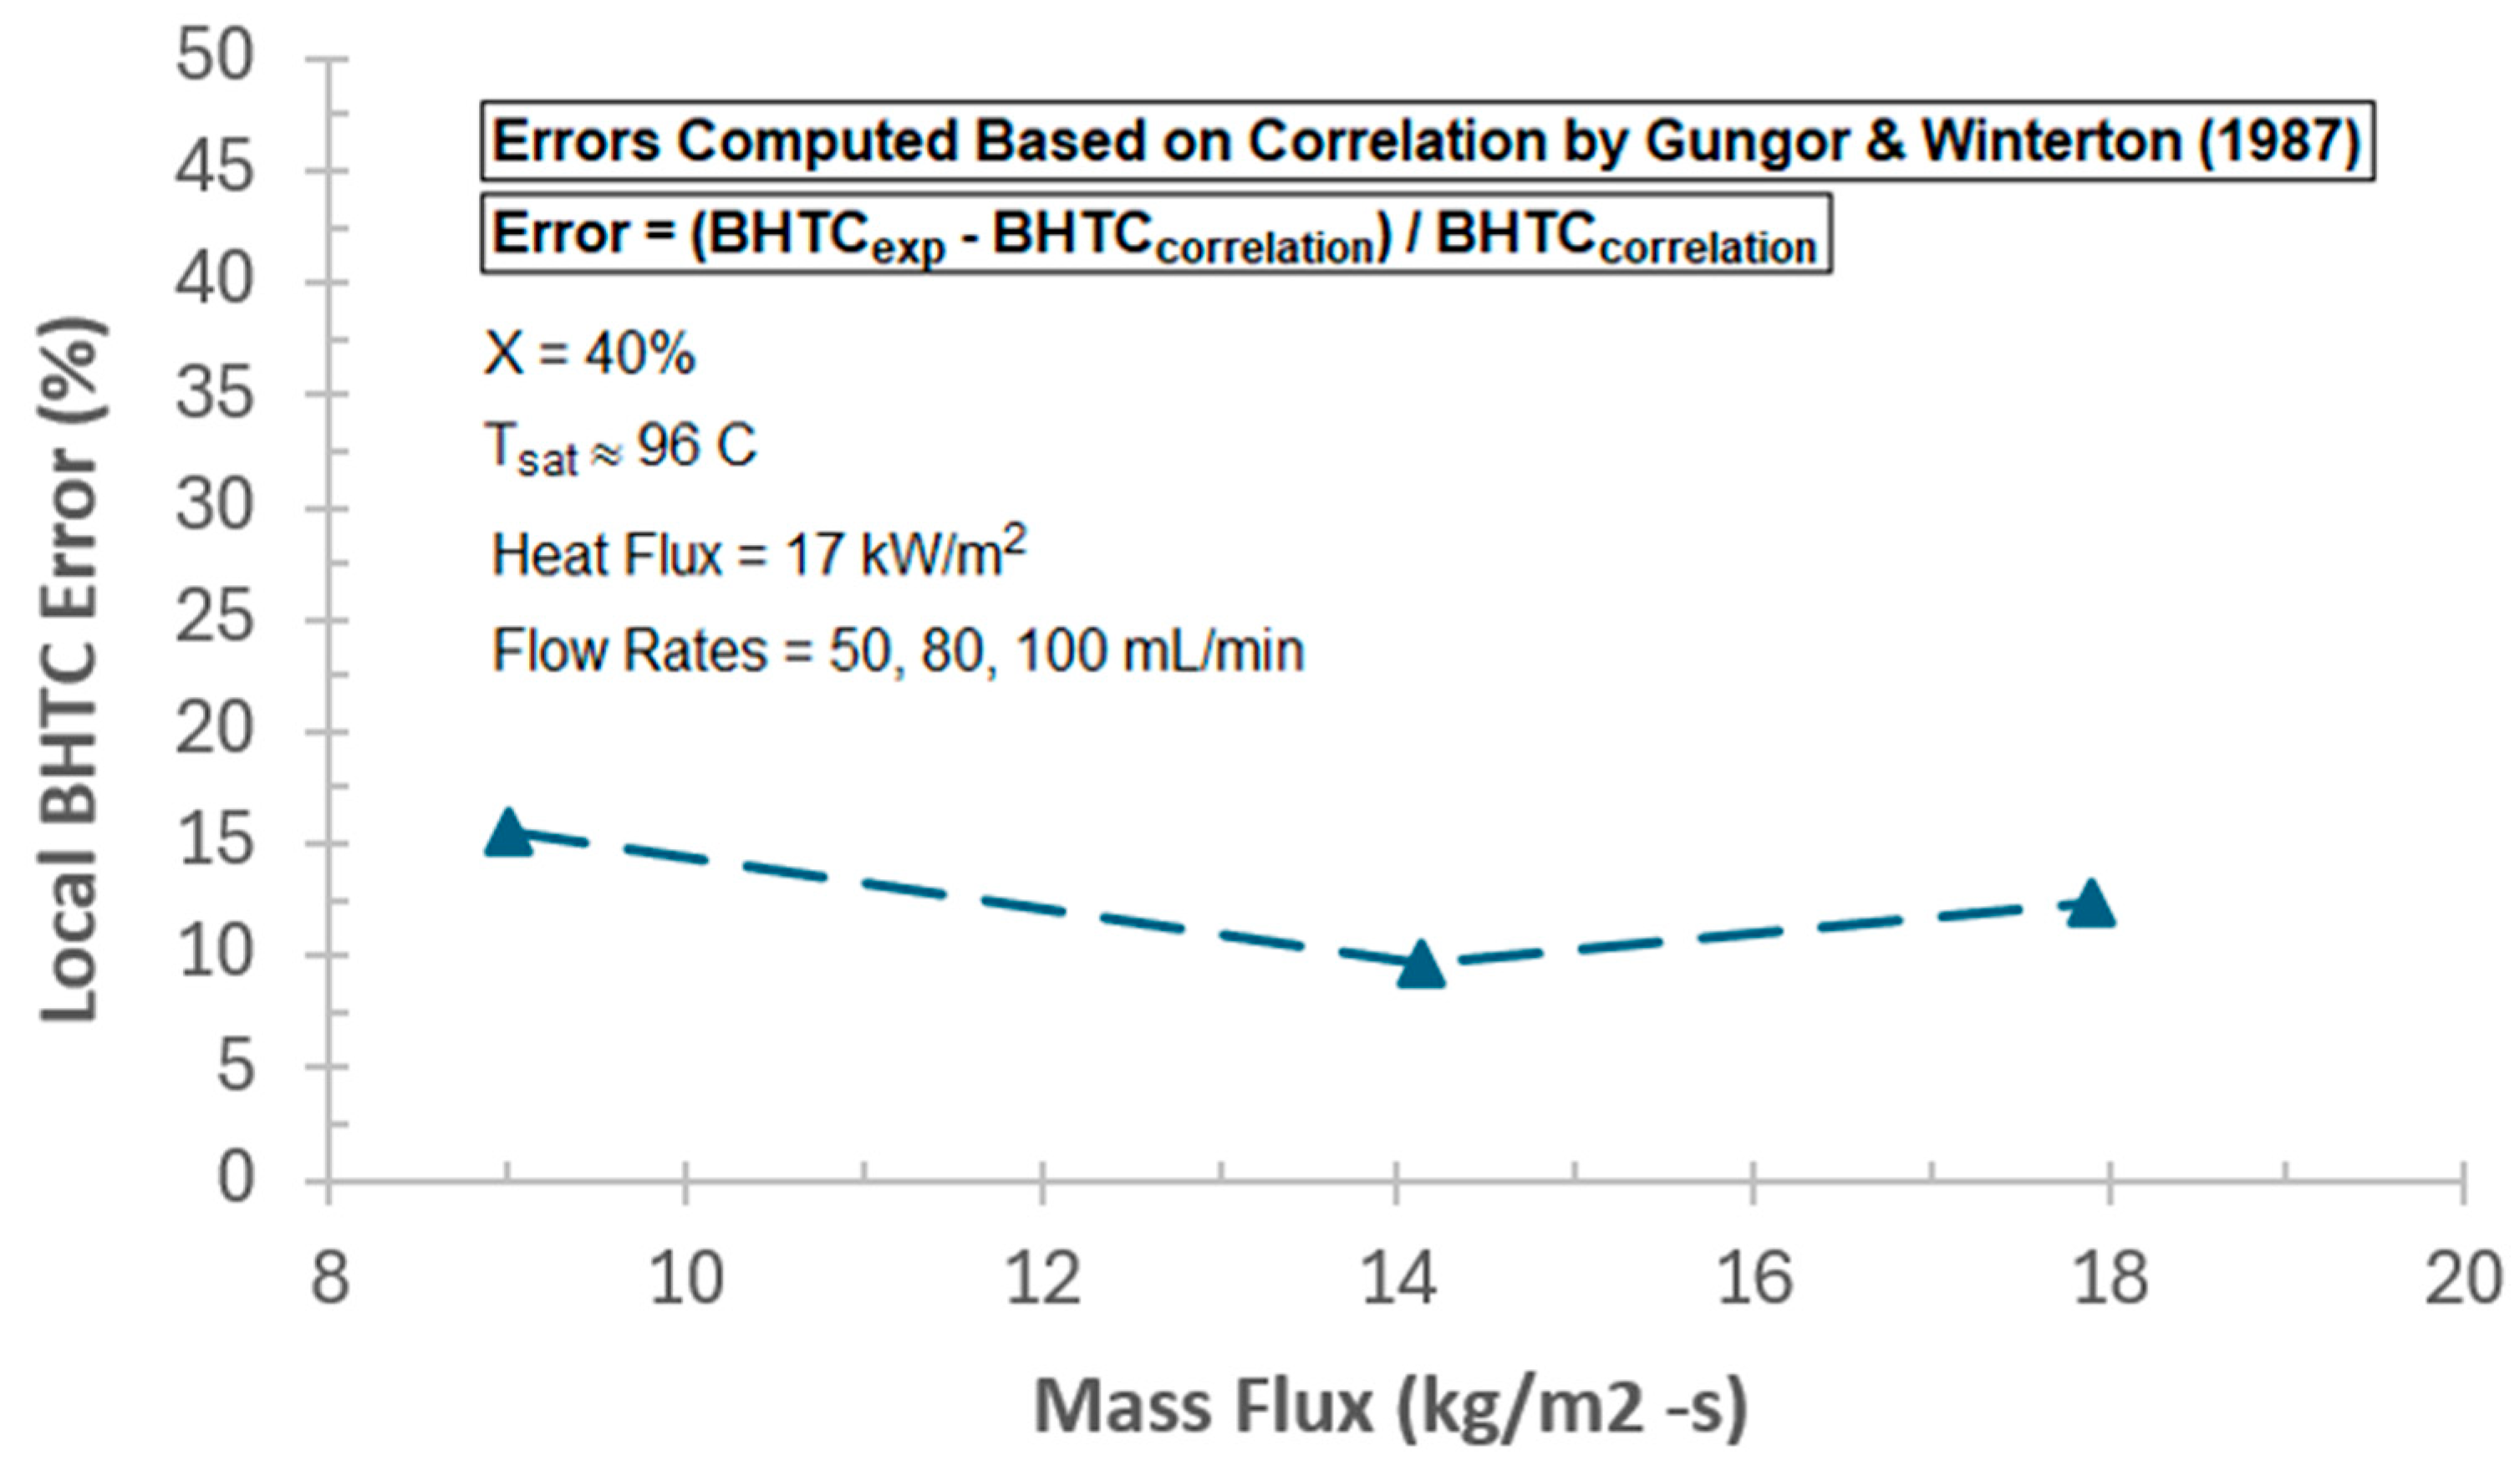
Figure 16 and Figure 17 display deviations of the experimental local BHTCs in error percentage from the empirical correlation proposed by Gungor and Winterton [31] for a given range of inlet vapor qualities and mass fluxes, respectively. This correlation is expressed as follows:
h t p h l = S S 2 + F F 2
where h l = 0.023   R e l 0.8   P r l 0.4   K l D i ,     S = 1 + 3000   B o 0.86 , and F = 1.12 x 1 x 0.75 ρ l ρ g 0.41 . If the liquid-phase Froude number ( F r l = G ρ l 2 g   D i ) for horizontal tubes is smaller than 0.05, S2 and F2 in the above correlation are as follows: S 2 = F r l 0.1 2 F r l and F 2 = F r l , otherwise both are set to be 1 for vertical tubes or for horizontal tubes with F r l 0.05 .
As shown in Figure 16, the error of local BHTCs increases from 4% to 15% as vapor quality at the inlet increases from 0.3 to 0.6, respectively, at a constant mass flux. The growing errors of experimental BHTCs with vapor quality are attributed to the trend of BHTC variations with vapor quality, predicted by the correlation of Gungor and Winterton [31]. While the experimental BHTCs from the present study reaches a peak at a certain vapor quality, the correlation by Gungor and Winterton predicts a consistently decreasing trend of local BHTCs with vapor quality under the LPLF conditions. Consequently, the BHTCs measured by the present study and those predicted by the correlation diverge from each other with the increase in local vapor quality. As illustrated in Figure 17, the deviations of the experimental BHTCs range from 9% to 15% over a given range of mass fluxes at a constant local vapor quality at the inlet. The correlation proposed by Gungor and Winterton is reported to have a mean deviation of 25% for subcooled boiling and 21.4% for saturated boiling [30,31], which conforms well to the BHTC results experimented in the present study.

4. Conclusions and Future Work

In the present study, heat transfer performance of single-phase and two-phase flow boiling of water in a horizontal conventional tube was experimentally characterized under low-pressure low-flow (LPLF) conditions, where limited studies have been conducted to date. For ranges of local vapor qualities from 30% to 80% and mass flux from 8 to 20 kg/m2-s, it was found that local boiling heat transfer coefficient (BHTC) and Nusselt at the test section exit reached a peak at a certain range of local qualities between 55% and 75%. A similar trend of BHTC variations was also predicted by several empirical correlations in the literature, reaching a peak at local qualities between 45% and 85%. It was also observed that local BHTCs and local Nusselt increased with the increase in mass flux, and the impact of mass flux was stronger than that of vapor quality. For the same mass flux and the same inlet vapor quality, local BHTCs increased along the test section as local quality increased, so that BHTCs at the outlet were always found to be greater than those at the middle and inlet. In contrast, heat transfer coefficient (HTC) for the liquid single-phase flow at the test section inlet was found to be larger than those at the middle and outlet for a range of mass fluxes, which is rooted in the entrance effect at the inlet of the test section where the liquid flow is still neither thermally nor hydrodynamically fully developed. While local HTCs and Nusselt at the inlet and middle increased slightly with the increase in mass flux, they remained fairly constant with the change in mass flux at the outlet where the laminar flow was fully developed. Furthermore, the present work investigated the suitability of the existing BHTC correlations for the experimented range of LPLF conditions, disclosing that most fail to properly estimate BHTC, except the correlation proposed by Gungor and Winterton in 1987.
It is important to point out that the present work studies a narrow, but extreme, range of mass fluxes lying in LPLF conditions at constant wall heat flux. The effect of heat flux variations, lower operating pressures towards high vacuum, and a wider range of mass fluxes up to 200 kg/m2-s are subject to be investigated further. Local BHTC of water was experimentally shown to vary with vapor quality, reaching a peak. However, possible mechanisms underlying this phenomenon are not clear or well investigated in the literature. Therefore, further efforts are required to better appreciate the mechanisms of flow boiling heat transfer in LPLF conditions for developing more reliable and accurate prediction tools and empirical correlations. To address this, vapor bubble formation, growth, and departure from the heated surface along with the boiling flow patterns are subject to further studies through modifying the experimental setup to allow direct high-speed camera observations in a transparent test section. Additionally, a computational fluid dynamic (CFD) simulation of the two-phase flow dynamics is a great help in understanding the governing mechanisms deeper.

Author Contributions

Conceptualization, M.K.; Methodology, M.K.; Software, C.F. and D.H.; Validation, M.K.; Formal analysis, M.K.; Investigation, M.K., C.F. and D.H.; Data curation, M.K.; Writing—original draft, M.K.; Writing—review & editing, M.K., C.F. and D.H.; Visualization, M.K., C.F. and D.H.; Supervision, M.K.; Project administration, M.K. All authors have read and agreed to the published version of the manuscript.

Funding

This research received no external funding.

Data Availability Statement

The data presented in this study are available on request from the corresponding author.

Acknowledgments

The authors would like to sincerely thank Gabrielle Gaustad, Dean of Kazuo Inamori School of Engineering at Alfred University, as well as Mahesh Hosur, Associate Dean of the College of Engineering at Texas A&M University, Kingsville, for their advice and ongoing support.

Conflicts of Interest

The authors declare no conflict of interest.

Nomenclature

SymbolDefinition
BHTCBoiling heat transfer coefficient (W/m2-K)
CpSpecific heat (J/kg-K)
GMass flux (kg/m2-s)
hEnthalpy (J/kg)
HTCSingle-phase heat transfer coefficient (W/m2-K)
IDInner diameter of test tube (m)
KThermal conductivity (W/m-K)
LTube length (m)
m ˙ Mass flow rate (kg/s)
μ Dynamic viscosity (kg/s-m)
NuNusselt number
ODOuter Diameter of test tube
PPressure (kPa)
PrPrandtl number
QHeat transfer rate (W)
RThermal resistance (K/W)
ReReynolds number
TTemperature (°C)
xVapor quality
SubscriptDefinition
fSaturated liquid
gSaturated vapor or gas phase
inInlet of test section
lLiquid phase
outoutlet of test section
spSingle-phase
satSaturation
tpTwo-phase

References

  1. Kabir, M.; Downer, J.; Preller, E.; Tarau, C.; Yang, B.; Xu, J. Two-phase Flow Boiling of Nanofluids in Mini- and Microchannels. High Temp. 2023, 61, 262–287. [Google Scholar] [CrossRef]
  2. Mudawar, I. Recent advances in high-flux, two-phase thermal management. J. Therm. Sci. Eng. Appl. 2013, 5, 021012. [Google Scholar] [CrossRef]
  3. Santini, L.; Cioncolini, A.; Butel, M.T.; Ricotti, M.E. Flow boiling heat transfer in a helically coiled steam generator for nuclear power applications. Int. J. Heat Mass Transf. 2016, 92, 91–99. [Google Scholar] [CrossRef]
  4. Kabir, M.; Gemeda, T.; Preller, E.; Xu, J. Design and Development of a PCM-Based Two-Phase Heat Exchanger Manufactured Additively for Spacecraft Thermal Management Systems. Int. J. Heat Mass Transf. 2021, 180, 121782. [Google Scholar] [CrossRef]
  5. Downer, J.; Kabir, M.; Xu, J. The Design and Development of a Smart Multilayer Coating with Variable Emissivity Capability for Space Vehicle Thermal Control Systems. In Proceedings of the 2023 22nd IEEE Intersociety Conference on Thermal and Thermomechanical Phenomena in Electronic Systems (ITherm), Orlando, FL, USA, 30 May 2023–2 June 2023; pp. 1–12. [Google Scholar] [CrossRef]
  6. Kabir, M.; Preller, E.; Mohammed, R.; Tarau, C.; Yang, B.; Alvarez-Hernandez, A.; Xu, J. Investigation of An Additively Manufactured Two-Phase Heat Exchanger with Built-In Thermal Storage. In Proceedings of the 2023 22nd IEEE Intersociety Conference on Thermal and Thermomechanical Phenomena in Electronic Systems (ITherm), Orlando, FL, USA, 30 May 2023–2 June 2023; pp. 1–7. [Google Scholar] [CrossRef]
  7. Kandlikar, S.G.; Garimella, S.; Li, D.; Colin, S.; King, M.R. Heat Transfer and Fluid Flow in Minichannels and Microchannels; Elsevier: Amsterdam, The Netherlands, 2006; ISBN 0-0804-4527-6. [Google Scholar]
  8. Bergman, T.L.; Lavine, A.S.; Incropera, F.P.; Dewitt, D.P. Fundamentals of Heat and Mass Transfer, 7th ed.; John Wiley & Sons Inc.: Hoboken, NJ, USA, 2011; ISBN 13 978-0470-50197-9. [Google Scholar]
  9. Baburajan, P.; Bisht, G.; Gupta, S.; Prabhu, S. Measurement of subcooled boiling pressure drop and local heat transfer coefficient in horizontal tube under LPLF conditions. Nucl. Eng. Des. 2013, 255, 169–179. [Google Scholar] [CrossRef]
  10. Kabir, M. An Experimental Approach to Heat Loss Measurement of Horizontal Two-Phase Flow Boiling in Low-Pressure Low-Flow (LPLF) Conditions. Case Stud. Therm. Eng. 2024, 58, 104419. [Google Scholar] [CrossRef]
  11. Lee, E.; Kang, H.; Kim, Y. Flow boiling heat transfer and pressure drop of water in a plate heat exchanger with corrugated channels at low mass flux conditions. Int. J. Heat Mass Transf. 2014, 77, 37–45. [Google Scholar] [CrossRef]
  12. Butrymowicz, D.; Śmierciew, K.; Karwacki, J.; Borsukiewicz, A.; Gagan, J. Experimental Investigations of Flow Boiling Heat Transfer under Near-Critical Pressure for Selected Working Fluids. Sustainability 2022, 14, 14029. [Google Scholar] [CrossRef]
  13. Kharangate, C.R.; Mudawar, I. Review of computational studies on boiling and condensation. Int. J. Heat Mass Transf. 2017, 108, 1164–1196. [Google Scholar] [CrossRef]
  14. Sun, Z.-C.; Ma, X.; Ma, L.-X.; Li, W.; Kukulka, D.J. Flow Boiling Heat Transfer Characteristics in Horizontal, Three-Dimensional Enhanced Tubes. Energies 2019, 12, 927. [Google Scholar] [CrossRef]
  15. Lu, Q.; Chen, D.; Li, C.; He, X. Experimental investigation on flow boiling heat transfer in conventional and mini vertical channels. Int. J. Heat Mass Transf. 2017, 107, 225–243. [Google Scholar] [CrossRef]
  16. Changhong, P.; Yun, G.; Suizheng, Q.; Dounan, J.; Changhua, N. Two-phase flow and boiling heat transfer in two vertical narrow annuli. Nucl. Eng. Des. 2005, 235, 1737–1747. [Google Scholar] [CrossRef]
  17. Yan, J.; Bi, Q.; Liu, Z.; Zhu, G.; Cai, L. Subcooled flow boiling heat transfer of water in a circular tube under high heat fluxes and high mass fluxes. Fusion Eng. Des. 2015, 100, 406–418. [Google Scholar] [CrossRef]
  18. Yan, J.; Bi, Q.; Cai, L.; Zhu, G.; Yuan, Q. Subcooled flow boiling heat transfer of water in circular tubes with twisted-tape inserts under high heat fluxes. Exp. Therm. Fluid Sci. 2015, 68, 11–21. [Google Scholar] [CrossRef]
  19. Hardik, B.; Prabhu, S. Boiling pressure drop and local heat transfer distribution of water in horizontal straight tubes at low pressure. Int. J. Therm. Sci. 2016, 110, 65–82. [Google Scholar] [CrossRef]
  20. Hardik, B.; Prabhu, S. Boiling pressure drop and local heat transfer distribution of helical coils with water at low pressure. Int. J. Therm. Sci. 2017, 114, 44–63. [Google Scholar] [CrossRef]
  21. Kabir, M.; Xu, J. Experimental Approaches to Measurement of Vapor Quality of Two-Phase Flow Boiling. Heat Transfer—Design, Experimentation, and Applications; Intech Open: London, UK, 2021; ISBN 978-1-83968-438-8. [Google Scholar]
  22. Jagirdar, M.; Lee, P.S. Methodology for More Accurate Assessment of Heat Loss in Microchannel Flow Boiling. In Proceedings of the IEEE 16th Electronics Packaging Technology Conference, Singapore, 3–5 December 2014; pp. 630–634. [Google Scholar]
  23. Balasubramanian, K.; Jagirdar, M.; Lee, P.; Teo, C.; Chou, S. Experimental investigation of flow boiling heat transfer and instabilities in straight microchannels. Int. J. Heat Mass Transf. 2013, 66, 655–671. [Google Scholar] [CrossRef]
  24. Burmeister, L.C. Convective Heat Transfer, 2nd ed.; John Wiley: Hoboken, NJ, USA, 1993; ISBN 978-0-471-57709-6. [Google Scholar]
  25. Wojtan, L.; Ursenbacher, T.; Thome, J.R. Investigation of flow boiling in horizontal tubes: Part I—A new diabatic two-phase flow pattern map. Int. J. Heat Mass Transf. 2005, 48, 2955–2969. [Google Scholar] [CrossRef]
  26. Shah, M.M. Chart correlation for saturated boiling heat transfer equations and further study. ASHRAE Trans. 1982, 88, 185–196. [Google Scholar]
  27. Kandlikar, S.G. A General correlation for saturated two-phase flow boiling heat transfer inside horizontal and vertical tubes. J. Heat Transf. 1990, 112, 219–228. [Google Scholar] [CrossRef]
  28. Kandlikar, S.G.; Shoji, M.; Dhir, V.K. Handbook of Phase Change: Boiling and Condensation; Taylor & Francis: Philadelphia, PA, USA, 1999. [Google Scholar]
  29. Bertsch, S.S.; Groll, E.A.; Garimella, S.V. A composite heat transfer correlation for saturated flow boiling in small channels. Int. J. Heat Mass Transf. 2009, 52, 2110–2118. [Google Scholar] [CrossRef]
  30. Gungor, K.E.; Winterton, R.H.S. A general correlation for flow boiling in tubes and annuli. Int. J. Heat Mass Transf. 1986, 29, 351–358. [Google Scholar] [CrossRef]
  31. Gungor, K.E.; Winterton, R.H.S. Simplified general correlation for saturated flow boiling and comparisons of correlations with data. Chem. Eng. Res. Des. 1987, 65, 148–156. [Google Scholar]
  32. Liu, Z.; Winterton, R.H.S. A general correlation for saturated and subcooled flow boiling in tubes and annuli, based on a nucleate pool boiling equation. Int. J. Heat Mass Transf. 1991, 34, 2759–2766. [Google Scholar] [CrossRef]
  33. Wattelet, J.P.; Chato, J.C.; Souza, A.L.; Christoffersen, B.R. Evaporative characteristics of R-12, R-134a, and a mixture at low-mass fluxes. In Proceedings of the ASHRAE Winter Meeting, New Orleans, LA, USA, 23–27 January 1994; pp. 603–615. [Google Scholar]
  34. Fang, X.; Zhou, Z.; Wang, H. Heat transfer correlation for saturated flow boiling of water. Appl. Therm. Eng. 2015, 76, 147–156. [Google Scholar] [CrossRef]
Figure 1. The experimental apparatus [10].
Thermo 05 00033 g001
Figure 2. Schematic of the experimental test apparatus.
Thermo 05 00033 g002
Figure 3. Flowchart of experimental measurement of HTC at each mass flux.
Thermo 05 00033 g003
Figure 4. Actual heat transferred versus heat supplied by varying the flow rate with constant temperatures at the inlet and outlet for laminar liquid flow (single-phase-based heat loss approach for heat calibration).
Thermo 05 00033 g004
Figure 5. Actual heat transferred versus heat supplied by varying the flow rate with constant saturation temperature for two-phase flow boiling (two-phase-based heat loss approach for heat calibration).
Thermo 05 00033 g005
Figure 6. Variations in outlet vapor quality with mass flux for a given range of inlet qualities at constant heat flux and saturation temperature.
Thermo 05 00033 g006
Figure 7. Variations in HTC with mass flux for liquid single-phase flow in laminar regime.
Thermo 05 00033 g007
Figure 8. Variations in Nusselt with mass flux for liquid single-phase flow in laminar regime.
Thermo 05 00033 g008
Figure 9. Errors of experimental HTCs from the correlation proposed by Hausen [24] for laminar single-phase flow.
Thermo 05 00033 g009
Figure 10. Variations in local BHTCs with local vapor quality for a given range of inlet qualities at a constant flow rate of 80 mL/min (corresponding to the mass flux of 14 kg/m2-s).
Thermo 05 00033 g010
Figure 11. Variations in local Nusselt with local vapor quality for a range of inlet qualities at a constant flow rate of 80 mL/min (corresponding to the mass flux of 14 kg/m2-s).
Thermo 05 00033 g011
Figure 12. Variations in local BHTCs with mass flux for an inlet vapor quality of 40%.
Thermo 05 00033 g012
Figure 13. Variations in local Nusselt with mass flux for an inlet vapor quality of 40%.
Thermo 05 00033 g013
Figure 14. Comparison of BHTC results with empirical correlations for a range of vapor qualities at inlet.
Thermo 05 00033 g014
Figure 15. Comparison of BHTC results with empirical correlations for a range of mass fluxes.
Thermo 05 00033 g015
Figure 16. Errors of experimental BHTCs from the correlation (13) over a range of vapor qualities.
Thermo 05 00033 g016
Figure 17. Errors of experimental BHTCs from the correlation (13) over a range of mass fluxes.
Thermo 05 00033 g017
Table 1. Specifications of sensing devices engaged to the test apparatus.
Precision InstrumentModelManufacturer/VendorOperating RangesAccuracyQTY in Use
Pressure TransmitterPX119-030AIOMEGAPressure Range:
0–30 psia (207 kPa)
Temperature Range:
−40–135 °C
±0.5%6
Thermocouple Probe3857K223McMaster-CarrType T,
Temperature Range:
−200–370 °C
±0.75%9
Wall-Mounted Thermocouple10-3148-T-2Thermocouple Technology LLC.Type T,
Temperature Range:
up to 480 °C
±0.75%6
Turbine FlowmeterFLR1009-SSOMEGAFlow Rate Range:
50–500 mL/min,
Temperature Range:
0–50 °C
±1%1
Power Monitor and ControllerPN2000
&
LC-Z-120
Poniie and HTS/AmptekMax Power: 1840 W,
Max Current: 16 A,
110–220 V,
50–60 Hz
±1%6 × 6
Table 2. Operating conditions and test section geometry.
Geometry
Test SectionMaterialTube SurfaceOrientationNominal
Tube Size
Inner
Diameter
Outer
Diameter
Length
Circular TubeCopperSmooth/PlainHorizontal3/810.9 mm12.7 mm98 cm
Test Operating Conditions at the Inlet of Test Section
ConfigurationWorking Fluid T i n or T s a t P i n or P s a t Heat FluxMass FluxInlet Quality
Single-Phase FlowDistilled Water 40 ° C (inlet) 88 k P a 5–17 kW/m28–20 kg/m2-sSubcooled
Flow BoilingDistilled Water 96 ° C 88 k P a 5–17 kW/m28–20 kg/m2-s0.3 < x < 0.6
Table 3. Summary of uncertainty propagation analysis.
ParameterUncertainty
Surface and Fluid Temperatures±0.75%
Fluid Pressure±0.5%
Flow Rate±1%
Heat Supplied±1%
Tube Diameter±0.0001016 m
Tube Length±0.005 m
Heat Transferred±1.6%
Vapor Quality±2.3%
Heat Transfer Coefficient±5.5%
Disclaimer/Publisher’s Note: The statements, opinions and data contained in all publications are solely those of the individual author(s) and contributor(s) and not of MDPI and/or the editor(s). MDPI and/or the editor(s) disclaim responsibility for any injury to people or property resulting from any ideas, methods, instructions or products referred to in the content.