Article

Optimized Solar-Powered Evaporative-Cooled UFAD System for Sustainable Thermal Comfort: A Case Study in Riyadh, KSA

1
Mechanical Engineering Department, Faculty of Engineering, Beirut Arab University, Riad El Solh, P.O. Box 11-5020, Beirut 1107-2809, Lebanon
2
College of Engineering and Technology, American University of the Middle East, Egaila 54200, Kuwait
*
Author to whom correspondence should be addressed.
Thermo 2025, 5(3), 26; https://doi.org/10.3390/thermo5030026
Submission received: 26 June 2025 / Revised: 17 July 2025 / Accepted: 28 July 2025 / Published: 30 July 2025

Abstract

Evaporative cooling (EC) offers an energy-efficient alternative to direct expansion (DX) cooling but suffers from high water consumption. This limitation can be mitigated by pre-cooling incoming fresh air using cooler exhaust air via energy recovery. This study presents and optimizes a solar-driven EC system integrated with underfloor air distribution (UFAD) to enhance thermal comfort and minimize water use in a temporary office in Riyadh’s arid climate. A 3D CFD model was developed and validated against published data to simulate indoor airflow, providing data for thermal comfort evaluation using the predicted mean vote model in cases with and without energy recovery. A year-round hourly energy analysis revealed that the solar-driven EC-UFAD system reduces grid power consumption by 93.5% compared to DX-based UFAD under identical conditions. Energy recovery further cuts annual EC water usage by up to 31.3%. Operational costs decreased by 84% without recovery and 87% with recovery versus DX-UFAD.

1. Introduction

Air conditioners and electric fans currently account for approximately 20% of total electricity consumption in buildings worldwide. The rising demand for space cooling is putting considerable strain on the electrical infrastructure in many countries and contributing to higher greenhouse gas emissions [1]. Without strong governmental intervention, global demand for space cooling—and the energy required to meet it—is projected to increase by up to 85.2% by 2050, particularly in developing nations [2]. In hot and arid regions such as Riyadh in Saudi Arabia, cooling is not a luxury but a necessity, with ambient temperatures reaching as high as 45 °C. In such regions, air conditioning systems based on the vapor compression cycle are responsible for up to 70% of annual energy consumption [3].
With the sharp rise in energy prices, non-compressor-based cooling options are becoming increasingly popular. One such method, especially effective in hot and dry climates, is evaporative cooling (EC), which uses water evaporation to reduce air temperature. This natural and energy-efficient process works by absorbing heat from the surrounding air as water evaporates, resulting in cooler air. In contrast, direct expansion (DX) systems use refrigerant evaporation to absorb heat from nearby air, relying on mechanical components and higher energy consumption. EC systems are a more environmentally friendly substitute than traditional DX systems that depend on refrigerants that damage the ozone layer, since they just run on water. Direct, indirect, and multistage EC systems were thoroughly reviewed by Kapilan et al. [4] in three main respects. They reported that direct EC, where air comes into direct contact with water, is the most efficient and cost-effective among the three methods. Moreover, Hussain et al. [5] developed an effective, precise model to evaluate the thermal performance of three EC systems, considering both meteorological and systematic variables. Their results indicate that, within the data range investigated, the multistage EC system demonstrates the highest thermal performance compared to the other two systems. Yang et al. [6] summarized advancements in the research and development of indirect EC technology, highlighting key innovations and progress in the field. Their findings suggest that hybrid systems and system modifications can ensure effective cooling in both hot arid and hot humid climates, as dew-point evaporative coolers can produce air at lower temperatures.
Active EC systems consume minimal power to operate their fans, making them highly compatible with solar energy integration for sustainable operation. In their study on hybrid EC-solar energy systems, Xue et al. [7] demonstrated how these systems can meet cooling and energy demands while promoting sustainable environmental progress. Tripathi et al. [8] conducted a comparative study of dry channels and wet channels of solar-driven EC systems based on exergy variations and thermal performance. Their findings revealed that the exergy efficiency of the wet channel was 18.8% lower than that of the dry channel.
One limitation of EC systems is their relatively high supply of air temperature compared to traditional air conditioning systems. This makes EC particularly well-suited for underfloor air distribution (UFAD) systems, where the supply air temperature is typically 4–7 °C, which is higher than that of conventional overhead systems [9,10]. By leveraging this characteristic, UFAD systems can maintain effective thermal comfort while optimizing energy efficiency. In these systems, conditioned air is delivered through floor-mounted diffusers at a controlled velocity and extracted through ceiling-level exhaust vents. The airflow dynamics are driven by the interaction of supply air fountains and thermal plumes rising from heated surfaces, while buoyancy-driven flow helps lift contaminants upward. As a result, the UFAD space is effectively divided into two distinct zones: a lower region that remains clean and cool, and an upper region where warm, contaminated air accumulates [11]. These zones are separated by a density interface, formed when the total upward thermal plume flow balances the conditioned air supply rate [12]. Alajmi et al. [13] evaluated through both simulation and experimental analysis the energy performance of a UFAD system in a heated office building. They found that an optimized UFAD system can achieve 37–39% energy savings compared to conventional mixing ventilation systems, highlighting its potential for enhanced efficiency and sustainability. Rahmati et al. [14] conducted a CFD-based investigation into indoor air quality, thermal comfort, and energy consumption in a hybrid UFAD system integrated with a desk displacement ventilation system within a small office setting. Their findings revealed that the optimally designed hybrid system achieved a 16.6% reduction in energy consumption compared to an overhead system.
The evaporatively cooled UFAD system is considerably more energy-efficient than traditional DX-based UFAD systems [15]. However, the high water consumption of EC remains a major drawback, posing sustainability challenges despite its efficiency benefits.
A highly effective way to reduce water consumption in EC systems is to integrate an energy recovery heat exchanger between the fresh and exhaust air streams upstream of the EC unit.
This integrated system, known as an “ambiator”, pre-cools incoming fresh air prior to the EC process by leveraging the temperature difference between the exhaust air and outdoor fresh air. This approach can significantly reduce water consumption in EC systems by lowering the wet-bulb temperature of the entering airflow while maintaining a constant humidity ratio. This effect is particularly beneficial in extremely hot climates, where the temperature difference can reach 15–20 °C.
Jaber and Ezzat [16] examined the performance of an ambiator coupled with mixing ventilation, finding a 13.38% reduction in the base cooling load. However, certain key factors, such as the beneficial impact of energy recovery on EC water consumption and the viability of powering the ambiator with solar energy, remain unexamined. Furthermore, the integration of EC with UFAD systems is largely unexplored in the existing literature. This study investigates the performance of a solar-powered EC-UFAD system, emphasizing thermal comfort, water conservation, and energy efficiency.
Computational fluid dynamics (CFD) analysis was conducted on a standard temporary UFAD office space in Riyadh, KSA, to evaluate thermal comfort under various EC supply conditions, both with and without the use of an energy recovery heat exchanger. Furthermore, a feasibility study compared the EC-UFAD system with a DX-UFAD system, assessing their sustainability performance and cost-effectiveness under identical design conditions through a year-round hourly analysis. The detailed analysis highlights the water savings and overall reduction in operational costs achieved by the EC-UFAD system.

2. Materials and Methods

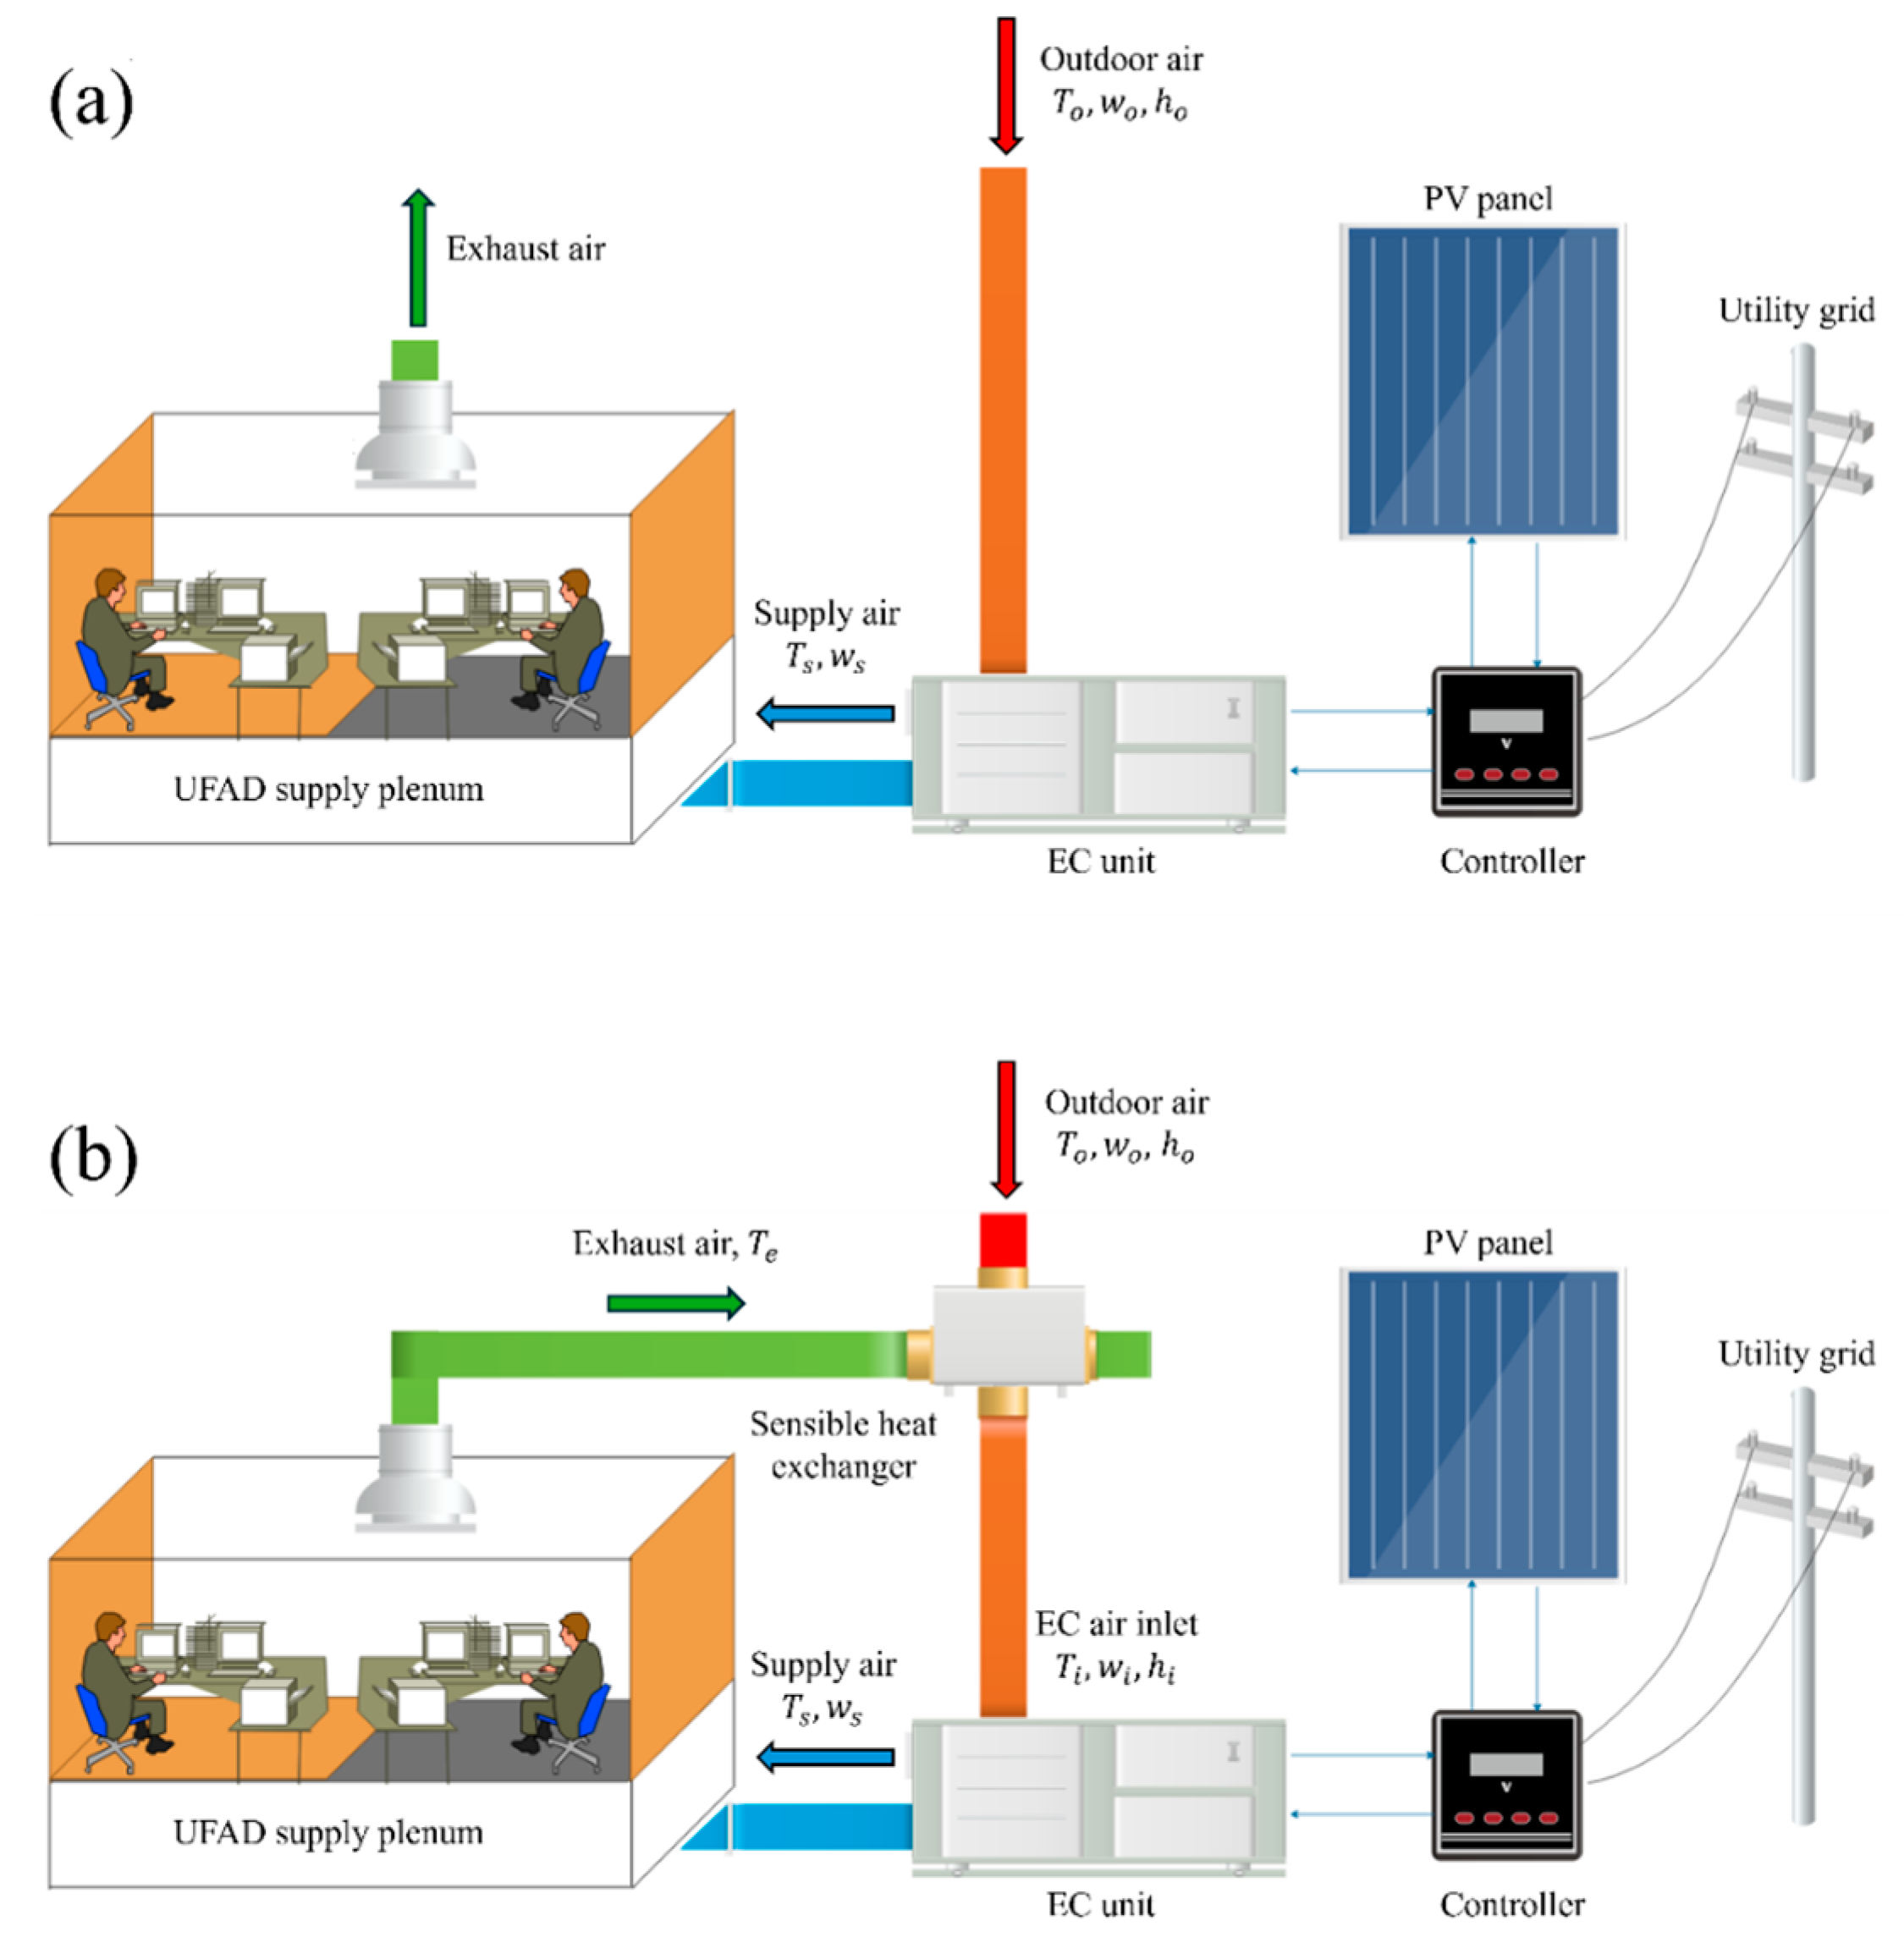
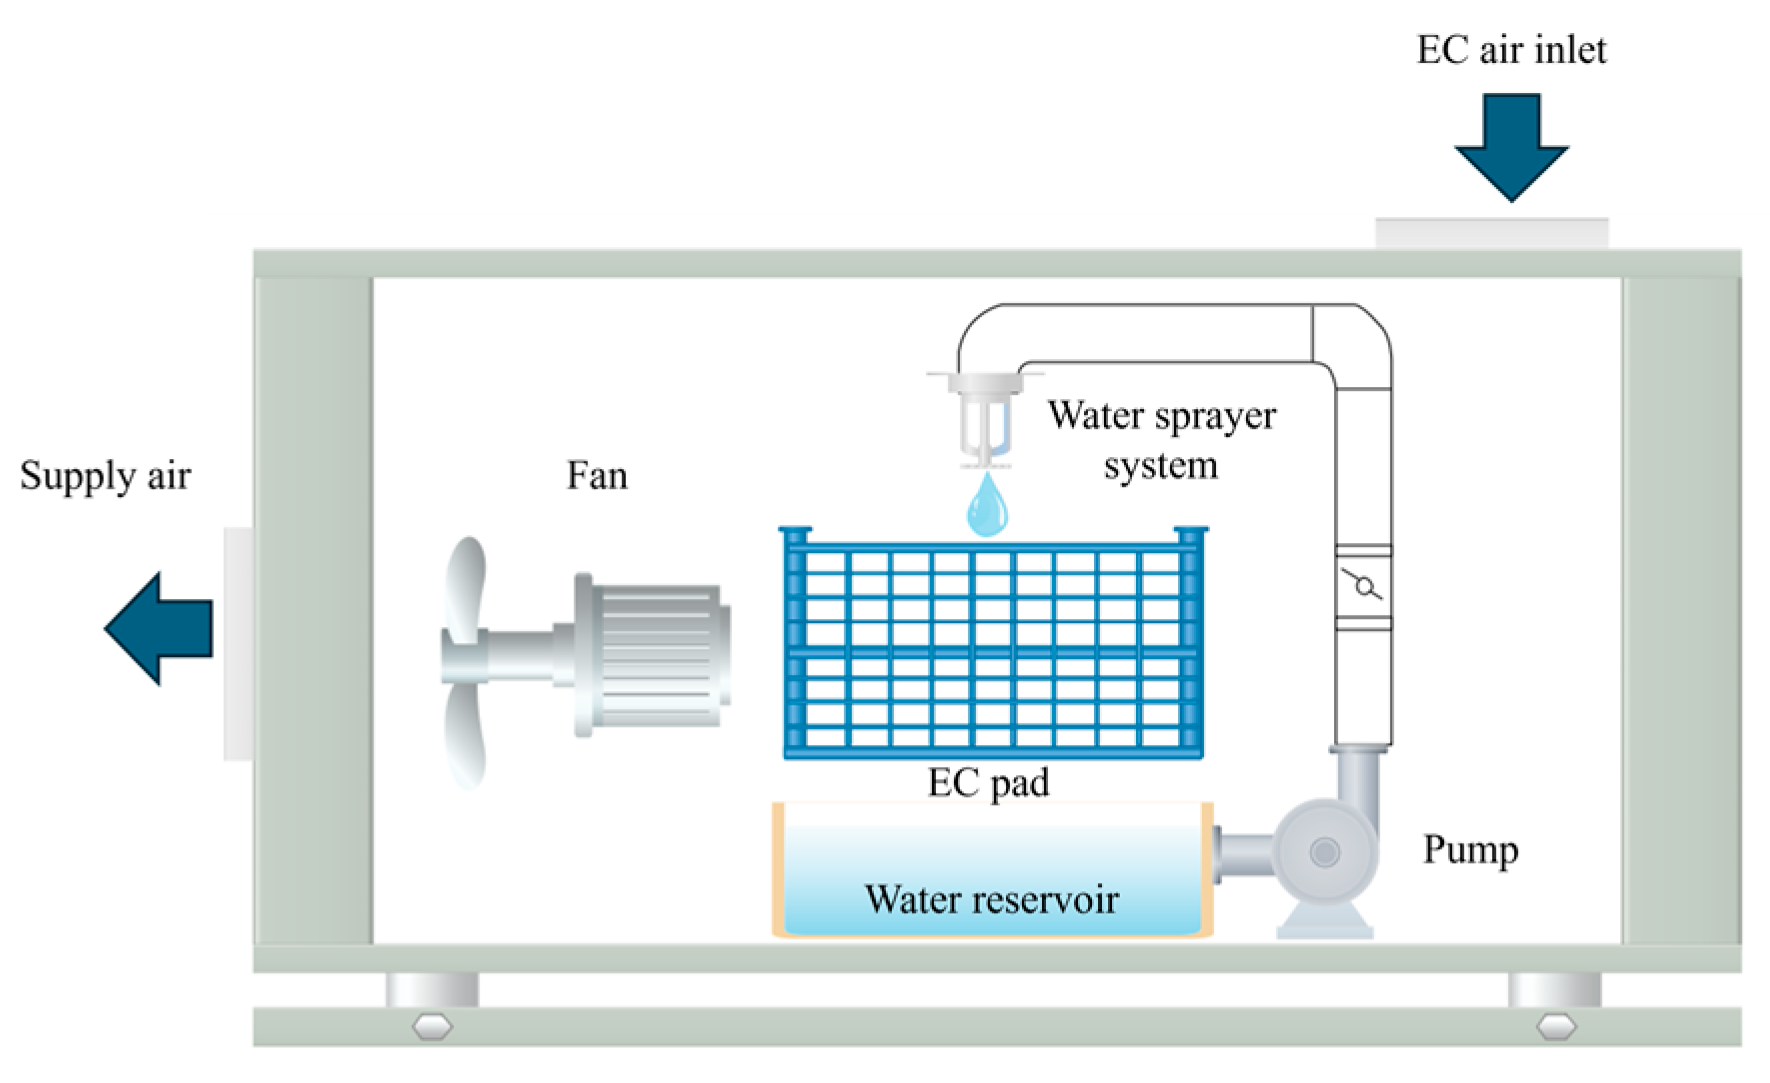
2.1. System Description

The conditioned temporary office, shown in Figure 1, is situated in Riyadh and constructed from polyvinyl chloride (PVC) with an overall U-value of 0.51 W/m2·K. It has a floor area of 14.14 m2 and a height of 2.8 m. The north- and west-facing walls are external, while the remaining two walls serve as internal partitions. The space contains two workstations, each occupied by a seated individual represented by a block-shaped simulator. This simplified modeling approach, commonly adopted in the literature, maintains accuracy with minimal impact on global indoor airflow investigations [17,18,19].
The simulator accounts for a heat generation rate of 58.15 W/m2 (1 Met), reflecting a sedentary adult activity level, while each workstation includes a personal computer with 93 W heat output. A typical lighting power density of 11.8 W/m2 is applied to the office space [20]. Assuming uniform light distribution, the heat flux is imposed as a ceiling boundary condition in the simulations, with light fixtures omitted from the geometry [21].
The UFAD system under study includes six floor-mounted supply diffusers, each measuring 25 × 25 cm, along with a 40 × 40 cm exhaust vent. Air cooling via EC is distributed through the underfloor supply plenum. Figure 2 illustrates two EC-UFAD system configurations: one without energy recovery and one with energy recovery. In the configuration without energy recovery (Figure 2a), outdoor air is cooled in the EC unit before being delivered to the UFAD space. By contrast, the configuration with energy recovery (Figure 2b) integrates a sensible heat exchanger that pre-cools the outdoor air, prior to EC, by transferring heat to the cooler exhaust stream.
Figure 3 presents the schematic diagram of the EC unit, illustrating all functional components and their interconnections.

2.2. EC-UFAD Supply Conditions

Psychrometric analysis of the adiabatic EC process shows that the possible states of air supply lie along a constant-enthalpy line between the EC inlet air condition and the saturation curve. Without an energy recovery heat exchanger, this process occurs at the outdoor air enthalpy, hₒ. When energy recovery is introduced, however, it occurs at the EC inlet enthalpy, hᵢ, which can be determined through the following energy analysis of the heat exchanger.
The rate of sensible energy recovered is determined, in kW, using Equation (1).
Q ˙ ER = η E R .   ρ o   . q a c p ( T o T e )
where ρo is the outdoor air density in kg/m3; qa denotes the supply air flow rate in m3/s; cp is the specific heat of air in kJ/kg.K; and T o and T e are the dry bulb temperatures of the outdoor and exhaust air, respectively. The efficiency of the energy recovery heat exchanger, η E R , typically ranges from 60% to 80%, depending on its design and operating conditions. In this study, an efficiency of 70% was used [22]. Applying an energy balance to the entire heat exchanger, assuming it to be adiabatic, allows the determination of the temperature of the fresh air entering the EC unit, via Equation (2).
T i = T o Q ˙ ER ρ o   . q a c p
The enthalpy of air at the EC inlet, hi, is determined by psychrometry based on the inlet temperature Ti and humidity ratio wi, which—under the assumption of sensible energy recovery—is equal to the outdoor air humidity ratio wo. This enthalpy establishes the constant-enthalpy line along which the adiabatic EC process takes place when energy recovery is applied.

2.3. Water Consumption

The water consumption of the EC system, expressed in L/h, is calculated using Equation (3).
q EC = 3600 ρ   . q a w / η w
where ρ is the air density at the EC inlet, and Δw is the difference in humidity ratio across the EC unit in kg H2O /kg air.

2.4. Energy Consumption

The energy consumption of an active EC system is solely attributed to the electrical power required to operate the fans. The power consumption rate can be calculated based on the airflow supply rate and head pressure, in kW, using Equation (4).
Q ˙ E C = q a × T P η f × 10 6
where TP represents the total head pressure, assumed to be 300 Pa, considering the supply grill, fresh air louver, exhaust air louver, and EC equipment. The fan efficiency, η f , is 70%.
Additionally, the EC system is designed to operate on an on-grid PV system with a solar fraction of 70%, which is a widely adopted approach in the existing literature [23]. The optimal tilt angle for PV panels in Riyadh is taken as 26° C based on the findings of Mansour et al. [24].
For comparison, the power consumption of a DX-UFAD system operating under identical design conditions is evaluated using DesignBuilder 7.0. The software utilizes the coefficient of performance (COP) of the vapor compression cycle to determine the electrical consumption required to maintain the setpoint temperature and then achieve thermal comfort. In arid environments, the refrigeration cycle operates with lower efficiency than under standard laboratory conditions, leading to a derated COP of approximately 1.5 [25].

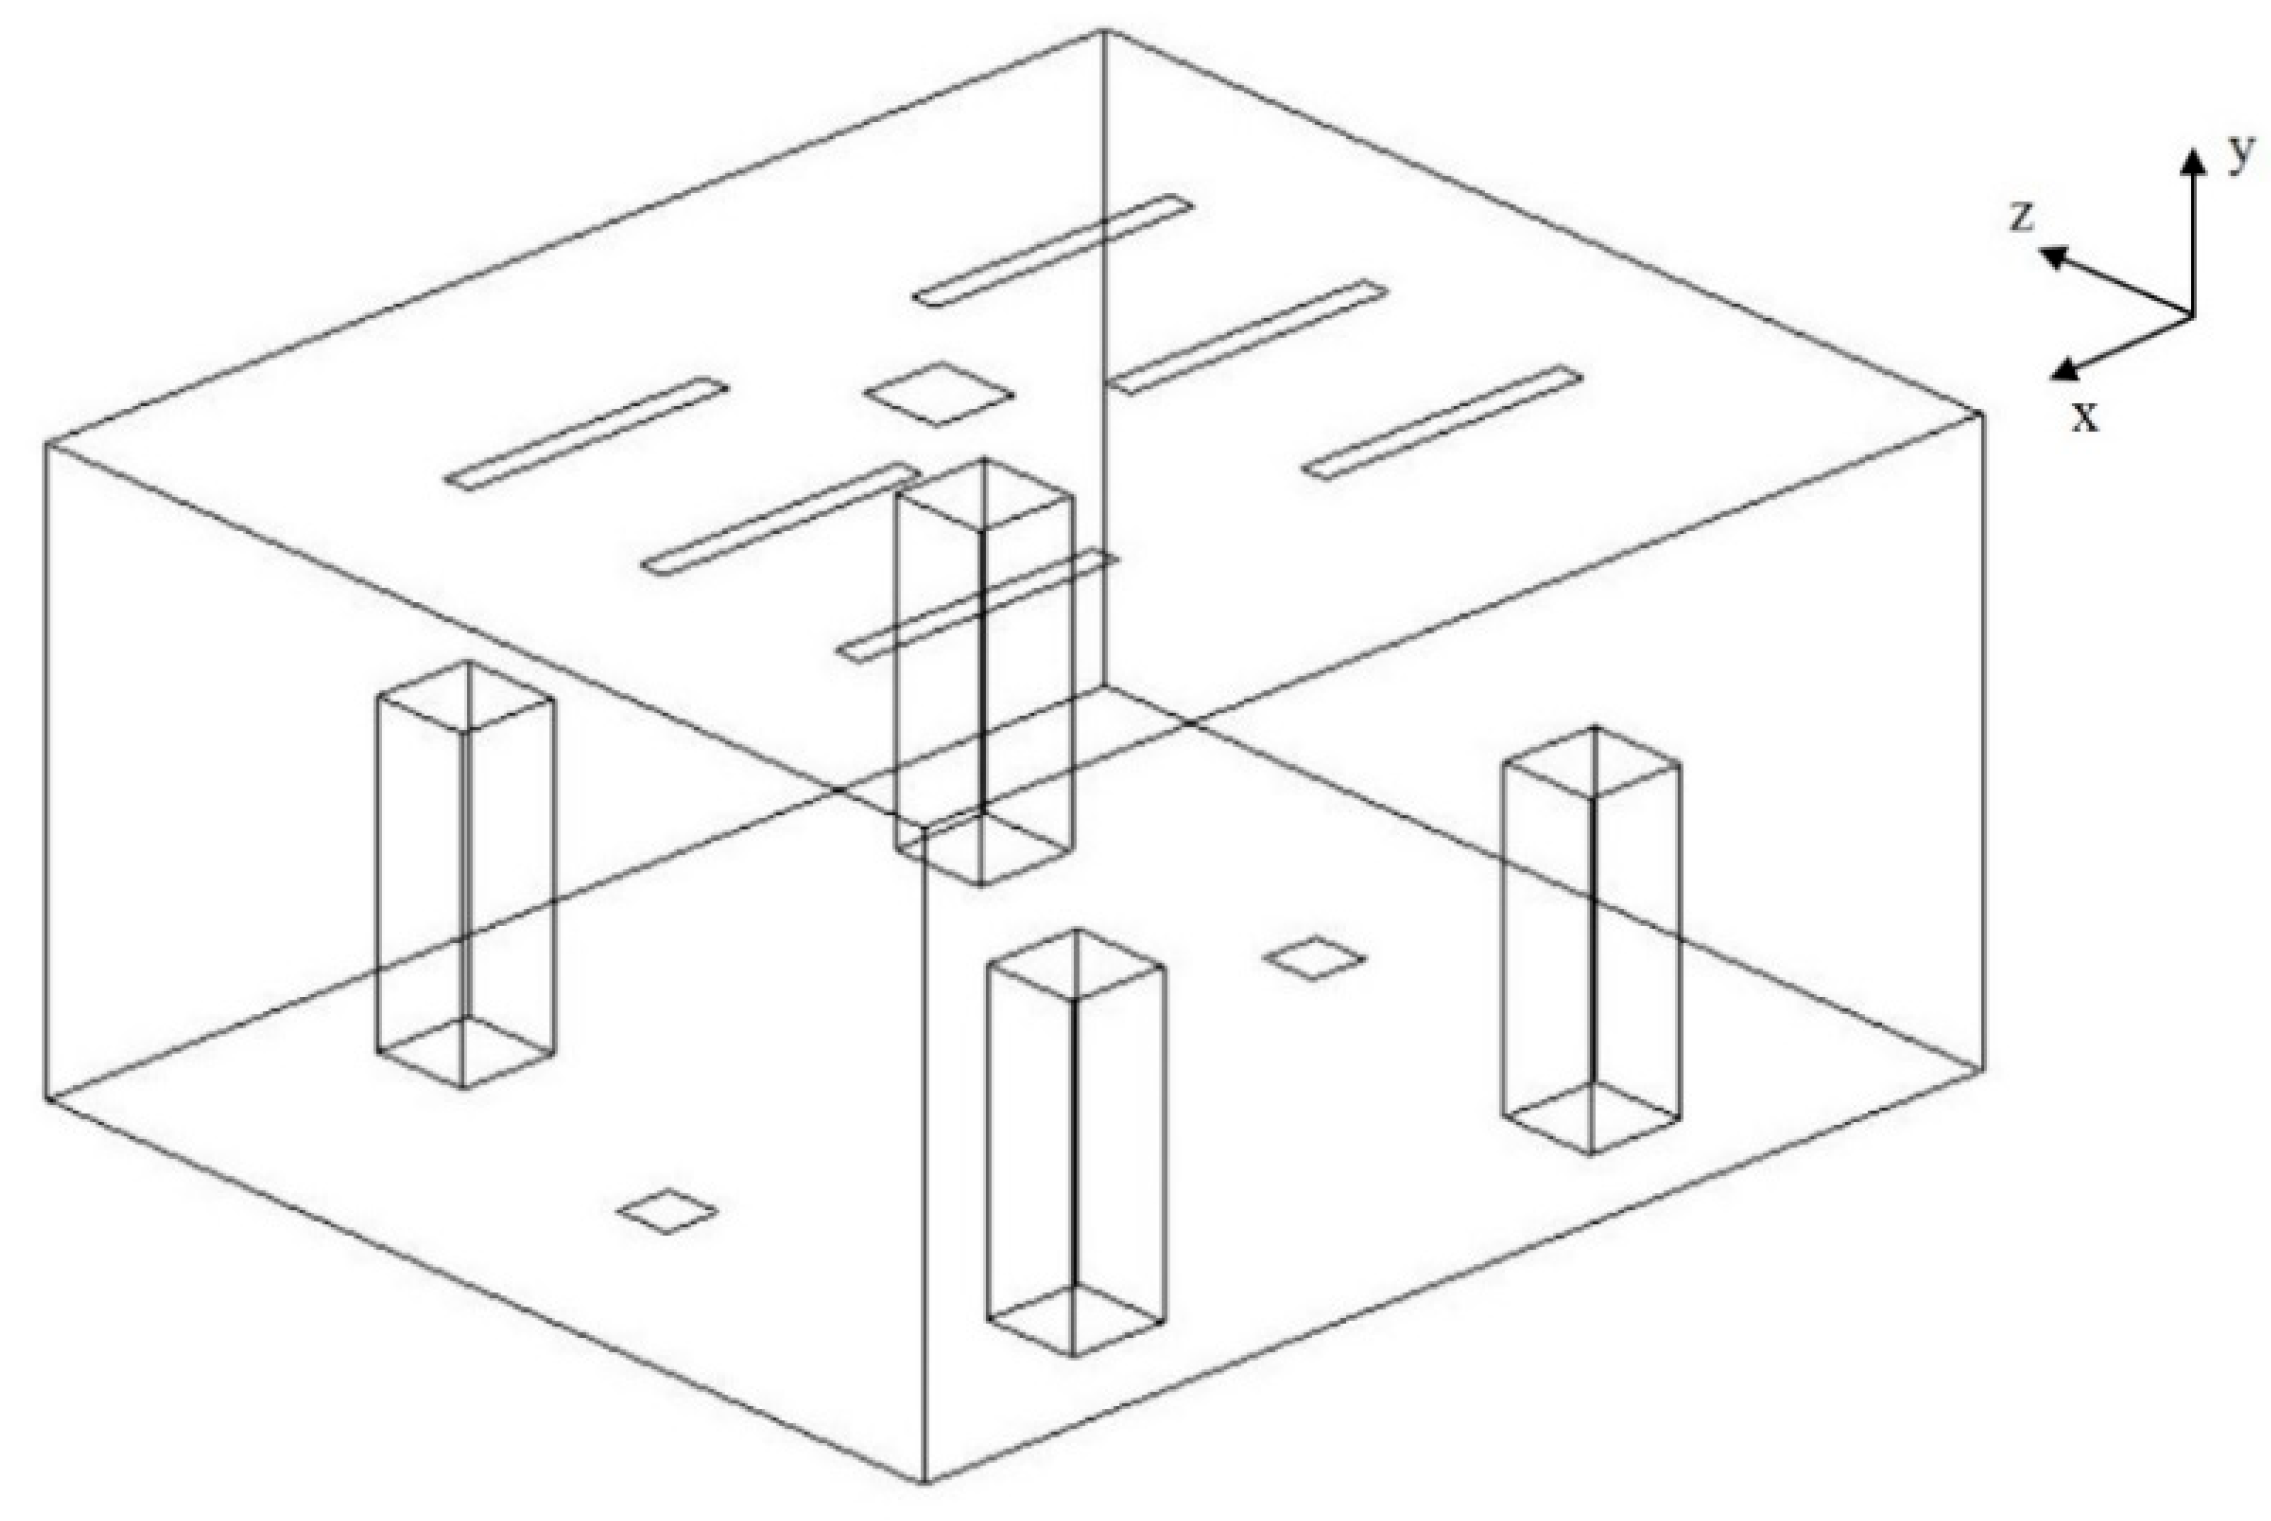
2.5. Simulation Parameters
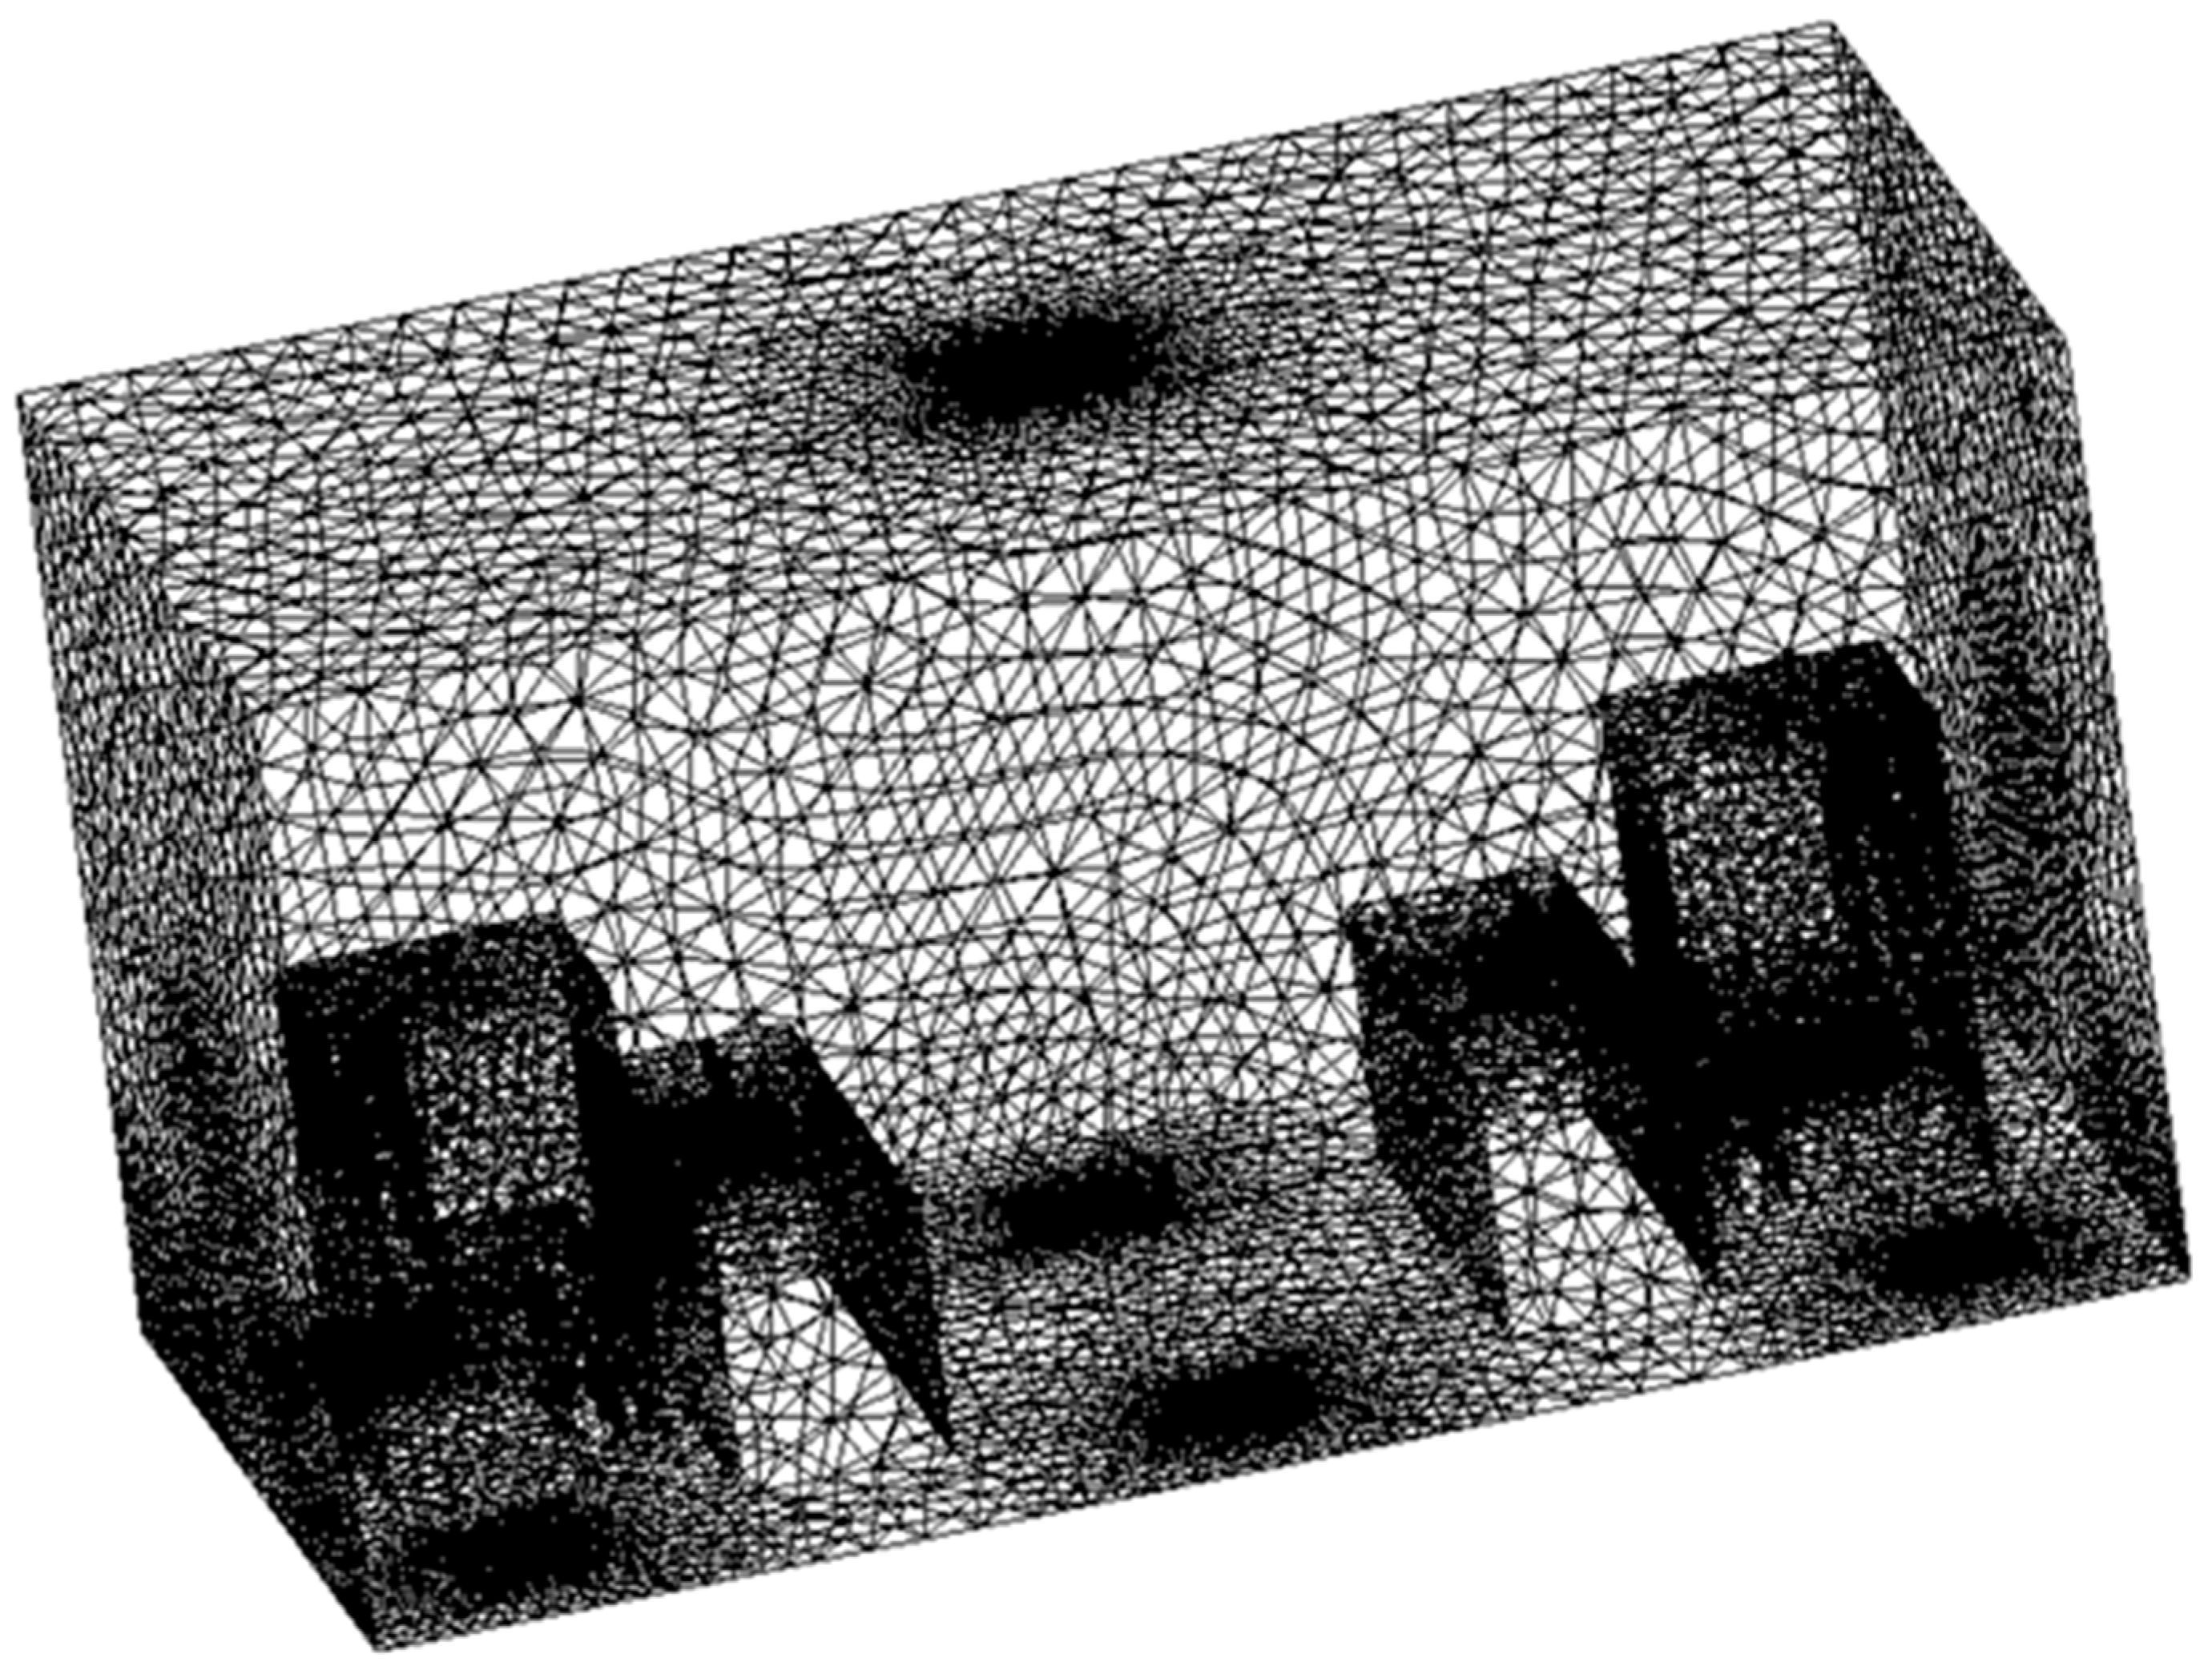
A unified set of supply temperatures (20 °C, 21 °C, and 22 °C) was applied to both energy recovery and non-energy recovery scenarios, maintaining consistency with the standard UFAD supply temperature range. The indoor setpoint temperature in the UFAD occupied zone (1.8 m above the floor) was intended to remain 3 °C above the supply air temperature. An energy model of the studied office, developed using DesignBuilder software, estimated the cooling load based on Riyadh’s weather data and determined the required supply flow rate for the specified indoor design conditions. After importing the building envelope characteristics, occupancy data, lighting intensity, and appliance details outlined in Section 2.1, the hourly cooling loads were computed over a full year using the ASHRAE heat balance method, as implemented in the simulation software EnergyPlus 9.4.
The inclusion of energy recovery modifies the humidity ratio at the UFAD supply due to the change in EC inlet air enthalpy as previously discussed. These conditions for the cooling season peak hour are summarized in Table 1.

2.6. CFD Methods

A comprehensive steady-state, three-dimensional CFD model was developed using ANSYS Fluent 15.0 to simulate the conditioned space and predict air variables in the vicinity of occupants for PMV calculations. CFD has been proven to be a reliable tool for analyzing airflow patterns and characteristics in built environments. However, achieving a successful CFD simulation requires several key factors, including a high-quality computational grid, an appropriate selection of simulation models and numerical schemes, a precise definition of boundary conditions, and a well-converged, grid-independent solution.

2.6.1. Mesh and Grid-Independence Analysis

A tetrahedral assembly method was used for meshing, with refinement applied at the supply diffusers and exhaust vent to capture high gradients in these regions. To accurately resolve the viscous sublayer on the person simulator’s surface, inflation layers were generated, setting the height of the first cell at 0.2 mm—corresponding to a maximum y+ value of less than 1 [26].
To ensure grid independence, the room was simulated using three different mesh sizes, with the air temperature and velocity at the exhaust monitored across the simulations as shown in Table 2. The results indicated that when transitioning from Mesh 2 to Mesh 3, the values of these quantities of interest varied by less than 3%.
Therefore, the simulations utilize Mesh 2, as shown in Figure 4, ensuring an optimal balance between accuracy and computational costs.

2.6.2. Airflow Modeling

The indoor flow was assumed to be incompressible and turbulent. Simulations were performed using the standard k-epsilon turbulence model, which has been validated for the accurate prediction of UFAD flows [27,28,29].
The developed CFD model was designed to solve the governing equations for airflow, including continuity, momentum, energy, turbulent kinetic energy, and its dissipation rate, as expressed by Equation (5).
d i v ρ v φ = d i v Γ φ g r a d φ + S φ
where v is the velocity vector; φ represents the air variable being solved; Γφ denotes the effective diffusivity of φ; and Sφ is the source term.
The Boussinesq approximation was reasonably applied to accelerate convergence, given the relatively small temperature differences in UFAD indoor spaces [30]. It is represented by Equation (6), where ρ0 and T0 denote the operating density and temperature, respectively, with the expansion coefficient defined by β = 1/T0.
ρ ρ 0 ρ 0 β g T T 0
Radiation effects were accounted for using the surface-to-surface model, which calculates view factors within the domain under the assumption of gray and diffuse surfaces.

2.6.3. Boundary Conditions

The supply diffuser boundary was treated as a velocity inlet, as the airflow scalar properties were known prior to the simulations. This boundary condition type is commonly used in indoor air simulations and has been shown to yield accurate results [31,32]. The room exhaust was modeled as a pressure outlet. Wall heat fluxes were estimated for each simulated case using the DesignBuilder energy model. The boundary conditions applied in the simulations are summarized in Table 3.

2.6.4. Numerical Solution

The second-order UPWIND scheme was employed for discretizing all variables except pressure, which was handled using the PRESTO! staggered scheme. Pressure–velocity coupling of the Navier–Stokes equations was achieved using the SIMPLE algorithm.
The following under-relaxation factors were applied in the simulations to ensure numerical stability by dampening fluctuations: continuity (0.3), density and body forces (0.7), momentum (0.3), turbulent kinetic energy, dissipation rate, viscosity (0.8), and energy (0.9).
Convergence was established when all scaled residuals diminished to the order of 10−5; the values of quantities of interest within occupant microenvironments stabilized, and net heat and mass fluxes within the computational domain became negligible.

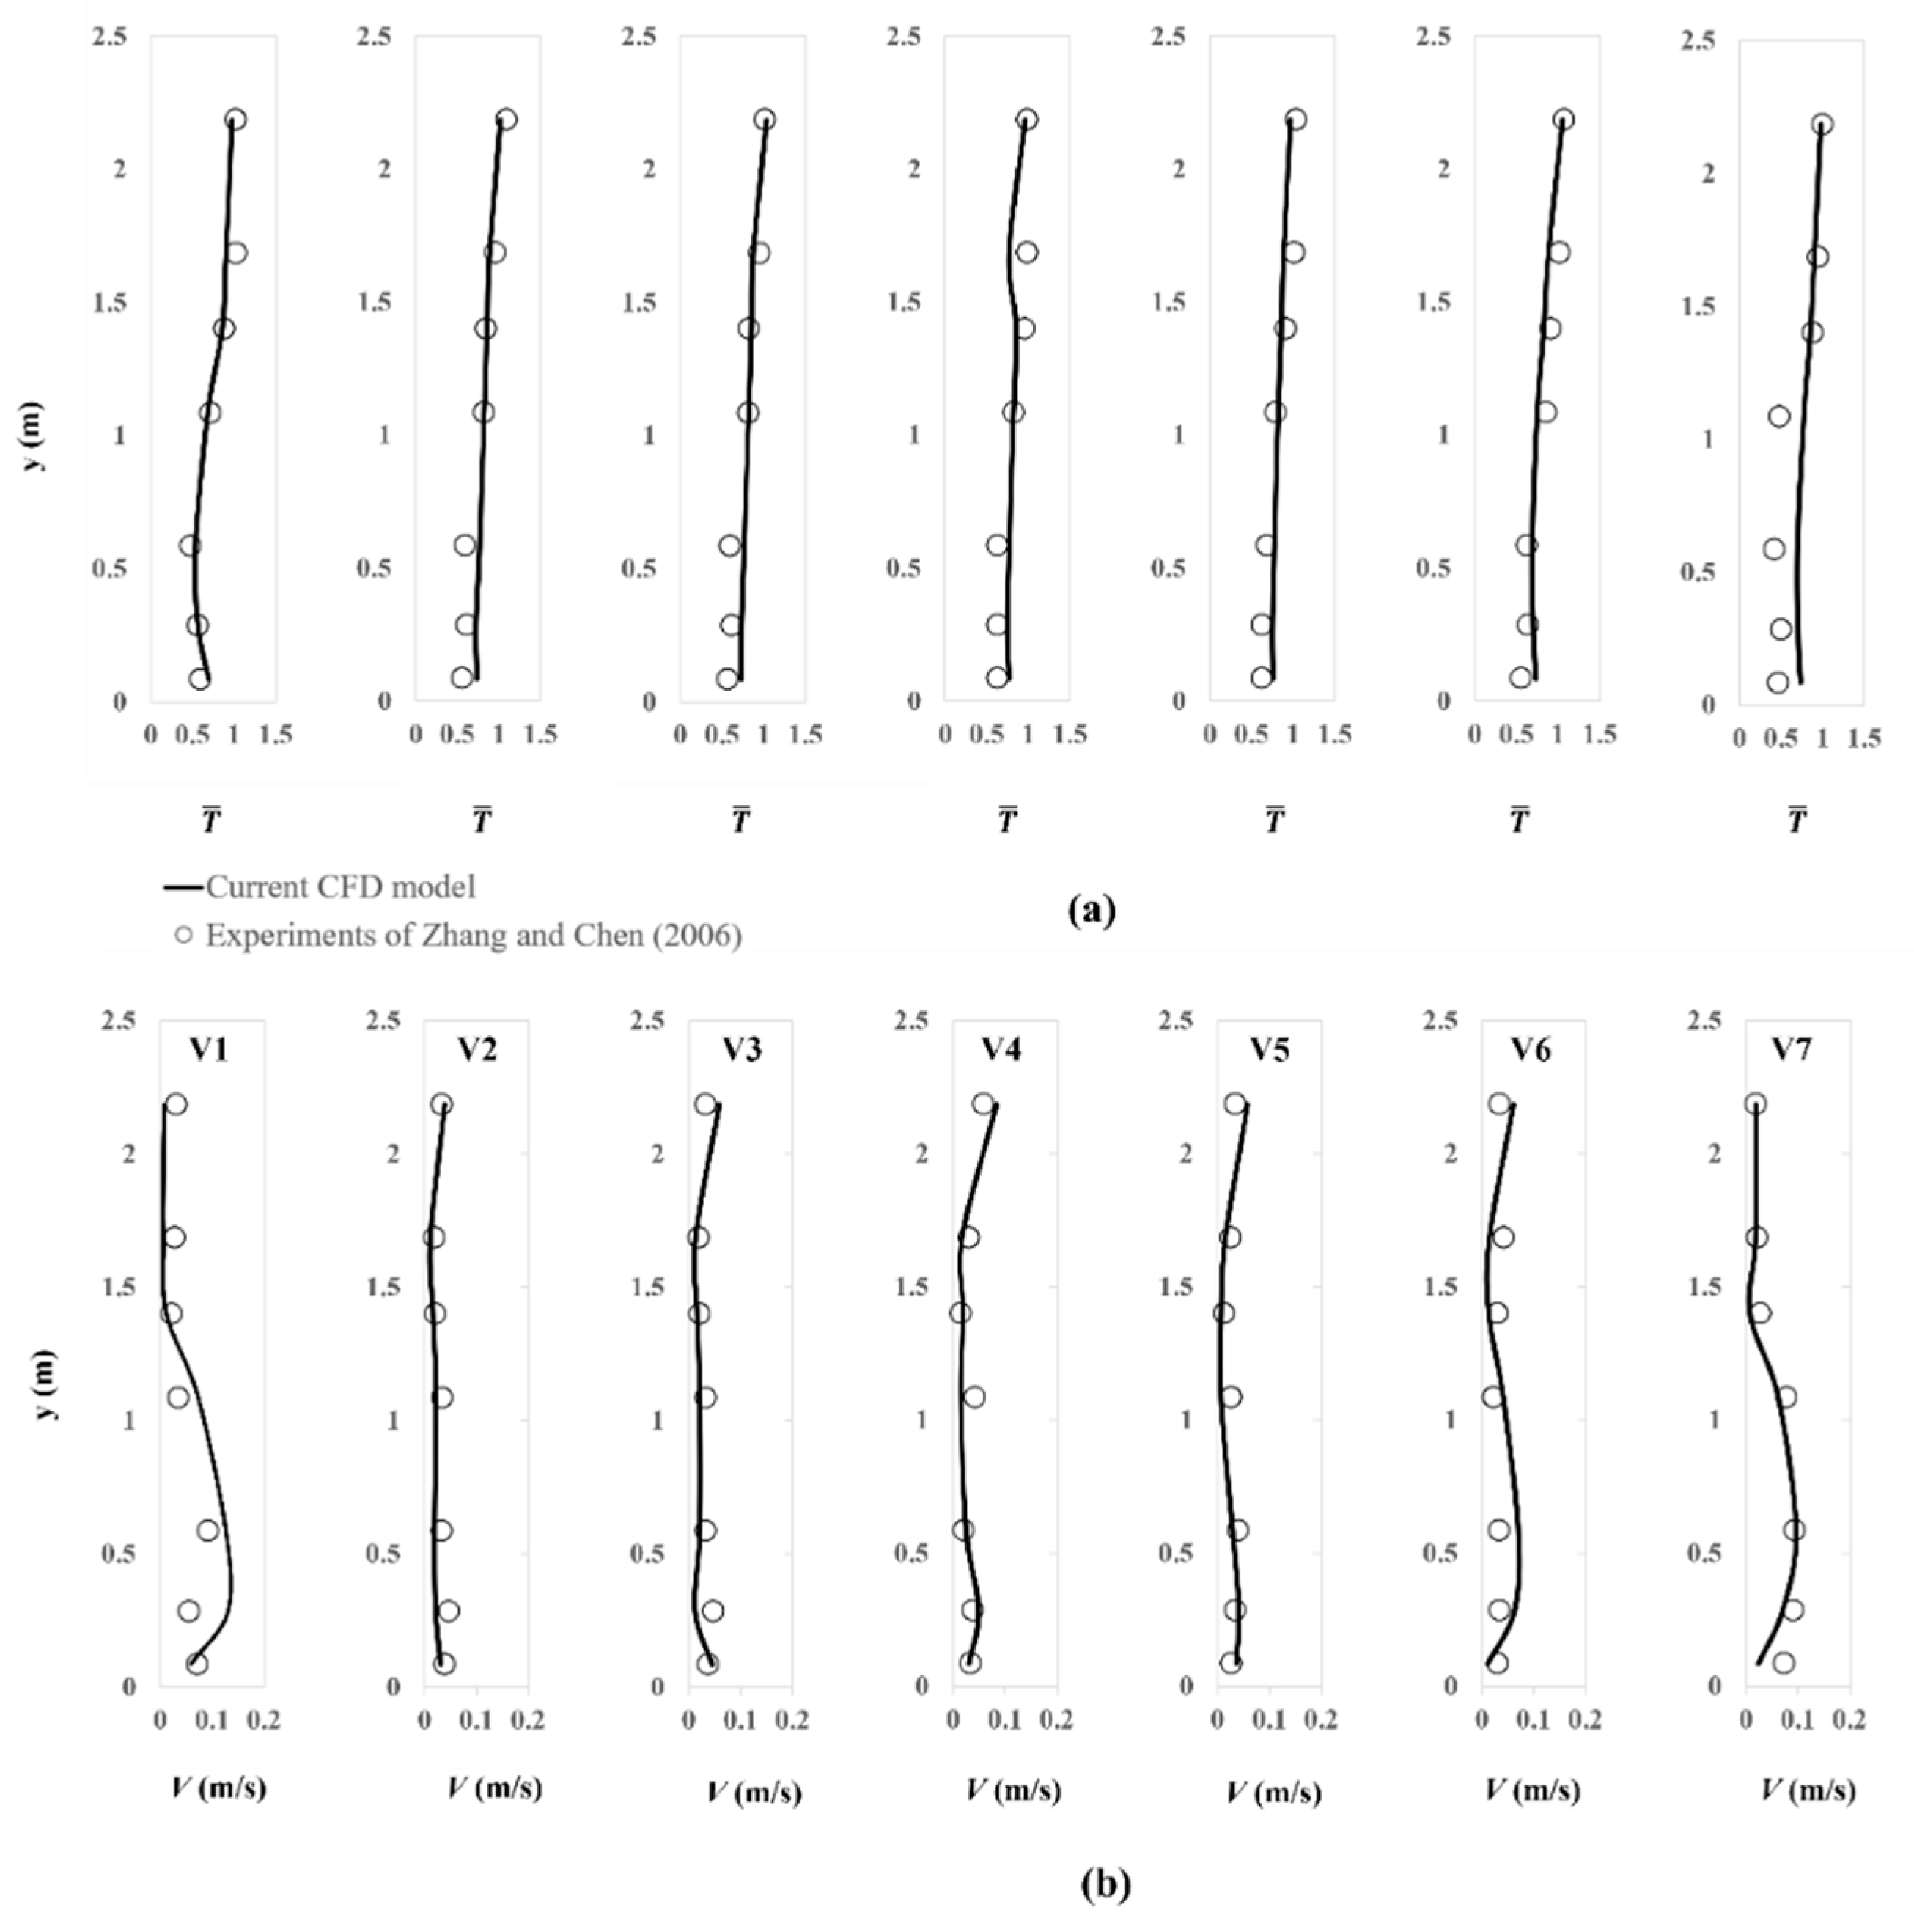
2.6.5. Validation of the CFD Model

To validate the developed model, it was applied to the experimental environmental chamber of Zhang and Chen [33], which was conditioned with UFAD. Measurements were taken to assess the vertical distributions of air temperature and velocity. The chamber, measuring 4.91 m × 4.31 m × 2.44 m, contained four cuboid person simulators, each generating 100 W of heat, along with six ceiling-mounted lamps producing 64 W each (Figure 5). The UFAD system comprises two floor-mounted air supply openings with a total airflow rate of 0.0944 m3/s, and an exhaust opening positioned on the ceiling.
The reported measured values of internal wall surface temperatures were applied as boundary conditions in our model. The environmental chamber simulation employs a computational mesh with 263,133 elements, ensuring solution grid independence.
Our model was validated by comparing the measured vertical distributions of air temperature and velocity with those predicted by CFD at seven locations, at z = 2.1 m: V1 at x = 0.3 m, V2 at x = 1.5 m, V3 at x = 1.95 m, V4 at x = 2.4 m, V5 at x = 2.85 m, V6 at x = 3.3 m, and V7 at x = 4.5 m. The comparative plots in Figure 6 demonstrate strong agreement between the current CFD model predictions and the experimental values reported in [33], with normalized temperature expressed as follows: T ¯ = T T s u p p l y / T e x h a u s t T s u p p l y .

2.7. Thermal Comfort Assessment

During the pre-processing stage of the simulations, a cuboid fluid zone was established around each occupant, representing its microenvironment. Predictions of air properties within this zone were then utilized to assess overall thermal comfort using Fanger’s predicted mean vote (PMV) model [34]. The PMV metric incorporates both personal and environmental factors, using a scale from −3 (cold) to +3 (hot), with intermediate points representing varying degrees of warmth or coolness. Personal factors include activity level and clothing insulation, while environmental factors encompass air temperature, air velocity, relative humidity, and mean radiant temperature.
A detailed methodology for calculating PMV, including all relevant equations, can be found in [35]. The analysis is based on the following assumptions:
  • The metabolic rate corresponds to that of a sedentary adult (1 Met = 58.15 W/m2).
  • Mechanical work attributed to the occupant is assumed to be zero.
  • A typical indoor clothing insulation value of 0.6 clo is used, corresponding to 0.093 m2·°C/W.
  • The mean radiant temperature is assumed to be equivalent to the indoor ambient temperature. This approximation is reasonable under summer conditions, provided there is no direct solar radiation entering the conditioned space [36,37].
As per ASHRAE standards, the recommended PMV range for thermal comfort falls between −0.5 and +0.5, serving as the criterion for this study.

3. Results and Discussion

3.1. Performance Analysis Results

The airflow patterns and thermal fields within the office space studied for the simulated cases are illustrated in Figure 7 and Figure 8. Since energy recovery does not affect supply conditions, except for the humidity ratio, it has no impact on these indoor air characteristics. As a result, the velocity and temperature distributions inside the office space remain unchanged, regardless of whether energy recovery is applied. Additionally, air humidity was considered uniform throughout the conditioned space, given the assumption of negligible internal latent loads. The velocity vectors on a symmetrical plane, as depicted in Figure 7, exhibit minimal differences among the simulated cases, owing to the narrow range of supply velocities. The developed CFD model effectively captured the flow dynamics of the UFAD system, demonstrating mixed flow behavior in the lower zone and piston flow in the upper zone [38]. Additionally, thermal plumes generated by heat sources such as occupants and computers were well represented, with the upward buoyant flow clearly visible in the vector plots.
Figure 8 presents the temperature contour plots on two cut planes through the supply diffusers near occupants for each simulated case. The thermal stratification is clearly established, with a cool lower zone transitioning to a warmer upper zone, confirming the accurate modeling of UFAD physics. The UFAD supply fountains are well captured penetrating the density interface without impinging the ceiling. The effect of ventilation rate on the supply throw and height of the density interface is not distinctly noticeable due to the minimal variations in supply flow rates across simulations [11,29]. It is important to note that all cases maintained good indoor air quality, as the density interface remained above the breathing level. This accounts for the lock-up phenomenon observed in UFAD systems, where exhaled contaminants accumulate at the density interface, increasing exposure [39,40].
Table 4 presents the CFD-predicted mean radiant temperature (MRT) within the office space, along with air temperature, velocity, and relative humidity in each occupant’s microenvironment. It also includes the computed PMV values for the studied cases presented in Table 1, both with and without energy recovery, as well as the corresponding water consumption.
Occupant 1 experienced slightly warmer conditions due to their proximity to the exposed north-oriented wall, whereas Occupant 2 was positioned near the internal partition to the south. The results indicate that, in the absence of energy recovery, case (a.1) did not achieve thermal comfort, with PMV values of around −0.7, meaning occupants felt slightly cool according to ASHRAE’s PMV scale. In contrast, cases (b.1) and (c.1) met thermal comfort standards, with PMV values within the recommended range of −0.5 to +0.5. However, case (c.1) represents the optimal operation of the EC-UFAD system without energy recovery, achieving thermal comfort with minimal water consumption. Meanwhile, only case (c.2) achieved satisfactory comfort in the presence of energy recovery. For the summer peak hour, a comparison of the two cases showed that operating the EC-UFAD system with energy recovery—at a supply flow rate of 232 L/s and a temperature of 22 °C, with a corresponding humidity ratio of 9.47 g H2O/kg air—achieved occupant thermal comfort while reducing water consumption by 51.7%.

3.2. Hourly Analysis

Taking a practical approach, the energy and water performance of the solar-powered EC-UFAD system for cases (c.1) and (c.2) were analyzed hourly throughout the year using DesignBuilder based on Riyadh’s weather hourly data [41]. The system operates from 6:00 to 18:00, five days a week. To emphasize the energy efficiency and cost-effectiveness of the solar-powered EC-UFAD system compared to DX-UFAD, the grid power consumption and operational costs of both systems were analyzed under identical design conditions. The operational expenses of the EC-UFAD system included both electricity and water costs. Figure 9 presents the results, showing that the EC-UFAD system with energy recovery reduces water consumption by 31.3% compared to the no-recovery system. Furthermore, transitioning from a DX-UFAD system to a solar-driven EC-UFAD system results in a 93.5% reduction in annual grid power consumption. This shift lowers the total yearly operational costs by 84% without energy recovery and 87% with energy recovery.

3.3. Cost–Benefit Analysis

In line with Saudi Arabia’s strategy to reduce electricity consumption, the Power and Cogeneration Regulatory Authority recently set the electricity generation cost at USD 0.216 per kilowatt-hour (kWh) [42]. The cost of water, including production, desalination, and sewage treatment, was estimated at USD 1.6 per cubic meter [43].
In the current study, the RETScreen v8 application was used for financial analysis, evaluating the feasibility of various renewable energy systems [44]. Initial component prices and maintenance fees were provided by market operators and producers. The initial investment cost reflects the difference between the expense of the new solar ambiator system and the conventional DX system that it could replace. Earnings were determined using the difference in electricity bills between the two systems.
Table 5 presents financial input parameters, with results calculated using discounted cash inflows, accounting for the time value of money at a 5% interest rate per period [45]. The discounted payback period is around 5 years, with an internal rate of return of 18.52%. This study encourages operators to adopt solar systems, significantly reducing electricity usage and pollution.

4. Conclusions

The operation of an integrated solar-driven EC-UFAD system is optimized while assessing thermal comfort and water consumption in scenarios with and without energy recovery. A detailed 3D steady-state CFD model was developed and validated against experimental data from the literature to simulate airflow inside a standard EC-UFAD-conditioned temporary office in Riyadh, KSA. CFD-predicted indoor air velocity and temperature values were used to evaluate thermal comfort across all simulated cases. A year-round energy analysis determined annual water usage, grid power consumption, and the overall operational costs of the integrated system. Results indicate the following:
  • For the temporary office under study, the EC-UFAD system achieved optimal thermal comfort and water efficiency when operated with energy recovery. The ideal conditions included a supply flow rate of 232 L/s at a temperature of 22 °C, with a corresponding humidity ratio of 9.47 g H2O/kg air. This finding aligns with the proposed UFAD design with six 25 × 25 cm supply diffusers, the number, placement, and size of which directly influence performance [46,47].
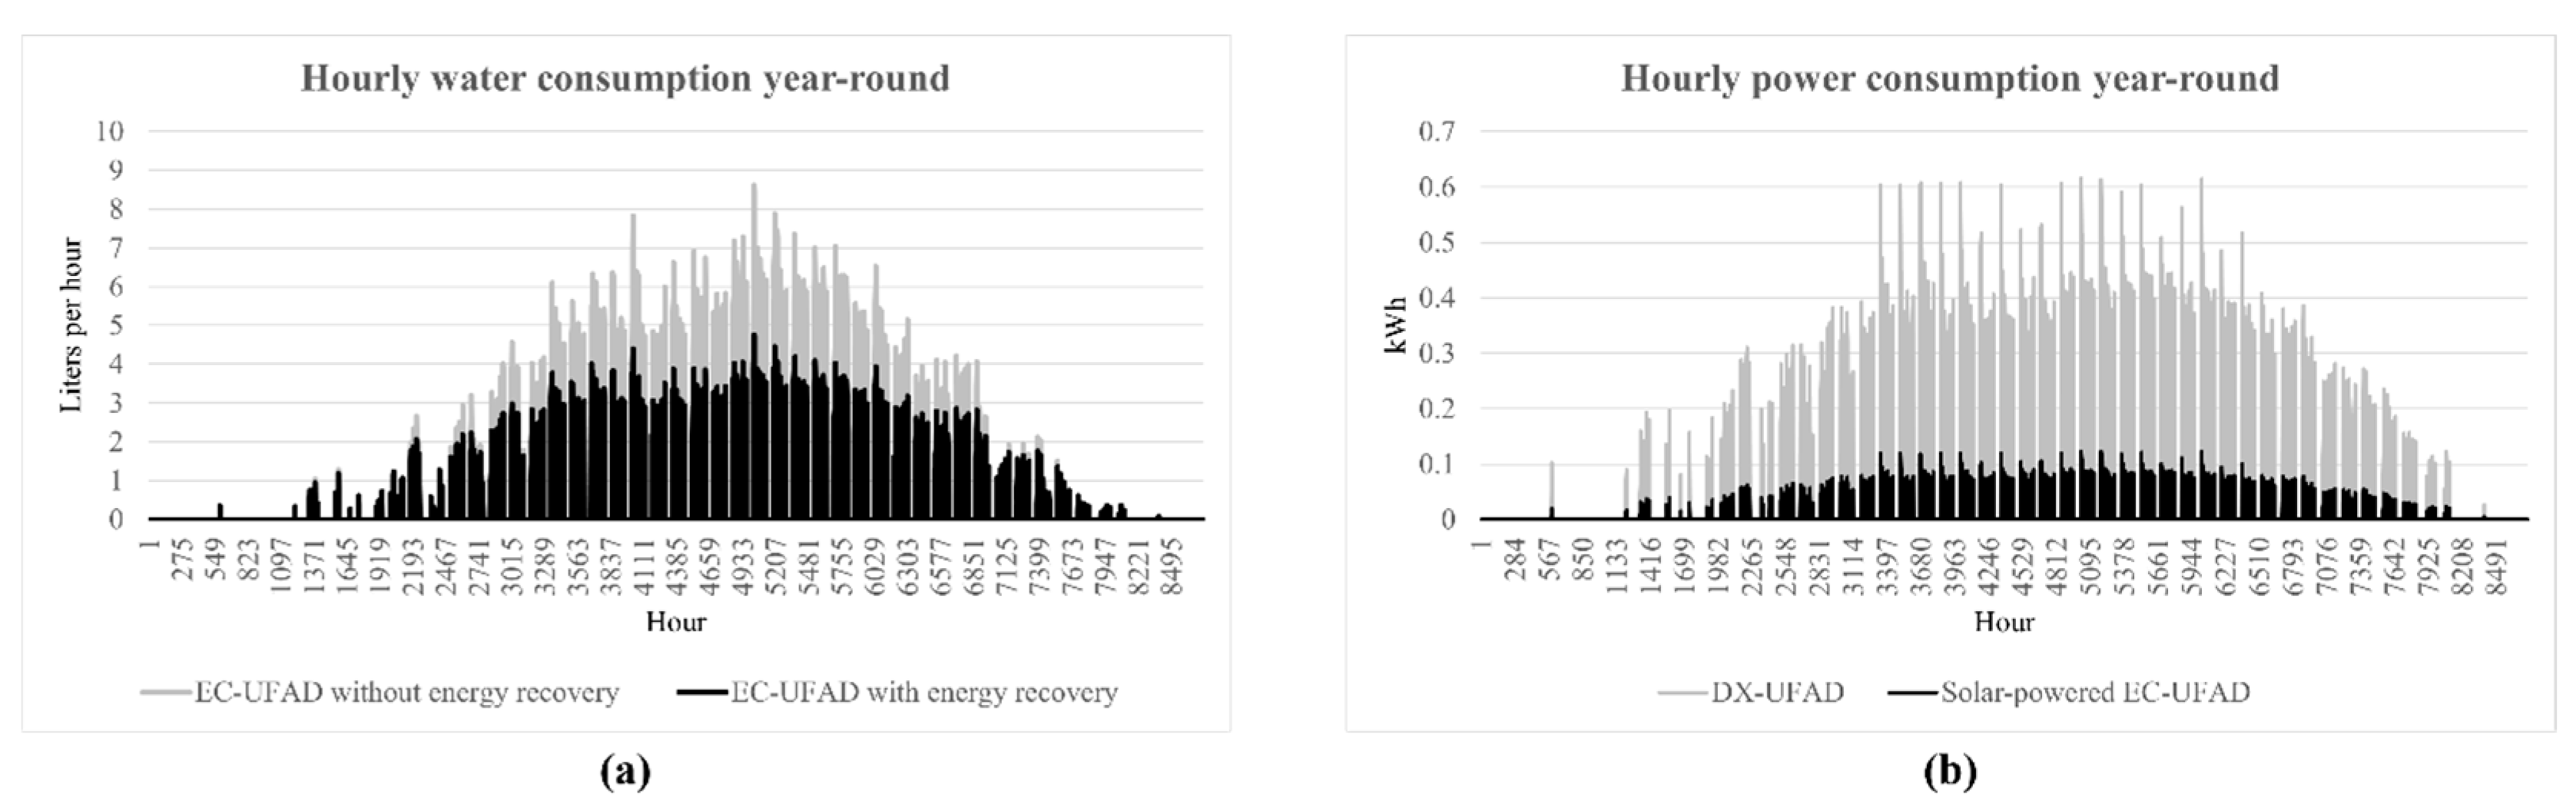
  • The EC-UFAD system with energy recovery reduces water consumption by 31.3% compared to the system without energy recovery, while both configurations maintain occupant comfort.
  • With 70% of its power sourced from solar energy, the optimized EC-UFAD system reduces grid electricity consumption by 93.5% compared to the DX-UFAD system under identical design conditions.
  • Operational costs are reduced by 84–87% when transitioning from the DX-UFAD to the EC-UFAD system.
  • The optimized EC-UFAD operation yields a 5-year payback period and a USD 375 net present value.
The proposed system is better suited for non-residential spaces, which typically contain a more practical layout for UFAD installations. These environments can accommodate floor-mounted diffusers and an underfloor supply plenum, which are features that are rarely present in residential buildings. Additionally, the system is optimized for hot and dry climates, where the EC process delivers greater efficiency. One of the most relevant applications is in temporary office units at construction sites located in arid regions. Future research may focus on evaluating indoor air quality to ensure a healthy environment for occupants, complementing the system’s provision of thermal comfort.

Author Contributions

Conceptualization, M.K., S.A. and M.H.; methodology M.K. and M.H.; software, M.K. and M.H.; validation, M.K.; formal analysis, S.A. and M.H.; investigation, M.K. and M.H.; resources, S.A. and M.H.; writing—original draft preparation, M.H.; writing—review and editing, M.K. and S.A.; visualization, S.A.; supervision, M.K.; project administration, M.K. All authors have read and agreed to the published version of the manuscript.

Funding

This research received no external funding.

Data Availability Statement

The data are contained within the article.

Conflicts of Interest

The authors declare no conflicts of interest.

References

  1. The Future of Cooling. Available online: https://www.oecd.org/en/publications/the-future-of-cooling_9789264301993-en.html (accessed on 1 June 2025).
  2. Mastrucci, A.; Ruijven, B.; Byers, E.; Poblete-Cazenave, M.; Pachauri, S. Global Scenarios of Residential Heating and Cooling Energy Demand and CO2 Emissions. Clim. Change 2021, 168, 14. [Google Scholar] [CrossRef]
  3. Open Data Library|Open Data of the SEEC|SEEC. Available online: https://www.seec.gov.sa/en/media-center/open-data/open-data-library (accessed on 1 June 2025).
  4. Kapilan, N.; Isloor, A.M.; Karinka, S. A Comprehensive Review on Evaporative Cooling Systems. Results Eng. 2023, 18, 101059. [Google Scholar] [CrossRef]
  5. Hussain, I. Evaluating the Parameters Affecting the Direct and Indirect Evaporative Cooling Systems. Eng. Anal. Bound. Elem. 2022, 145, 211–223. [Google Scholar] [CrossRef]
  6. Yang, H.; Shi, W.; Chen, Y.; Min, Y. Research Development of Indirect Evaporative Cooling Technology: An Updated Review. Renew. Sustain. Energy Rev. 2021, 145, 111082. [Google Scholar] [CrossRef]
  7. Xue, T. A Comprehensive Review of the Applications of Hybrid Evaporative Cooling and Solar Energy Source Systems. Sustainability 2023, 15, 16907. [Google Scholar] [CrossRef]
  8. Tripathi, R.J.; Kumar, D. A Holistic Approach for Solar-Driven HVAC Evaporative Cooling System: Comparative Study of Dry and Wet Channel. J. Build. Eng. 2024, 83, 108465. [Google Scholar] [CrossRef]
  9. A/L Sambathan, S.; Ismail, F.B.; Nasif, M.S. Underfloor Air Distribution Technology: A Review. AIP Conf. Proc. 2018, 2035, 070004. [Google Scholar] [CrossRef]
  10. Matsunawa, K.; Iizuka, H.; Tanabe, S. Development and Application of an Underfloor Air-Conditioning System with Improved Outlets for a’smart’building in Tokyo. Ashrae Trans. 1995, 101 Pt 2, 887–901. [Google Scholar]
  11. LIU, Q.A.; LINDEN, P.F. The fluid dynamics of an underfloor air distribution system. J. Fluid Mech. 2006, 554, 323. [Google Scholar] [CrossRef]
  12. Lin, Y.J.P.; Linden, P.F. A Model for an under Floor Air Distribution System. Energy Build. 2005, 37, 399–409. [Google Scholar] [CrossRef]
  13. Alajmi, A.F.; Abou-Ziyan, H.Z.; El-Amer, W. Energy Analysis of Under-Floor Air Distribution (UFAD) System: An Office Building Case Study. Energy Convers. Manag. 2013, 73, 78–85. [Google Scholar] [CrossRef]
  14. Rahmati, B.; Heidarian, A.; Jadidi, A.M. Investigation in Performance of a Hybrid Under-Floor Air Distribution with Improved Desk Displacement Ventilation System in a Small Office. Appl. Therm. Eng. 2018, 138, 861–872. [Google Scholar] [CrossRef]
  15. Seok, Y.J.; Cho, H.J.; Han, S.K.; Jeong, J.W. Underfloor Air Distribution Integrated with an Indirect and Direct Evaporative Cooling Assisted 100% Outdoor Air System. 2011. Available online: https://www.aivc.org/resource/underfloor-air-distribution-integrated-indirect-and-direct-evaporative-cooling-assisted-100 (accessed on 17 July 2025).
  16. Jaber, S.; Ezzat, A.W. Investigation of Energy Recovery with Exhaust Air Evaporative Cooling in Ventilation System. Energy Build. 2017, 139, 439–448. [Google Scholar] [CrossRef]
  17. Chen, M.; Hao, S. Numerical Study on the Cutting off Performance of a Novel Personalized Air Curtain in a General Consulting Ward. Dev. Built Environ. 2023, 16, 100239. [Google Scholar] [CrossRef]
  18. Ameen, A.; Cehlin, M.; Yamasawa, H.; Kobayashi, T.; Karimipanah, T. Energy Saving, Indoor Thermal Comfort and Indoor Air Quality Evaluation of an Office Environment Using Corner Impinging Jet Ventilation. Dev. Built Environ. 2023, 15, 100179. [Google Scholar] [CrossRef]
  19. Asral, A. CFD Analysis of Coronavirus Dispersion through Breathing in Aircraft Cabin Environments. J. Adv. Fluid Heat Mater. Eng. 2025, 1, 49–59. [Google Scholar] [CrossRef]
  20. Singh, R.; Rawal, R. Effect of Surface Reflectance on Lighting Efficiency in Interiors. In Proceedings of the Building Simulation 2011: 12th Conference of International Building Performance Simulation Association (IBPSA), Sydney, Australia, 14–16 November 2011; Available online: https://publications.ibpsa.org/proceedings/bs/2011/papers/bs2011_1725.pdf (accessed on 17 July 2025).
  21. Ray, S.D.; Gong, N.-W.; Glicksman, L.R.; Paradiso, J.A. Experimental Characterization of Full-Scale Naturally Ventilated Atrium and Validation of CFD Simulations. Energy Build. 2014, 69, 285–291. [Google Scholar] [CrossRef]
  22. ASHRAE. ASHRAE Handbook—HVAC Systems and Equipment. In Air-to-Air Energy Recovery Equipment; ASHRAE: Peachtree Corners, GA, USA, 2020; p. 26. [Google Scholar]
  23. Franchini, G.; Brumana, G.; Perdichizzi, A. Performance Prediction of a Solar District Cooling System in Riyadh, Saudi Arabia—A Case Study. Energy Convers. Manag. 2018, 166, 372–384. [Google Scholar] [CrossRef]
  24. Mansour, R.B.; Khan, M.A.M.; Alsulaiman, F.A.; Mansour, R.B. Optimizing the Solar PV Tilt Angle to Maximize the Power Output: A Case Study for Saudi Arabia. IEEE Access 2021, 9, 15914–15928. [Google Scholar] [CrossRef]
  25. Bahrami, M. Refrigeration Cycle Notes. 2020. Available online: https://www.sfu.ca/~mbahrami/ENSC%20461/Notes/Refrigeration%20Cycle.pdf (accessed on 17 July 2025).
  26. Yoo, S.; Ito, K. Validation, Verification, and Quality Control of Computational Fluid Dynamics Analysis for Indoor Environments Using a Computer-simulated Person with Respiratory Tract. Jpn. Archit. Rev. 2022, 5, 714–727. [Google Scholar] [CrossRef]
  27. Lee, Y.-T.; Wen, C.-Y.; Shih, Y.-C.; Li, Z.; Yang, A.-S. Numerical and Experimental Investigations on Thermal Management for Data Center with Cold Aisle Containment Configuration. Appl. Energy 2022, 307, 118213. [Google Scholar] [CrossRef]
  28. Cheong, C.H.; Park, B.; Ryu, S.R. Effect of Under-Floor Air Distribution System to Prevent the Spread of Airborne Pathogens in Classrooms. Case Stud. Therm. Eng. 2021, 28, 101641. [Google Scholar] [CrossRef]
  29. Kanaan, M. Modelling of Contaminant Dispersion in Underfloor Air Distribution Systems: Comparison of Analytical and CFD Methods. J. Build. Perform. Simul. 2019, 12, 759–769. [Google Scholar] [CrossRef]
  30. Wan, M.P.; Chao, C.Y. Numerical and Experimental Study of Velocity and Temperature Characteristics in a Ventilated Enclosure with Underfloor Ventilation Systems. Indoor Air 2005, 15, 342–355. [Google Scholar] [CrossRef]
  31. Alsaad, H.; Voelker, C. Performance Assessment of a Ductless Personalized Ventilation System Using a Validated CFD Model. J. Build. Perform. Simul. 2018, 11, 689–704. [Google Scholar] [CrossRef]
  32. Liu, X.; Niu, J.; Perino, M.; Heiselberg, P. Numerical Simulation of Inter-Flat Air Cross-Contamination under the Condition of Single-Sided Natural Ventilation. J. Build. Perform. Simul. 2008, 1, 133–147. [Google Scholar] [CrossRef]
  33. Zhang, Z.; Chen, Q. Experimental Measurements and Numerical Simulations of Particle Transport and Distribution in Ventilated Rooms. Atmos. Env. 2006, 40, 3396–3408. [Google Scholar] [CrossRef]
  34. Fanger, P.O. Thermal Comfort; McGraw-Hill Book Company: New York, NY, USA, 1972. [Google Scholar]
  35. Kanaan, M.; Amine, S.; Gazo-Hanna, E. Optimizing Supply Conditions and Use of Return Air in UFAD System: Assessment of IAQ, Thermal Comfort and Energy Performance. Results Eng. 2024, 24, 103426. [Google Scholar] [CrossRef]
  36. Walikewitz, N.; Jänicke, B.; Langner, M.; Meier, F.; Endlicher, W. The Difference between the Mean Radiant Temperature and the Air Temperature within Indoor Environments: A Case Study during Summer Conditions. Build. Environ. 2015, 84, 151–161. [Google Scholar] [CrossRef]
  37. Kántor, N.; Unger, J. The Most Problematic Variable in the Course of Human-Biometeorological Comfort Assessment—The Mean Radiant Temperature. Open Geosci. 2011, 3, 90–100. [Google Scholar] [CrossRef]
  38. Ito, H.; Nakahara, N. Simplified Calculation Model of Room Air Temperature Profile in Under-Floor Air-Condition System. In Proceedings of the International Symposium on Room Convection and Ventilation Effectiveness, Tokyo, Japan, 22–24 July 1993. [Google Scholar]
  39. Liu, F.; Zhang, L.; Qian, H. The Penetration Phenomenon of the Expiratory Airflow from Thermal Plume of Human Body in the Microenvironment around People. Build. Environ. 2024, 259, 111656. [Google Scholar] [CrossRef]
  40. Gao, N.; Niu, J.; Morawska, L. Distribution of Respiratory Droplets in Enclosed Environments under Different Air Distribution Methods. Build. Simul. 2008, 1, 326–335. [Google Scholar] [CrossRef]
  41. ASHRAE. International Weather for Energy Calculations (IWEC). Version 2012; Volume 2. Available online: https://www.ashrae.org/technical-resources/bookstore/ashrae-international-weather-files-for-energy-calculations-2-0-iwec2 (accessed on 17 July 2025).
  42. Hmadi, M.; Mourtada, A.; Daou, R. Forecasting the Performance of a District Solar Thermal Smart Network in Desert Climate—A Case Study. Energy Convers. Manag. 2020, 207, 112521. [Google Scholar] [CrossRef]
  43. Javid, M. Assessing the Impact of Water Price and Water-Use Efficiency on Domestic Water Demand in Saudi Arabia. 2024. Available online: https://www.researchgate.net/publication/380053331_Assessing_the_Impact_of_Water_Price_and_Water-Use_Efficiency_on_Domestic_Water_Demand_in_Saudi_Arabia (accessed on 17 July 2025).
  44. Moya, D.; Paredes, J.; Kaparaju, P. Technical, Financial, Economic and Environmental Pre-Feasibility Study of Geothermal Power Plants by RETScreen—Ecuador’s Case Study. Renew. Sustain. Energy Rev. 2018, 92, 628–637. [Google Scholar] [CrossRef]
  45. Economics, T. Saudi Arabia Interest Rate. Available online: https://tradingeconomics.com/saudi-arabia/interest-rate (accessed on 17 July 2025).
  46. Zhang, K.; Zhang, X.; Li, S. Simplified Model for Desired Airflow Rate in Underfloor Air Distribution (UFAD) Systems. Appl. Therm. Eng. 2016, 93, 244–250. [Google Scholar] [CrossRef]
  47. Wang, H.; Chen, Q.; Liu, Y. Investigation of the Quasi-Periodic Airflow Oscillation and Ventilation Performance of an Enclosed Environment with a Jet Air Supply. Energy Build. 2022, 265, 112104. [Google Scholar] [CrossRef]
Figure 1. Isometric view of the temporary office. Dimensions are in meters.
Thermo 05 00026 g001
Figure 2. Layouts of the EC-UFAD system (a) without energy recovery and (b) with energy recovery.
Thermo 05 00026 g002
Figure 3. Schematic diagram of the EC unit.
Thermo 05 00026 g003
Figure 4. Computational mesh used in simulations.
Thermo 05 00026 g004
Figure 5. Schematic of the experimental room used for validation.
Thermo 05 00026 g005
Figure 6. Comparative plots of our CFD predictions and experimental data of [33] for (a) normalized temperature profiles and (b) velocity profiles.
Thermo 05 00026 g006
Figure 7. Air velocity distributions on a symmetrical plane for supply temperatures of (a) 20 °C, (b) 21 °C, and (c) 22 °C.
Thermo 05 00026 g007
Figure 8. Thermal fields in the vicinity of occupants for supply temperatures of (a) 20 °C, (b) 21 °C, and (c) 22 °C.
Thermo 05 00026 g008
Figure 9. Year-round analysis results of (a) water consumption and (b) grid power consumption.
Thermo 05 00026 g009
Table 1. Simulated scenarios.
CaseSetpoint Temperature Below 1.8 m, °CSupply Temperature,
°C (db)
Supply Flow Rate, m3/sHumidity Ratio,
kg H2O/per kg Dry Air
With no energy recovery
(a.1)23200.229 0.014729
(b.1)24210.230 0.014309
(c.1)25220.232 0.013889
With energy recovery
(a.2)23200.229 0.009710
(b.2)24210.230 0.009587
(c.2)25220.232 0.009465
Table 2. Results of the grid-independence analysis.
Nb. of CellsRelative Difference in Predicted Values of Air Properties at the Exhaust with Previous Mesh Value (%)
TemperatureVelocity
Mesh 1701,414--
Mesh 21,151,7484.713.5
Mesh 31,243,8870.92.8
Table 3. Boundary conditions for the CFD simulations.
BoundaryTypeDetails
Supply diffuserVelocity inlet Temperature = 20–22 °C; velocity = 0.610; 0.613; 0.619 m/s; turbulent intensity = 5%; hydraulic diameter = 0.25 m.
Exhaust ventPressure outletDefault values
Person simulatorNo-slip conditionHeat flux = 58.15 W/m2
Roof No-slip conditionHeat flux = 16.96–17.67 W/m2
North-oriented wallNo-slip conditionHeat flux = 10.99–11.68 W/m2
West-oriented wallNo-slip conditionHeat flux = 11.81–13.12 W/m2
Floor and other wallsNo-slip conditionZero heat flux
Table 4. Thermal comfort and water performance analysis results.
CaseMRT, °CMicroenvironment of Occupant 1Microenvironment of Occupant 2Water Usage, L/h
T, °CV, m/sRH, %PMVT, °CV, m/sRH, %PMV
1. Simulations without energy recovery
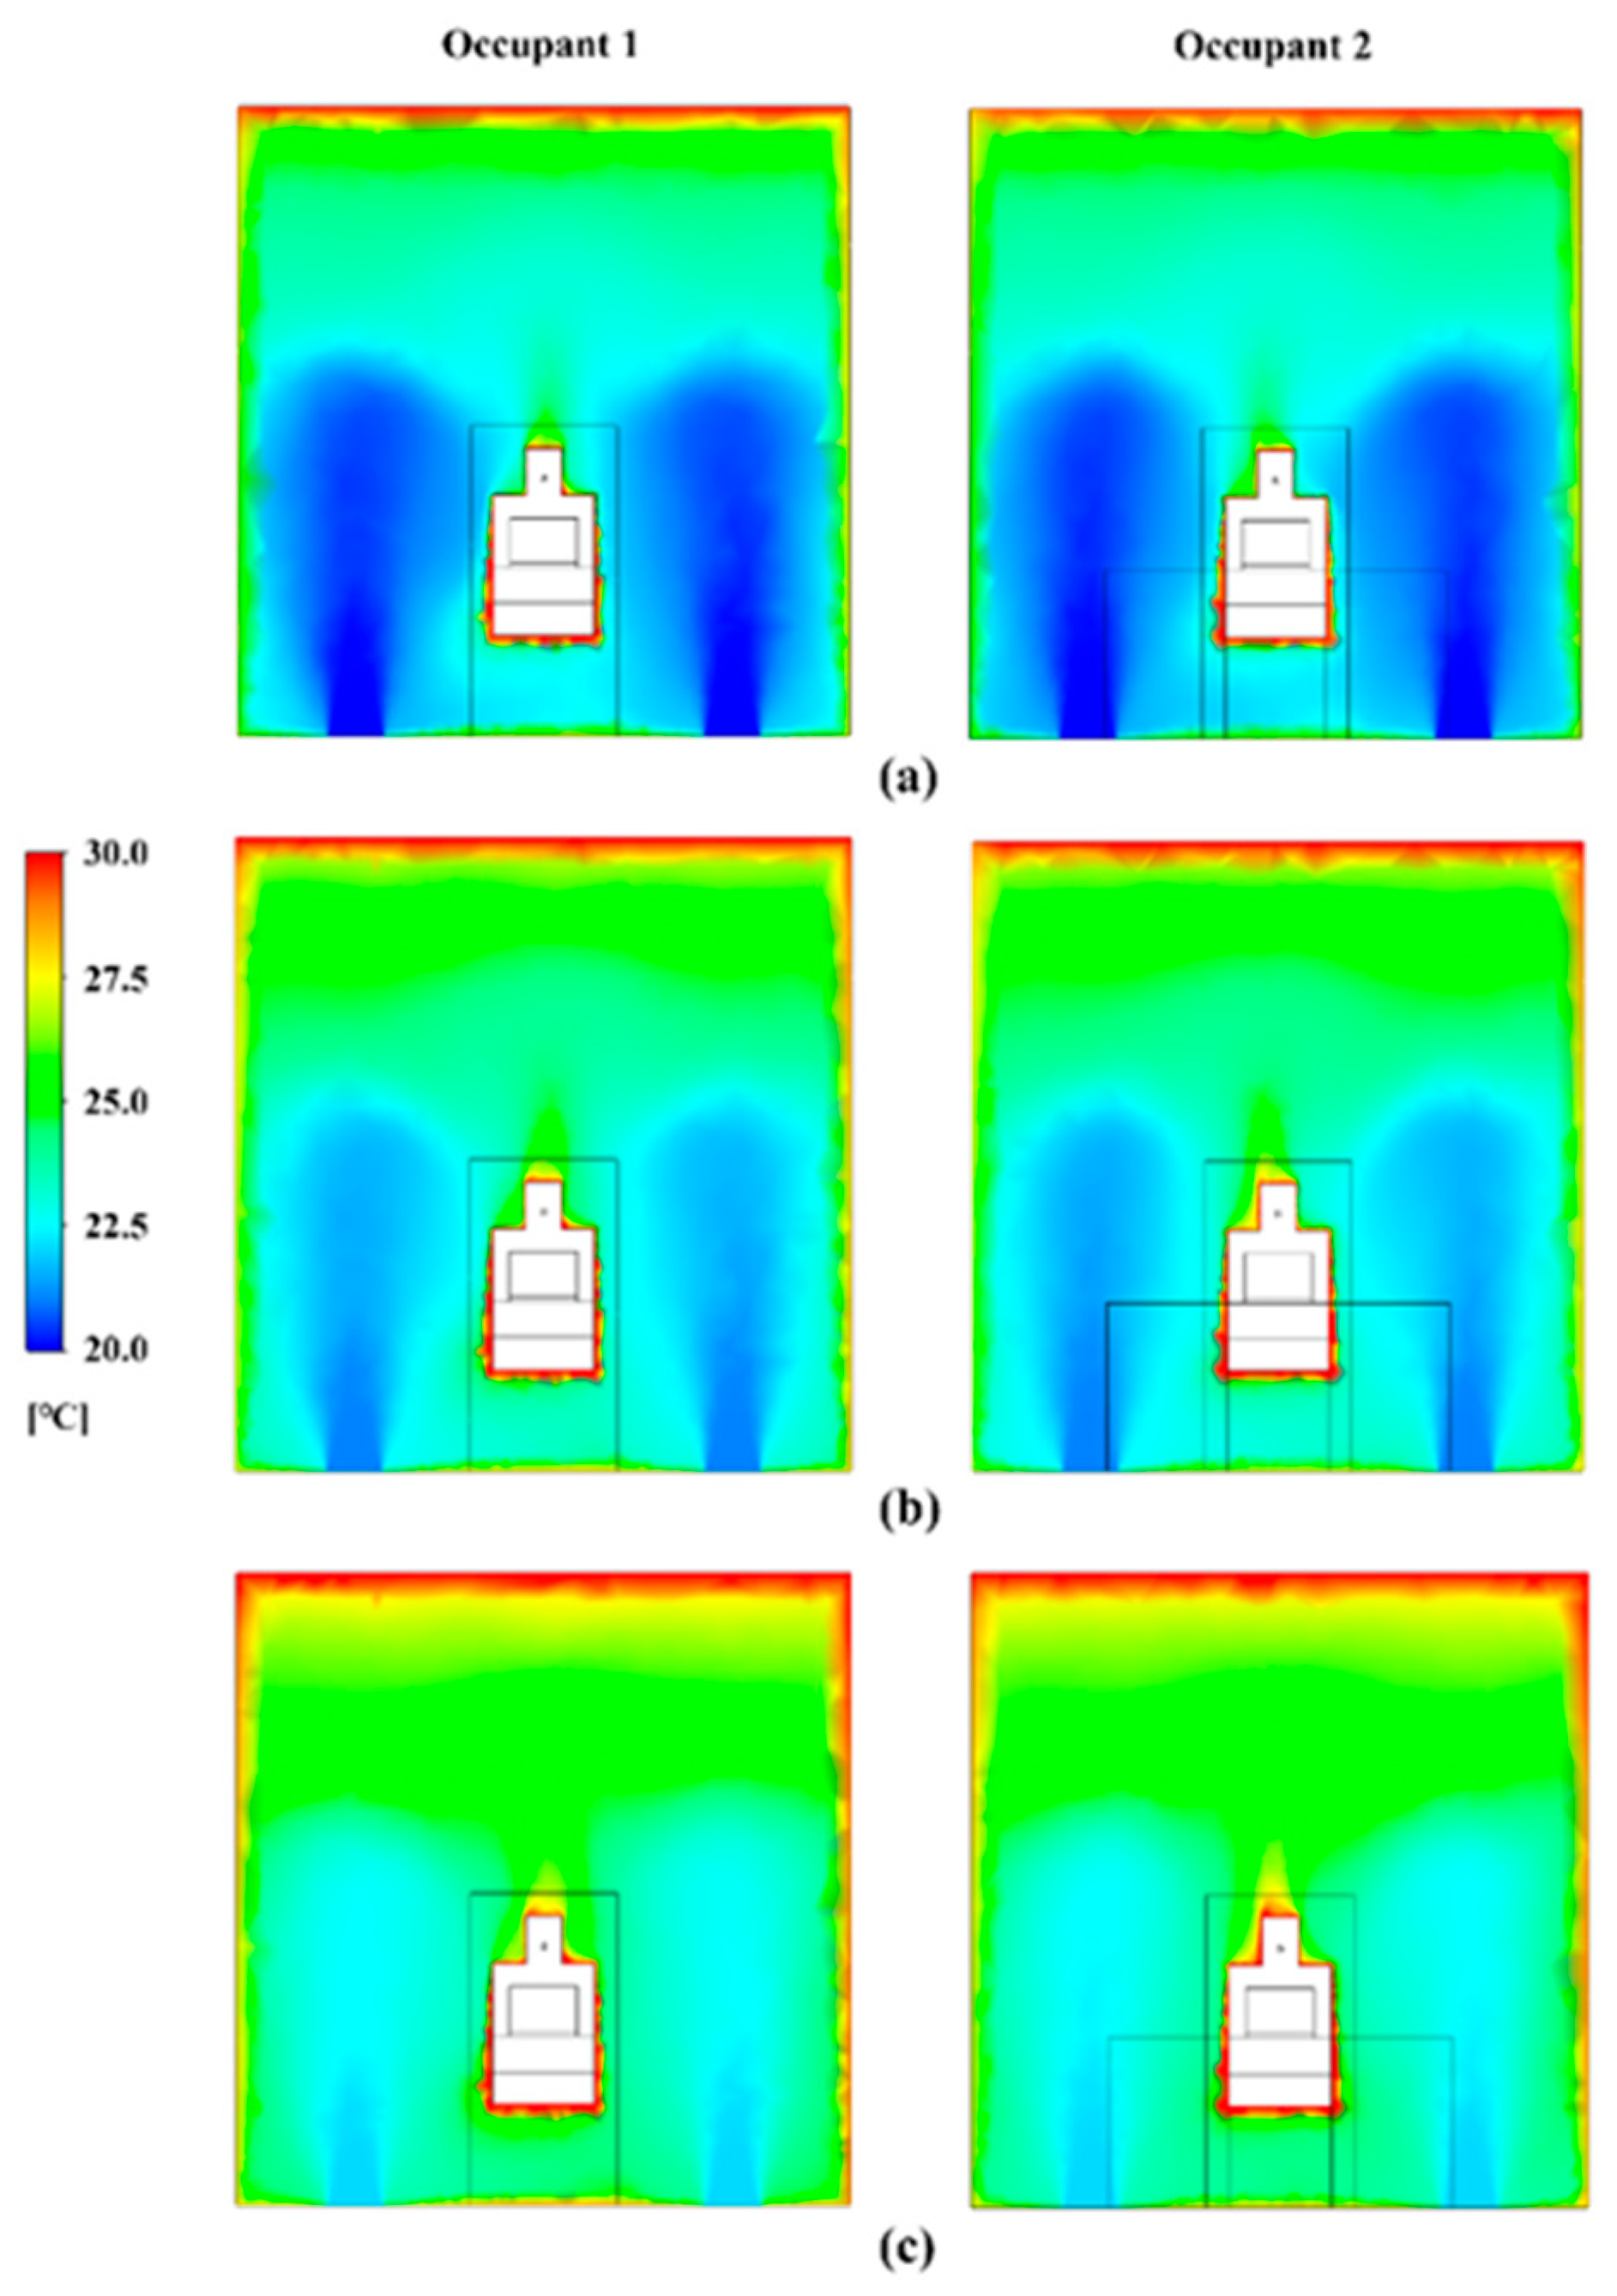
(a.1)22.8422.710.07684.55−0.7322.650.07484.86−0.7410.73
(b.1)23.8323.720.07577.32−0.4323.660.07277.60−0.4410.38
(c.1)24.8224.690.07370.86−0.1224.700.07170.82−0.1310.01
2. Simulations with energy recovery
(a.2)22.8422.710.07656.18−0.9422.650.07456.36−0.955.00
(b.2)23.8323.720.07552.19−0.6223.660.07252.38−0.634.92
(c.2)24.8224.690.07348.63−0.3124.700.07148.60−0.324.84
Table 5. Financial input parameters.
Gross area of one panel, m22
Tilted angle, degrees26
Price of PV panel, USD150
Installation cost, USD150
Cost of controller, USD100
Cost of ambiator, USD700
Cost of the DX system, USD600
Total initial investment cost, USD500
Interest rate per period, %5%
Lifetime, years10%
Yearly earnings based on 2025 electrical tariff, USD113.3
Discounted payback period based on 2025 tariff, years5
Net present value (NPV), USD375
Internal rate of return, %18.52%
Disclaimer/Publisher’s Note: The statements, opinions and data contained in all publications are solely those of the individual author(s) and contributor(s) and not of MDPI and/or the editor(s). MDPI and/or the editor(s) disclaim responsibility for any injury to people or property resulting from any ideas, methods, instructions or products referred to in the content.

