Abstract
This study investigates the effects of varying hydrogen percentages in fuel blends on combustion dynamics, engine performance, and emissions. Experimental data and analytical equations were used to evaluate combustion parameters such as equivalent lambda, in-cylinder pressure, heat release rate, and ignition timing. The findings demonstrate that hydrogen blending enhances combustion stability, shortens ignition delay, and shifts peak heat release to be closer to the top dead center (TDC). These changes improve thermal efficiency and reduce cycle-to-cycle variation. Hydrogen blending also significantly lowers carbon dioxide (CO2) and hydrocarbon (HC) emissions, particularly at higher blend levels (H0–H5), while lower blends increase nitrogen oxides (NOx) emissions and risk pre-ignition due to advanced start of combustion (SOC). Engine performance improved with an average hydrogen energy contribution of 12% under a constant load. However, the optimal hydrogen blending range is crucial to balancing efficiency gains and emission reductions. These results underline the potential of hydrogen as a cleaner additive fuel and the importance of optimizing blend ratios to harness its benefits effectively.
1. Introduction
The challenge of carbon dioxide emissions by systems using fossil fuels leads to alternative fuels such as hydrogen. The lower the carbon content of the fuel, the lower the CO2 emissions [1]. Hydrogen combustion does result in CO2 and unburned hydrocarbon emissions [2,3]. Using lean combustion for spark ignition engines (SI) improves efficiency and reduces pollution [4]. Likewise, the heat losses [5] are reduced. The thermal efficiency increases, especially at partial load, where increased air dilution is one of the main methods to reduce pumping losses [6]. It has been a promising fuel for internal combustion engines (ICEs); however, controlling hydrogen combustion within a spark ignition (SI) ICE is challenging due to its propensity for knocking and the impact this can have on engine durability. Several methods are available to control engine knocking through the adjustment of the air–fuel ratio or timing of ignition. Applying the CFD combustion model for hydrogen–gasoline blends would facilitate the development of hydrogen–gasoline engines. The fundamental properties of combustion mixtures, such as laminar flame speed, could be of help.
Wang et al. [7] experimented on a modified GDI engine via the injection of hydrogen gas and concluded that hydrogen enhances the combustion rate. Still, its effective thermal efficiency is lower than gasoline’s due to delayed MBF50 (mass burned fraction at 50%) under stoichiometric conditions. While it reduces CO and HC emissions, it also increases NOx emissions. Achieving optimal performance and emission reduction necessitates precise control of the air dilution ratio, which can be complex and may limit practical applications. Wang et al. suggested that effective thermal efficiency could be increased with an increase in air dilution.
Mohamed et al. [8] conducted an experimental study on enhancing the combustion and performance of a spark ignition (SI) engine using hydrogen (H2). The research explored port fuel injection (PFI) and direct injection (DI) hydrogen fuel systems. In the DI system, hydrogen was injected at pressures up to 4000 kPa, and pressure up to 1000 kPa was used in PFI. Both injection methods resulted in zero emissions of carbon dioxide (CO2), hydrocarbons (HCs), and carbon monoxide (CO) within a lambda range of 2.5 to 3.7 and noted challenges like knocking at certain conditions. Kim et al. [9] examined the effect of engine speed hydrogen injection timing, equivalent ratio and ignition timing on DI hydrogen internal combustion engines. They concluded that COVimep is an appropriate parameter for characterizing the cyclic variation in combustion in DI hydrogen engines. Subramanian et al. [10] conducted an investigation similar to Wang et al. [11]’s work on the instability of combustion under lean conditions and presented active strategies like water injection to mitigate high NO emissions with stable combustion. The COVimep is an ideal parameter in evaluating the performance of hydrogen engines [12,13]. Blending hydrogen with gasoline has proven to result in better combustion and thermal efficiencies while reducing exhaust emissions such as carbon dioxide and unburned hydrocarbon because hydrogen has a lean burn limit and high burning velocity. The incorporation of a small amount of hydrogen gas into a gasoline engine can improve the engine’s performance under low speed and low load. Ji et al. [14] discovered that the impact of hydrogen addition on a gasoline (SI) engine under idle conditions reduced combustion cycle fluctuation, decreased the combustion duration, and improved the emission of hydrocarbon and carbon monoxide. They further [15] developed and tested a gasoline rotary engine enriched with hydrogen under partial load conditions, and observed an improvement in thermal efficiency. Wang et al. [16] also used hydrogen during a wide open-throttle operation with a lean strategy in a gasoline engine. Moreover, Verhelst et al. [17] concluded that the combustion characteristics of hydrogen could significantly improve engine efficiency, especially at partial load. Their findings support the idea that a reduction in pumping losses and residual gas factions could lead to increased brake thermal efficiency and enhanced exhaust emissions. Much research has been performed on blending hydrogen in the lean condition of a gasoline engine; moreover, there is a need to explore the balance of a reduction in CO2 and hydrocarbon with the potential of increasing NOx while maintaining combustion efficiency and stability. The percentage of hydrogen that needs to be added for a particular operation needs to be determined, and the effects on the combustion parameters and emissions must be observed for real-life operations. The results from this investigation of the influence of the volumetric percentage changes of hydrogen on the lean air–fuel ratio can be used to address the challenges of increased NOx emissions. This will contribute to the reduction in greenhouse gases and pollution emissions in the transportation sector.
The objective of this study is to evaluate the effects of blending varying volumetric percentages of hydrogen with gasoline on the overall performance, combustion characteristics, and emissions of a gasoline engine. This includes examining how hydrogen blending influences key performance metrics, such as brake thermal efficiency (BTE) and fuel consumption, to determine the potential for improved energy utilization. It also involves investigating the impact of different hydrogen–gasoline blend ratios on combustion dynamics, including cylinder pressure, heat release rates, and cyclic stability, to understand the operational characteristics under various blending scenarios. Additionally, this study aims to measure and analyze the changes in the emission levels of major pollutants, including nitrogen oxide (NOx), carbon monoxide (CO), hydrocarbons (HCs), and carbon dioxide (CO2), resulting from hydrogen blending. Finally, it seeks to identify the volumetric percentage of hydrogen that achieves the most favorable balance between enhanced engine performance and minimized emissions, making the system more environmentally sustainable. This research aims to provide valuable insights into the potential of hydrogen–gasoline blends as a viable and practical transitional solution for reducing carbon emissions in internal combustion engines, supporting global efforts toward the decarburization of the transportation sector.
2. Methodology
2.1. Experimental Setup
An experiment was carried out on a contemporary gasoline direct ignition (GDI) SI engine with the properties of hydrogen and gasoline shown in Table 1 and the engine specifications in Table 2. A modified injection feature was incorporated to add hydrogen into the intake manifold. A volumetric flow meter (PlatonNGseriesVAGTF-2AHD with a range of 2–44 L/min 1.013 bar 20 °C) was used to measure the volumetric flow rate of hydrogen. The mixture of air and hydrogen was introduced into the cylinder, and the gasoline was supplied directly into the cylinder. An AVL piezoelectric in-cylinder pressure transducer with a charged amplifier (AVL FlexlFEM) was used to measure the combustion data before the catalyst converter, while a Baumer (720 pulses per revolution) magnetic crank angle encoder was used. The pressure data were recorded at each 0.1 crank angle by the AVL, as shown in Figure 1. Emission measurements were taken before the TWC for NOx, carbon monoxide, unburnt hydrogen gas, CO2, and water using an MKS 2030 Fourier transform infrared (FTIR) spectrometer.

Table 1.
Hydrogen and gasoline fuel properties [18].

Table 2.
Test engine specifications.
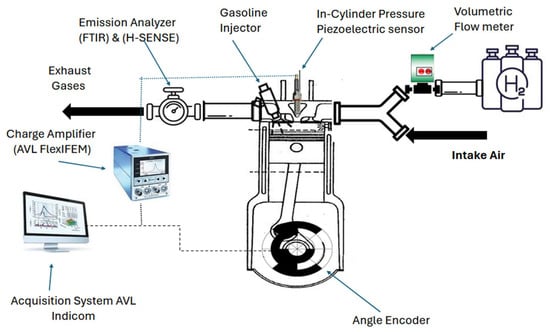
Figure 1.
Experimental setup.
2.2. The Test Procedures
The experiments were conducted under steady-state engine conditions with a torque of 40 Nm and a speed of 2000 rpm. For the baseline gasoline with 0% hydrogen, the lambda values were maintained between 1.0 and 1.2. In contrast, for the dual-fuel gasoline–hydrogen combustion with a 20 liter/minute volumetric flow rate of hydrogen gas, the lambda values ranged with a 0.01 interval from 1.0 to 2.0. Combustion stability was ensured by keeping the coefficient of variation in the indicated mean effective pressure (COVimep) below 5% under various operating conditions to prevent engine knock. The engine’s lambda was adjusted automatically by modifying the injection duration and throttle angle, increasing airflow to maintain consistent engine brake torque.
The experiments began with baseline gasoline without hydrogen to establish control data. Subsequently, tests with dual-fuel gasoline–hydrogen mixtures were performed to evaluate the effects of hydrogen on engine performance. The volumetric percentage of the hydrogen gas was determined using Equation (1), and the overall equivalent ratio was calculated with Equation (2). It required no significant hardware modifications, highlighting the potential applicability of these results to commercially available engines.
Lean combustion was studied for its potential to reduce fuel consumption, providing a reduction in CO2 emissions. To ensure consistent comparisons between the combustion setups and lambda values, the mass fraction burned at 50% (MFB50) was maintained between 3 and 4 crank angle degrees after top dead center (CAD TDC) through spark timing adjustments. For each experimental condition, 200 cycles were recorded. Table 3 and Table 4 show the overall test plan for the engine operation points. It includes three operations with the conventional engine (gasoline only) named (M0…M2) and eleven operations with the dual fuel of hydrogen—gasoline (H0…H10).

Table 3.
Experimental data.

Table 4.
Engine performance.
The percentage of hydrogen, αH2, and overall equivalent ratio, , can be calculated as follows [19]:
where and are the volumes of hydrogen gas and air, respectively. and are the densities of hydrogen gas and air, respectively. On the other hand, and are the stoichiometric air-to-fuel ratios of hydrogen gas and gasoline, respectively, and is the mass flow rate of the fuel. Then, the equivalent lambda,
2.3. The Heat Release Rate (HRR)
The heat release rate (HRR) measures the energy released during combustion in an engine cylinder. This is derived from the in-cylinder pressure data, measured relative to the crank angle. This is achieved by using a pressure transducer and a crank angle encoder to capture synchronized data. The collected pressure data are then processed using thermodynamic equations, such as Equation (3), to calculate the HRR as a function of crank angle, providing insights into combustion dynamics and efficiency.
2.4. The Hydrogen Energy Share (HES)
This is defined as the hydrogen fuel to the total energies of the fuel input. It is calculated with Equation (4), where LHVhyd and LHVgas are the lower heating values of hydrogen and gasoline, respectively, while hydrogen and mgas are the mass flow rates of hydrogen and gasoline, respectively.
2.5. Calculation of Mean Effective Pressure (COVimep)
To maintain the combustion stability and durability of the engine, COVimep was monitored while the engine ran for 200 cycles. It was calculated using Equation (5), as stated below. The COVimep of 5% was selected as the accepted value to prevent damage to the engine.
2.6. Brake Thermal Efficiency and Brake-Specific Fuel Consumption
The brake thermal efficiency and brake-specific fuel combustion were calculated using Equations (6) and (7), respectively. The records of torque and speed were taken to calculate the power.
3. Results and Discussion
The molecular percentages of hydrogen fuel (Mol. %H) in the combustion mixture were calculated using Equation (1), as shown in Table 3. M0, M1, and M2 were the experiments with gasoline only, and H0,…. And H10 were experiments that combined hydrogen fuel with gasoline fuel. H0 had the highest percentage of hydrogen fuel, and H10 had the lowest percentage.
3.1. Effect of Hydrogen Percentage on the Equivalent Lambda
Equations (1) and (2) were used to calculate the molecular percentage of hydrogen in the combustion mixture and the equivalent lambda. As the mixture becomes leaner, more air flows into the combustion chamber, diluting the fuel concentration. This means more hydrogen gas is involved in the combustion of low lambda. Moreover, the high air–fuel ratio required less fuel per cycle, and the fuel burnt faster at lower lambda, as shown in Figure 2. It can be inferred that when the combustible mixture is leaner, more air flows in and less fuel is needed. This reduces the hydrogen gas percentage as the lambda increases.
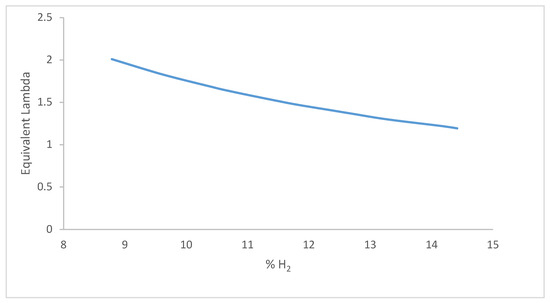
Figure 2.
Hydrogen percentage with equivalent lambda.
3.2. Effect on In-Cylinder Pressure
Figure 3a illustrates the in-cylinder pressures for hydrogen-blended fuels and their variation with increasing lambda values. All peak pressures occurred after the top dead center (TDC), indicating a low tendency for knocking. Among the fuels, H10, which had the lowest percentage of hydrogen, exhibited the highest peak pressure and produced more NOx emissions. In contrast, H0, which had the highest percentage of hydrogen fuel, recorded the lowest peak pressure.
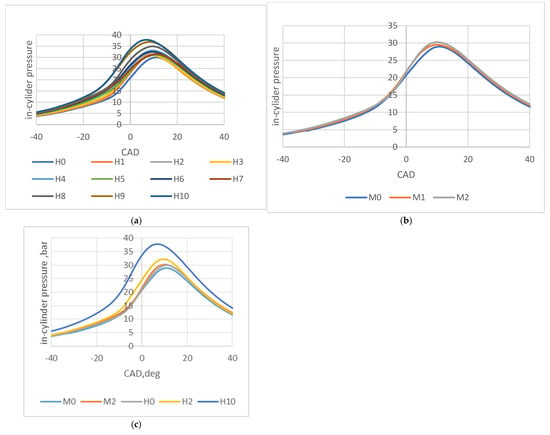
Figure 3.
(a) In-cylinder pressures for experiments with hydrogen + gasoline. (b) In-cylinder pressures for experiments with gasoline only. (c) In-cylinder pressures for M0, M2, H0, H2, and H10.
Figure 3b presents the in-cylinder pressure for the engine running solely on gasoline. The pressure showed a slight increase as the lambda increased.
Figure 3c compares the effects of hydrogen addition under equivalent lambda conditions. The fuels M0 and H0 operated at λ = 1, M2 and H2 at λ = 1.2, and H10 at λ = 2. Interestingly, despite having the lowest hydrogen percentage, H10 produced the highest peak pressure. Ignition timing adjustments ensured that the coefficient of variation in the indicated mean effective pressure (COVimep) remained below 5% at higher hydrogen volume percentages, effectively mitigating the risk of knocking.
3.3. Effect on the Heat Release Rate
Hydrogen fuel did not significantly increase the heat release rate but reduced the ignition delay, causing the peak combustion event to shift closer to the top dead center (TDC). This trend is depicted in Figure 4a for hydrogen-blended fuel and Figure 4b for gasoline-only operation. The reduction in ignition delay enhances combustion stability by minimizing cycle-to-cycle variations, a critical factor influenced by the fuel quantity used in the engine [20]. Notably, H10, which had the lowest hydrogen content, demonstrated the most pronounced shift in peak value, as highlighted in Figure 4c. This finding underscores hydrogen’s role in refining combustion dynamics, even at lower blend levels.
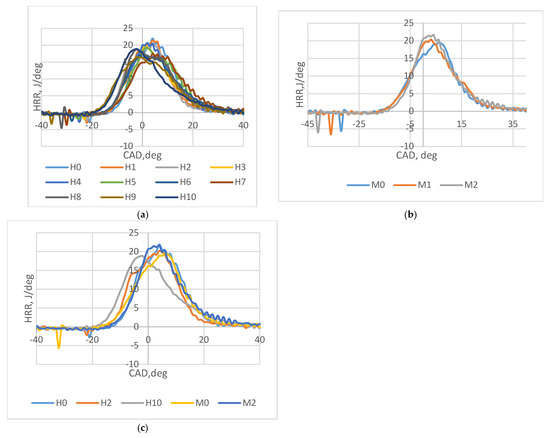
Figure 4.
(a) The heat release rate of experiments with hydrogen + gasoline. (b) The heat release rate of experiments with gasoline only. (c) HRR for M0, M2, H0, H2, and H10.
Effect on Coefficient of Variation in Indicated Mean Effective Pressure and Thermal Efficiency
The addition of hydrogen fuel enhanced combustion stability, as indicated by the coefficient of variation in the indicated mean effective pressure (COVimep) remaining below 5% [21,22]. This is illustrated in Figure 5, where COVimep values for hydrogen-blended fuels (H0 to H10) were consistently lower than those observed for gasoline-only fuels (M0 to M2). This finding suggests that hydrogen contributes to improved engine performance and cleaner combustion.
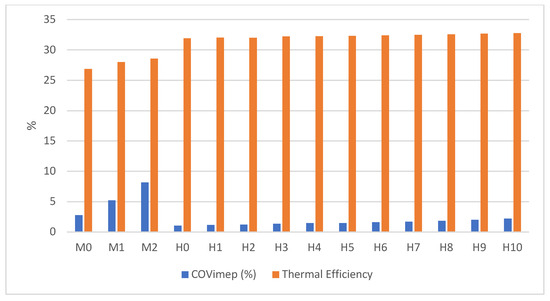
Figure 5.
The thermal efficiency and COVimep.
The figure also highlights the influence of hydrogen blending on thermal efficiency. As the percentage of hydrogen added increased, there was a positive impact on thermal efficiency. Furthermore, the hydrogen energy share, calculated using Equation (4) (referenced in Table 4), averaged 12%. This metric reflects the proportion of energy introduced by hydrogen to the conventional engine at a constant load of 40 N·m torque and an engine speed of 2000 rpm. These results underscore the potential of hydrogen as an additive to optimize engine operation under specified conditions.
3.4. Ignition Timing
The start of combustion (SOC) was observed to vary with the percentage of hydrogen blended into the air–fuel mixture. Higher hydrogen blends (H0 to H5) demonstrated a reduction in SOC compared to gasoline-only operations, as shown in Figure 6. This is attributed to hydrogen’s faster ignition properties, which optimize the combustion timing. However, in the lower hydrogen blends (H6 to H10), it is necessary to advance the SOC to retain the stability of the engine, as demonstrated by Germane et al. [23]. The COVimep was found to be less than 5. Interestingly, the impact on combustion duration was minimal, indicating that hydrogen blending primarily affects the ignition phase rather than the entire combustion process. This limitation suggests that while hydrogen blends can enhance ignition and improve early-stage combustion, the benefits for overall efficiency may be constrained unless the engine parameters, such as ignition timing and mixture preparation, are carefully optimized.
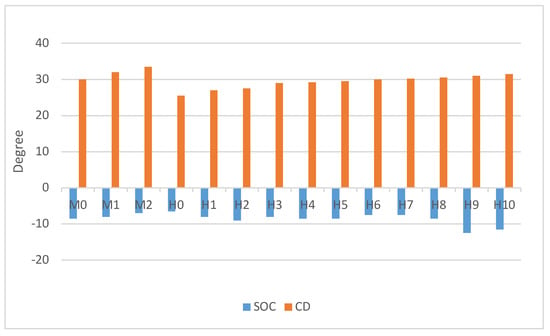
Figure 6.
SOC and combustion duration.
These findings underscore the dual nature of hydrogen as a fuel additive in improving ignition characteristics and combustion stability. It requires meticulous adjustment of engine settings to prevent negative outcomes like increased knocking propensity or reduced thermal efficiency.
3.5. Emission Analysis
Figure 7 and Table 5 shows the effect of hydrogen blending on emissions. Hydrogen blending significantly reduced carbon dioxide (CO2) and hydrocarbon (HC) emissions. The reductions were more pronounced in hydrogen blends (H0 to H5) compared to gasoline-only fuels (M0 to M2) at the same lambda values. For instance, H1 showed lower CO2 and HC emissions than M1, and H2 showed lower emissions than M2. The emissions of CO2 and HC started to increase after H5 for CO2 and H3 for HC. This indicates that there is an optimal range for hydrogen blending, beyond which the benefits start to diminish. While hydrogen blending reduced CO2 and HC emissions, it tended to increase nitrogen oxide (NOx) emissions at higher hydrogen percentages. Conversely, NOx emissions decreased at lower hydrogen blending levels for H1 to H6 and slightly increased from H7, which can be contributed to localized high-temperature zones and the retarded ignition timing setting. These findings highlight the importance of optimizing hydrogen blending levels to achieve the best balance between reducing CO2 and HC emissions while managing NOx emissions. Moreover, the average carbon monoxide (CO) emissions reduced by 73.5%, nitrogen monoxide (NO) by 35%, nitrogen dioxide by (NO2) by 24.8%, unburnt hydrocarbon (HC) by 22.3%, and total nitrogen oxide (NOX) by 33%. However, a slight increase in NOx emissions was observed at very low molecular hydrogen percentages.
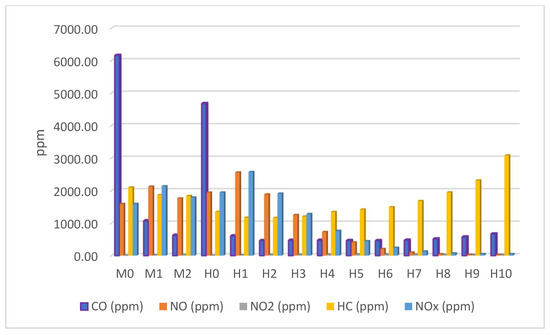
Figure 7.
Engine emissions.

Table 5.
Engine emissions.
4. Conclusions
This study examined the effects of varying hydrogen percentages in fuel blends on combustion characteristics, engine performance, and emissions. The findings indicate that hydrogen blending significantly influences combustion dynamics and engine operation, offering both advantages and challenges, as described in the following.
Combustion characteristics: Increasing the hydrogen content in the blend shortens the ignition delay and shifts the peak heat release towards top dead center (TDC), enhancing combustion stability and reducing cycle-to-cycle variations. However, higher-hydrogen blends (H6–H10) can excessively advance the start of combustion (SOC), risking pre-ignition or knocking.
In-cylinder pressure and temperature: Hydrogen blends affect in-cylinder pressure and temperature dynamics. The H10 blend, which had the lowest hydrogen percentage, exhibited the highest peak pressure and temperature, leading to increased NOx emissions. Conversely, a higher hydrogen content (H0) reduced peak pressure, demonstrating hydrogen’s impact on combustion energy.
Thermal efficiency and combustion stability: Hydrogen blending improves thermal efficiency and combustion stability, as evidenced by a coefficient of variation in the indicated mean effective pressure (COVimep) below 5%. These effects are attributed to hydrogen’s faster ignition properties and cleaner burn compared to gasoline-only fuels.
Emissions: Hydrogen blending significantly reduces carbon dioxide (CO2) and hydrocarbon (HC) emissions, particularly at higher blending levels (H0–H5). However, NOx emissions increase with lower hydrogen percentages, emphasizing the need to optimize hydrogen blending to balance emission reductions.
Engine performance: At a constant load of 40 N torque and 2000 rpm, hydrogen energy contributed an average of 12% to engine output, highlighting its potential to enhance conventional engine performance while reducing carbon-based emissions.
In conclusion, hydrogen blending offers significant benefits in improving engine efficiency and supports cleaner combustion by reducing certain emissions, but it requires careful optimization to avoid issues like excessive NOx emissions and pre-ignition. Balancing hydrogen percentages within an optimal range is crucial for harnessing its advantages while mitigating drawbacks.
Author Contributions
Conceptualization, O.M.O. and O.O.T.; methodology, O.M.O., O.O.T., O.O.A. and O.S.I.; software, O.M.O., O.O.T., O.O.A. and O.S.I.; validation, O.M.O., O.O.T., O.O.A. and O.S.I.; formal analysis, O.M.O., O.O.T., O.O.A. and O.S.I.; investigation, O.M.O., O.O.T., O.O.A. and O.S.I.; resources, O.M.O. and O.O.T.; data curation, O.M.O., O.O.T., O.O.A. and O.S.I.; writing—original draft preparation, O.M.O., O.O.T., O.O.A. and O.S.I.; writing—review and editing, O.M.O., O.O.T., O.O.A. and O.S.I.; visualization, O.M.O., O.O.T., O.O.A. and O.S.I.; supervision, O.M.O.; project administration, O.M.O.; funding acquisition, O.M.O. All authors have read and agreed to the published version of the manuscript.
Funding
This research received no external funding.
Data Availability Statement
Data is available upon request.
Conflicts of Interest
The authors declare no conflict of interest.
Nomenclature
| αH2 | Percentage of the hydrogen (-) |
| Overall equivalent ratio (-) | |
| Volume of hydrogen gas (m3) | |
| Volume of air (m3) | |
| Density of hydrogen gas (m3/Kg) | |
| Density of air (m3/Kg) | |
| Stoichiometric air-to-fuel ratios of hydrogen gas (-) | |
| Stoichiometric air-to-fuel ratios gasoline (-) | |
| Mass flow rate of fuel (gasoline). (Kg/s) | |
| Mass flow rate of hydrogen (Kg/s) | |
| Equivalent lambda (-) | |
| Q | Heat transfer (KJ) |
| P | Pressure (bar) |
| V | Volume (m3) |
| Θ | Crank angle (deg) |
| ϒ | Specific heat ratio (-) |
| LHVhyd | Lower heating values of hydrogen (KJ/Kg) |
| LHVgas | Lower heating values of gasoline (KJ/Kg) |
| HES | Hydrogen energy share (-) |
| COVimep | Coefficient of variation in the indicated mean effective pressure (-) |
| STDEVimep | Standard deviation of indicated mean effective pressure (-) |
| Imep | Indicated mean effective pressure (bar) |
| Brake-specific fuel consumption (g/kWh) | |
| Engine brake power (kW). | |
| HRR | Heat release rate (J/deg) |
References
- Demirbas, A. Correlations between carbon dioxide emissions and carbon contents of fuels. Energy Sources Part B Econ. Plan. Policy 2006, 1, 421–427. [Google Scholar] [CrossRef]
- Onorati, A.; Payri, R.; Vaglieco, B.M.; Agarwal, A.K.; Bae, C.; Bruneaux, G.; Canakci, M.; Gavaises, M.; Günthner, M.; Hasse, C.; et al. The role of hydrogen for future internal combustion engines. Int. J. Engine Res. 2022, 23, 529–540. [Google Scholar] [CrossRef]
- Salvi, B.L.; Subramanian, K.A. Sustainable development of the road transportation sector using a hydrogen energy system. Renew. Sustain. Energy Rev. 2015, 51, 1132–1155. [Google Scholar] [CrossRef]
- Mancaruso, E.; Sequino, L. Measurements and modeling of piston temperature in a research compression ignition engine during transient conditions. Res. Eng. 2019, 2, 100007. [Google Scholar] [CrossRef]
- Dennis, P.A.; Dingli, R.J.; Atibeh, P.A.; Watson, H.C.; Brear, M.J.; Voice, G. Performance of a Port Fuel Injected, Spark Ignition Engine Optimised for Hydrogen Fuel, 2012, p. 2012-01–0654. Available online: https://www.sae.org/publications/technical-papers/content/2012-01-0654/ (accessed on 26 March 2025). [CrossRef]
- Jeon, J.; Bock, N.; Northrop, W. In-cylinder flame luminosity measured from a stratified lean gasoline direct injection engine. Res. Eng. 2019, 1, 100005. [Google Scholar] [CrossRef]
- Wang, L.; Li, H.; Huang, Z.; Wang, L.; Chen, W. Impact of hydrogen direct injection on engine combustion and emissions in a GDI engine. Adv. Mech. Eng. 2023, 15, 16878132231189117. [Google Scholar] [CrossRef]
- Mohamed, M.; Longo, K.; Zhao, H.; Hall, J.; Harrington, A. Hydrogen Engine Insights: A Comprehensive Experimental Examination of Port Fuel Injection and Direct Injection; Technical Paper 2024-01-2611; SAE International: Warrendale, PA, USA, 2024. [Google Scholar] [CrossRef]
- Kim, Y.Y.; Lee, J.T.; Choi, G.H. An investigation on the causes of cycle variation in direct injection hydrogen-fueled engines. Int. J. Hydrogen Energy 2005, 30, 69–76. [Google Scholar] [CrossRef]
- Subramanian, V.; Mallikarjuna, J.M.; Ramesh, A. Effect of water injection and spark timing on the nitric oxide emission and combustion parameters of a hydrogen-fueled spark ignition engine. Int. J. Hydrogen Energy 2007, 32, 1159–1173. [Google Scholar] [CrossRef]
- Wang, S.F.; Ji, C.W.; Zhang, B.; Zhang, J.; Niu, Z.; Fan, B. Combustion and cycle-by-cycle variation of pure hydrogen-fueled spark ignition engine at idle and lean conditions. Trans. Chin. Soc. Agric. Mach. 2011, 42, 12–15. [Google Scholar]
- Sun, B.-G.; Zhang, D.-S.; Liu, F.-S. Cycle variations in a hydrogen internal combustion engine. Int. J. Hydrogen Energy 2013, 38, 3778–3783. [Google Scholar] [CrossRef]
- Chen, Y. Stability Research of Hydrogen Internal Combustion Engine in Idle Condition. Master’s Thesis, Beijing Institute of Technology, Beijing, China, 2008. [Google Scholar]
- Ji, C.; Zhang, Y.; Wang, S. Effects of hydrogen addition on combustion and emissions performance of a gasoline engine at idle conditions. Int. J. Hydrogen Energy 2010, 35, 2467–2475. [Google Scholar]
- Ji, C.; Wang, S.; Zhang, Y. Hydrogen enrichment effects on performance of a gasoline rotary engine at partial load. Int. J. Hydrogen Energy 2011, 36, 4209–4216. [Google Scholar]
- Wang, J.; Huang, Z.; Zheng, J. Partial load control of gasoline engines with hydrogen addition using lean burn strategies. Int. J. Hydrogen Energy 2012, 37, 573–580. [Google Scholar]
- Verhelst, S.; Wallner, T.; Sierens, R.; Scarcelli, R. Combustion characteristics of hydrogen in spark-ignition engines. Int. J. Hydrogen Energy 2009, 34, 5286–5293. [Google Scholar]
- Yavuz, M.; Brinklow, G.; Bonillo, A.C.; Herreros, M.; Wu, D.; Doustdar, O.; Rezaei, S.Z.; Tsolakis, A.; Millington, P.; Clave, S.A. The suitability of the three-way catalyst for hydrogen-fueled engines: A study in carbon emissions reduction and NOx management. Johns. Matthey Technol. Rev. 2024, 68, 412–426. [Google Scholar] [CrossRef]
- Cheng, S.; Changwei, C.; Shuofeng, W.; Jinxin, Y.; Xueyi, L.; Yunshan, G. Effects of hydrogen direct-injection angle and charge concentration on gasoline-hydrogen blending lean combustion in a Wankel engine. Energy Convers. Manag. 2019, 187, 316–327. [Google Scholar]
- Du, Y.; Yu, X.; Wang, J.; Wu, H.; Dong, W.; Gu, J. Research on combustion and emission characteristics of a lean burn gasoline engine with hydrogen direct injection. Int. J. Hydrogen Energy 2016, 41, 3240–3248. [Google Scholar] [CrossRef]
- Kim, J.; Chun, K.M.; Song, S.; Baek, H.K.; Lee, S.W. Hydrogen effects on the combustion stability, performance and emissions of a turbo gasoline direct injection engine in various air/fuel ratios. Appl. Energy 2018, 228, 1353. [Google Scholar] [CrossRef]
- Lee, S.; Kim, G.; Bae, C. Effect of injection and ignition timing on a hydrogen-lean stratified charge combustion engine. Int. J. Engine Res. 2022, 23, 816–829. [Google Scholar] [CrossRef]
- Germane, G.J.; Wood, C.G.; Hess, C.C. Lean Combustion in Spark-Ignited Internal Combustion Engines—A Review; Technical paper 831694; SAE International: Warrendale, PA, USA, 1983. [Google Scholar] [CrossRef]
Disclaimer/Publisher’s Note: The statements, opinions and data contained in all publications are solely those of the individual author(s) and contributor(s) and not of MDPI and/or the editor(s). MDPI and/or the editor(s) disclaim responsibility for any injury to people or property resulting from any ideas, methods, instructions or products referred to in the content. |
© 2025 by the authors. Licensee MDPI, Basel, Switzerland. This article is an open access article distributed under the terms and conditions of the Creative Commons Attribution (CC BY) license (https://creativecommons.org/licenses/by/4.0/).