Article

Optimal Location of the Active Thermal Insulation Layer in the Building Envelope

Faculty of Chemical Engineering and Technology, Cracow University of Technology, Warszawska 24, 31-155 Cracow, Poland
*
Author to whom correspondence should be addressed.
Thermo 2023, 3(1), 176-199; https://doi.org/10.3390/thermo3010011
Submission received: 18 November 2022 / Revised: 4 January 2023 / Accepted: 1 February 2023 / Published: 8 February 2023

Abstract

:
One of the modern methods of protecting against building heat losses is active thermal insulation (ATI). In winter conditions, ATI works by supplying heat into the envelope, which increases the temperature in the ATI layer. A low-temperature renewable energy medium feeds the active insulation layer directly, e.g., through solar or geothermal energy. A model for heat transfer through the building envelope with an ATI layer was developed. The numerical simulations verified the simplifying assumptions in the model. A relationship was derived to determine the optimal location of the ATI layer in the envelope. The objective function of the summed costs of the thermal energy supplied to the internal space and the envelope was assumed. We took into account the fact that the unit price of energy supplied to the ATI layer is lower than the price of the energy supplied to the internal space. Based on the results of the measurements carried out in a building facility with the ATI layer installed, the actual savings effects due to the ATI layer were compared to the calculated values.

1. Introduction

Some human activities, such as burning fossil fuels and cutting down forests, increase the amount of carbon dioxide in the atmosphere. As a greenhouse gas, carbon dioxide in the atmosphere retains heat and impedes its propagation into space. The burning of fossil fuels is still being used intensively in many countries around the world, which has a negative effect on the Earth’s climate.
Counteracting the ongoing environmental degradation resulting from energy production is possible by:
  • The rational energy use of energy, i.e., energy-efficient technologies in all manufacturing and living processes. In this way, the global demand for primary energy can be reduced;
  • Increasing the share of energy production from renewable sources to meet energy needs;
  • Use “clean” technologies when burning fossil fuels. Renewable sources will not wholly substitute conventional sources.
The energy used for heating and cooling a building’s spaces represents a significant share of global consumption. Therefore, preventing heat (or cold) loss in buildings will play an essential role in climate protection. One of the modern ways of protecting against such losses is active thermal insulation.
The most common approach to reducing heat loss from a building is to increase the thermal resistance of the walls. This operation, which usually involves increasing the thickness of insulation, is widely used but has limitations primarily related to the geometry of the building.
Heat loss from the building can also be reduced by heating the walls. This involves transferring heat outside of the room being heated, which may seem uneconomical. However, it should be considered that the cost of raising the temperature strongly depends on the temperature range in which it occurs. It makes sense if this involves using renewable energy from a low-temperature medium in its direct form (solar or geothermal energy). Thus, this forms the basis of active thermal insulation (ATI).
The main advantage of ATI is that the heat loss from a heated room is reduced during the heating season. This is synonymous with saving energy for heating, caring for the environment, and preventing climate change.
In the literature, ATI is also referred to as a thermal barrier (TB), a thermo-activated wall (TAW), and active thermal protection (ATP).
Active thermal insulation is the subject of many research papers and patents. One of the earlier reports on ATI concerns the Isomax Terrasol system [1], which consists of a solar collector and a ground storage reservoir for storing solar energy. The insulated ground storage consists of several zones with different temperatures. A suitable control system transfers energy from the storage tank to the walls with embedded pipes. The ground is treated as a seasonal heat accumulator with great capacity.
The paper by Xu et al. [2] reviews the methods for modeling heat transfer in systems with pipes located in a wall. The method for placing pipes in a wall is described, among other factors, in the patent [3].
Romani et al. [4] discussed the simulation and control of thermally active building systems (TABS). A review of the work on the use of phase-change materials (PCM) for radiant chilled ceilings was presented by Mousavi et al. in their paper [5]. In the work of Hongn et al. [6], two new models for active structures with embedded pipes were proposed.
Krzaczek and Kowalczuk [7] suggested that a wall with ATI should consist of at least three layers: an external insulating layer, a core with installed pipes, and an internal layer with low thermal conductivity. They also recommended using a working liquid with a constant temperature of 17 °C throughout the year. This temperature provides an unchanging direction of heat transfer from the internal surface toward the ATI layer. Obtaining a constant medium temperature requires extracting the heat from different locations in the ground, depending on the season.
Barkanyi [8] presented a method of arranging the different wall layers containing ATI. The ATI layer is placed between the layers of insulation, with the internal layer having a lower thermal conductivity coefficient than the external layer.
Meggers et al. [9] presented a system that minimizes exergy demand and maximizes the use of renewable geothermal heat from the ground. The liquid is pumped into a pipe network in the building wall. The pipe network is connected to a ground source of heat. Steady-state analyses showed that at an outdoor temperature of −10 °C and a 6 cm-thick active insulation system has the equivalent performance of 11 cm-thick passive insulation. Furthermore, the location of the pipes in the wall was found to have a minor effect on the thermal effects.
Niu and Yu [10] performed numerical calculations for a multilayer wall with an embedded capillary pipe network. In order to analyze the effect of the location of the pipe network embedded in the wall, a mathematical heat transfer model was created, and a simulation platform based on the Matlab application was developed to evaluate the system’s performance. Optimization of the location of the pipe network was performed. The net energy benefit, i.e., the direct energy benefit (difference in heat losses for passive insulation and active insulation) minus the power (related to the surface area) consumed to transport the working liquid flowing through the pipes in the ATI layer, was used as the objective function. No significant dependence of the energy benefit on the location of pipes in the wall was found.
Yu et al. [11] studied the effect of water temperature and flow rate on the thermal performance of the envelope, while Li et al. [12] studied the effect of external temperature (climate) on the energy savings resulting from the use of ATI. Shen and Li [13] analyzed an ATI layer supplied with water that was heated by an air source heat pump, and Simko et al. [14] studied the effect of geometric dimensions of the ATI layer on reducing heat losses.
Kisilewicz et al. [15] studied a system constructed according to patents [3,8]. According to this system, the pipes are placed in a concrete core insulated from both sides. The bearing layer is located at the internal side of the wall, and the pipes are connected directly to the ground heat exchanger. The results showed that the heat losses through the building walls were reduced by 63% on average when compared to passive insulation (when the ATI layer is not working). During the hot summer period that was analyzed, positive wall-cooling effects were obtained. Under these conditions, the refrigerant circulation in the active insulation system needed to be turned off to allow for the natural cooling of the interior spaces.
In the paper by Krzaczek et al. [16], an improved energy management technique for wall heating/cooling systems is described. The installed wall heating/cooling system is fully controlled by a special fuzzy logic program, which synchronizes the heat supply/receiving, considering the varying heat loads. The measurement results showed that the indoor air temperature variation did not exceed 0.8 °C throughout the year.
Computational fluid dynamics were used in the numerical study of the thermal performance of a wall with an embedded ATI layer, as described by Zhou and Li [17]. The simulation data were in very good agreement with the laboratory-scale measurements. The effects of the inlet water temperature, mass flow rate, and the position of the embedded pipe were studied. The results showed that the wall with an embedded pipe achieves the best cooling or heating performance when the pipes are located in the middle of the wall. The mass flow rate has a slight effect on wall heat loss.
In [18], Figiel and Leciej-Pirczewska carried out calculations concerning the impact of the location of a thermal envelope on its effectiveness. The results of the calculations involved three different locations of the thermal envelope and a wall without it. This analysis shows that the greatest reductions in heat losses are obtained with the ATI layer located outside the core. This location of the ATI layer is most common in thermally retrofitted buildings.
In a paper by Kalus et al. [19], the design solutions of walls with pipes for heating or cooling were described. Krajcik et al. [20] studied ATI with pipes attached to insulating bricks, while another paper by Krajcik et al. [21] reviewed water wall systems.
Yang et al. [22] conducted a global sensitivity analysis, which indicated that the heat source temperature, indoor temperature, charging duration, and thermal conductivity of the layer in which the pipes are embedded are the four most significant variables characterizing ATI performance. Furthermore, it was shown that pipe spacing has a major influence on heat accumulation (optimum spacing 100–250 mm). In contrast, pipe position has a minor influence on both the internal surface heat load and external surface heat losses.
Kalus et al. [23] conducted an economic analysis comparing active insulation performance with passive insulation. Insulation costs, thermal costs, and gray energy costs were taken into account. They found the use of active insulation desirable, especially when powered by geothermal or waste energy.
Another paper by Kalus et al. [24] considered the co-operation of ATI with heat storage in the form of a foundation slab that was 100 m2 and 0.2 m thick and was powered by solar energy. It was found that this storage is insufficient to heat the house but is suitable for supplying active insulation during the heating season. At a working fluid temperature of 13 °C, the thermal resistance of a wall with ATI installed is equivalent to a thickness of 500 mm of insulation.
From the above review, it is clear that the optimal location of pipes in the building envelope with the ATI layer installed is of interest to researchers, but the results they obtain are inconclusive.
The primary role in the ATI layer heat transfer model is played by the temperature of the liquid flowing through the pipes. It is variable with time as well as with position. The difference in liquid temperature between the inlet and outlet of the layer is slight, which makes it possible to use the average liquid temperature (Tf). This is reasonable because the pipes in the ATI layer are arranged in a meandering manner such that the temperature of the ATI layer in the longitudinal section is equalized. For example, for a given circuit, the pipes in the inlet region are located near the outlet sections, which averages the temperature course in the longitudinal section of the ATI.
The basis for determining the temperature, TL, is the temperature of the ground in which the ground exchanger is installed. In addition, the temperature TL is affected by the heat transfer rate between the liquid and the ATI layer with Tf. If the ground is not a heat store, the ground temperature as a function of position and time can be determined from the relationships presented in [25,26], among others.
This work aims to determine the optimal position of the ATI layer in the envelope. A heat transfer model through the envelope with the ATI layer was developed. The simplifying assumptions in the model were verified by numerical simulations. A relationship to determine the optimal location of the ATI layer was derived. Minimizing the summed cost of the heat energy delivered to the interior space and the ATI layer was used as the objective function. Only the operating costs were taken into account, and the unit price of energy supplied to the ATI layer is lower than the unit price of energy supplied to the internal space. Based on the results of the measurements carried out in the building facility with the ATI layer installed, the actual location of the ATI layer was compared with the location under optimal conditions.

2. Basic Relationships and Problem Description

For an envelope (e.g., building) with thermal resistance, R, separating the environments with different temperatures, T1 and T2, the heat flux amounts to
q = T 1 T 2 R
When the temperature T1 is fixed, and T2 < T1, then in order to reduce the heat flux, the total thermal resistance through the envelope should be increased, or the temperature T2 should be increased. In the latter case, we are dealing with ATI.
The ATI is often located in the bearing layer of the building envelope in the form of a coil connected directly to the ground heat exchanger. The working liquid circulating in this system has a lower temperature than the indoor air of the building and a higher temperature than the outdoor air during the winter season. This reduces the heat flux transferring from the indoor space during this period. The direct energy benefit can be defined as the difference in heat losses for passive insulation q0 and active insulation qi:
q b = q 0 q i
This study paid special attention to applying the ATI layer under winter conditions.
A simplified model of heat transport through an envelope with an active insulation layer is based on the assumption that the thermal resistance of the ATI layer is negligibly small, which causes the layer to have a uniform temperature, Tf. The definition of a dimensionless, active insulation temperature was introduced (0 < Φ <1):
Φ = T i T f T i T e
where Ti, Te, and Tf—internal temperature, external temperature, and ATI layer temperature [°C], respectively.
When Tf = Ti, then Φ = 0, while for Tf = Te, Φ = 1.
The ATI layer contains a heat source with heat generation qv:
q v = q f 2 L
where qf is the heat flux supplied to the ATI layer [W], while L is half the thickness of this layer [m]. The active insulation layer separates the envelope into an internal part (i) and an external part (e). Each part is characterized by the summed thermal resistances: Ri and Re. These are the sum of the resistances of the individual layers (insulation, bearing partition, and plaster) and the convective heat transfer resistance at the internal/external surface. Therefore,
R i = j s i , j k i , j + 1 h i = s i , e q k i n s
R e = j s e , j k e , j + 1 h e = s e , e q k i n s
where hi and he—convective heat transfer coefficient at the internal and external surface [W/(m2K)], respectively.
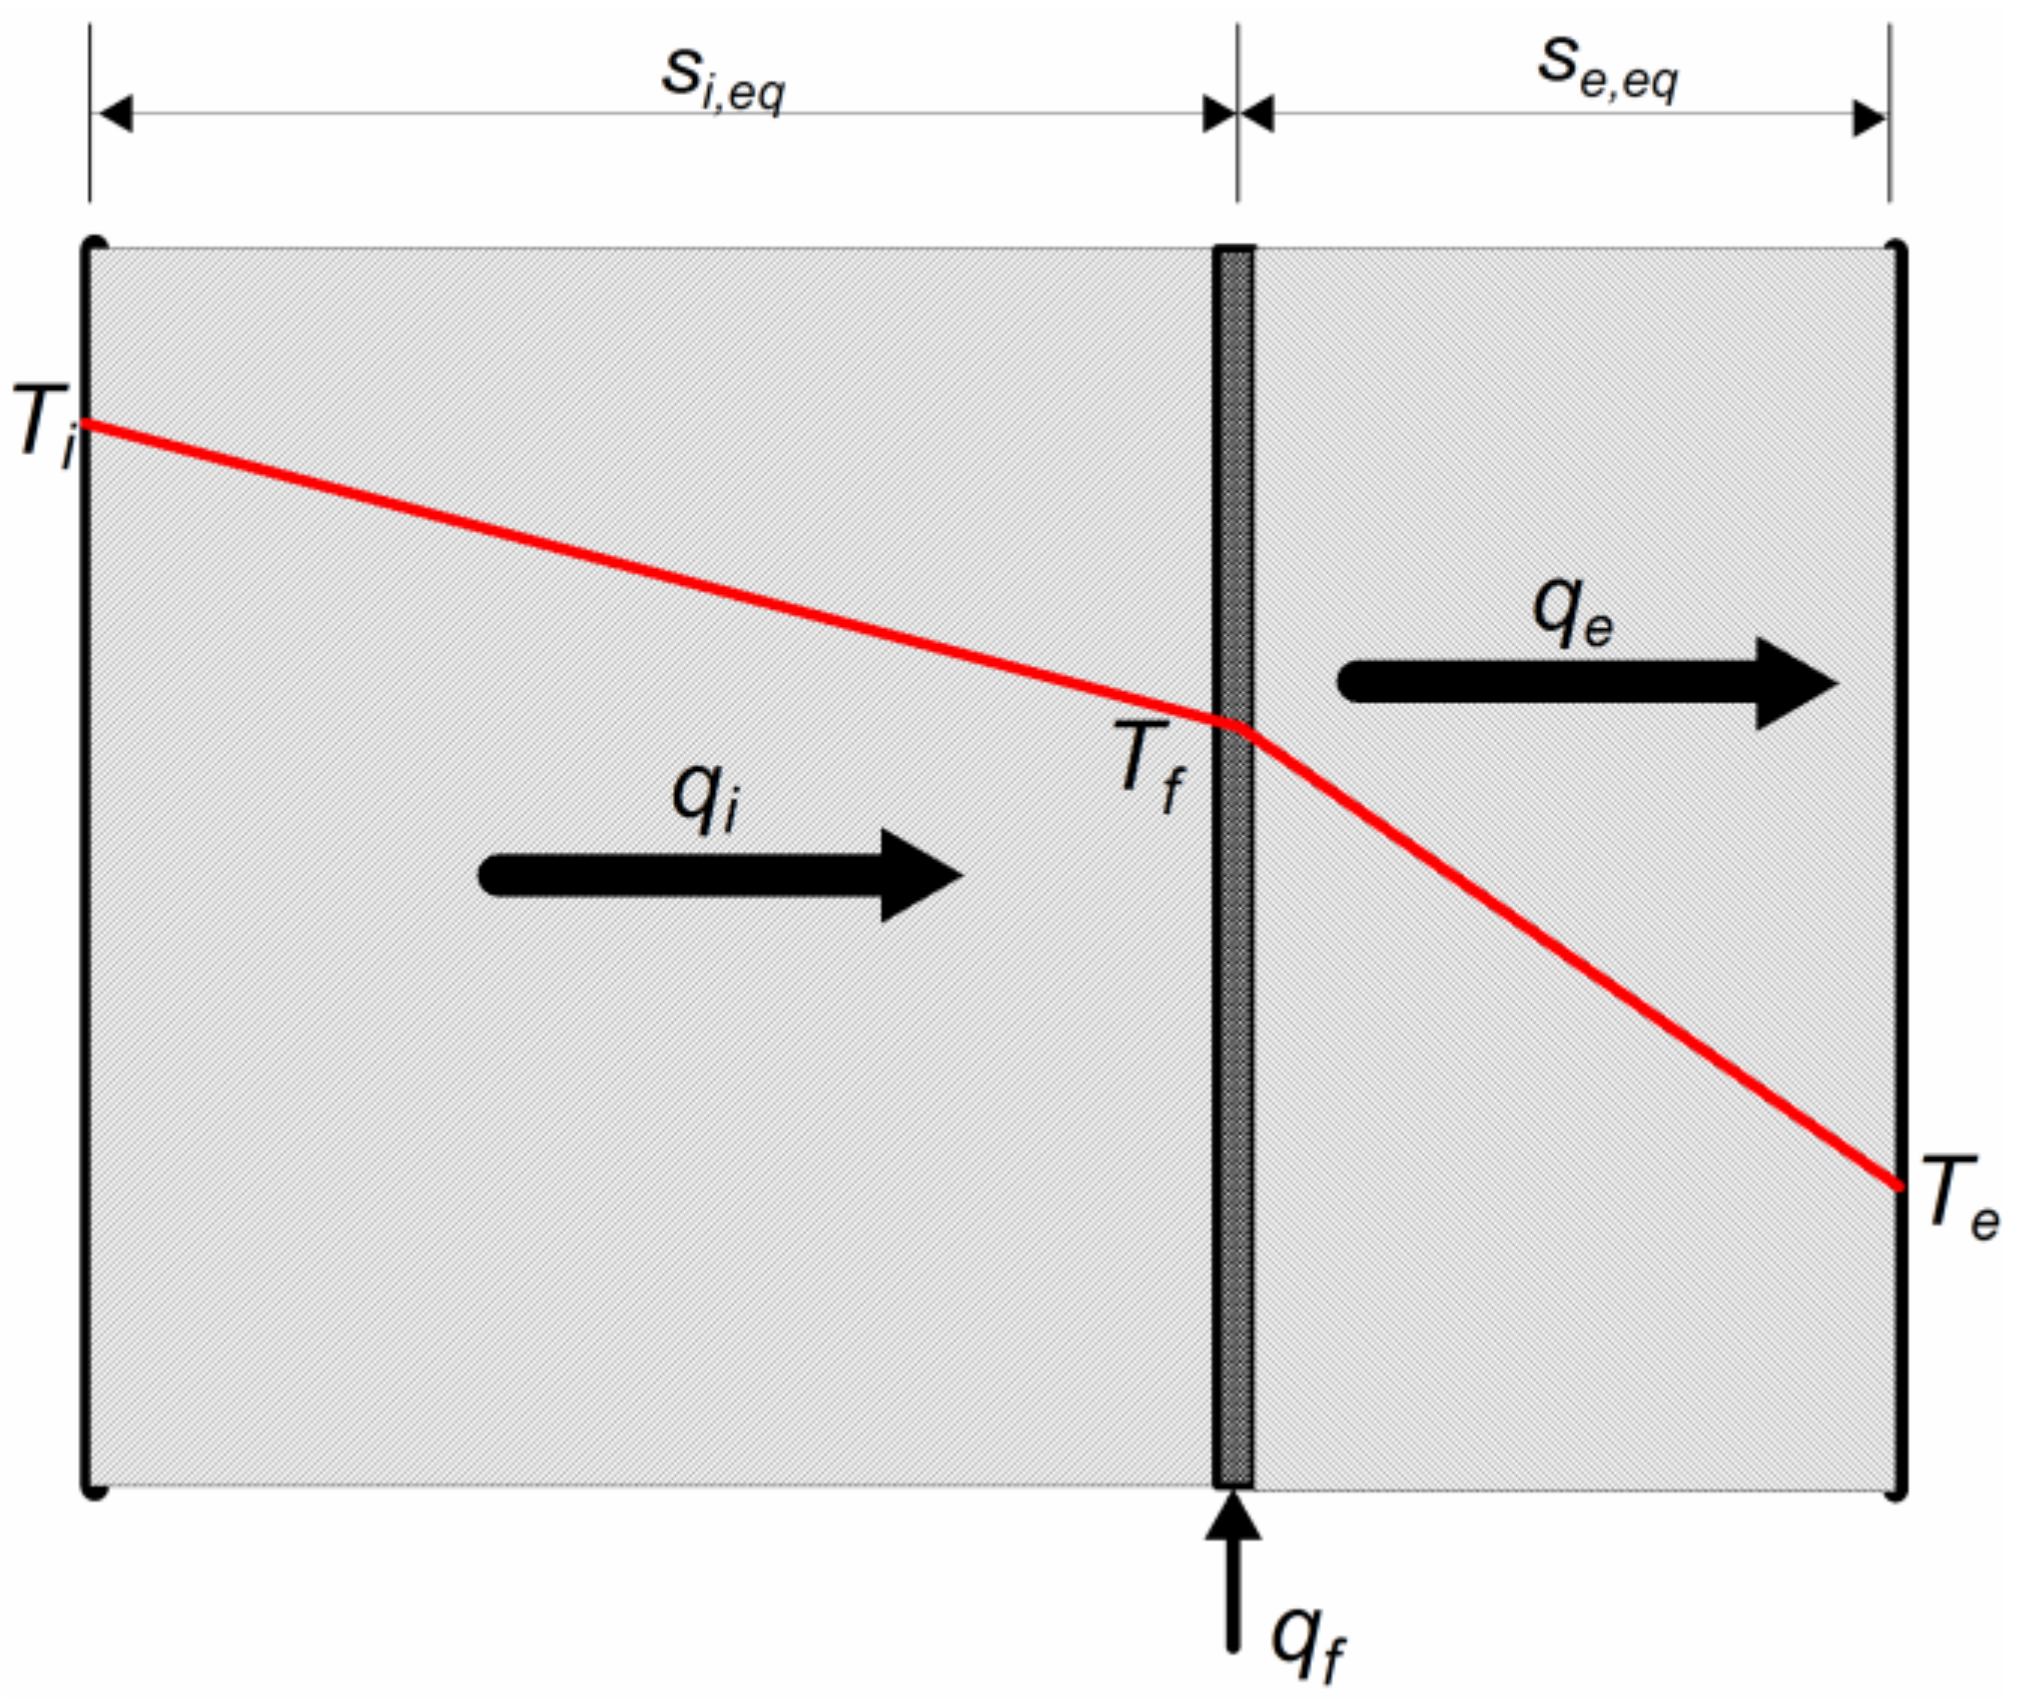
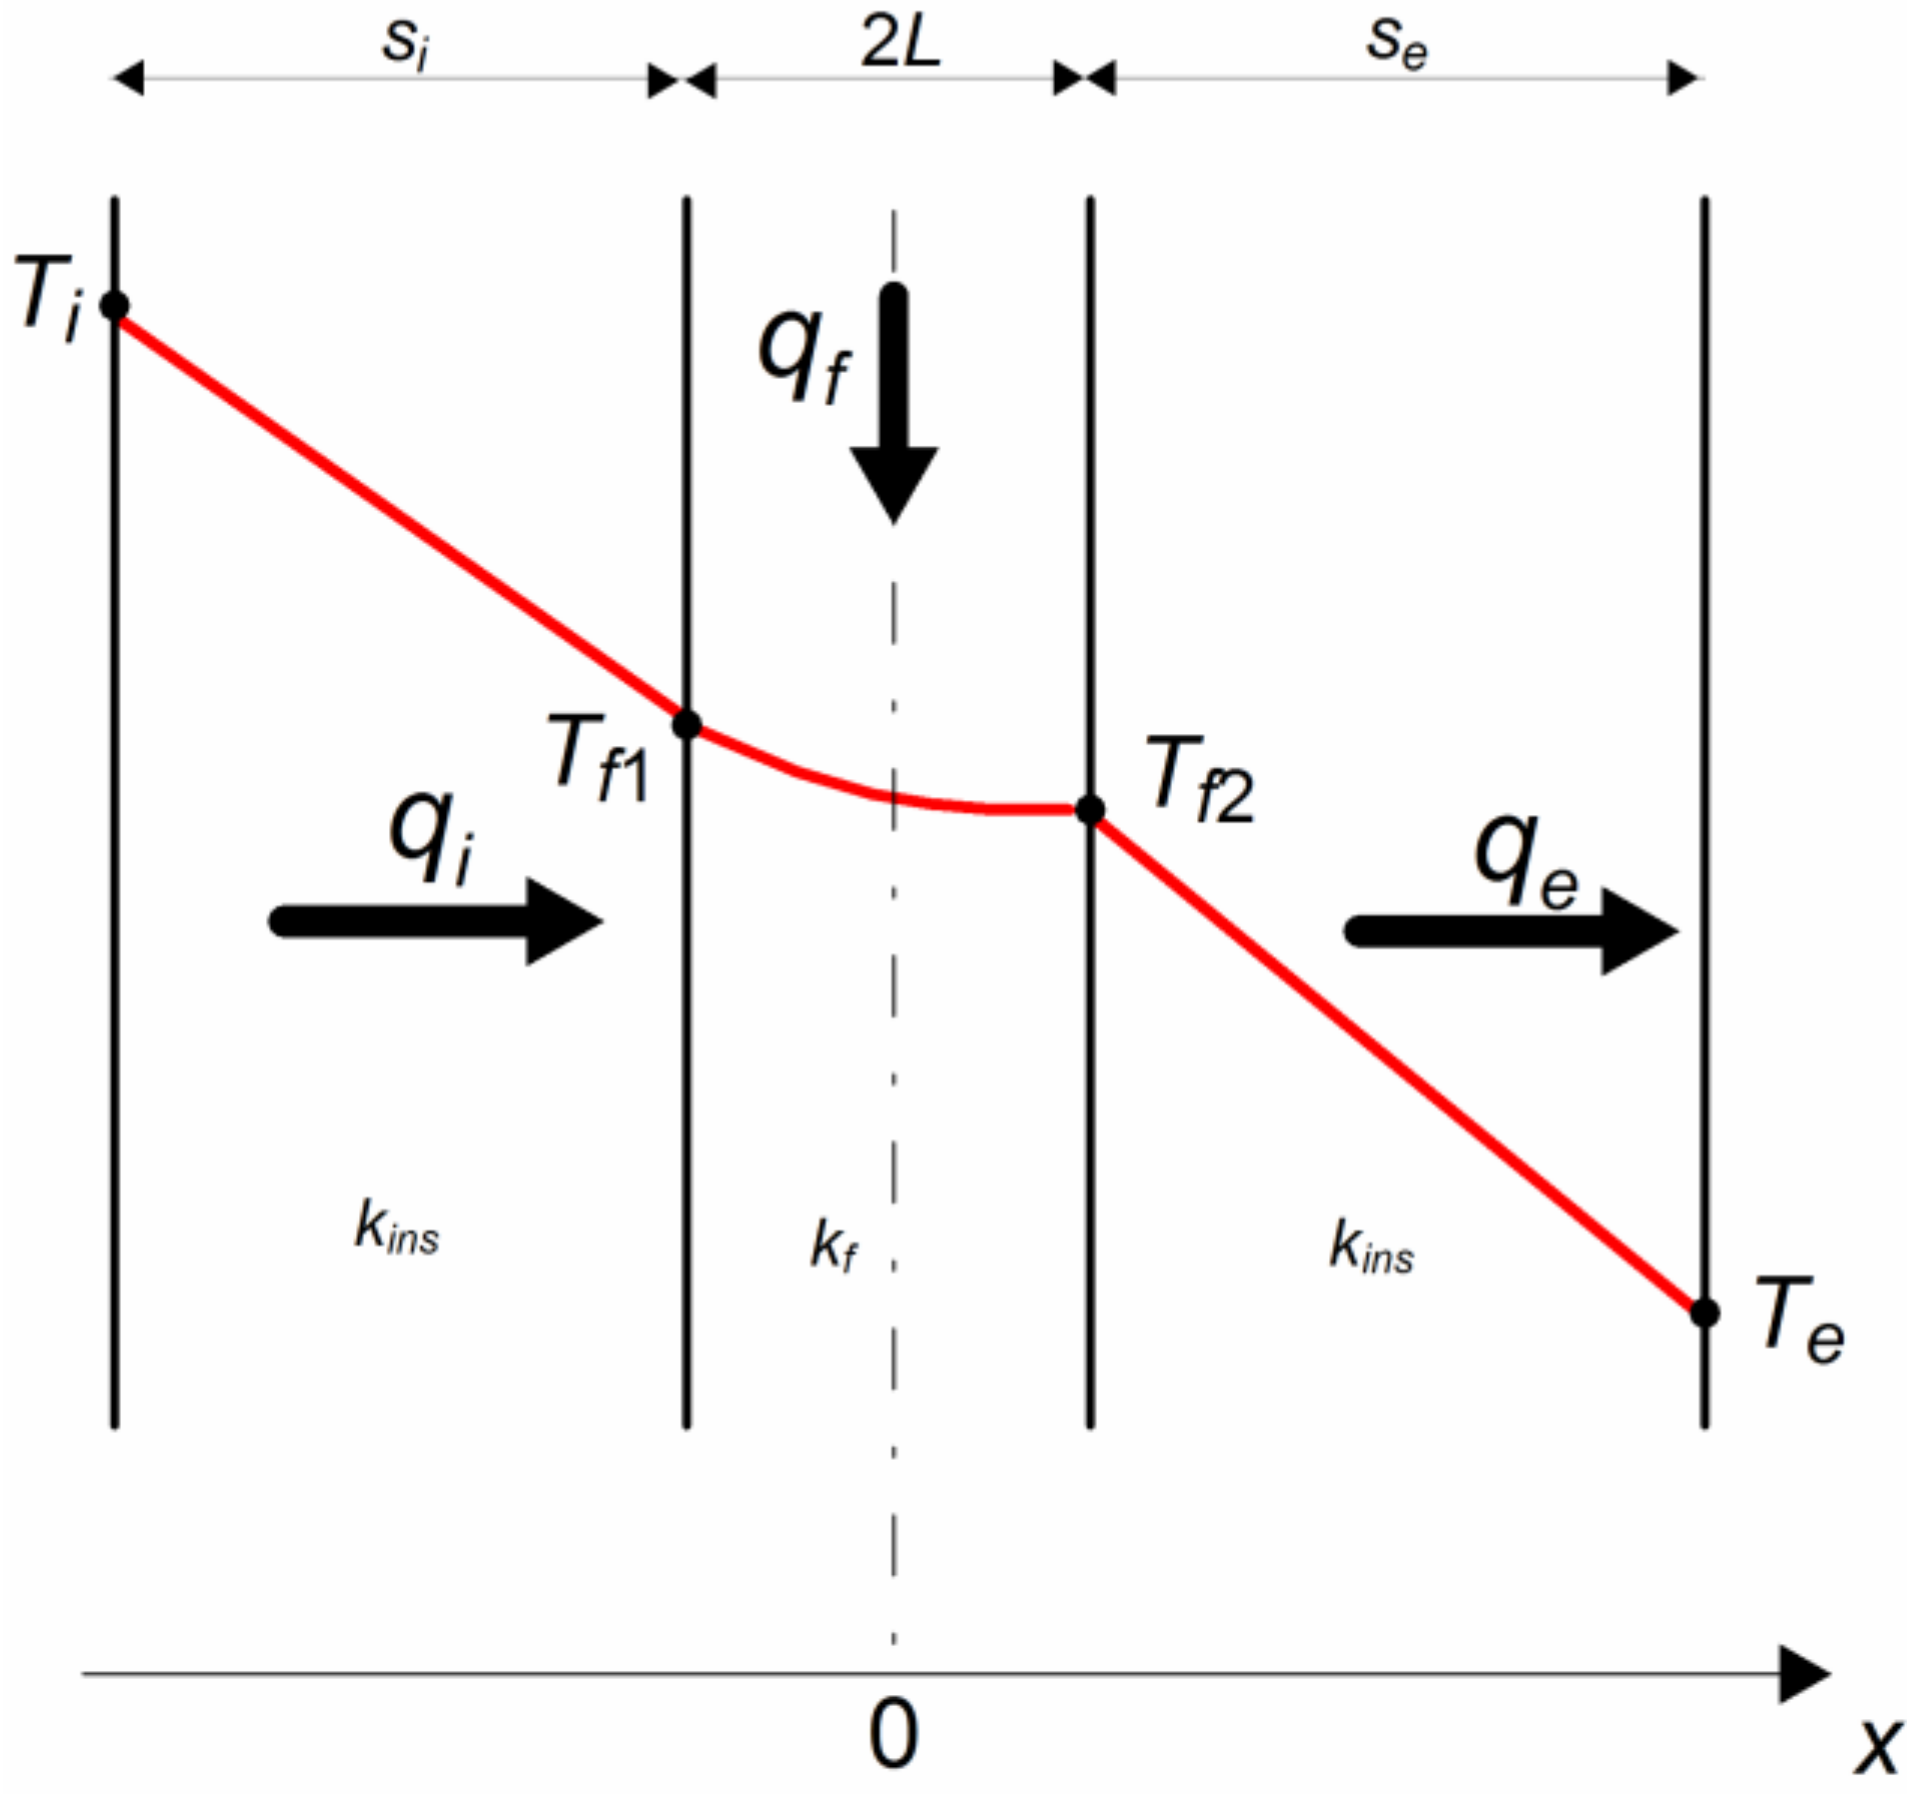
A schematic diagram of the considered envelope is shown in Figure 1. The total thermal resistance of the envelope is
R = R i + R e
The envelope temperature on the side of the interior space is kept constant at Ti, while the envelope temperature on the ambient side is Te. In the special case of no heat source (qf = 0), the insulation becomes passive. The heat fluxes in the internal and external insulation layers are then equal and amount to q0. The heat flux for passive insulation becomes
q 0 = T i T e R
In the presence of an active insulation layer, the heat fluxes transferred through the envelope are different: for the internal part (from the internal space to the active insulation layer), the heat flux is qi, while for the external part (from the active insulation layer to the surroundings), the heat flux is qe. The heat flux in the internal part is smaller than q0 and equals
q i = T i T f R i
Whereas, in the external part, the heat flux is greater than q0 and amounts to
q e = T f T e R e
The heat fluxes are related by the heat balance equation:
q i + q f = q e
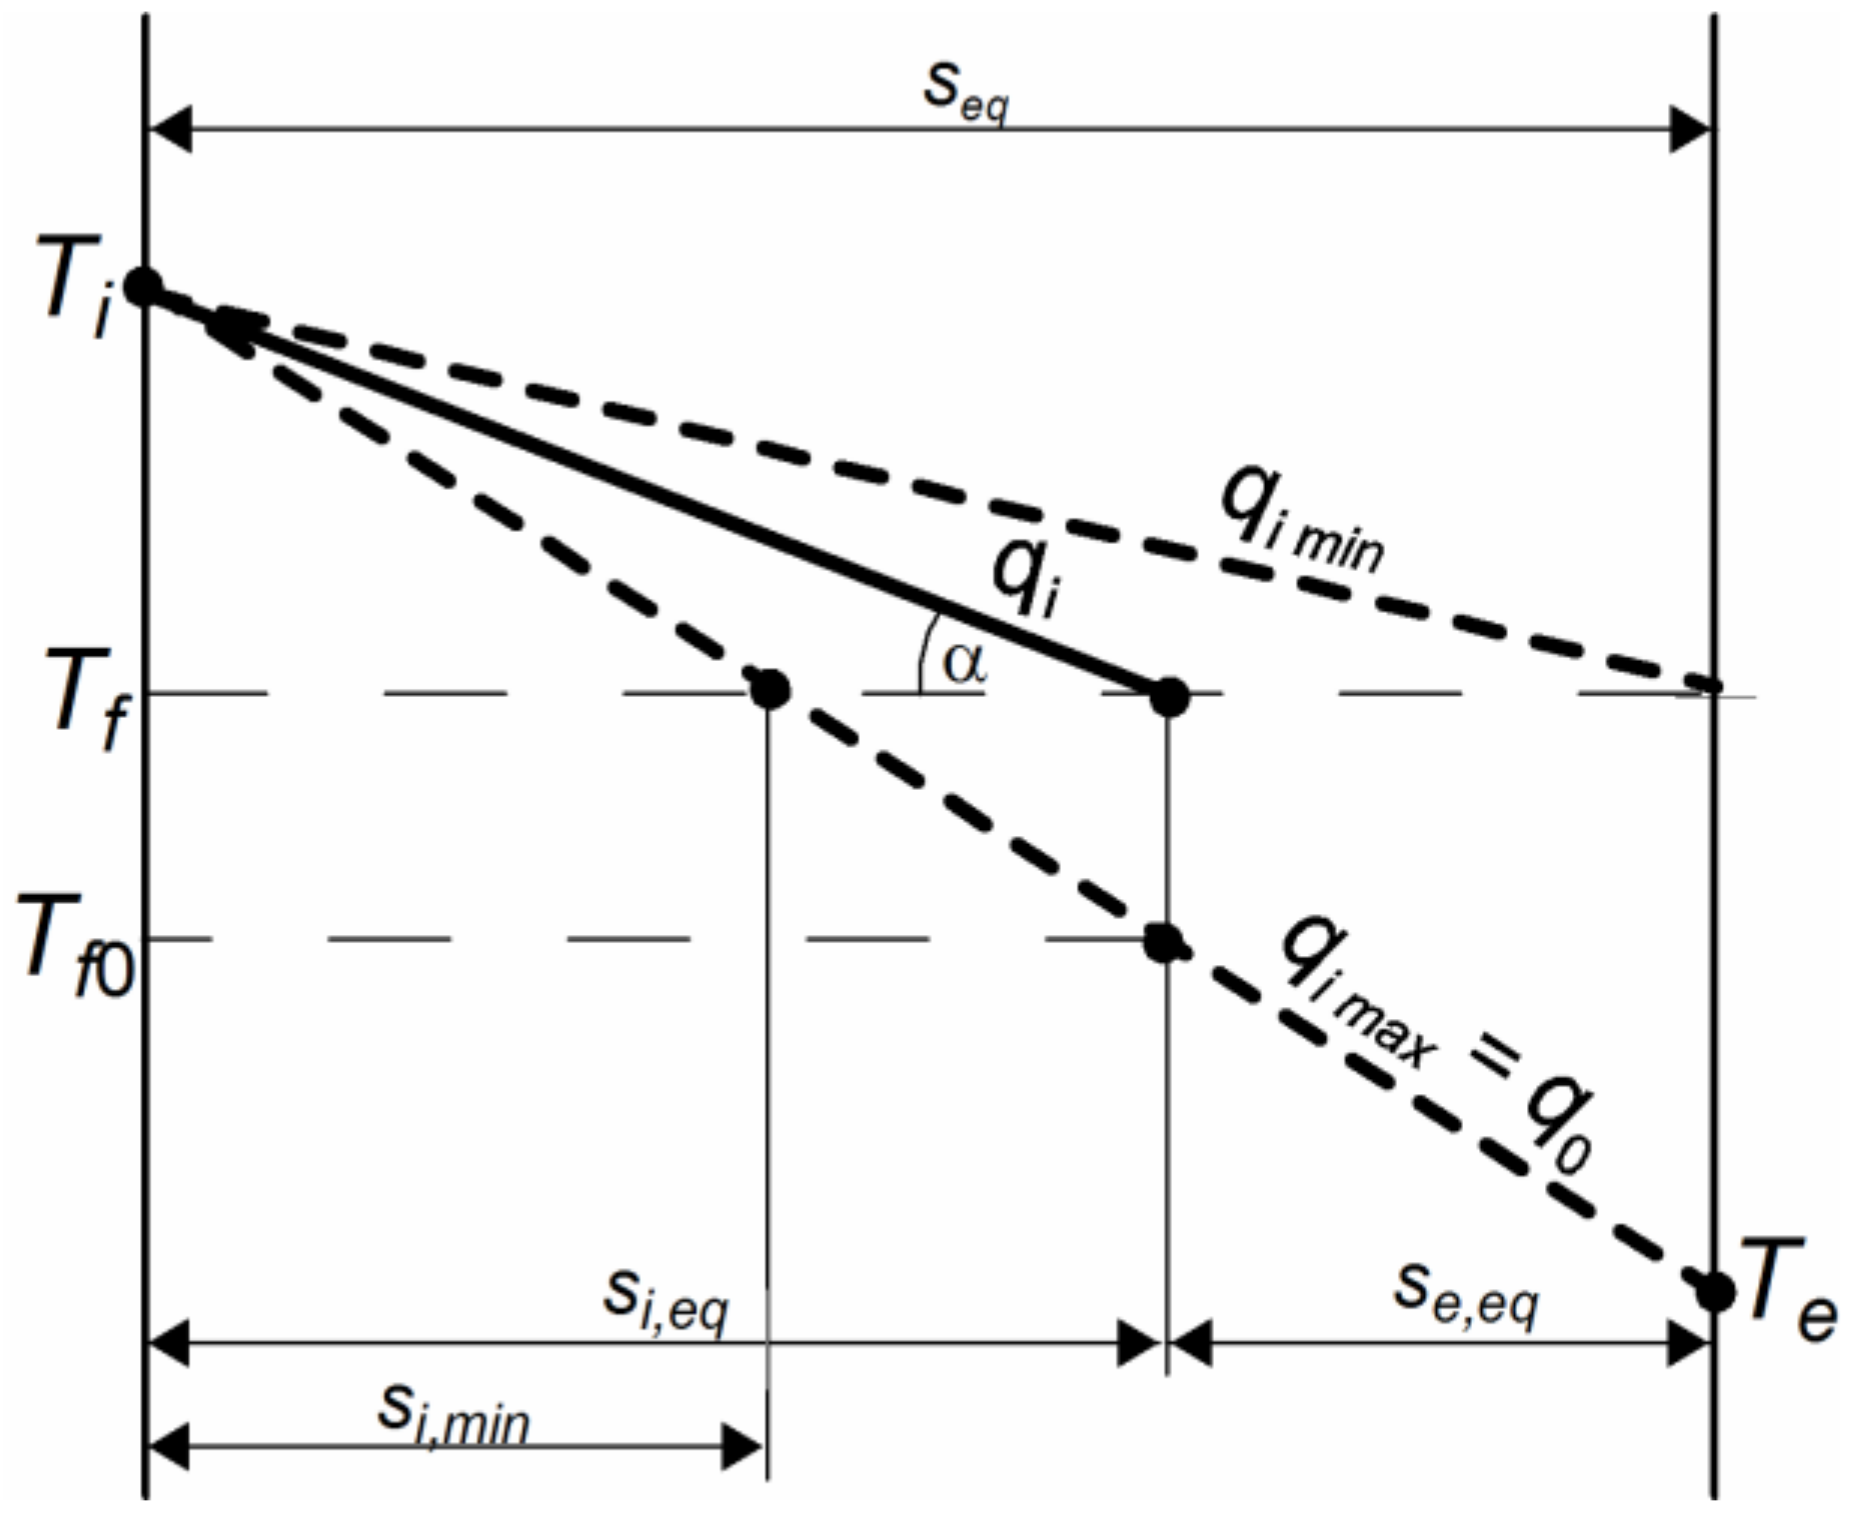
In Figure 2, the limiting positions of the temperature profiles of the envelope with the active insulation layer are shown. The tangent of the angle of the temperature profile tan(α) = −dT/dx, according to the Fourier equation, is
d T d x = q k
i.e., the higher the heat flux, the steeper the profile line is.
For a given value of Tf, the minimum heat flux in the internal part corresponds to placing the ATI layer on the external surface of the envelope (Ri,max = R) and equals
q i , min = T i T f R
The maximum heat flux in the internal part equals the value q0, corresponding to passive insulation. Hence it follows that
T i T e R = T i T f R i , min
Therefore, the minimum value of the internal thermal resistance is
R i , min = Φ R
The ratio of the resistance of the envelope’s internal part to the total resistance is denoted as ρ (dimensionless internal resistance):
ρ = R i / R = s i , e q / s e q
According to the above considerations, the values of the dimensionless internal resistance are in the range of
Φ < ρ < 1
When considering (5) and (6) and the proportionality of the sum of the equivalent layer thicknesses, seq, to the thermal resistances, it follows, from Figure 2, that
T f 0 = ρ T e + 1 ρ T i
For winter conditions, the temperature of the external surface of the envelope is lower than the internal space temperature and close to the ambient temperature, Te. The envelope temperature varies linearly with position and decreases as one moves away from the internal envelope surface. The active insulation can be located at any section of the envelope, represented by the segment CD in Figure 3. The location at point 1 causes the temperature profile in the internal part of the envelope to be segment A1, and the profile in the external part is segment 1B. The angle of inclination of segment A1 differs slightly from the slope angle of segment AC, corresponding to passive insulation. Thus, the heat losses from the internal space are slightly smaller than those for passive insulation. A greater reduction in heat losses will be achieved when the ATI layer is located at point 2, and an even greater reduction will be achieved for point 3 (α1 > α2 > α3). However, the heat fluxes in the external part of the envelope are determined by the corresponding slope angles of the temperature profiles, which must also be considered. When the ATI layer is placed at point 1, the slope angle of segment 1B is slightly greater than the angle of inclination of segment CB, corresponding to passive insulation. The angle for segment 2B is greater than that for 1B, and the angle for segment 3B is more significant than that for 2B (β1 < β2 < β3). The increase in the angle β in the outer part of the envelope corresponds to a higher heat flux loss to the environment. Thus, the closer the ATI layer is located to point D, the less heat is transferred from the internal space to the ATI, but at the same time, more heat is transferred from the ATI layer to the surroundings. In the extreme case where the ATI layer is located at point C, the reduction in heat losses from the internal space is zero. In the other severe case where the ATI layer is located at point D, the heat flux lost to the surroundings is infinite (vertical profile course). Therefore, finding the most favorable position for the ATI layer in the envelope is desirable.

3. Numerical Simulations

Numerical heat transfer simulations through an envelope with an ATI layer were performed. The calculations are intended to verify the simplifying assumptions in the model used to optimize the location of the ATI layer. The calculations used the heat conduction equation for a plane wall [27]:
T t = α 2 T x 2 + 2 T y 2 + 2 T z 2 + q v c v
where α—thermal diffusivity [m2/s].
The quantities qv and qf are related to each other by relation (4).

3.1. Temperature Distribution in the Plate with a Coil

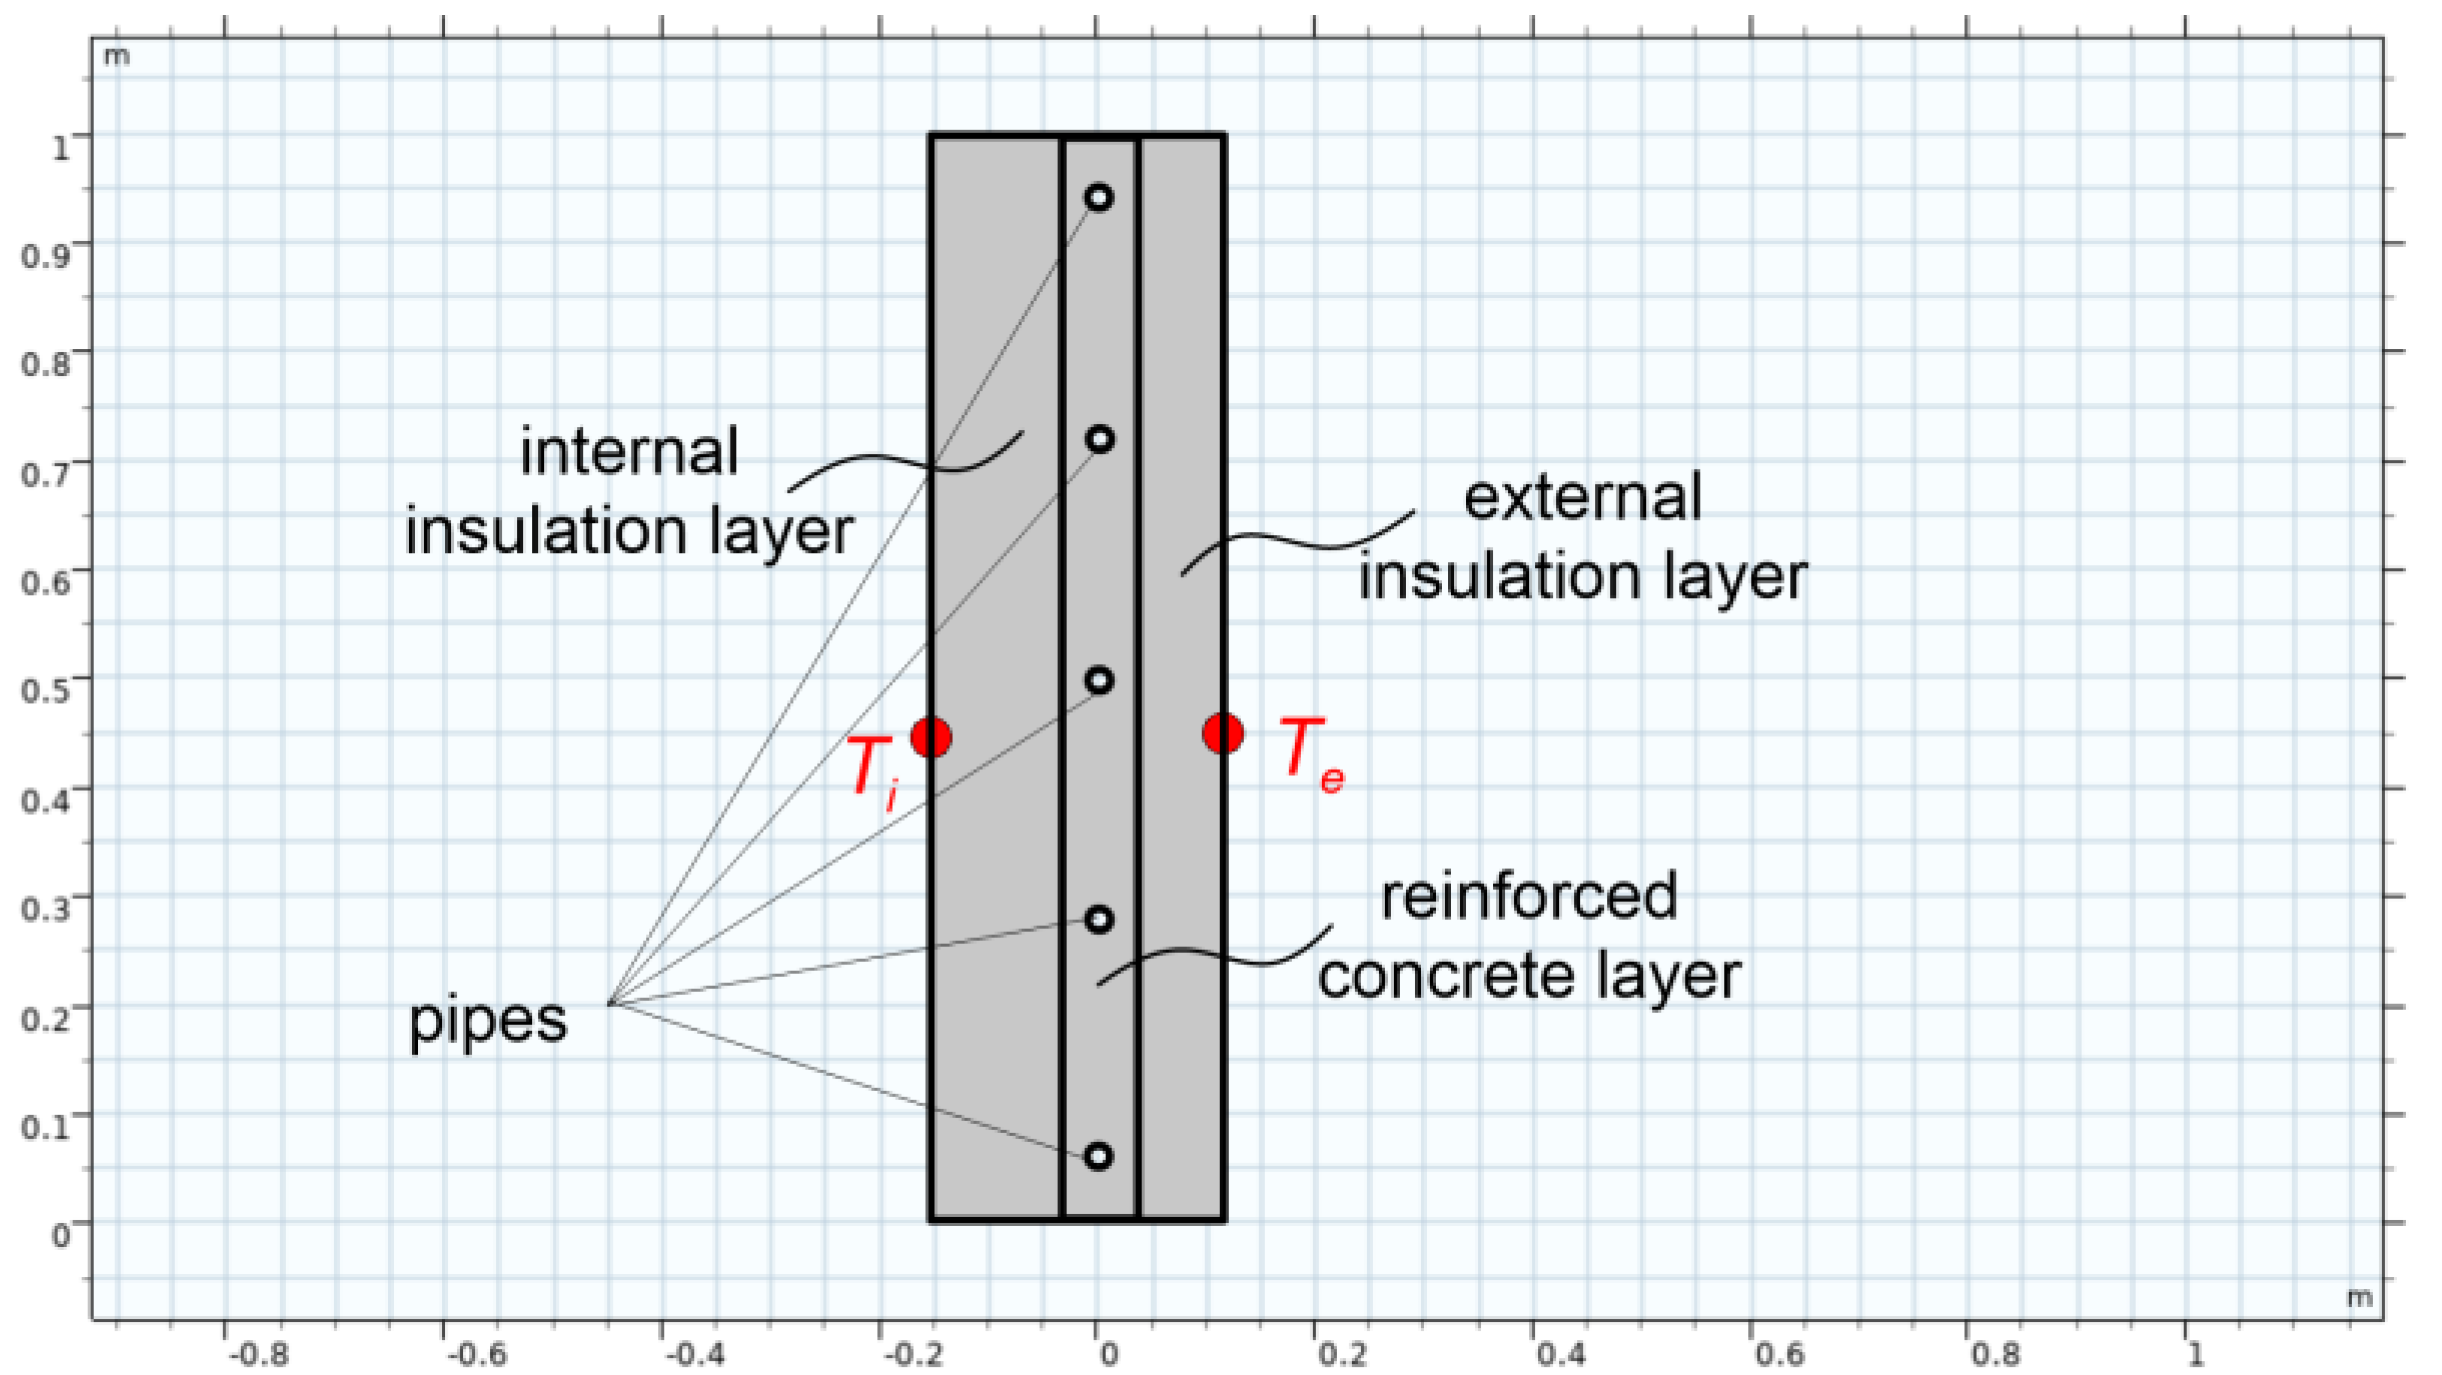
The object of the numerical simulation is a system consisting of a layer of reinforced concrete (2L = 0.07 m thick) with embedded 20 mm diameter pipes at 0.20 m apart. The wall thickness of the pipes is 2 mm, and the thermal conductivity coefficient is 0.35 W/(mK). On both sides of the reinforced concrete layer, there are layers of insulation: internal and external (Figure 4). The heat is transferred from the internal insulation layer, the temperature for which the internal space side is equal to Ti = 21 °C, to the external insulation layer, for which the temperature on the ambient side is equal to Te = 10 °C (the boundary conditions). The calculations have been made for the steady-state conditions with an average temperature of water in pipes TL = 17 °C. As the initial condition, a temperature of 17 °C was assumed. The thermal conductivity coefficients are respective for both insulation layers, kins = 0.04 W/(mK), and for the reinforced concrete layer, kf = 1.6 W/(mK). The thicknesses of the insulation layers are si = 0.12 m on the internal part and se = 0.08 m on the external part. The simulations were carried out for different values of the heat transfer coefficient between the working liquid and the external surface of the pipes hp.
The simulation was performed using the ANSYS Fluent application. As the numeric algorithm, the realizable k-ε model was used. In order to minimize the numerical errors and to expedite the computation, the size of the finite elements was chosen to be extra fine for the area close to the pipes in the ATI layer and fine for the area far from it. The mesh is limited to 16,376 elements to reduce the computational time. A total of 8634 elements are reserved for the ATI layer (52.7%). In order to check the mesh independence of the solutions, the same problem in the steady-state case was solved for a mesh that was increased to more than 35,000 elements, and it was found that there was a negligible change in the numerical solution. The results of the mesh independence study are presented in Table 1. Five mesh types, from coarse to dense, were generated to ensure that the simulation results were sufficiently grid independent. As shown in Table 1, when the number of mesh elements was higher than 16,376, the temperature near the pipes became stable and remained nearly unchanged. Thus, mesh no. 3 was used for further simulations.
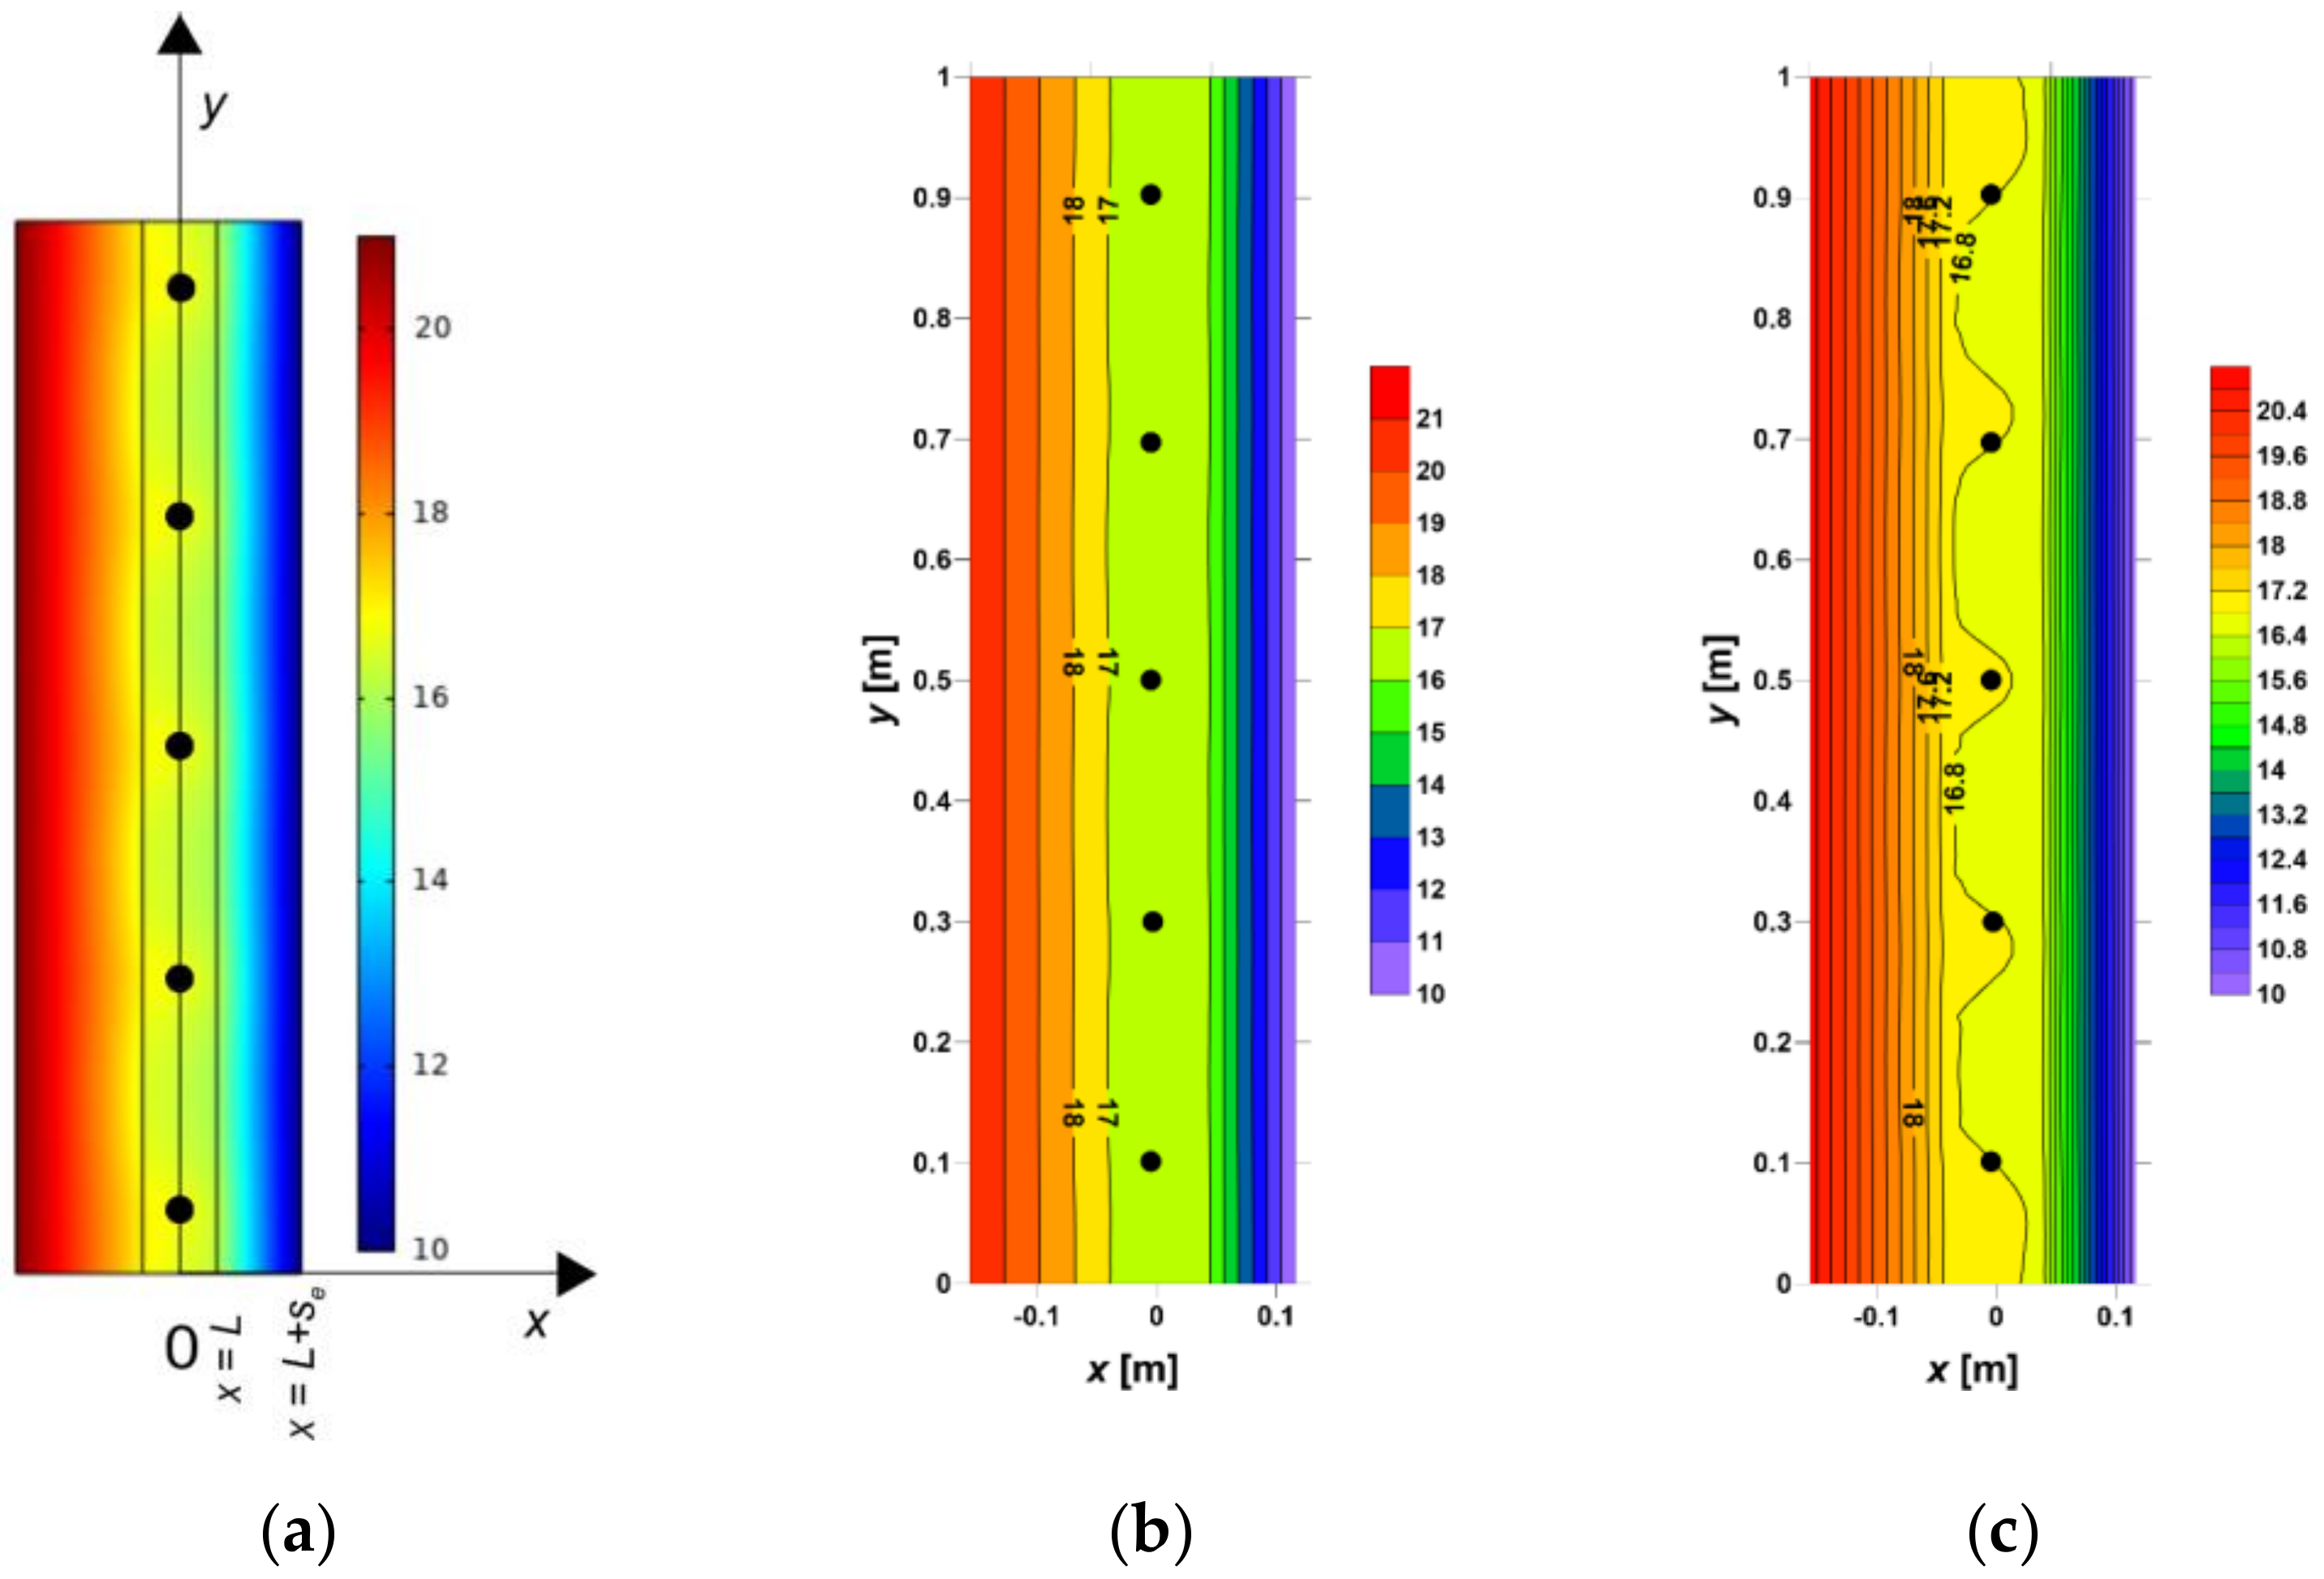
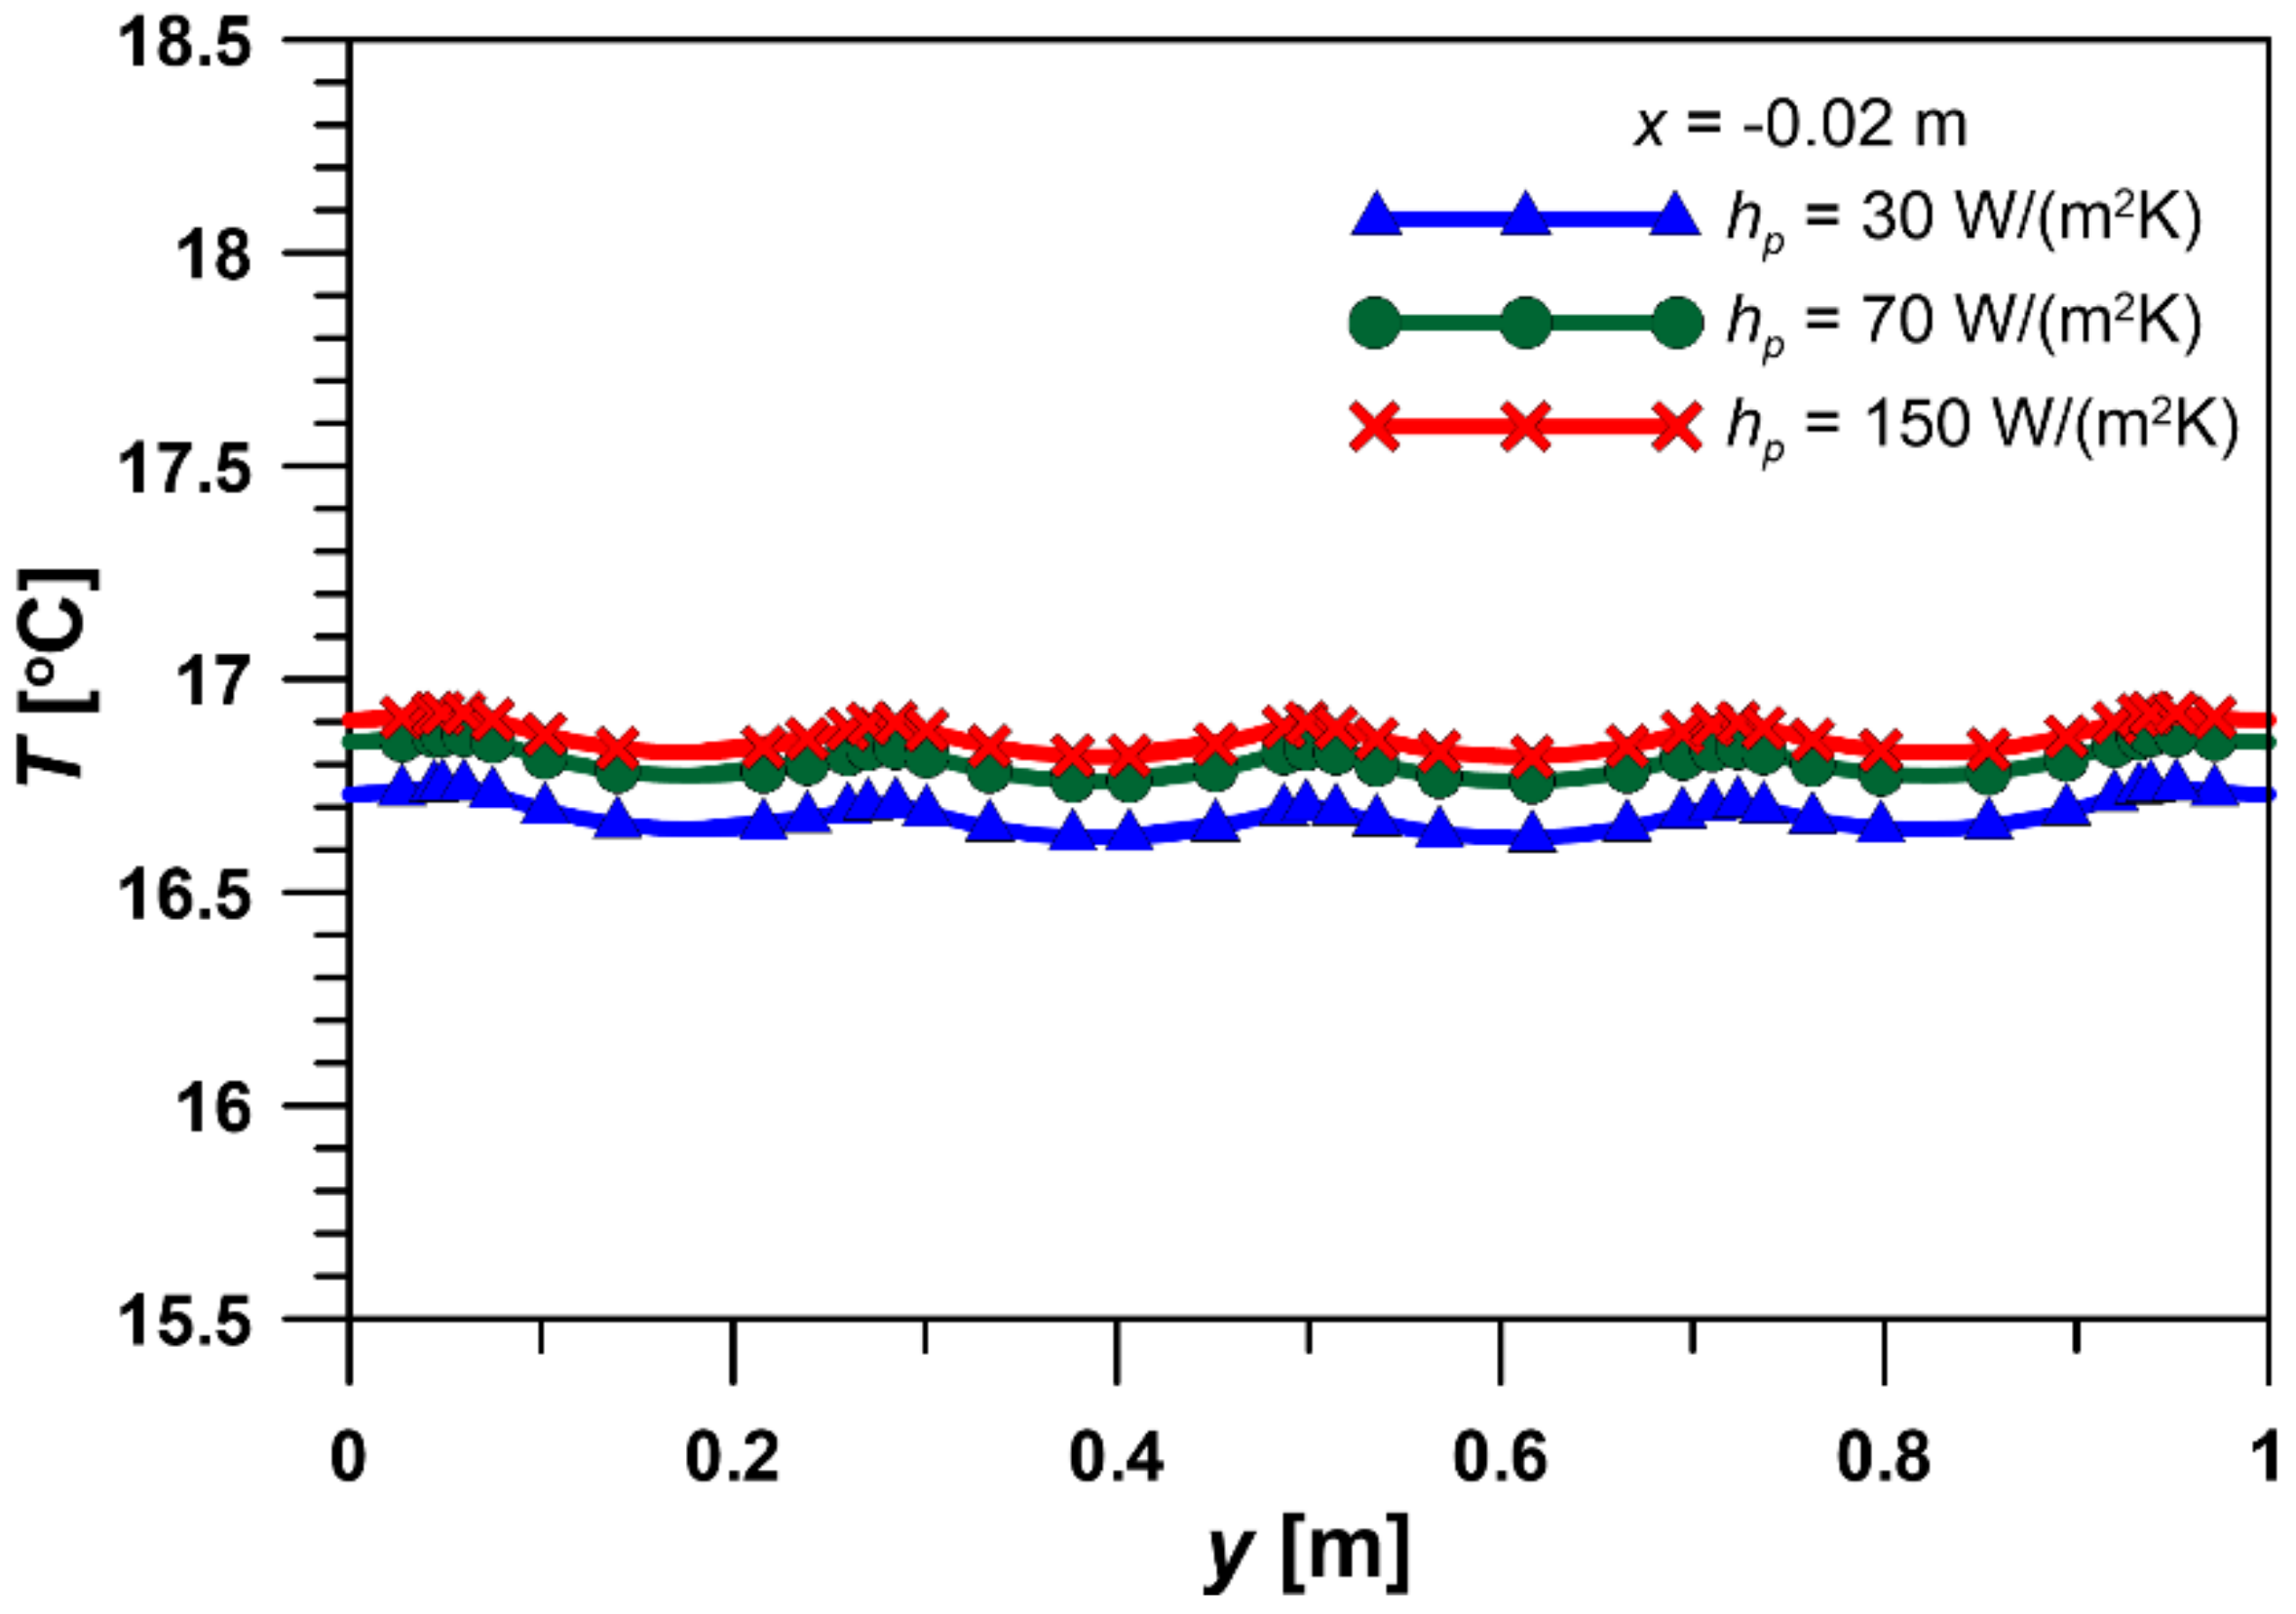
The simulation results are presented in Figure 5, Figure 6 and Figure 7. Figure 5a–c show the temperature maps of the considered system. The results are presented for a heat transfer coefficient of hp = 70 W/(m2K). Temperature drops along the x-axis occur almost exclusively in the insulation layers, while temperature inhomogeneities in the reinforced concrete layer are slight. The curvature of the isolines around the pipes can only be seen in Figure 5c, where they are dense every 0.4 K. Therefore, it can be concluded that the temperature in the reinforced concrete layer is equalized. This was confirmed in the plot in the T-y co-ordinate system (Figure 6) for different values of hp.
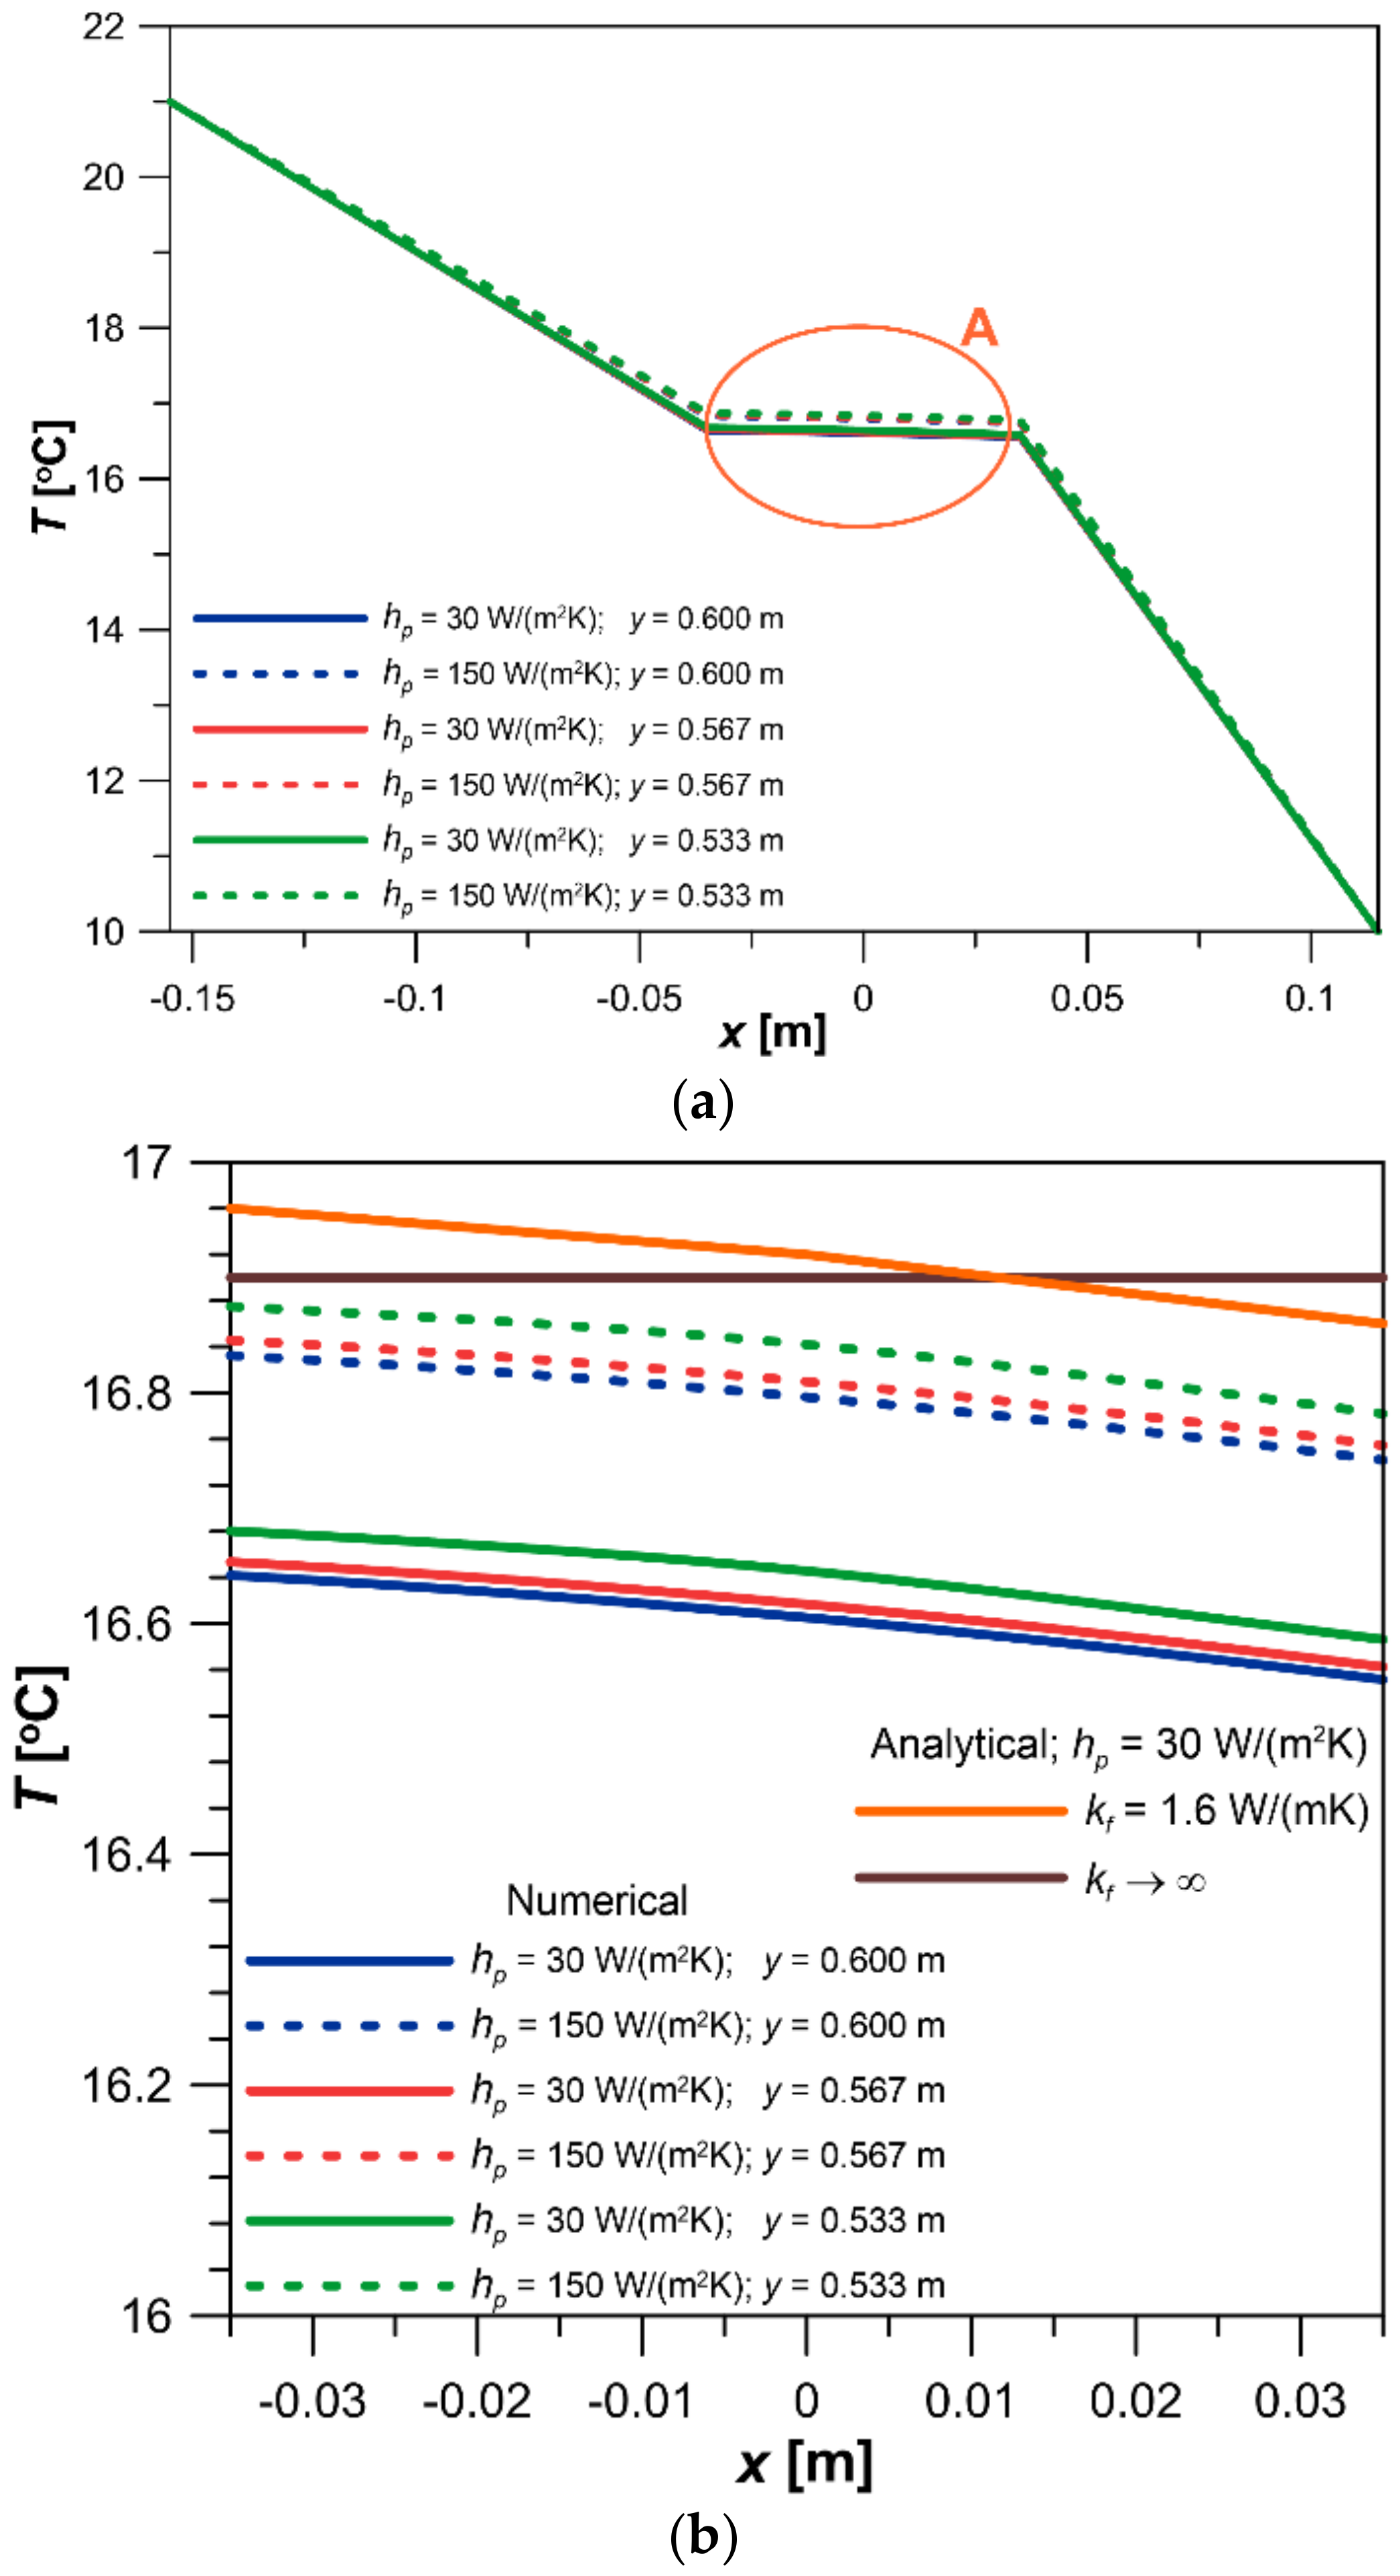
The temperature distribution in the T-x co-ordinate system for different values of hp and the different values of y is shown in Figure 7. In all cases, the temperature profiles in the insulation layers are linear. In contrast, the profile is almost flat in the reinforced concrete layer. The profiles for the different values of the y-co-ordinate are virtually identical. The value of the heat transfer coefficient slightly influences the temperature; for extreme values of hp = 30 W/(m2K) and hp = 150 W/(m2K), the temperatures differ by only 0.2 K.
The enlarged section A of Figure 7a concerning the heated (middle) layer is shown in Figure 7b. Additionally, the results of the calculations based on the analytical solution of the heat conduction equation with a source term (presented in Appendix A) are plotted on the graph. The analytical solution is related to the one-dimensional case with an internal homogeneous heat source at a steady state.
Temperature profiles become flatter with the increasing thermal conductivity of the middle layer. For kf→∞, the temperature is entirely equalized.

3.2. Comparison of Temperature Distribution in the Insulation Layer under Steady and Transient Conditions

A similar layer arrangement (to Section 3.1) was considered, except that the temperature of the middle layer was homogeneous, and the surface of the external insulation layer exposed to the environment had the temperature periodically changing with time. A one-day time interval during the winter was considered, so the temperature variation was only for the diurnal cycle. The time variation for ambient air temperature is described by the relationship
T e = T e m A e cos 2 π t c t
where Tem and Ae—daily averaged air temperature and the amplitude of its changes, tc = 24 h.
Heat conduction through the external insulation layer is of a one-dimensional transient nature. Therefore, 2 T / y 2 = 0 2 T / z 2 = 0 , qv = 0. At the interface between the middle layer and the external insulation, the boundary condition has the form (Figure 5a):
x = L ; T = T f
where
T f = T i R i + β T L R f + T e R e 1 R i + β R f + 1 R e
where β—the ratio of the area of the tubes to the area of the cross-section of the ATI layer, TL—liquid temperature [°C], and Ri, Re, and Rf—heat resistance of the internal layer, external layer, and ATI layer [(m2K)/W], respectively.
The derivation of relationship (21) is provided in Appendix A.
For the external insulation surface on the ambient side, the boundary condition is as follows (Figure 5a):
x = L + s e ; T x = h e k T T e
Equation (18), with conditions (20) and (22), was solved numerically using the finite difference method. The calculations were carried out for the following values: se = 0.08 m, he = 24 W/(m2K), TL = 12 °C, Tem = −5 °C, Ae = 6 K, and Rf = 0.020 m2K/W.
Calculations were performed for the insulation layer with the following thermal properties: kins = 0.04 W/(mK) and cv = 0.045 × 10⁶ J/(m3K). In Figure 8, the temperature profiles in the slab over 6 h intervals are shown. The results relate to the first 24 h of the process duration (the system reaches a cyclic steady state very quickly). The profiles are almost rectilinear for the steady-state process. A slight nonlinearity in the profiles can only be observed by comparing the profiles for durations of 6 and 18 h, for which the ambient temperature is the same (−5 °C). Moreover, it should be emphasized that the difference in the temperatures of the external envelope surface and the ambient condition is minor (indicated in Figure 8 by symbols on the line x = 0.115 m). There is also a slight difference between TL and Tf, which justifies the condition (20). In Figure 8, this is indicated by the symbol on the line x = 0.035 m.
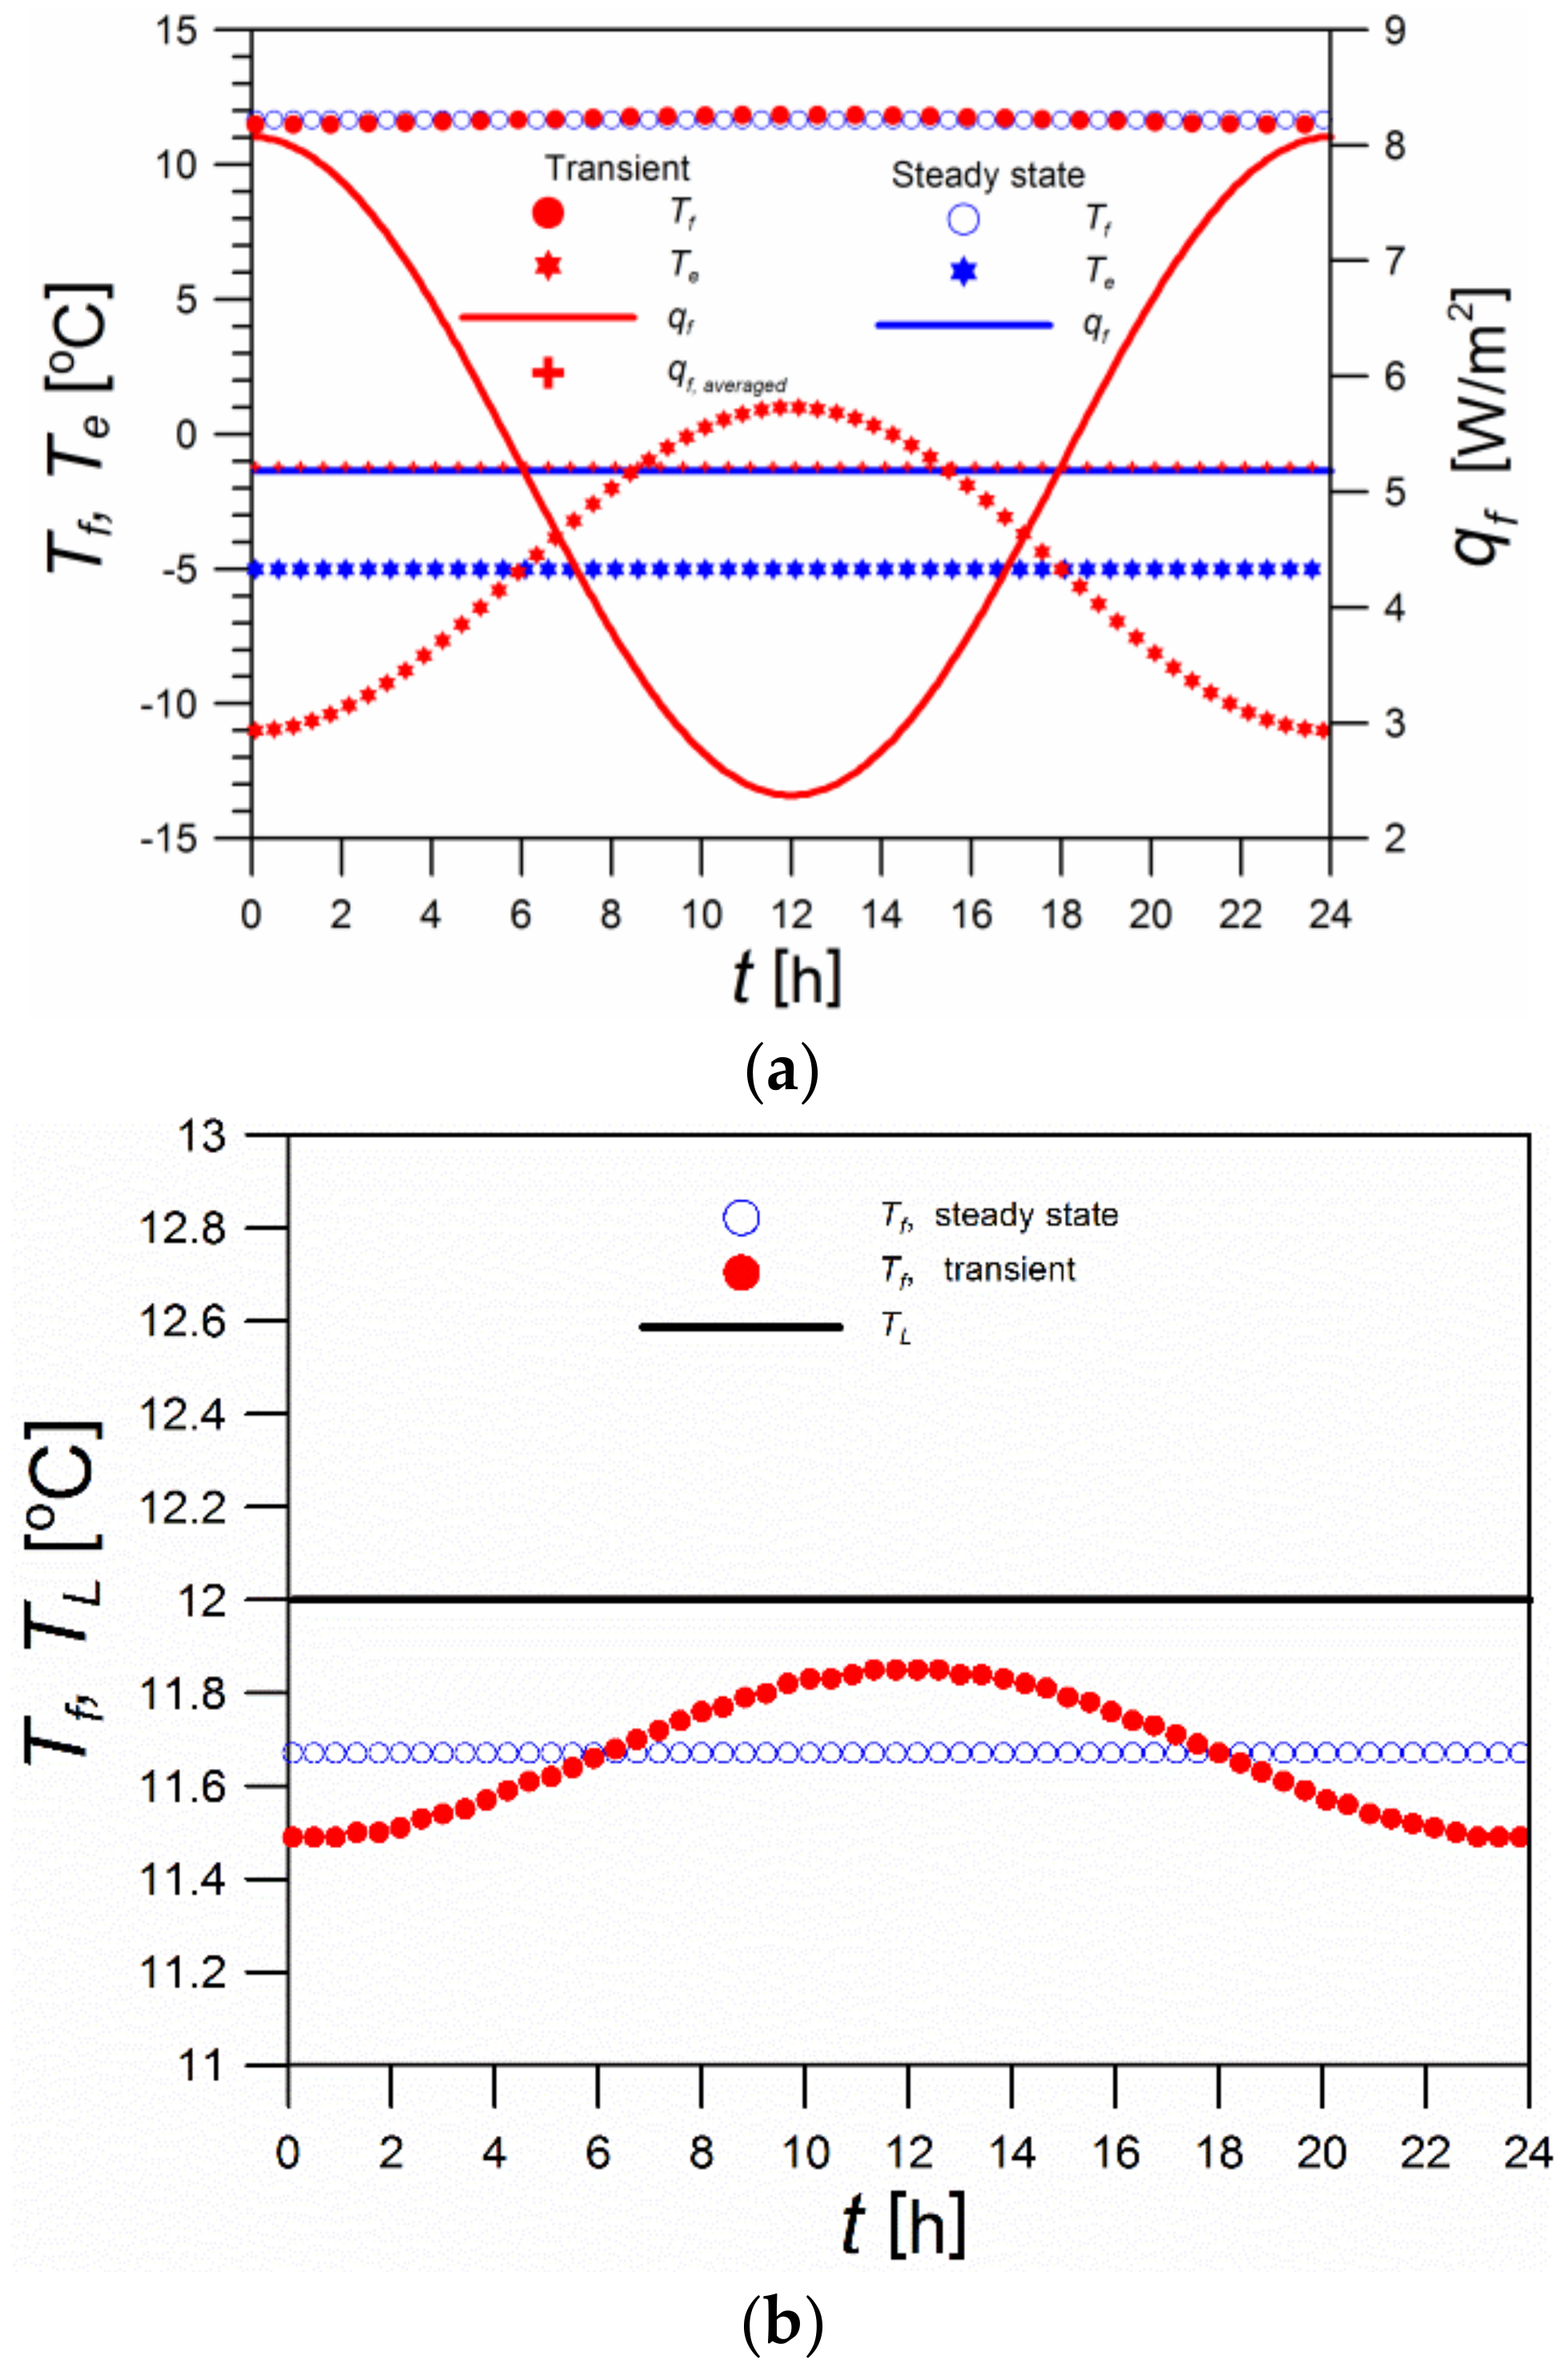
In Figure 9a, the effect of the ambient temperature, Te, on the temperature of the ATI layer, Tf, and the heat flux supplied in this layer, qf, is depicted. The process under both steady and transient conditions was considered. In the first case, the temperature Te is assumed to be invariable throughout the day, Te = Tem. In this case, the temperature Tf and the heat flux qf are also invariant and equal to Tf = 11.67 °C and qf = 5.18 W/m2.
If the temporal variation in Te (according to relation (19)) is considered, temporal variations in the temperature Tf are observed, but they are minor. They can be seen only after enlarging the diagram (Figure 9b). Diurnal changes in temperature Te from −11 °C to 1 °C cause temperature Tf to vary from 11.49 °C to 11.85 °C. On the other hand, changes in Te strongly affect the heat flux qf transferred in the ATI layer from the working liquid. The heat flux varies during the day from 2.4 to 8.1 W/m2, with an average value of 5.22 W/m2. The small difference between the temperatures of the working liquid and the ATI layer, as shown in Figure 9b, affects the significant diurnal variation in the heat flux qf. Thus, the diurnal variation of ambient temperature does not significantly affect the temperature of the ATI layer, and the average heat flux qf,averaged is close to the value of qf, corresponding to the time-unchanged temperature of Te.
The simulation calculations showed that its temperature is approximately equalized under typical conditions in the ATI layer. Moreover, it was proven that, under conditions of varying temperature Te, the temperature profiles are almost identical to those for the steady-state process.

4. Optimal Location of the Active Insulation Layer

Space heating is associated with costs that depend on the unit price of energy. There are two energy streams when using an active insulation layer: the stream supplied to the interior space and the stream supplied to the active insulation layer. The unit prices of these streams are different; since the stream to the active layer is supplied directly from the ground without any transformation, its unit price, PW, is lower than the unit price of the heat stream supplied to the internal space, PR.
The price ratio is denoted by the pricing parameter κ:
κ = P R P W
For the given temperatures Ti, Te, and Tf, the total thermal resistance of envelope R, and the pricing parameter κ, the optimum location of the ATI layer can be determined. The problem consists in finding the thermal resistance of the internal part of the envelope Ri, and, more precisely, the fraction of this resistance in the total resistance ρ (Equation (15)).
The ratio of the heating costs of the interior space with active insulation CATI to the costs of the heating space with passive insulation C0 was used, with all other conditions remaining unchanged. Thus,
η = C A T I C 0
Taking into account formulae (3), (8)–(11), (15), (23), and (24), the relationship η = F (ρ, κ, Φ) is obtained as a relationship between the dimensionless quantities:
η = 1 κ κ 1 Φ ρ + 1 Φ 1 ρ
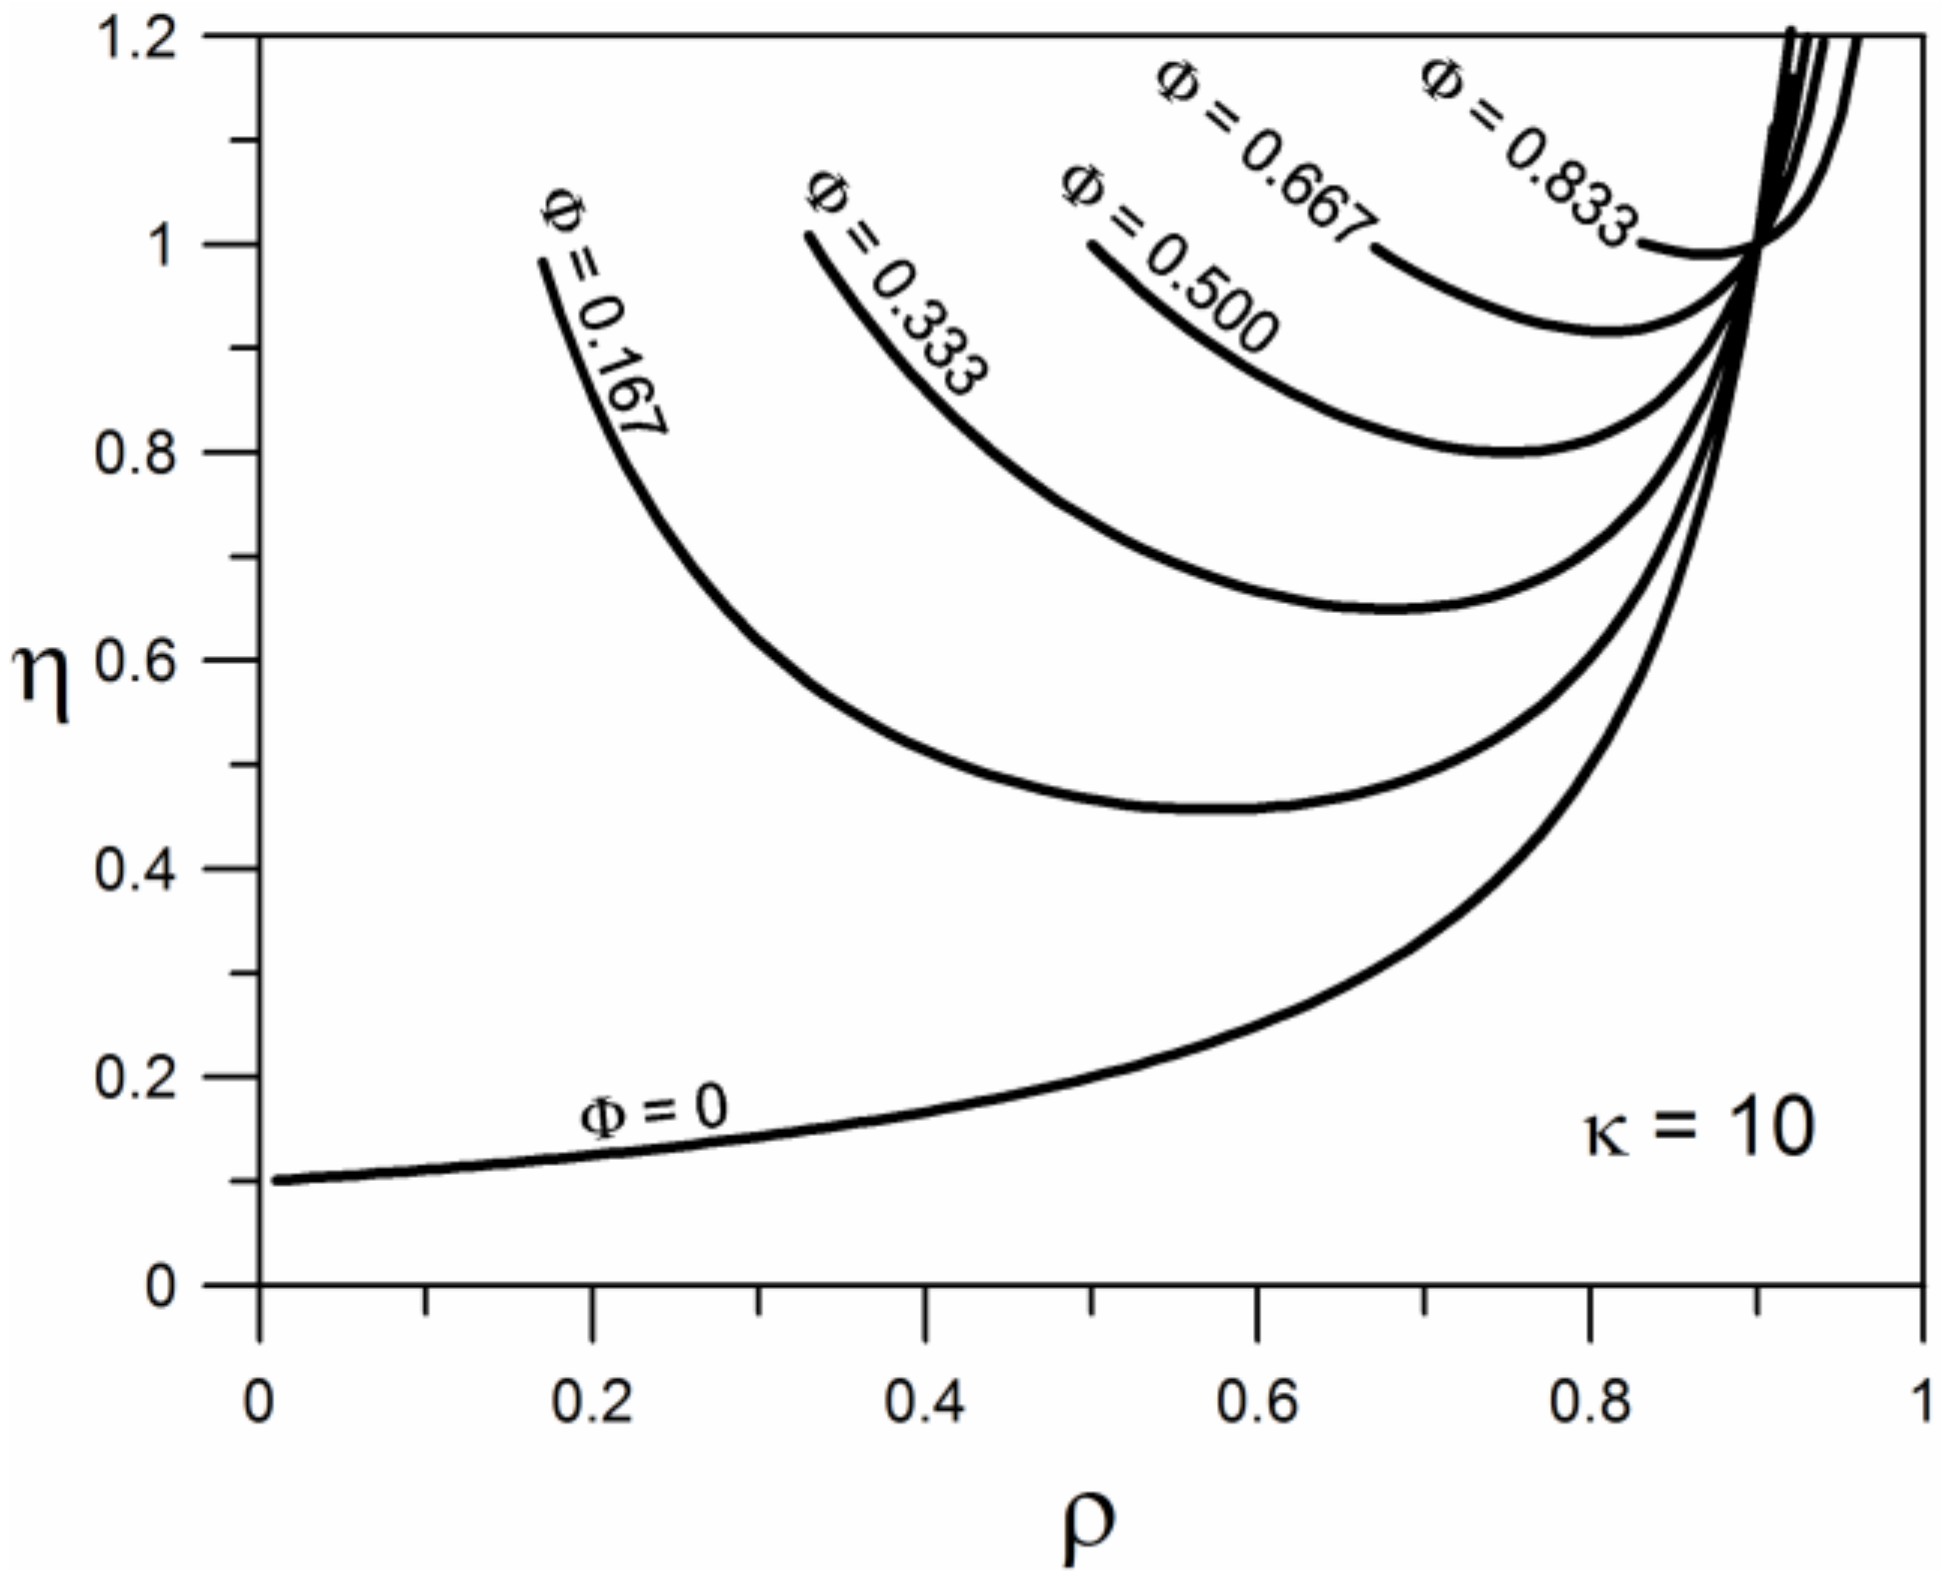
In Figure 10, the courses of the function η = F1(ρ, κ) are shown for a constant value of the dimensionless temperature Φ. In contrast, in Figure 11, the courses of the function η = F2 (ρ, Φ) are depicted for a constant value of the pricing parameter κ.
The value of ρopt, for which η is minimal at fixed values of κ and Φ, was determined analytically. A necessary condition for the existence of an extremum of a function is the zeroing of the first derivative. The first derivative of the function η = f(ρ) is
d η d ρ = 1 κ κ 1 Φ ρ 2 + 1 Φ 1 ρ 2
whereas the second derivative,
d 2 η d ρ 2 = 2 κ κ 1 Φ ρ 3 + 1 Φ 1 ρ 3
is always positive since κ > 1; 0 < Φ < 1 and Φ < ρ < 1. By setting the first derivative to zero, the result is
κ 1 Φ ρ 2 = 1 Φ 1 ρ 2
from which it follows that the optimal position of the ATI layer corresponds to the following value of dimensionless resistance ρ:
ρ o p t = κ 1 Φ 1 Φ 1 + κ 1 Φ 1 Φ
By substituting ρopt into relationship (25), one obtains the value η, corresponding to the extremum of the function:
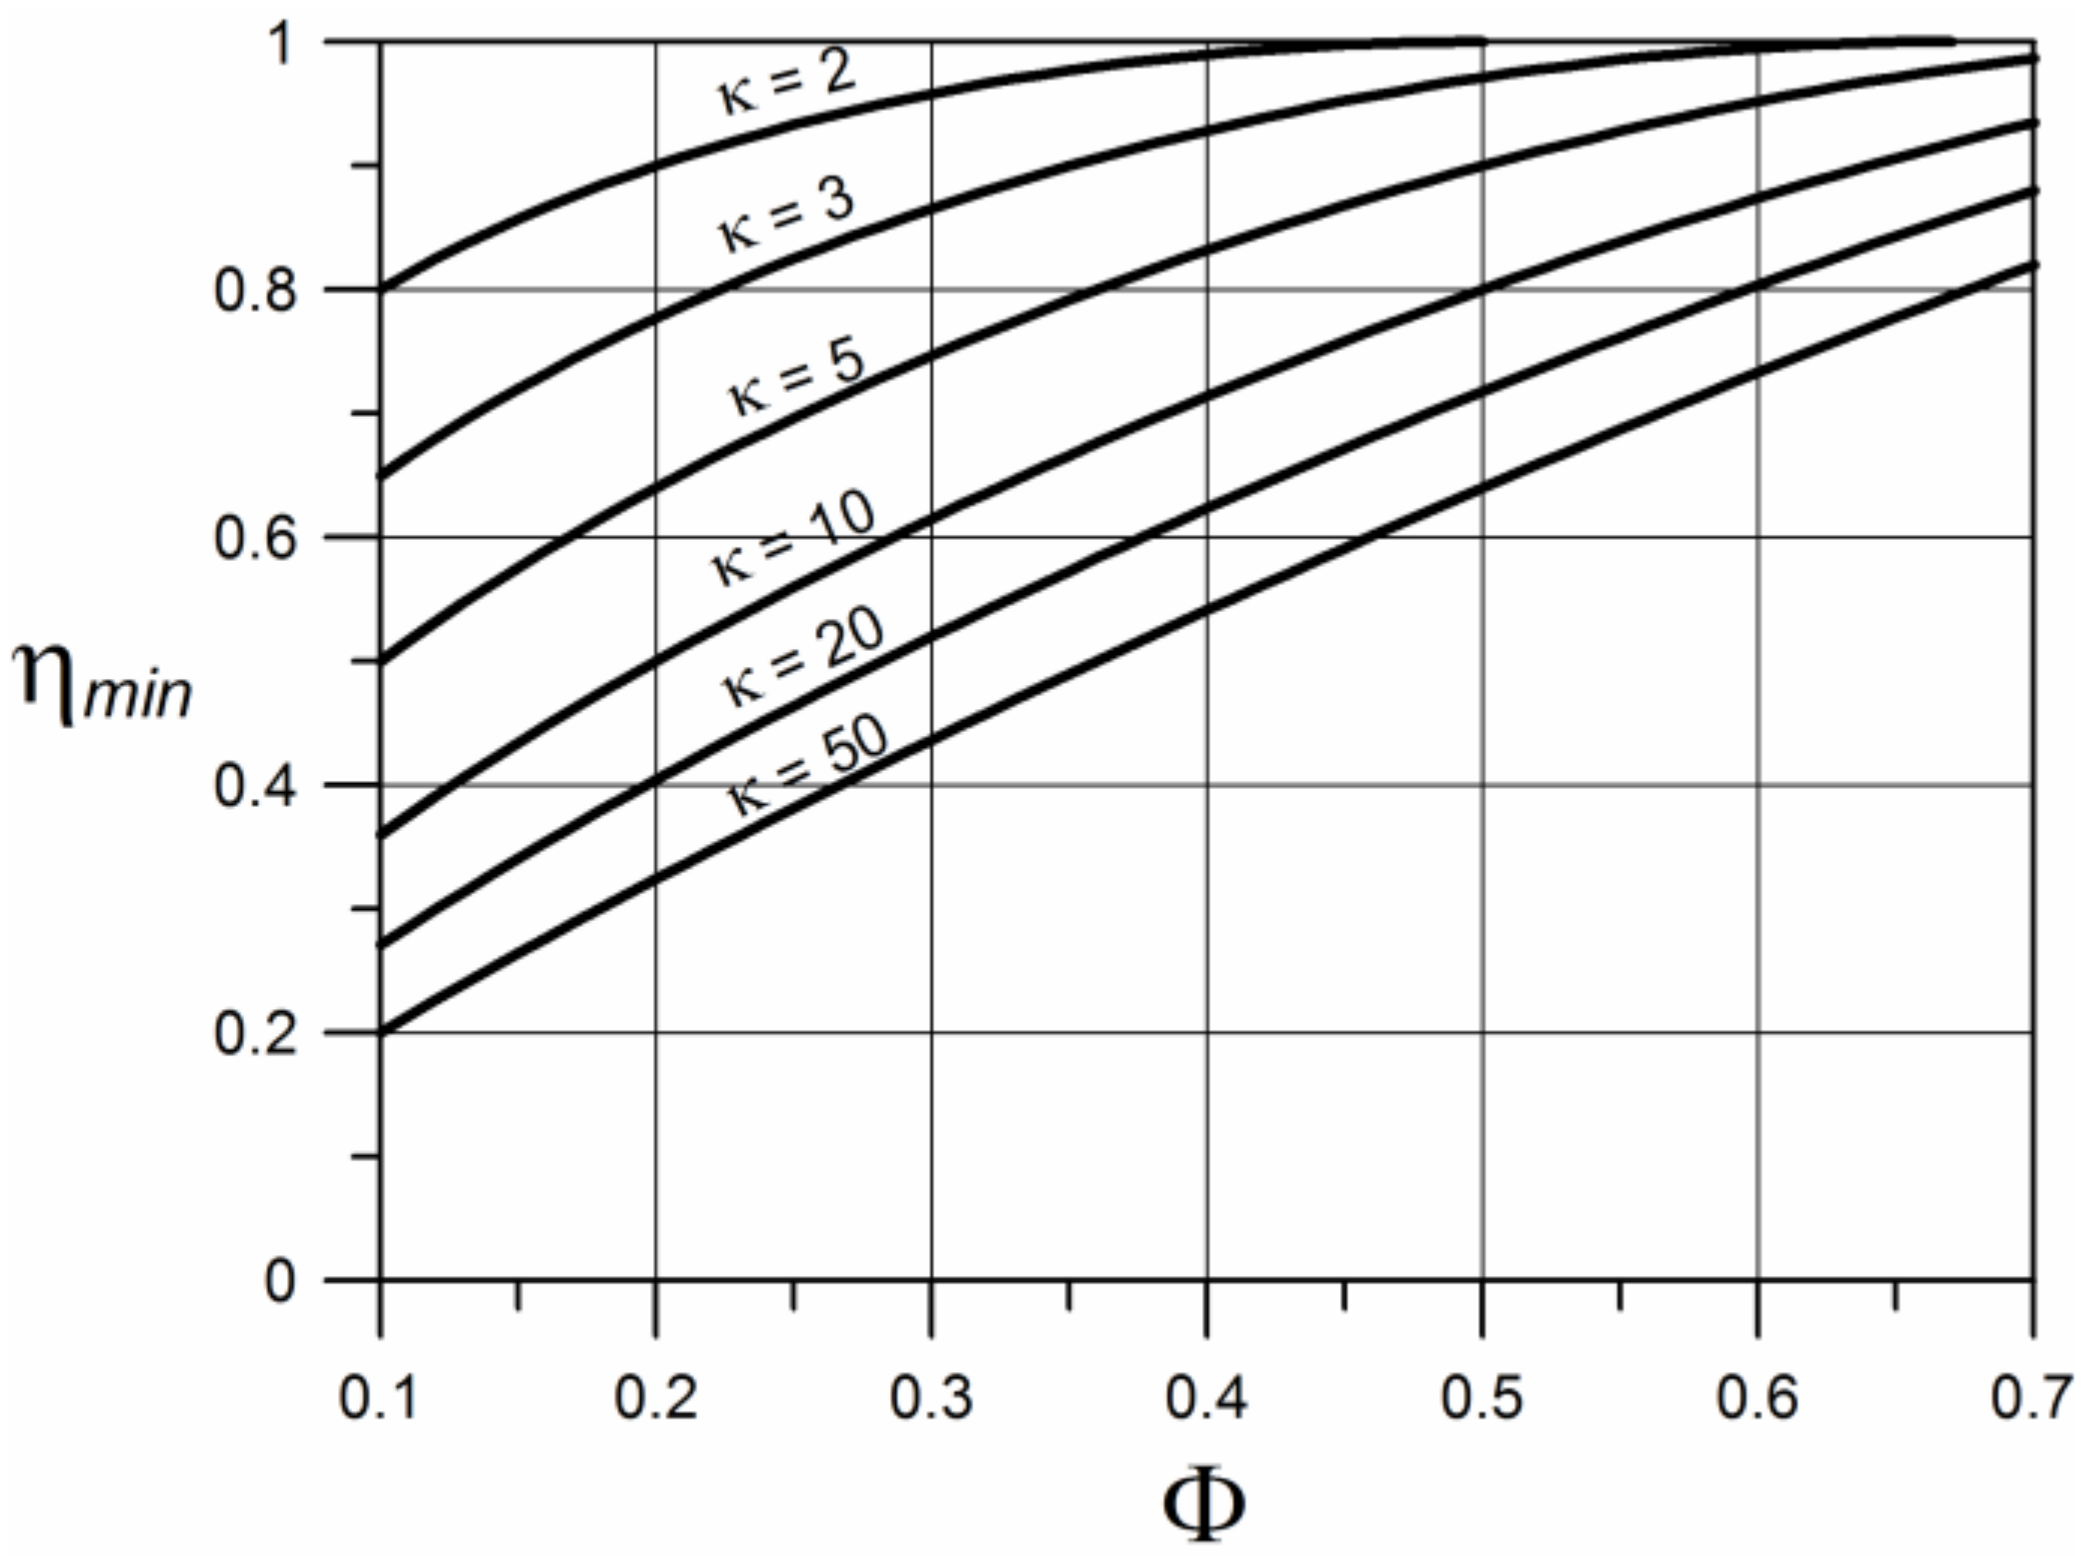
η min = κ 1 κ Φ ρ o p t 2
This is the minimum value of η since the second derivative of the function η = f (ρ) is positive. The problem of determining the optimum ATI layer location is, therefore, reduced to the estimation of ρopt for specific values of Φ and κ. The economic effect of replacing passive insulation with an ATI layer is represented by ηmin, which can be determined from formula (30).
The following graphs (Figure 12 and Figure 13) may be used for approximate calculations.
It can be seen from Figure 12 and Figure 13 that the smaller the Φ (larger Tf and/or smaller Te), the lower the total heating costs and the closer to the inside surface of the envelope the ATI layer should be installed. The influence of the parameter κ is evident as well. The greater the κ (smaller unit cost of heat energy supplied to the ATI layer), the smaller the total heating costs are, and the closer to the environment the ATI layer should be installed.

5. Comparison with Experimental Results

Experimental results were taken from a publication [15]. The research was conducted in a building located in Nyiregyhaza, Hungary. The building contains a variety of energy-efficient solutions, such as mechanical ventilation with heat recovery, a water–water heat pump, solar collectors, a fireplace with a water jacket, thermally insulated concrete energy storage under the building with a volume of 35 m3, a horizontal ground exchanger under the building and around the building, and active insulation of the external walls and roof in the form of a coil connected to the ground exchanger located 1.75 m below ground level. The layer of active insulation in the form of pipes embedded in the envelope is located in the layer of reinforced concrete between the two layers of thermal insulation. The pipes with an internal diameter of 20 mm are made of polyethylene. The spacing between the pipes is 0.2 m. The circulation of the working liquid in the system is provided by a 21 W pump. A detailed description of the system can be found in [15].
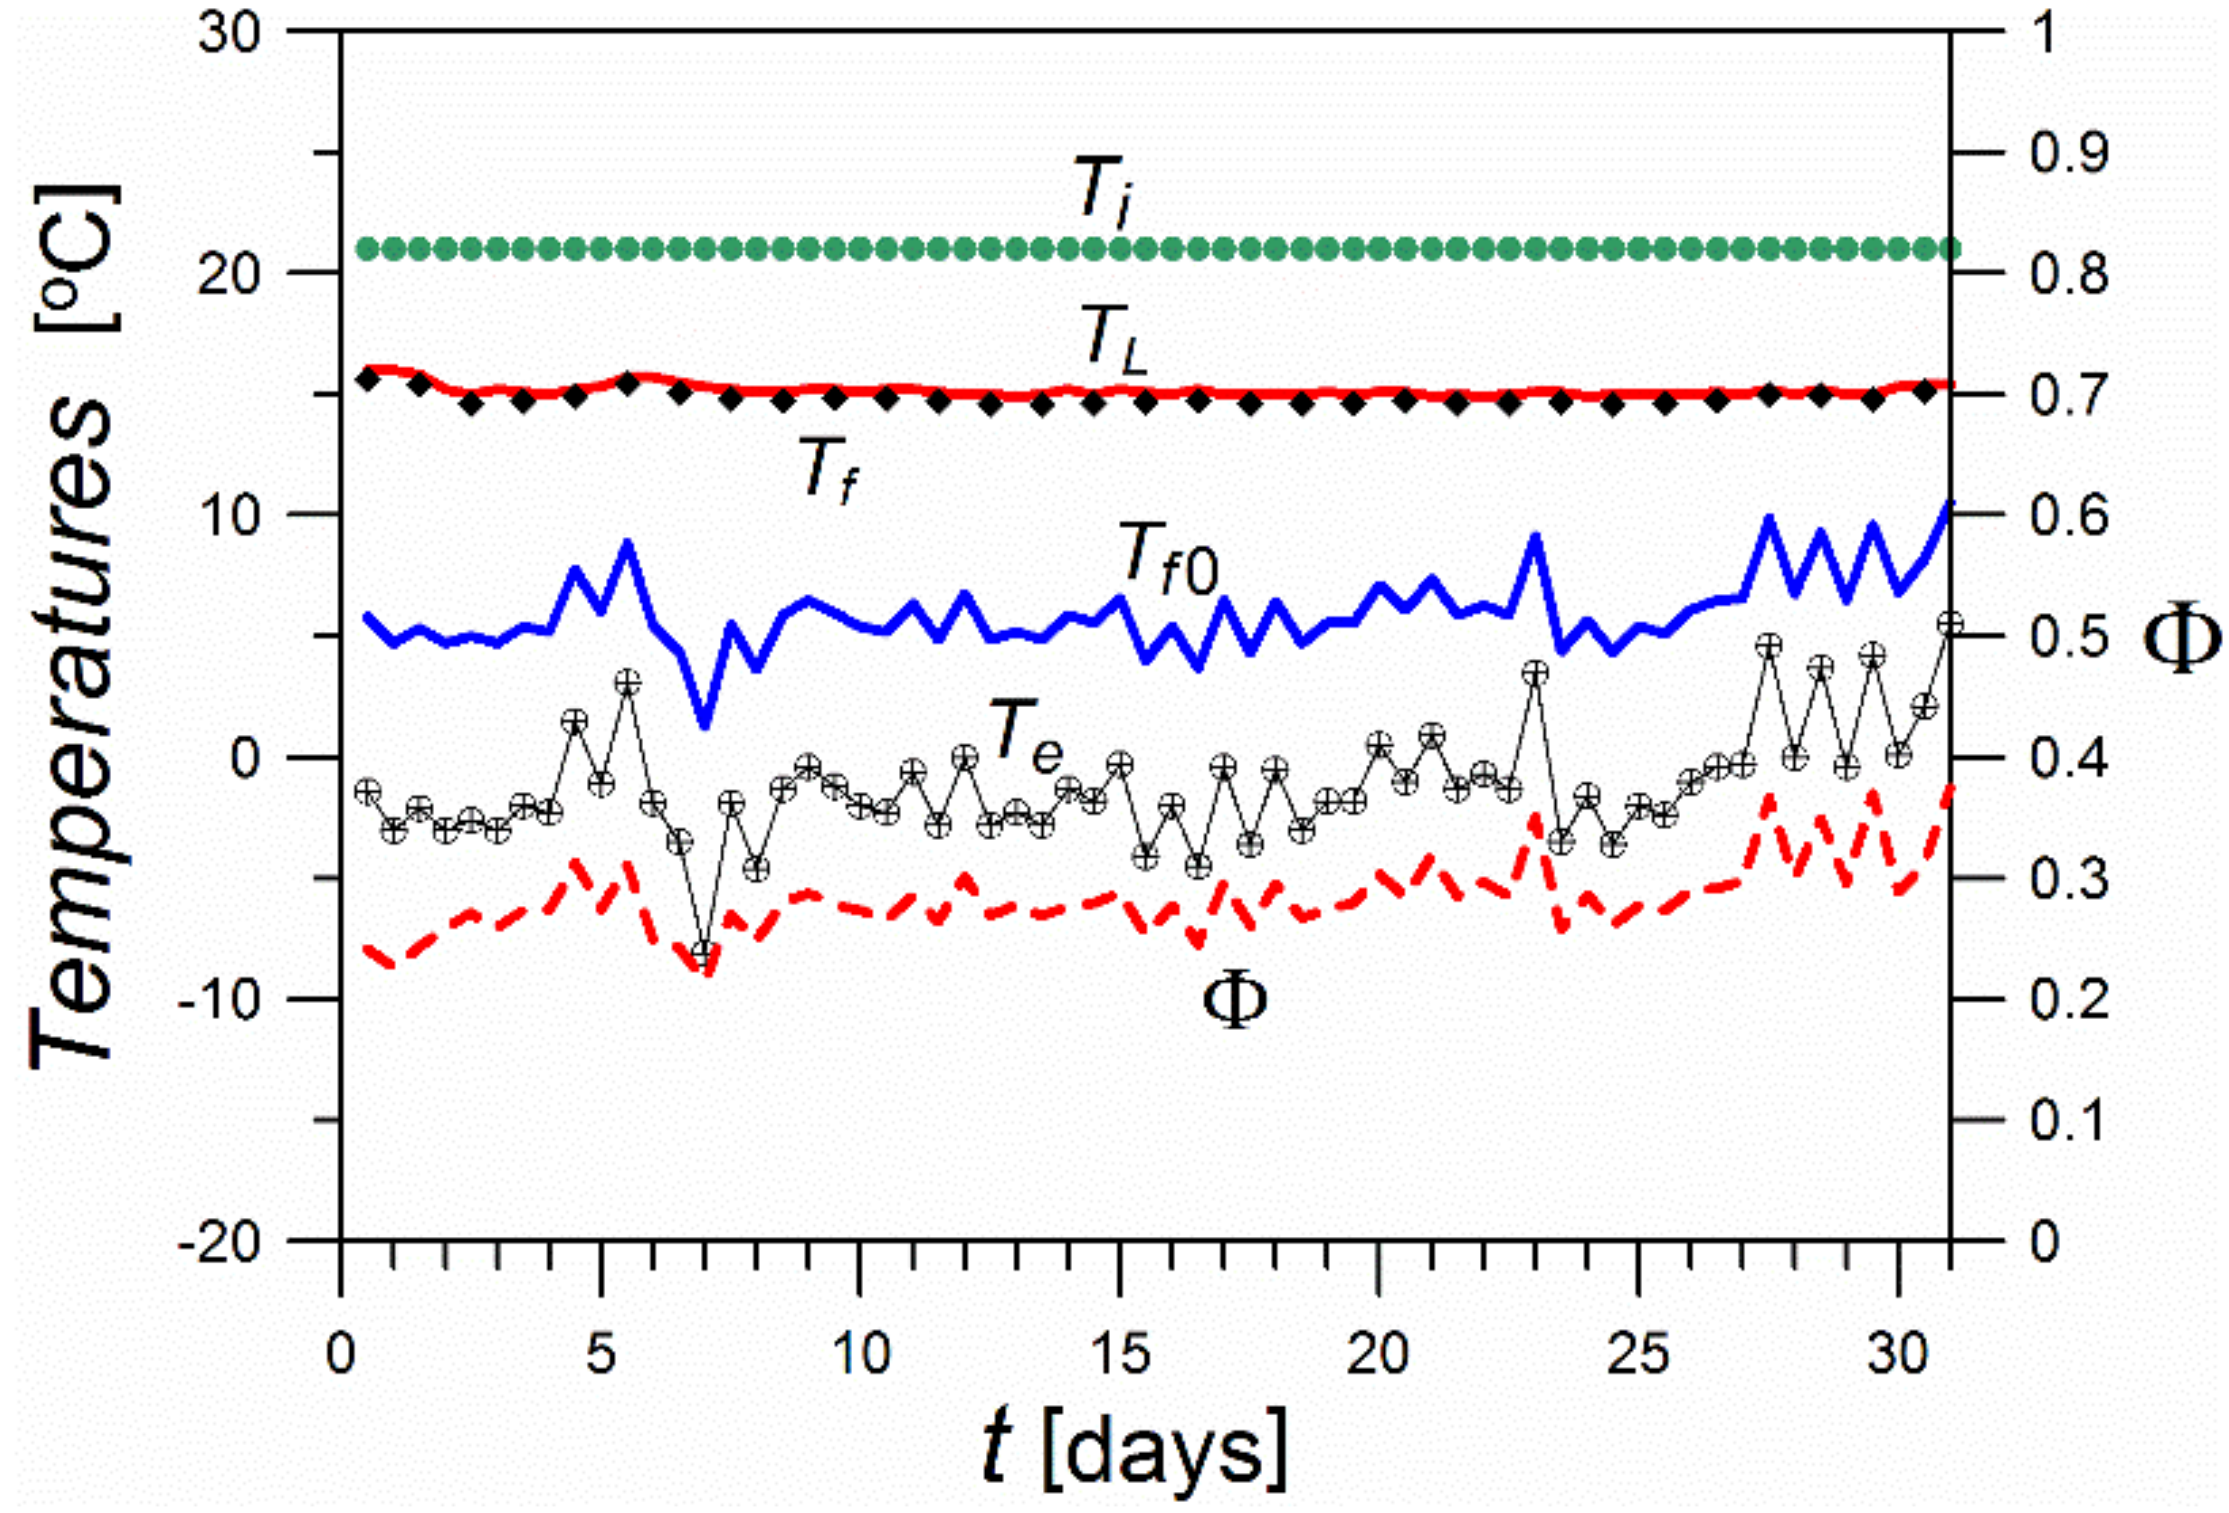
The heating system with active insulation was equipped with measuring devices and was adjusted for the continuous recording of the results. The internal space temperature, Ti, the outdoor air temperature, Te, and the temperature of the circulating liquid flowing through the active insulation pipes, TL (mean value of the inlet and outlet temperatures), were measured. The measurements were performed using digital temperature sensors (DS18B20) with a one-wire interface. The measuring range was from −55 °C to 125 °C. The measuring accuracy was ±0.5 °C [15]. The results are presented in Figure 14. Apart from the measurement values, the diagram includes the calculated courses of the dimensionless temperature Φ, and temperature, Tf0, determined from relations (3) and (16), respectively.
The value of ρ = Ri/R was determined based on adding up the thermal resistance of individual envelope layers. The dimensions and materials of the individual envelope layers are presented in [15]. The following values are obtained: Ri = 3.57 m2K/W, and R = 5.26 m2K/W; thus, ρ = 0.678.
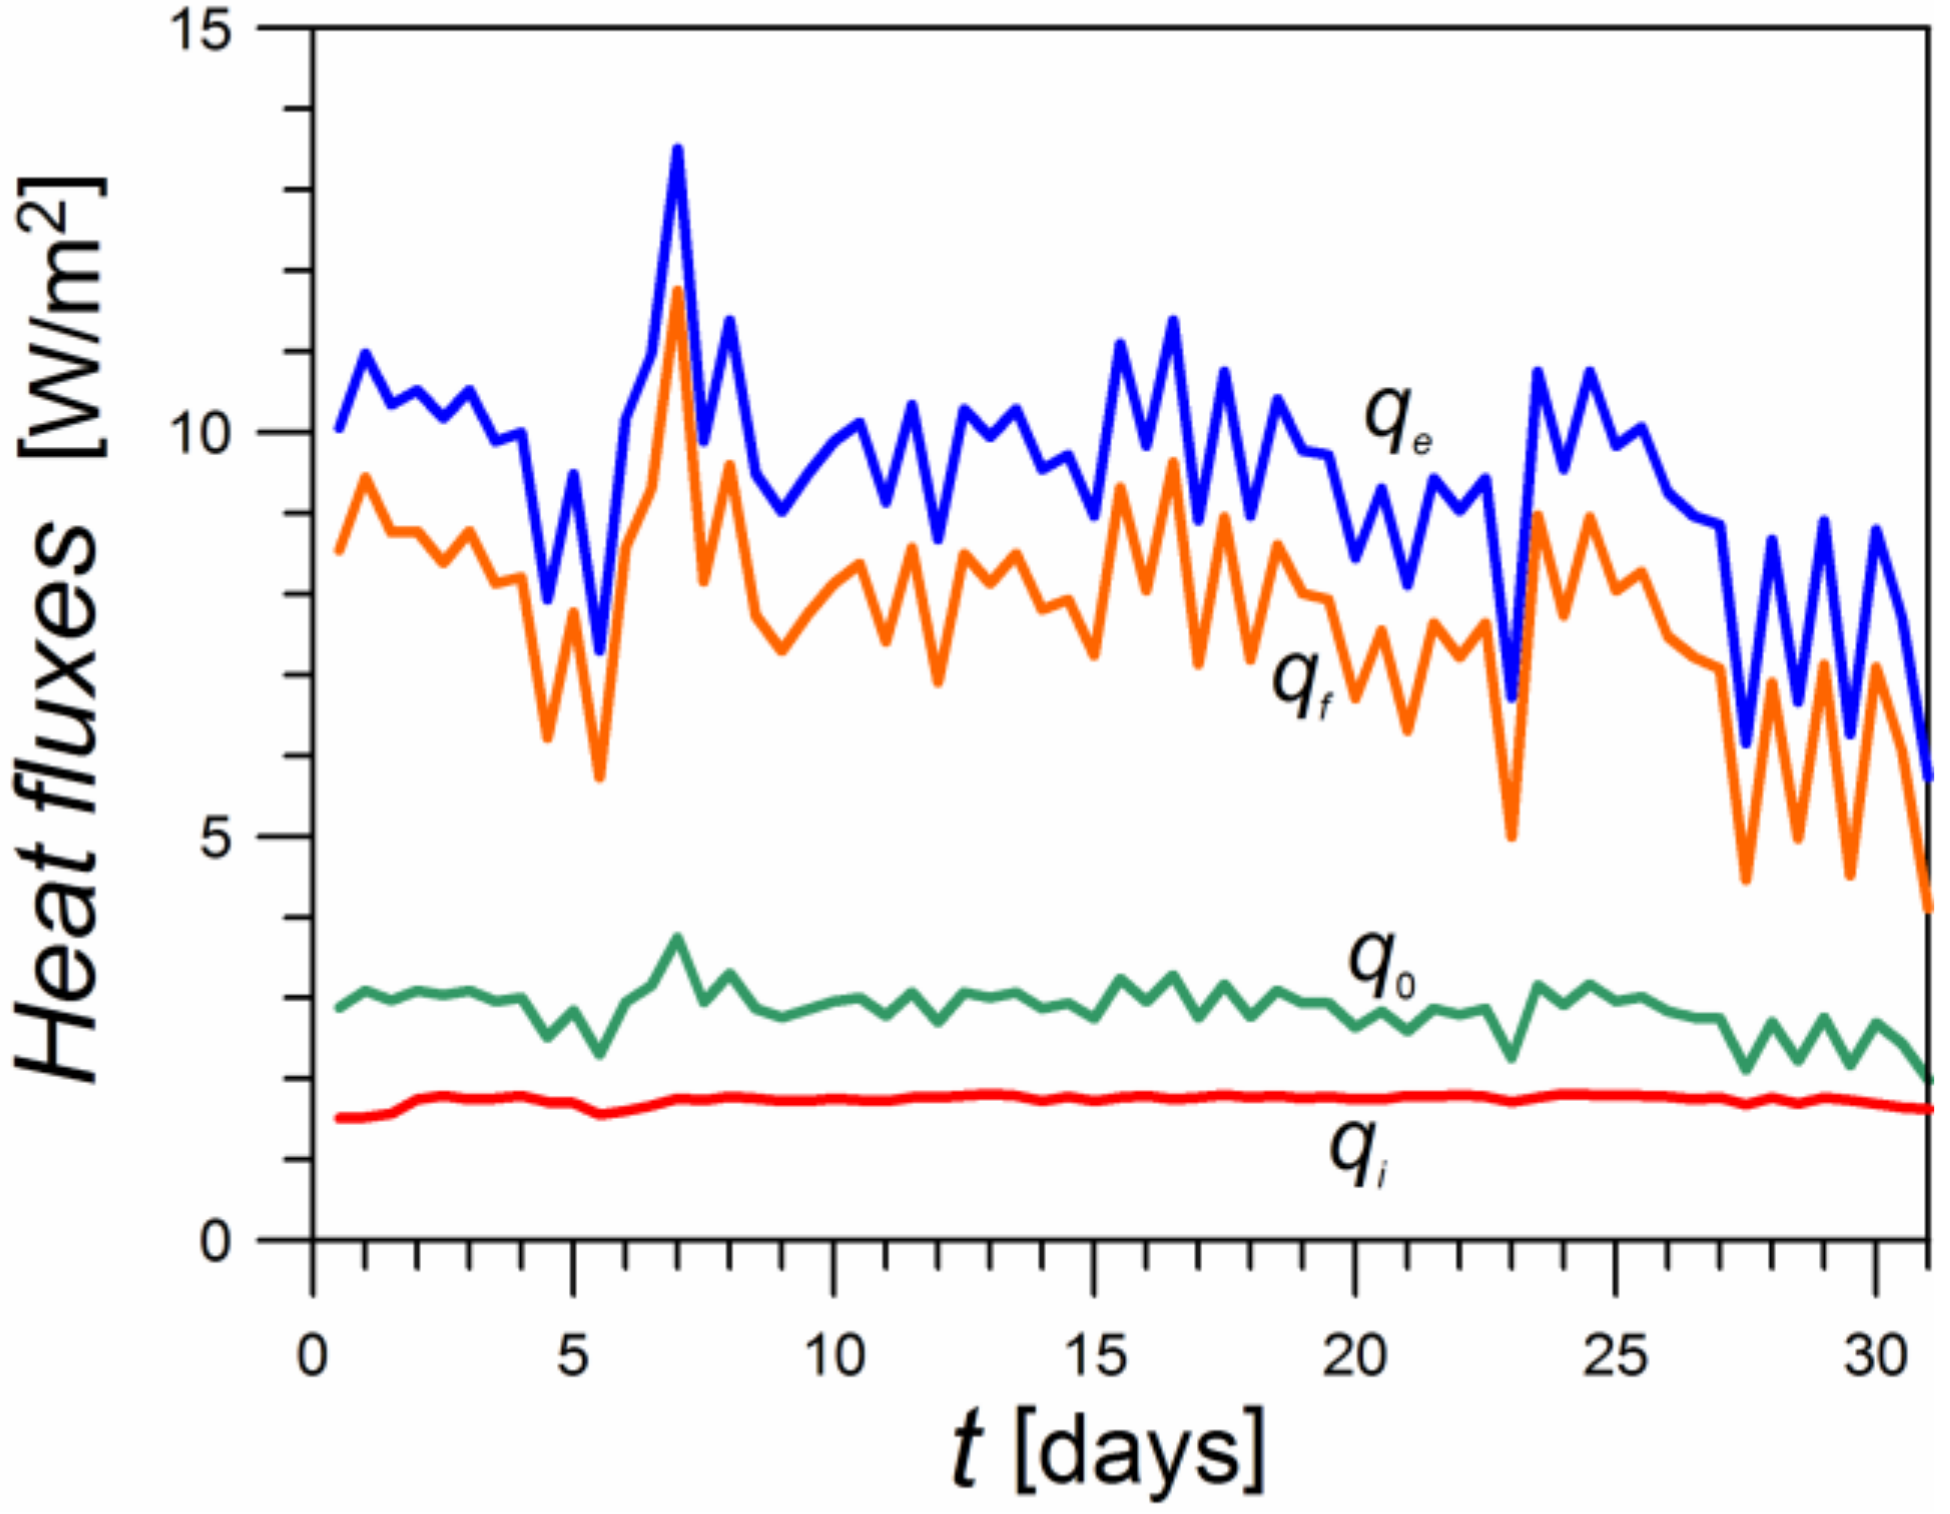
The values of the heat flux were calculated according to relations (8)–(11) and are presented in Figure 15. The parameter κ was determined from the formula (Appendix B):
κ = q f / C O P N p u m p / A f
where
  • COP—coefficient of performance of the space heating heat pump;
  • Npump—the motor power of the pump transporting the working liquid (21 W);
  • Af—total wall surface area with the ATI layer (314 m2).
Figure 15. Temporal courses of heat fluxes qi, qe, qf, and q0.
Thermo 03 00011 g015
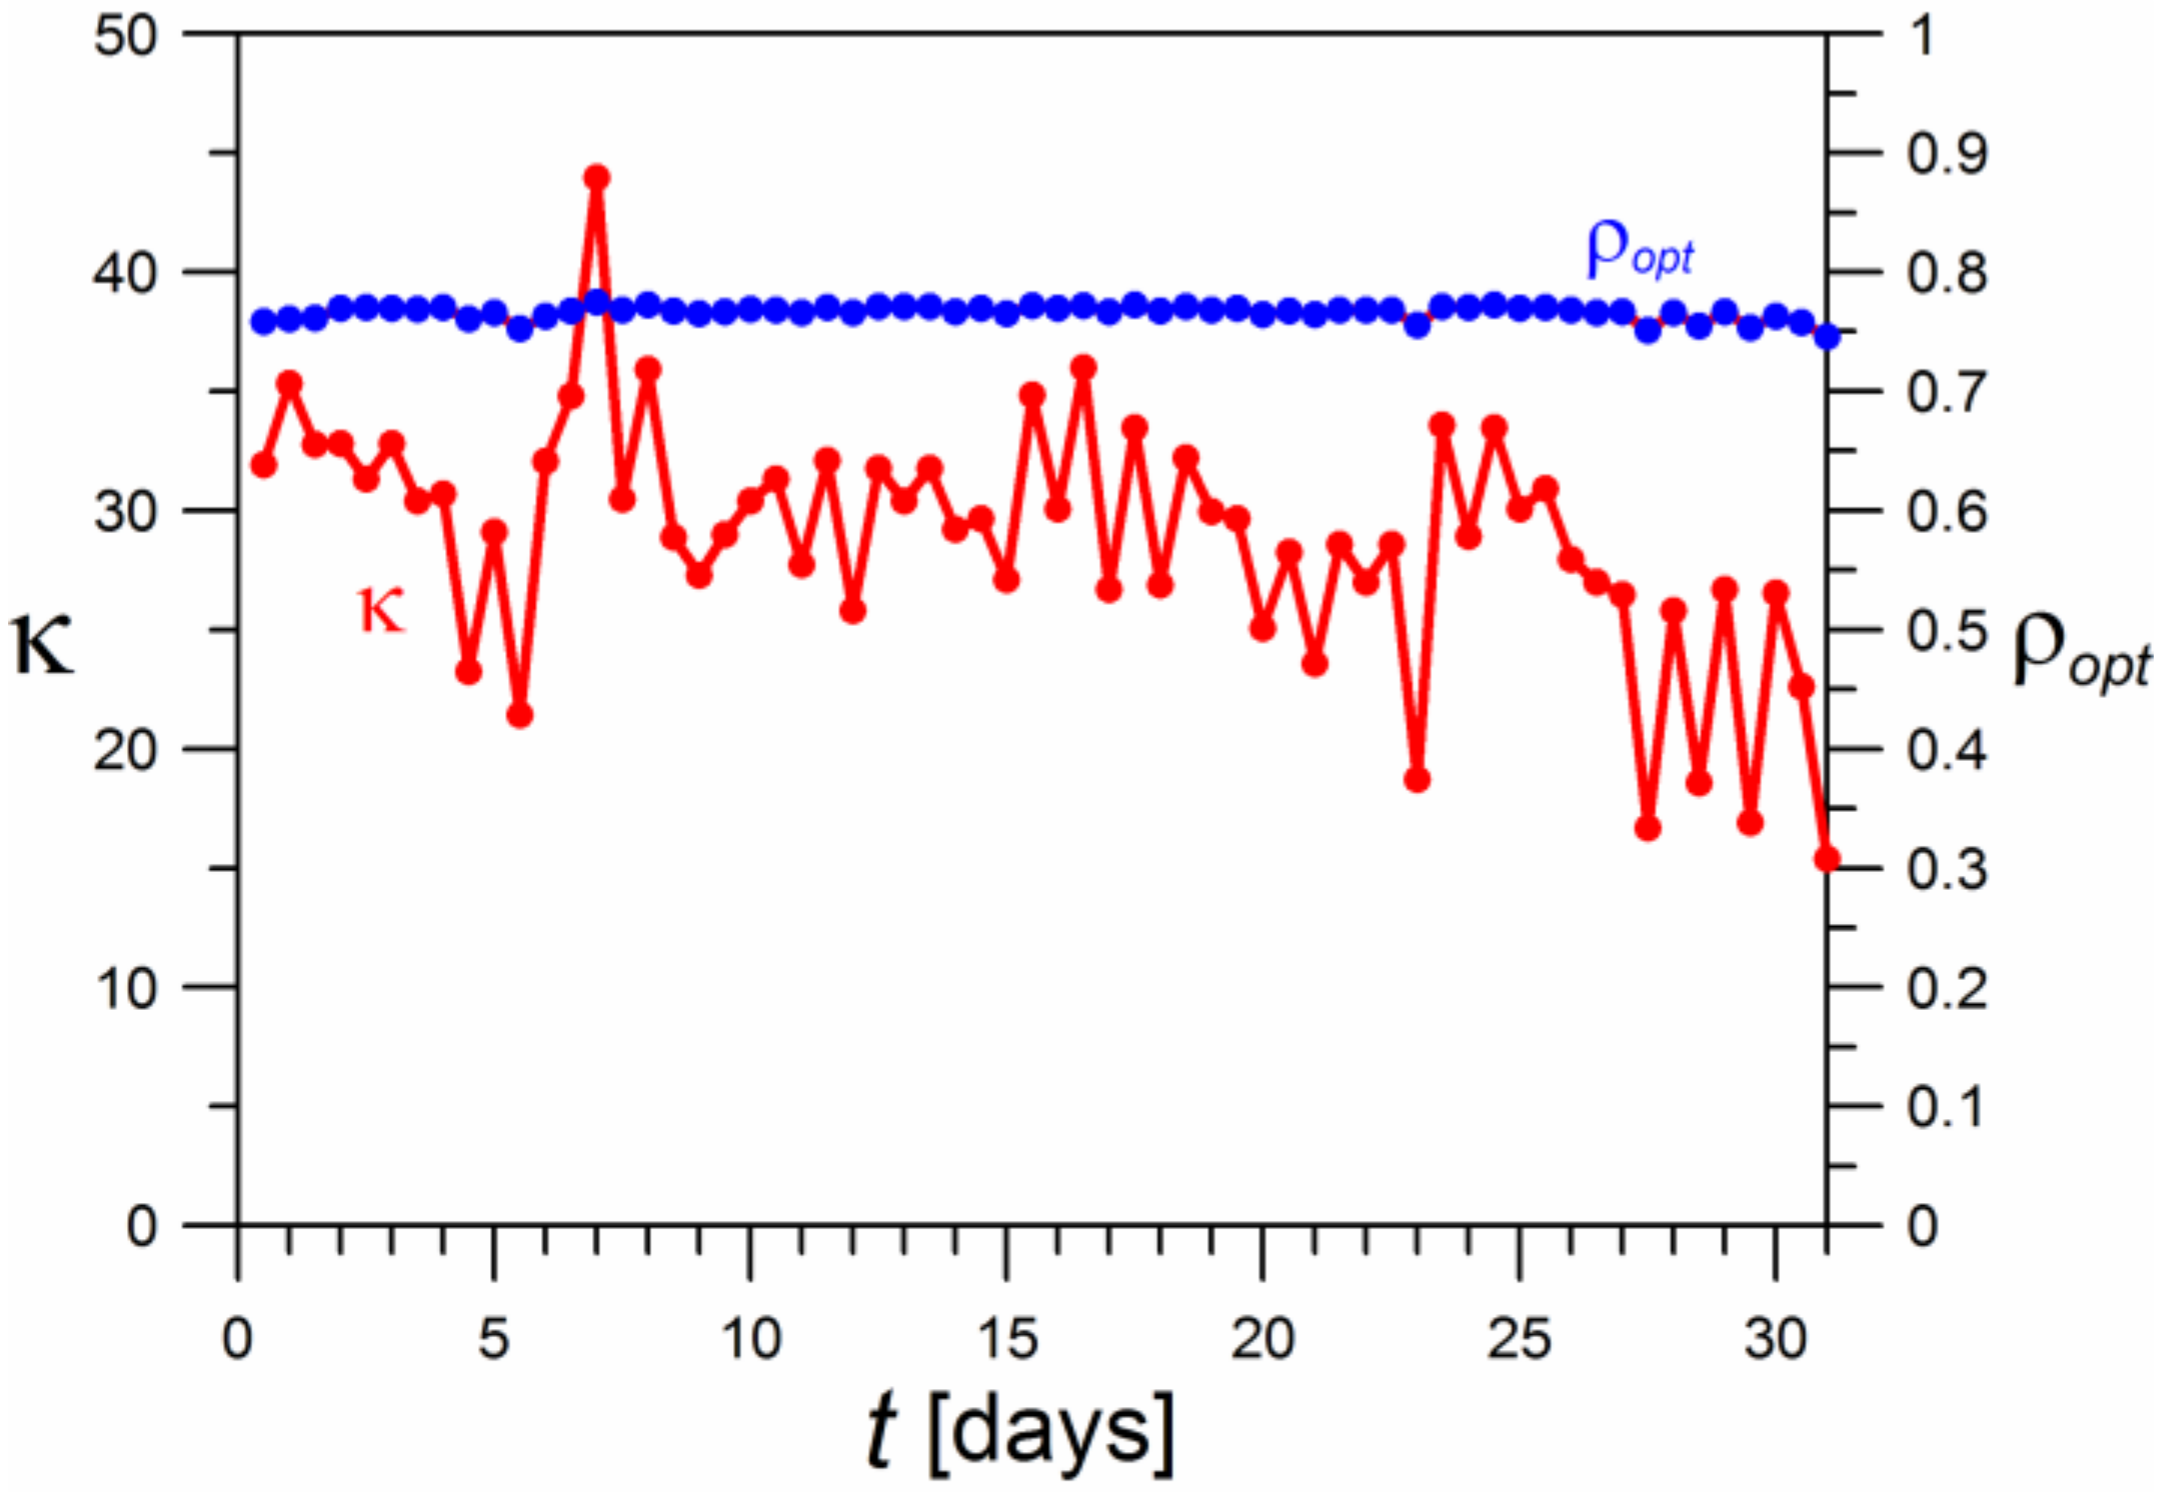
The calculations were carried out for the pump performance coefficient COP = 4.0. The obtained results are presented in Figure 16. It was found that real κ values show some scatter, but their average value can be estimated as approximately 25–30. For the κ values estimated in this manner, the corresponding ρopt values defining the optimum location of the ATI layer in the envelope were calculated according to formula (29). A value of ρopt ≈ 0.77 was obtained.
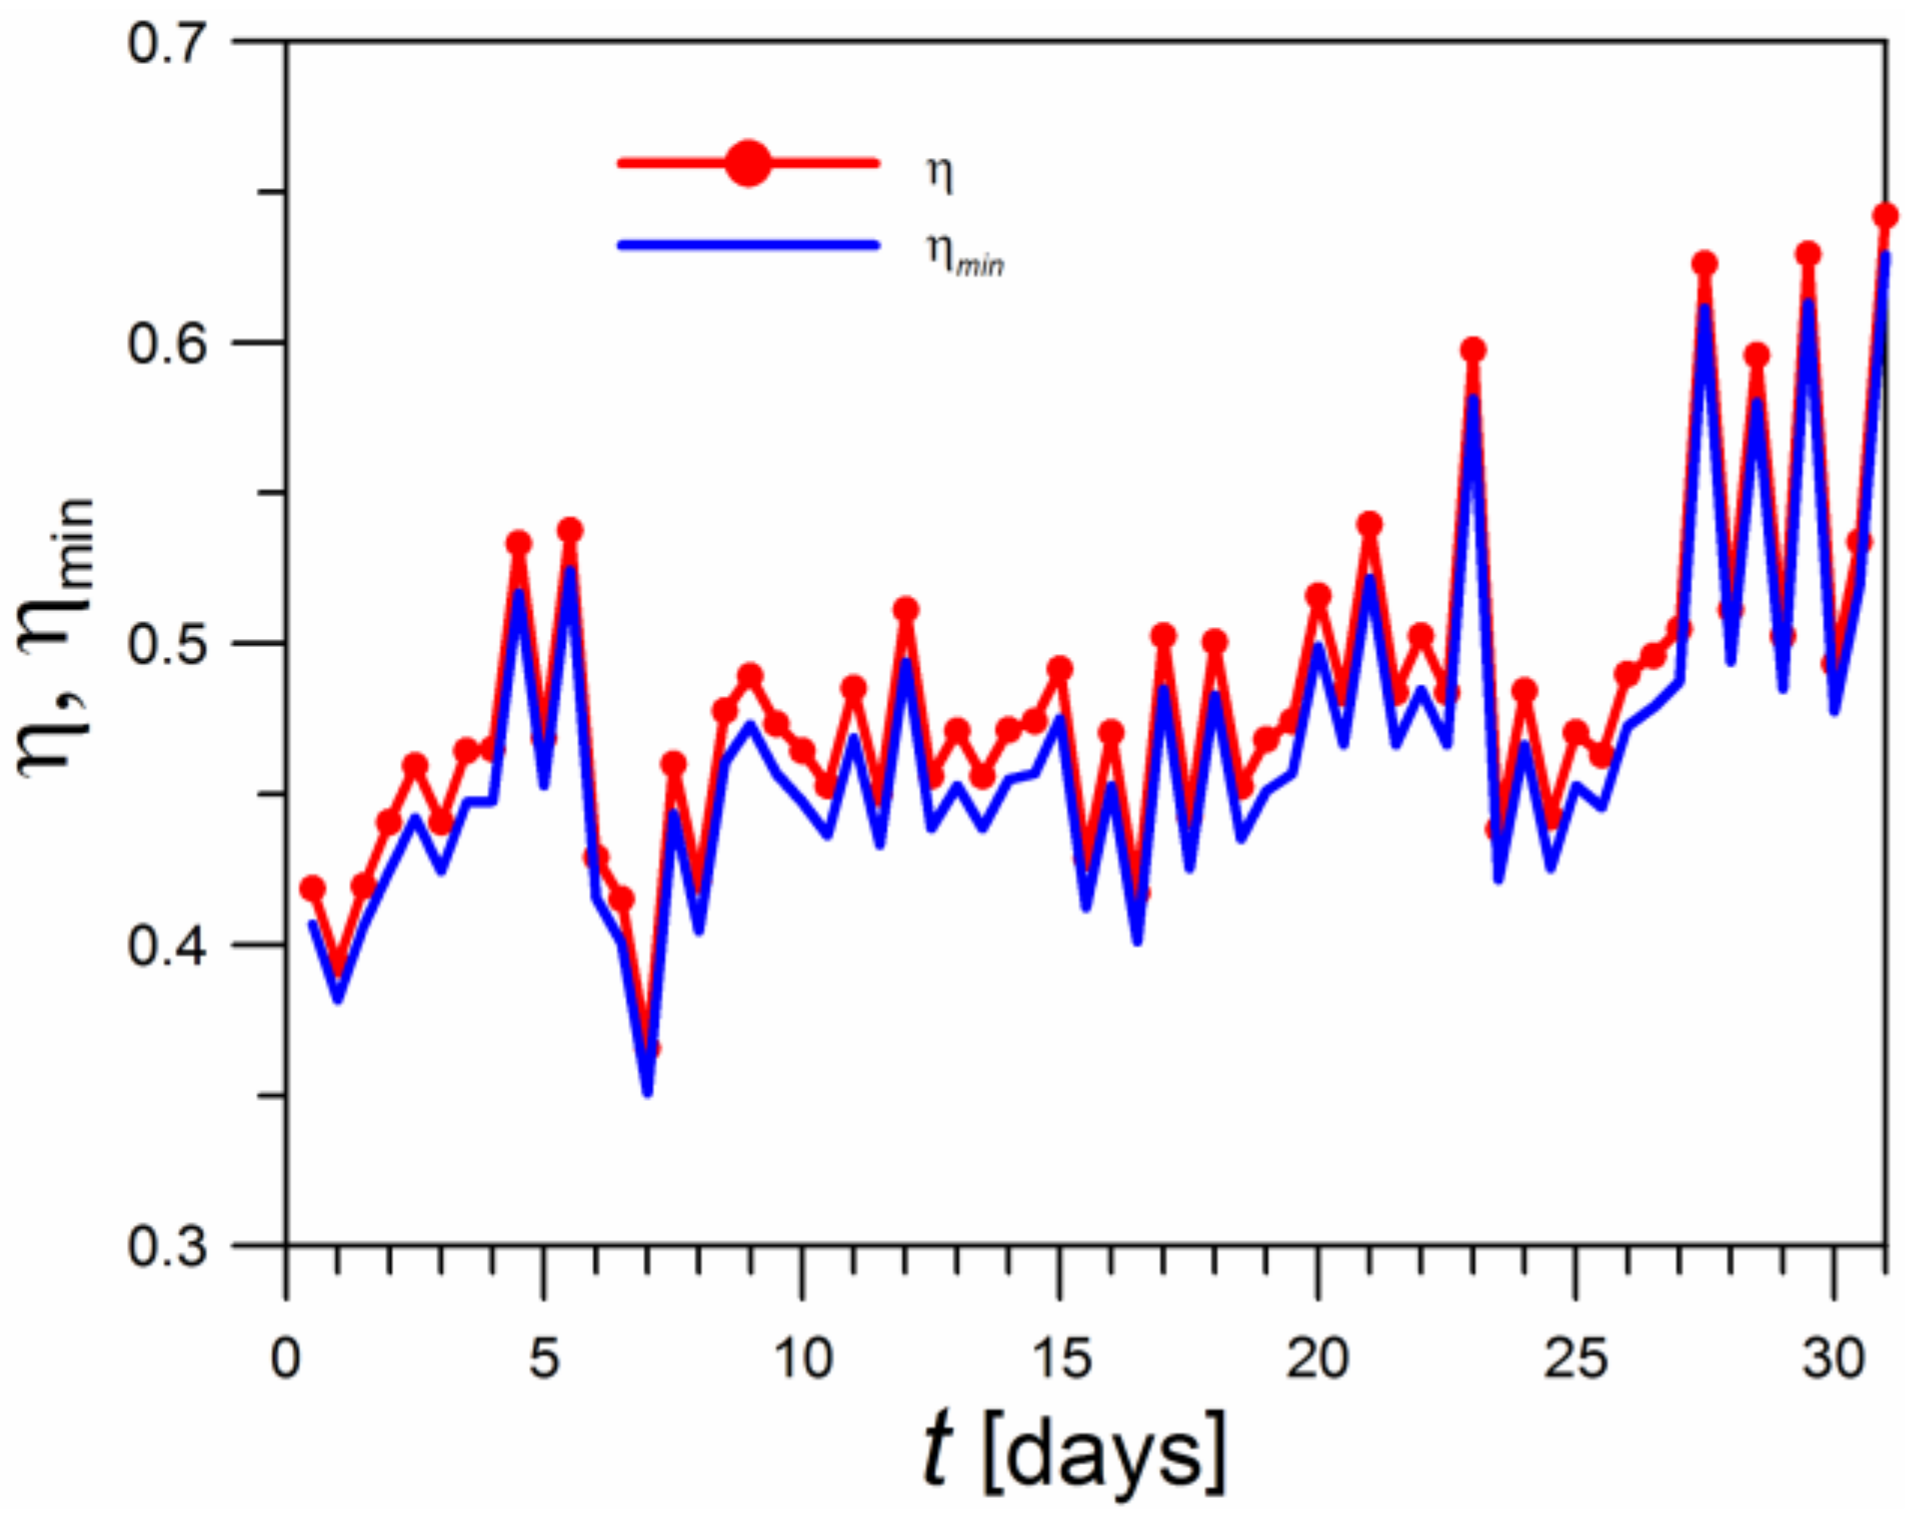
In Figure 17, the results of calculating the economic benefits of using an active insulation layer are shown. The economic factor η was used for this assessment. Its actual values have been determined according to Equation (25) and are depicted as symbols. Values of η in the range of 0.4–0.6 were obtained. If instead of the actual value of the resistance ratio ρ = 0.678, the values of ρopt corresponding to the optimal location of the ATI layer (shown in Figure 16) are used, the ηmin values, calculated according to Equation (30), are slightly lower (the energy saving would be higher). Consequently, it should be considered that the value of ρ = 0.678, which determines the location of the ATI layer under the measurement conditions, is somewhat underestimated. The placement of the pipes corresponding to a value of ρ = 0.77, i.e., closer to the external surface of the envelope, would be more beneficial. However, the expected differences in savings due to a location change would be slight.
6. Conclusions

An analysis of the heat transfer in a building envelope with an active insulation layer was carried out. The main attention was focused on the optimal position of the pipes. The following assumptions were made:
  • The temperature in the ATI layer is equalized;
  • The thermal resistance of the wall is the conduction of the heat moving through the insulation layers;
  • The heat transfer through the wall is of a steady-state nature.
  • The theoretical analysis of the location of the ATI layer leads to the formulation of an optimization problem in which two opposing factors affect the operating costs of heating a building with an active insulation layer. The location of the ATI layer near the interior surface of the envelope is limited by Equation (14). By locating the ATI layer closer to the external surface of the envelope, the heat stream lost to the environment increases. Although the lost heat is low-grade (i.e., relatively cheap), it has its own price, which should be considered;
  • A relationship to determine the location of the ATI layer that provides the minimum operating cost was derived. We took into account that the unit prices of the heat supplied to the internal space and the ATI layer are different;
  • Equation (29) has the form of a simple arithmetic expression between three dimensionless quantities: the dimensionless thermal resistance ρ, the dimensionless temperature Φ, and the pricing parameter κ;
  • The dimensionless temperature of the ATI layer, which depends on the ambient temperature and the ATI layer temperature, plays an important role in optimization, especially the ambient temperature, which changes significantly and unceasingly during the heating season, causing the actual ATI position to not always coincide with the optimal one;
  • Computationally, it has been shown that small changes in the position of the ATI layer about the optimum position moderately affect the economics of the process, which allows a certain tolerance in the design of devices with active insulation;
  • An analysis of the measurements carried out in an existing building equipped with an ATI layer showed that locating the pipes at a shorter distance from the external envelope surface would be more beneficial. However, the predicted differences in economic effects due to the location change would be small;
  • The optimal location of the ATI layer is affected by the following factors: the temperature of the ATI layer, Tf, the ambient temperature, Te, and the unit price of energy supplied to the ATI, PW. These factors affect the optimal location of the ATI layer as follows:
    -
    The higher the unit price of energy delivered to the ATI (smaller κ), the closer the ATI layer should be placed to the internal surface of the envelope (smaller ρ);
    -
    The higher the temperature of the ATI layer (smaller Φ), the closer the ATI layer should be placed to the internal surface of the envelope (smaller ρ);
    -
    The higher the ambient temperature (larger Φ), the closer the ATI layer should be placed to the external surface of the envelope (larger ρ).

Author Contributions

Conceptualization, K.K.; methodology, B.K. and K.K.; software, B.K. and K.K.; validation, B.K. and K.K. formal analysis, K.K.; investigation, B.K. and K.K.; resources, K.K.; data curation, B.K. and K.K.; writing—original draft preparation, K.K.; writing—review and editing, B.K. and K.K.; visualization, K.K.; supervision, K.K.; project administration, B.K. All authors have read and agreed to the published version of the manuscript.

Funding

This research received no external funding.

Data Availability Statement

Not applicable.

Acknowledgments

Authors would like to thank Tamas Barkanyi (Nyiregyhaza, Hungary) for providing the results of the temperature measurements he carried out in a residential building with active insulation installed.

Conflicts of Interest

The authors declare no conflict of interest.

Nomenclature

Asurface area
ATIactive thermal insulation
COPcoefficient of performance
Cheating cost per time and envelope surface area
cvvolumetric specific heat
hconvective heat transfer coefficient
kthermal conductivity
Llength
Npumppower of the pump
PRunit price of heat supplied to the internal space
PWunit price of heat supplied to ATI layer
qvrate of heat generation per unit volume
Q ˙ rate of heat transfer
Rheat resistance per surface area
swidth
ttime
Ttemperature
x, y, zposition coordinates
Greek letters
αthermal diffusivity
κpricing parameter
ηeconomic factor
ρdimensionless heat resistance
Φdimensionless temperature
Indices
factive insulation layer
eexterior
eqequivalently
Lworking liquid
iinterior
insinsulation
minminimum
maxmaximum
optoptimal
ppipes
0passive

Appendix A. Relationship between the Supply Heat Flux of the ATI Layer and the Average Temperature of the ATI Layer

A wall consisting of three layers was considered, with a middle layer 2L in thickness, and thermal conductivity coefficient kf was heated with a uniform source efficiency qv. On both sides of the middle layer, there are insulation layers with thicknesses of si and se and thermal conductivity kins (Figure A1). The equation for the temperature profile in a uniformly heated plate has the form given by Incropera et al. [27]:
T = q v L 2 2 k f 1 x L 2 + T f 2 T f 1 2 x L + T f 1 T f 2 2
Figure A1. Three-layer wall with a heat source in the middle layer.
Thermo 03 00011 g0a1
If the outside temperatures of the three-layer system are fixed at Ti and Te, respectively, the temperatures of the external surfaces of the middle layer, Tf1 and Tf2, can be determined:
T f 1 = s e T i + s i T e + 2 q v L s i s e k i n s + k i n s T i + q v L s i γ s i + s e + k i n s γ
T f 2 = s e T i + s i T e + 2 q v L s i s e k i n s + k i n s T e + q v L s e γ s i + s e + k i n s γ
where
γ = 2 L k f
When the middle layer is a good conductor of heat, γ→0 and temperatures Tf1 and Tf2 become equal.
T f 1 = T f 2 = s e T i + s i T e + 2 q v L s i s e k i n s s i + s e
Therefore, the relationship between qf and Tf is as follows:
T f = s e T i + s i T e + q f s i s e k i n s s i + s e
Temperature Tf can also be calculated based on the knowledge of the mean temperature of the working liquid, TL, and the thermal resistance of the heat transfer between a working liquid and the external surface of the pipes, Rf. The heat flux supplied to the middle layer through the pipe system is described by the heat transfer equation:
Q ˙ = T L T f 1 / h p + s p / k p A p
In the balanced relationship (11), the heat flux qf is related to the wall surface, hence
q f = β T L T f R f
where Rf is substituted with:
R f = 1 h p + s p k p
whereas, β = Ap/Af.
Taking into account Formulas (9)–(11), Equation (21) was obtained.

Appendix B. Pricing Parameter

The unit price of energy, P, can be calculated as the ratio of the cost of supplying this energy per unit of time and per unit of area to the flux of this energy q.
For the heating of the internal space with a heat pump, the costs associated with the heat loss from the internal envelope surface towards the ATI layer are qi/COP · Pel (Pel − unit price of electricity). Therefore, the unit price of heat energy supplied to the internal space equals
P R = P e l C O P
The transfer of heat with the flux qf from a working liquid to the ATI layer is related to the pump drive costs: Npump/Af · Pel. Therefore, the unit price of thermal energy supplied to the ATI layer is
P W = N p u m p / A f P e l q f
Based on Equations (A8) and (A9), the following expression is obtained for the ratio of the unit prices of the energy transferred from the internal surface of the envelope PR and the energy transferred from the working liquid PW.
κ = P R P W = q f / C O P N p u m p / A f

References

  1. Isomax-Terrasol. Available online: http://www.isomax-terrasol.eu/home.html (accessed on 6 February 2022).
  2. Xu, X.; Wang, S.; Wang, J.; Xiao, F. Active pipe-embedded structures in buildings for utilizing low-grade energy sources: A review. Energy Build. 2010, 42, 1567–1581. [Google Scholar] [CrossRef]
  3. Barkanyi, T. Space Delimiting Structure for Utilizing Low-Temperature Heat-Carrying Agents. WO Patent 2011/135387 A1, 3 November 2011. [Google Scholar]
  4. Romaní Picas, J.; Gracia Cuesta, A.D.; Cabeza, L.F. Simulation and control of thermally activated building systems (TABS). Energy Build. 2016, 127, 22–42. [Google Scholar] [CrossRef]
  5. Mousavi, S.; Rismanchi, B.; Brey, S.; Aye, L. PCM embedded radiant chilled ceiling: A state-of-the-art review. Renew. Sustain. Energy Rev. 2021, 151, 111601. [Google Scholar] [CrossRef]
  6. Hongn, M.; Bre, F.; Valdez, M.; Larsen, S.F. Two novel resistance-capacitance network models to predict the dynamic thermal behavior of active pipe-embedded structures in buildings. J. Build. Eng. 2022, 47, 103821. [Google Scholar] [CrossRef]
  7. Krzaczek, M.; Kowalczuk, Z. Thermal Barrier as a technique of indirect heating and cooling for residential buildings. Energy Build. 2011, 43, 823–837. [Google Scholar] [CrossRef]
  8. Barkanyi, T. A Construction Element for Active Insulation of Buildings (Element Konstrukcji Budowlanej do Aktywnej Izolacji Budynków). PL Patent 226897 B1, 15 February 2012. (In Polish). [Google Scholar]
  9. Meggers, F.; Baldini, L.; Leibundgut, H. An Innovative Use of Renewable Ground Heat for Insulation in Low Exergy Building Systems. Energies 2012, 5, 3149–3166. [Google Scholar] [CrossRef]
  10. Niu, F.; Yu, Y. Location and optimization analysis of capillary tube network embedded in active tuning building wall. Energy 2016, 97, 36–45. [Google Scholar] [CrossRef]
  11. Yu, Y.; Niu, F.; Guo, H.-A.; Woradechjumroen, D. A thermo-activated wall for load reduction and supplementary cooling with free to low-cost thermal water. Energy 2016, 99, 250–265. [Google Scholar] [CrossRef]
  12. Li, A.; Xu, X.; Sun, Y. A study on pipe-embedded wall integrated with ground source-coupled heat exchanger for enhanced building energy efficiency in diverse climate regions. Energy Build. 2016, 121, 139–151. [Google Scholar] [CrossRef]
  13. Shen, C.; Li, X. Energy saving potential of pipe-embedded building envelope utilizing low-temperature hot water in the heating season. Energy Build. 2017, 138, 318–331. [Google Scholar] [CrossRef]
  14. Šimko, M.; Krajčík, M.; Šikula, O.; Šimko, P.; Kalús, D. Insulation panels for active control of heat transfer in walls operated as space heating or as a thermal barrier: Numerical simulations and experiments. Energy Build. 2018, 158, 135–146. [Google Scholar] [CrossRef]
  15. Kisilewicz, T.; Fedorczak-Cisak, M.; Barkanyi, T. Active thermal insulation as an element limiting heat loss through external walls. Energy Build. 2019, 205, 109541. [Google Scholar] [CrossRef]
  16. Krzaczek, M.; Florczuk, J.; Tejchman, J. Improved energy management technique in pipe-embedded wall heating/cooling system in residential buildings. Appl. Energy 2019, 254, 113711. [Google Scholar] [CrossRef]
  17. Zhou, L.; Li, C. Study on thermal and energy-saving performances of pipe-embedded wall utilizing low-grade energy. Appl. Therm. Eng. 2020, 176, 115477. [Google Scholar] [CrossRef]
  18. Figiel, E.; Leciej-Pirczewska, D. Outer wall with thermal barrier. Impact of the barrier on heat losses and CO2 emissions. Przegląd Nauk. Inżynieria Kształtowanie Sr. 2020, 29, 223–233. [Google Scholar] [CrossRef]
  19. Kalús, D.; Gašparík, J.; Janík, P.; Kubica, M.; Šťastný, P. Innovative Building Technology Implemented into Facades with Active Thermal Protection. Sustainability 2021, 13, 4438. [Google Scholar] [CrossRef]
  20. Krajčík, M.; Šimko, M.; Šikula, O.; Szabó, D.; Petráš, D. Thermal performance of a radiant wall heating and cooling system with pipes attached to thermally insulating bricks. Energy Build. 2021, 246, 111122. [Google Scholar] [CrossRef]
  21. Krajčík, M.; Arıcı, M.; Šikula, O.; Šimko, M. Review of water-based wall systems: Heating, cooling, and thermal barriers. Energy Build. 2021, 253, 111476. [Google Scholar] [CrossRef]
  22. Yang, Y.; Chen, S.; Chang, T.; Ma, J.; Sun, Y. Uncertainty and global sensitivity analysis on thermal performances of pipe-embedded building envelope in the heating season. Energy Convers. Manag. 2021, 244, 114509. [Google Scholar] [CrossRef]
  23. Kalús, D.; Mučková, V.; Koudelková, D. Energy, Economic and Environmental Assessment of Thermal Barrier Application in Building Envelope Structures. Coatings 2021, 11, 1538. [Google Scholar] [CrossRef]
  24. Kalús, D.; Janík, P.; Koudelková, D.; Mučková, V.; Sokol, M. Contribution to research on ground heat storages as part of building energy systems using RES. Energy Build. 2022, 267, 112125. [Google Scholar] [CrossRef]
  25. Gwadera, M.; Larwa, B.; Kupiec, K. Undisturbed Ground Temperature—Different Methods of Determination. Sustainability 2017, 9, 2055. [Google Scholar] [CrossRef]
  26. Larwa, B.; Kupiec, K. Study of temperature distribution in the ground. Chem. Process Eng. 2019, 40, 123–137. [Google Scholar] [CrossRef]
  27. Incropera, F.P.; Dewitt, D.P.; Bergman, T.L.; Lavine, A.S. Fundamentals of Heat and Mass Transfer, 8th ed.; John Wiley & Sons: Hoboken, NJ, USA, 2017. [Google Scholar]
Figure 1. Envelope with an active insulation layer.
Thermo 03 00011 g001
Figure 2. Envelope temperature profiles.
Thermo 03 00011 g002
Figure 3. ATI layer location.
Thermo 03 00011 g003
Figure 4. The geometry of the simulated system.
Thermo 03 00011 g004
Figure 5. (ac)Temperature maps in a three-layer envelope with heat supplied to the middle layer for a different density of isolines.
Thermo 03 00011 g005
Figure 6. Temperature distribution in the vertical section of a reinforced concrete layer.
Thermo 03 00011 g006
Figure 7. (a) Temperature profiles in the individual envelope layers; (b) temperature profiles in the layer with a heat source.
Thermo 03 00011 g007
Figure 8. Temperature profiles in the insulation layer.
Thermo 03 00011 g008
Figure 9. (a) Temporal course of ambient temperature, ATI layer temperature, and heat flux supplied to the ATI layer under steady and transient conditions; (b) temporal course of ATI layer temperature under steady and transient conditions.
Thermo 03 00011 g009
Figure 10. Relationship η = F1(ρ, κ).
Thermo 03 00011 g010
Figure 11. Relationship η = F2 (ρ, Φ).
Thermo 03 00011 g011
Figure 12. Dependence of dimensionless thermal resistance (at the optimal location of ATI layer) on the dimensionless temperature and pricing parameter.
Thermo 03 00011 g012
Figure 13. Dependence of economic coefficient for the optimal location of ATI layer on the dimensionless temperature and pricing parameter.
Thermo 03 00011 g013
Figure 14. Temporal courses of the internal space temperature, Ti, mean working liquid temperature, TL, and the ambient temperature, Te—measurement results.
Thermo 03 00011 g014
Figure 16. Calculated values of the pricing parameter κ and values of ρopt.
Thermo 03 00011 g016
Figure 17. Comparison of the actual values of the economic factor η with ηmin values for optimum location of ATI layer.
Thermo 03 00011 g017
Table 1. Mesh independence results.
Number of ElementsTemperature [°C]
838416.545
12,43616.752
16,37616.783
26,65816.782
35,10316.782
Disclaimer/Publisher’s Note: The statements, opinions and data contained in all publications are solely those of the individual author(s) and contributor(s) and not of MDPI and/or the editor(s). MDPI and/or the editor(s) disclaim responsibility for any injury to people or property resulting from any ideas, methods, instructions or products referred to in the content.