1. Introduction
The LiF–BeF2 system is well known as possible heat transfer media for molten salt reactors (MSRs). According to previous investigations, the molten salt made from a mixture of lithium fluoride (LiF) and beryllium fluoride (BeF2) possesses very good thermal conductivity (about 1.1 W/mK), which is higher than that of all individual molten salts with the exception of LiF. For this reason, the heat transfer process can be effectively organized using FliBe as a medium. At the initial and final stages of the process, the thermal properties of solid and transitional phases can play a significant role.
Early investigations of thermal conductivity were carried out using the variable-gap method [
1,
2]. The authors took into consideration the possibility that sample thickness can be a source of undesirable effects, while changing specimen thickness allows potential measurement errors to be minimized. Later, the laser flash analysis (LFA) method was used to measure the thermal conductivity of molten LiF–BeF
2 mixtures [
3]. In this case, the measuring property was thermal diffusivity, while thermal conductivity was calculated as the product of thermal diffusivity, density, and heat capacity. Peritectic and eutectic compositions were studied. While thermal diffusivity values for both compositions are close, thermal conductivity can be calculated only for peritectic Li
2BeF
4 due to heat capacity and density data only being known for this composition. In the case of eutectic compositions, thermal conductivity cannot be calculated due to the lack of a heat capacity value. Results obtained by American and Japanese scientists for Li
2BeF
4 are in good agreement.
Li
2BeF
4 is also known for some unusual behavior at the phase transition. The undercooling phenomenon is attributed to this composition [
4]. While Li
2BeF
4 transitions to a molten state at 458 °C under heating, the freezing process takes place at the temperature interval 458–380 °C under certain conditions. At these temperatures, the salt mixture consists of both liquid and solid phases. This fact is very important for thermal conductivity measurements since the thermal conductivity and heat capacity of solid and liquid phases are different.
The heat capacity of Li
2BeF
4 in a liquid state was studied in recent work [
5]. The results are in good agreement with the data of Douglas and Paine [
6], but slightly different from the values obtained by Power and Ballock [
7]. The density of Li
2BeF
4 in a solid state is considered in the dissertations [
8,
9]. It is evident that the change of density at the solid–liquid transition is negligible. This represents a very unusual solid–liquid transition, since density typically drops by 20–25% for pure salts, while the corresponding change for eutectic mixtures is about 10% [
9].
Thus, some interesting phenomena occur at the solid–liquid transition in Li2BeF4 compound, prompting a need to investigate the thermophysical properties of this substance at transition temperatures in order to shed light on the nature of this transition. The objective of the present work was to investigate the thermophysical properties of the Li2BeF4 system in solid and transitional states.
2. Materials and Methods
2.1. Preparation of Samples
All manipulations of salts in the LiF–BeF2 system were carried out in a glove box under a controlled inert argon atmosphere (SPEKS GB-02M). Neither the moisture nor oxygen content exceeded 1 ppm. Samples of lithium fluoride (reagent grade) and beryllium fluoride (reagent grade) were mixed in the required ratio with an accuracy of 1 mg in order to obtain 40–50 g of the salt. The mixture of salts was loaded in a glassy carbon crucible into a nickel retort, placed in a resistance furnace and heated to a temperature of 973–1023 K. After holding in a molten state for at least three hours, samples were removed for chemical analysis.
Next, the samples were placed in special nickel containers inside a box with a controlled argon atmosphere (oxygen < 5 ppm; moisture < 1 ppm); the samples were taken from the melt of the required composition using a spoon-shaped nickel sampler. Following solidification, droplets of the samples weighed about 0.4–0.7 g. To obtain a total weight of about 1.5 g, several samples were placed in a nickel container and heated in a furnace above the melting point. Following melting, the absence of gas bubbles at the bottom was visually monitored. If such bubbles occurred, they were driven out by stirring with a nickel wire. Then the container was removed from the furnace and sealed with a lid while still hot. Next, the entire container assembly was again heated to a temperature of melting point. After cooling, they were taken out of the box in a sealed container, from which they were taken out immediately before welding. After welding using an argon-arc apparatus, the samples were again placed into the box and heated above melting temperature. After cooling, the samples were labeled and packed into containers.
2.2. Laser Flash Analysis (LFA)
Thermal diffusivity was measured using a technique developed for molten media [
10,
11,
12,
13]. The sample is placed in a holder inside a high-temperature electric furnace. Laser radiation is supplied to the sample from a solid-state pulsed neodymium-doped yttrium-aluminum garnet (YAG) laser with a wavelength of 1.064 μm. The lens system provides a uniform distribution of intensity over a 13 mm spot, which is monitored periodically. The pulse duration varies from 0.3 to 1 ms. The maximum energy of a single pulse does not exceed 40 J. The high-temperature electric furnace consists of two hermetically separated parts, one of which contains a graphite heater and a system of thermo-radiation shields, while the other contains a sample holder. The change in the temperature of the upper surface of the sample is recorded by an indium antimonide (InSb)-based IR detector cooled with liquid nitrogen, with an area of about 6 mm in diameter. To focus radiation from the sample surface, a CaF2 lens transparent to the IR spectrum was installed in front of the detector. The time dependence of the laser pulse amplitude was recorded using a separate detector. The design of the setup allows samples to be investigated across a wide temperature range, from room temperature to 2000 °C in an inert atmosphere (Ar, He) or vacuum, and up to 1500 °C in air. The set-up comprised two pumps: fore-vacuum and turbomolecular (up to 10
−5 Torr). The temperature of the holder was measured with a thermocouple, installed in the immediate vicinity of the sample (1–2 mm). The thermal diffusivity measurement range of the installation was 0.01–1000 mm
2 s
−1.
In order to measure the thermal diffusivity of liquids, a special measuring cell was developed. In a cell of this design, it was possible to create a uniform plane-parallel liquid layer of a known thickness. To ensure that the lid remained firmly pressed against the crucible throughout the experiment, the cell itself was clamped into the holder. For the experiments with molten salts, the cell was made of nickel alloy NP 2 (99.5 wt% of nickel). The cell material was selected on the basis of its physical and chemical properties (the thermal diffusivity of the cell material was investigated in separate experiments). The following dimensions applied: thicknesses of the crucible bottom and lid, ≈ 0.5 mm; melt layer, 1–2.5 mm; thickness of the side walls of the crucible and insert, ≈ 0.3 mm; outer diameters, 12.6 mm and 9 mm, respectively.
During the measurements, the NP2 alloy was observed to retain a bright metallic luster, which did not darken even after prolonged high-temperature experiments. In order to increase the degree of blackness, both surfaces of the free sample and the lower end of the cell were processed with emery paper and covered with graphite spray (thickness ~5 μm). Following the experiment, the graphite was easily removed with alcohol, since the NP2 material does not interact with carbon. The cell shape did not change following the high-temperature experiments. In each experiment, the cell was kept isothermally at the maximum temperature (923 or 973 K) for 30–40 min. The time of a single measurement (duration of thermogram recording) for the salt was about 20–24 s; on the free sample NP2, the duration of a single measurement was approximately 0.8–1.1 s. The results obtained in different experiments and in different cycles (heating, cooling) agree with each other within the allowed measurement error.
In order to measure the thermal diffusivity and thermal conductivity of melts from experimental thermograms, it is necessary to construct a mathematical model that allows the time evolution of the temperature field in the cell to be calculated. Such a model has been developed and presented elsewhere [
10].
2.3. Heat Capacity Measurements
The investigations of heat capacity in the LiF–BeF
2 system were carried out using a STA 449F1 Jupiter synchronous thermal analyzer (NETZSCH, Germany) to synchronously record the change in the sample mass and the differential scanning calorimetry (DSC) curve. The experimental setup provides high measurement accuracy of the specified parameters: temperature (±1.5 K); mass (<10
−6 g); baseline reproducibility (±2.5 mW); enthalpy (±3%). A single sapphire crystal was used for sensitivity calibration. The measurements were carried out under the following conditions: temperature range: heating, 308–873 K; cooling, 873–473 K; heating rate, 10 K/min; atmosphere, pure Ar (special purity); Pt-Rh crucibles with lids. Test samples with a weight of about 10 mg were preheated to 1023 K and kept for 1 h in a muffle furnace situated in an Ar glove box. In order to determine the heat capacity of the sample under study, the thermal behavior of the initial system was first determined when both crucibles were empty to form a baseline. Then, using the same experimental conditions (heating rate, crucibles, atmosphere, etc.), measurements were made for a sapphire reference sample (DSC sapphire) with a mass m and known heat capacity C
p. A third measurement was performed for the test sample with a known mass m. The specific heat capacity of the test sample (C
p) was calculated by the formula:
All measurements were carried out under the same conditions. The corresponding calculations were carried out using the NETZSCH Proteus program. The standard error of the temperature measurement was 5 K. Taking the 3 stage measurement process into account, the standard error of the heat capacity measurement was taken to be 5%. When studying such complex objects as molten salts, in which significant changes in their shape occur after melting, the measurement error can be estimated at 10%. Then measurements were carried out both at heating and at cooling. Calibration was also performed under the same conditions.
3. Results and Discussions
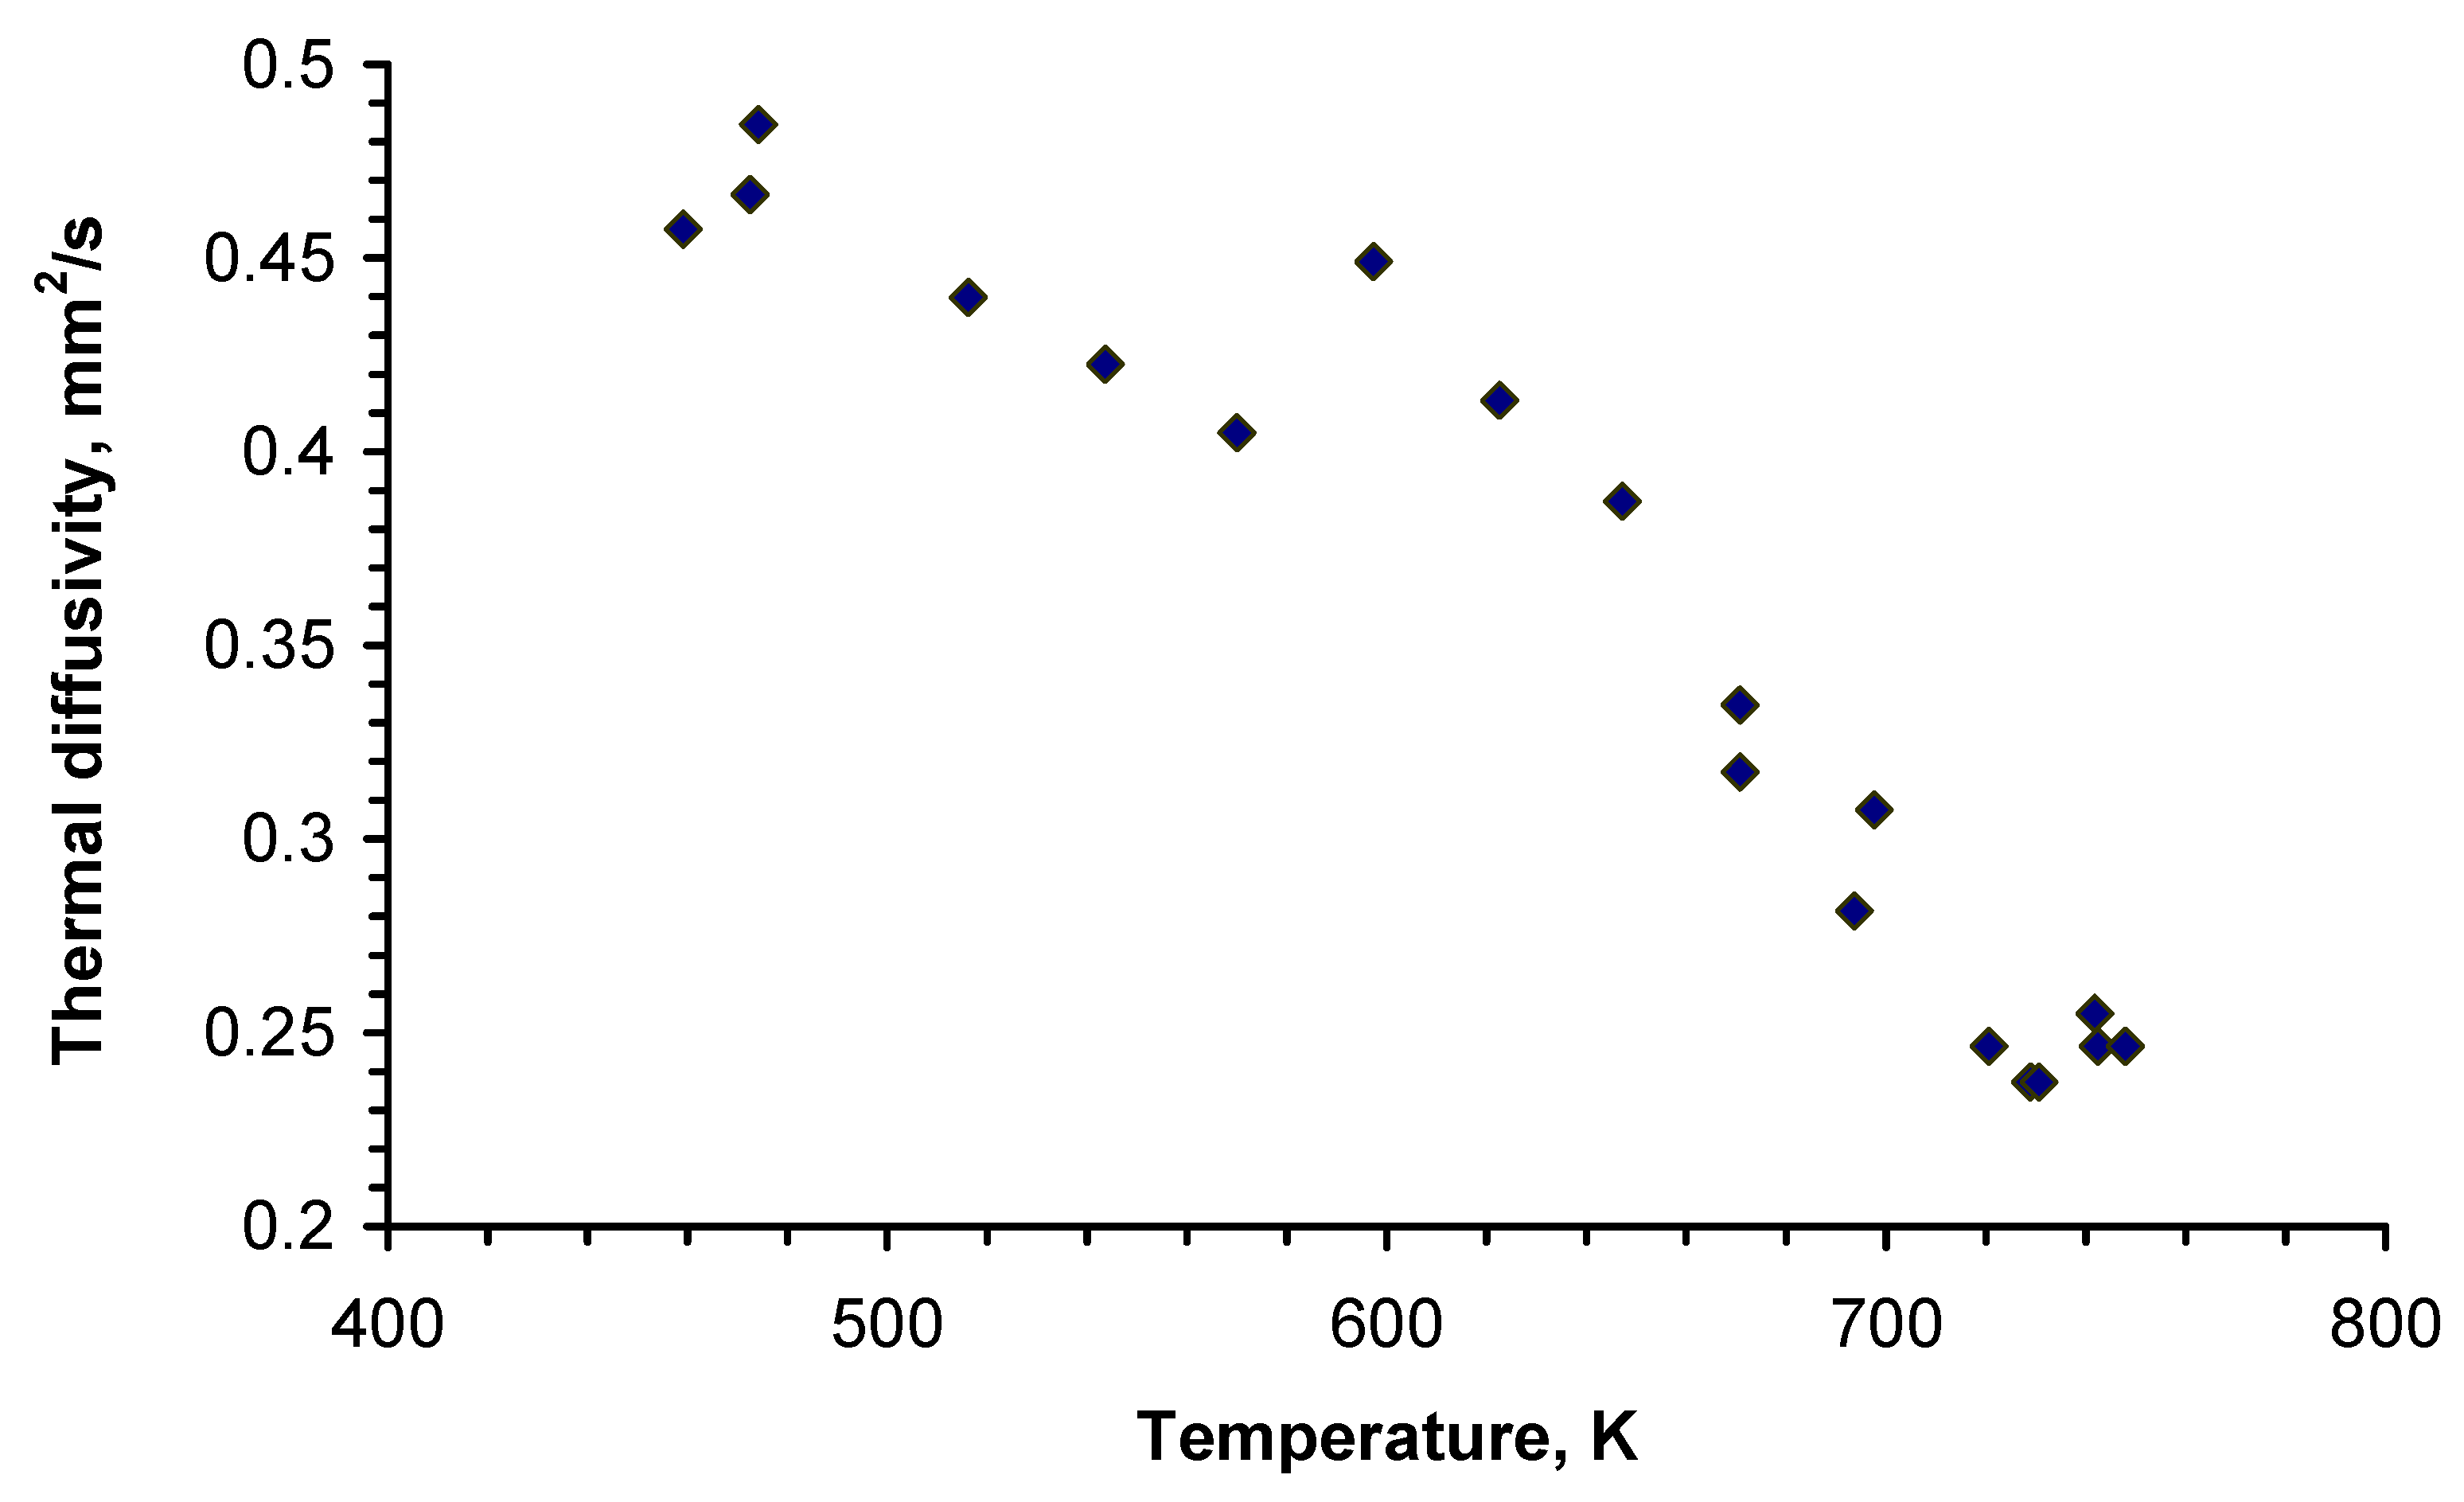
The thermal diffusivity values of Li
2BeF
4 shown in
Figure 1 were obtained under cooling mode, in which a gradual change in diffusivity was observed at the temperature interval 653–731 K. This corresponds to the undercooling conditions at cooling of sample [
4]. The sample under these conditions consists of solid and liquid phases, which is reflected in the resulting diffusivity. The change of thermal diffusivity in the temperature interval presented in
Figure 1 reflects the transition from a solid to a molten state. Li
2BeF
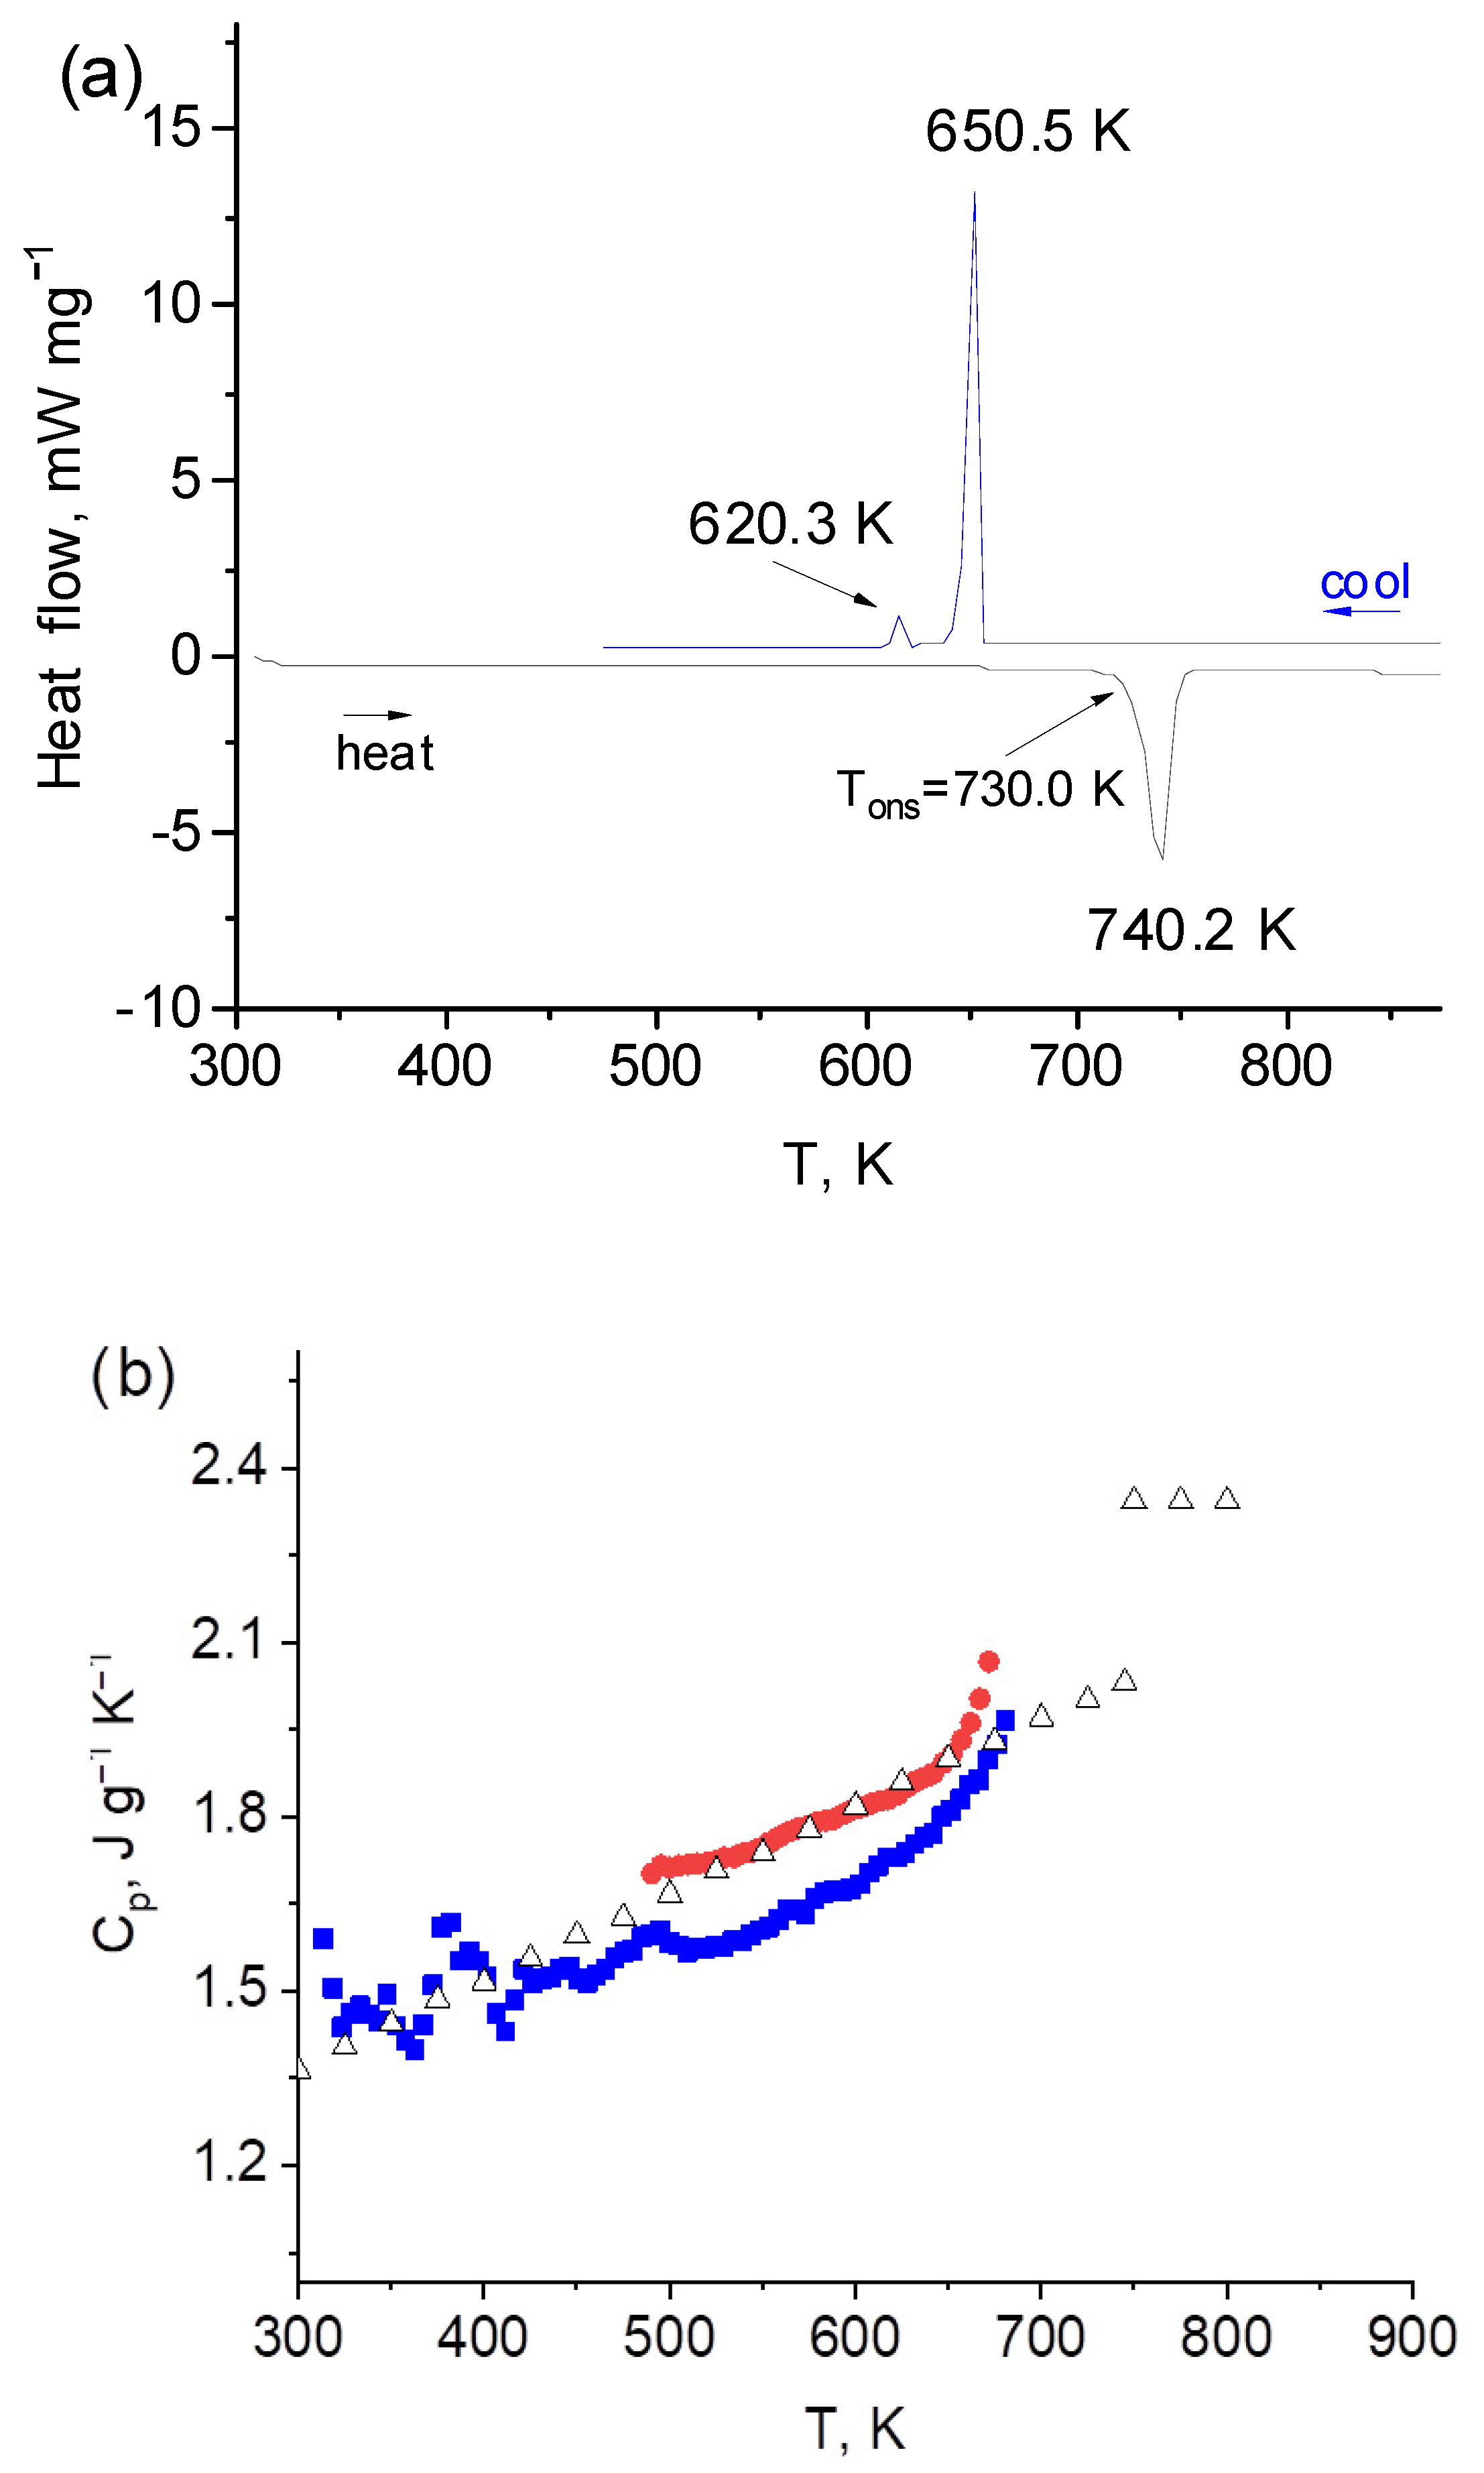
4 is solid in the temperature interval up to 650 K. In the temperature interval 650–723 K, a heterophase system is observed, while above 723 K, the sample is in a molten state. DSC curves of the studied system are shown in
Figure 2a. On heating, only the solidus line was observed at 730 K, which is in good agreement with literature data [
6]. The first peak on cooling corresponds to the melting point of the eutectic composition 45LiF-55BeF
2 (T = 651 K [
4]). The second peak at 620.3 K corresponds to the phase transition to a solid state. Since the Li
2BeF
4 compound is decomposed at melting, there is no crystallizing component at the freezing point. Rather, this begins to appear during further cooling to produce a solid phase; thus, the system is two-component until complete crystallization.
Our data for the liquid state are in good agreement (within 5%) with the results obtained by Kato [
1]. The diffusivity for the solid state is close to a constant value. This is in accordance with diffusivity data for solid salts, where a rapid decrease of diffusivity at low temperatures changes to very slow pace at higher temperatures [
14].
In order to calculate thermal conductivity from thermal diffusivity results heat capacity and density data are needed. Heat capacity (C
p) was measured for temperatures 473–773 K. There is some difference between values obtained in heating and cooling modes, but the difference is within uncertainty interval. The values obtained at cooling are very close to those of Douglas and Paine [
6]. In cooling mode, the solidus point moves to 650 K due to overcooling. In case of overcooling there is two-phase region between the equilibrium and non-equilibrium melting point [
15]. In our case, the heterophase region is in the interval 650–730 K (
Figure 2a). Heat capacity results are given in
Figure 2b. The obtained data below 650 K were approximated by the Equation:
where T is temperature, K.
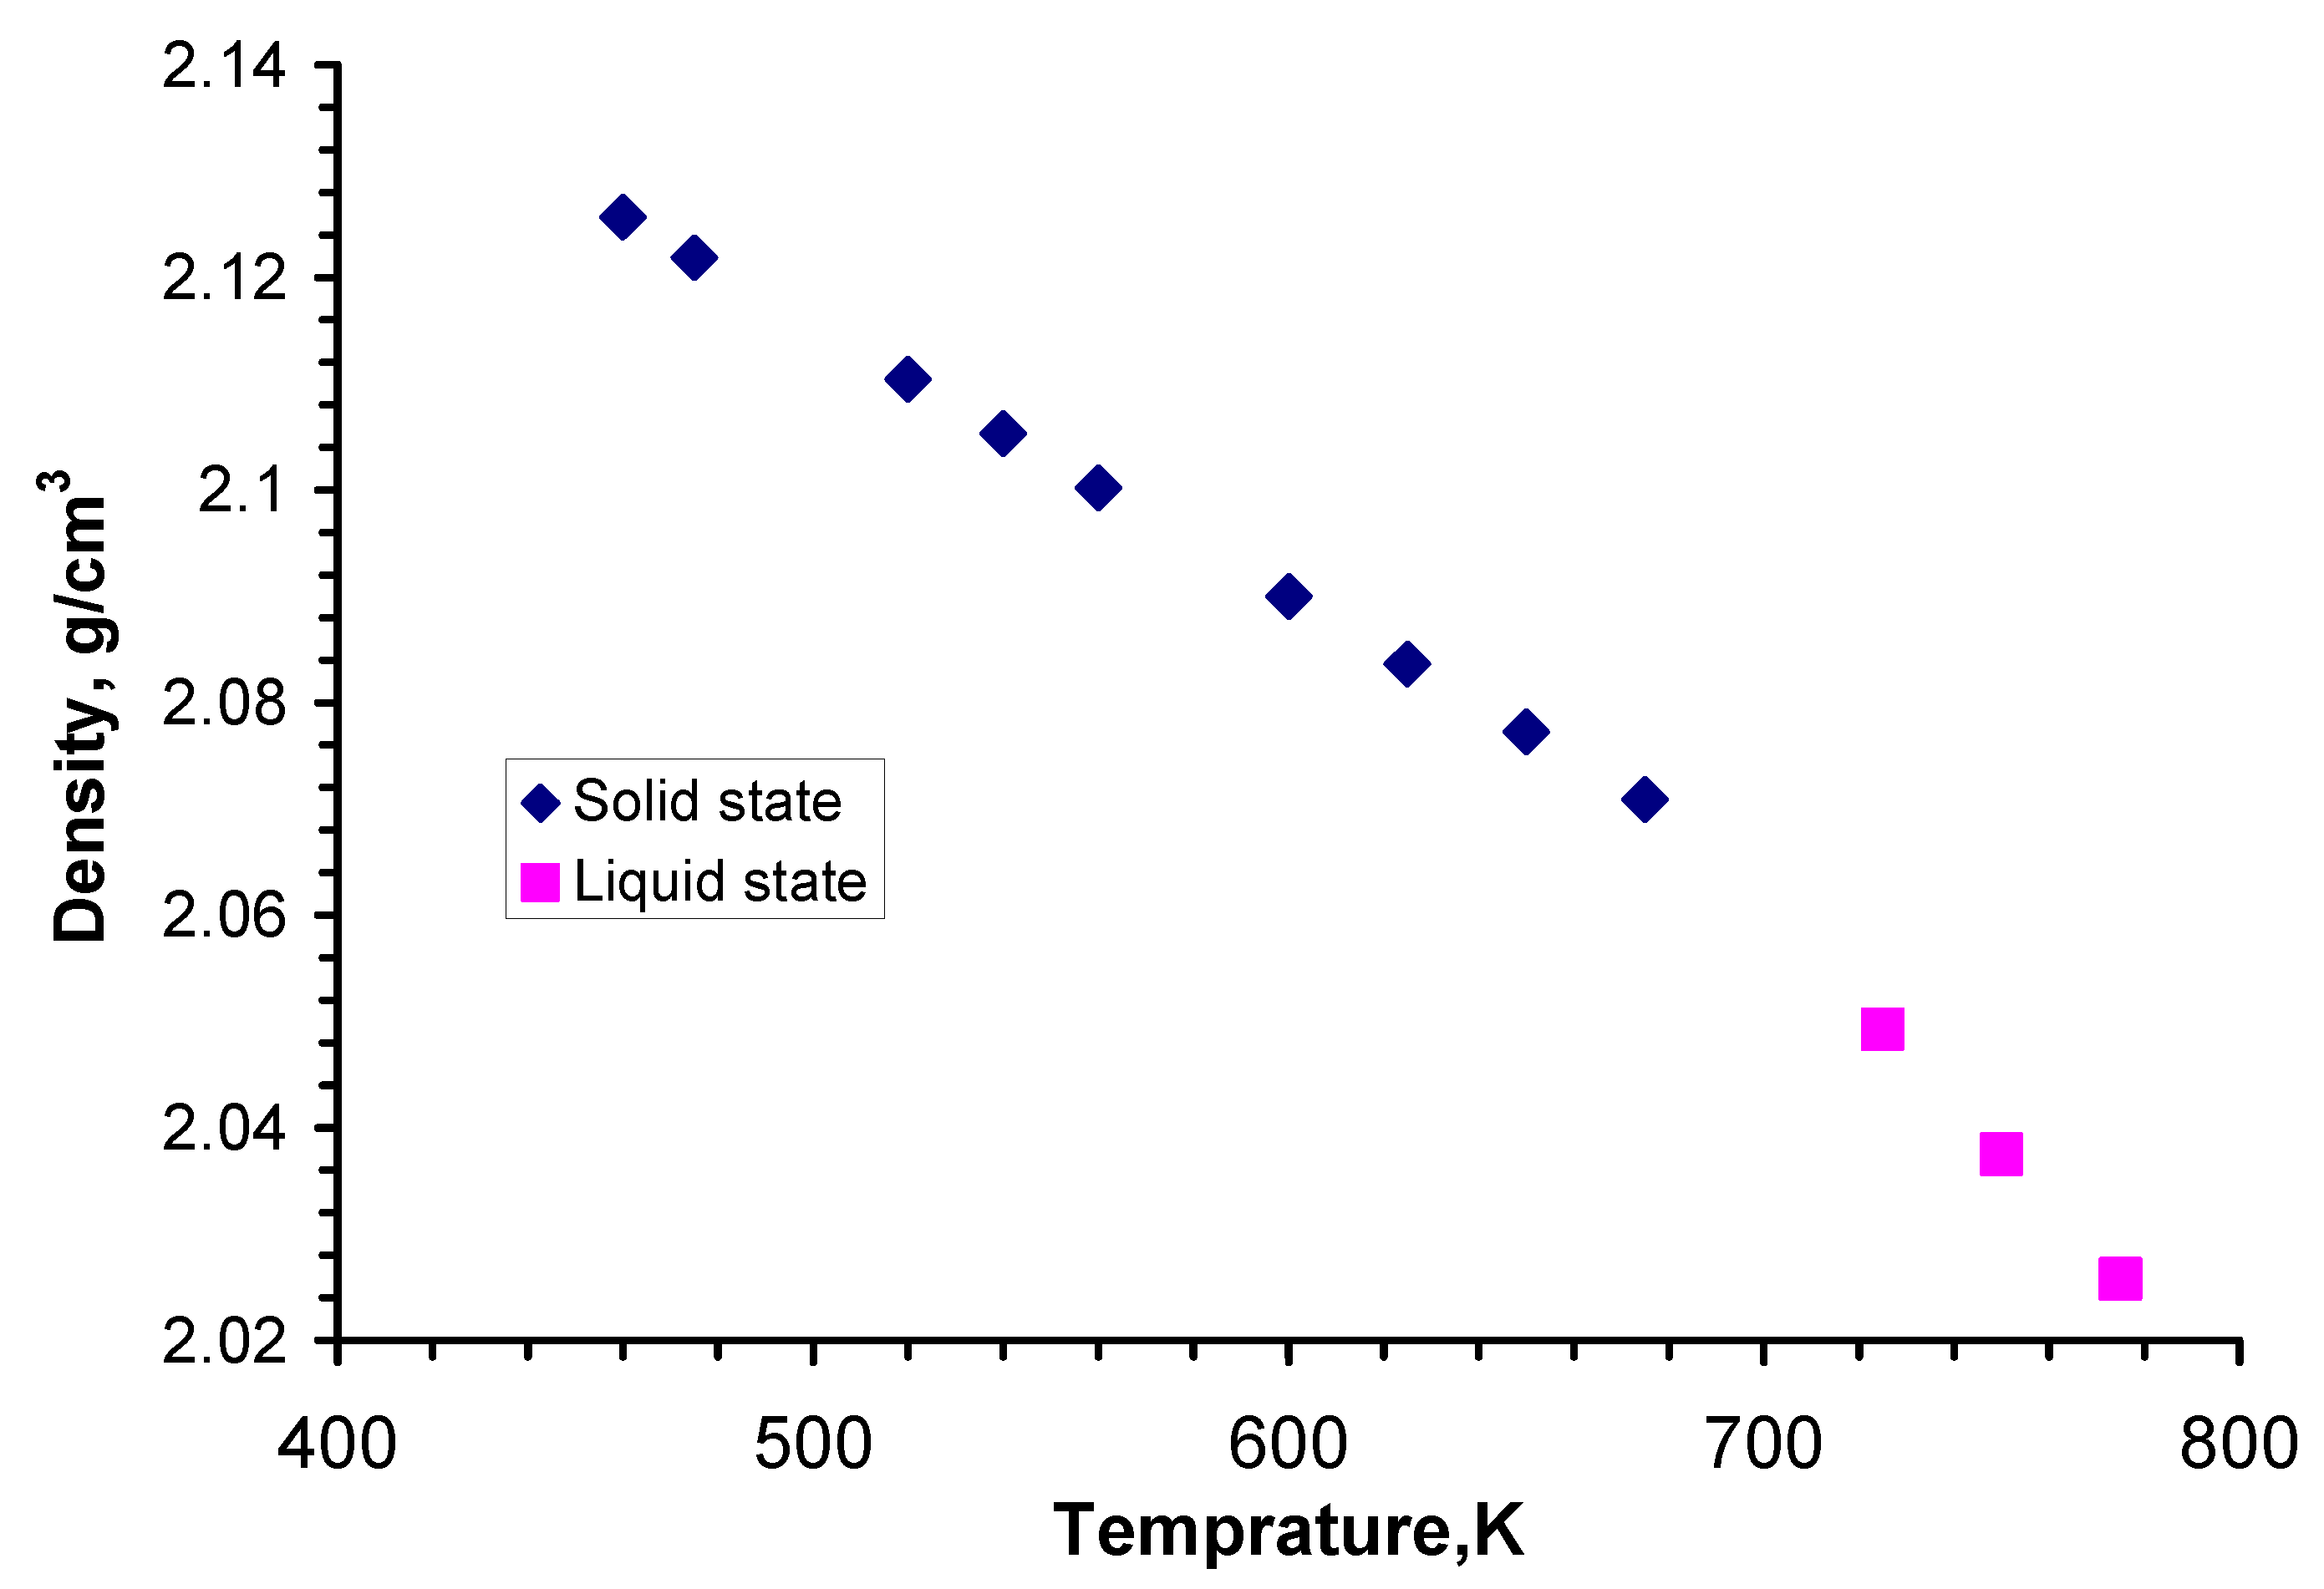
The density measurements of the Li
2BeF
4 compound in a molten state were performed in the temperature interval 723–1073 K [
5]. The results of this work are close to the values given in [
16,
17]. The dependence of the temperature on density for Li
2BeF
4 in a solid state is given in [
8]. The data for liquid and solid Li
2BeF
4 are shown in
Figure 3. No significant fall in density at phase transition is observed; only the temperature dependence is different.
Thermal conductivity (λ) was calculated on the basis of diffusivity (a), heat capacity (C
p), and density (ρ) data according to the Equation:
Data on density in a solid state were taken from [
8], while those pertaining to the liquid state were taken from our previous work [
5]. Heat capacity in a solid state was calculated from Equation (2); for a liquid state, the data from our previous work [
5] were used. The calculated thermal conductivity values are given in
Table 1 and shown in
Figure 4. Here, three different areas are visible. In the first, which corresponds to a solid state, thermal conductivity is almost constant. At the heterogeneous region, a significant drop in thermal conductivity can be distinguished, which ends with the full transformation of the sample into liquid state. According to our previous investigation of the melting behavior of Li
2BeF
4, the melting point at cooling moves to a lower temperature due to the overcooling phenomenon. This means that in the temperature range 653–733 K, both solid and liquid phases coexist, while the thermal conductivity is a combination of solid and liquid conductivity elements. Therefore, it is possible that the values obtained at this temperature interval reflect the relation between solid and liquid phases existing under non-equilibrium conditions.
There are very few investigations on changes in thermal conductivity at the solid-liquid transition. Although thermal conductivity typically drops significantly, there are not enough data to make a reasonable conclusion about the value of such changes [
18,
19,
20].
The obtained values for a liquid state are close to those obtained by Kato [
1] and Cooke [
3]. Taking into consideration that the uncertainty in the measurement of thermophysical properties is significant, the thermal conductivity value of the Li
2BeF
4 compound following melting is in the interval 1.1–1.2 W m
−1 K
−1. This represents a high conductivity for molten salt mixtures, since the values for most individual molten salts are in the interval 0.3–1 W m
−1 K
−1 above melting point [
21,
22]. This means that the investigated salt mixture will be an efficient medium for the transfer of thermal energy in a molten salt reactor.


 ,
, 


