Article

Application of the Triangular Spatial Relationship Algorithm in Representing and Quantifying Conformational Changes in Chlorophylls and Protein Local Environments

by
Tarikul I. Milon
1,
Khairum H. Orthi
1,
Krishna Rauniyar
1,2,
Rhen M. Renfrow
1,
August A. Gallo
1 and
Wu Xu
1,*
1
Department of Chemistry, University of Louisiana at Lafayette, P.O. Box 44370, Lafayette, LA 70504, USA
2
The Center for Advanced Computer Studies, University of Louisiana at Lafayette, Lafayette, LA 70504, USA
*
Author to whom correspondence should be addressed.
Photochem 2025, 5(1), 8; https://doi.org/10.3390/photochem5010008
Submission received: 31 December 2024 / Revised: 9 March 2025 / Accepted: 13 March 2025 / Published: 17 March 2025

Abstract

:
Chemically identical chlorophyll (Chl) molecules undergo conformational changes when they are embedded in a protein matrix. The conformational changes will modulate their absorption spectra to meet the need for programmed excitation energy transfer or electron transfer. To interpret spectroscopic data using the knowledge of pigment–protein interactions requires a single pigment embedded in one polypeptide matrix. Unfortunately, most of the known photosynthetic systems contain a set of multiple pigments in each protein subunit. This makes it complicated to interpret spectroscopic data using structural data due to the potential overlapping spectra of two or more pigments. Chl–protein interactions have not been systematically studied to answer three fundamental questions: (i) What are the structural characteristics and commonly shared substructures of different types of Chl molecules (e.g., Chl a, b, c, d, and f)? (ii) How many structural groups can Chl molecules be divided into and how are different structural groups influenced by their surrounding environments? (iii) What are the structural characteristics of pigment surrounding environments? Having no clear answers to the unresolved questions is probably due to a lack of computational methods for quantifying conformational changes in individual Chls and individual surrounding amino acids. The first version of the Triangular Spatial Relationship (TSR)-based method was developed for comparing protein 3D structures. The input data for the TSR-based method are experimentally determined 3D structures from the Protein Data Bank (PDB). In this study, we take advantage of the 3D structures of Chl-binding proteins deposited in the PDB and the TSR-based method to systematically investigate the 3D structures of various types of Chls and their protein environments. The key contributions of this study can be summarized as follows: (i) Specific structural characteristics of Chl d and f were identified and are defined using the TSR keys. (ii) Two and three clusters were found for various types of Chls and Chls a, respectively. The signature structures for distinguishing their corresponding two and three clusters were identified. (iii) Histidine residues were used as an example for revealing structural characteristics of Chl-binding sites. This study provides evidence for the three unresolved questions and builds a structural foundation through quantifying Chl conformations as well as structures of their embedded protein environments for future mechanistic understanding of relationships between Chl–protein interactions and their corresponding spectroscopic data.

1. Introduction

Life on planet Earth is sustained to a large extent by oxygenic photosynthesis. Oxygenic photosynthesis is a process in which higher plants, eukaryotic algae, and cyanobacteria convert CO2 to chemical forms of energy and produce O2 utilizing sunlight to power the entire biological world [1,2]. In the first steps of oxygenic and anoxygenic photosynthesis, light is absorbed by pigments including chlorophylls (Chls), bacteriochlorophylls (BChls), and carotene derivatives, which transfer excitation energy to the reaction center (RC), where charge separation occurs [3,4]. The protein environment influences the excited-state energy level of the pigments leading to absorption peaks (red- or blue-shifts) and broadening of their absorption and emission spectra depending on the specific interactions [3,4]. Those known to affect the pigment’s electronic properties include (i) axial coordination to the central Mg2+ ion [5,6,7,8], (ii) hydrogen bonding [9,10,11,12,13,14,15,16,17], (iii) electrostatic interactions with charged, aromatic residues or nonaromatic residues [5,18,19,20], and (iv) changes in Chl conformation [20,21,22,23]. Studies show that small changes in the protein can have a large effect on the properties of the pigments [3,19,24,25,26]. However, the effects of protein environments on Chl conformational changes have not been systematically studied, probably due to a lack of computational methods that have the capacity to detect and quantify subtle structural changes in Chls or amino acids.
The Triangular Spatial Relationship (TSR)-based method was developed for comparing protein 3D structures [27] and probing drug and target interactions [28]. The input data for the TSR-based method are experimentally determined 3D structures from the Protein Data Bank (PDB) [29]. The first version of the TSR-based method creates triangles with the Cα atoms of proteins as vertices. Triangles are constructed for every combination of three amino acids of a protein structure. A TSR key (an integer) is computed using geometric features such as length, angle, and vertex labels. Labels are determined by a rule-based assignment, which ensures consistent assignment of keys to identical TSRs across proteins, hence allowing a simpler but exact representation of protein structures [27]. Representation of 3D structures by TSR keys has its unique advantage of searching for similar substructures across structure datasets using keys (integers) as the query.
In this study, we take advantage of the 3D structures of pigment-binding proteins deposited in the PDB and the TSR-based method to understand the structural foundation of how protein environments affect pigment conformational changes. To achieve a mechanistic understanding of pigment–protein interactions, we have prepared a 3D structure dataset that contains nearly all available Chl-containing proteins in the PDB. Specifically, we aim to answer three unresolved questions through a comprehensive computational study: (i) Question #1: What are the structural characteristics and commonly shared substructures of different types of Chl molecules (e.g., Chl a, b, c, d, and f) (Figure 1a)? Identification and quantification of specific and common substructures will provide insight into pigment functions. Structures of Chl a and Chl b are similar but different. Due to such a structural difference, the absorption maxima of Chl a are at 430 nm and 662 nm, and Chl b has peaks located at 453 nm and 642 nm when they were extracted in diethyl ether [30]. In the protein setting, it has been reported that the common substructure motifs among different protein folds are of critical importance for predicting their biological functions [31]. (ii) Question #2: How many structural groups can Chl molecules be divided into? How are different structural groups influenced by their surrounding environments (Figure 1b)? It was reported that the formyl group substitutions on the side chains of Chl a result in the different absorption properties of Chl b, Chl d, and Chl f [32]. It is also reported that proteins have the intriguing ability to alter the optical properties of pigments [3]. However, it is largely unknown how similar and different certain types of Chl 3D structures (for instance, conformations of Chls a with an identical 2D structure) are when they are compared with other types of Chl molecules, for example, BChl, Chl b, Chl c, Chl d, and Chl f. For the same type of Chl molecules, e.g., Chl a, 3D structural similarity and difference of Chls a at different protein environments have also not been investigated or researched thoroughly. (iii) Question #3: What are the structural characteristics of pigment surrounding environments (Figure 1c)? Protein environments can cause structural changes in a pigment. Conversely, a pigment can also induce protein conformational changes. Protein conformational changes induced by the binding of a pigment have not been systematically studied. In this study, we were able to demonstrate the conformational changes in pigments as well as conformational changes in protein local environments. Absorption spectra of most individual Chl molecules embedded in proteins are not available. If such absorption spectra are available, those spectra data could be formulated as functional descriptors. Functional descriptors and TSR-based structural descriptors can be integrated in the future for predicting the absorption spectrum for a given Chl molecule embedded in a specific protein environment.

2. Results

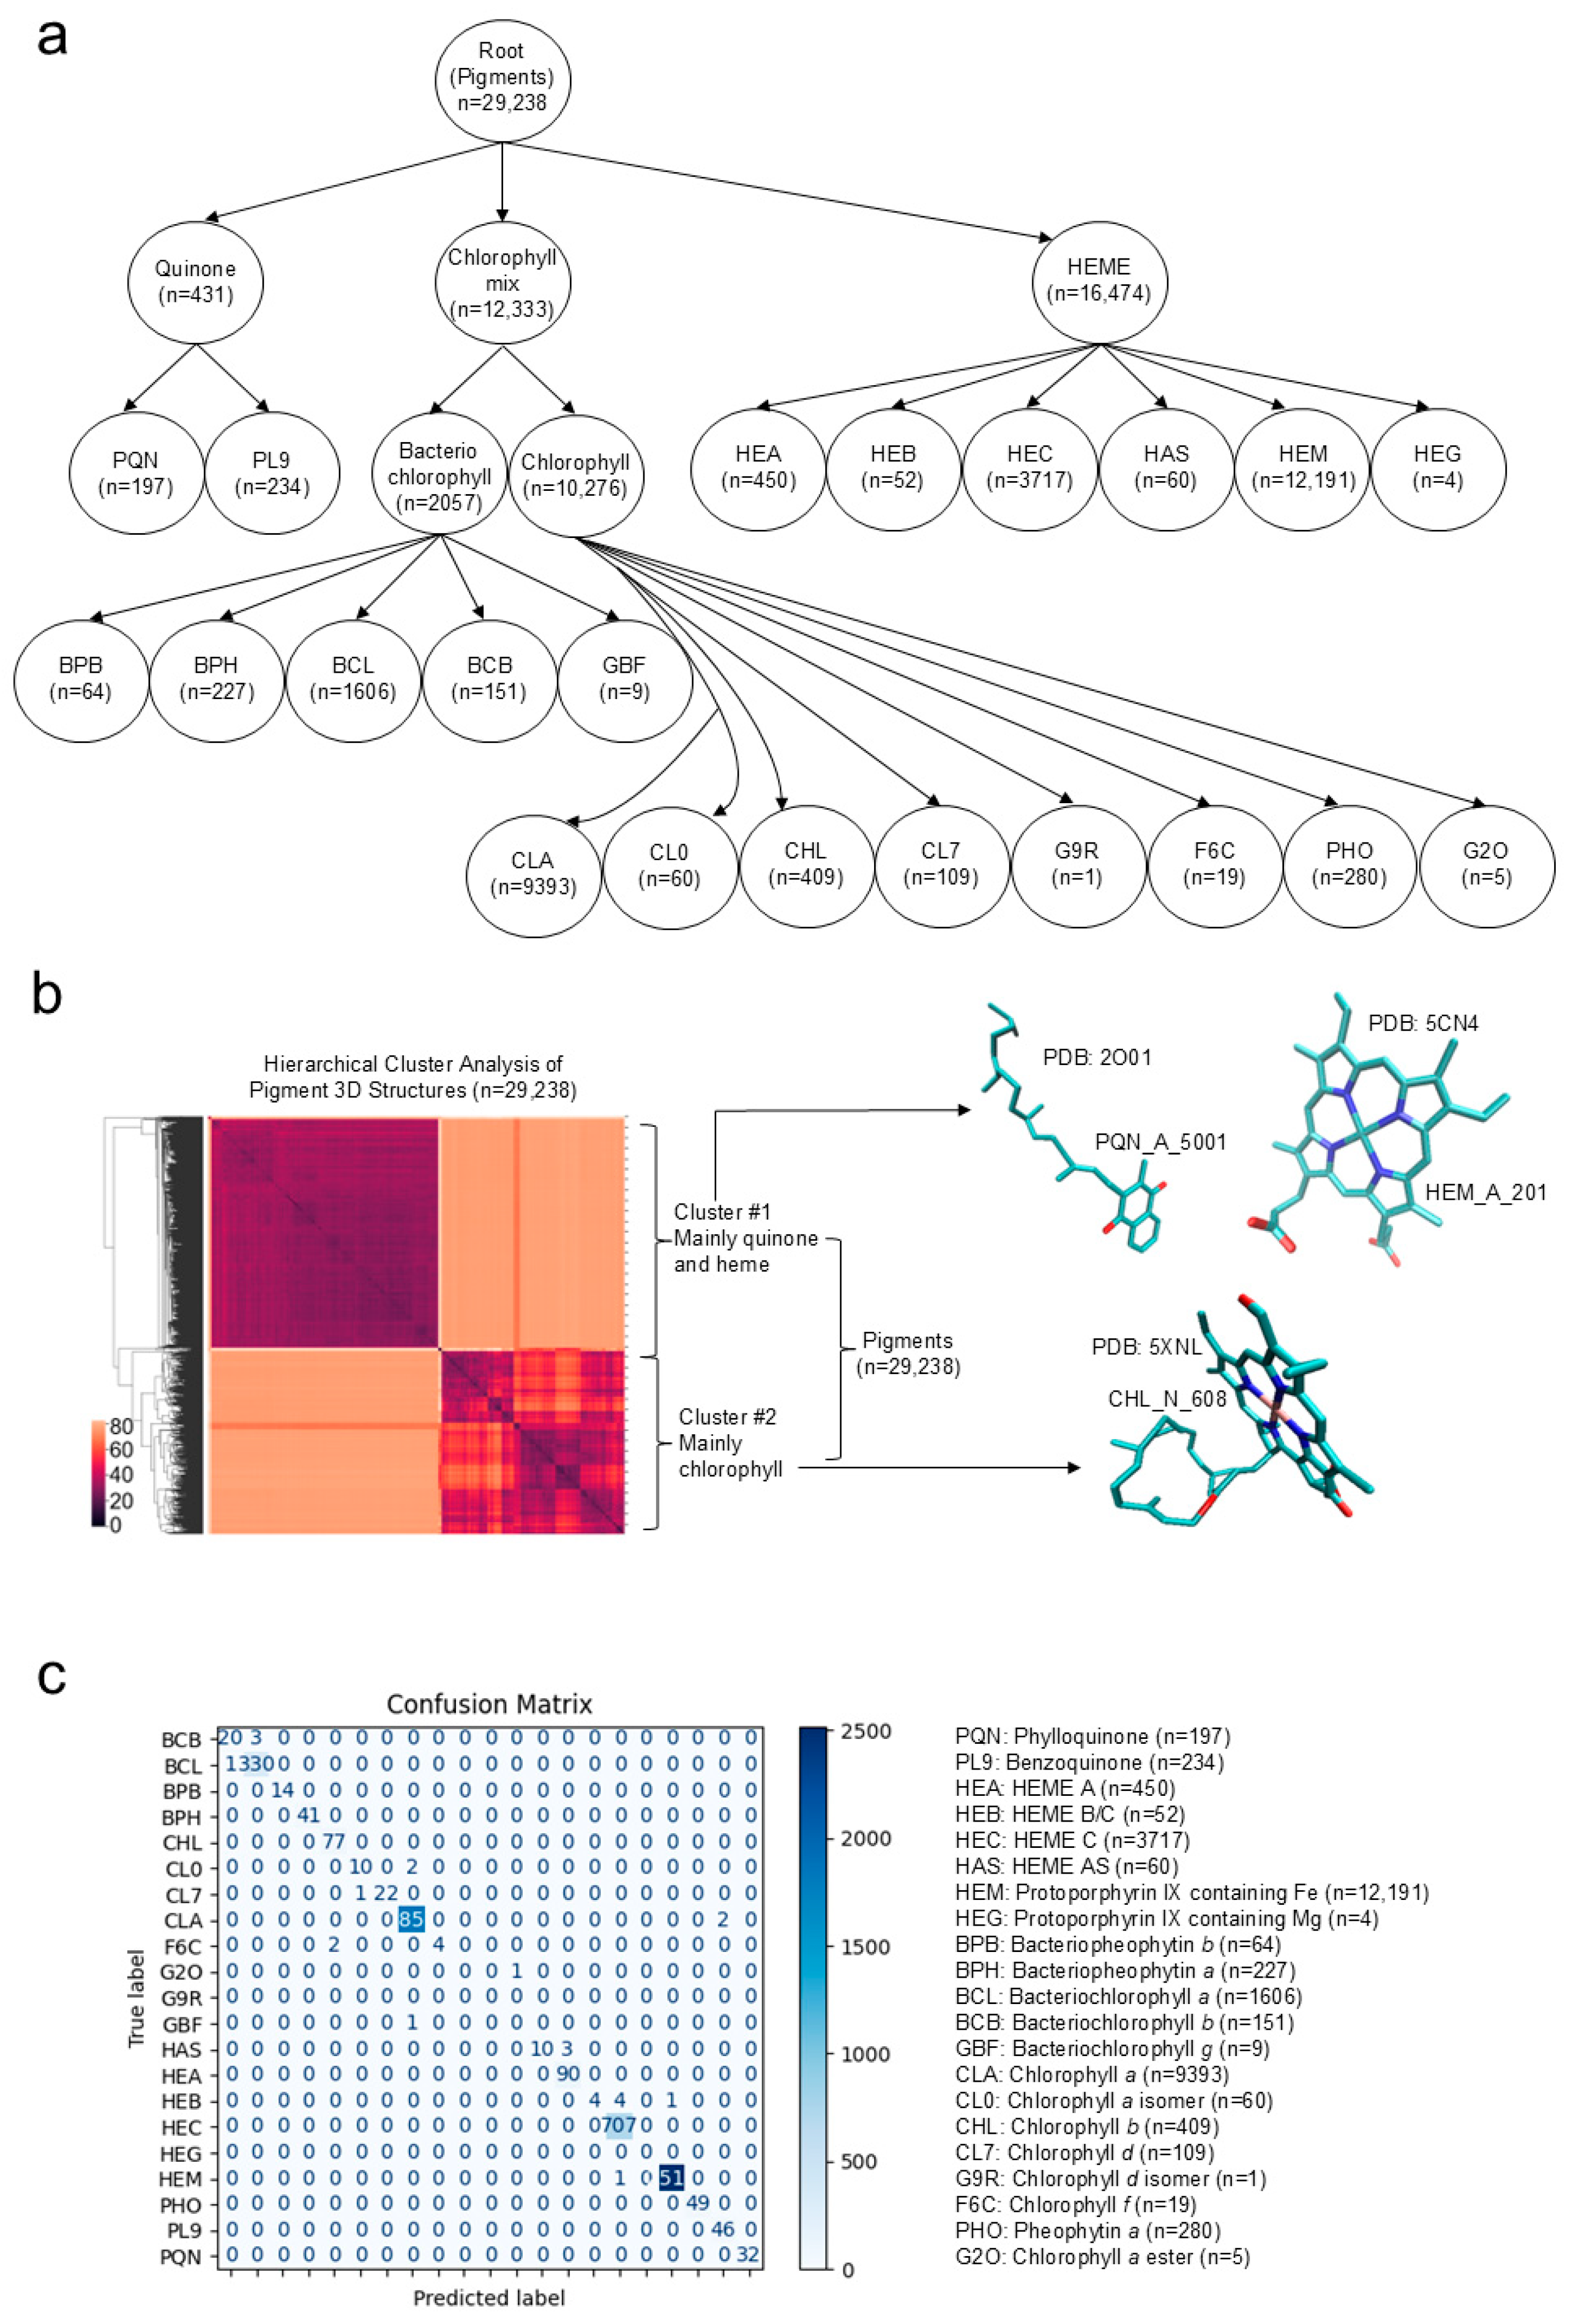
2.1. A Unique Approach to Represent 3D Structures of Pigments and an Evaluation of the Representation by Unsupervised and Supervised Machine Learning Approaches

We developed a unique representation of pigment 3D structures. To evaluate this representation, we prepared a dataset containing all types of Chl molecules. Heme molecules also have a porphyrin ring analogous to Chl molecules [33,34,35]. Porphyrin rings of heme and Chl are the most abundant and are essential components of critical biological processes such as respiration and photosynthesis across all kingdoms of life [34]. Porphyrin rings have often been described as the pigments of life [35]. Quinone molecules play an important role as a redox cofactor in photosystems [36,37]. Therefore, we included different types of heme and quinone molecules in the dataset (Supplementary Materials, File S1). A total of 29,238 pigment 3D structures were arranged in a hierarchical relationship based on their functional classification (Figure 2a). Level 1 includes three nodes: Quinone, Chl, and HEME (Figure 2a). Quinone, Chl, and HEME molecules were further classified into phylloquinone (PQN) and benzoquinone (PL9); bacteriochlorophyll and chlorophyll; and heme A (HEA), heme B/C (HEB), heme C (HEC), heme AS (HAS), protoporphyrin IX containing Fe (HEM), and protoporphyrin IX containing Mg (HEG) at level 2, respectively (Figure 2a). Bacteriochlorophyll and chlorophyll molecules were divided into different subtypes at level 3 (Figure 2a). Oxygenic photosynthetic organisms use Chls as their major photosynthetic pigment [38]. In contrast, all known anoxygenic eubacteria use BChls [38]. The overall structures of BChls and Chls are similar. However, they differ in the substitutions around the porphyrin ring and in the substitutions and length on the phytol tail. Commonly shared substructures between BChls and Chls and specific substructures exclusively belonging to either BChls or Chls have not been reported. The structural differences affect the specific wavelength of light that Chls and BChls absorb. Chl a and b absorb red light around 680 nm and 660 nm, respectively, while BChl a and b absorb infrared radiation in the range of 800 nm to 900 nm [39,40,41].
To evaluate the representation of pigment 3D structures using the TSR keys, we have used unsupervised and supervised machine learning approaches to study the large pigment dataset. The hierarchical clustering (unsupervised) result shows that the TSR-based method can distinguish the majority of the heme molecules from the majority of the Chl molecules (Figure 2b). Exceptions where heme molecules are clustered with BChl or Chl molecules are observed, suggesting that a certain type of heme molecules (e.g., HAS) are structurally more similar to (B)Chl molecules than other types of heme molecules. The unsupervised machine learning cannot clearly distinguish HASs from (B)Chls and vice versa. Thus, we decided to use a supervised learning approach. The Deep Neural Network (DNN) classification (supervised) model performed exceptionally well (Figure 2c) with an accuracy of 1.00 on the same dataset, suggesting the DNN model can capture the intricate patterns of pigments using TSR keys as the features.

2.2. Structural Characteristics of Chl d and Chl f and Effects of Protein Environments on Different Types of Chl Molecules and Chl a Molecules

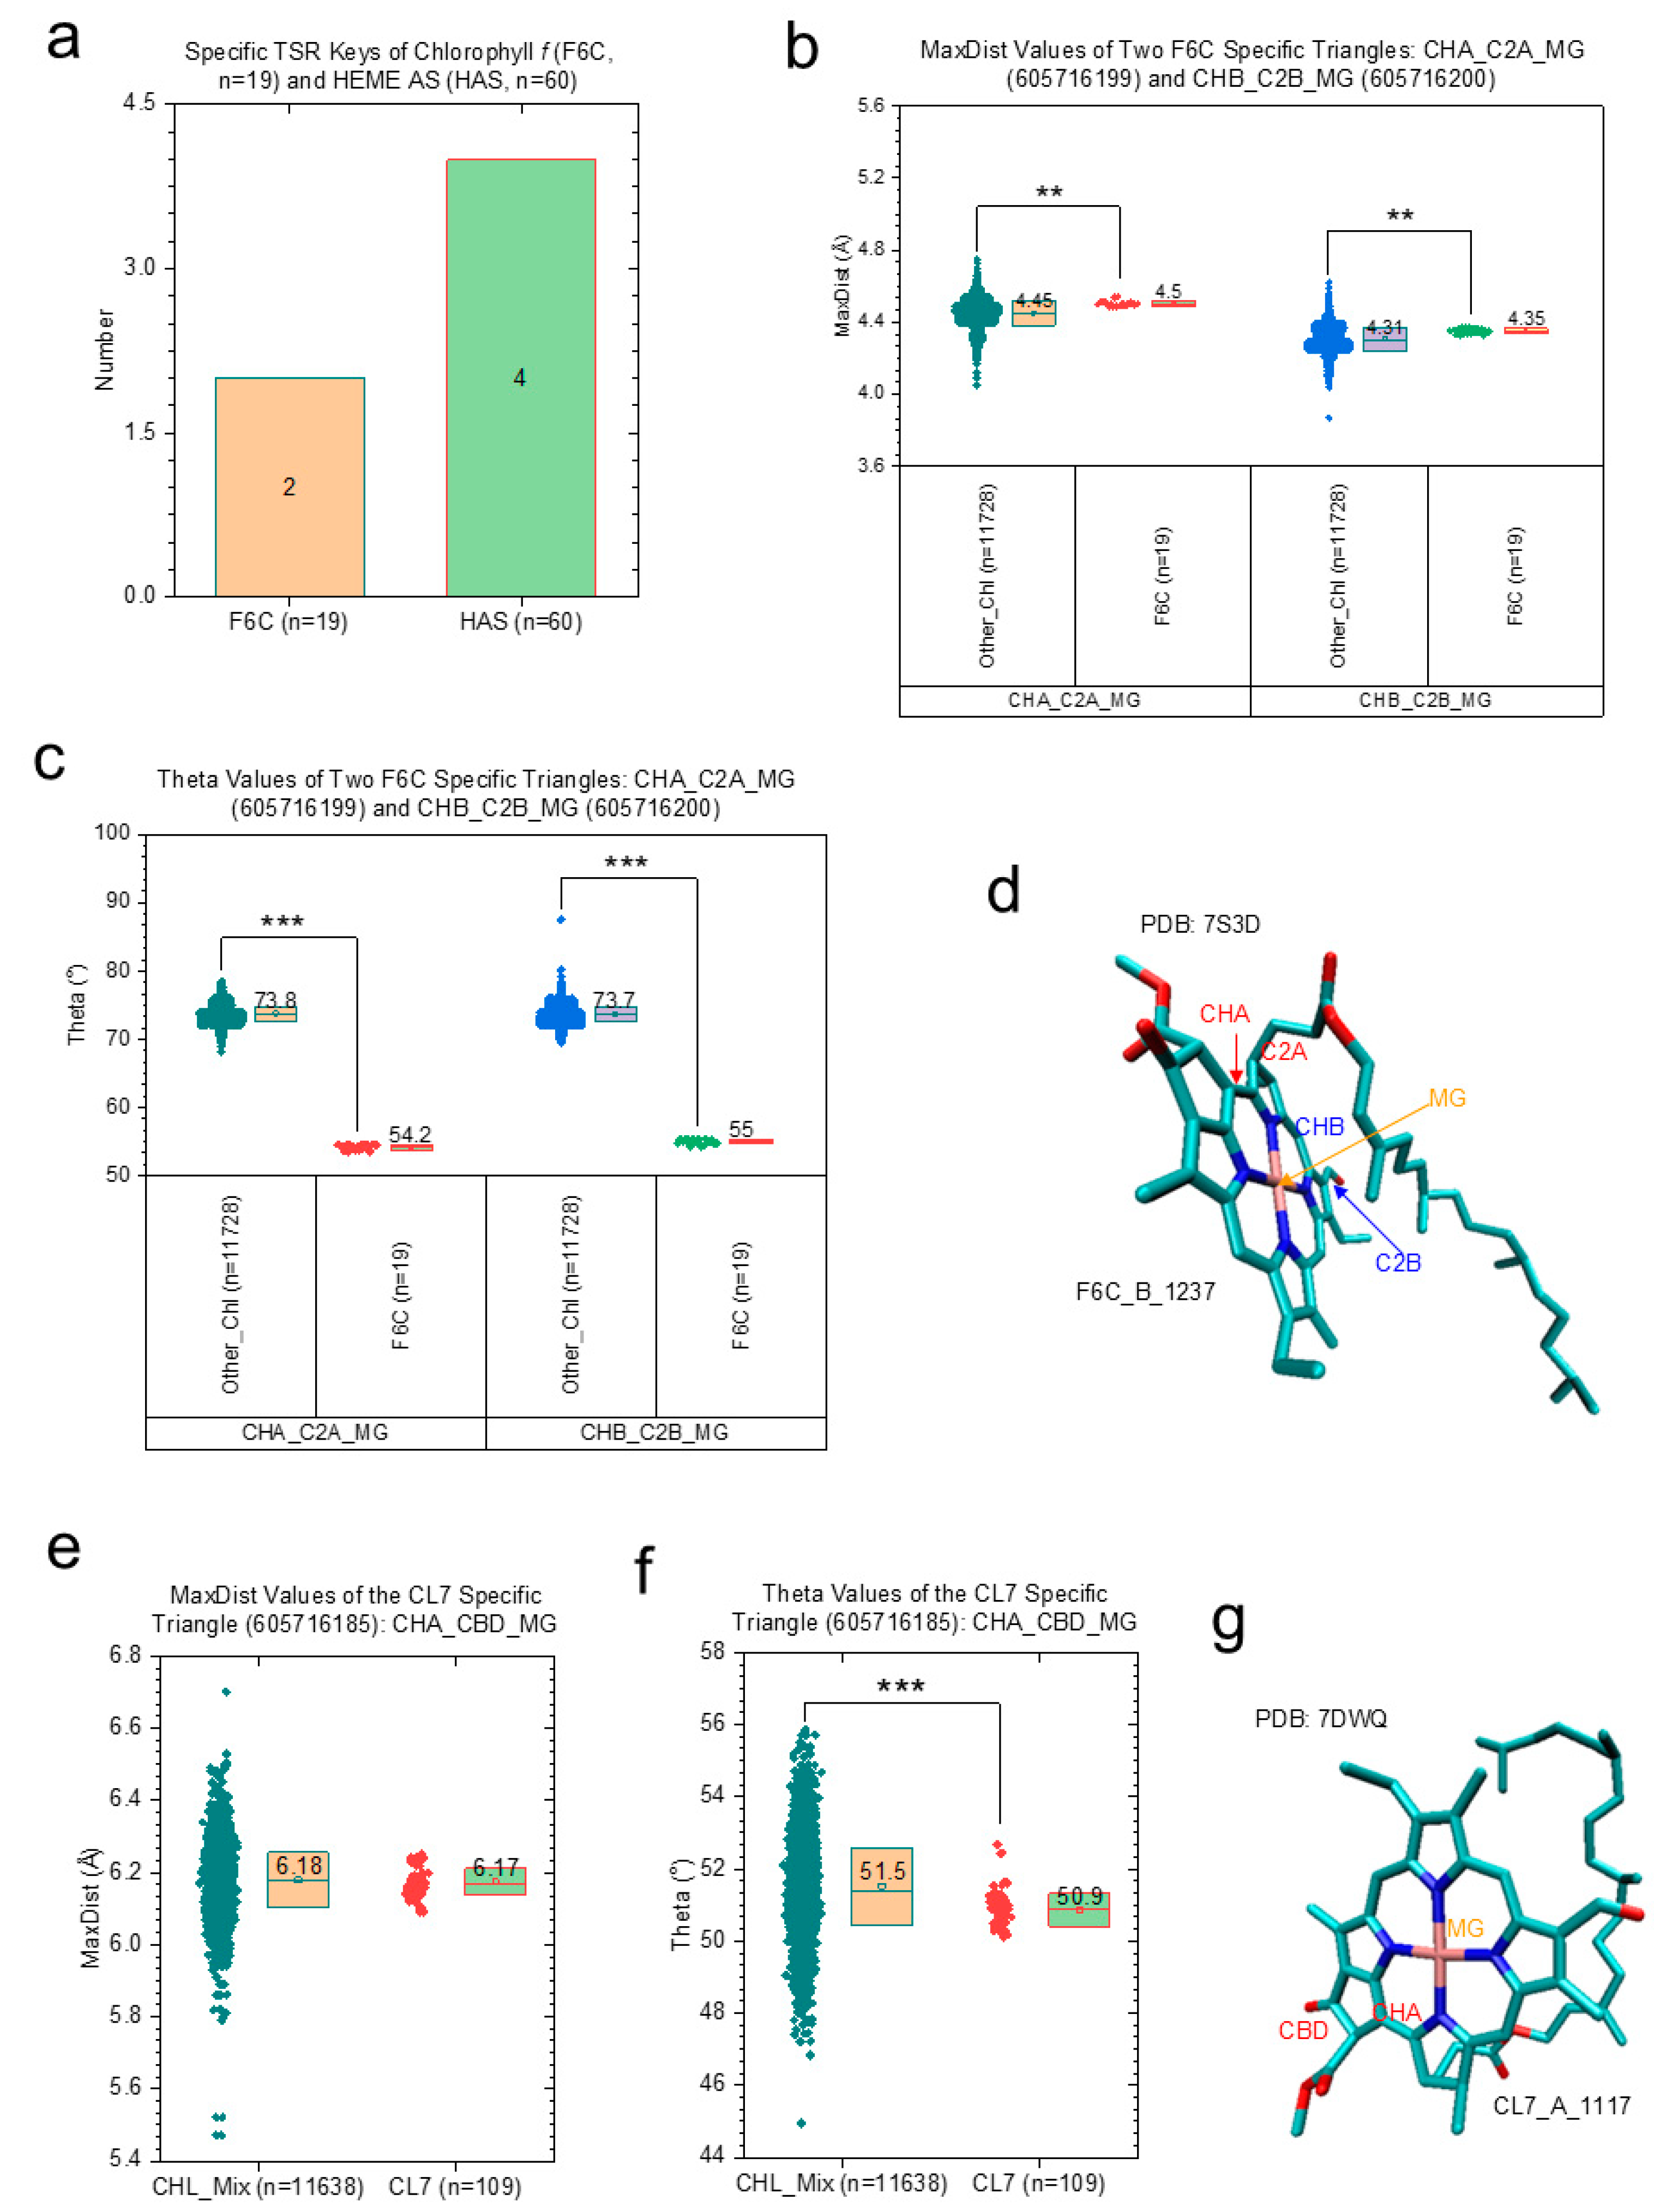
2.2.1. Structural Characteristics of Chl d and Chl f

Most terrestrial plants use Chls a and b to construct pigment–protein complexes [42,43,44,45,46]. In contrast, marine organisms possess a range of Chls (e.g., Chls a, b, c1, c2, c3, d, and f) to acclimate to the prevailing blue–green light that is found at greater depths [4]. Chl a, Chl a’, Chl d, Chl d’, and pheophytin were found in the RC of photosystem I. Chl a(d) and Chl a’(d’) differ in one asymmetric carbon with two different configurations. The presence of the red-shifted Chl d was first found in the RC of the photosystems of the Acaryochloris marina [47]. Compared with the molecular structure of Chl a, Chl d possesses a formyl group at the 3 position of the chlorin macrocycle ring instead of a vinyl group at this position for Chl a. This difference induces a large red-shift of the monomeric Qy absorption band of Chl d compared with the Qy band of Chl a [48]. Some cyanobacteria use Chl d to enrich in wavelengths >700 nm for trapping the long wavelength electronic excitation and convert it into chemical energy to allow them to survive in filtered and enriched light [42]. Chl f was discovered as a new form of Chl in cyanobacteria in 2010 [49]. Chl f chemically differs from Chl a through a substitution of the methyl group at the C-2 position by a formyl group [49]. This substitution causes a significant shift of the Qy absorption band from 670 nm to a longer wavelength of 706 nm in methanol [49]. Various species use different types of Chl molecules and culture conditions can change Chl compositions. For example, far-red light can alter gene expression [50] as well as induce the incorporation of Chl f molecules into photosystem I [51].
We were able to identify two specific TSR keys (605716199 and 605716200) exclusively only for Chl f and four specific TSR keys exclusively only for heme AS (Figure 3a) using the pigment dataset discussed for the cluster analysis (Figure 2a). The two triangles (CHA_C2A_MG and CHB_C2B_MG) of Chl f corresponding to the two specific TSR keys (605716199 and 605716200, respectively) have different MaxDist (Figure 3b) and Theta (Figure 3c) values compared with the all other types of Chls, indicating that the two triangles can be considered as specific substructural characteristics for presenting Chl f molecules. A representative Chl f structure is illustrated in Figure 3d. The atoms associated with the two triangles are labeled (Figure 3d). Similarly, we were able to identify a near-specific TSR key (605716185) for Chl d. This near-specific key means that the majority of the Chl d molecules, but not all, have this key. In addition, very few other types of Chls also have such keys. The triangle (CHA_CBD_MG) corresponding to the near-specific key of 605,716,185 has similar MaxDist values (Figure 3e) but different Theta values (Figure 3f) compared with all other types of Chls. This triangle is the structural characteristic for presenting Chl d 3D structures. A representative Chl d 3D structure is shown in Figure 3g and three atoms associated with this signature triangle are labeled (Figure 3g).

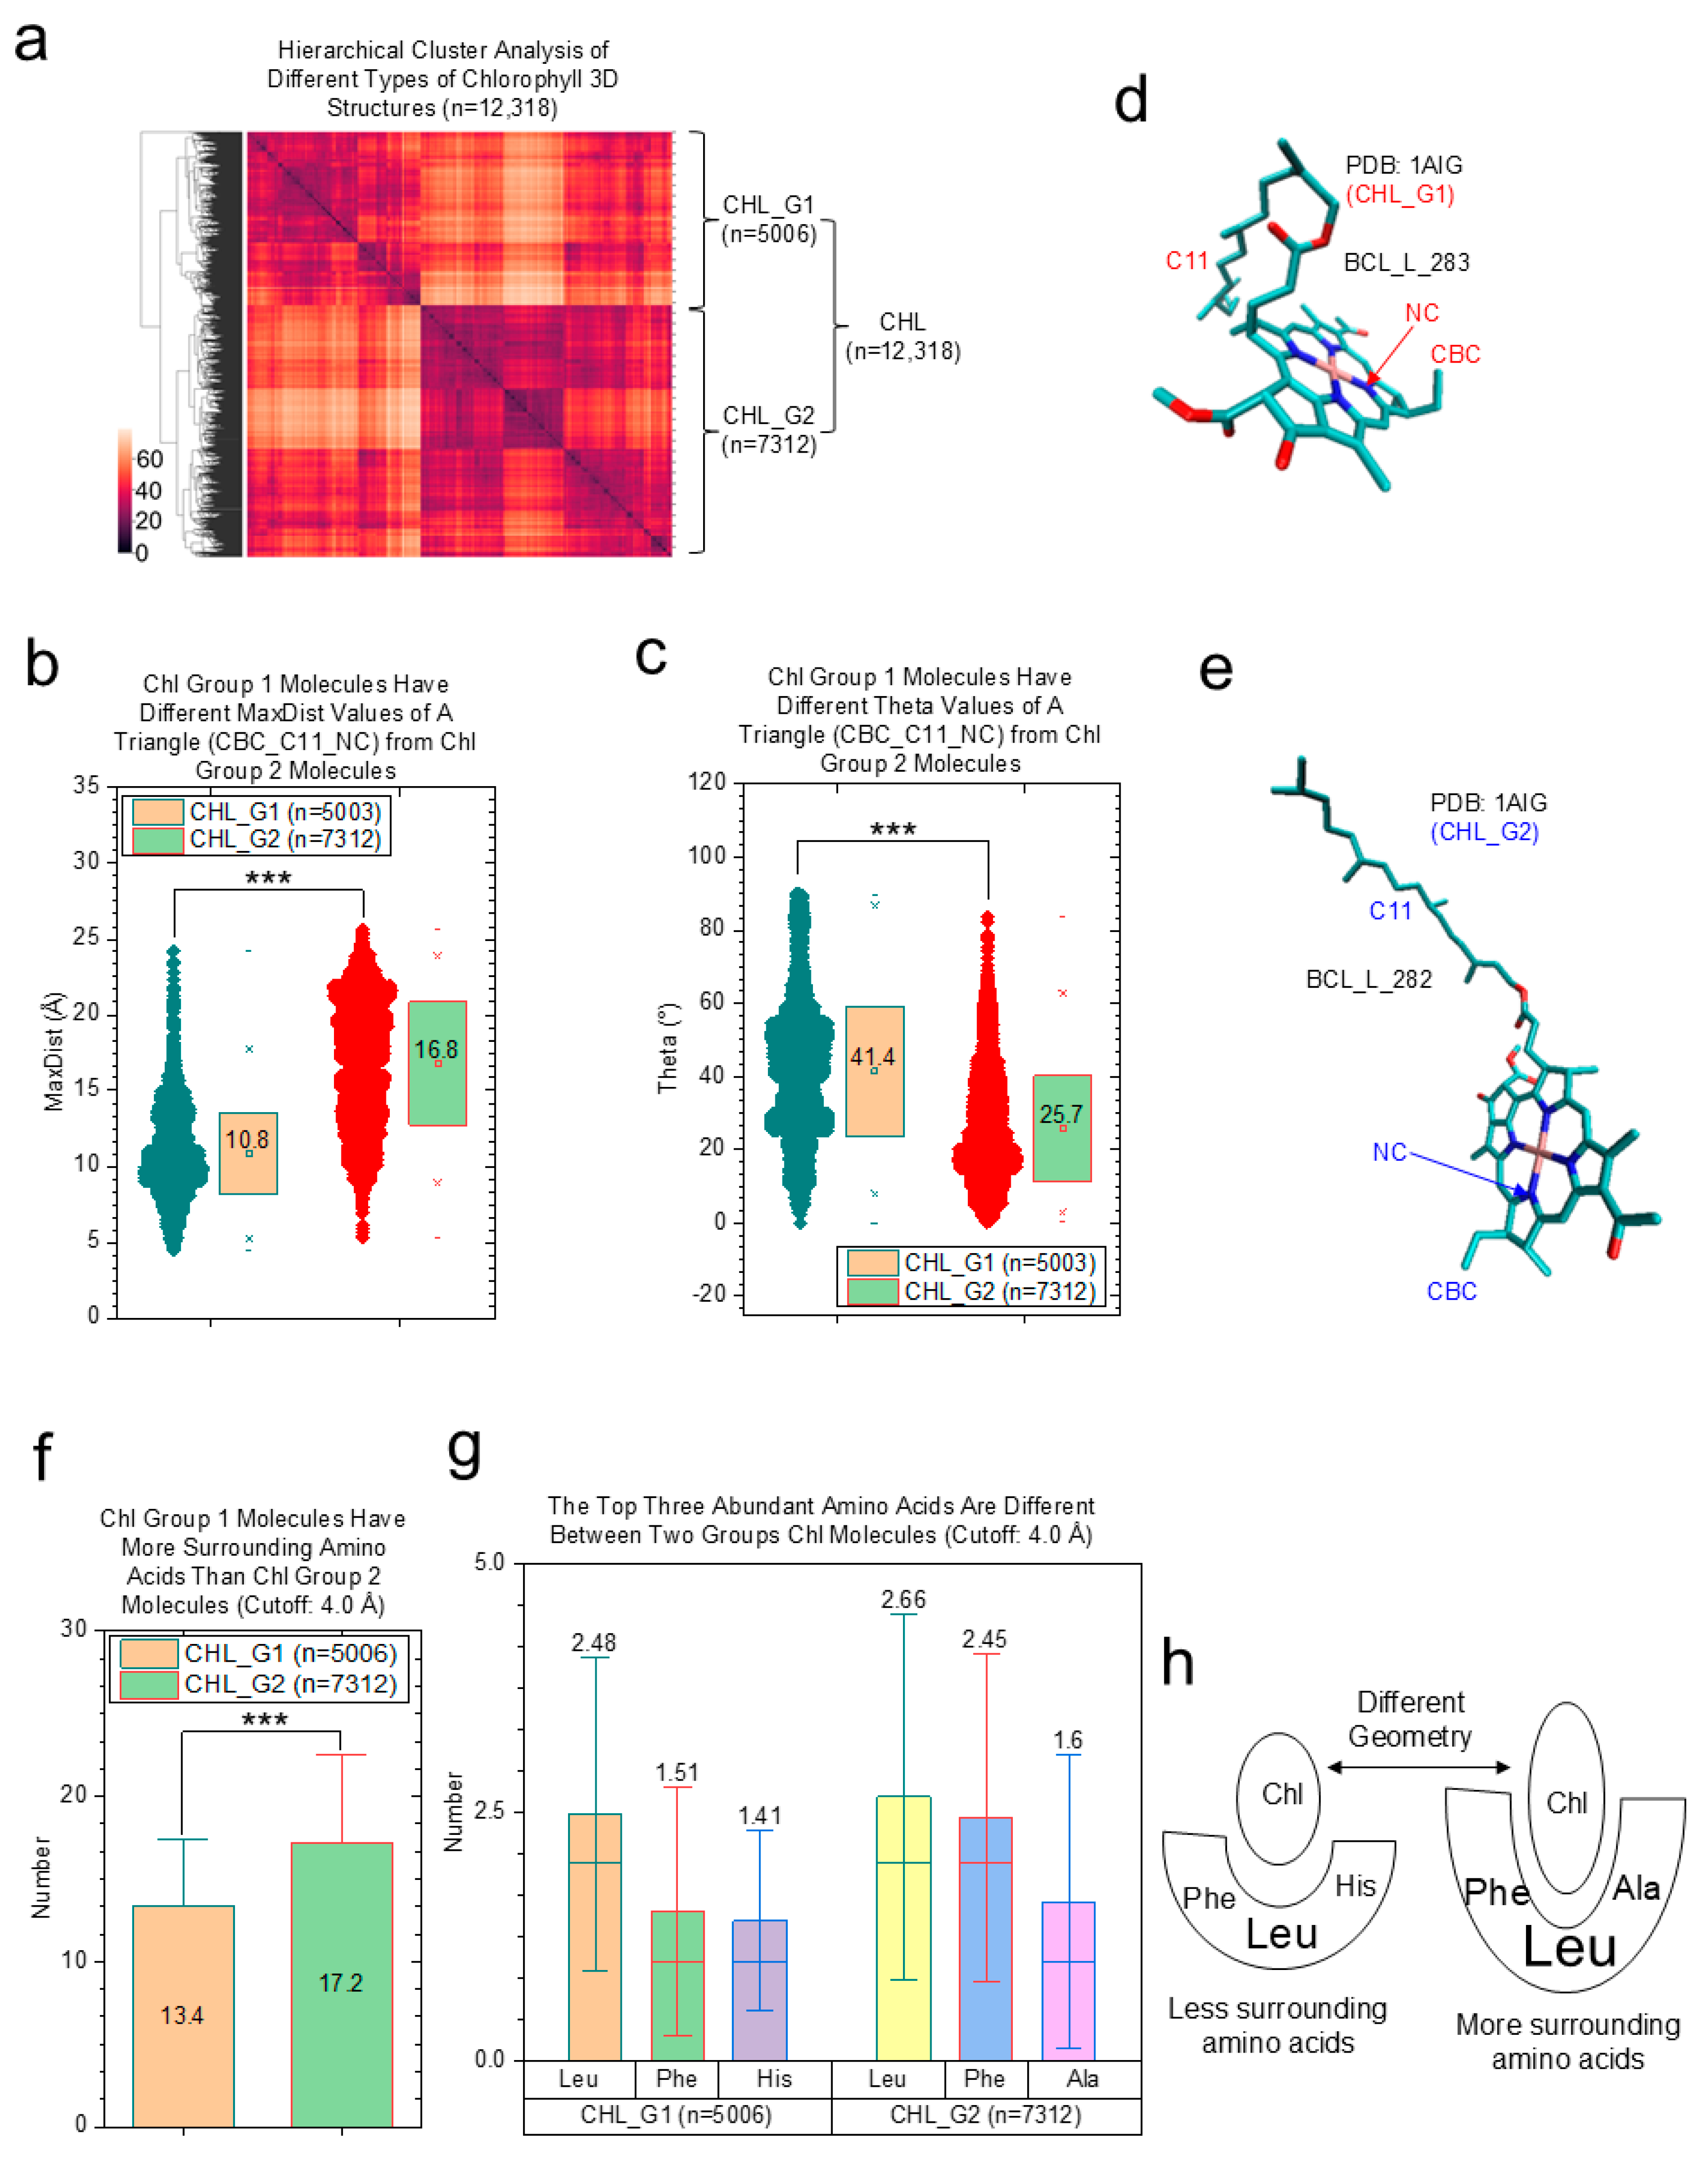
2.2.2. Effects of Protein Environments on Various Types of Chl Molecules

The focus of this study is to investigate the conformational changes in Chls, especially Chls a. Therefore, we have performed hierarchical cluster analyses of all types of Chls (Supplementary Materials, File S2) as well as only Chls a (Supplementary Materials, File S3). The results related to Chls will be discussed in this section and the results related only to Chls a will be discussed in the next section. The hierarchical cluster analysis reveals two main clusters of various types of Chls: CHL_G1 and CHL_G2 (Figure 4a). Pheophytin a and bacteriopheophytin b are exclusively found only in the cluster CHL_G2. All other types of BChl a, b, and g, bacteriopheophytin a, and Chl a, a’, b, d, and f are found in both the CHL_G1 cluster and the CHL_G2 cluster. One signature triangle (CBC_C11_NC) was identified for distinguishing these two clusters of Chls. The Chls in the CHL_G1 cluster has smaller MaxDist values (Figure 4b) and larger Theta values (Figure 4c) than those in the CHL_G2 cluster. Representative structures of Chls in CHL_G1 and CHL_G2 are shown in Figure 4d,e, respectively. The phytol chain of Chl is a long and hydrophobic hydrocarbon tail. The phytol chain in CHL_G1 is a bent conformation (Figure 4d) while the phytol chain in CHL_G2 is arranged in a relatively straight and extended conformation (Figure 4e). Two conformations of phytol chains were observed. We reasonably hypothesized that protein environments are the source for these two conformations. To test this hypothesis, we calculated the surrounding amino acids of the Chls. The result demonstrates that the Chls in CHL_G2 have more surrounding amino acids than those in CHL_G1 (Figure 4f). Additionally, we found that the top third abundant amino acid for the Chls in CHL_G1 is histidine (Figure 4g). In contrast, the top third abundant amino acid for the Chls in CHL_G2 is alanine (Figure 4g). The top two abundant amino acids are Leu and Phe for the Chls in both CHL_G1 and CHL_G2 (Figure 4g). Taken together, we conclude that more (less) surrounding amino acids are needed and Leu, Phe, and Ala (His) are important for maintaining a straight and extended (bent) conformation of the phytol chain of Chls (Figure 4h).

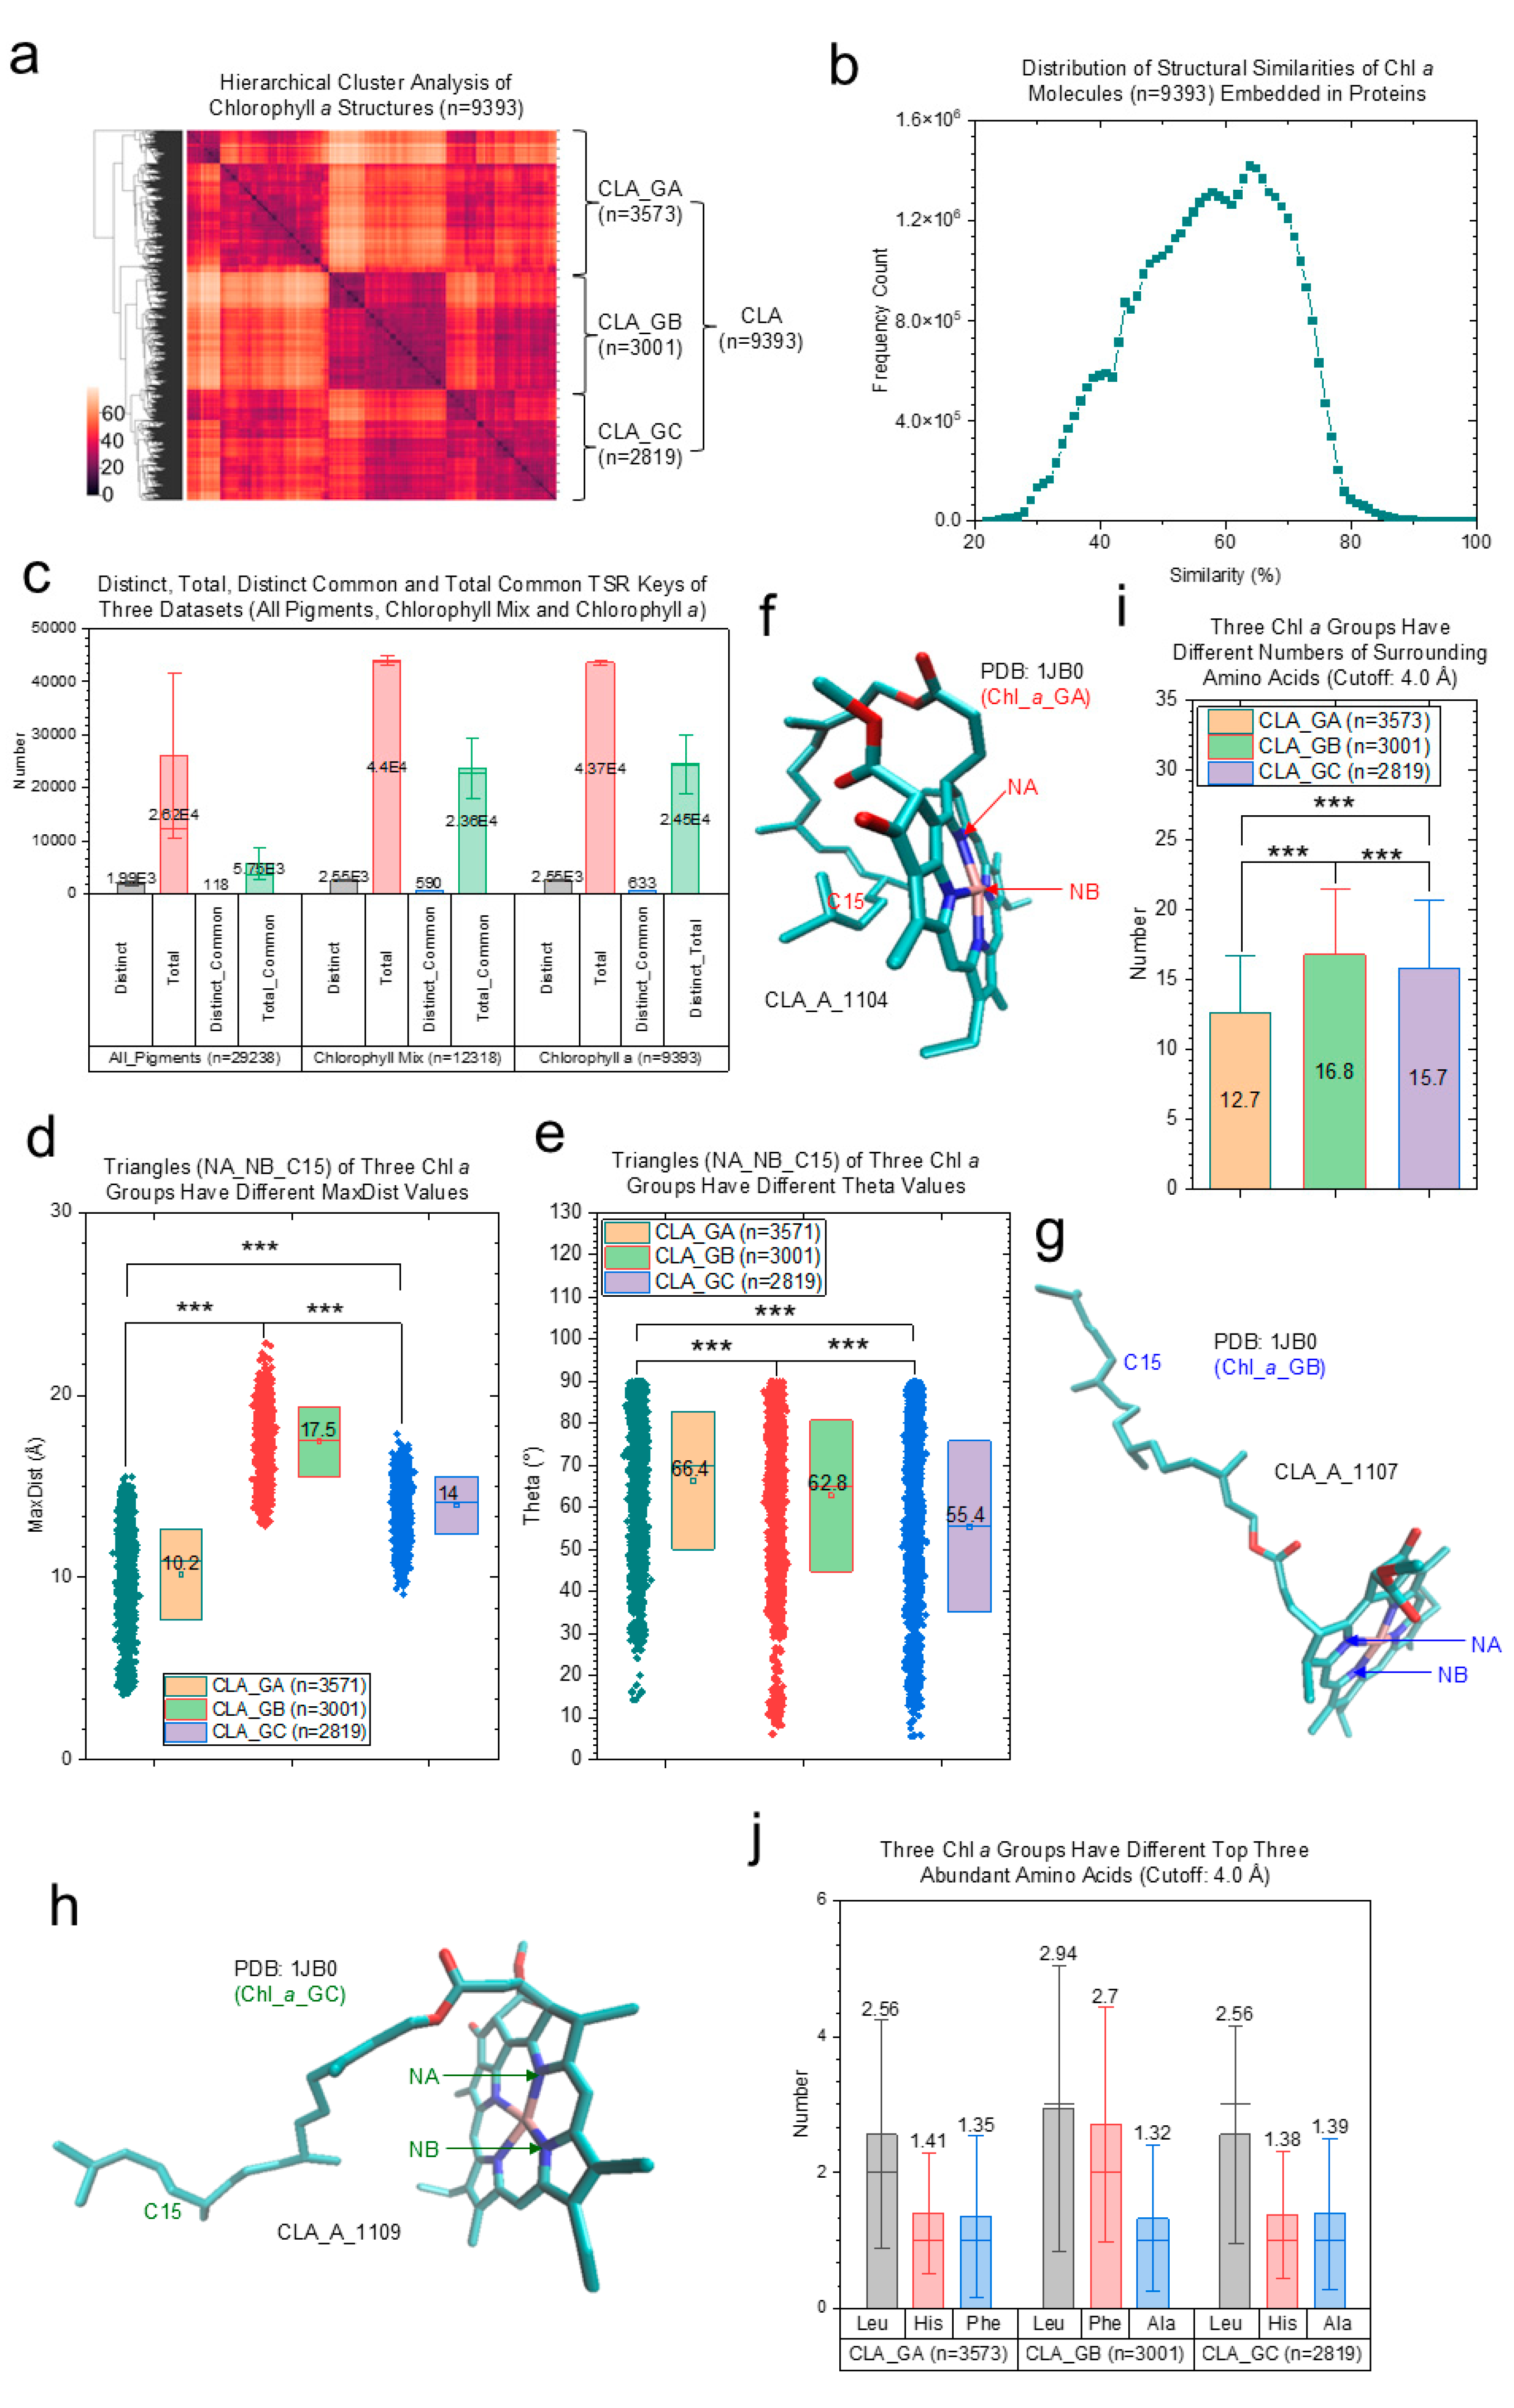
2.2.3. Effects of Protein Environments on Various Types of Chl a Molecules

Chl a serves a dual role in oxygenic photosynthesis: in light harvesting through energy transfer as well as in converting energy of absorbed photons to chemical energy through electron transfer as well as possible energy transfer [42]. Electron transfer is a fundamental process required for energy conversion in biological systems. Essential for electron transfer is the fine-tuning of the redox potentials of the electron acceptors and donors through interactions with the protein in which they are embedded [52] and the precise arrangement of cofactors with respect to each other. The Chl a dataset contains conformations of 9393 Chl a 3D structures embedded in proteins. The TSR keys were calculated for every Chl a structure. The conformations of these Chls a are represented by the TSR keys. The hierarchical cluster analysis shows three clusters of Chl a structures (Figure 5a). They are named CLA_GA, CLA_GB, and CLA_GC (Figure 5a). The pairwise structural similarities of most chemically identical Chls a are between 48% and 72% with a maximal count of 64% (Figure 5b). Distinct, total, distinct common, and total common TSR keys were calculated for all the pigment structures (Supplementary Materials, File S1), various types of Chls (Supplementary Materials, File S2), and Chls a (Supplementary Materials, File S3) (Figure 5c). Distinct TSR keys represent all different TSR keys for each individual pigment in the datasets (all pigments (Supplementary Materials, File S1), various Chls (Supplementary Materials, File S2), and Chls a (Supplementary Materials, File S3)) without considering the key frequencies. Total TSR keys represent all the distinct TSR keys but also account for their key frequencies. Distinct common TSR keys represent all the common substructures that are shared amongst all pigments in each dataset. Total common TSR keys represent all distinct common keys accounting for their frequencies. As expected, the number of distinct and total common TSR keys increases from the dataset of pigments (Figure 2b) to the dataset of Chls (Figure 4a) and to the dataset of Chls a (Figure 5a) due to structural diversity decreases (Figure 5c).
Similar to the situation of various types of Chls (Figure 4b–h), one signature triangle (NA_NB_C15) can distinguish all three clusters of Chls a based on their MaxDist (Figure 5d) and Theta (Figure 5e) values. Representative structures are shown in Figure 5f–h for the Chls a in the clusters of CLA_GA, CLA_GB, and CLA_GC, respectively. Three Chl a clusters have different conformations of their phytol chains (Figure 5f–h). The number of surrounding amino acids (Figure 5i) and certain amino acids (Figure 5j) play important roles in determining the conformations of Chls a.

2.3. Structural Characteristics of Pigment Surrounding Protein Environments

Photosynthetic systems are characterized by optimized structures where the protein scaffolds finely tune their surroundings and modulate their properties and functionalities [53]. Numerous studies have demonstrated the contributions of individual amino acids for modulating the spectroscopic properties of bound chromophores by altering their 3D arrangements [3,7,54]. For example, the Ala to Asn mutant of type IIa water soluble Chl-binding protein blue-shifts the Chl Qy transition band from 673 nm to 667 nm, whereas the analogous reciprocal Asn to Ala mutant of type IIb water soluble Chl-binding protein induces a red shift from 664 nm to 669 nm [55]. To identify a specific amino acid as an example for demonstrating structural characteristics of protein environments for binding of a Chl molecule, we calculated amino acids in the binding sites of various types of Chls. The top six abundant amino acids vary depending on the types of Chls (Figure 6a–j), indicating the diversity of conformations of Chl–protein complexes. Two close interactions between Chls and their surrounding amino acids are shown in Figure 6k,l. Figure 6k shows a coordination bond between the central Mg2+ of a BChl a and a histidine residue and a hydrogen bond between the BChl a and a tryptophan residue. The importance of the axial ligand histidine residue to Chl or BChl has been demonstrated in photosystem I [24,56,57,58,59,60], photosystem II [6,61,62,63,64,65,66,67], and bacterial RCs [68,69,70,71,72,73,74,75] using mutagenesis studies. Figure 6l presents a structure of pheophytin a. Pheophytin a is a metal-free derivative of Chl that functions as the primary electron acceptor of photosystem I [40] and photosystem II [76]. A leucine residue is close to the center of the porphyrin ring of the pheophytin a. The BChl a has one hydrogen bond with a tryptophan residue (Figure 6k) and the pheophytin a has two hydrogen bonds with two tyrosine residues (Figure 6l). The hydrogen bonds between pigments and surrounding amino acids play an important role in maintaining the chemical properties of the pigments. For example, the absorption properties of the antennas can be largely modified by the introduction/removal of a hydrogen bond between the pigment and the protein [77,78].
To demonstrate the specific geometrical characteristics of Chl-binding sites, we decided to study conformations of histidine residues embedded in proteins. A dataset containing 11,040 3D structures of the histidine residues from the (B)Chl-binding proteins was prepared (Supplementary Materials, File S4). TSR keys were calculated for every histidine structure in the dataset. All the possible conformations of the histidine residues are represented by their TSR keys. The hierarchical cluster analysis using the calculated TSR keys of these histidine residues reveals two clusters (Figure 7a). The peak of the structural similarity of the histidines is 25% (Figure 7b), demonstrating a high structural diversity of the histidine residues. All these histidine residues share one common TSR key and this TSR key represents four possible triangles of a histidine residue with similar or identical geometries (Figure 7c). Histidine residues ligate the central Mg2+ of (B)Chl from either the α side or β side to lead to a metallic stereocenter [79]. To show structural differences between histidines ligating Mg2+ of (B)Chls and those not ligating Mg2+ of (B)Chls, we divided 11,040 histidine structures into two groups: one group with a coordination bond with Mg2+ of (B)Chl and the other group without a coordination bond with Mg2+ of (B)Chl. Interestingly, one signature triangle (C_O_CB) of histidines can be used for structurally distinguishing these two groups. The signature triangle is supported by the evidence that the two histidine groups have different MaxDist (Figure 7d) and Theta (Figure 7e) values. One histidine structure is illustrated in Figure 7f. The atom names are labeled for connecting the triangles to their corresponding common TSR key (Figure 7b) and the signature TSR key (Figure 7d,e). One representative interaction between a histidine and a Mg2+ of Chl a can be seen in Figure 7g. Figure 7h,i show two histidine 3D structures ligating and not ligating an Mg2+ of Chl, respectively. Taken together, we concluded that histidines ligating Mg2+ of Chl are structurally different from those not ligating Mg2+ of Chl, indicating specific structural characteristics of histidine residues that coordinate with Chls (Figure 7j).

3. Conclusions, Limitations, and Future Directions

Pigments function in excitation energy transfer and electron transfer converting solar energy to chemical energy through photosynthesis. To achieve this goal, chromophores are incorporated into protein matrices [80]. Energy and electron transfers are determined by pigment–pigment interactions and pigment–protein interactions. A great variety of different spectroscopic methods (e.g., ultrafast, FTIR, and EPR) and theoretical approaches (e.g., MD simulations and QM/MM calculations) are available to analyze pigment–protein interactions [81]. However, correlating spectroscopic data with specific pigment–protein interactions requires a single pigment embedded in one polypeptide matrix. Unfortunately, most of the known systems contain a set of multiple pigments in each protein subunit [80] and this makes it complicated to interpret spectroscopic data based on the structural data. In this study, we used the TSR-based method to systematically investigate 3D structures of various types of Chls and were able to show structural characteristics of Chls- and Chl-binding sites. The TSR algorithm is a structure-based method that can be used in studying any type of molecular interaction (e.g., cofactor and protein, pigment and pigment, protein and protein, and DNA and protein interactions). It outperforms or complements other structure-based methods (DALI [82], CE [83], TM-align [84], Ultrafast Shape Recognition [85], ProBiS [86], and Root Mean Square Deviation [87]) [27,28,88]. As stated earlier, the input data used in this study are from experimentally solved 3D structures. The theoretical or modeled conformations of Chls and amino acids can be generated using MD simulations or QM/MM calculations. The TSR algorithm can complement MD simulations and QM/MM calculations using theoretical or modeled 3D structures as the input data [27,89]. The key contributions of this study can be summarized as follows.
(i)
A dataset containing all (B)Chl 3D structures and a histidine dataset from (B)Chl-binding proteins is prepared and annotated.
(ii)
Specific structural characteristics of Chls d and f were identified and are defined using the TSR keys. A total of 590 common TSR keys were identified, and those common key-associated substructures are shared by all types of Chls.
(iii)
Two and three clusters were found for various Chls and Chls a, respectively. The signature structures for distinguishing their corresponding two and three clusters were identified. The number of surrounding amino acids and certain amino acids play important roles in determining the conformations of Chls and Chls a.
(iv)
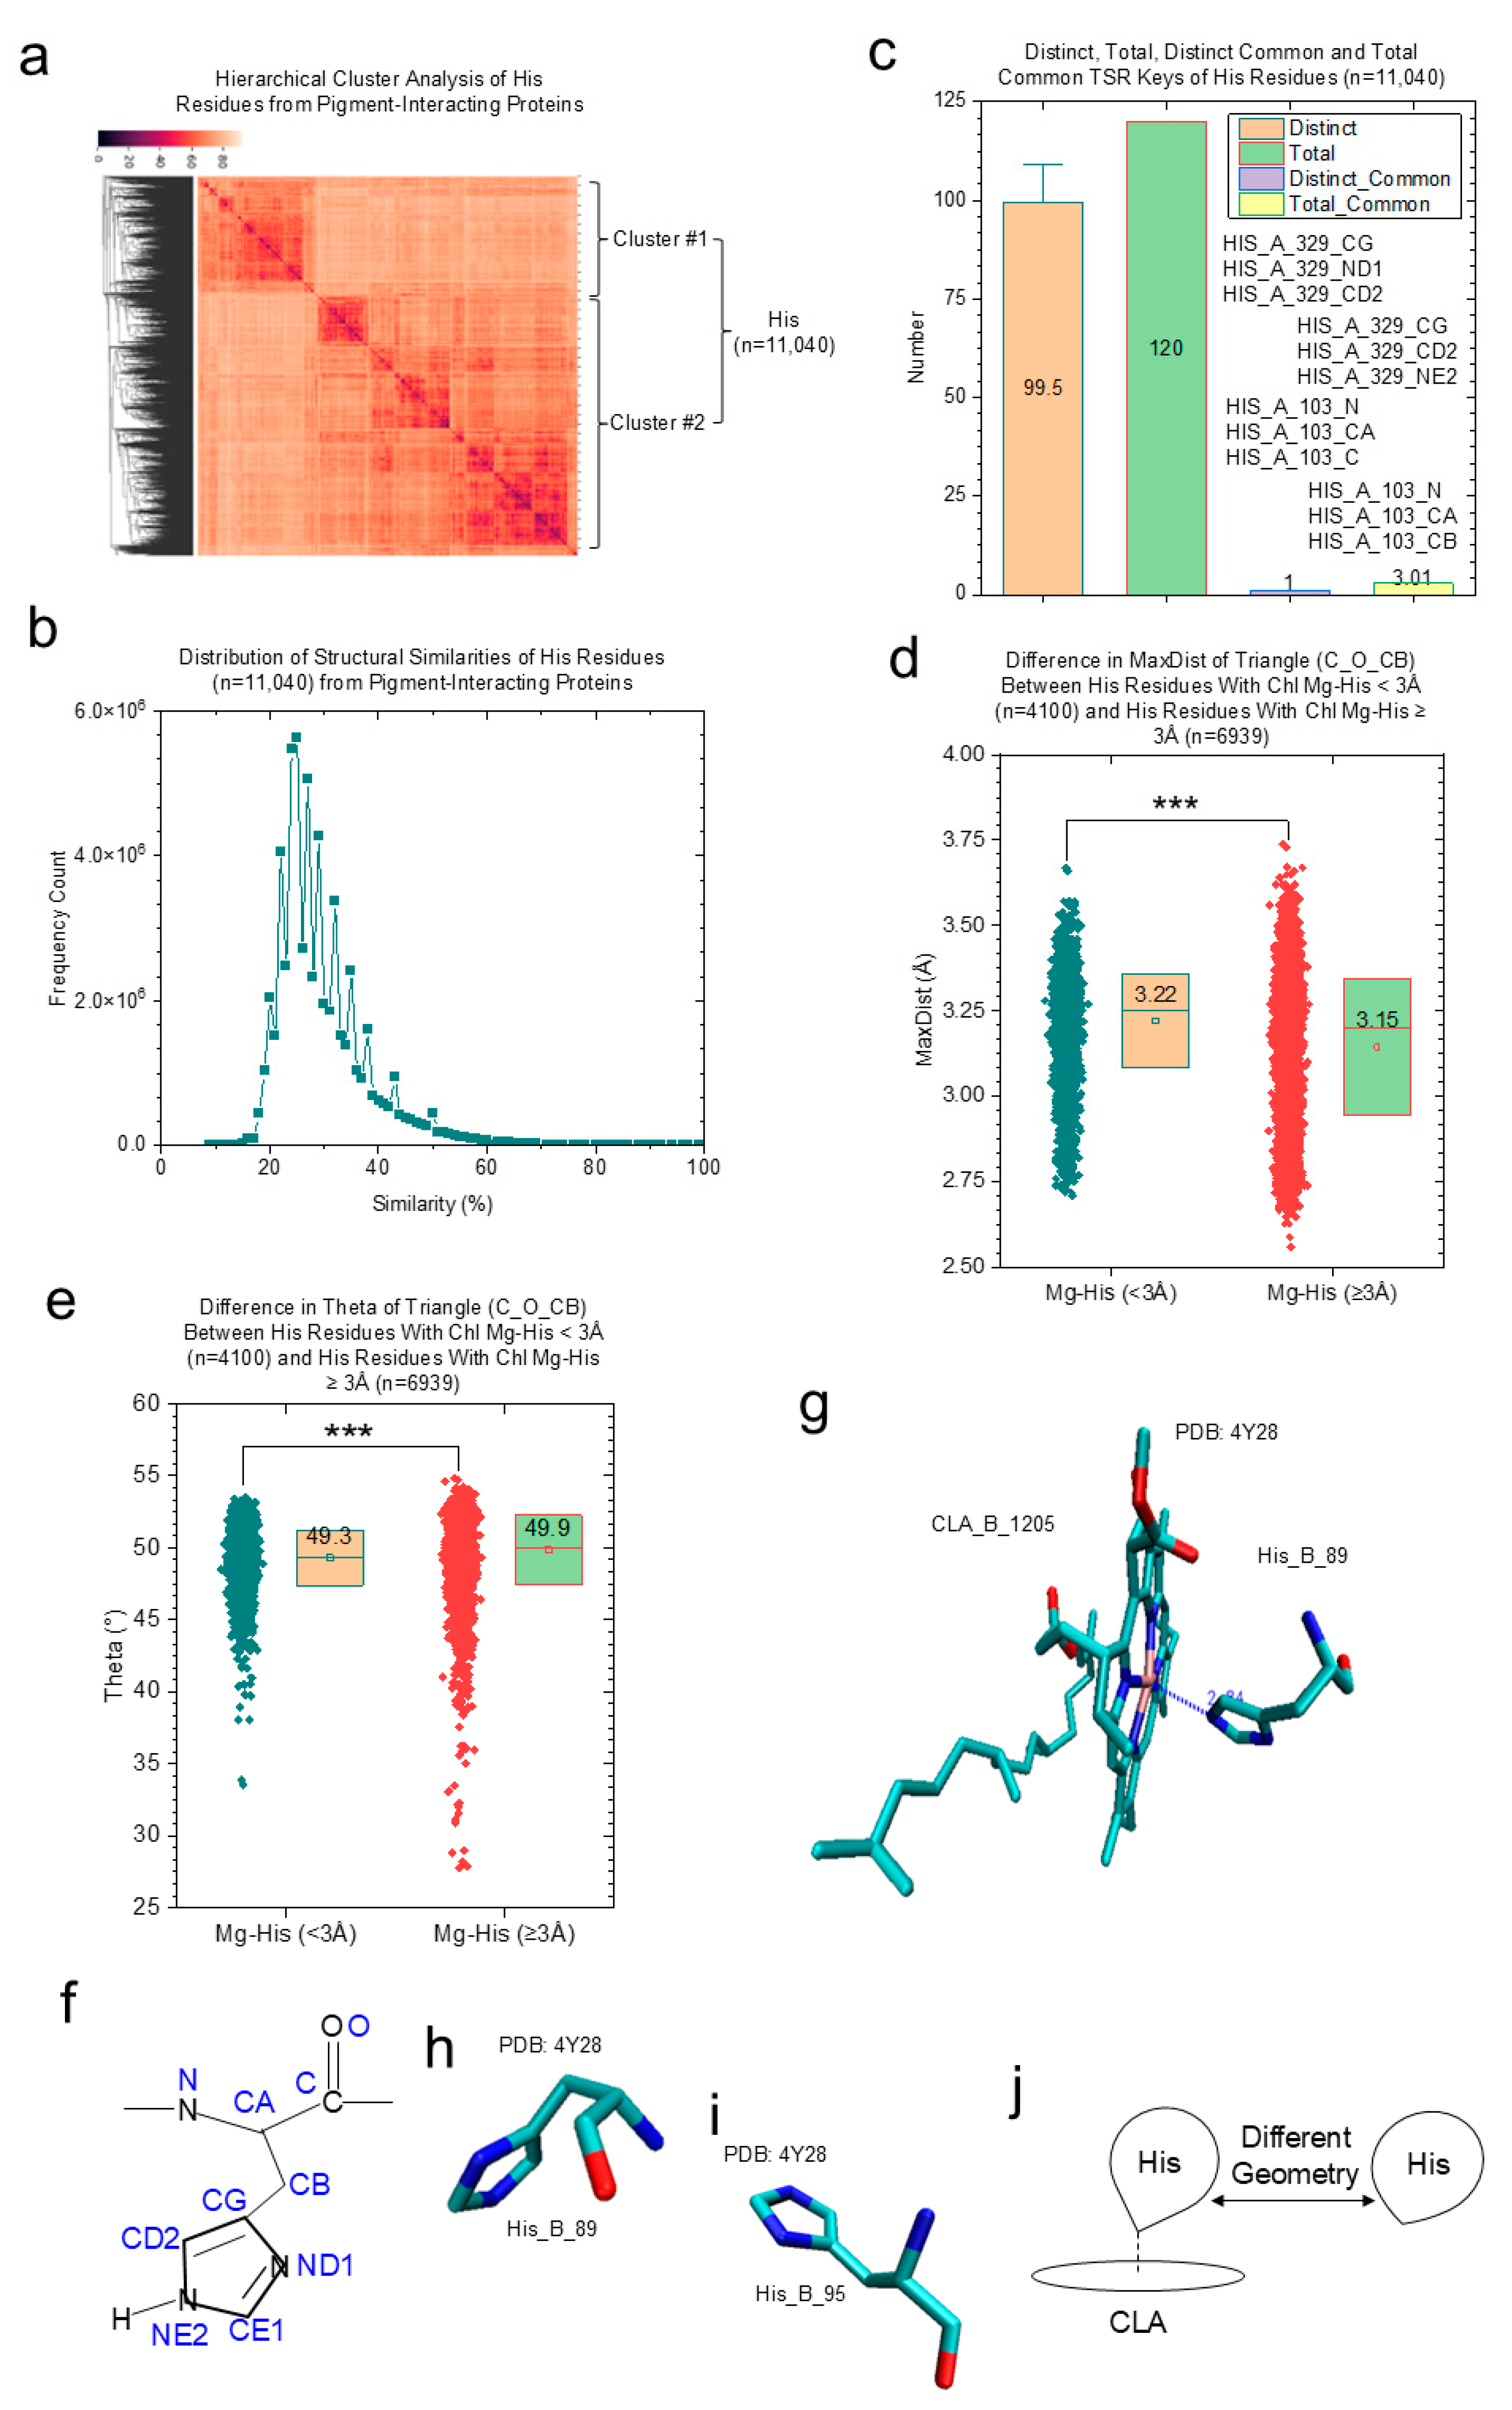
Histidine residues are used as an example for revealing structural characteristics of Chl-binding sites.
The contributions described in (ii), (iii), and (iv) provide evidence in support of the unresolved questions #1, #2, and #3 raised in Section 1, respectively. The TSR-based method has the capacity to quantify conformational changes in individual molecules or molecular complexes. One key limitation of the TSR algorithm is that it requires functional data for the mechanistic understanding of protein structure and function relationships. Specifically, to interpret the conformational changes in Chls a observed in this study, it requires functional data (e.g., binding energy or spectroscopic data). Nearly no experimental binding affinity or spectroscopic data for individual Chls a are available. This limits our mechanistic understanding of relationships between structures and functions of individual Chls a embedded in protein environments. However, this study builds a structural foundation through quantifying 9393 (B)Chl conformations as well as 11,040 histidine conformations for the future mechanistic understanding of relationships between pigment–protein interactions and their corresponding spectroscopic data.

4. Methods

4.1. Key Generation

The process began with extracting Cα atoms from PDB files of each protein under analysis. Next, the three side lengths and angles of all triangles constructible from these Cα atoms were systematically calculated. Each of the 20 amino acids was labeled or assigned with 20 consecutive unique integer identifiers [27]. We mapped the amino acids involved with three vertices of triangle i to corresponding integer IDs to three labels l i 1 , l i 2 , and l i 3 ; we then ensured the uniqueness of the same TSR triangle across proteins to be represented by the same integer keys by applying the rule-based label determination of vertices of each triangle [90]. Once l i 1 , l i 2 , and l i 3 are determined for triangle i, we calculate θ1 using Equation (1) and θ based on θ1 values:
θ 1 = cos 1 ( ( d 13 2 ( d 12 2 ) 2 d 3 2 ) / ( 2 × ( d 12 2 ) × d 3 ) )
θ = θ 1 i f   θ 1   90 ° 180 ° θ 1 o t h e r w i s e
where
  • d 13 : distance between l i 1 and l i 3 for triangle i;
  • d 12 : distance between l i 1 and l i 2 for triangle i;
  • d 3 : distance between l i 3 and the midpoint of l i 1 and l i 2 for triangle i.
We refer to the value of θΔ as Theta and D as MaxDist [27]. Theta is defined as the angle that is <90° between the line from the midpoint of the edge of l i 1 and l i 2   to the opposite vertex l i 3 and half of the l i 1 - l i 2   edge. MaxDist is defined as the distance of the longest edge of a triangle. Once the labels l i 1 , l i 2 , l i 3 , D, and θΔ are determined, we use Equation (2) to calculate the key for each triangle:
k = θ T d T l i 1 1 m 2 + θ T d T l i 2 1 m + θ T d T l i 3 1 + θ T d 1 + θ 1
where
  • m: the total number of distinct labels;
  • θ: the bin value for the class in which θ , the angle representative, falls; to achieve discretization, we use the Adaptive Unsupervised Iterative Discretization algorithm;
  • θ T : the total number of distinct discretization levels (or bin number) for angle representative;
  • d: the bin value for the class in which D, the length representative, falls; to achieve discretization, we use the Adaptive Unsupervised Iterative Discretization algorithm;
  • d T : the total number of distinct discretization levels (or the number of bins) for length representative.
Crucially, the generated key for each triangle depends on l i 1 , l i 2 , and l i 3 (vertex labels), Theta (θ), and MaxDist (D). This design ensures that keys, while remaining invariant to rotations and translations, can effectively capture scale changes in protein structures, making them suitable for alignment-free, pairwise comparison of 3D structures.

4.2. Protein Structural Similarity and Distance Calculations

We apply the Generalized Jaccard coefficient measure [91], Equation (3), for the calculation of similarity between two proteins:
J a c g e n = i = 1 n ϵ i / i = 1 n z i  
where n is the total number of unique keys in proteins p1 and p2.
Equivalence ϵ for a given key ki in two different proteins p1 and p2 is defined as ϵ i = k i p 1 k i p 2 , where is defined by the minimum of the count of corresponding keys.
Difference z for a given key ki in a pair of proteins is defined as z i = k i p 1 k i p 2 , where ∪ is defined by the maximum of the count of corresponding keys. The count of a key is the number of times that key occurs (occurrence frequency) within a protein.

4.3. Development of a Version of the TSR-Based Method for Representing and Quantifying Pigment 3D Structures

To effectively model pigment 3D structures, we developed a specialized TSR variant based on the TSR concept for protein 3D structural comparisons that leverages all atoms except hydrogen atoms within these types of molecules for triangle construction, enabling a comprehensive representation of their 3D structures. This TSR version is similar to what we have reported for drugs [28].

4.4. Development of a TSR Algorithm for Representing and Quantifying 3D Structures of Amino Acids

The TSR concept was used to develop an algorithm for quantifying the similarities between structures of different amino acids and those between the same amino acids at different positions using all atoms except hydrogen atoms. The algorithm considers each amino acid as a separate unit for TSR key calculations. The bin boundaries for Theta and MaxDist are the same as those for the TSR algorithms for pigments.

4.5. Dataset Preparation

The experimentally determined 3D structures from the PDB repository [29] were used to prepare the datasets used in this study.

4.5.1. Pigment Dataset Preparation

A dataset containing 3D structures of twenty-one different pigments (phylloquinone (n = PQN), benzoquinone (PL9), heme A (HEA), heme B/C (HEB), heme C (HEC), heme AS (HAS), protoporphyrin IX containing Fe (HEM), protoporphyrin IX containing Mg (HEG), bacteriopheophytin b (BPB), bacteriopheophytin a (BPH), BChl a (BCL), BChl b (BCB), BChl g (GBF), Chl a (CLA), Chl a isomer (CL0), Chl b (CHL), Chl d (CL7), Chl d isomer (G9R), Chl f (F6C), and pheophytin a (PHO)) was prepared. The PDB IDs, chains, pigment names, or pigment IDs can be found in the Supplementary Materials, File S1. Two subsets of the pigment dataset containing various types of Chls (Supplementary Materials, File S2) and only Chls a (Supplementary Materials, File S3) were also prepared.

4.5.2. Histidine Dataset Preparation

A dataset containing all the histidine residues from the Chl-binding proteins in the dataset including various types of Chls was prepared. The PDB IDs, chains, histidine residues, and histidine residue positions are included in the dataset (Supplementary Materials, File S4).

4.6. Hierarchical Cluster and Classification Analyses and Visualization

Pigment and histidine 3D structure clustering analyses are visualized based on Average Linkage Clustering [92]. A Deep Neural Network including an input layer, four hidden layers, and one output layer is used for classifying pigment structures. Each of the hidden layers uses the ReLU activation function [93]. Structural images were prepared using the Visual Molecular Dynamics (VMD) package 1.9.3 [94].

4.7. Statistical Analyses

A two-tailed independent Student’s t-test was used to identify statistical differences between the two groups. A threshold of p < 0.05 was used to determine significance.

Supplementary Materials

The following supporting information can be downloaded at https://www.mdpi.com/article/10.3390/photochem5010008/s1: The datasets used in this study can be found in the supplementary materials.

Author Contributions

W.X. proposed and designed this study. T.I.M., K.H.O., K.R., R.M.R. and W.X. carried out this study. T.I.M. and W.X. collected data and prepared the figures. T.I.M. and K.R. wrote the Python codes. A.A.G. and W.X. supervised the students and contributed to the discussions. All authors have read and agreed to the published version of the manuscript.

Funding

This study is supported by the National Science Foundation, 2313482, and NIH NIGMS (1R15GM144944-01).

Data Availability Statement

These data were derived from the following resource available in the public domain: https://www.rcsb.org/ (accessed on 10 January 2025). The authors confirm that the data supporting the findings of this study are available within the article and its Supplementary Materials. The source code is available for academic users on GitHub: https://github.com/tarikulislammilon/TSR and https://github.com/WuXu26/Protein-3D-TSR (accessed on 10 January 2025).

Acknowledgments

Most of this research was conducted with high-performance computational resources provided by the Louisiana Optical Network Infrastructure (http://www.loni.org, accessed on 10 January 2025). W.X. acknowledges Lyudmila V. Slipchenko and Sergei Savikhin for fruitful discussions on this project. Josee E. Robinson, Lauren E. Savoy, and Sophia R. LeBlanc helped to prepare the datasets. We also wish to acknowledge the contributions of the LONI support team, especially Feng Chen, Jianxiong Li, and Oleg Starovoytov.

Conflicts of Interest

The authors declare no conflicts of interest.

References

  1. De Marais, D.J. When Did Photosynthesis Emerge on Earth? Science 2000, 289, 1703–1705. [Google Scholar] [CrossRef]
  2. Rye, R.; Holland, H.D. Paleosols and the evolution of atmospheric oxygen: A critical review. Am. J. Sci. 1998, 298, 621–672. [Google Scholar] [CrossRef] [PubMed]
  3. Wientjes, E.; Roest, G.; Croce, R. From red to blue to far-red in Lhca4: How does the protein modulate the spectral properties of the pigments? Biochim. Biophys. Acta (BBA) Bioenerg. 2012, 1817, 711–717. [Google Scholar] [CrossRef] [PubMed]
  4. Croce, R.; van Amerongen, H. Natural strategies for photosynthetic light harvesting. Nat. Chem. Biol. 2014, 10, 492–501. [Google Scholar] [CrossRef] [PubMed]
  5. Adolphs, J.; Renger, T. How proteins trigger excitation energy transfer in the FMO complex of green sulfur bacteria. Biophys. J. 2006, 91, 2778–2797. [Google Scholar] [CrossRef]
  6. Diner, B.A.; Schlodder, E.; Nixon, P.J.; Coleman, W.J.; Rappaport, F.; Lavergne, J.; Vermaas, W.F.J.; Chisholm, D.A. Site-Directed Mutations at D1-His198 and D2-His197 of Photosystem II in Synechocystis PCC 6803: Sites of Primary Charge Separation and Cation and Triplet Stabilization. Biochemistry 2001, 40, 9265–9281. [Google Scholar] [CrossRef]
  7. Morosinotto, T.; Breton, J.; Bassi, R.; Croce, R. The Nature of a Chlorophyll Ligand in Lhca Proteins Determines the Far Red Fluorescence Emission Typical of Photosystem I *. J. Biol. Chem. 2003, 278, 49223–49229. [Google Scholar] [CrossRef]
  8. Kirpich, J.S.; Luo, L.; Nelson, M.R.; Agarwala, N.; Xu, W.; Hastings, G. Is the A-1 Pigment in Photosystem I Part of P700? A (P700+–P700) FTIR Difference Spectroscopy Study of A-1 Mutants. Int. J. Mol. Sci. 2024, 25, 4839. [Google Scholar] [CrossRef]
  9. Sturgis, J.N.; Robert, B. Pigment Binding-Site and Electronic Properties in Light-Harvesting Proteins of Purple Bacteria. J. Phys. Chem. B 1997, 101, 7227–7231. [Google Scholar] [CrossRef]
  10. Sturgis, J.N.; Robert, B. The role of chromophore coupling in tuning the spectral properties of peripheral light-harvesting protein of purple bacteria. Photosynth. Res. 1996, 50, 5–10. [Google Scholar] [CrossRef]
  11. Witt, H.; Schlodder, E.; Teutloff, C.; Niklas, J.; Bordignon, E.; Carbonera, D.; Kohler, S.; Labahn, A.; Lubitz, W. Hydrogen Bonding to P700:  Site-Directed Mutagenesis of Threonine A739 of Photosystem I in Chlamydomonas reinhardtii. Biochemistry 2002, 41, 8557–8569. [Google Scholar] [CrossRef]
  12. McLuskey, K.; Prince, S.M.; Cogdell, R.J.; Isaacs, N.W. The Crystallographic Structure of the B800-820 LH3 Light-Harvesting Complex from the Purple Bacteria Rhodopseudomonas Acidophila Strain 7050. Biochemistry 2001, 40, 8783–8789. [Google Scholar] [CrossRef] [PubMed]
  13. Saer, R.; Orf, G.S.; Lu, X.; Zhang, H.; Cuneo, M.J.; Myles, D.A.A.; Blankenship, R.E. Perturbation of bacteriochlorophyll molecules in Fenna–Matthews–Olson protein complexes through mutagenesis of cysteine residues. Biochim. Biophys. Acta (BBA) Bioenerg. 2016, 1857, 1455–1463. [Google Scholar] [CrossRef] [PubMed]
  14. Khmelnitskiy, A.; Saer, R.G.; Blankenship, R.E.; Jankowiak, R. Excitonic Energy Landscape of the Y16F Mutant of the Chlorobium tepidum Fenna–Matthews–Olson (FMO) Complex: High Resolution Spectroscopic and Modeling Studies. J. Phys. Chem. B 2018, 122, 3734–3743. [Google Scholar] [CrossRef] [PubMed]
  15. Vrandecic, K.; Rätsep, M.; Wilk, L.; Rusevich, L.; Golub, M.; Reppert, M.; Irrgang, K.-D.; Kühlbrandt, W.; Pieper, J. Protein Dynamics Tunes Excited State Positions in Light-Harvesting Complex II. J. Phys. Chem. B 2015, 119, 3920–3930. [Google Scholar] [CrossRef]
  16. Llansola-Portoles, M.J.; Li, F.; Xu, P.; Streckaite, S.; Ilioaia, C.; Yang, C.; Gall, A.; Pascal, A.A.; Croce, R.; Robert, B. Tuning antenna function through hydrogen bonds to chlorophyll a. Biochim. Biophys. Acta (BBA) Bioenerg. 2020, 1861, 148078. [Google Scholar] [CrossRef]
  17. Luo, L.; Martin, A.P.; Tandoh, E.K.; Chistoserdov, A.; Slipchenko, L.V.; Savikhin, S.; Xu, W. Impact of Peripheral Hydrogen Bond on Electronic Properties of the Primary Acceptor Chlorophyll in the Reaction Center of Photosystem I. Int. J. Mol. Sci. 2024, 25, 4815. [Google Scholar] [CrossRef]
  18. Damjanović, A.; Vaswani, H.M.; Fromme, P.; Fleming, G.R. Chlorophyll Excitations in Photosystem I of Synechococcus elongatus. J. Phys. Chem. B 2002, 106, 10251–10262. [Google Scholar] [CrossRef]
  19. Xu, W.; Chitnis, P.R.; Valieva, A.; van der Est, A.; Brettel, K.; Guergova-Kuras, M.; Pushkar, Y.N.; Zech, S.G.; Stehlik, D.; Shen, G.; et al. Electron transfer in cyanobacterial photosystem I: II. Determination of forward electron transfer rates of site-directed mutants in a putative electron transfer pathway from A0 through A1 to FX. J. Biol. Chem. 2003, 278, 27876–27887. [Google Scholar] [CrossRef]
  20. Lahav, Y.; Noy, D.; Schapiro, I. Spectral tuning of chlorophylls in proteins–electrostatics vs. ring deformation. Phys. Chem. Chem. Phys. 2021, 23, 6544–6551. [Google Scholar] [CrossRef]
  21. Shelnutt, A.J.; Song, X.-Z.; Ma, J.-G.; Jia, S.-L.; Jentzen, W.J.; Medforth, C.J.; Medforth, C. Nonplanar porphyrins and their significance in proteins. Chem. Soc. Rev. 1998, 27, 31–42. [Google Scholar] [CrossRef]
  22. Senge, M.O.; MacGowan, S.A.; O’Brien, J.M. Conformational control of cofactors in nature–the influence of protein-induced macrocycle distortion on the biological function of tetrapyrroles. Chem. Commun. 2015, 51, 17031–17063. [Google Scholar] [CrossRef] [PubMed]
  23. Senge, M.O. Exercises in molecular gymnastics—Bending, stretching and twisting porphyrins. Chem. Commun. 2006, 3, 243–256. [Google Scholar] [CrossRef]
  24. Xu, W.; Wang, Y.; Taylor, E.; Laujac, A.; Gao, L.; Savikhin, S.; Chitnis, P.R. Mutational analysis of photosystem I of Synechocystis sp. PCC 6803: The role of four conserved aromatic residues in the j-helix of PsaB. PLoS ONE 2011, 6, e24625. [Google Scholar] [CrossRef] [PubMed]
  25. Cherepanov, D.A.; Shelaev, I.V.; Gostev, F.E.; Petrova, A.; Aybush, A.V.; Nadtochenko, V.A.; Xu, W.; Golbeck, J.H.; Semenov, A.Y. Primary charge separation within the structurally symmetric tetrameric Chl2APAPBChl2B chlorophyll exciplex in photosystem I. J. Photochem. Photobiol. B Biol. 2021, 217, 112154. [Google Scholar] [CrossRef]
  26. Kurashov, V.; Milanovsky, G.; Luo, L.; Martin, A.; Semenov, A.Y.; Savikhin, S.; Cherepanov, D.A.; Golbeck, J.H.; Xu, W. Conserved residue PsaB-Trp673 is essential for high-efficiency electron transfer between the phylloquinones and the iron-sulfur clusters in Photosystem I. Photosynth. Res. 2021, 148, 161–180. [Google Scholar] [CrossRef]
  27. Kondra, S.; Sarkar, T.; Raghavan, V.; Xu, W. Development of a TSR-Based Method for Protein 3-D Structural Comparison with Its Applications to Protein Classification and Motif Discovery. Front. Chem. 2021, 8, 602291. [Google Scholar] [CrossRef]
  28. Milon, T.I.; Wang, Y.; Fontenot, R.L.; Khajouie, P.; Villinger, F.; Raghavan, V.; Xu, W. Development of a novel representation of drug 3D structures and enhancement of the TSR-based method for probing drug and target interactions. Comput. Biol. Chem. 2024, 112, 108117. [Google Scholar] [CrossRef]
  29. Berman, H.M.; Westbrook, J.; Feng, Z.; Gilliland, G.; Bhat, T.N.; Weissig, H.; Shindyalov, I.N.; Bourne, P.E. The Protein Data Bank. Nucleic Acids Res 2000, 28, 235–242. [Google Scholar] [CrossRef]
  30. Ustin, S.L.; Gitelson, A.A.; Jacquemoud, S.; Schaepman, M.; Asner, G.P.; Gamon, J.A.; Zarco-Tejada, P. Retrieval of foliar information about plant pigment systems from high resolution spectroscopy. Remote Sens. Environ. 2009, 113, S67–S77. [Google Scholar] [CrossRef]
  31. Wu, S.; Zhang, Y. Recognizing Protein Substructure Similarity Using Segmental Threading. Structure 2010, 18, 858–867. [Google Scholar] [CrossRef] [PubMed]
  32. Chen, M. Chlorophyll modifications and their spectral extension in oxygenic photosynthesis. Annu. Rev. Biochem. 2014, 83, 317–340. [Google Scholar] [CrossRef] [PubMed]
  33. Vavilin, D.V.; Vermaas, W.F.J. Regulation of the tetrapyrrole biosynthetic pathway leading to heme and chlorophyll in plants and cyanobacteria. Physiol. Plant. 2002, 115, 9–24. [Google Scholar] [CrossRef]
  34. Kobayashi, K.; Masuda, T.; Tajima, N.; Wada, H.; Sato, N. Molecular Phylogeny and Intricate Evolutionary History of the Three Isofunctional Enzymes Involved in the Oxidation of Protoporphyrinogen IX. Genome Biol. Evol. 2014, 6, 2141–2155. [Google Scholar] [CrossRef]
  35. Mauzerall, D.C.P. Evolution of Porphyrins. Clin. Dermatol. 1998, 16, 195–201. [Google Scholar] [CrossRef]
  36. Kato, Y.; Nagao, R.; Noguchi, T. Redox potential of the terminal quinone electron acceptor Q<sub>B</sub> in photosystem II reveals the mechanism of electron transfer regulation. Proc. Natl. Acad. Sci. USA 2016, 113, 620–625. [Google Scholar]
  37. Srinivasan, N.; Golbeck, J.H. Protein–cofactor interactions in bioenergetic complexes: The role of the A1A and A1B phylloquinones in Photosystem I. Biochim. Biophys. Acta (BBA) Bioenerg. 2009, 1787, 1057–1088. [Google Scholar] [CrossRef] [PubMed]
  38. Lockhart, P.J.; Larkum, A.W.; Steel, M.; Waddell, P.J.; Penny, D. Evolution of chlorophyll and bacteriochlorophyll: The problem of invariant sites in sequence analysis. Proc. Natl. Acad. Sci. USA 1996, 93, 1930–1934. [Google Scholar] [CrossRef]
  39. Singh, A.K.; Rana, H.K.; Pandey, A.K. Chapter 19-Analysis of chlorophylls. In Recent Advances in Natural Products Analysis; Sanches Silva, A., Nabavi, S.F., Saeedi, M., Nabavi, S.M., Eds.; Elsevier: Amsterdam, The Netherlands, 2020; pp. 635–650. [Google Scholar]
  40. Hamaguchi, T.; Kawakami, K.; Shinzawa-Itoh, K.; Inoue-Kashino, N.; Itoh, S.; Ifuku, K.; Yamashita, E.; Maeda, K.; Yonekura, K.; Kashino, Y. Structure of the far-red light utilizing photosystem I of Acaryochloris marina. Nat. Commun. 2021, 12, 2333. [Google Scholar] [CrossRef]
  41. Swainsbury, D.J.K.; Faries, K.M.; Niedzwiedzki, D.M.; Martin, E.C.; Flinders, A.J.; Canniffe, D.P.; Shen, G.; Bryant, D.A.; Kirmaier, C.; Holten, D.; et al. Engineering of B800 bacteriochlorophyll binding site specificity in the Rhodobacter sphaeroides LH2 antenna. Biochim. Biophys. Acta. Bioenerg. 2019, 1860, 209–223. [Google Scholar] [CrossRef]
  42. Björn, L.O.; Papageorgiou, G.C.; Blankenship, R.E.; Govindjee. A viewpoint: Why chlorophyll a? Photosynth. Res. 2009, 99, 85–98. [Google Scholar] [CrossRef]
  43. Esteban, R.; Barrutia, O.; Artetxe, U.; Fernández-Marín, B.; Hernández, A.; García-Plazaola, J.I. Internal and external factors affecting photosynthetic pigment composition in plants: A meta-analytical approach. New Phytol. 2015, 206, 268–280. [Google Scholar] [CrossRef] [PubMed]
  44. Kiang, N.Y.; Siefert, J.; Govindjee; Blankenship, R.E. Spectral Signatures of Photosynthesis. I. Review of Earth Organisms. Astrobiology 2007, 7, 222–251. [Google Scholar] [CrossRef] [PubMed]
  45. Kunugi, M.; Satoh, S.; Ihara, K.; Shibata, K.; Yamagishi, Y.; Kogame, K.; Obokata, J.; Takabayashi, A.; Tanaka, A. Evolution of Green Plants Accompanied Changes in Light-Harvesting Systems. Plant Cell Physiol. 2016, 57, 1231–1243. [Google Scholar] [CrossRef]
  46. Kume, A.; Akitsu, T.; Nasahara, K.N. Why is chlorophyll b only used in light-harvesting systems? J. Plant Res. 2018, 131, 961–972. [Google Scholar] [CrossRef] [PubMed]
  47. Miyashita, H.; Ikemoto, H.; Kurano, N.; Adachi, K.; Chihara, M.; Miyachi, S. Chlorophyll d as a major pigment. Nature 1996, 383, 402. [Google Scholar] [CrossRef]
  48. Tomo, T.; Allakhverdiev, S.I.; Mimuro, M. Constitution and energetics of photosystem I and photosystem II in the chlorophyll d-dominated cyanobacterium Acaryochloris marina. J. Photochem. Photobiol. B Biol. 2011, 104, 333–340. [Google Scholar] [CrossRef]
  49. Chen, M.; Schliep, M.; Willows, R.D.; Cai, Z.L.; Neilan, B.A.; Scheer, H. A red-shifted chlorophyll. Science 2010, 329, 1318–1319. [Google Scholar] [CrossRef]
  50. Kato, K.; Shinoda, T.; Nagao, R.; Akimoto, S.; Suzuki, T.; Dohmae, N.; Chen, M.; Allakhverdiev, S.I.; Shen, J.-R.; Akita, F.; et al. Structural basis for the adaptation and function of chlorophyll f in photosystem I. Nat. Commun. 2020, 11, 238. [Google Scholar] [CrossRef]
  51. Gisriel, C.; Shen, G.; Kurashov, V.; Ho, M.-Y.; Zhang, S.; Williams, D.; Golbeck, J.H.; Fromme, P.; Bryant, D.A. The structure of Photosystem I acclimated to far-red light illuminates an ecologically important acclimation process in photosynthesis. Sci. Adv. 2020, 6, eaay6415. [Google Scholar] [CrossRef]
  52. Olson, T.L.; Williams, J.C.; Allen, J.P. Influence of protein interactions on oxidation/reduction midpoint potentials of cofactors in natural and de novo metalloproteins. Biochim. Biophys. Acta (BBA) Bioenerg. 2013, 1827, 914–922. [Google Scholar] [CrossRef]
  53. Fresch, E.; Meneghin, E.; Agostini, A.; Paulsen, H.; Carbonera, D.; Collini, E. How the Protein Environment Can Tune the Energy, the Coupling, and the Ultrafast Dynamics of Interacting Chlorophylls: The Example of the Water-Soluble Chlorophyll Protein. J. Phys. Chem. Lett. 2020, 11, 1059–1067. [Google Scholar] [CrossRef]
  54. Scholes, G.D.; Fleming, G.R.; Olaya-Castro, A.; van Grondelle, R. Lessons from nature about solar light harvesting. Nat. Chem. 2011, 3, 763–774. [Google Scholar] [CrossRef]
  55. Bednarczyk, D.; Dym, O.; Prabahar, V.; Peleg, Y.; Pike, D.H.; Noy, D. Fine Tuning of Chlorophyll Spectra by Protein-Induced Ring Deformation. Angew. Chem. (Int. Ed. Engl.) 2016, 55, 6901–6905. [Google Scholar] [CrossRef] [PubMed]
  56. Krabben, L.; Schlodder, E.; Jordan, R.; Carbonera, D.; Giacometti, G.; Lee, H.; Webber, A.N.; Lubitz, W. Influence of the Axial Ligands on the Spectral Properties of P700 of Photosystem I:  A Study of Site-Directed Mutants. Biochemistry 2000, 39, 13012–13025. [Google Scholar] [CrossRef] [PubMed]
  57. Webber, A.N.; Su, H.; Bingham, S.E.; Käss, H.; Krabben, L.; Kuhn, M.; Jordan, R.; Schlodder, E.; Lubitz, W. Site-Directed Mutations Affecting the Spectroscopic Characteristics and Midpoint Potential of the Primary Donor in Photosystem I. Biochemistry 1996, 35, 12857–12863. [Google Scholar] [CrossRef] [PubMed]
  58. Breton, J.; Xu, W.; Diner, B.A.; Chitnis, P.R. The two histidine axial ligands of the primary electron donor chlorophylls (P700) in photosystem I are similarly perturbed upon P700+ formation. Biochemistry 2002, 41, 11200–11210. [Google Scholar] [CrossRef]
  59. Redding, K.; MacMillan, F.; Leibl, W.; Brettel, K.; Hanley, J.; Rutherford, A.W.; Breton, J.; Rochaix, J.D. A systematic survey of conserved histidines in the core subunits of Photosystem I by site-directed mutagenesis reveals the likely axial ligands of P700. EMBO J. 1998, 17, 50–60. [Google Scholar] [CrossRef]
  60. Ramesh, V.M.; Guergova-Kuras, M.; Joliot, P.; Webber, A.N. Electron Transfer from Plastocyanin to the Photosystem I Reaction Center in Mutants with Increased Potential of the Primary Donor in Chlamydomonas reinhardtii. Biochemistry 2002, 41, 14652–14658. [Google Scholar] [CrossRef]
  61. Sugiura, M.; Boussac, A.; Noguchi, T.; Rappaport, F. Influence of Histidine-198 of the D1 subunit on the properties of the primary electron donor, P680, of photosystem II in Thermosynechococcus elongatus. Biochim. Biophys. Acta (BBA) Bioenerg. 2008, 1777, 331–342. [Google Scholar] [CrossRef]
  62. Di Donato, M.; Cohen, R.O.; Diner, B.A.; Breton, J.; van Grondelle, R.; Groot, M.L. Primary Charge Separation in the Photosystem II Core from Synechocystis: A Comparison of Femtosecond Visible/Midinfrared Pump-Probe Spectra of Wild-Type and Two P680 Mutants. Biophys. J. 2008, 94, 4783–4795. [Google Scholar] [CrossRef] [PubMed]
  63. Ruffle, S.V.; Wang, J.; Johnston, H.G.; Gustafson, T.L.; Hutchison, R.S.; Minagawa, J.; Crofts, A.; Sayre, R.T. Photosystem II peripheral accessory chlorophyll mutants in Chlamydomonas reinhardtii. Biochemical characterization and sensitivity to photo-inhibition. Plant Physiol. 2001, 127, 633–644. [Google Scholar] [CrossRef] [PubMed]
  64. Stewart, D.H.; Cua, A.; Chisholm, D.A.; Diner, B.A.; Bocian, D.F.; Brudvig, G.W. Identification of Histidine 118 in the D1 Polypeptide of Photosystem II as the Axial Ligand to Chlorophyll Z. Biochemistry 1998, 37, 10040–10046. [Google Scholar] [CrossRef]
  65. Schlodder, E.; Coleman, W.J.; Nixon, P.J.; Cohen, R.O.; Renger, T.; Diner, B.A. Site-directed mutations at D1-His198 and D1-Thr179 of photosystem II in Synechocystis sp. PCC 6803: Deciphering the spectral properties of the PSII reaction centre. Philos. Trans. R. Soc. Lond. Ser. B Biol. Sci. 2008, 363, 1197–1202. [Google Scholar] [CrossRef]
  66. Saito, K.; Shen, J.-R.; Ishikita, H. Influence of the Axial Ligand on the Cationic Properties of the Chlorophyll Pair in Photosystem II from Thermosynechococcus vulcanus. Biophys. J. 2012, 102, 2634–2640. [Google Scholar] [CrossRef]
  67. Wang, J.; Gosztola, D.; Ruffle, S.V.; Hemann, C.; Seibert, M.; Wasielewski, M.R.; Hille, R.; Gustafson, T.L.; Sayre, R.T. Functional asymmetry of photosystem II D1 and D2 peripheral chlorophyll mutants of Chlamydomonas reinhardtii. Proc. Natl. Acad. Sci. USA 2002, 99, 4091–4096. [Google Scholar] [CrossRef] [PubMed]
  68. Kanchanawong, P.; Dahlbom, M.G.; Treynor, T.P.; Reimers, J.R.; Hush, N.S.; Boxer, S.G. Charge delocalization in the special-pair radical cation of mutant reaction centers of Rhodobacter sphaeroides from Stark spectra and nonadiabatic spectral simulations. J. Phys. Chem. B 2006, 110, 18688–18702. [Google Scholar] [CrossRef]
  69. Katilius, E.; Turanchik, T.; Lin, S.; Taguchi, A.K.W.; Woodbury, N.W. B-Side Electron Transfer in a Rhodobacter sphaeroides Reaction Center Mutant in Which the B-Side Monomer Bacteriochlorophyll Is Replaced with Bacteriopheophytin. J. Phys. Chem. B 1999, 103, 7386–7389. [Google Scholar] [CrossRef]
  70. Nabedryk, E.; Schulz, C.; Müh, F.; Lubitz, W.; Breton, J. Heterodimeric versus homodimeric structure of the primary electron donor in Rhodobacter sphaeroides reaction centers genetically modified at position M202. Photochem. Photobiol. 2000, 71, 582–588. [Google Scholar] [CrossRef]
  71. Bylina, E.J.; Youvan, D.C. Directed mutations affecting spectroscopic and electron transfer properties of the primary donor in the photosynthetic reaction center. Proc. Natl. Acad. Sci. USA 1988, 85, 7226–7230. [Google Scholar] [CrossRef]
  72. Schulz, C.; Müh, F.; Beyer, A.; Jordan, R.; Schlodder, E.; Lubitz, W. Investigation of Rhodobacter Sphaeroides Reaction Center Mutants with Changed Ligands to the Primary Donor. In Photosynthesis: Mechanisms and Effects: Volume I–V: Proceedings of the XIth International Congress on Photosynthesis, Budapest, Hungary, 17–22 August 1998; Garab, G., Ed.; Springer: Dordrecht, The Netherlands, 1998; pp. 767–770. [Google Scholar]
  73. Fuchs, M.R.; Schnegg, A.; Plato, M.; Schulz, C.; Müh, F.; Lubitz, W.; Möbius, K. The primary donor cation P+ in photosynthetic reaction centers of site-directed mutants of Rhodobacter sphaeroides: G-tensor shifts revealed by high-field EPR at 360 GHz/12.8 T. Chem. Phys. 2003, 294, 371–384. [Google Scholar] [CrossRef]
  74. Vasilieva, L.G.; Fufina, T.Y.; Gabdulkhakov, A.G.; Leonova, M.M.; Khatypov, R.A.; Shuvalov, V.A. The site-directed mutation I(L177)H in Rhodobacter sphaeroides reaction center affects coordination of PA and BB bacteriochlorophylls. Biochim. Biophys. Acta (BBA) Bioenerg. 2012, 1817, 1407–1417. [Google Scholar] [CrossRef] [PubMed]
  75. Leonova, M.M.; Vasilieva, L.G.; Khatypov, R.A.; Boichenko, V.A.; Shuvalov, V.A. Properties of mutant reaction centers of Rhodobacter sphaeroides with substitutions of histidine L153, the axial Mg2+ ligand of bacteriochlorophyll BA. Biochemistry 2009, 74, 452–460. [Google Scholar] [CrossRef] [PubMed]
  76. Klimov, V.V.; Klevanik, A.V.; Shuvalov, V.A.; Kransnovsky, A.A. Reduction of pheophytin in the primary light reaction of photosystem II. FEBS Lett. 1977, 82, 183–186. [Google Scholar] [CrossRef]
  77. Fowler, G.J.S.; Visschers, R.W.; Grief, G.G.; van Grondelle, R.; Hunter, C.N. Genetically modified photosynthetic antenna complexes with blueshifted absorbance bands. Nature 1992, 355, 848–850. [Google Scholar] [CrossRef]
  78. Olsen, J.D.; Sockalingum, G.D.; Robert, B.; Hunter, C.N. Modification of a hydrogen bond to a bacteriochlorophyll a molecule in the light-harvesting 1 antenna of Rhodobacter sphaeroides. Proc. Natl. Acad. Sci. USA 1994, 91, 7124–7128. [Google Scholar] [CrossRef] [PubMed]
  79. Balaban, T.S.; Braun, P.; Hättig, C.; Hellweg, A.; Kern, J.; Saenger, W.; Zouni, A. Preferential pathways for light-trapping involving β-ligated chlorophylls. Biochim. Biophys. Acta (BBA) Bioenerg. 2009, 1787, 1254–1265. [Google Scholar] [CrossRef]
  80. Renger, G.; Pieper, J.; Theiss, C.; Trostmann, I.; Paulsen, H.; Renger, T.; Eichler, H.J.; Schmitt, F.J. Water soluble chlorophyll binding protein of higher plants: A most suitable model system for basic analyses of pigment–pigment and pigment–protein interactions in chlorophyll protein complexes. J. Plant Physiol. 2011, 168, 1462–1472. [Google Scholar] [CrossRef]
  81. Messinger, J.; Alia, A.; Govindjee. Special educational issue on ‘Basics and application of biophysical techniques in photosynthesis and related processes’. Photosynth. Res. 2009, 101, 89–92. [Google Scholar] [CrossRef]
  82. Holm, L.; Sander, C. Protein structure comparison by alignment of distance matrices. J. Mol. Biol. 1993, 233, 123–138. [Google Scholar] [CrossRef]
  83. Shindyalov, I.N.; Bourne, P.E. Protein structure alignment by incremental combinatorial extension (CE) of the optimal path. Protein Eng. 1998, 11, 739–747. [Google Scholar] [CrossRef] [PubMed]
  84. Zhang, Y.; Skolnick, J. TM-align: A protein structure alignment algorithm based on the TM-score. Nucleic Acids Res. 2005, 33, 2302–2309. [Google Scholar] [CrossRef] [PubMed]
  85. Ballester, P.J.; Richards, W.G. Ultrafast shape recognition to search compound databases for similar molecular shapes. J. Comput. Chem. 2007, 28, 1711–1723. [Google Scholar] [CrossRef]
  86. Konc, J.; Janežič, D. ProBiS algorithm for detection of structurally similar protein binding sites by local structural alignment. Bioinformatics 2010, 26, 1160–1168. [Google Scholar] [CrossRef] [PubMed]
  87. Kufareva, I.; Abagyan, R. Methods of protein structure comparison. Methods Mol. Biol. 2012, 857, 231–257. [Google Scholar]
  88. Luo, L.; Milon, T.I.; Tandoh, E.K.; Galdamez, W.J.; Chistoserdov, A.Y.; Yu, J.; Kern, J.; Wang, Y.; Xu, W. Development of a TSR-based method for understanding structural relationships of cofactors and local environments in photosystem I. BMC Bioinform. 2025, 26, 15. [Google Scholar] [CrossRef]
  89. Xu, W.; Xie, X.-J.; Faust, A.; Liu, M.; Li, X.; Chen, F.; Naquin, A.; Walton, A.; Kishbaugh, P.; Ji, J.-Y. All-Atomic Molecular Dynamic Studies of Human and Drosophila CDK8: Insights into Their Kinase Domains, the LXXLL Motifs, and Drug Binding Site. Int. J. Mol. Sci. 2020, 21, 7511. [Google Scholar] [CrossRef]
  90. Guru, D.S.; Nagabhushan, P. Triangular spatial relationship: A new approach for spatial knowledge representation. Pattern Recognit. Lett. 2001, 22, 999–1006. [Google Scholar] [CrossRef]
  91. Jaccard, P. Etude comparative de la distribution florale dans une portion des Alpes et des Jura. Bull. Soc. Vaudoise Sci. Nat. 1901, 37, 547–579. [Google Scholar]
  92. Ackerman, M.; Ben-David, S. A characterization of linkage-based hierarchical clustering. J. Mach. Learn. Res. 2016, 17, 8182–8198. [Google Scholar]
  93. Kondra, S.; Chen, F.; Chen, Y.; Chen, Y.; Collette, C.J.; Xu, W. A study of a hierarchical structure of proteins and ligand binding sites of receptors using the triangular spatial relationship-based structure comparison method and development of a size-filtering feature designed for comparing different sizes of protein structures. Proteins 2022, 90, 239–257. [Google Scholar] [PubMed]
  94. Humphrey, W.; Dalke, A.; Schulten, K. VMD: Visual molecular dynamics. J. Mol. Graph. 1996, 14, 33–38. [Google Scholar] [CrossRef] [PubMed]
Figure 1. Objective of this study and questions to be addressed. (a) Two types of pigment 3D structures are shown. There are two structure instances for the pigment type A and there are three structure instances for the pigment type B. A common substructure belonging to all the instances in the pigment types A and B, and specific substructures exclusively belonging to each instance either in the pigment type A or in the pigment type B, are illustrated. (b) A cluster presentation shows a hierarchical relationship between the instances in the pigment type A and the instances in the pigment type B (left panel). Conformational changes in two pigments are illustrated after they bind their protein binding sites. The differences in the size of their protein binding sites (smaller vs. larger) are shown and labeled. (c) The difference in geometry of a triangle between the amino acid not ligating to Chls (left side) and the amino acid ligating to Chls (right side) is shown. (ac) The questions #1, #2, and #3 to be addressed are shown in (a), (b), and (c), respectively.
Photochem 05 00008 g001
Figure 2. Clustering and classification of pigment 3D structures using the TSR algorithm. (a) Twenty-one different types of pigments were arranged in a hierarchical manner. The hierarchical arrangement includes one root and three levels (level 1, level 2, and level 3). The numbers of structures in each node are labeled. (b) TSR keys were calculated for each pigment 3D structure. The Generalized Jaccard coefficient measure was used to calculate pairwise structural similarity for every pigment pair. A hierarchical cluster approach was used to present their structural relationships. Two well-separated clusters and the number of pigment 3D structures used in the analysis are labeled. The colors on the lower left side indicate structural distances. Representative structures of three types of pigments (PQN, CHL, and HEME A) are illustrated. PDB IDs and chain and residue IDs and types are labeled. (c) The confusion matrix shows the result from the classification analysis of pigment 3D structures. Abbreviations of pigments and numbers of pigment structures are shown.
Photochem 05 00008 g002
Figure 3. Signature substructures were identified exclusively for Chl d or Chl f. (a) The numbers of specific and distinct TSR keys were identified exclusively for Chl f or HAS not for any of the other pigment structures in the pigment dataset (Supplementary Materials, File S1). The numbers of Chl f (F6C) and HAS structures are labeled. (b) Side-by-side comparison of MaxDist of two triangles (CHA_C2A_MG and CHB_C2B_MG) between Chls f and other types of Chls. The numbers of Chl f structures and other types of Chl structures and average MaxDist values are labeled. ** means a p value is less than 0.01 in a t-test. (c) Side-by-side comparison of Theta of two triangles (CHA_C2A_MG and CHB_C2B_MG) between Chls f and other types of Chls. The numbers of Chl f structures and other types of Chl structures and average Theta values are labeled. (d) A representative Chl f structure is illustrated. PDB IDs, Chl f’s name (F6C), chain and residue IDs, and the atoms associated with the two specific TSR keys are labeled. (e) Side-by-side comparison of MaxDist of one triangle (CHA_CBD_MG) between Chls d and other types of Chls. The numbers of Chl d (CL7) structures and other types of Chl structures and average MaxDist values are labeled. (f) Side-by-side comparison of Theta of one triangle (CHA_CBD_MG) between Chls d and other types of Chls. The numbers of Chl d (CL7) structures and other types of Chl structures and average Theta values are labeled. (g) A representative Chl d structure is illustrated. PDB IDs, Chl d’s name (CL7), chain and residue IDs, and the atoms associated with the specific TSR key are labeled. (c,f) *** means a p value is less than 0.001 in a t-test; (b,c,e,f) SDs are shown in the plots.
Photochem 05 00008 g003
Figure 4. A signature substructure was identified for distinguishing two Chl clusters. (a) TSR keys were calculated for each Chl 3D structure. The Generalized Jaccard coefficient measure was used to calculate pairwise structural similarity for every Chl pair. A hierarchical cluster approach was used to present their structural relationships. Two clusters and numbers of Chl 3D structures in each cluster and total Chl structures are labeled. The colors on the lower left side indicate structural distances. (b) Side-by-side comparison of MaxDist of one triangle (CBC_C11_NC) between Chl group 1 (CHL_G1) and Chl group 2 (CHL_G2). The numbers of Chl structures in each cluster and average MaxDist values are labeled. (c) Side-by-side comparison of Theta of one triangle (CBC_C11_NC) between Chl group 1 (CHL_G1) and Chl group 2 (CHL_G2). The numbers of Chl structures in each cluster and average Theta values are labeled. (d) A representative Chl group 1 (CHL_G1) structure is illustrated. PDB IDs, Chl’s name (BCL), chain and residue IDs, and the atoms associated with the specific TSR key are labeled. (e) A representative Chl group 2 (CHL_G2) structure is illustrated. PDB IDs, Chl’s name (BCL), chain and residue IDs, and the atoms associated with the specific TSR key are labeled. (f) Side-by-side comparison of numbers of Chl surrounding amino acids between Chl group 1 (CHL_G1) and Chl group 2 (CHL_G2). The numbers of Chl structures in each cluster and average amino acid numbers are labeled. (g) Side-by-side comparison of the top three abundant surrounding amino acids between Chl group 1 (CHL_G1) and Chl group 2 (CHL_G2). The numbers of Chl structures in each cluster and average amino acid numbers are labeled. (h) A model shows the differences in conformations of Chls and their surrounding amino acids. The size of the letter presenting amino acids indicates relative abundance. A larger letter means a high abundance. Less and more surrounding amino acids are labeled. (b,c,f,g) SDs are shown in the plots; (b,c,f) *** means a p value is less than 0.001 in a t-test; and (f,g) a cutoff value for surrounding amino acids is 4.0 Å.
Photochem 05 00008 g004
Figure 5. A signature substructure was identified for distinguishing three Chl a clusters. (a) TSR keys were calculated for each Chl a 3D structure. The Generalized Jaccard coefficient measure was used to calculate pairwise structural similarity for every Chl a pair. A hierarchical cluster approach is used to present their structural relationships. Three clusters and numbers of Chl a 3D structures in each cluster and total Chl a structures are labeled. The colors on the lower left side indicate structural distances. (b) Frequency counts of pairwise structural similarities of Chls a from 0% to 100% with an interval of 1% were calculated and are present. The number of Chl a structures is labeled. (c) The numbers of distinct, total, distinct common, and total common TSR keys were calculated and are present for the structures in the pigment dataset, Chls sub dataset, and Chl a sub dataset. The average numbers and numbers of structures in each dataset are labeled. (d) Side-by-side comparison of MaxDist of one triangle (NA_NB_C15) among Chl a group A (CLA_GA), Chl a group B (CLA_GB), and Chl a group C (CLA_GC). The numbers of Chl a structures in each cluster and average MaxDist values are labeled. (e) Side-by-side comparison of Theta of one triangle (NA_NB_C15) among Chl a group A (CLA_GA), Chl a group B (CLA_GB), and Chl a group C (CLA_GC). The numbers of Chl a structures in each cluster and average Theta values are labeled. (fh) Representative Chl a structures for CLA_GA (f), CLA_GB (g), and CLA_GC (h) are illustrated. PDB IDs, Chl a’s names (CLA), chain and residue IDs, and the atoms associated with the specific TSR key are labeled. (i) Side-by-side comparison of numbers of Chl a surrounding amino acids among Chl a group A (CLA_GA), Chl a group B (CLA_GB), and Chl a group C (CLA_GC). The numbers of Chl a structures in each cluster and average amino acid numbers are labeled. (j) Side-by-side comparison of the top three abundant surrounding amino acids among Chl a group A (CLA_GA), Chl a group B (CLA_GB), and Chl a group C (CLA_GC). The numbers of Chl a structures in each cluster and average amino acid numbers are labeled. (d,e,i) *** means a p value is less than 0.001 in a t-test; (ce,i,j) SDs are shown in the plots; and (i,j) a cutoff value for surrounding amino acids is 4.0 Å.
Photochem 05 00008 g005
Figure 6. Diversity of binding sites of various Chls types. (aj) Top six abundant surrounding amino acids for Chl a: CLA (a), Chl a isomer: CL0 (b), Chl b: CHL (c), Chl d: CL7 (d), Chl f: F6C (e), pheophytin a: PHO (f), BChl a: BCL (g), BChl b: BCB (h), bacteriopheophytin a: BPH (i), and bacteriopheophytin b: BPB (j). A cutoff value for surrounding amino acids is 3.5 Å. (k,l) Representative structures for BChl a: BCL (k) and pheophytin a: PHO (l) and their close interacting amino acids are illustrated. PDB IDs, Chl names (BCL and PHO), chains, amino acids, and residue IDs for BCL, PHO, and amino acids are labeled. Axial ligand interaction and hydrogen bonds are labeled with dashed lines.
Photochem 05 00008 g006
Figure 7. A signature substructure was identified for distinguishing histidine residues ligating a Mg2+ ion of Chl a from histidine residues not ligating a Mg2+ ion of Chl a. (a) TSR keys were calculated for each histidine structure. The Generalized Jaccard coefficient measure was used to calculate pairwise structural similarity for every histidine pair. A hierarchical cluster approach was used to present their structural relationships. Two clusters and total histidine structures are labeled. The colors on the upper left side indicate structural distances. (b) Frequency counts of pairwise structural similarities of histidine residues from 0% to 100% with an interval of 1% were calculated and are present. The number of histidine structures is labeled. (c) The numbers of distinct, total, distinct common, and total common TSR keys were calculated and are present for the structures in the histidine dataset. Average numbers, numbers of structures, and the possible corresponding triangles to the common key are labeled. (d) Side-by-side comparison of MaxDist of one triangle (C_O_CB) between the histidine residues ligating the central Mg ion of Chls and the histidine residues not ligating the central Mg2+ ion of Chls. The numbers of histidine structures and average MaxDist values are labeled. (e) Side-by-side comparison of Theta of one triangle (C_O_CB) between the histidine residues ligating the central Mg2+ ion of Chls and the histidine residues not ligating the central Mg2+ ion of Chls. The numbers of histidine structures and average Theta values are labeled. (f) A 2D histidine structure is illustrated; atom names are labeled. (g) A representative structure illustrates axial ligand interaction between Chl a and histidine. PDB ID, Chl’s name (CLA), and chain, amino acid, and residue IDs for CLA and His are labeled. The axial ligand interaction is labeled with dashed lines. (h,i) Two representative histidine 3D structures are shown. One structure presents a histidine that ligates to the central Mg2+ ion of Chl a and the other structure presents a histidine that does not ligate to the central Mg2+ ion of Chl a. PDB IDs, and chain and histidine residue positions are labeled. (j) A model shows the differences in conformations of histidine residues between ligating and not ligating a central Mg2+ ion of Chl a. The dashed line shows the coordination bond between histidine and a Chl a. (d,e) *** means a p value is less than 0.001 in a t-test. A cutoff value for axial ligand interaction is 3.0 Å; (ce) SDs are shown in the plots.
Photochem 05 00008 g007
Disclaimer/Publisher’s Note: The statements, opinions and data contained in all publications are solely those of the individual author(s) and contributor(s) and not of MDPI and/or the editor(s). MDPI and/or the editor(s) disclaim responsibility for any injury to people or property resulting from any ideas, methods, instructions or products referred to in the content.

