Article

Optimization of CdSe Thin-Film Photoelectrochemical Cells: Effects of NaOH/Na2S/S Redox Couple Concentration and Activity on Cell Efficiency

Chemistry Department, An-Najah National University, Nablus P.O. Box 7, Palestine
Photochem 2024, 4(3), 334-345; https://doi.org/10.3390/photochem4030020
Submission received: 6 June 2024 / Revised: 5 August 2024 / Accepted: 8 August 2024 / Published: 10 August 2024

Abstract

:
This study investigates the relationships among redox couple activity, electrolyte concentration, and efficiency in CdSe thin-film photoelectrochemical solar cells. A CdSe photo-electrode was prepared using the electro-depositing technique to produce well-staged layering of CdSe, followed by chemical bath deposition to produce a layer with an acceptable thickness to absorb enough photons to create a suitable amount of photocurrent. The CdSe photo-electrochemical cell was tested under various concentrations of a NaOH/Na2S/S electrolyte solution. The results showed that the activity of the redox couple greatly affected the efficiencies of the solar cells. Correlation plots between ionic strength and PEC efficiency with the Debye–Hückel equation yielded an R² value of 0.96, while those between ionic strength and photocurrent density had an R² value of 0.92. The correlation between concentration and PEC efficiency was much weaker. This paper highlights how optimal ionic activity increases the performance of photoelectrochemical solar cells, which consequently improves the conversion efficiency of solar energy.

1. Introduction

As climate change and sustainable energy have become pressing issues of the 21st century, researchers have been driven to explore and develop renewable energy technologies. Solar energy has quickly become a clear frontrunner among these technologies because of its immense availability and minimal environmental impact. Among solar energy technologies, the use of photoelectrochemical cells for the conversion of solar energy into electricity current is a promising route toward sustainable solar harvesting and energy conversion [1,2,3,4]. Central to photoelectrochemical cells are photoelectrodes, which are photoactive electrodes responsible for the absorption of sunlight and the triggering of redox reactions in energy conversion. Several materials have been investigated as photoelectrodes, and chalcogenides have been found to be very promising [1,2,3,4,5].
Cadmium selenide (CdSe) is a thin film that has been proven to be one of the best photoelectrochemical materials [6,7]. The PEC properties of CdSe include a perfect band gap for visible light absorption and favorable electronic characteristics for efficient charge transport [8]. This set of properties makes the CdSe thin film highly effective at improving photoelectrochemical cell efficiency and thereby places it among the top candidates for efficient solar energy conversion. Central to the operation of photoelectrochemical cells is the redox couple electrolyte, which facilitates the transfer of electrons from the photoelectrode to the counter electrode through spontaneous oxidation and reduction reactions [9], enabling the electrochemical processes that generate electric current [9,10,11,12,13,14,15].
Therefore, the selection of the redox couple electrolyte is important to the overall efficiency of the photoelectrochemical cell because it affects the kinetics of the electrochemical reactions and the over-potential required for the reactions [12,13,16,17,18,19]. The redox couple electrolytes should ideally have fast reaction kinetics, high stability, and low over-potential for the realization of the maximum efficiency of the photoelectrochemical cell while being compatible with the photoelectrode material for long-term stability and performance [14,19,20,21]. Traditionally, the concentration of the redox couple solution has been the main focus in optimization efforts in PEC cells [22]. However, recent developments in this field have underscored that the solution activity determines cell performance. In fact, the activity, not the molar concentration, directly affects the kinetics of charge transfer processes at the semiconductor–electrolyte interface and hence the cell efficiency [23,24,25]. Such a realization has led to a paradigm shift in optimization strategies for PEC cells; increasing emphasis is now placed on understanding and exploiting the effects of the activity of the redox couple solution.
In this study, we examined in detail the effects of the concentration and activity of a redox couple solution on the efficiency of CdSe thin-film photoelectrochemical cells. A theoretical and experimental study on the interplay between the properties of the redox couple solution (NaOH/Na2S/S) and cell performance will be performed. Activity coefficients and departures from ideal behavior in redox couple solutions will be modeled using the Debye–Hückel equation [26,27]. By changing the concentrations within the redox couple solution, the activity of these solutions will be calculated so that the effect of solution activity on cell efficiency can be isolated [28]. The theoretical findings will be validated by experiments to gain insight into the real-life performance of CdSe thin-film photoelectrochemical cells operating under a wide range of redox couple solution concentrations. The growth of thin films of CdSe will be achieved by electrodeposition followed by chemical deposition [6,29]. This will be done to produce thin films exhibiting optimal thickness and quality characteristics for efficient charge transport and light absorption [6].
The performance will be assessed against a diversity of metrics, including J–V plots and measurements of efficiency, thus allowing a more in-depth understanding of the impact of redox couple solution properties on cell performance. Overall, this research redefines the optimization paradigm of solar cell technologies by focusing on the activity instead of the molar concentration of the redox couple solution. It is our hope that we are in a position to generate new methodologies that will maximize the efficiency and sustainability of CdSe thin-film photoelectrochemical cells, which are integrated into the theoretical understanding of the subject and then experimentally validated, toward the advancement of renewable energy technologies and a global transition to a cleaner, more sustainable future.

2. Experimental

2.1. Chemicals

High-quality chemicals and materials were obtained from reputable suppliers to ensure the success of the experiments. Sigma-Aldrich, Frutarom, and Merck provided the pure forms of cadmium chloride (CdCl2) 99.9%, sodium sulfide (Na2S) 99.8%, sulfur (S) 99.9%, hydrochloric acid (HCl) 36%, sodium selenite (Na2SeO3) 98%, selenium powder (Se) 99.99%, triethanolamine 99%, and ammonium chloride (NH4Cl) 99.5%. Riedel-DeHaën provided solvents with analytical-grade purity, such as methanol 99.9%, dichloromethane 99.8%, and DMF 99.8%. Glass/FTO substrates with a surface resistivity of approximately 7 Ω/sq were obtained from Aldrich, and a transparent and conductive surface was made for material deposition. These diverse ranges of chemical suppliers ensured that high-quality materials for the experimental procedure were available.

2.2. Equipment

Fine measurements of the solid-state electronic absorption spectra of the CdSe films were taken using a Shimadzu UV-1601 spectrophotometer from Shimadzu, Tokyo, Japan. Baseline corrections were taken by taking readings with glass/FTO substrates. Accurate X-ray diffraction patterns were recorded on a Philips XRD XPERT PRO diffractometer system from PANalytical (Almelo, The Netherlands), a standard instrument from Philips, Netherlands, used for experiments in the UAE.
Its film morphology was characterized in detail using a Jeol JSM-6700F state-of-the-art scanning electron microscope from Jeol Ltd. (Tokyo, Japan), which is also used in the UAE. The remaining characterization was J–V characterization via the CV technique and was performed using a CS310 electrochemical workstation from the same company equipped with a fast digital function generator. The illumination used was a 50 W halogen spot lamp that provided an extended spectral range from 350–800 nm and high stability, which guaranteed that the outcome would be consistent throughout the experiment.

2.3. The CdSe Thin-Film Electrode Preparation

2.3.1. Electrodeposition Step, ED

The ECD process was carried out based on the principles mentioned in reference [6] with some modifications to the conditions for the optimization process. FTO/glass substrates, with a dipping area of 3 cm × 1 cm, were used as the working electrodes in this process. The platinum sheet used as the counter electrode was connected to a precalibrated Ag/AgCl reference electrode in conjunction with these electrodes [30].
The working electrodes were carefully immersed in a solution that consisted of 0.008 M cadmium chloride dihydrate (CdCl2·H2O) and 0.005 M sodium selenite (Na2SeO3). A solution of Na2SeO3 was prepared by adding selenium powder to distilled water and a 1 M aqueous solution of sodium sulfite, followed by refluxing at 90 °C for 15 hrs. This solution was filtered and preserved for use in this work. The CdCl2 solution was prepared by dissolving cadmium chloride in distilled water to a concentration of 0.50 M. This solution was then mixed in a beaker with the Na2SeO3 solution before volume adjustment to 100 mL by the addition of distilled water, and the mixture was then stirred to homogeneity. The pH of the solution was adjusted by the addition of a few drops of ammonium solution, which increased the pH to approximately 11. Before deposition, nitrogen gas (99.999%) was bubbled through the solution for 5 min to expel the oxygen dissolved in the solution. Nitrogen gas was bubbled throughout the deposition time. Gentle stirring was performed to ensure that the solution was mixed homogeneously. The deposition was performed in DC stripping mode under an applied potential of −1.0 V with respect to the Ag/AgCl reference electrode. The electrochemical workstation used in this work was a CS310 electrochemical workstation containing a fast digital function generator and used as a potentiostat/galvanostat from Hubei, China. To avoid volume loss of the solution, water drops were judiciously added during the deposition. The depositions were performed at 45 min. The film annealed for 15 min showed preferred characteristics unless otherwise stated. After deposition, the samples were removed from the solution and washed with distilled water to remove excess reactants. Then, the sample was dried by blowing nitrogen gas over it and stored in a desiccator to prevent moisture from affecting its properties. The average film thickness was measured by both gravimetry and electrochemical calculations using Faraday’s law. In the gravimetry measurements, a density of 5.42 g/cm2 was assumed, and the average film thickness was approximately 400 nm, which agreed with the results of the electrochemical calculations. The conductivity of the CdSe film was deduced by plotting the current density vs. applied potential and 4-probe methods. Its value was approximately 1.8 × 10⁻⁴ (Ω·cm)−1.

2.3.2. The Chemical Bath Deposition Step, CBD

The procedure used for the CBD process was based on previous literature [6] but with slight modifications to optimize the conditions. In the present work, two complexing agents, namely, triethanolamine (TEA) and ammonia, were used. In the chemical bath, cadmium chloride (CdCl2) was dissolved in distilled water at a concentration of 0.50 M, followed by the addition of TEA (7.4 M) and ammonia (13.4 M). The Na2SeSO3 solution (prepared as described above) was added to the bath in a diluted form with distilled water (20 mL). The materials were added to the reaction container in that particular order for proper mixing [31]. The pH of the solution was adjusted to approximately 11, which was favorable for good deposition. The pre-electrodeposited electrode was then dipped vertically in the solution, and the deposition was allowed to take place at 70 °C for 4 h with continuous gentle stirring. The system was sealed tightly with a rubber seal to avoid contamination. During the deposition process, the color of the solution changed from colorless to pale yellow and finally to red wine, which confirmed that the desired material was formed. After the completion of deposition, the coated substrate was removed from the solution, thoroughly washed with distilled water, and dried in a desiccator. The average thickness of the film measured was approximately 20 μm, and the conductivity was determined to be ~2 × 10⁻⁴ (Ω·cm)−1. The properties of the films were further optimized by thermal annealing under nitrogen at 150 °C using a precisely controlled, thermostated horizontal tube furnace. The films were then allowed to slowly cool to room temperature over a period of 120 min at a controlled cooling rate of 2 °C/min to achieve homogeneous and optimized film properties.

2.4. The Photoelectrochemical Experiment

Prior to the PEC experiments, the ED/CBD CdSe electrodes were subjected to a pre-etching process to ensure the acquisition of a high-quality film surface. The electrode was immersed in a 10% dilute HCl solution (v/v) for 5 s, followed by thorough rinsing with distilled water to remove any impurities [6,32]. This process was repeated two or three times to obtain a shiny and uniform film surface. Afterwards, the electrode was rinsed with distilled water and methanol to remove the remaining impurities and then dried with nitrogen gas to prevent moisture buildup. Then, the as-prepared CdSe film electrode was used as the working electrode in a three-electrode single-compartment photoelectrochemical cell, together with a platinum counter electrode and a reference saturated calomel electrode. An electrochemical workstation (CS310) was used to create J–V plots, which provided information regarding the performance of the electrodes. The redox couples in this study were NaOH/Na2S/S, in which the amount of each ingredient was changed to 0.05 M, 0.10 M, 0.15 M, or 0.20 M for each case to examine the impact of the concentration on the PEC response [6,33]. Before each measurement, the solution was stirred vigorously for 1–2 min to mix evenly, and the process was stopped when the measurement started. To minimize the effect of air contamination, high-purity nitrogen gas (99.999%) was bubbled into the solution for at least 5 min before the experiment, and bubbling continued above the solution throughout the experiment. The solar simulator illumination intensity on the electrode was 0.0055 W cm−2, offering a specified and uniform illumination environment for the PEC experiment.

3. Results and Discussion

3.1. Thin Film Characterization

Figure 1 shows the XRD patterns of the ED CdSe polycrystalline electrode and the CD/CBD-combined CdSe electrode, which were analyzed to determine their structural properties. The XRD patterns reveal that the CdSe films have a nanoscale size, indicating crystallite sizes of 10 to 15 nm for the ED film and 5 to 10 nm for the CBD layer, as determined by the Scherrer equation. In fact, the CBD technique favors epitaxial particle growth. The literature states that the major phase of CdSe films is the cubic crystal phase, which is in good agreement with the results found [33,34]. The XRD pattern displays diffractions at characteristic 2θ angles, corresponding to the (111), (220), and (311) planes of the cubic crystal phase. These reflections are referred to as card numbers 75-1546, and their positions agree with the standard diffraction angles of cubic-phase CdSe. Therefore, the dominant structure of the films is indeed cubic. XRD analysis provides information for understanding the structural properties of electrodes containing both ED CdSe and CD/CBD combined with CdSe, revealing nanosized particles and a dominant cubic crystal phase.
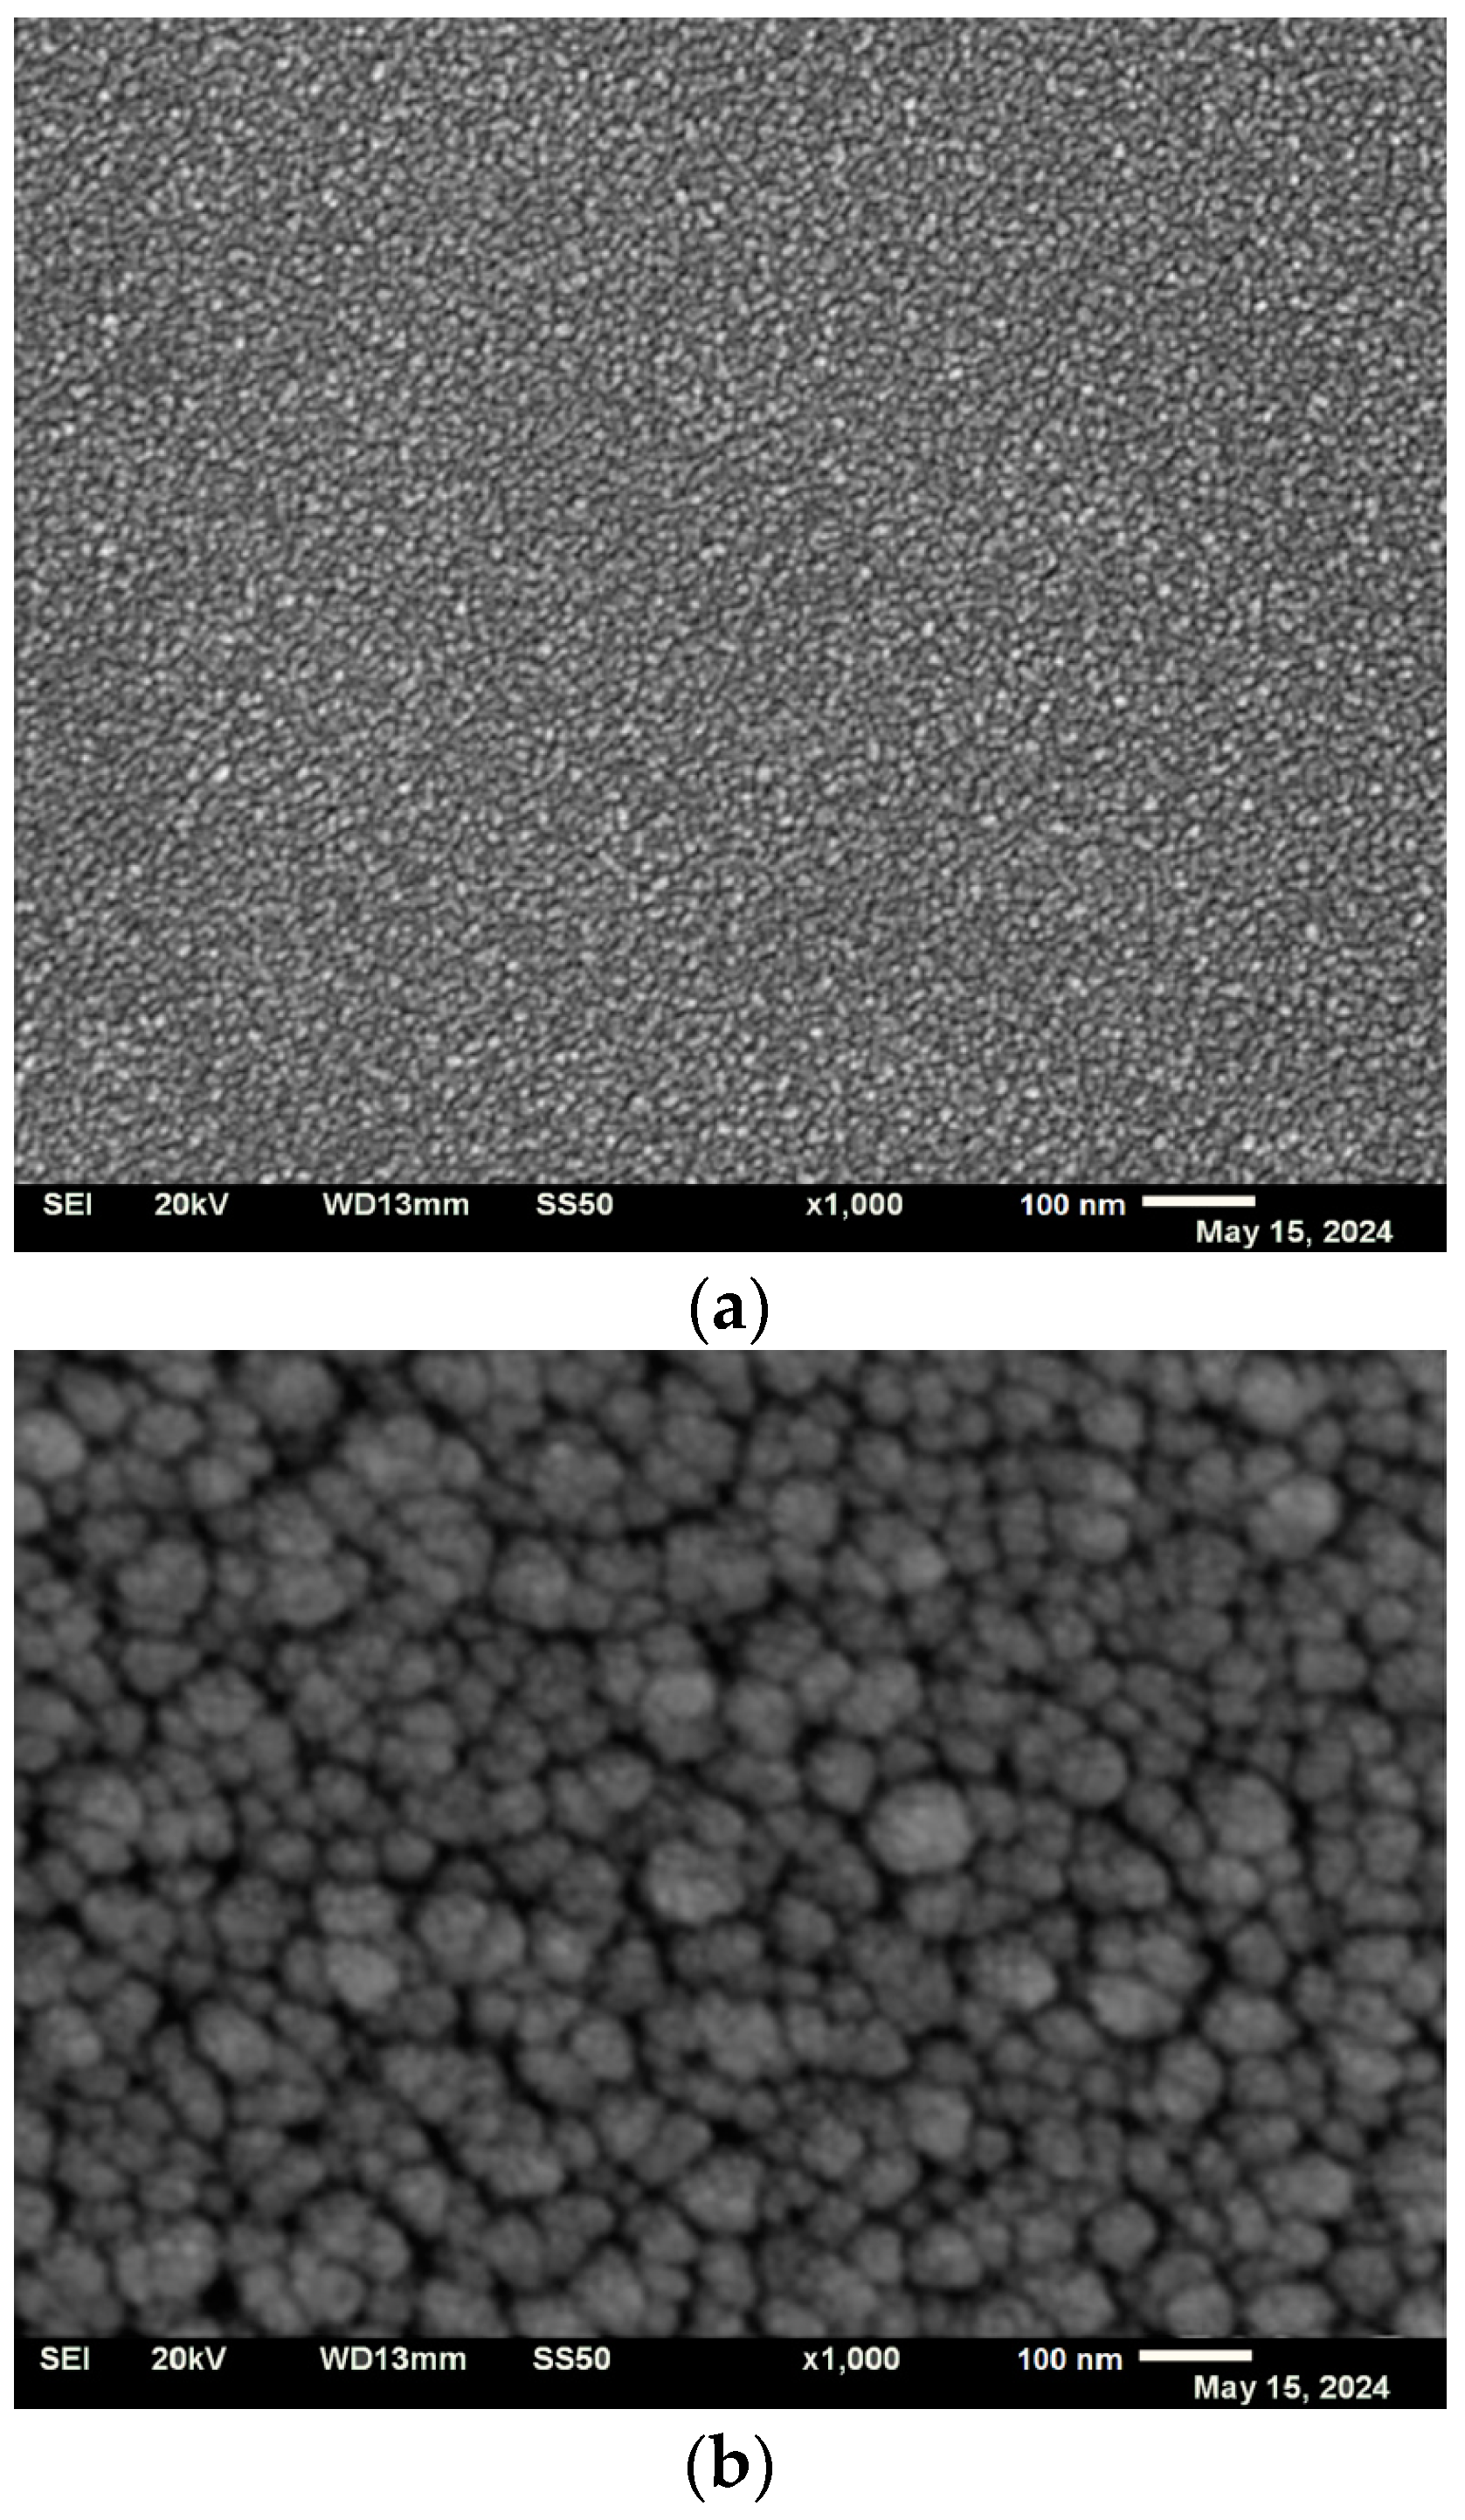
The detailed structural features of the polycrystalline CdSe thin-film electrode are shown in Figure 2, which shows SEM micrographs. The SEM micrographs of the ED film clearly show that the CdSe particles are 15 nm in size, with a uniform distribution in the film. The particles are very well staged with respect to the FTO surface, and there is no agglomeration. In contrast, the CBD technique yields a film consisting of large agglomerates of CdSe with agglomeration sizes between 250 and 500 nm. These agglomerates are composed of several nanosized particles, each approximately 10 nm in diameter; the SEM micrographs resemble earlier SEM micrographs reported for CdSe by CBD in terms of the agglomerate structures and sizes [35,36]. The SEM micrographs also indicate that the agglomerates spread uniformly over the film, leading to a homogeneous surface morphology of the film. Such consistency is important for applications since it can assure uniformity in the physical and chemical properties of the film throughout the electrode. This is an important factor that can affect the reliability and performance of the electrode under practical application conditions. The SEM micrographs of the CdSe thin-film electrode clearly show that there are structural features whose differences show that the results of the ED and CBD techniques are different based on the particle size and particle distribution.
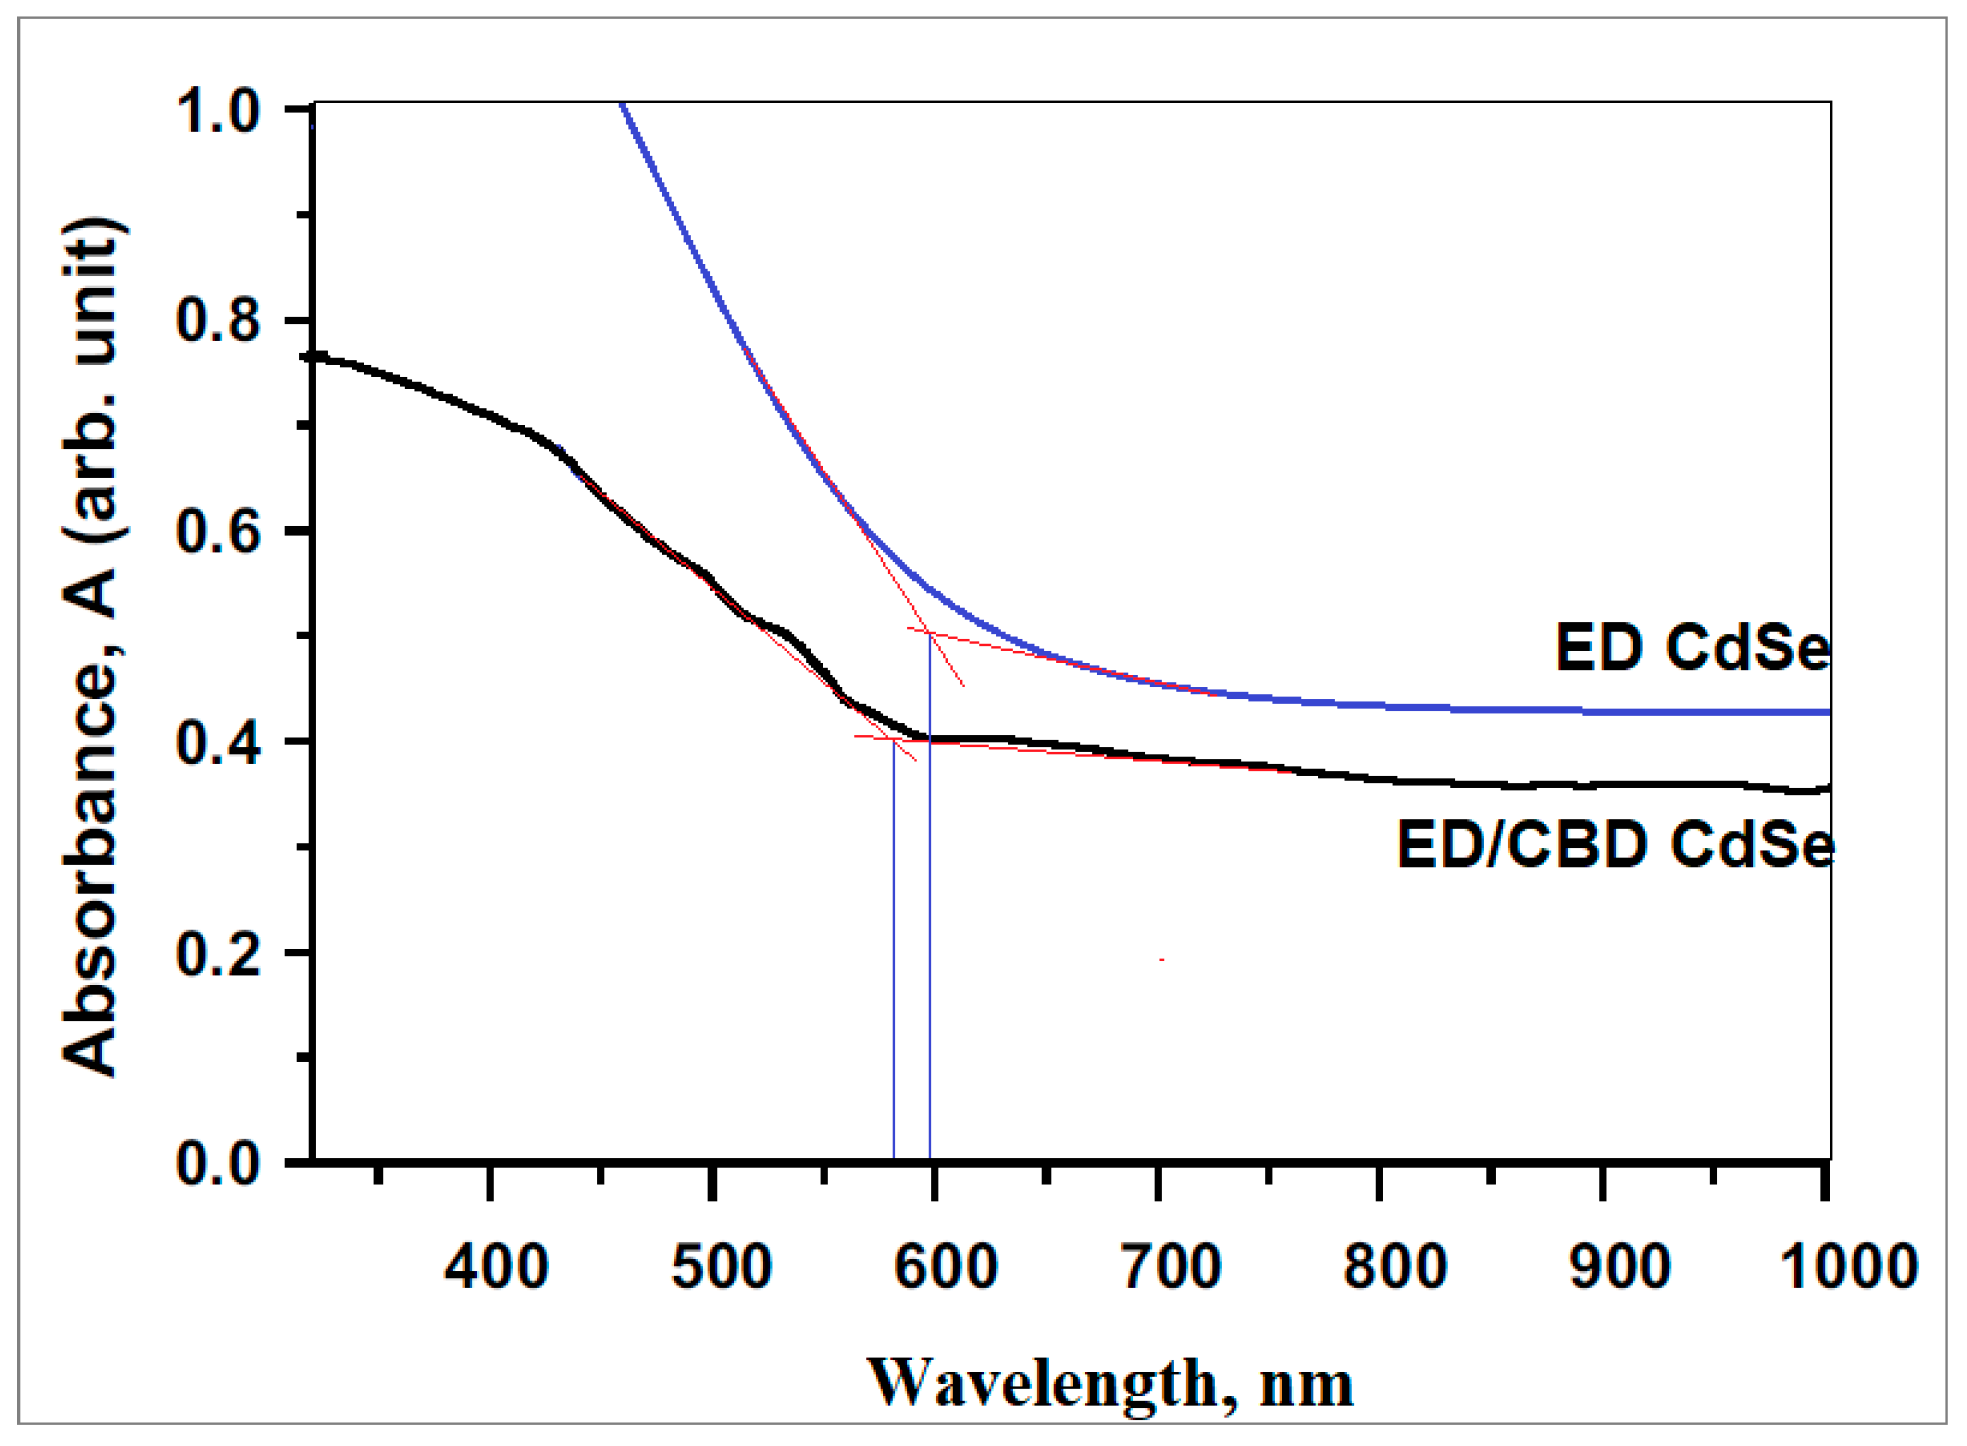
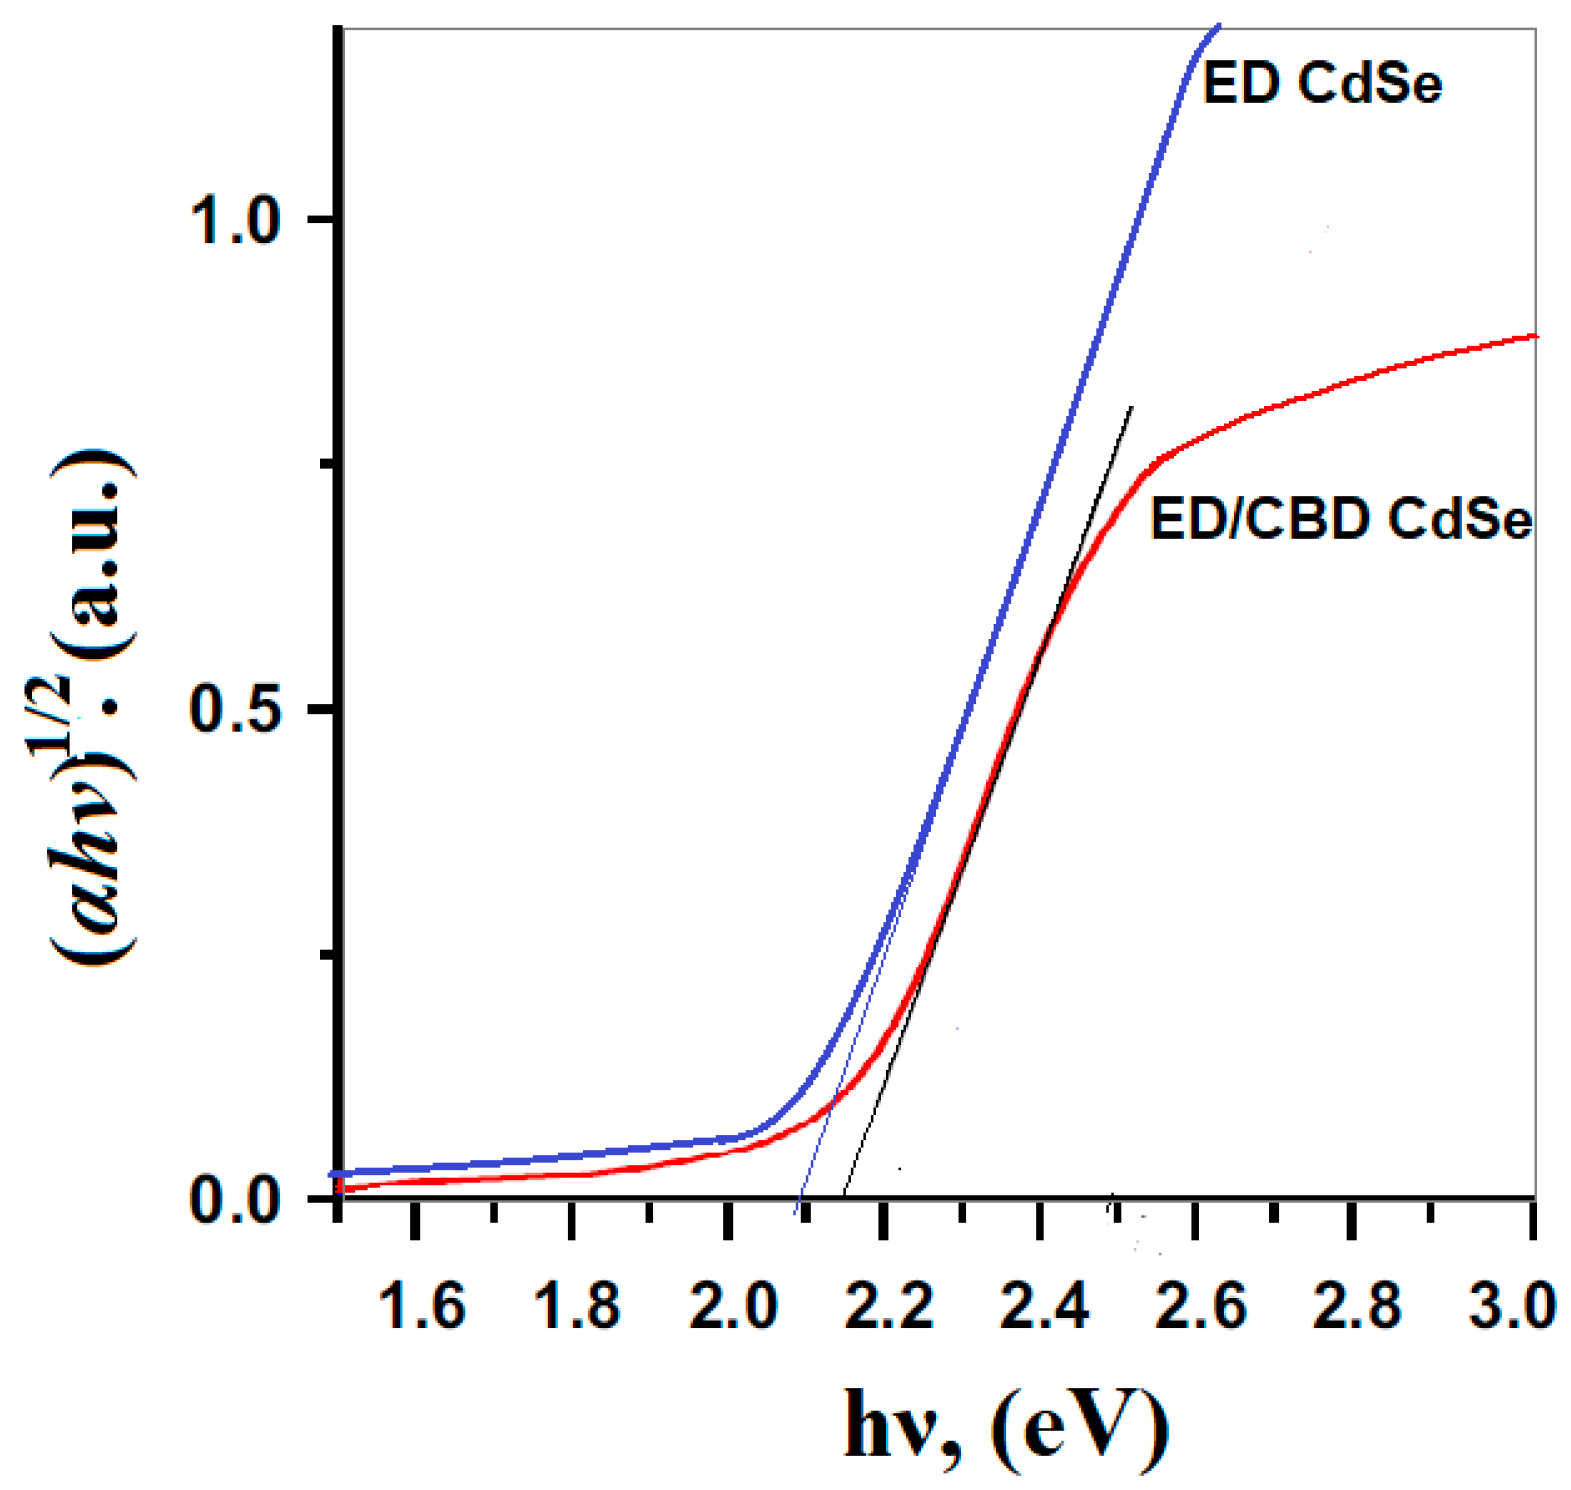
The absorption spectra for the ED CdSe and ED/CBD CdSe thin-film layers were recorded in the solid state, as shown in Figure 3. The absorption spectrum of the ED/CBD CdSe layer exhibited a well-defined absorption edge at approximately 580 nm, indicating a reduction in particle size. Conversely, the ED CdSe layer showed an absorption edge at 598 nm, suggesting the formation of larger particles. These absorption edges are characteristic of CdSe films. The Tauc plot [37], shown in Figure 4, was plotted as αhν versus , where α is the absorptivity, h is the Planck constant, ν is the frequency, and n = ½ for direct allowed electronic transitions. This provides a Tauc plot for the estimation of the band gap energy through the extrapolation of the linear part to the axis. Figure 4 displays the Tauc plot, which is a visual and analytical method for analyzing the bandgap of CdSe thin films. Estimations from this plot show that the CdSe electrode has an approximately 2.10 eV band gap for the ED CdSe layer, indicating larger particle size. Conversely, the ED/CBD CdSe layer shows a 2.14 eV band gap, indicating the formation of smaller particles. The Tauc results are in very good agreement with the literature values [6,38]. This value corresponds to the standard expected bandgap for CdSe since it is a direct bandgap. The bandgap of a CdSe thin film is important for understanding its electronic and optical features because it will directly impact its applicability for use in optoelectronic devices, including solar cells. Accurate estimation of the bandgap may enable better tuning of the features of the material and increase the performance of devices using such CdSe films. The absorption spectra and Tauc plot provide insight into the optical features of CdSe thin films, allowing estimations of the energy of the band gap and its use in optoelectronic devices.

3.2. J–V Characterization

Photocurrent density versus potential (J–V) measurements were used to study the photoelectrochemical (PEC) behavior of the glass/FTO/CdSe thin-film electrodes. The same film was subjected to multiple PEC measurements with different concentrations of the redox couple electrolyte solution. The electrolyte solution included a NaOH/Na2S/S redox couple, whose constituent concentrations were 0.05, 0.10, 0.15, and 0.20 M. The Debye–Hückel equation was used to determine the ionic strength and activity of each component, with the ionic strength and activity values listed in Table 1. The table further shows the total activity of all the ions in the redox electrolyte solution and the total molar concentration. Through this all-rounded study, it was possible to determine the dependence of the PEC performance on the electrolyte concentration and applied light on the importance of the ionic activity, concentration, and photoelectrochemical response.
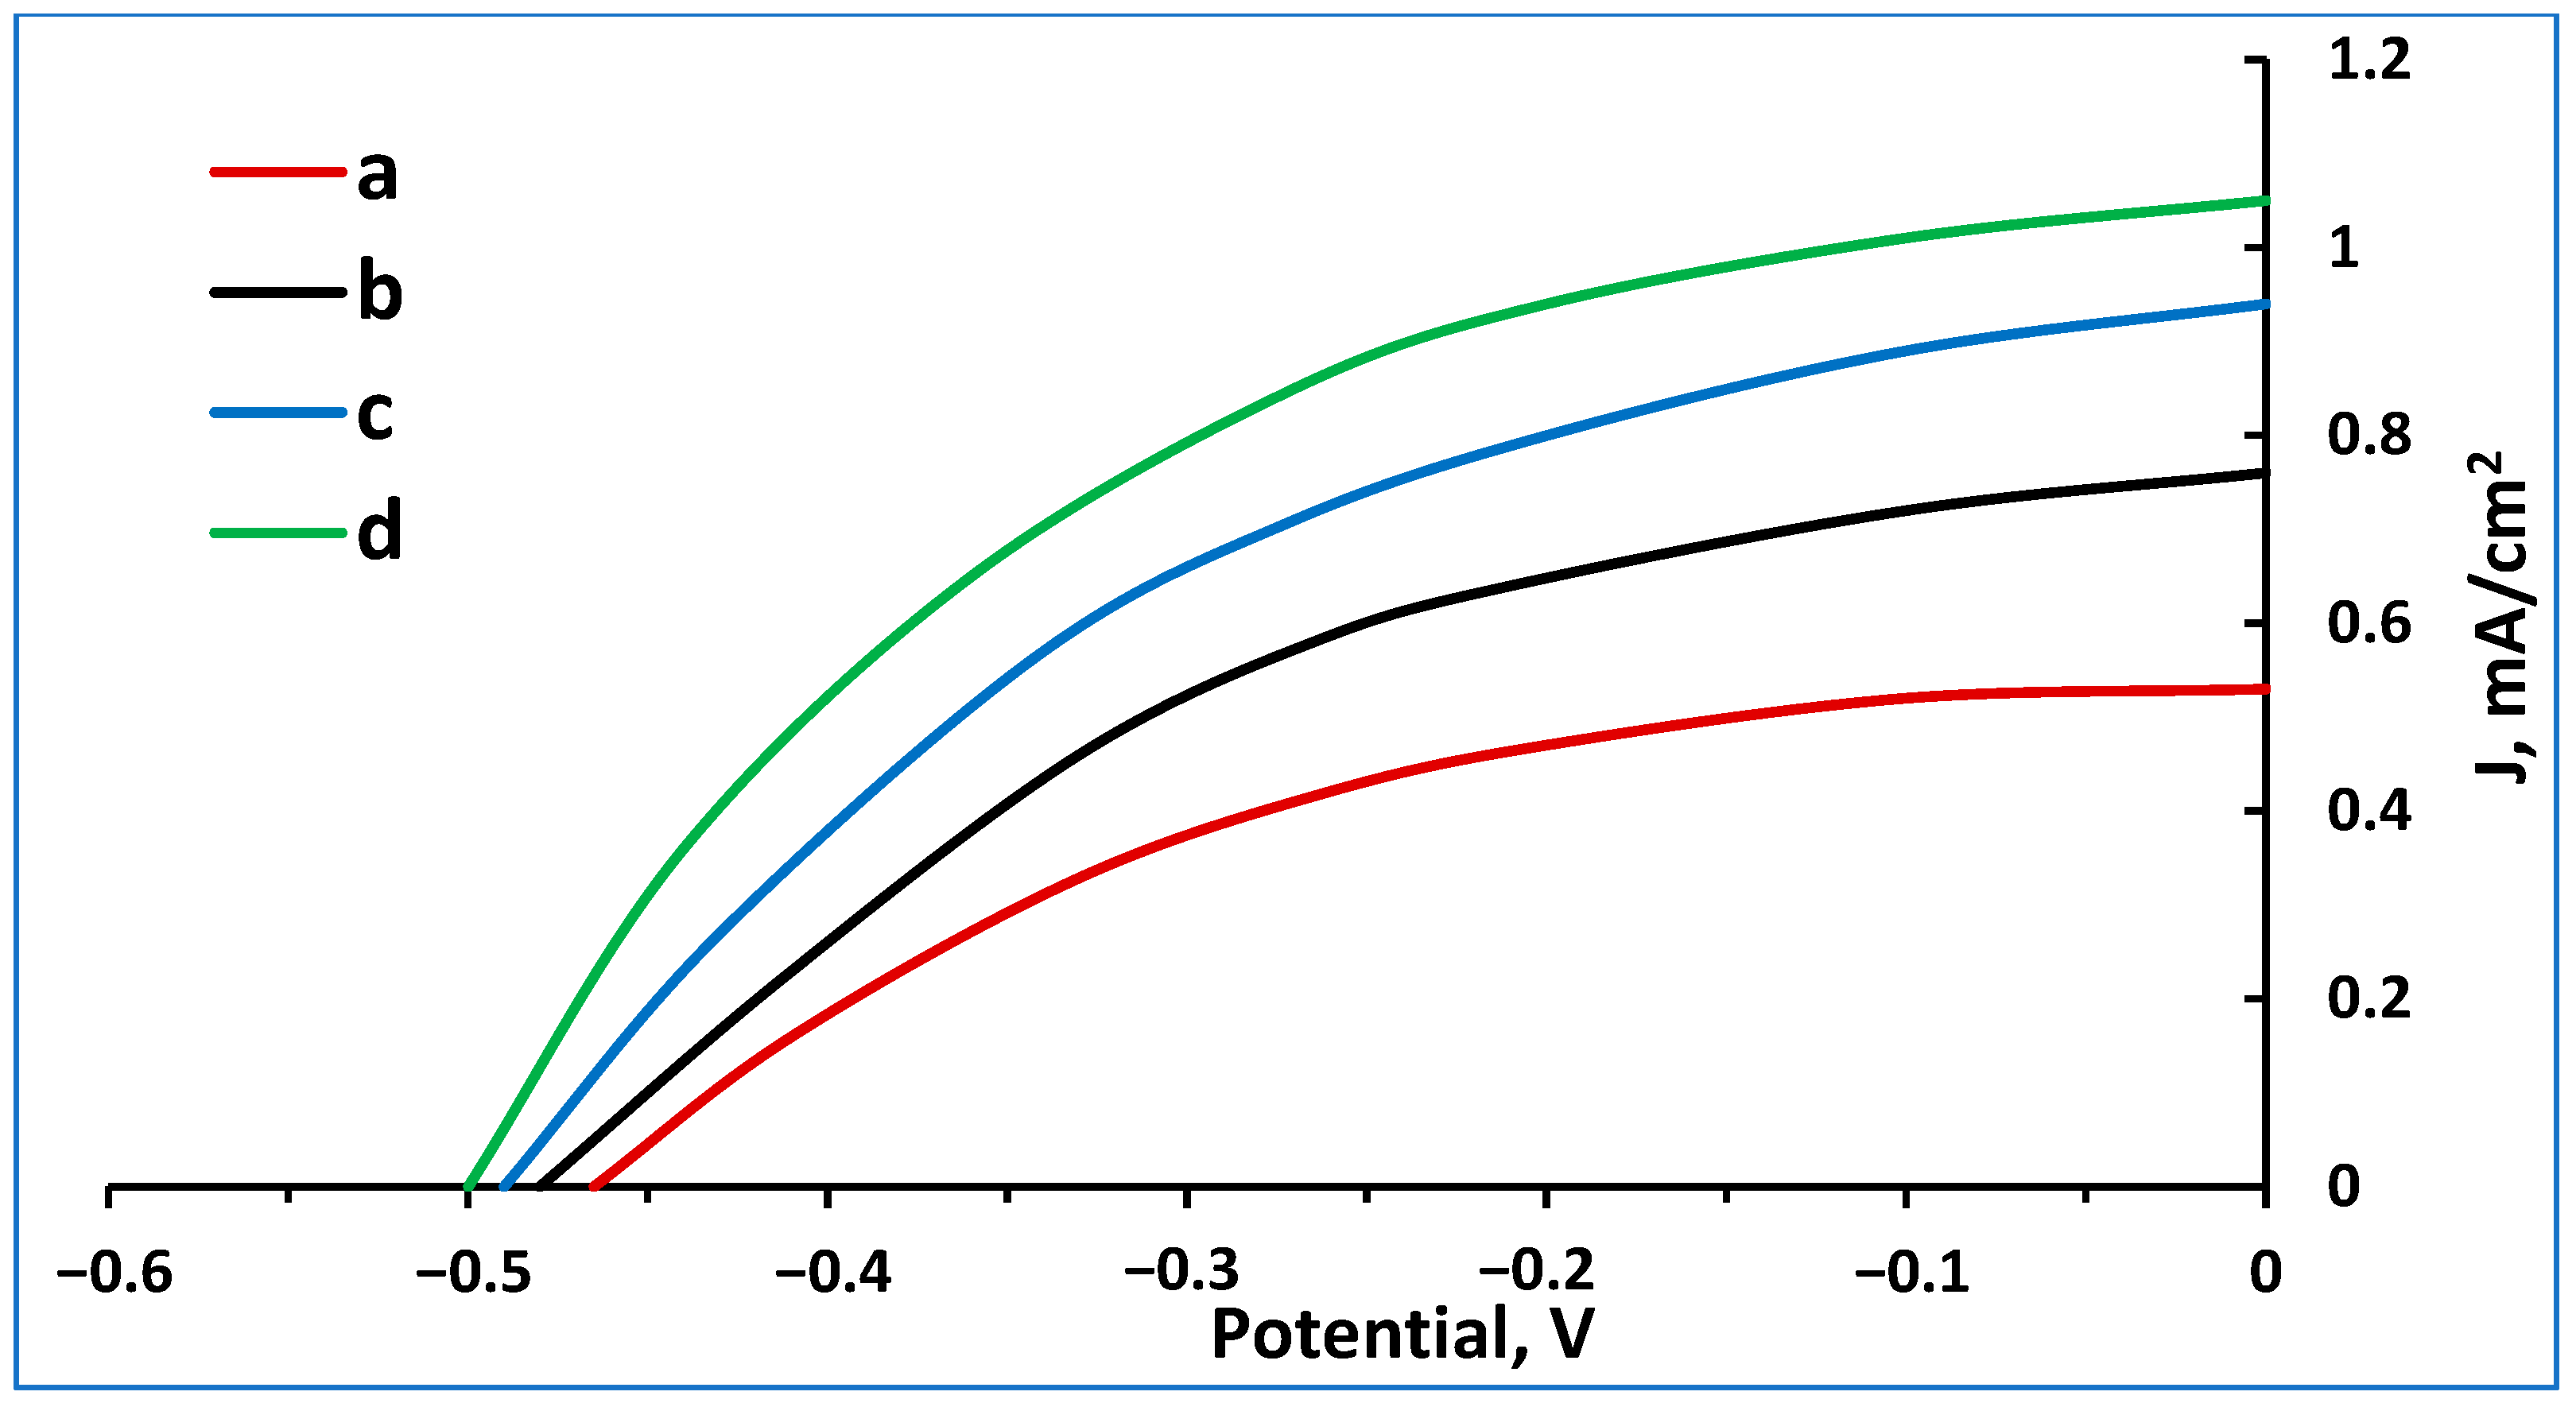
Figure 5 shows the J–V plots from the measurements for the synthesized CdSe thin-film electrode at four different redox couple electrolyte concentrations. The plots demonstrate that the CdSe films also possess n-type semiconducting characteristics, as expected from previous findings in the literature. The PEC characteristics of the CdSe films are given in Table 2, which shows the specific values for the short-circuit current density, Jsc, the open-circuit potential, Voc, the fill factor, FF, and the conversion efficiency, η, for each of the four redox electrolyte solution molar concentrations. The activity corresponding to each solution is also tabulated. Through these carefully documented parameters, this study provides a comprehensive understanding of how different solution compositions affect PEC performance. This analysis allows for a deeper understanding of how these electrolyte concentrations, ion activities, and photoelectrochemical behaviors intersect and can help optimize PEC systems.
Figure 6 shows a graphical plot of the dependence of the PEC cell efficiency on the molar concentration and activity of the redox couple solution. A linear trend line was fitted to the data, and linear regression correlation coefficients were calculated. A fair correlation could be observed between the PEC efficiency and the redox couple activity, with a high R² value of 0.96, indicating a 96% correlation. In contrast, the correlation between the PEC efficiency and the redox couple molar concentration was quite poor, with an R² value of 0.45, indicating a 45% correlation. The correlation between cell efficiency and molar concentration followed a logarithmic trend with an R2 value of 99%. The intersection of the drawn tangents on the logarithmic trend line indicates that the optimal redox couple concentration for a photoelectrochemical cell is 0.6 M, as shown in Figure 6.
Figure 7 shows the dependence of the PEC photocurrent density on the molar concentration and activity of the redox couple. Linear regression analysis indicates that the photocurrent density is strongly correlated with the redox couple activity, with an R² value of 0.92, which represents a 92% correlation. In contrast, the relationship between the photocurrent density and the molar concentration of the redox couple is quite weak, with an R² value of 0.30 representing a 30% correlation. The correlation between the cell photocurrent density and molar concentration followed a logarithmic trend with an R2 value of 99.9%. The intersection of the drawn tangents on the logarithmic trend line indicates that the optimal redox couple concentration for a photoelectrochemical cell is 0.6 M, as shown in Figure 6.
The results emphasized the strong dependence of the efficiency and performance of the photoelectrochemical CdSe thin-film solar cells on the redox couple activity rather than on the molar concentration. The stronger correlation with activity suggests that the electrochemical dynamics, governed by the effective activity of the redox couple, are more important than the molar concentration with regard to determining the PEC performance. This suggests that more attention should be given to the proper design and optimization of such PEC systems.
These relationships are understandable in a better way because of the Debye–Hückel theory, which describes ionic interactions within the electrolyte solution. The Debye–Hückel theory states that the activity ai of an ion i in solution is related to its concentration ci by the activity coefficient γi:
𝑎i = 𝛾ici
The activity coefficient γi is affected by the ionic strength I of the solution, defined as
I = ½∑icizi2
where ci is the molar concentration of ion i and zi is the charge number of ion i. For dilute solutions, the Debye–Hückel limiting law provides an expression for the activity coefficient:
log γ i = A z i 2 I
where A is a constant that depends on the temperature and the dielectric constant of the solvent. This theoretical and experimental framework can explain why the correlation of PEC efficiency (and photocurrent density) with redox couple activity is greater than that with molar concentration. With increasing ionic strength of the solution, the activity coefficients decrease because of increased electrostatic interactions between ions, resulting in lower effective ion activity. Therefore, the activity is closer to the real behavior of ions in the electrolyte compared with the molar concentration. From a practical point of view, the Debye–Hückel theory means that at higher concentrations, ions are more likely to interact with each other in a way that diminishes their activity. Such a reduction in activity will impact the redox reactions at electrode interfaces, which are of major importance for PEC processes. Conclusively, although molar concentration is a straightforward measure of the number of ions present, it does not consider the interaction between ions, which could significantly alter their effective behavior in solution. The implications of these findings for the design and optimization of PEC cells are profound. The enhanced correlation with redox couple activity suggests that the effective participation of ions in the electrochemical processes is more accurately captured by their activities rather than their concentrations. In such a case, one must improve not only the molar concentration of the electrolyte but also the ionic environment for activity.
The observed discrepancies between the molar concentration and activity correlations agree well with the predictions of the Debye–Hückel theory. In more concentrated solutions, the increased ionic strength will bring about greater ion–ion interactions, which reduce the effective activity of the ions. This reduction in activity can negatively impact the redox reactions necessary for PEC cell operation, therefore affecting the overall cell efficiency and photocurrent density.

4. Conclusions

These results show that the PEC efficiency of CdSe thin-film photoelectrochemical cells is attributed to the photocurrent density and redox couple activity when the molar concentration increases. High R² values of 0.96 for PEC efficiency and 0.92 for photocurrent density indicate strong relationships, while low R² values of 0.45 and 0.30, respectively, show weaker correlations with the concentration. The optimal redox couple concentration, based on the logarithmic correlation between cell efficiency and molar concentration, was 0.6 M. This concentration was also found to be optimal for the cell’s photocurrent. It is evident that the PEC performance depends more on the activity of the redox couple since it is based on ionic interactions. This can explain ion behavior better than concentration. Improving the ionic environment to increase the ionic activity will significantly improve the PEC performance. A superior solar energy conversion efficiency can be achieved through PEC system design and optimization, prioritizing redox couple activity instead of concentration. These results are in agreement with theoretical forecasts of ion behavior in electrolyte solutions. It is possible to design more efficient PEC cells by leveraging and understanding redox couple activity as pathways to achieve superior solar energy conversion.

Funding

This research received no external funding.

Data Availability Statement

Data will be available upon request.

Acknowledgments

The author would like to thank An-Najah National University (www.najah.edu) for the technical support provided to publish the present manuscript.

Conflicts of Interest

The author declares no conflict of interest.

References

  1. Zyoud, A.; Al-Yamani, S.; Bsharat, H.; Helal, M.H.; Kwon, H.; Park, D.; Hilal, H.S. Recycled polycrystalline CdS film electrodes with enhanced photo-electrochemical characteristics. Mater. Sci. Semicond. Process. 2018, 74, 277–283. [Google Scholar] [CrossRef]
  2. Zyoud, A.; Saa’Deddin, I.; Khudruj, S.; Hawash, Z.M.; Park, D.; Campet, G.; Hilal, H.S. CdS/FTO thin film electrodes deposited by chemical bath deposition and by electrochemical deposition: A comparative assessment of photo-electrochemical characteristics. Solid State Sci. 2013, 18, 83–90. [Google Scholar] [CrossRef]
  3. Zyoud, S.H.; Zyoud, A.H. Simulation and Numerical Investigation of the Effect of Temperature and Defect on ZnTe/ZnSe/ZnO Thin-Film Photovoltaic Solar Cell Performance Efficiency. Int. J. Eng. Appl. 2023, 11, 1–10. [Google Scholar] [CrossRef]
  4. Sbeah, M.; Zyoud, A.; Ishteiwi, M.; Hajjyahya, M.; Al Armouzi, N.; Qamhieh, N.; Hajamohideen, A.R.; Zyoud, S.; Helal, H.H.; Bsharat, H.; et al. Assessment of flexible pristine CdS film electrodes in photoelectrochemical light-to-electricity conversions. Mater. Chem. Phys. 2023, 293, 126967. [Google Scholar] [CrossRef]
  5. Zyoud, S.H.; Zyoud, A.H. Investigating the Impact of Temperature and Interlayer Defects on the Efficiency of Mo/ZnTe/ZnSe/SnO2 Heterojunction Thin Film Solar Cells: A SCAPS-1D Simulation Study. Int. Rev. Model. Simul. 2023, 16, 120–128. [Google Scholar] [CrossRef]
  6. Zyoud, A.; Abdul-Rahman, N.N.; Campet, G.; Park, D.; Kwon, H.; Kim, T.W.; Choi, H.-J.; Helal, M.H.; Hilal, H.S. Enhanced PEC characteristics for CdSe polycrystalline film electrodes prepared by combined electrochemical/chemical bath depositions. J. Electroanal. Chem. 2016, 774, 7–13. [Google Scholar] [CrossRef]
  7. Sabri, H.; Saleh, S.; Zyoud, A.; Abdel-Rahman, N.N.; Saadeddin, I.; Campet, G.; Park, D.; Faroun, M.; Hilal, H.S. Enhancement of CdSe film electrode PEC characteristics by metalloporphyrin/polysiloxane matrices. Electrochim. Acta 2014, 136, 138–145. [Google Scholar] [CrossRef]
  8. Li, J.; Wu, N. Semiconductor-based photocatalysts and photoelectrochemical cells for solar fuel generation: A review. Catal. Sci. Technol. 2015, 5, 1360–1384. [Google Scholar] [CrossRef]
  9. Wang, M.; Nie, T.; She, Y.; Tao, L.; Luo, X.; Xu, Q.; Guo, L. Study on the behavior of single oxygen bubble regulated by salt concentration in photoelectrochemical water splitting. Int. J. Hydrogen Energy 2023, 48, 23387–23401. [Google Scholar] [CrossRef]
  10. Patel, D.B.; Chauhan, K.R.; Mukhopadhyay, I. Impedance Analysis of Inherently Redox-Active Ionic-Liquid-Based Photoelectrochemical Cells: Charge-Transfer Mechanism in the Presence of an Additional Redox Couple. ChemPhysChem 2015, 16, 1750–1756. [Google Scholar] [CrossRef]
  11. Biswas, N.K.; Srivastav, A.; Saxena, S.; Verma, A.; Dutta, R.; Srivastava, M.; Upadhyay, S.; Satsangi, V.R.; Shrivastav, R.; Dass, S. The impact of electrolytic pH on photoelectrochemical water oxidation. RSC Adv. 2023, 13, 4324–4330. [Google Scholar] [CrossRef]
  12. Zhao, Y.; Zhao, X.; Song, K.; Sun, X.; Xi, N.; Zhang, X.; Sang, Y.; Liu, H.; Yu, X. Polyol-assisted efficient hole transfer and utilization at the Si-based photoanode/electrolyte interface. Appl. Catal. B Environ. Energy 2024, 350, 123901. [Google Scholar] [CrossRef]
  13. Kong, H.; Gupta, S.; Pérez-Torres, A.F.; Höhn, C.; Bogdanoff, P.; Mayer, M.T.; van de Krol, R.; Favaro, M.; Abdi, F.F. Electrolyte selection toward efficient photoelectrochemical glycerol oxidation on BiVO4. Chem. Sci. 2024, 15, 10425–10435. [Google Scholar] [CrossRef]
  14. Wang, M.; Xu, Q.; Nie, T.; Luo, X.; She, Y.; Guo, L. Growth characteristics and the mass transfer mechanism of single bubble on a photoelectrode at different electrolyte concentrations. Phys. Chem. Chem. Phys. 2023, 25, 28497–28509. [Google Scholar] [CrossRef] [PubMed]
  15. Amelia, M.; Avellini, T.; Monaco, S.; Impellizzeri, S.; Yildiz, I.; Raymo, F.M.; Credi, A. Redox properties of CdSe and CdSe–ZnS quantum dots in solution. Pure Appl. Chem. 2010, 83, 1–8. [Google Scholar] [CrossRef]
  16. Lee, J.; Srimuk, P.; Fleischmann, S.; Su, X.; Hatton, T.A.; Presser, V. Redox-electrolytes for non-flow electrochemical energy storage: A critical review and best practice. Prog. Mater. Sci. 2019, 101, 46–89. [Google Scholar] [CrossRef]
  17. Nam, D.-H.; Lumley, M.A.; Choi, K.-S. Electrochemical redox cells capable of desalination and energy storage: Addressing challenges of the water–energy nexus. ACS Energy Lett. 2021, 6, 1034–1044. [Google Scholar] [CrossRef]
  18. Xu, D.; Zhang, S.; Yu, Y.; Zhang, S.; Ding, Q.; Lei, Y.; Shi, W. Ultrathin metal Ni layer on ZnO/TiO2 photoelectrodes with excellent photoeletrochemical performance in multiple electrolyte solutions. Fuel 2023, 351, 128774. [Google Scholar] [CrossRef]
  19. Prather, K.V.; Stoffel, J.T.; Tsui, E.Y. Redox reactions at colloidal semiconductor nanocrystal surfaces. Chem. Mater. 2023, 35, 3386–3403. [Google Scholar] [CrossRef]
  20. Faasse, R. Theoretical & Experimental Analysis of PEC Redox Flow Battery Kinetics; Delft University of Technology: Delft, The Netherlands, 2019. [Google Scholar]
  21. Wu, C.-Q.; Liu, A.-A.; Li, X.; Tu, J.-W.; Kong, J.; Yang, L.-L.; Jia, J.-H.; Wang, C.; Hu, B.; Xie, Z.-X.; et al. Intracellular redox potential-driven live-cell synthesis of CdSe quantum dots in Staphylococcus aureus. Sci. China Chem. 2024, 67, 990–999. [Google Scholar] [CrossRef]
  22. Mugisa, J.; Chukwu, R.; Brogioli, D.; La Mantia, F. Effect of ion-paring on the kinetics of redox systems with concentrated supporting electrolyte. Electrochim. Acta 2024, 473, 143473. [Google Scholar] [CrossRef]
  23. Biswas, N.K.; Srivastav, A.; Saxena, S.; Verma, A.; Dutta, R.; Srivastava, M.; Satsangi, V.R.; Shrivastav, R.; Dass, S. Role of varying ionic strength on the photoelectrochemical water splitting efficiency. Sol. Energy 2022, 247, 543–552. [Google Scholar] [CrossRef]
  24. Bekhit, M.; Blazek, T.; Gorski, W. Electroanalysis of enzyme activity in small biological samples: Alkaline phosphatase. Anal. Chem. 2021, 93, 14280–14286. [Google Scholar] [CrossRef] [PubMed]
  25. Peng, J.; Xiao, Y.; Imel, A.; Barth, B.A.; Cantillo, N.M.; Nelms, K.M.; Zawodzinski, T.A. Electrolyte effects on the electrochemical performance of microemulsions. Electrochim. Acta 2021, 393, 139048. [Google Scholar] [CrossRef]
  26. Kontogeorgis, G.M.; Maribo-Mogensen, B.; Thomsen, K. The Debye-Hückel theory and its importance in modeling electrolyte solutions. Fluid Phase Equilibria 2018, 462, 130–152. [Google Scholar] [CrossRef]
  27. Manov, G.G.; Bates, R.G.; Hamer, W.J.; Acree, S.F. Values of the constants in the Debye—Hückel equation for activity coefficients. J. Am. Chem. Soc. 1943, 65, 1765–1767. [Google Scholar] [CrossRef]
  28. Shilov, I.Y.; Lyashchenko, A. Activity coefficient modeling for aqueous aluminum salt solutions in terms of the generalized Debye–Hückel theory. Russ. J. Inorg. Chem. 2019, 64, 1186–1189. [Google Scholar] [CrossRef]
  29. Ozmen, S.I.; Gubur, H.M. Characterization of CdSe thin film fabricated by electrodeposition. Optoelectron. Adv. Mater. Rapid Commun. 2022, 16, 453–457. [Google Scholar]
  30. Litaiem, Y.; Dridi, D.; Slimi, B.; Chtourou, R. Electrodeposition of Cadmium Selenide Based Photoanodes from TOMAC/Formamide Ionic Liquid System for Photoelectrochemical Water Splitting. Int. J. Nanosci. 2023, 22, 2350013. [Google Scholar] [CrossRef]
  31. Najm, A.S.; Naeem, H.S.; Alwarid, D.A.R.M.; Aljuhani, A.; Hasbullah, S.A.; Hasan, H.A.; Sopian, K.; Bais, B.; Al-Iessa, H.J.; Majdi, H.S.; et al. Mechanism of chemical bath deposition of CdS thin films: Influence of sulphur precursor concentration on microstructural and optoelectronic characterizations. Coatings 2022, 12, 1400. [Google Scholar] [CrossRef]
  32. Zyoud, A.; Saadeddin, I.; Khurduj, S.; Mari’e, M.; Hawash, Z.M.; Faroun, M.I.; Campet, G.; Park, D.; Hilal, H.S. Combined electrochemical/chemical bath depositions to prepare CdS film electrodes with enhanced PEC characteristics. J. Electroanal. Chem. 2013, 707, 117–121. [Google Scholar] [CrossRef]
  33. Hone, F.G.; Ampong, F.K.; Abza, T.; Nkrumah, I.; Nkum, R.K.; Boakye, F. Synthesis and characterization of CdSe nanocrystalline thin film by chemical bath deposition technique. Int. J. Thin. Fil. Sci. Tecnol. 2015, 4, 69–74. [Google Scholar]
  34. Jin, Y.S.; Kim, K.H.; Park, S.J.; Yoon, H.H.; Choi, H.W. Properties of TiO2 films prepared for use in dye-sensitized solar cells by using the sol-gel method at different catalyst concentrations. J. Korean Phys. Soc. 2010, 57, 1049–1053. [Google Scholar] [CrossRef]
  35. Vargas-Hernández, C.; Lara, V.C.; Vallejo, J.E.; Jurado, J.F.; Giraldo, O. XPS, SEM and XRD investigations of CdSe films prepared by chemical bath deposition. Phys. Status Solidi (B) 2005, 242, 1897–1901. [Google Scholar] [CrossRef]
  36. Singh, R.S.; Bhushan, S.; Singh, A.K.; Deo, S.R. Characterization and optical properties of CdSe nano-crystalline thin films. Dig. J. Nanomater. Biostructures 2011, 6, 403. [Google Scholar]
  37. Stern, F. Elementary Theory of the Optical Properties of Solids. In Solid State Physics; Elsevier: Amsterdam, The Netherlands, 1963; pp. 299–408. [Google Scholar]
  38. Zyoud, A.; Abu Alrob, S.; Kim, T.W.; Choi, H.-J.; Helal, M.H.; Bsharat, H.; Hilal, H.S. Electrochemically and chemically deposited polycrystalline CdSe electrodes with high photoelectrochemical performance by recycling from waste films. Mater. Sci. Semicond. Process. 2020, 107, 104852. [Google Scholar] [CrossRef]
Figure 1. XRD diffraction patterns measured for the CdSe film, (a) ED CdSe film, (b) EC/CBD CdSe film.
Photochem 04 00020 g001
Figure 2. SEM image of the CdSe film, (a) ED CdSe film, (b) EC/CBD CdSe film.
Photochem 04 00020 g002
Figure 3. The solid-state electronic absorption spectra were measured for the prepared ED CdSe and ED/CBD CdSe thin film layers. The absorption edge is at 598 nm for the ED CdSe layer and 580 nm for the ED/CBD CdSe layer.
Photochem 04 00020 g003
Figure 4. The bandgap energy calculation (Tauc plot) of the prepared ED CdSe and ED/CBD CdSe thin-film layers shows an estimated band gap of 2.1 eV for the ED CdSe layer and 2.14 eV for the ED/CBD CdSe layer.
Photochem 04 00020 g004
Figure 5. Plots of the photocurrent vs. applied potential for CdSe film electrodes at different redox couple concentrations: (a) 0.05 M, (b) 0.10 M, (c) 0.15 M, and (d) 0.20 M NaOH or Na2S.
Photochem 04 00020 g005
Figure 6. The linear regression correlation between the photoelectrochemical cell efficiency and the NaOH/Na2S/S redox couple electrolyte solution’s molar concentration and electrolyte activity.
Photochem 04 00020 g006
Figure 7. The linear regression correlation between the photoelectrochemical cell photocurrent density and the NaOH/Na2S/S redox couple electrolyte solution’s molar concentration and electrolyte activity.
Photochem 04 00020 g007
Table 1. Four different redox couple electrolyte solutions with the calculated ion and solution activities.
SolutionNaOHNa2S[Na+], M[OH], M[S2−], MµγNaγOHγSαNaαOHαSα Solution[solution], M
a0.050.050.150.050.050.20.7240.7070.2980.1090.0350.0150.1590.25
b0.10.10.30.10.10.40.6750.6500.2330.2030.0650.0230.2910.5
c0.150.150.450.150.150.60.6470.6180.2010.2910.0930.0300.4140.75
d0.20.20.60.20.20.80.6280.5960.1820.3770.1190.0360.5321
Table 2. Summary of the PEC characteristics of CdSe thin-film electrodes with different redox couple solution concentrations and solution activities.
SolutionRedox Molar Conc.Redox ActivityJm × 10−3VmMax Obs Power × 10−3Jsc × 10−3VocIdeal Power × 10−3FFEfficiency%
a0.250.1590.38−0.300.1140.42−0.470.200.581.8
b0.50.2910.52−0.310.16120.68−0.480.330.502.9
c0.750.4140.64−0.310.19840.89−0.490.440.463.8
d10.5320.78−0.310.24181.05−0.500.530.464.7
Disclaimer/Publisher’s Note: The statements, opinions and data contained in all publications are solely those of the individual author(s) and contributor(s) and not of MDPI and/or the editor(s). MDPI and/or the editor(s) disclaim responsibility for any injury to people or property resulting from any ideas, methods, instructions or products referred to in the content.