Article

Rational Design of Sustainable Multifunctional Textile Care Formulations Using Virgin and Waste Vegetable Oils

by
Valentina-Gabi Stănescu
1,
Vasilica Popescu
1,2,*,
Cristina Mihaela Rîmbu
3,
Gabriel Popescu
4,*,
Viorica Vasilache
5,
Andrei Popescu
4,
Mădălina Maria Popescu-Brezuleanu
6 and
Marius Pîslaru
2,6
1
Department of Chemical Engineering in Textiles and Leather, Faculty of Industrial Design and Business Management, “Gheorghe Asachi” Technical University of Iasi, 700050 Iasi, Romania
2
Centre for Research and Innovation in Textiles and Fashion Industry—SMART-Tex-IS, 700050 Iasi, Romania
3
Department of Public Health, “Ion Ionescu de la Brad” University of Life Sciences of Iasi, 700490 Iasi, Romania
4
Department of Machine Design, Mechatronics and Robotics, Faculty of Mechanical Engineering, “Gheorghe Asachi” Technical University of Iasi, 700050 Iasi, Romania
5
Laboratory of Scientific Investigation and Cultural Heritage Conservation, “Alexandru Ioan Cuza” University of Iasi, 700506 Iasi, Romania
6
Department of Engineering and Management, Faculty of Industrial Design and Business Management, “Gheorghe Asachi” Technical University of Iasi, 700050 Iasi, Romania
*
Authors to whom correspondence should be addressed.
Textiles 2026, 6(3), 94; https://doi.org/10.3390/textiles6030094
Submission received: 9 July 2026 / Revised: 1 August 2026 / Accepted: 3 August 2026 / Published: 5 August 2026

Abstract

Sustainable textile care formulations based on renewable and waste vegetable oils represent environmentally responsible alternatives to conventional laundry products while supporting circular bioeconomy strategies. However, the influence of formulation composition on EO transfer, textile persistence and multifunctional performance remains poorly understood. This study investigated the influence of formulation design on the physicochemical properties, encapsulation efficiency, EO transfer, textile persistence, washing performance and antibacterial activity of sustainable textile care formulations prepared from virgin and waste vegetable oils. All formulations exhibited appropriate physicochemical characteristics, including alkaline pH values (9.84–10.64), good foaming capacity and encapsulation efficiencies of 95.6–98.2%. Although encapsulation efficiency remained consistently high, formulation composition influenced EO transfer and persistence on textile substrates. Formulation V1-D exhibited the most balanced overall performance. Waste vegetable oil formulations achieved washing efficiencies of 86–92%, comparable to those of virgin oil formulations, while maintaining EO persistence on textile substrates. The developed soap formulations also exhibited pronounced antibacterial activity against Staphylococcus aureus and Escherichia coli. These findings indicate that rational formulation design, rather than encapsulation efficiency alone, primarily determines the overall performance of sustainable multifunctional textile care formulations by balancing washing efficiency, EO transfer, textile persistence, and the antibacterial activity of the developed soap formulations.

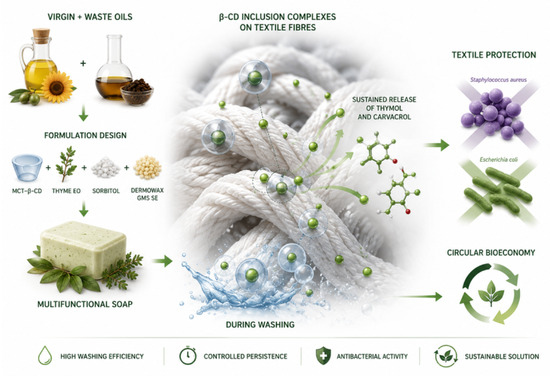
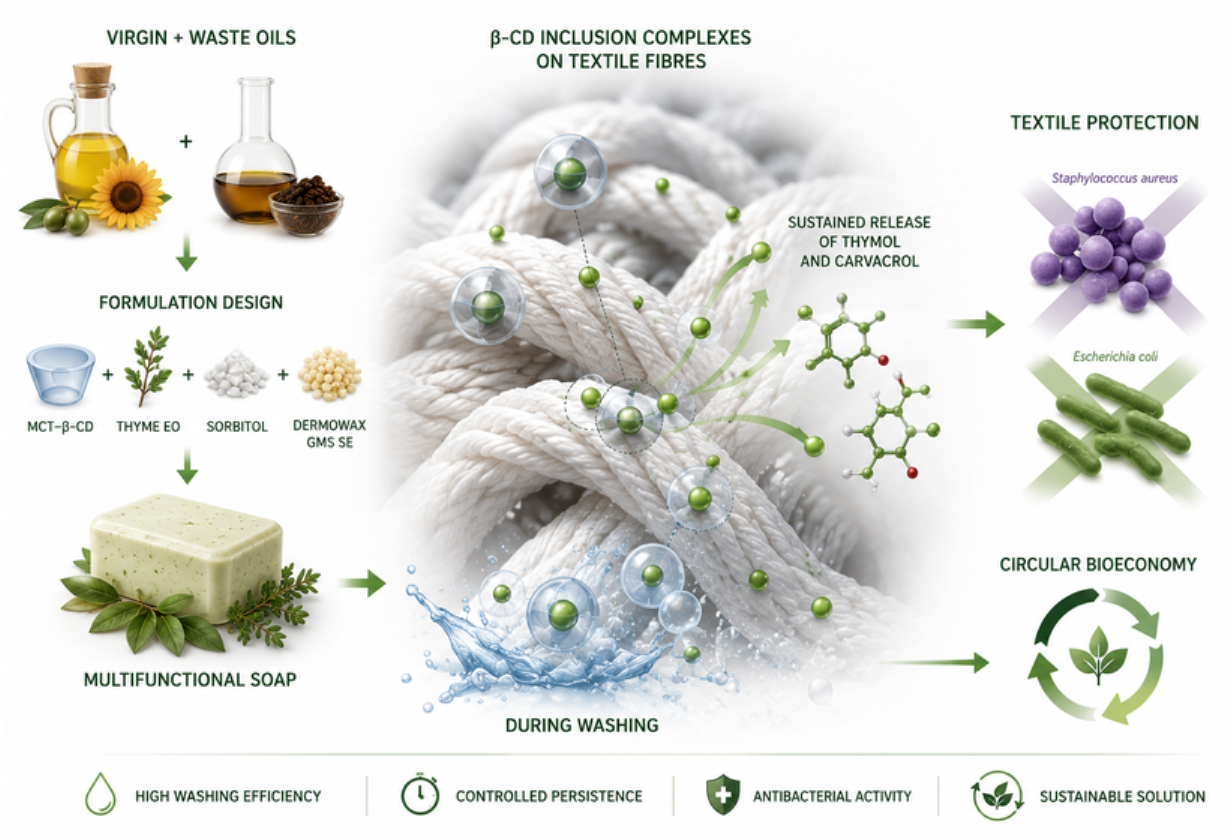
Graphical Abstract

1. Introduction

The transition toward sustainable textile care has become a priority in response to increasing concerns over the environmental impact of conventional laundry products. Most commercial detergents rely on petrochemical-derived surfactants and additives that often exhibit limited biodegradability and contribute to aquatic pollution, ecosystem toxicity and the depletion of non-renewable resources [1,2,3,4,5]. Consequently, increasing research efforts have focused on developing sustainable textile care products based on renewable resources that combine effective cleaning with reduced environmental impact while supporting circular bioeconomy principles.
Renewable vegetable oils have emerged as attractive feedstocks for sustainable textile care formulations because of their biodegradability, renewability and favourable saponification properties. Beyond the use of virgin oils, circular bioeconomy strategies have stimulated growing interest in the valorisation of waste vegetable oils as alternative raw materials for value-added applications. Large quantities of waste cooking oils are generated worldwide each year, and their improper disposal contributes to sewer blockages, increased wastewater treatment costs and environmental pollution [6,7,8,9]. Converting these residues into textile care formulations represents an effective resource recovery strategy that reduces waste generation, decreases the demand for virgin feedstocks and promotes resource circularity. Nevertheless, comparative studies systematically evaluating formulations prepared from both virgin and waste vegetable oils remain scarce.
Textile laundering is a complex physicochemical process governed by interactions among the washing formulation, the textile substrate, and the nature of the soil. Consequently, laundering performance depends not only on the composition of the washing formulation but also on fibre chemistry, fabric structure, surface characteristics, and laundering conditions, all of which influence soil adhesion, wetting behaviour, detergent penetration, and ultimately soil removal efficiency [10,11]. Differences between natural and synthetic fibres, as well as variations in fabric construction, may therefore result in distinct laundering behaviours and affect the deposition and retention of functional compounds on textile surfaces [12]. These considerations highlight the importance of evaluating sustainable textile care formulations under representative laundering conditions and within the context of their intended textile applications. Beyond cleaning efficiency, increasing attention has therefore been directed towards textile care formulations capable of simultaneously maintaining textile hygiene and delivering durable functional properties.
Beyond their cleaning function, sustainable textile care formulations are increasingly expected to improve textile hygiene, prolong the retention of active compounds on textile substrates and reduce reliance on synthetic functional additives. Among naturally derived bioactive compounds, essential oils have attracted considerable attention because of their antimicrobial and antioxidant properties, offering sustainable alternatives to conventional functional additives [13,14,15,16]. Thyme essential oil (Thymus vulgaris) is particularly attractive because of its high thymol and carvacrol contents, which confer broad-spectrum antibacterial activity against both Gram-positive and Gram-negative bacteria [17,18,19]. Previous studies have demonstrated that soap formulations containing thyme essential oil can impart antibacterial activity to washed cotton textiles, highlighting their potential for developing functional textile care products [20]. However, achieving durable functionality requires maintaining essential oil stability while ensuring effective transfer to textile substrates and persistence during laundering and subsequent rinsing.
The development of multifunctional textile care formulations requires balancing effective soil removal with the provision of durable functional properties to the treated textile. Sustainable approaches increasingly focus on incorporating naturally derived bioactive compounds, particularly essential oils, to impart antimicrobial and other value-added functionalities while reducing the environmental impact associated with conventional textile finishing processes [21]. Because the long-term performance of functional textiles depends on the durability of deposited bioactive compounds, textile care formulations should facilitate their transfer and persistence on textile substrates while preserving their biological activity after repeated laundering [22]. Consequently, evaluating washing efficiency together with bioactive compound transfer, persistence after laundering and antibacterial performance provides a comprehensive assessment of multifunctional textile care formulations [23].
Despite their functional potential, the direct incorporation of essential oils into alkaline textile care formulations remains challenging because of their high volatility and susceptibility to oxidation and thermal degradation during processing and storage [24]. These limitations may reduce the retention of bioactive compounds on textile substrates and compromise their functional performance during textile care processes. Cyclodextrin-based encapsulation has emerged as an effective strategy for developing durable functional textile systems by protecting volatile bioactive compounds against evaporation, oxidation and chemical degradation while improving their stability and promoting their transfer and persistence on textile substrates [25,26,27,28,29]. Among the available cyclodextrin derivatives, monochlorotriazinyl–β-cyclodextrin (MCT–β-CD) is particularly suitable because of its stability under alkaline conditions and compatibility with textile applications [30].
Although considerable progress has been made in developing sustainable textile care products, the influence of formulation design on washing performance, essential oil transfer to and persistence on textile substrates, and the antibacterial activity of soap formulations has not been systematically evaluated. Moreover, comparative studies evaluating formulations prepared from both virgin and waste vegetable oils incorporating cyclodextrin-encapsulated essential oils remain scarce. Understanding these relationships is essential for the rational design of sustainable multifunctional textile care formulations.
Accordingly, this study investigated how formulation design influences the performance of sustainable textile care formulations prepared from virgin and waste vegetable oils and incorporating MCT–β-cyclodextrin-encapsulated thyme essential oil. The developed formulations were characterized in terms of their physicochemical properties and encapsulation efficiency, while washing performance, essential oil transfer to textile substrates during washing, persistence on textile substrates after washing and successive rinsing stages, and the antibacterial activity of the soap formulations were systematically evaluated to identify formulation strategies capable of balancing high washing performance, effective essential oil transfer and persistence on textile substrates, and the antibacterial activity of the soap formulations.

2. Materials and Methods

Olive pomace oil (INCI: Olea europaea Fruit Oil) and virgin coconut oil (INCI: Cocos nucifera Oil) were used as the lipid raw materials for preparing the soap formulations. Both oils were purchased from Lidl (Iași, Romania). The corresponding waste olive pomace oil and waste coconut oil were generated from the respective virgin oils after six domestic frying cycles (three potato-frying cycles and three meat-frying cycles). Before use, the waste oils were filtered to remove suspended food residues and used without further purification. The quality and suitability of both virgin and waste oils for soap production were subsequently evaluated by determining their saponification value (SAP), iodine value (IV) and INS index, as described in Section 2.2.1.
Organic thyme essential oil (Thymus vulgaris L., thymol chemotype; INCI: Thymus vulgaris Flower/Leaf Oil) was purchased from Ellemental (Elemental SRL, Oradea, Romania). According to the manufacturer’s specifications, the essential oil was obtained by steam distillation of the flowering aerial parts of T. vulgaris. The essential oil was selected because of the well-documented antimicrobial and antioxidant properties associated with the thymol chemotype [17,31,32] and was used as received without further purification.
Monochlorotriazinyl–β-cyclodextrin (MCT–β-CD), commercially available as CAVASOL® W7 MCT, was supplied by Wacker Chemie AG (Munich, Germany). According to the manufacturer’s specifications, the product has an average molecular weight of approximately 1560 g mol−1 and an average degree of substitution of 0.4 per glucopyranosyl unit.
Dermowax GMS SE (INCI: Glyceryl Stearate SE), vegetable stearic acid, sorbitol, and potassium alum were purchased from Ingrediente Cosmetice by Sanflora (Bucharest, Romania). These ingredients were incorporated to improve the physicochemical characteristics and stability of the soap formulations [33].
Potassium hydroxide, hydrochloric acid, phenolphthalein, carbon tetrachloride, iodine/potassium iodide solution, sodium thiosulfate, starch indicator, and ethanol (96%) were purchased from Merck (Darmstadt, Germany). All reagents were of analytical grade and were used as received. The 1% alcoholic phenolphthalein solution was additionally used in the qualitative assessment of MCT–β-CD/essential oil inclusion complex formation.
The washing performance of the developed formulations was evaluated using 100% cotton fabric samples and a commercial reference detergent (AATCC 1993 WOB Standard Reference Detergent, CRB Techs) [34]. Antibacterial activity was assessed using Staphylococcus aureus ATCC 25923 (Gram-positive) [35] and Escherichia coli ATCC 25922 (Gram-negative) [36].

2.1. Experimental Protocol

The reference formulation consisted of 7.00 g coconut oil, 15.00 g pomace olive oil, 3.51 g sodium hydroxide (NaOH) and 8.93 g distilled water. To improve structural stability and functional performance, 1.50 g stearic acid and 0.50 g potassium alum were incorporated into the base formulation. The bioactive system comprised 0.73 g thyme essential oil encapsulated in 1.00 g monochlorotriazinyl–β-cyclodextrin (MCT–β-CD). Depending on the experimental formulation, 0.60 g sorbitol and/or 0.03 g Dermowax GMS SE were incorporated as functional additives.
An experimental design was established to evaluate the influence of both the lipid feedstock (virgin or waste vegetable oils) and the formulation components on the performance of the developed textile care formulations (Table 1). Four oil combinations were investigated: virgin coconut oil/virgin pomace olive oil (V1), virgin coconut oil/waste pomace olive oil (V2), waste coconut oil/virgin pomace olive oil (V3), and waste coconut oil/waste pomace olive oil (V4). Within each series, control formulations without thyme essential oil and MCT–β-CD (0), formulations containing only the soap matrix (A), and formulations incorporating the encapsulation system either alone (C) or in combination with sorbitol (B), Dermowax GMS SE (E), or both additives (D) were prepared.
The MCT–β-CD–thyme essential oil inclusion complex was prepared 24 h before saponification. MCT–β-CD was mixed with thyme essential oil, followed by the incorporation of sorbitol and/or Dermowax GMS SE according to the experimental design. The mixtures were gently homogenized and stored in sealed containers at room temperature for 24 h to promote inclusion complex formation.

2.2. Preparation of Textile Care Formulations

Soap-based sustainable textile care formulations were prepared using the hot-process saponification method. The vegetable oils were accurately weighed and heated in a water bath at 30–40 °C until a homogeneous phase was obtained. Prior to use, waste oils were filtered and decanted to remove residual impurities. Stearic acid and potassium alum were incorporated directly into the oil phase under continuous stirring.
Separately, sodium hydroxide was dissolved in cold distilled water to prepare the alkaline solution, which was subsequently cooled to approximately 40 °C. The alkaline phase was gradually added to the oil phase under continuous stirring until the trace stage was reached. The reaction mixture was maintained at 70 °C for 90 min in a thermostatically controlled water bath with continuous stirring to ensure complete saponification.
After partial cooling of the soap paste to approximately 40 °C, the previously prepared MCT–β-CD–thyme essential oil inclusion complex was incorporated, together with sorbitol and/or Dermowax GMS SE according to the experimental design. The resulting formulations were poured into silicone moulds, allowed to solidify for 24 h, demoulded and conditioned at room temperature for 4–5 days before characterization.

2.2.1. Analysis of Vegetable Oils Used in the Formulations

Determination of Saponification Value (SAP)
The saponification value (SAP) of the vegetable oils was determined according to the AOCS standard method Cd 3-25 [37], commonly applied for the evaluation of lipid raw materials intended for saponification processes.
For each sample, 1 g of oil was accurately weighed into an Erlenmeyer flask and mixed with 25 mL of 1 N alcoholic KOH solution. The mixture was heated under reflux in a water bath for 1 h to ensure complete reaction. After cooling, 0.5 mL of 1% alcoholic phenolphthalein was added as an indicator, and the excess KOH was titrated with 0.5 N HCl until the disappearance of the pink coloration.
The saponification value was calculated using Equation (1), according to the procedure reported in [38,39]:
S A P = V B V S × N H C l × 56.1 W
where VB is the volume of HCl used for the blank sample, VS is the volume of HCl consumed for the sample, NHCl is the normality of the HCl solution, and W is the mass of the oil sample. The results were expressed as mg KOH per g of oil.
Determination of Iodine Value (IV)
The iodine value (IV) was determined according to the AOCS standard method Cd 1-25 [37], commonly used to assess the degree of unsaturation in oils and fats [40].
Approximately 0.3 g of oil sample was dissolved in 20 mL of CCl4, followed by the addition of 25 mL iodine/potassium iodide solution. The reaction mixture was kept in the dark at room temperature for 30 min to allow complete interaction between iodine and unsaturated bonds.
The reaction was subsequently quenched by adding 200 mL of distilled water, and the excess iodine was titrated with 0.1 N sodium thiosulfate solution. Near the endpoint, 0.5 mL of 1% starch solution was introduced as an indicator, and titration was continued until complete discoloration.
The IV was calculated using Equation (2), as described by [10]:
I V = ( V B V S ) × N t h i o s u l f a t e × 12.69 W
where VB represents the volume of sodium thiosulfate used for the blank sample, VS is the volume of sodium thiosulfate consumed for the sample, and W is the mass of the oil sample. The results were expressed as g I2 per 100 g of oil. This parameter is relevant for predicting the final properties of the soap, including hardness, cleansing efficiency and oxidative stability [9,20].
Determination of Saponification–Iodine Number (INS)
The Saponification–Iodine Number (INS) was calculated as the difference between the saponification value (SAP) and the iodine value (IV), as shown in Equation (3). This parameter is commonly used to estimate the saponification potential and the expected hardness of soap formulations [9,20]:
INS = SAP − IV
For the mixture of the vegetable oils, SAP, IV and INS values were calculated using weighted contributions based on the formulation composition, according to [20]:
SAPmixture = 0.6383 × SAPolive oil + 0.2979 × SAPcoconut oil + 0.0638 × SAPstearic acid [mg KOH/g oil]
IVmixture = 0.6383 × IVolive oil + 0.2979 × IVcoconut oil + 0.0638 × IVstearic acid [g I2/100 g oil]
INSmixture = SAPmixture − IVmixture

2.2.2. Analyses for Confirming the Presence of Essential Oil in Soaps

FTIR Analysis
Fourier transform infrared (FTIR) spectroscopy was employed to identify the functional groups associated with the soap matrix and to verify the presence of essential oil (EO)-derived compounds. Measurements were performed using a TENSOR 27 FTIR spectrometer (Bruker Optik GmbH, Ettlingen, Germany), coupled with a HYPERION 1000 microscope (Bruker Corporation, Billerica, MA, USA), equipped with a standard 15× objective.
FTIR spectra were analysed to confirm the formation of the soap matrix and to identify characteristic absorption bands corresponding to the incorporated EO components. Spectral interpretation was based on established functional group assignments reported in [41,42].
UV–Vis Analysis
UV–Vis spectrophotometric measurements were carried out using a Camspec M501 spectrophotometer (Spectronic CamSpec Ltd., Leeds, UK). Calibration curves for thyme EO were established according to the Beer–Lambert law, which describes the linear relationship between absorbance and concentration within the working range of the method [43]. A stock solution (1 mg/mL) was prepared by dissolving 10 mg of EO in 10 mL of 96% ethanol. Serial dilutions were subsequently prepared to obtain concentrations ranging from approximately 0.033 to 0.200 mg/mL.
Absorbance measurements were performed using a quartz cuvette with a 1 cm optical path length after blank measurement. Although spectral scans were recorded in the 200–700 nm range, quantitative analysis was performed at the characteristic absorption wavelength of the main phenolic compounds (thymol and carvacrol), located within the 275–280 nm range [44].
The calibration curve was constructed by plotting absorbance as a function of concentration and was subsequently used to determine the following:
  • Encapsulation efficiency (EE%);
  • EO transfer to textile substrates during washing (1–30 min);
  • EO persistence on textile samples after one washing stage followed by four successive rinsing stages.
Based on the calibration curve, the concentration of free (non-encapsulated) EO, the amount of EO extracted from cotton samples during washing (1–30 min), and the residual EO retained on cotton fabrics after washing and successive rinsing stages were determined. All measurements were performed in five replicates.
The equations used for these calculations are provided in the Supplementary Materials (Table S1).

2.2.3. Validation of Inclusion Complex Formation

Quantitative Methods for Confirming Inclusion Complex Formation
The formation of inclusion complexes and the quantitative determination of thyme EO were evaluated using UV–Vis spectrophotometry, a widely used technique for the analysis of volatile compounds in solid and semi-solid matrices.
For each formulation, corresponding blank samples containing the same components (MCT–β-CD, sorbitol and/or Dermowax GMS SE) but without EO were prepared. This approach eliminated spectral interferences arising from the excipients and ensured that the measured absorbance was exclusively attributed to EO [45]. The inclusion of sorbitol and Dermowax GMS SE in the blank samples was essential, as these components may influence EO distribution, solubilization, or apparent retention within the system.
Measurements were performed on both the inclusion complexes and the solid soap samples after 4 days of conditioning. For analysis, a known amount of sample (0.1 g) was extracted with 96% ethanol, followed by agitation and phase separation by centrifugation. The resulting supernatant was analysed using a UV–Vis spectrophotometer (Spectronic CamSpec Ltd., Leeds, UK), and absorbance was recorded at 275 nm, corresponding to thymol, the major constituent of thyme EO [17,44].
The quantification of EO was performed using a calibration curve constructed from standard solutions prepared in 96% ethanol (0.033–0.200 mg/mL), according to the Beer–Lambert law. The linearity of the method was confirmed by a determination coefficient (R2) of 1.
The amount of free EO was determined from the measured absorbance, while the encapsulated EO content was calculated by the difference relative to the initial EO amount, allowing the encapsulation efficiency to be determined.
Determination of Encapsulation Efficiency (EE%)
The encapsulation efficiency (EE%) of thyme EO was determined using inclusion complexes (0.1 g). For each analysis, corresponding blank samples were prepared with compositions matching the proportions present in 0.1 g of the inclusion complex. These blank samples contained all formulation components (MCT–β-CD, sorbitol and/or Dermowax GMS SE), except EO, allowing correction for spectral interferences.
To extract the non-encapsulated EO, 4 mL of 96% ethanol was added to each sample (test and blank), followed by agitation and centrifugation at 7000 rpm for 1 min. Subsequently, 3 mL of the supernatant was collected for spectrophotometric analysis.
The absorbance of the blank sample was measured first and used for baseline correction, followed by measurement of the corresponding test sample.
The total EO content was calculated from the initial composition of the inclusion complex, whereas the amount of encapsulated EO was determined by difference according to Equation (7):
EOencapsulated = EOtotal − EOfree
Encapsulation efficiency was expressed as a percentage using Equation (8):
EE% = (EOencapsulated/EOtotal) × 100
Alternatively, EE (%) was calculated using Equation (9):
EE% = (1 − EOfree/EOtotal) × 100
Qualitative Methods for Confirming Inclusion Complex Formation
The formation of inclusion complexes between MCT–β-CD and thyme EO was qualitatively assessed using a phenolphthalein-based method, commonly applied to investigate host–guest interactions in cyclodextrin systems.
The method is based on the ability of phenolphthalein to form inclusion complexes with cyclodextrins. In an alkaline medium (pH > 8.2), phenolphthalein exhibits an intense magenta coloration. However, upon inclusion within the hydrophobic cavity of cyclodextrins, the colour is significantly reduced or disappears. When the cyclodextrin cavity is occupied by a hydrophobic guest molecule such as EO, phenolphthalein cannot be accommodated, and the magenta coloration is retained [46].
For the analysis, two sets of samples containing MCT–β-CD were prepared, either in the presence or absence of excipients (sorbitol and/or Dermowax GMS SE), followed by the addition of EO. The mixtures were gently homogenized and stored in the dark at room temperature for 24 h to promote inclusion complex formation, in accordance with the methodology reported by Thorsteinn Loftsson and Didier Duchêne [26].
The evaluation was performed in two stages:
Stage 1. Confirmation of inclusion complex formation. Each inclusion complex sample (0.1 g) was treated with 1 mL of 1% alcoholic phenolphthalein solution (pH ≈ 11), followed by gentle mixing and equilibration. Persistence of the magenta coloration indicates that the cyclodextrin cavities are occupied by EO, confirming the formation of inclusion complexes. In contrast, fading or disappearance of the colour suggests the presence of free or partially occupied cavities [46].
Stage 2. Assessment of complex stability in the presence of ethanol. After recording the initial colour, 1 mL of 96% ethanol was added, followed by mixing and equilibration. Retention of the magenta coloration indicates a stable inclusion complex in which EO remains associated with the cyclodextrin cavity. Conversely, a decrease or loss of colour suggests displacement of EO by ethanol, allowing subsequent inclusion of phenolphthalein.
The observed colour changes therefore provided qualitative evidence for both the formation and stability of the inclusion complexes, consistent with the mechanisms described in [26,46].
Evaluation of EO Transfer to Textile Substrates During Washing
The transfer of thyme essential oil (EO) from the washing solution to cotton textile substrates during washing was evaluated by determining the amount of EO associated with the textile specimens at different washing times. Because the functionality imparted to the textile depends on the amount of EO deposited onto the textile substrate, the experiment was designed to estimate the amount of EO associated with the textile specimens throughout the washing process.
Five identical 100% cotton fabric specimens were simultaneously immersed in a washing system consisting of 100 mL of distilled water containing 1 g of soap at 40 °C. One textile specimen was withdrawn after 1, 5, 10, 15 and 30 min of washing, while the remaining specimens continued the washing process under the same experimental conditions. Immediately after removal from the washing bath, each specimen was gently squeezed to remove excess washing solution and transferred into 4 mL of 96% ethanol for EO extraction. The EO concentration in the ethanolic extract was determined by UV–Vis spectrophotometry at 275 nm, corresponding to thymol, the principal component of thyme EO [17].
The experiment followed a sequential destructive sampling protocol. At each sampling time, one textile specimen was permanently removed for analysis and was not returned to the washing system. Consequently, each time point represents an independent measurement performed on an equivalent specimen rather than repeated measurements on the same specimen.
The EO concentration in the extract was calculated from the calibration curve, and the amount of EO extracted from the withdrawn textile specimen was determined according to Equation (10):
EOi = Ci × V
where EOi is the amount of EO extracted from the textile specimen withdrawn at sampling time i (mg), Ci is the EO concentration in the ethanolic extract (mg/mL), and V is the extraction volume (4 mL).
Since all textile specimens were identical and washed simultaneously under the same experimental conditions, the EO amount determined for the withdrawn textile specimen was assumed to be representative of the EO associated with the other textile specimens present in the bath at that specific interval. Therefore, the estimated total amount of EO associated with the entire active textile phase present in the washing system at sampling time i was calculated according to Equation (11):
EOtotal,i = EOi × Ni
where EOtotal,i is the estimated total amount of EO associated with all textile specimens represented by the batch at sampling time i (mg), and Ni is the sample representation coefficient corresponding to that specific step (Ni = 5; 4; 3; 2; 1). The estimated percentage of EO transferred to the textile substrates was calculated according to Equation (12):
Ri(%) = EOtotal,i/EO1g× 100
where EO1g is the total amount of EO initially (mg) contained in 1 g of soap (derived as 730 mg EO/d g of soap matrix), and Ri represents the estimated percentage of EO transferred to the textile substrates (EO transfer, %) at sampling time i.
The obtained Ri values describe the estimated time-dependent transfer of EO to the textile substrates during washing. Since the EO concentration in the washing solution was not determined directly, the calculated parameter represents the estimated amount of EO associated with the textile specimens under the selected washing conditions and should not be interpreted as the overall kinetic release of EO from the soap formulations into the bulk liquor. This approach enables a reliable comparative benchmarking of the ability of different soap formulations to transfer and deposit EO onto cotton textile substrates during the laundering process.
Evaluation of EO Persistence on Textile Substrates During Rinsing
The persistence of thyme EO on textile substrates was evaluated following an initial washing step and subsequent rinsing steps performed in distilled water without soap. The aim of this analysis was to estimate the amount of EO remaining associated with the textile substrates throughout the entire dynamic washing–rinsing procedure, thereby establishing a unified framework for describing EO transfer and persistence during the multi-stage hydro-mechanical treatment chain. Similar approaches have been reported for evaluating the persistence of cyclodextrin-encapsulated essential oils on textile substrates under competitive surfactant-free desorption kinetics [47].
Five identical 100% cotton fabric specimens were simultaneously washed in a solution containing 1 g of soap and 100 mL of distilled water at 40 °C for 30 min, allowing the transfer of EO from the soap formulation to the textile substrates governed by the phase stability and polyol distribution of the active matrix [33]. After the completion of the washing step, the washing solution was discarded to eliminate any dissolved soap molecules or free micellar fractions from the bulk liquor. One textile specimen was immediately withdrawn and extracted with 4 mL of 96% ethanol, whereas the remaining four specimens were subjected to a rinsing step in 100 mL of distilled water at 40 °C for 30 min without soap. Following each rinsing step, one additional specimen was withdrawn for EO extraction, while the remaining specimens continued the rinsing procedure under the same experimental conditions. This sequence was repeated until all five textile specimens had been analysed.
The EO extracted from each withdrawn specimen was quantified by UV–Vis spectrophotometry at 275 nm, corresponding to thymol, the principal constituent of thyme EO [17]. The EO amount determined for each specimen was assumed to be representative of the other textile specimens represented by the batch simulation at that specific interval, accounting for the sequential physical withdrawal of the substrates without shifting the systemic baseline. Accordingly, the estimated total amount of EO associated with the baseline textile substrates at each sampling stage was calculated according to the procedure described in Supplementary Table S1.
EO persistence was expressed according to Equation (13):
Persistence (%) = (EOtotal,i/EO1g)∙100
where the following definitions are used:
EO1g is the total amount of EO (mg) initially contained in 1 g of the corresponding soap formulation—derived as 730 mg EO/d g of soap matrix;
EOtotal,i is the estimated total amount of EO associated with the textile specimens represented by the continuous batch simulation at sampling stage i, which is upscaled by applying the sample representation scaling coefficient (Ni = 5; 4; 3; 2; 1) to preserve structural size consistency.
This procedure enabled the evaluation of EO persistence on textile substrates throughout the initial washing stage and the four successive rinsing stages under the experimental conditions employed in this study, providing a quantitative assessment of EO retention on cotton fabrics after successive rinsing stages.
Controlled Soiling of Textile Samples for Washing Efficiency Evaluation
Washing performance was evaluated using washing conditions adapted from ISO 6330:2021 [48], which specifies standardized conditions for domestic laundering, including temperature, liquor ratio, washing time and agitation regime, thereby ensuring the reproducibility of experimental results.
To simulate realistic soiling conditions, 100% cotton fabric samples were artificially contaminated using a synthetic soil ballast suspension, functionally comparable to the standardized WFK SBL 2004 Type I soil commonly employed in detergent performance testing. The suspension was formulated to mimic the main components of real dirt, including mineral, organic and lipid fractions.
The soil suspension (total volume 100 mL) consisted of 60 mL distilled water (dispersion medium), 3.5 g sorbitol (wetting agent), 10 mL vegetable oil (lipid fraction), 6 g cocoa and 6 g coffee (organic pigments), 3 g powdered egg yolk (protein fraction), 10 g kaolin (mineral component) and 1.5 g sieved soil, prepared according to procedures described in [48,49].
The suspension was prepared by first dissolving sorbitol in water, followed by the gradual incorporation of vegetable oil under continuous stirring. The solid components were subsequently added stepwise until a homogeneous dispersion was obtained. The suspension was used immediately after preparation.
The textile substrate consisted of white 100% cotton fabric cut into 5 × 5 cm samples, each with an average mass of approximately 0.24 g. A volume of 200 µL of the soil suspension was deposited at the centre of each sample using a digital micropipette (DLAB Scientific Co., Ltd., Beijing, China) The samples were then dried in an oven at 50 °C for 30 min, in accordance with the standard recommendations [48]. Each experimental condition was performed in five replicates.
The soiling procedure was based on the principles described in AATCC 130-2000 and adapted to ensure controlled and reproducible contamination [50].
Washing tests were carried out under controlled conditions using 150 mL Berzelius beakers placed in a thermostatically controlled water bath with mechanical agitation, simulating domestic washing conditions. For each sample, 50 mL of washing solution was used, containing either the tested soap formulations or a reference detergent without optical brighteners at a concentration of 4 g/L.
The washing parameters were as follows: temperature 40 °C, washing time 30 min, agitation rate 100–120 rpm (equivalent to ISO 6330 method 2A), followed by two rinsing cycles with distilled water (30 mL each) and air drying on an absorbent support for 2 h.
For the evaluation of washing performance, three types of samples were considered: clean (R-C), soiled (unwashed, R-S) and washed samples (R-D). Colour measurements were performed using a Datacolor Spectraflash SF600 spectrophotometer (Datacolor AG, Lucerne, Switzerland) operating in diffuse reflectance mode with D65 illuminant and a 10° standard observer. The results were expressed in the CIELAB colour space using the coordinates L* (lightness), a* (red–green axis) and b* (yellow–blue axis). The chroma (C*) and hue angle (h) values, as well as the colour-difference parameters (ΔL*, Δa*, Δb*, ΔC*, ΔH* and ΔE*), were calculated automatically by the instrument software for each of the five replicate measurements relative to the textile washed with the reference detergent (R-D). The results are presented as the mean ± standard deviation of the five individually calculated values.
Evaluation of washing performance
Washing efficiency was assessed using the Hidden Stain Visibility (Hs) index, derived from the lightness parameter (L*) measured in the CIELAB colour space, in accordance with the recommendations of the International Commission on Illumination [51]. This parameter allows the quantification of residual soil visibility on textile substrates after washing [20].
In this study, two Hidden Stain indicators (Hs1 and Hs2) were calculated. The Hs1 index expresses the relative difference between the clean reference sample and the washed sample, normalized to the lightness of the reference (Equation (14)). In contrast, Hs2 accounts for the initial degree of soiling, providing a normalized indicator that better reflects the actual cleaning efficiency (Equation (15)) [51]:
Hs1 (%) = (L*ref − L*washed)/L*ref × 100
Hs2 (%) = (L*washed − L*ref)/(L*soiled − L*ref) × 100
where L*ref represents the lightness of the clean (reference) sample, L*soiled corresponds to the lightness of the soiled sample prior to washing, and L*washed is the lightness measured after washing.
Among the two indicators, Hs2 was considered more relevant because it accounts for the initial level of contamination and provides a normalized measure of residual soil.
Washing efficiency was calculated according to Equation (16):
Washing efficiency (%) = (L*soiled − L*washed)/(L*soiled − L*ref) × 100
Statistical Analysis
Colorimetric measurements of cotton samples after washing with the soap formulations were performed using a Datacolor spectrophotometer (Datacolor AG, Lucerne, Switzerland), operating in the CIE 1976 Lab colour space, in accordance with standardized protocols [51].
For each experimental group (n = 5 replicates), the mean value and standard deviation (SD) were calculated using the conventional statistical expressions (Equations (17) and (18)):
x ¯ = 1 n x i
S D = ( x i x ¯ ) 2 n 1
where x ¯ represents the mean value and xi denotes the individual measurements.

2.2.4. Physicochemical Characterization of Soap Formulations

pH Determination
The pH of the soap formulations was determined using a method adapted from [20]. Briefly, 1 g of soap was dispersed in 50 mL of distilled water and stirred until complete dissolution was achieved. The resulting solution was allowed to stabilize for 30 min prior to measurement.
The pH was measured using a calibrated pH meter. This parameter was used to assess the alkalinity of the formulations and to provide indirect information on the completeness of the saponification process.
Foaming Capacity
Foaming capacity was evaluated using a 500 mL graduated cylinder. A soap solution (1 g/L) was prepared, and 100 mL was transferred into the cylinder. The system was vigorously shaken for 10 s to generate foam.
After agitation, the sample was allowed to stand for 10 min, and the height of the foam layer was measured. This parameter was used to evaluate both foam formation and foam stability, which are closely related to the fatty acid composition of the oils and the presence of functional additives or encapsulation systems [20].
Antibacterial Activity of Soap Formulations
Antibacterial activity was evaluated against two representative bacterial strains: Staphylococcus aureus ATCC 25923 (Gram-positive) and Escherichia coli ATCC 25922 (Gram-negative) [35,36]. Bacterial suspensions were prepared from 24 h cultures in sterile physiological saline and adjusted to a concentration of 1.5 × 10⁶ CFU/mL.
Soap suspensions were prepared at a concentration of 5% (w/v) by dissolving 1 g of soap (V1-A, V1-D, V2-D, V3-D and V4-D) in 20 mL of sterile physiological saline, followed by vortex mixing to ensure uniform dispersion.
The antibacterial activity was assessed using a modified time–kill assay based on the ASTM E2149 standard [52]. For each soap formulation and bacterial strain, individual reaction tubes were prepared for predefined contact times: T0 (control), T1 (30 s), T2 (1 min), T3 (2 min) and T4 (5 min).
Each reaction mixture consisted of 1 mL of 5% soap suspension and 1 mL of bacterial suspension, resulting in a final volume of 2 mL and a final soap concentration of 2.5%. The mixtures were incubated at 37 °C (Figure S1).
At each contact time, 100 µL of the reaction mixture was immediately transferred (within 10 s) into 900 µL of sterile physiological saline to quench the antibacterial activity and minimize carry-over effects. Serial decimal dilutions were subsequently prepared up to 10−6.
For microbial enumeration, 1 mL from each dilution was transferred into sterile Petri dishes, followed by the addition of molten Mueller–Hinton agar (Oxoid) cooled to approximately 45 °C. The samples were gently mixed to ensure homogeneous distribution of bacterial cells. After solidification, the plates were incubated at 37 °C for 24 h.
Colony-forming units (CFUs) were counted and multiplied by the corresponding dilution factor, and the results were expressed as CFU/mL of the reaction mixture.
All experiments were performed in five replicates. CFU values were converted to logarithmic form (log10), and mean values and standard deviations were calculated. Antibacterial activity was expressed as log reduction and percentage reduction according to Equation (19):
Log reduction = log10(N0) − log10(Nt)
where N0 represents the initial bacterial count (T0), and Nt corresponds to the bacterial count at each contact time.
The antibacterial activity of the modified soap formulations (V1-D, V2-D, V3-D and V4-D) was compared with that of the control formulation (V1-A), while the positive control (culture control, C+) was used to verify bacterial viability.

3. Results

3.1. Validation of Encapsulation

3.1.1. FTIR Spectroscopic Analysis

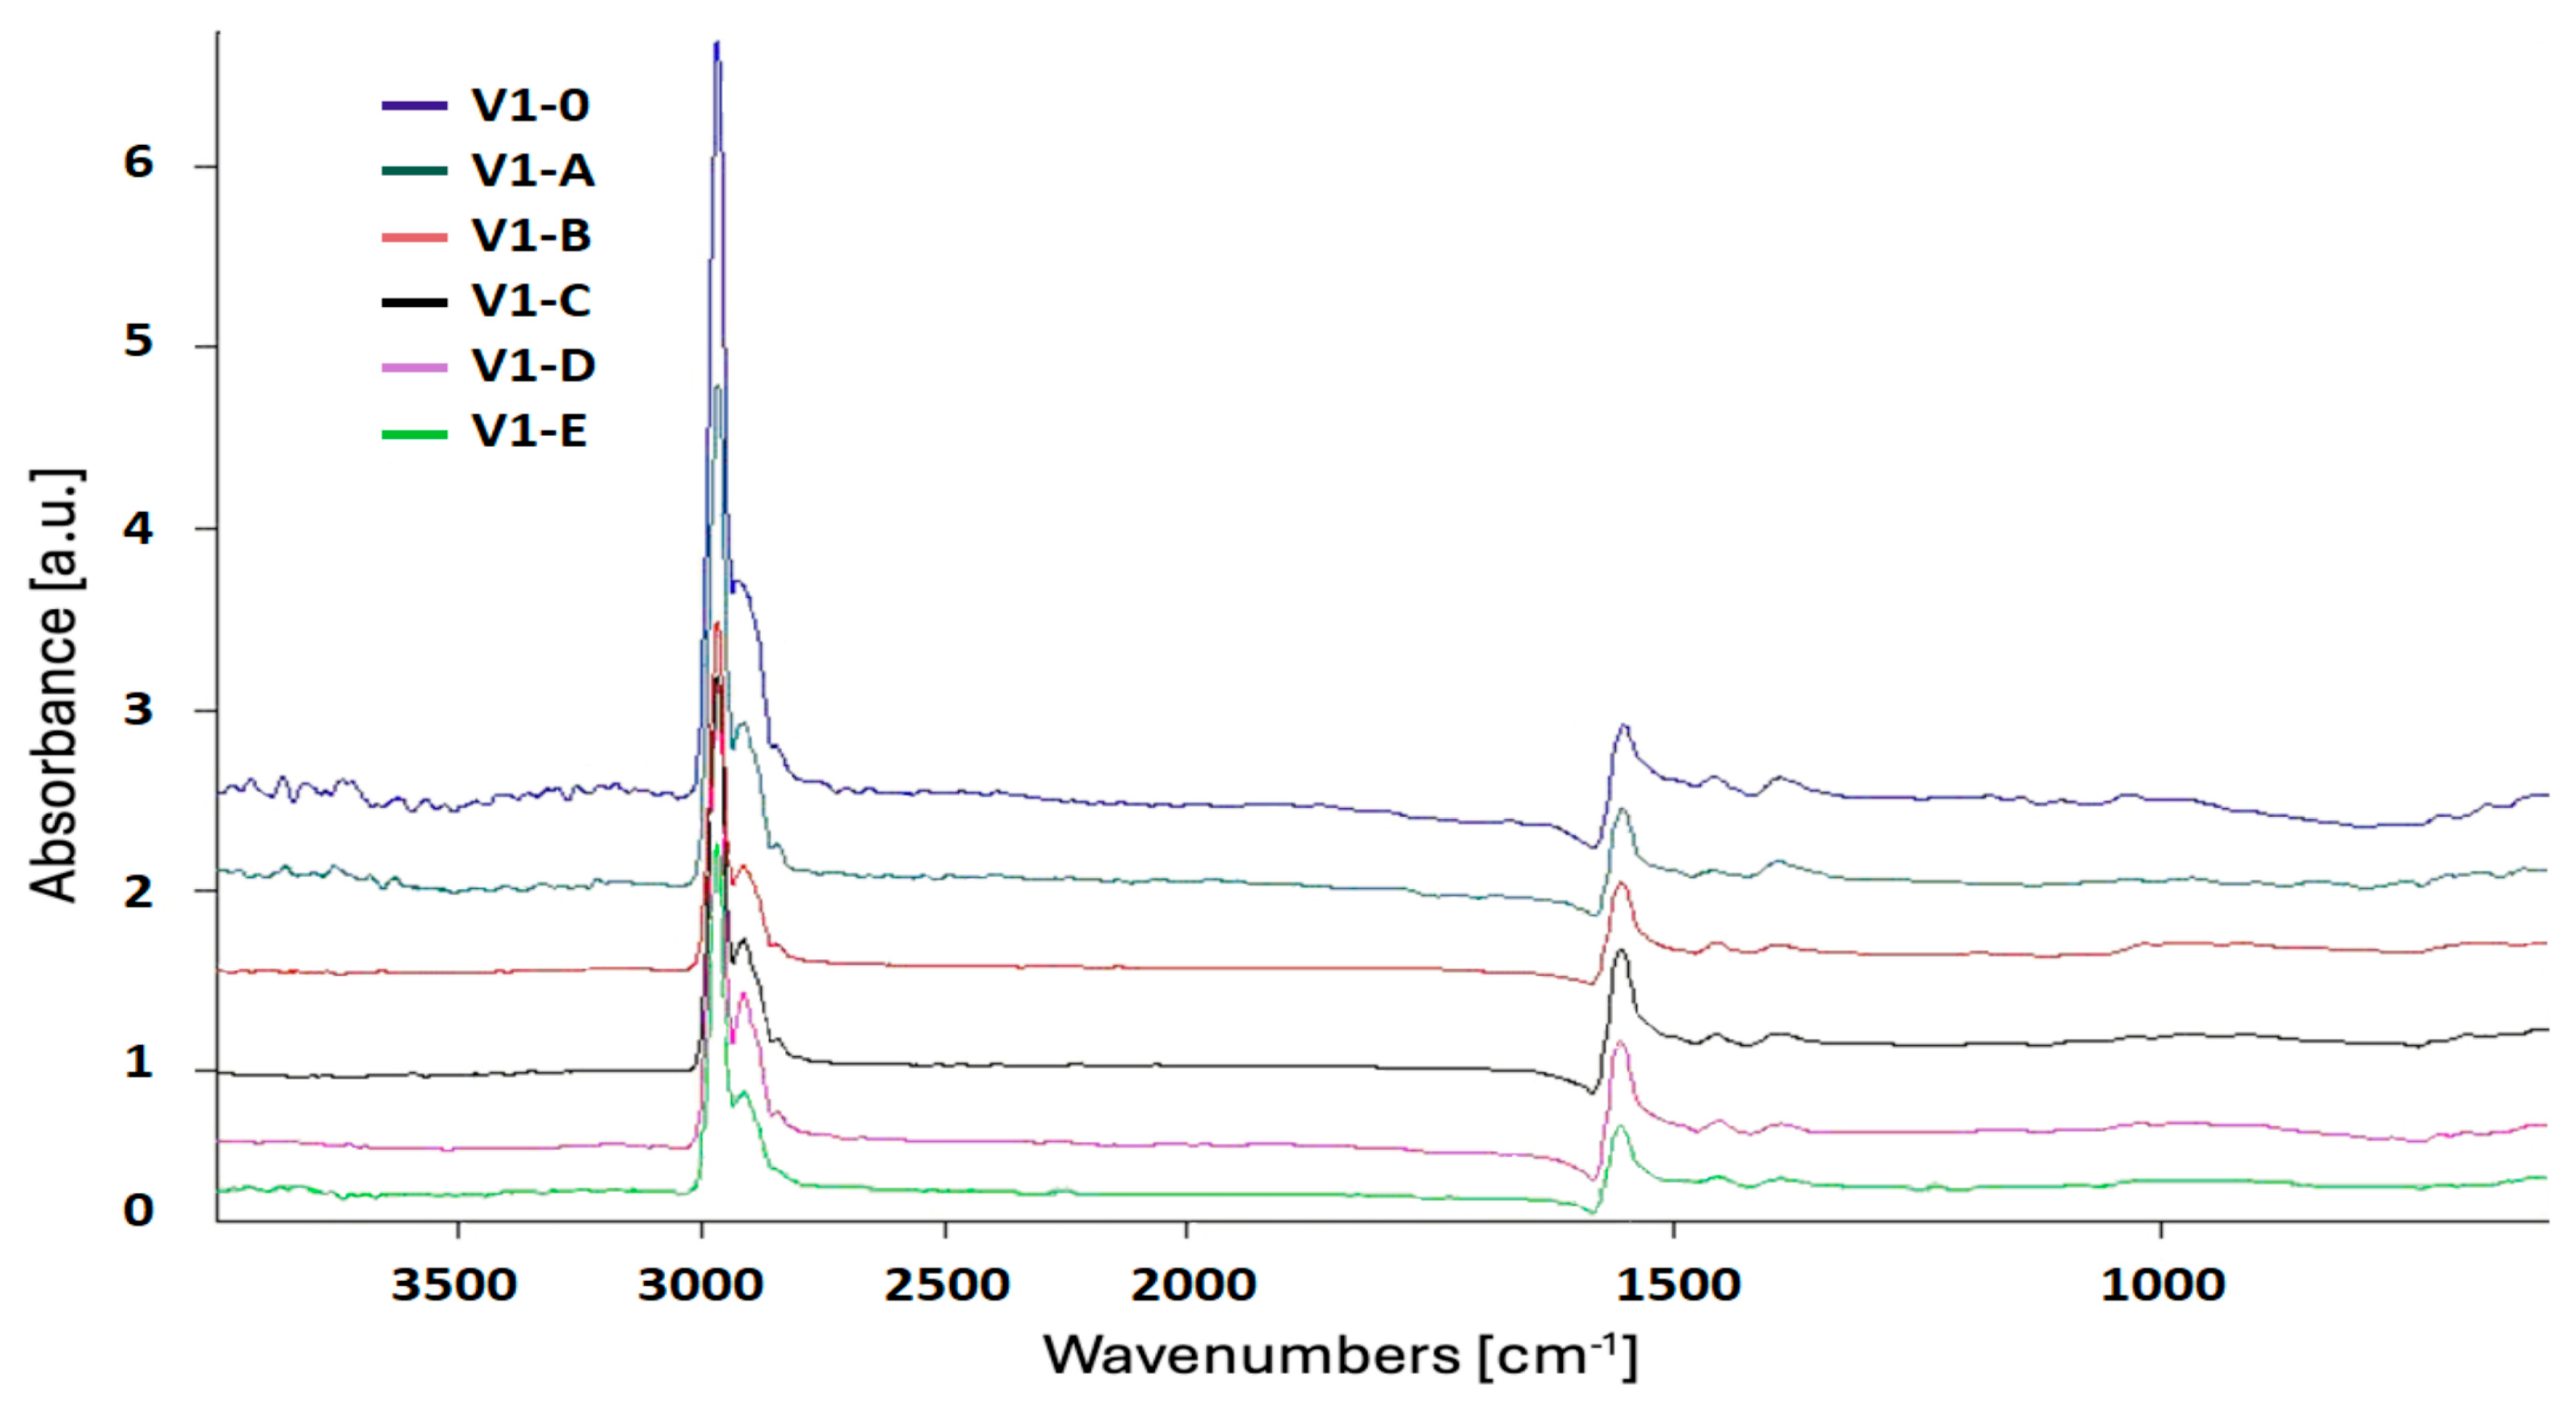
The FTIR spectra of soaps formulated exclusively from vegetable oils (Figure 1) revealed characteristic absorption bands associated with carboxylate groups (COO), with peaks observed in the 1565–1601 cm−1 region (asymmetric stretching) and around 1415 cm−1 (symmetric stretching) [41,42]. These features confirm the formation of fatty acid salts and indicate the successful completion of the saponification process.
In contrast, formulations containing the MCT–β-CD–thyme EO inclusion complex exhibited noticeable spectral modifications compared with the control samples. An increase in band intensity was observed in the 3200–3500 cm−1 region, corresponding to O–H stretching vibrations of cyclodextrin hydroxy groups. Additionally, signals appearing in the 3000–3200 cm−1 range were attributed to aromatic C–H stretching vibrations of phenolic compounds present in the EO, particularly thymol and carvacrol [17,41,53].
The broad band cantered around 3400 cm−1 suggests the presence of an extensive hydrogen-bonding network, which is characteristic of cyclodextrin-based inclusion systems. Furthermore, changes detected in the 1099–1149 cm−1 region, assigned to C–O–C stretching vibrations of the cyclodextrin structure, indicate interactions between the host cavity and hydrophobic EO molecules [30,53].
FTIR analysis of the individual components (stearic acid, MCT–β-CD, sorbitol, Dermowax GMS SE, potassium alum and thyme EO) enabled the identification of their characteristic absorption bands and provided a reference for interpreting the spectra of the final formulations (Table S2).
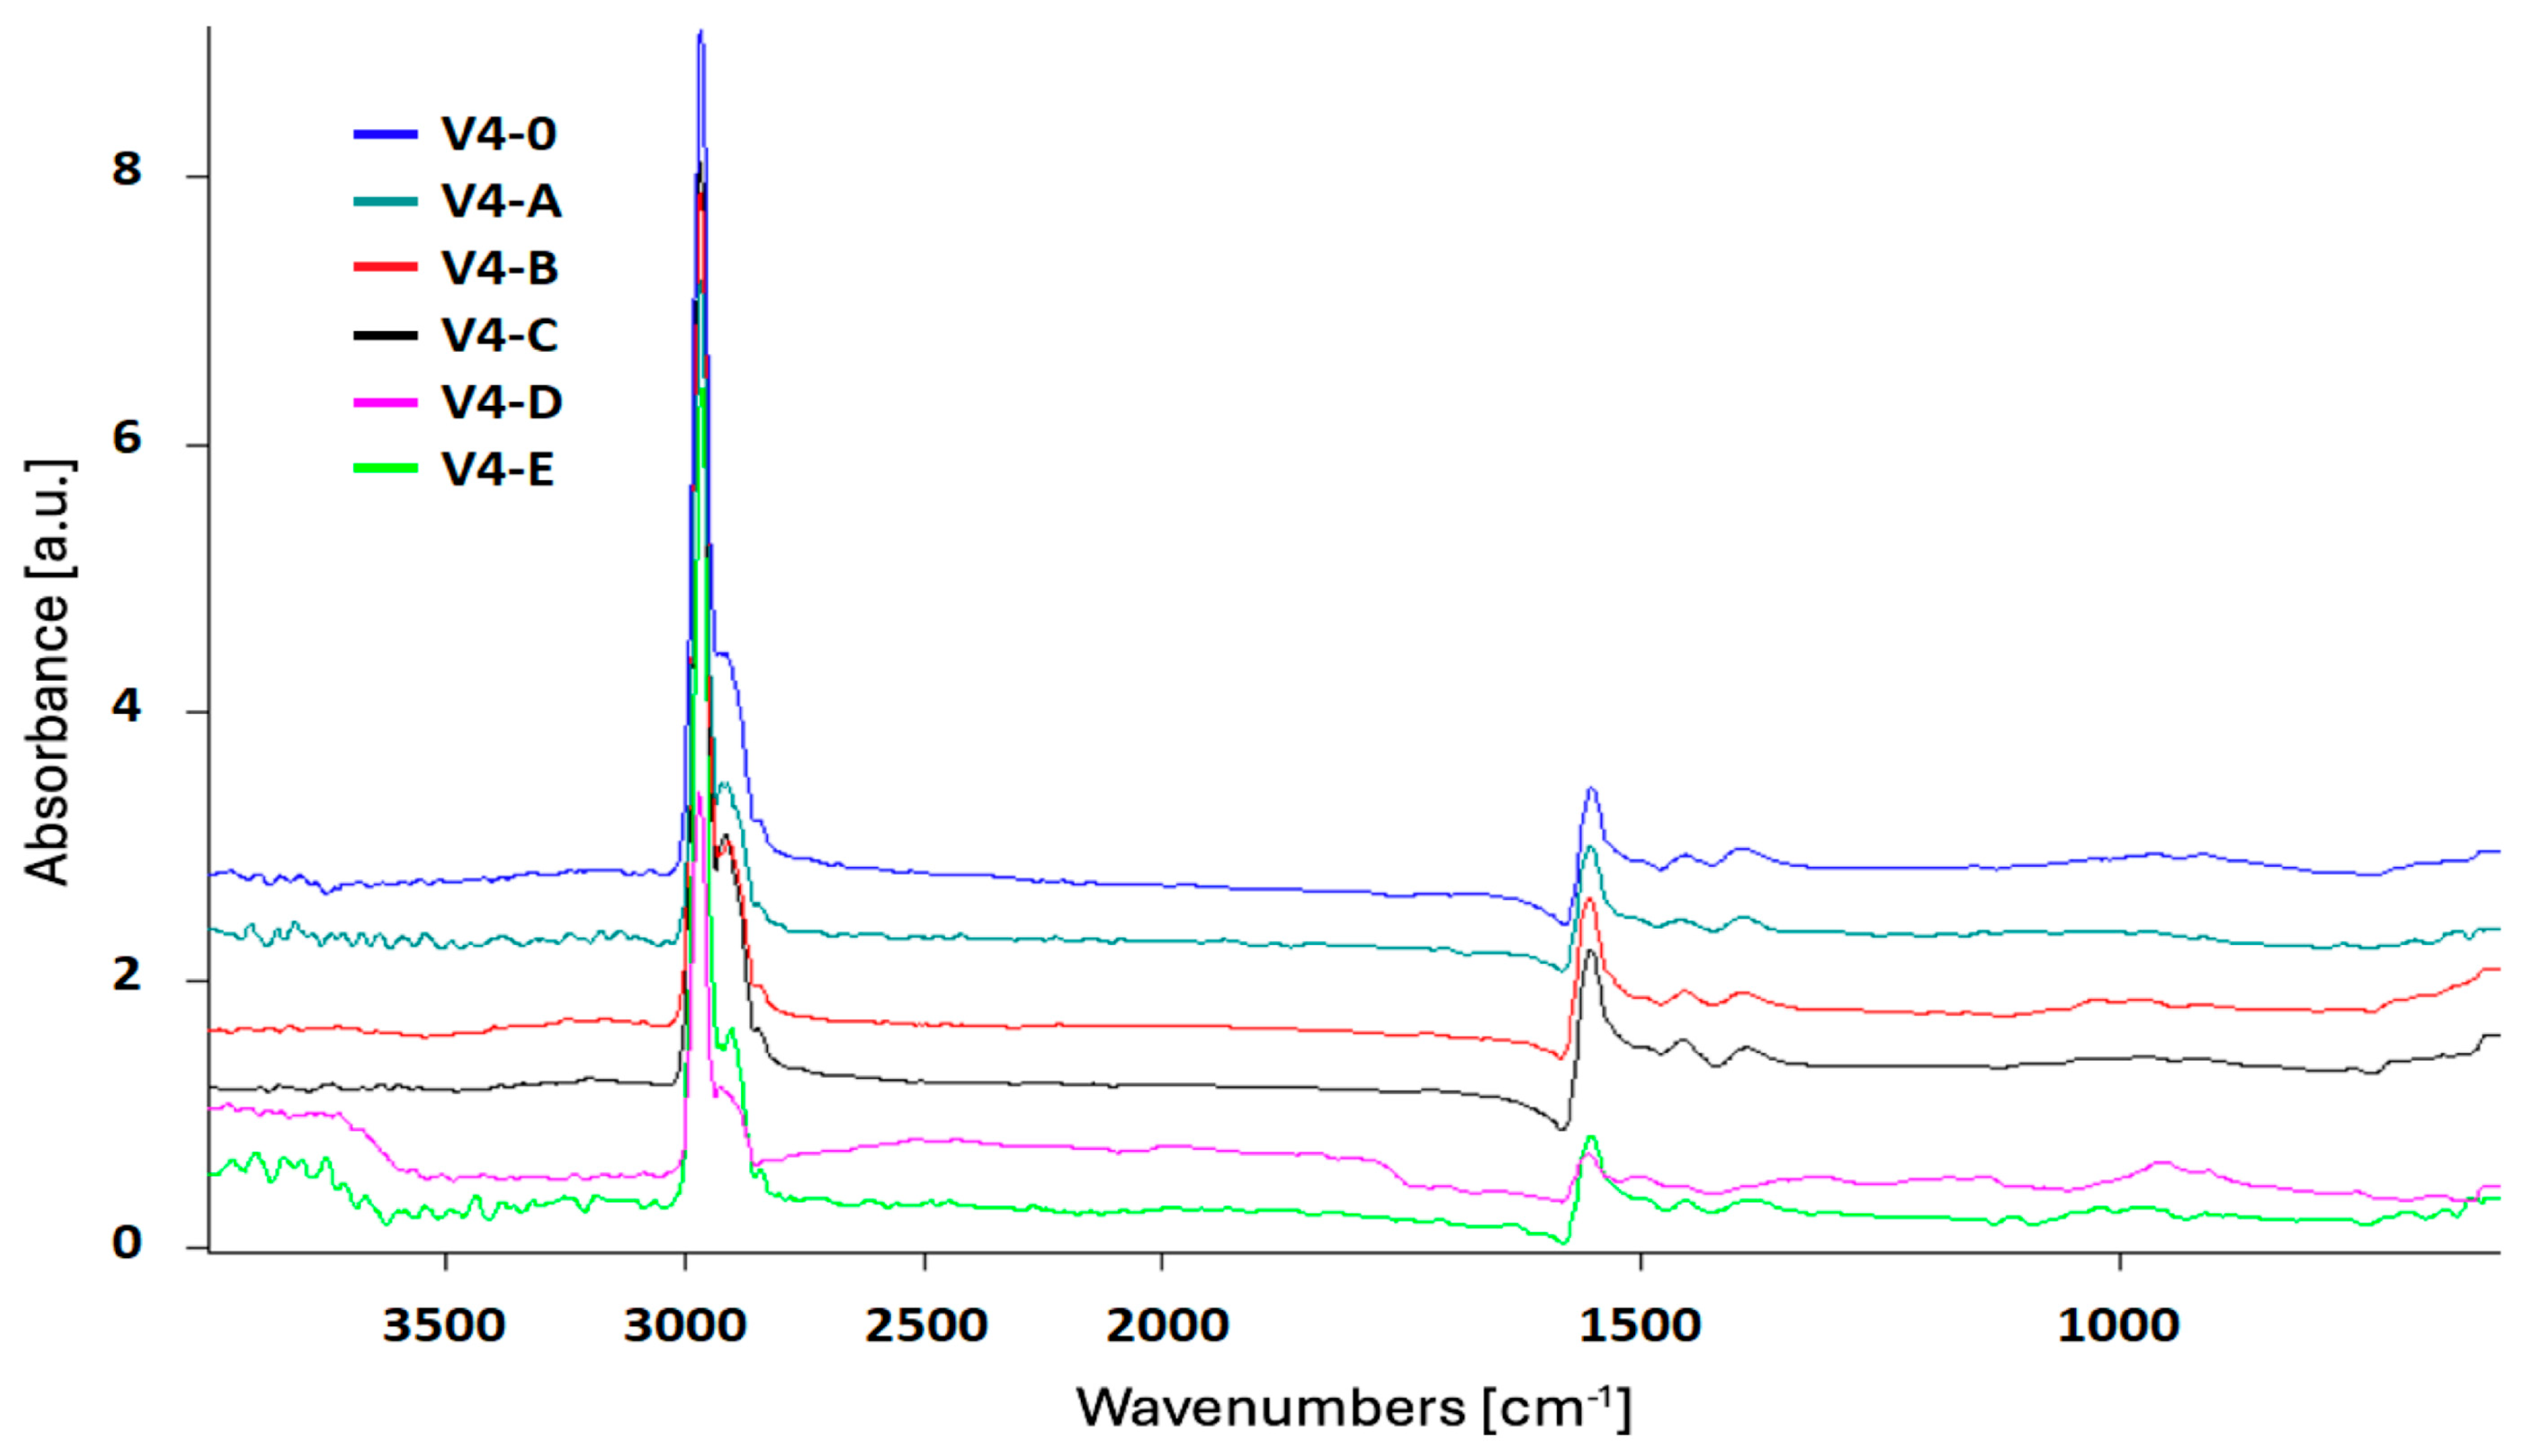
The FTIR spectra of the soaps from the V4 series are presented in Figure 2.
The FTIR spectrum of the control sample V4-0 (Figure 2) is dominated by the asymmetric stretching vibration of the carboxylate group (COO) in the 1540–1600 cm−1 region and the δ(CH2) band around 1465 cm−1 [41,54]. Compared with the V1 series, more pronounced contributions are observed in the 1700–1725 cm−1 region, attributed to free fatty acids, together with a weak ester band in the 1735–1750 cm−1 range, indicating the presence of residual unsaponified lipid fractions. The 2920–2850 cm−1 region exhibits strong absorption associated with aliphatic chains, while the fingerprint region shows greater spectral complexity.
For samples V4-A and V4-B, the fundamental soap structure was preserved, although an increase in intensity was observed in the 1020–1150 cm−1 region, which can be associated with the presence of polar additives. Bands related to free fatty acids remained detectable. The FTIR spectrum of sample V4-C simultaneously displayed the characteristic COO bands, contributions from polar components and weak aromatic signals in the 1505–1525 cm−1 region, suggesting the presence of EO retained within the soap matrix (Figure 2).
Sample V4-D exhibited the most complex spectral profile within the series, characterized by a well-defined COO band, an intensified fingerprint region associated with cyclodextrin and sorbitol, and weak but detectable ester bands. Additional weak aromatic contributions around 1505–1525 cm−1 further support the presence of EO in the formulation [41].
In the case of sample V4-E, the ester band in the 1735–1750 cm−1 region became more pronounced, whereas the 1020–1150 cm−1 region showed moderate enhancement, reflecting the influence of Dermowax GMS SE on the structural organization of the soap matrix (Figure 2).
Comparison of the V1 and V4 series indicates that both virgin and waste vegetable oils can be successfully incorporated into soap formulations while preserving the characteristic spectral features of the soap matrix. The greater spectral complexity observed for the V4 series reflects the higher chemical heterogeneity of the waste oil feedstock. Nevertheless, the presence of MCT–β-CD and the selected formulation additives contributed to maintaining the structural integrity of the formulations and supported the incorporation of the MCT–β-CD–thyme EO inclusion complex into the soap matrix.
Overall, the FTIR analysis confirms the successful formation of the soap matrix and provides structural evidence consistent with the incorporation of the MCT–β-CD–thyme EO inclusion complex into both virgin- and waste oil-based formulations, supporting the subsequent evaluation of their functional performance.

3.1.2. UV–Vis Calibration Curves

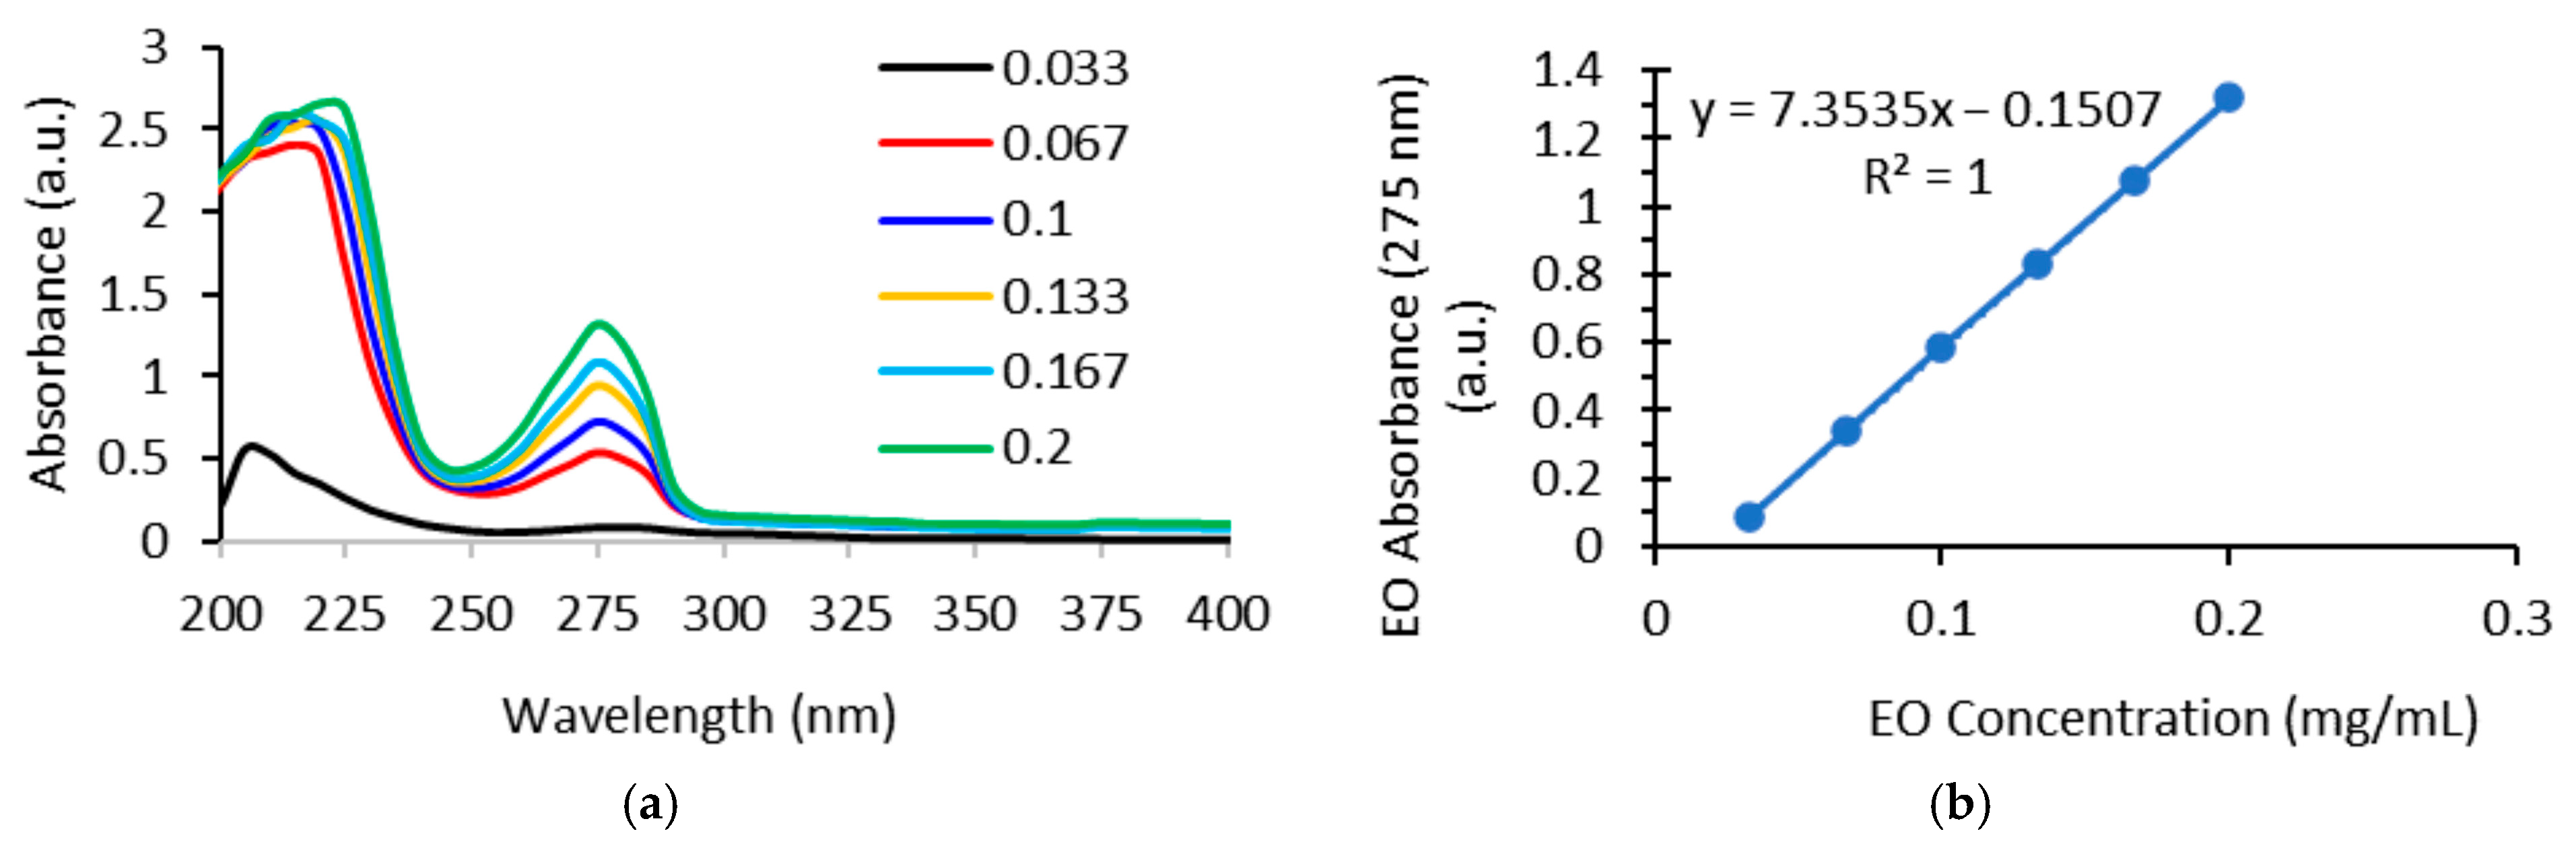
The UV–Vis absorption spectra of thyme EO at different concentrations in 96% ethanol, together with the corresponding calibration curve, are presented in Figure 3. A strong linear relationship between absorbance and EO concentration was obtained, as described by the calibration equation: y = 7.3535x − 0.1507 (R2 = 1).
The excellent correlation coefficient confirms the linearity of the method within the investigated concentration range, demonstrating its suitability for the quantitative determination of thyme EO in the subsequent analyses.

3.2. Validation of Inclusion Complex Formation

3.2.1. Qualitative Assessment of Inclusion Complex Formation

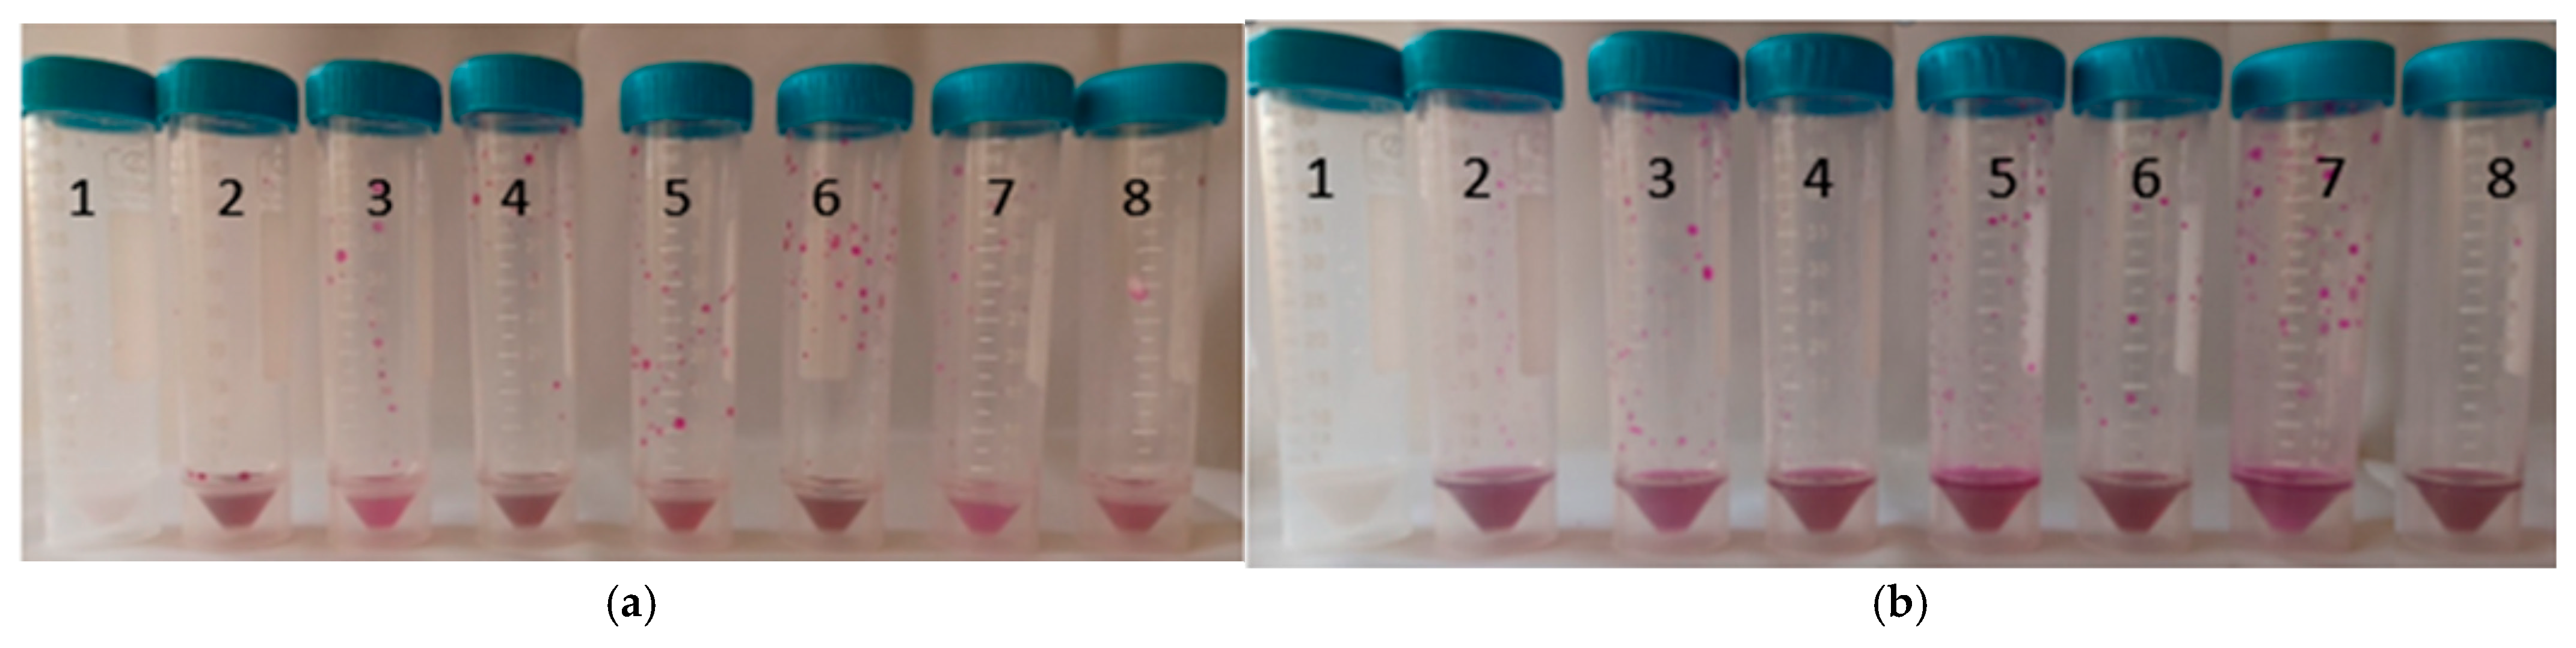
The formation of inclusion complexes between MCT–β-CD and thyme EO was qualitatively evaluated using the phenolphthalein test, an indirect method based on the colour variation in the indicator according to the availability of the cyclodextrin cavity [26,46]. In samples without EO (V1-C without EO), the disappearance of the magenta colour confirmed that phenolphthalein could readily access the free cyclodextrin cavity. In contrast, EO-containing samples retained the characteristic magenta coloration, indicating that the cavity was occupied by hydrophobic volatile compounds and confirming the formation of inclusion complexes [27].
The intensity of the magenta coloration varied with formulation composition, following the order V1-D > V1-B > V1-C > V1-E, suggesting that the combined presence of sorbitol and Dermowax GMS SE promoted a more effective stabilization of the inclusion complexes.
In the second stage of the test, following the addition of 96% ethanol, the stability of the inclusion complexes was evaluated. Ethanol partially disrupts host–guest interactions by facilitating the extraction of weakly bound hydrophobic compounds from the cyclodextrin cavity. Consequently, persistence of the magenta coloration indicated stable inclusion complexes, whereas fading of the colour reflected partial release of EO [46].
A comparative stability analysis based on the colour variations observed during both test stages (Table S3 and Figure 4) allowed the contribution of the formulation components to inclusion complex stabilization to be evaluated. Representative images illustrating the colour changes observed immediately after each test phase are presented in Figure 4.

3.2.2. Quantitative Evaluation of Inclusion Complex Formation

The qualitative phenolphthalein test provided qualitative evidence for the formation of stable inclusion complexes between MCT–β-CD and thyme EO and supported the use of 96% ethanol as the extraction solvent under the selected experimental conditions. The test further indicated that ethanol did not induce complete dissociation of the inclusion complexes. Partial displacement of weakly bound EO cannot be excluded. Based on this approach, UV–Vis spectrophotometry was employed to quantify free EO, encapsulated EO and encapsulation efficiency (EE%).
Determination of Free and Encapsulated Essential Oil
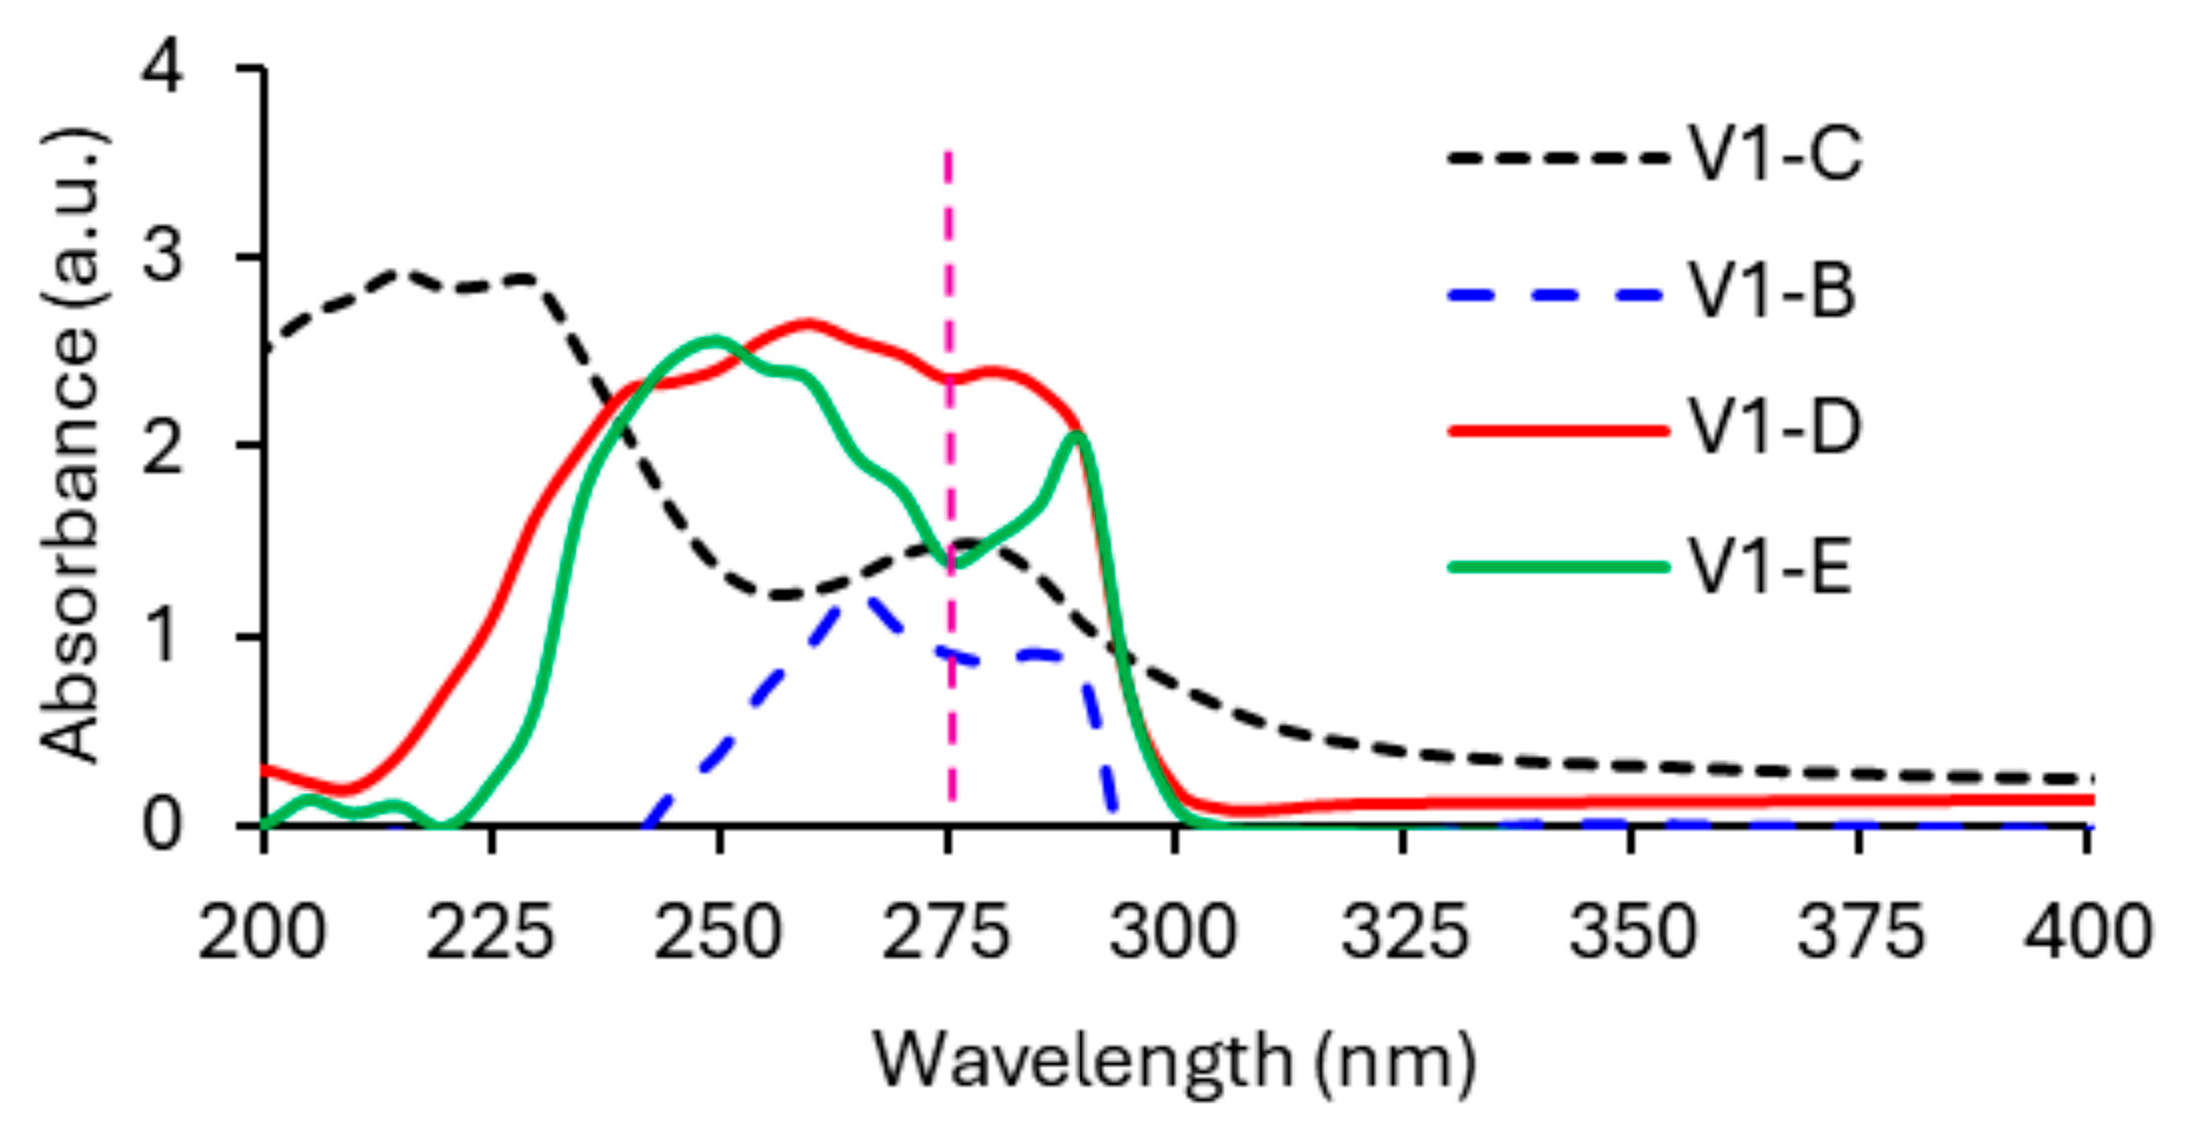
The amount of free EO was quantified spectrophotometrically at 275 nm using the previously established calibration curve (Figure 5). The results revealed differences among the investigated formulations, reflecting the influence of the formulation components on the distribution of EO between the free and encapsulated fractions.
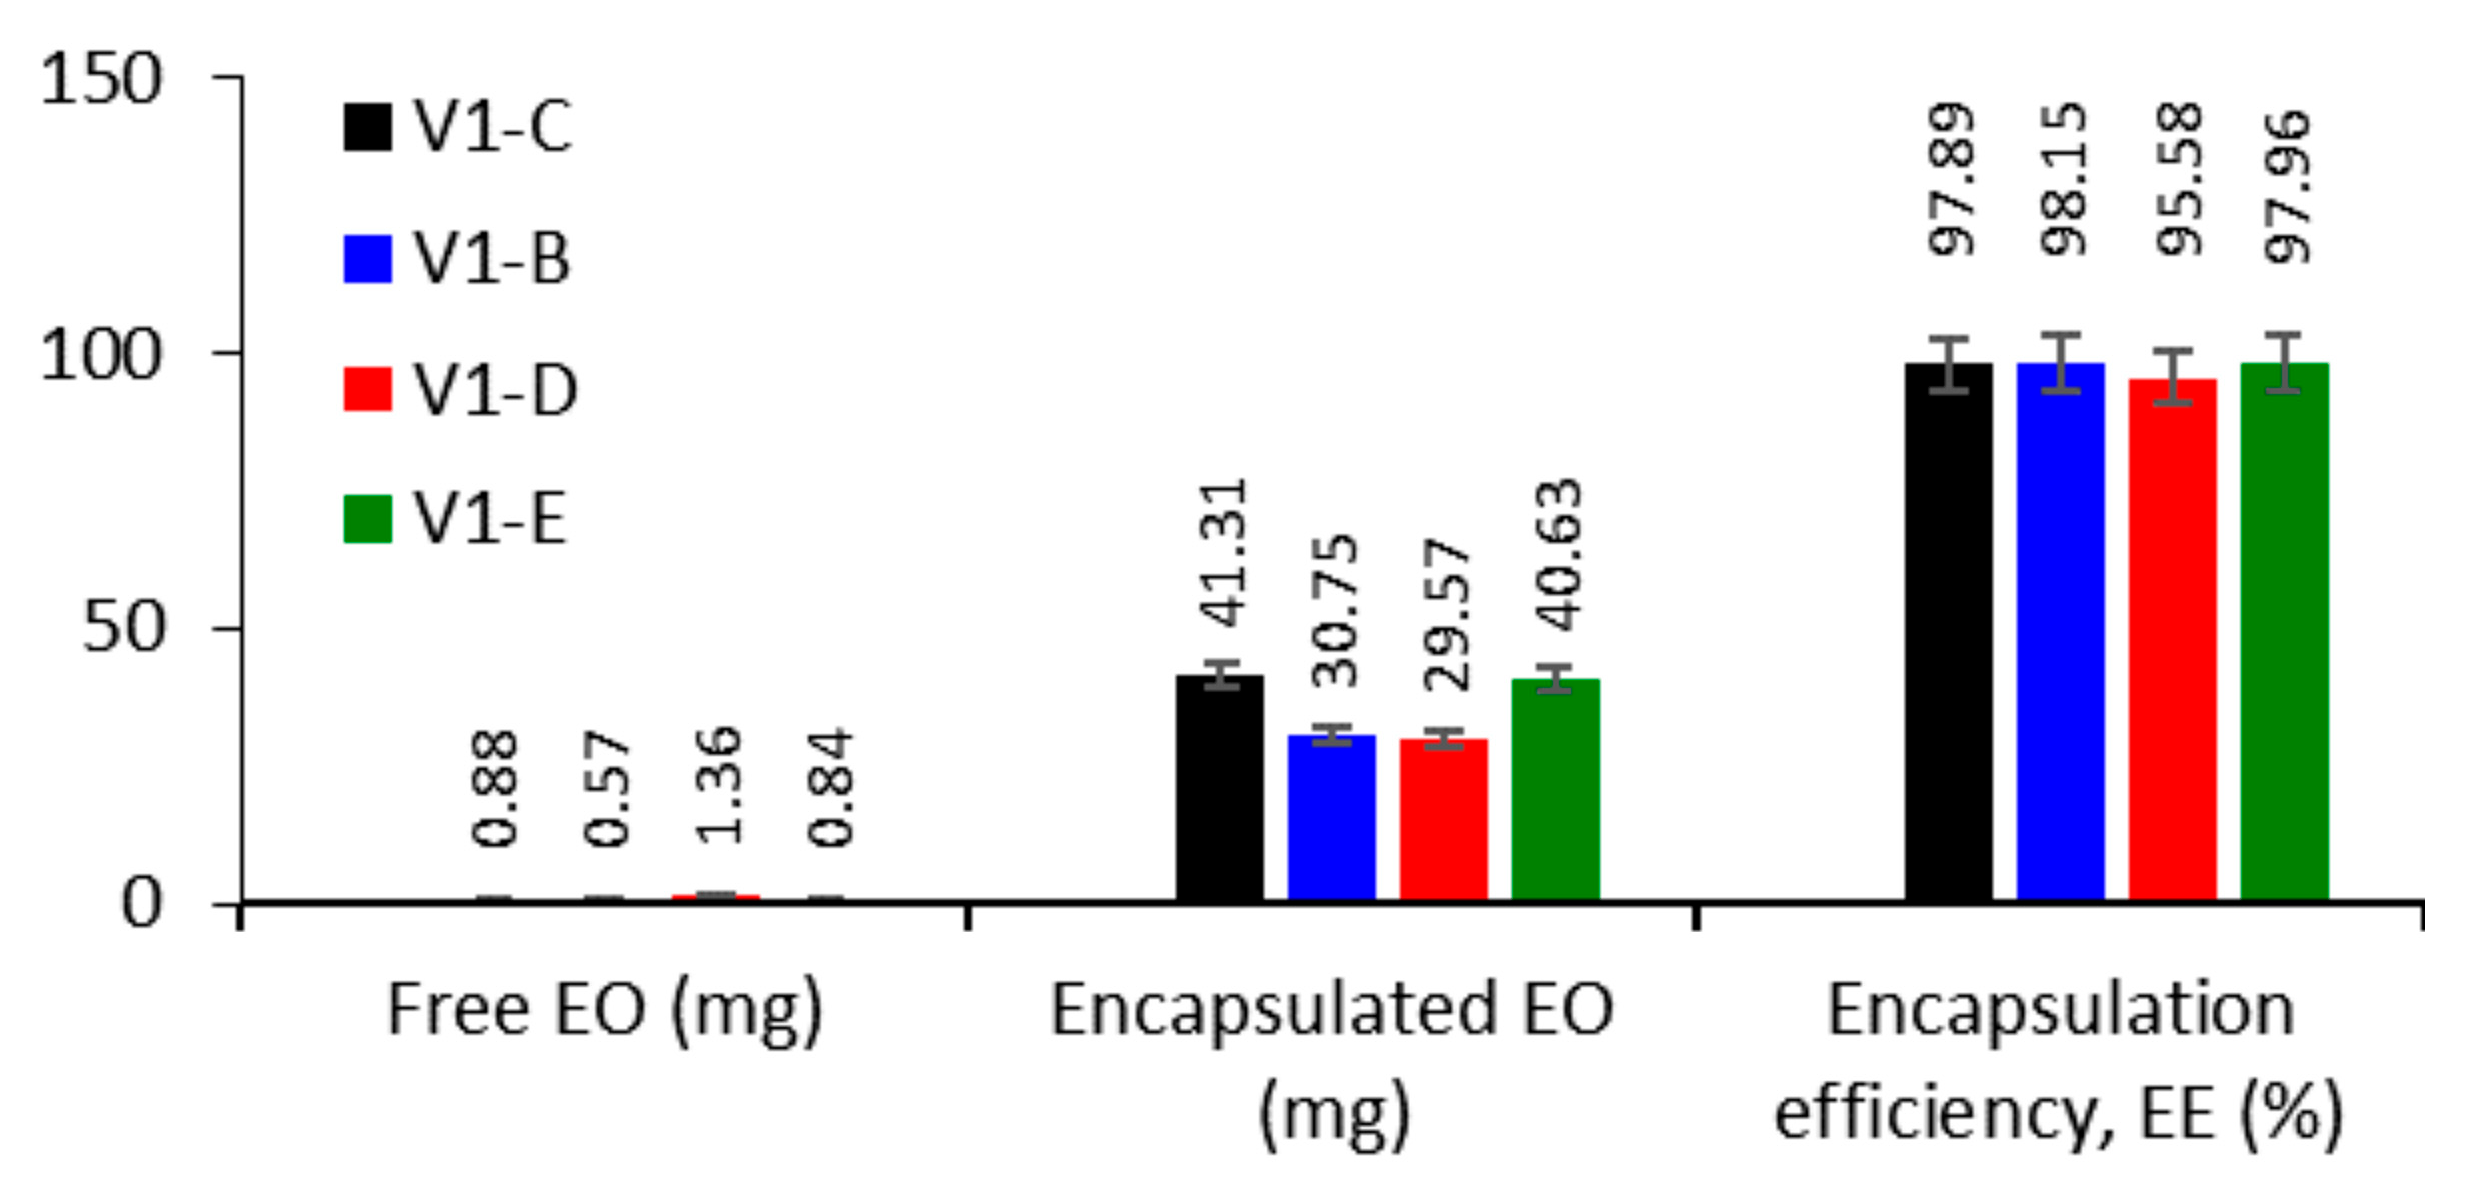
Among the investigated formulations, V1-B, containing sorbitol, exhibited the lowest amount of free EO (0.577 mg), indicating improved retention of EO within the cyclodextrin system. Intermediate values were obtained for V1-E (0.843 mg) and V1-C (0.887 mg), whereas V1-D, containing both sorbitol and Dermowax GMS SE, showed the highest amount of free EO (1.365 mg), suggesting that the simultaneous presence of both excipients influenced the distribution of EO within the formulation.
The amount of encapsulated EO, calculated as the difference between the total EO content and the free EO fraction according to the Beer–Lambert relationship [43], exhibited an opposite trend. The highest amounts of encapsulated EO were obtained for formulations V1-C (41.31 mg) and V1-E (40.63 mg), followed by V1-B (30.753 mg), while V1-D showed the lowest encapsulated EO content (29.57 mg) (Figure 6).
Encapsulation Efficiency (EE%) of Essential Oil
The encapsulation efficiency (EE%) of thyme EO in the MCT–β-CD inclusion complexes was calculated from the amounts of free and encapsulated EO determined by UV–Vis spectrophotometry. The corresponding results are presented in Figure 6.
All formulations exhibited high encapsulation efficiencies, ranging from 95.58% to 98.16%, confirming the strong affinity of thyme EO for the hydrophobic cavity of MCT–β-CD. These values indicate that the inclusion process remained highly efficient irrespective of formulation composition.
The highest EE% was obtained for formulation V1-B (98.16%), indicating that sorbitol promoted efficient retention of EO within the inclusion system. In contrast, formulation V1-D (95.58%), containing both sorbitol and Dermowax GMS SE, exhibited the lowest EE%, suggesting that the combined presence of the two excipients slightly reduced the efficiency of EO inclusion.

3.3. Quality Control and Performance of the Soap Formulations

The quality of the vegetable oils used for soap production was assessed using the saponification value (SAP), iodine value (IV) and INS index. For comparison, the corresponding reference SAPs and IVs reported in the Codex Alimentarius were included [55,56]. The experimentally determined SAPs, IVs and INS values for the individual virgin and waste oils, as well as the calculated values for the corresponding oil mixtures used in the soap formulations, are presented in Table 2. The experimentally determined SAPs and IVs confirmed that the virgin oils complied with the Codex Alimentarius reference ranges [55,56]. Although no Codex reference values are available for waste oils obtained after repeated domestic frying cycles, the experimentally determined SAPs, IVs and INS values indicated that these oils retained physicochemical characteristics suitable for soap production. Compared with the corresponding virgin oils, the waste olive pomace and coconut oils exhibited slightly higher SAPs and lower IVs. The iodine value reflects the degree of unsaturation of the vegetable oils; therefore, the lower IVs observed for the waste oils indicate the partial consumption of carbon–carbon double bonds through oxidation and other thermo-oxidative reactions occurring during repeated domestic frying. In parallel, thermal degradation of triglycerides promotes the formation of lower-molecular-weight compounds and free fatty acids, resulting in a slight increase in the saponification value. Consequently, the calculated INS values increased for the waste oils as a direct result of the higher SAPs and lower IVs. Likewise, the calculated SAPs, IVs and INS values of the virgin and waste oil mixtures confirmed that both formulations retained physicochemical characteristics suitable for soap production. Overall, these findings demonstrate that repeated domestic frying modified the physicochemical characteristics of the vegetable oils without compromising their suitability as sustainable lipid feedstocks for the preparation of multifunctional laundry soap formulations.

3.3.1. Physicochemical Properties of the Formulated Soaps

The physicochemical properties of the formulated soaps were evaluated based on pH and foaming capacity, two parameters that provide information on formulation quality and practical performance.
pH of the Soaps
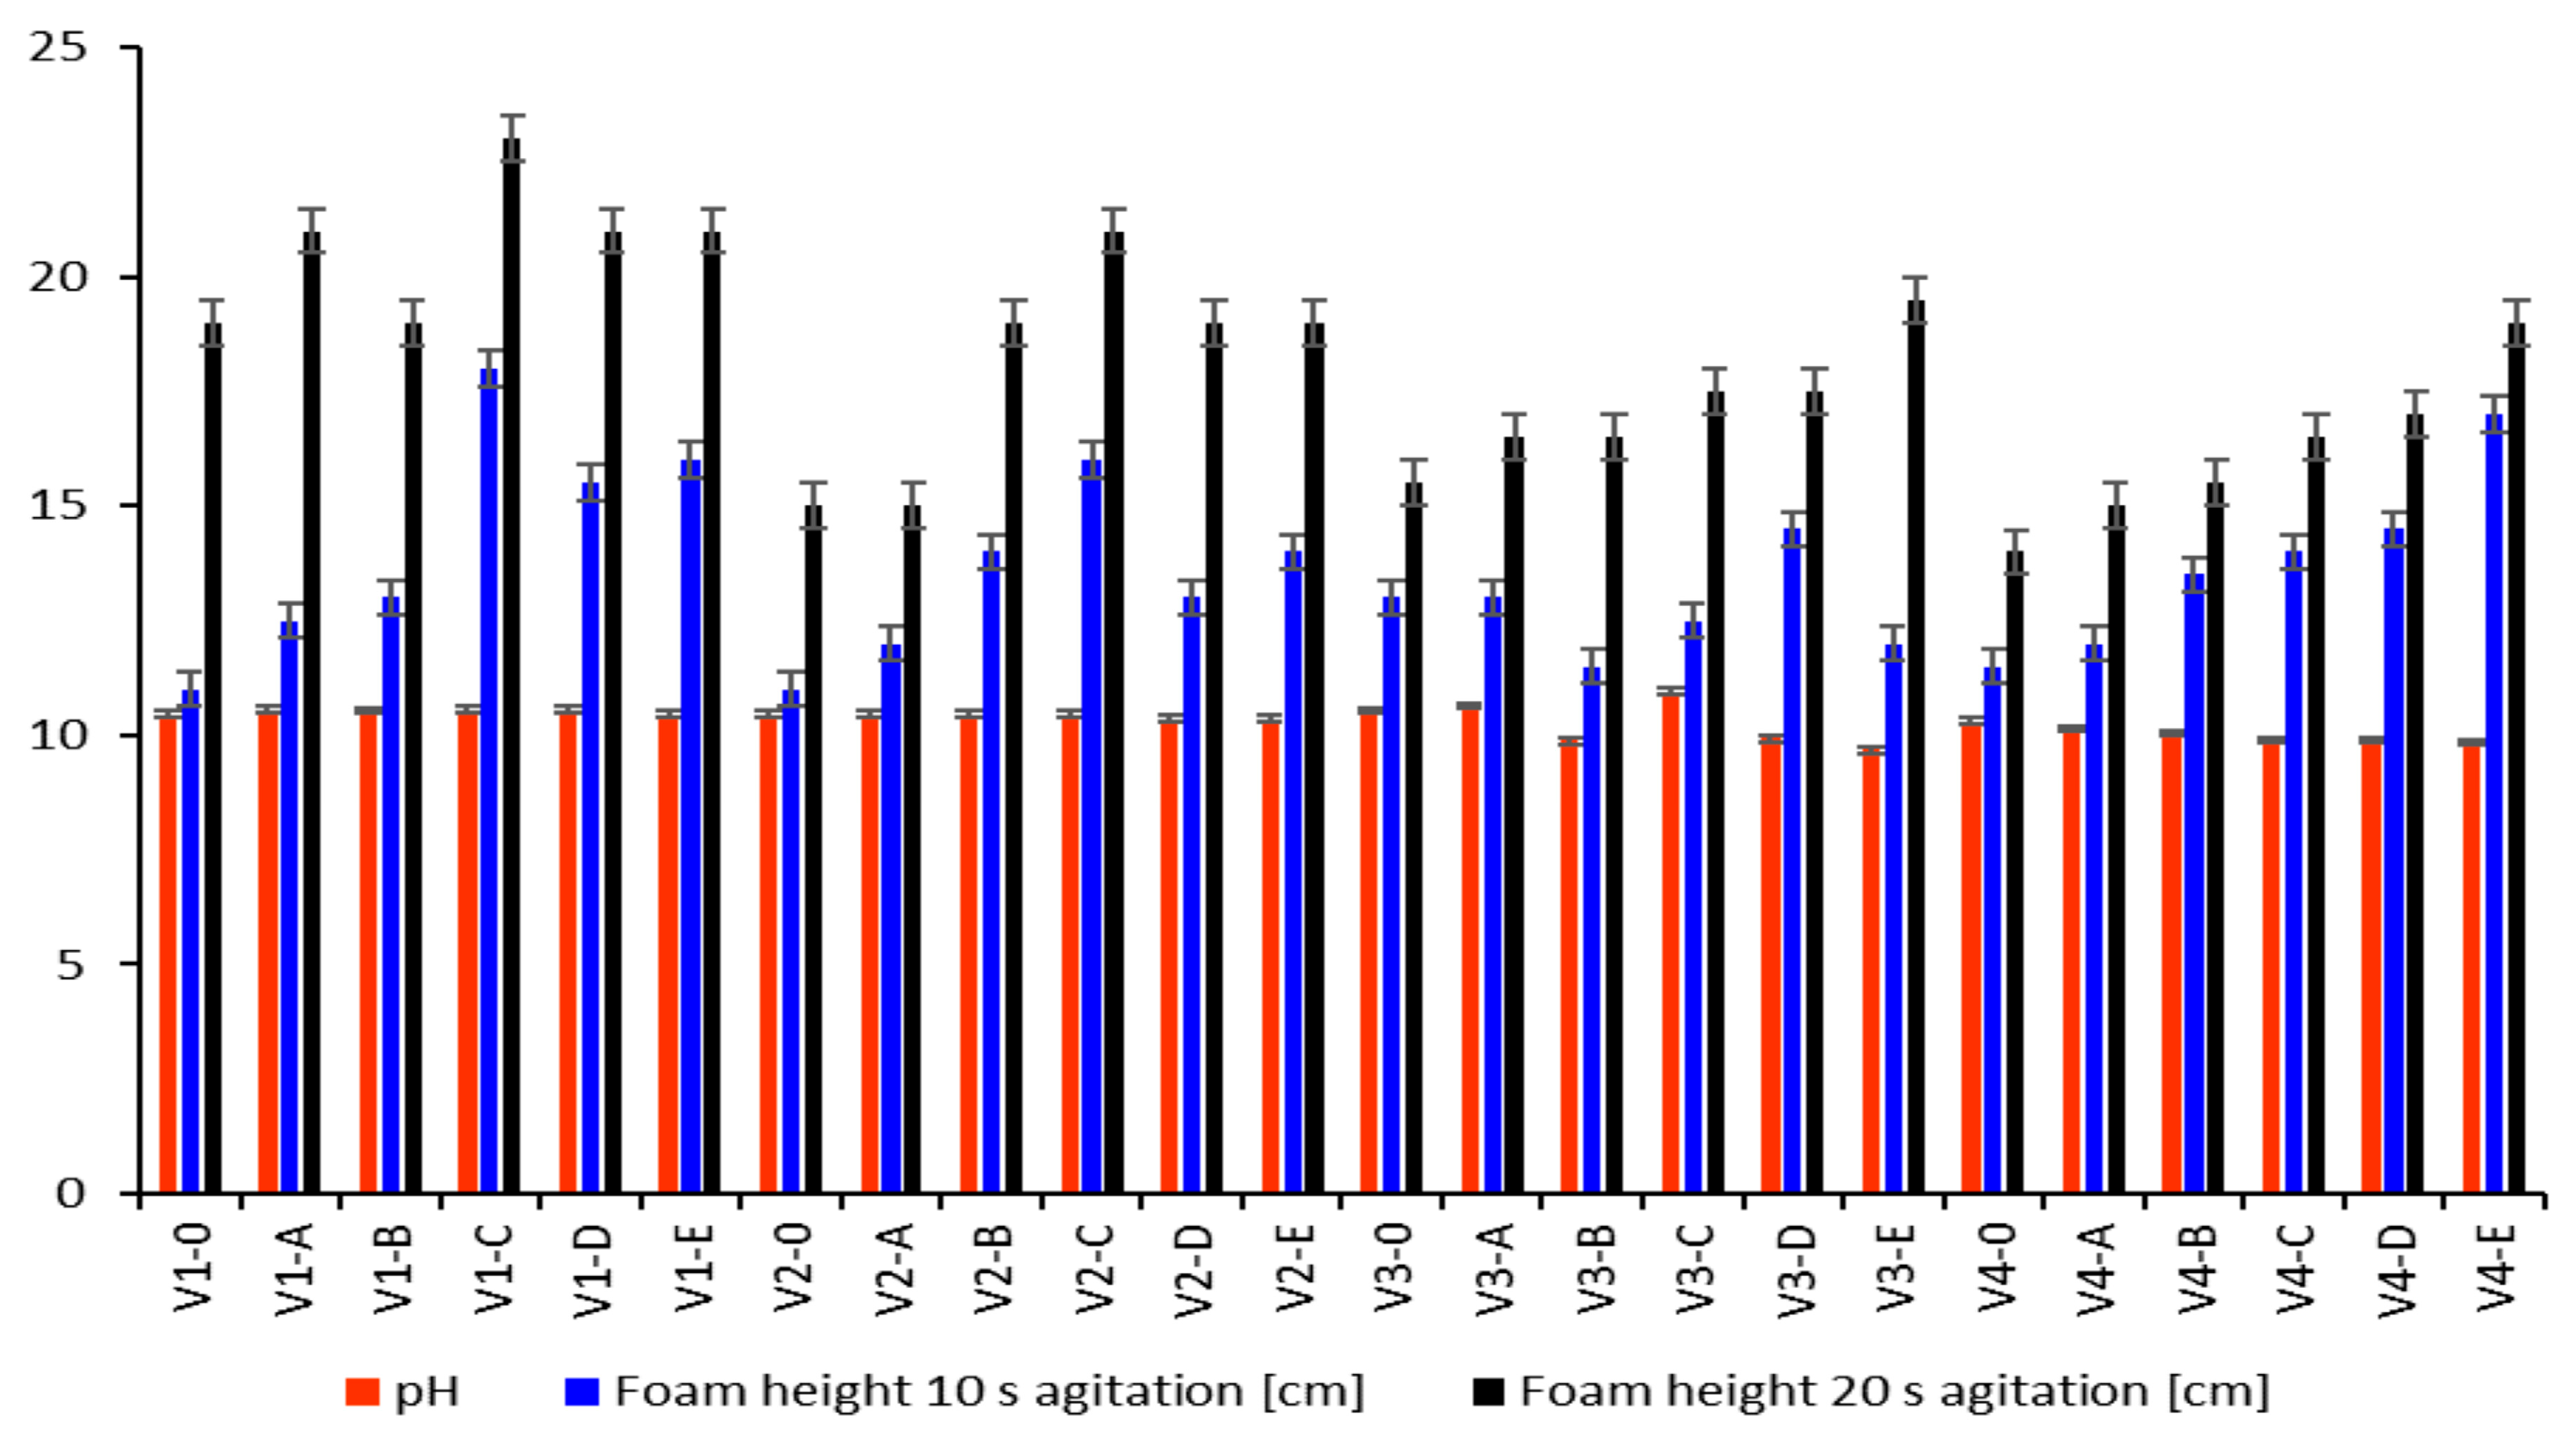
The pH values ranged from 9.84 to 10.64, confirming the typical alkaline character of solid soap systems [57,58]. Formulations containing MCT–β-CD, sorbitol and Dermowax GMS SE generally exhibited slightly lower pH values (approximately 9.8–10.0) than the corresponding control formulations, indicating that these additives slightly moderated the alkalinity of the system while maintaining complete saponification.
In contrast, formulations prepared without excipients or based exclusively on virgin oils exhibited slightly higher pH values (10.5–10.6), which may be associated with a higher content of residual alkaline species. Nevertheless, all formulations remained within the pH interval generally reported for solid soaps.
Foaming Capacity
Foaming capacity was strongly influenced by formulation composition. The lowest foam heights (11–13 cm) were recorded for the control formulations (V1-0 and V2-0) and for some waste oil-based formulations, such as V4-E, indicating reduced foaming ability (Figure 7).
Higher foam heights (14–18 cm) were observed for formulations containing coconut-oil-based soap matrices together with functional additives, particularly V1-C, V1-D and V4-D, demonstrating improved foam formation and stability.
Overall, the pH and foaming results confirmed that all formulations exhibited physicochemical properties suitable for textile care applications.

3.3.2. Transfer of Essential Oil to Textile Substrates During Washing

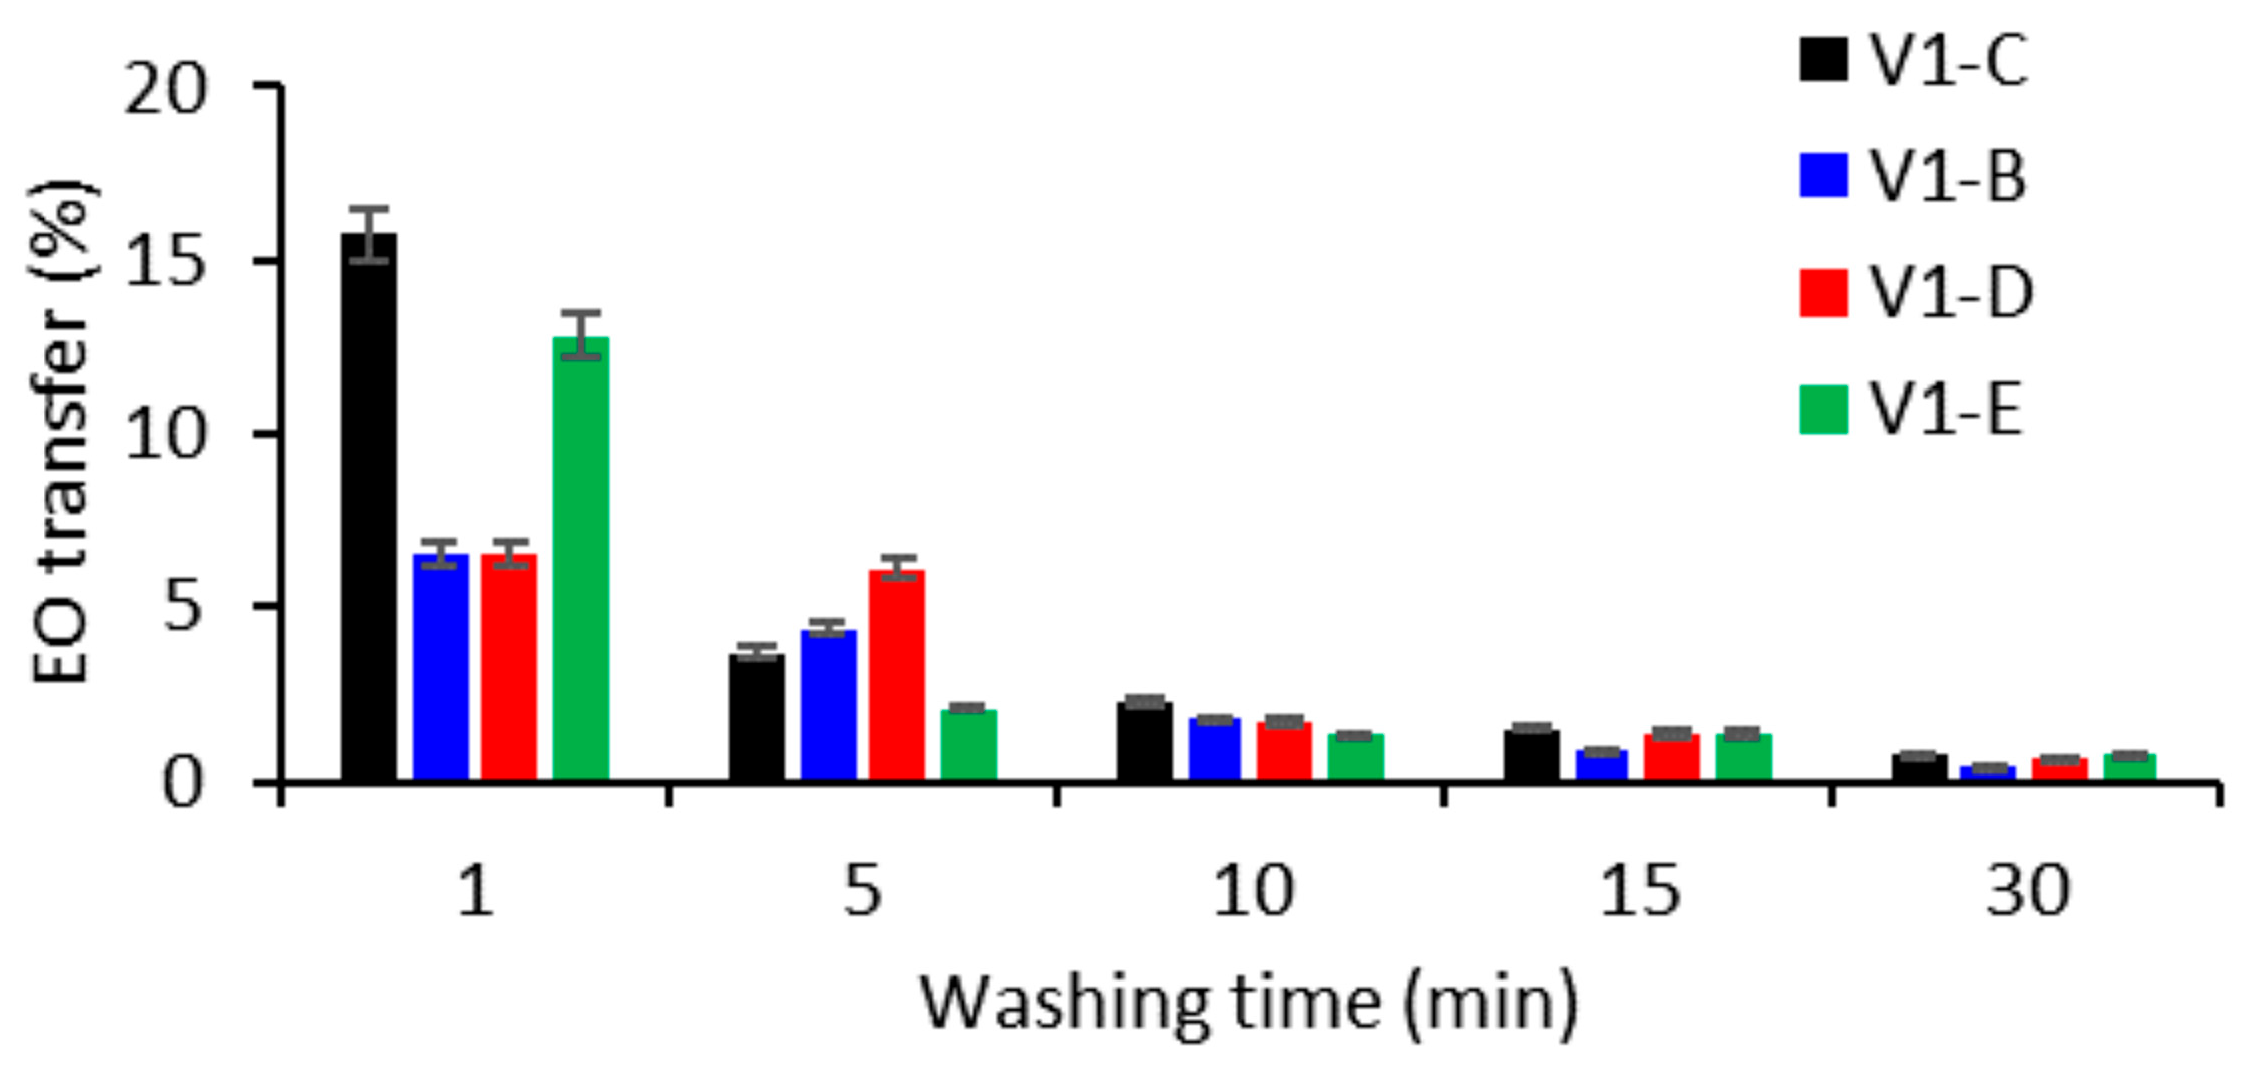
The transfer of thyme essential oil (EO) from the washing solution to the cotton textile substrate during washing was evaluated by determining the amount of EO associated with the textile specimens at different washing times. The transfer of bioactive compounds to textile substrates during laundering is an important aspect in the development and evaluation of functional textiles [59,60,61]. The estimated transfer values, systematized in Figure 8, revealed clear differences among the investigated formulations, indicating that the chemical composition of each soap directly influenced the amount of EO associated with the textile substrate throughout the washing process.
Among the investigated formulations, the baseline formulation V1-C (MCT–β-CD + EO) exhibited the highest estimated EO transfer after 1 min (15.73%), followed by a progressive decrease to 0.72% after 30 min. Formulations V1-B (MCT–β-CD + EO + sorbitol) and V1-D (MCT–β-CD + EO + sorbitol + Dermowax GMS SE) showed similar initial transfer values after 1 min (6.53% and 6.50%, respectively). After 30 min, formulation V1-B exhibited the lowest estimated EO transfer (0.42%), whereas formulation V1-D retained a slightly higher value (0.61%). Formulation V1-E (MCT–β-CD + EO + Dermowax GMS SE) showed a relatively high initial transfer (12.77%), which gradually decreased to 0.73% after 30 min. Overall, the investigated formulations differed both in the initial amount of EO transferred to the textile substrates and in the subsequent decrease in the estimated amount of EO associated with the textile specimens during washing. These differences indicate that formulation composition influenced EO transfer to the textile substrates under the experimental conditions employed in this study.

3.3.3. Colorimetric Characterization of Washed Textile Samples

The colorimetric characteristics of the cotton fabrics after washing with the formulated soaps were evaluated in the CIELAB colour space. The measured parameters for the untreated clean cotton fabric (reference, R-C), the soiled cotton fabric (R-S), the textile washed with the reference detergent (R-D), and the textile samples washed with the V1–V4 soap formulations are presented as mean values ± standard deviation (SD) in Table 3.
The CIELAB colour space provides quantitative information on the optical appearance of textile materials, where L* represents lightness, a* the green–red coordinate, b* the blue–yellow coordinate, C* the chroma and h* the hue angle [62]. These parameters provide complementary information on the extent of soil removal and the residual coloration remaining after washing.
The measured L* values ranged from 84.98 to 87.91, indicating that all formulations restored a high degree of fabric brightness after washing. The highest lightness values were obtained for formulations V1-D and V2-A, whereas slightly lower values were recorded for several formulations from the V3 and V4 series.
The a* values varied between 2.64 and 4.43, indicating only slight residual red coloration, while the b* values ranged from 6.99 to 7.62, reflecting limited differences in the residual yellow component among the investigated formulations.
Similarly, the C* and h* values exhibited relatively small variations, suggesting that the chromatic differences between the washed textile samples were modest. Slightly higher chroma values observed for several formulations in the V3 series indicate a somewhat greater retention of coloured soil compared with the other formulations [63].
Overall, the colorimetric analysis revealed only moderate differences among the investigated formulations. Therefore, washing performance was further evaluated using the normalized Hidden Stain (Hs) indices and colour difference (ΔE*) analysis presented in the following sections.
Hidden Stain (Hs) Indices and Washing Efficiency
The Hidden Stain indices (Hs1 and Hs2) together with the calculated washing efficiency are presented in Table 4. Lower Hs values indicate reduced residual stain visibility and, consequently, higher cleaning efficiency [20].
The Hs2 values ranged from 8.08 to 13.94%, while the corresponding washing efficiencies varied between 86.06 and 91.92%, indicating effective soil removal for all investigated formulations.
Among the investigated soaps, V1-D exhibited the lowest Hs2 value (8.08%) together with the highest washing efficiency (91.92%), demonstrating the most effective removal of residual soil. In contrast, formulation V3-E showed the highest Hs2 value (13.94%) and the lowest washing efficiency (86.06%), indicating less efficient cleaning performance.
Overall, the V1 and V2 series achieved the highest washing efficiencies, whereas the V3 formulations showed slightly lower cleaning performance. The V4 formulations, despite being prepared from waste vegetable oils, maintained satisfactory washing efficiency.
Colour Difference Relative to the Reference Detergent
The colour differences between fabrics washed with the formulated soaps and those washed with the reference detergent were evaluated using the CIELAB colour difference (ΔE*) together with its individual components (ΔL*, Δa*, Δb*, ΔC* and ΔH*). The obtained results are summarized in Table 5.
The calculated ΔE* values ranged from 3.83 to 6.50, indicating visually perceptible but moderate colour differences relative to the reference detergent [62].
For all formulations, positive ΔL* values together with negative Δa* and Δb* values indicate that the fabrics washed with the formulated soaps were slightly brighter and exhibited lower red and yellow colour components than those washed with the reference detergent. These results suggest the efficient removal of coloured soil components and the substantial restoration of the optical appearance of the textile substrates [63].
Overall, the colour differences remained moderate for all investigated formulations. The observed ΔE* values indicate visually perceptible differences relative to the reference detergent but remain consistent with effective washing performance under the experimental conditions employed.
Overall Washing Performance of the Soap Formulations
To obtain an overall assessment of washing performance, the formulations were compared using three complementary indicators: Hs2, washing efficiency, and ΔE*. Lower Hs2 values indicate reduced residual stain visibility, higher washing efficiency reflects improved soil removal, whereas lower ΔE* values indicate closer agreement with the reference detergent.
The comparative washing performance of the selected formulations is presented in Table 6.
Among the investigated formulations, V1-D exhibited the lowest Hs2 value (8.08%) and the highest washing efficiency (91.92%), while its ΔE* value remained comparable to that of the reference detergent. Formulation V1-B showed very similar washing performance together with the highest encapsulation efficiency, whereas V2-A and V2-D also demonstrated very good washing behaviour. Among the formulations prepared from waste vegetable oils, V4-B exhibited the most favourable combination of washing performance indicators.

3.4. Presence and Persistence of Essential Oil on Textile Substrates After Washing and Successive Rinsing

The presence of thyme essential oil (EO) on the washed textile samples was confirmed by extraction with absolute ethanol followed by UV–Vis spectrophotometric analysis at 275 nm, corresponding to thymol and carvacrol, the major constituents of thyme EO [64,65]. The detection of these characteristic absorption bands confirmed the presence of measurable amounts of EO associated with the textile fibres following the washing and successive rinsing procedure. EO persistence on the textile substrates was evaluated by estimating the amount of EO associated with the textile specimens at each sampling stage using the UV–Vis calibration curve, the Beer–Lambert relationship, and the calculation procedure described in Supplementary Table S1. The resulting EO persistence values are presented in Table 7.
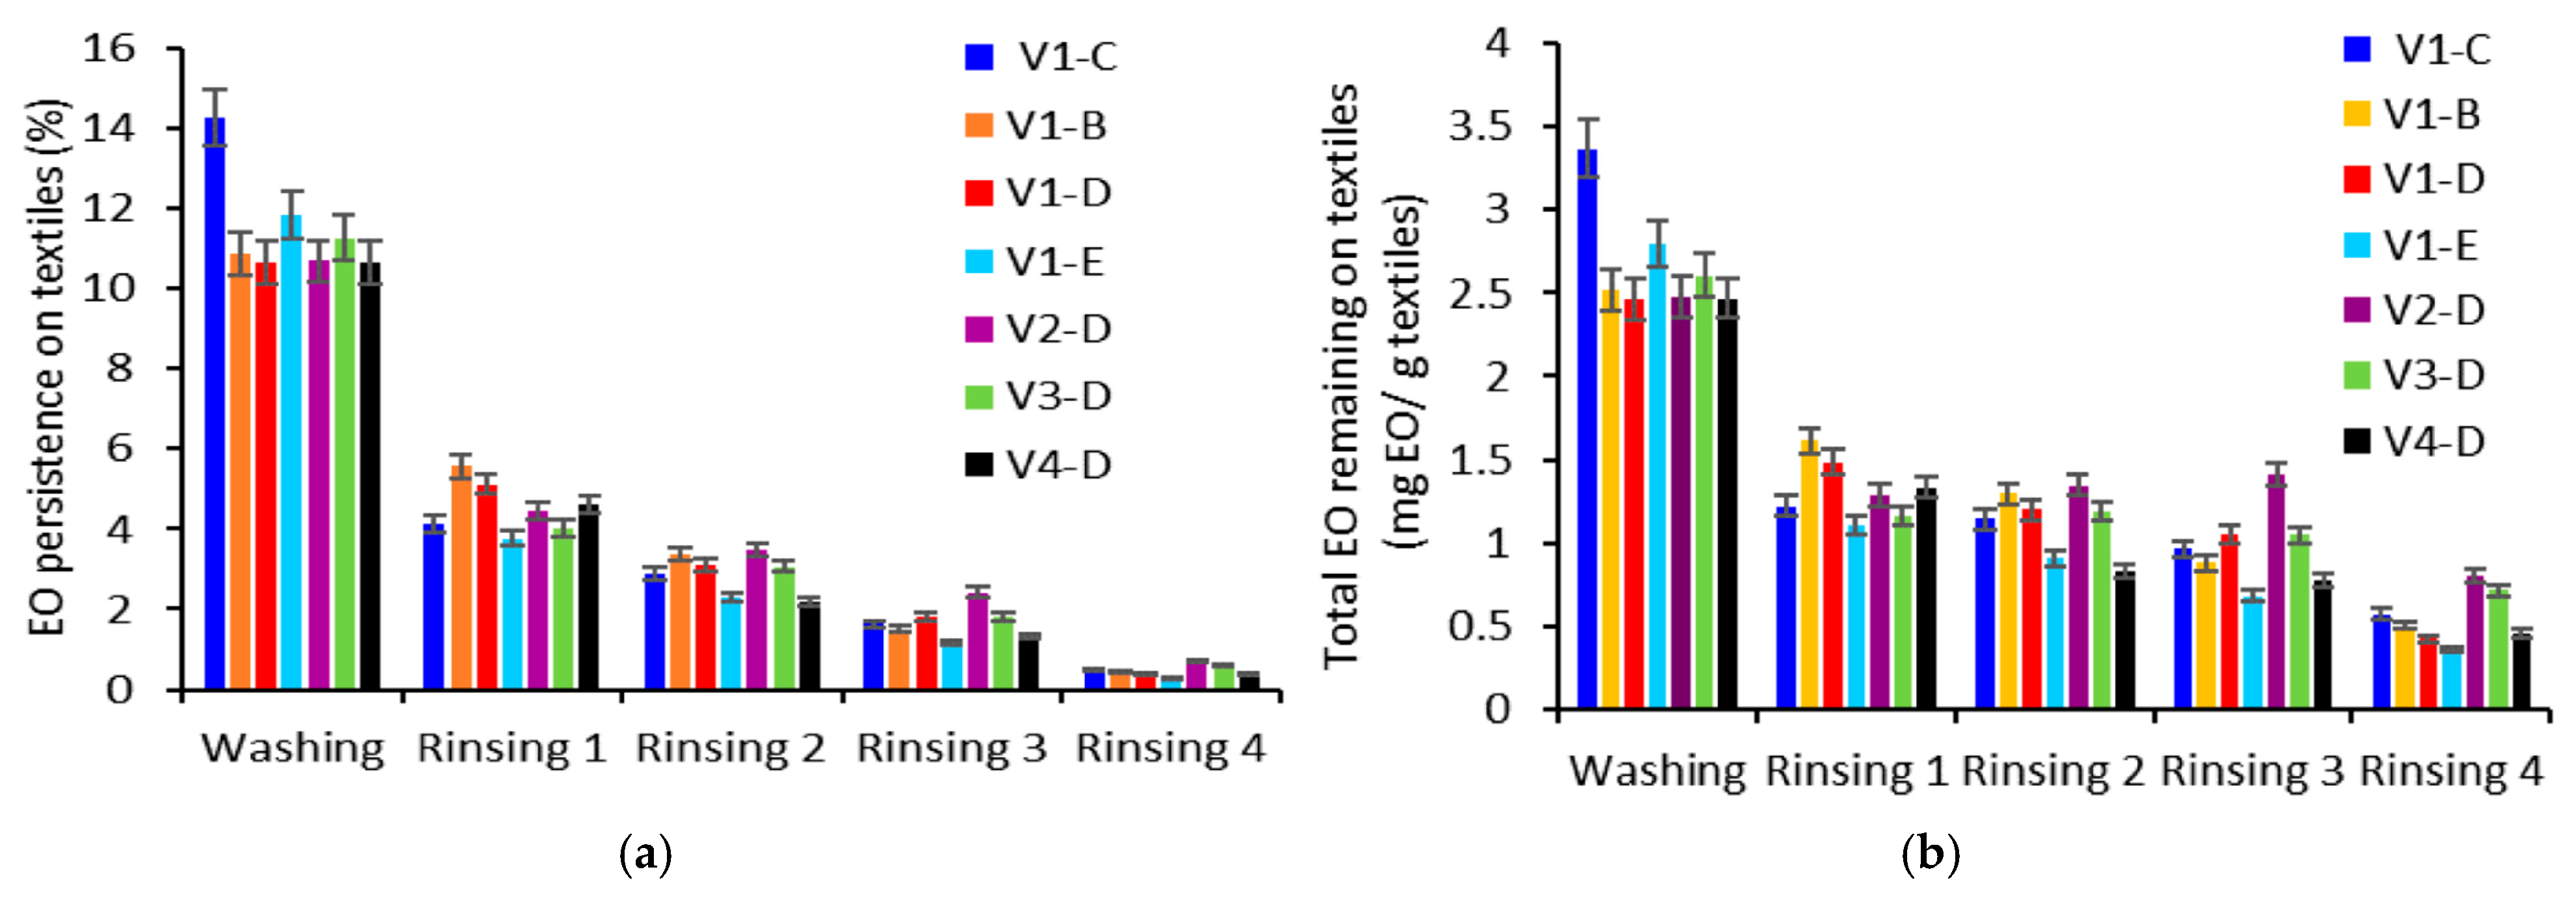
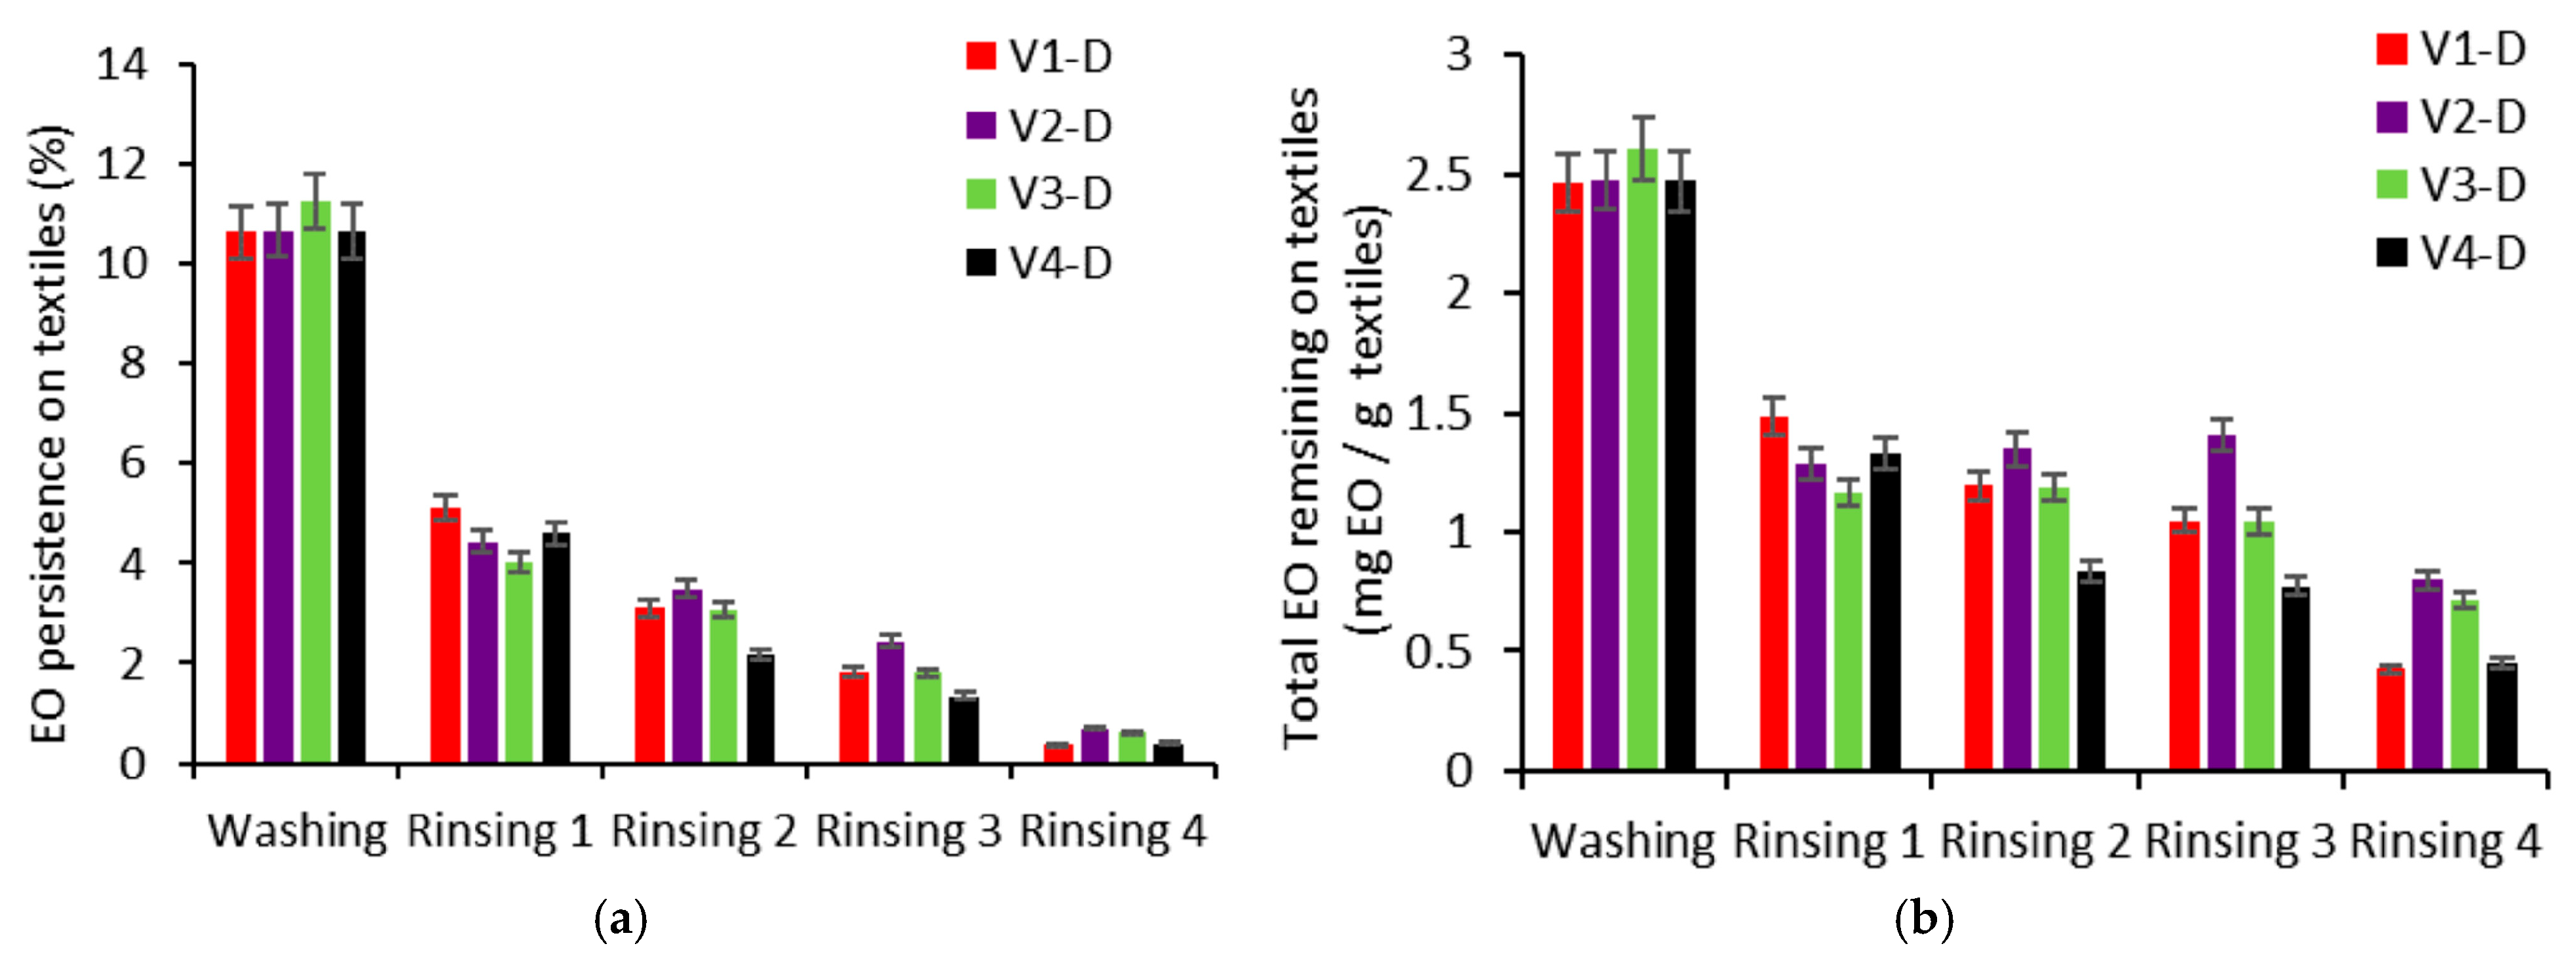
For all formulations, EO persistence decreased progressively from the initial washing stage to the fourth rinsing stage, with persistence values declining from 10.641 to 14.250% after washing to 0.302–0.689% after the final rinsing stage (Table 7). Among the formulations prepared exclusively from virgin vegetable oils, V1-C exhibited the highest EO persistence immediately after washing (14.250%), followed by a progressive decrease to 0.483% after the fourth rinsing stage. Formulations containing sorbitol and/or Dermowax GMS SE exhibited different persistence profiles throughout the rinsing procedure. Within the virgin oil-based formulations, V1-B retained 5.563% and 3.355% after the first and second rinsing stages, respectively, before decreasing to 0.432% after the fourth rinsing stage. Formulation V1-D showed a persistence of 10.641% after washing and 0.365% after the fourth rinsing stage, whereas formulation V1-E decreased from 11.859% after washing to 0.302% after the fourth rinsing stage. The formulations prepared with mixtures of virgin and waste vegetable oils (V2-D and V3-D) exhibited the highest persistence after the fourth rinsing stage, reaching 0.689% and 0.615%, respectively, while formulation V4-D retained 0.391%. Overall, the investigated formulations exhibited distinct EO persistence profiles throughout the washing and successive rinsing stages, indicating that formulation composition influenced the amount of EO remaining associated with the textile substrates under the experimental conditions employed in this study.
The persistence behaviour of all formulations is illustrated in Figure 9 and Figure 10, where Figure 9 presents the global evolution of EO persistence expressed as a normalized percentage yield, whereas Figure 10 compares exclusively the D-series formulations containing identical inclusion complexes but different vegetable oil matrices.
The estimated EO amounts remaining on the textile substrates, expressed as mg EO/g textile (Figure 9b and Figure 10b), also revealed clear differences among the investigated formulations. At the fourth rinsing stage, the formulations prepared exclusively from virgin vegetable oils retained between 0.357 and 0.572 mg EO/g textile, whereas the formulations prepared with recycled waste vegetable oils retained higher amounts, reaching 0.798 mg/g for V2-D and 0.713 mg/g for V3-D. Formulation V4-D retained 0.453 mg EO/g textile. These results further indicate that differences in formulation composition were associated with differences in the amount of EO remaining associated with the textile substrates throughout the washing and successive rinsing procedure.

3.5. Antibacterial Activity

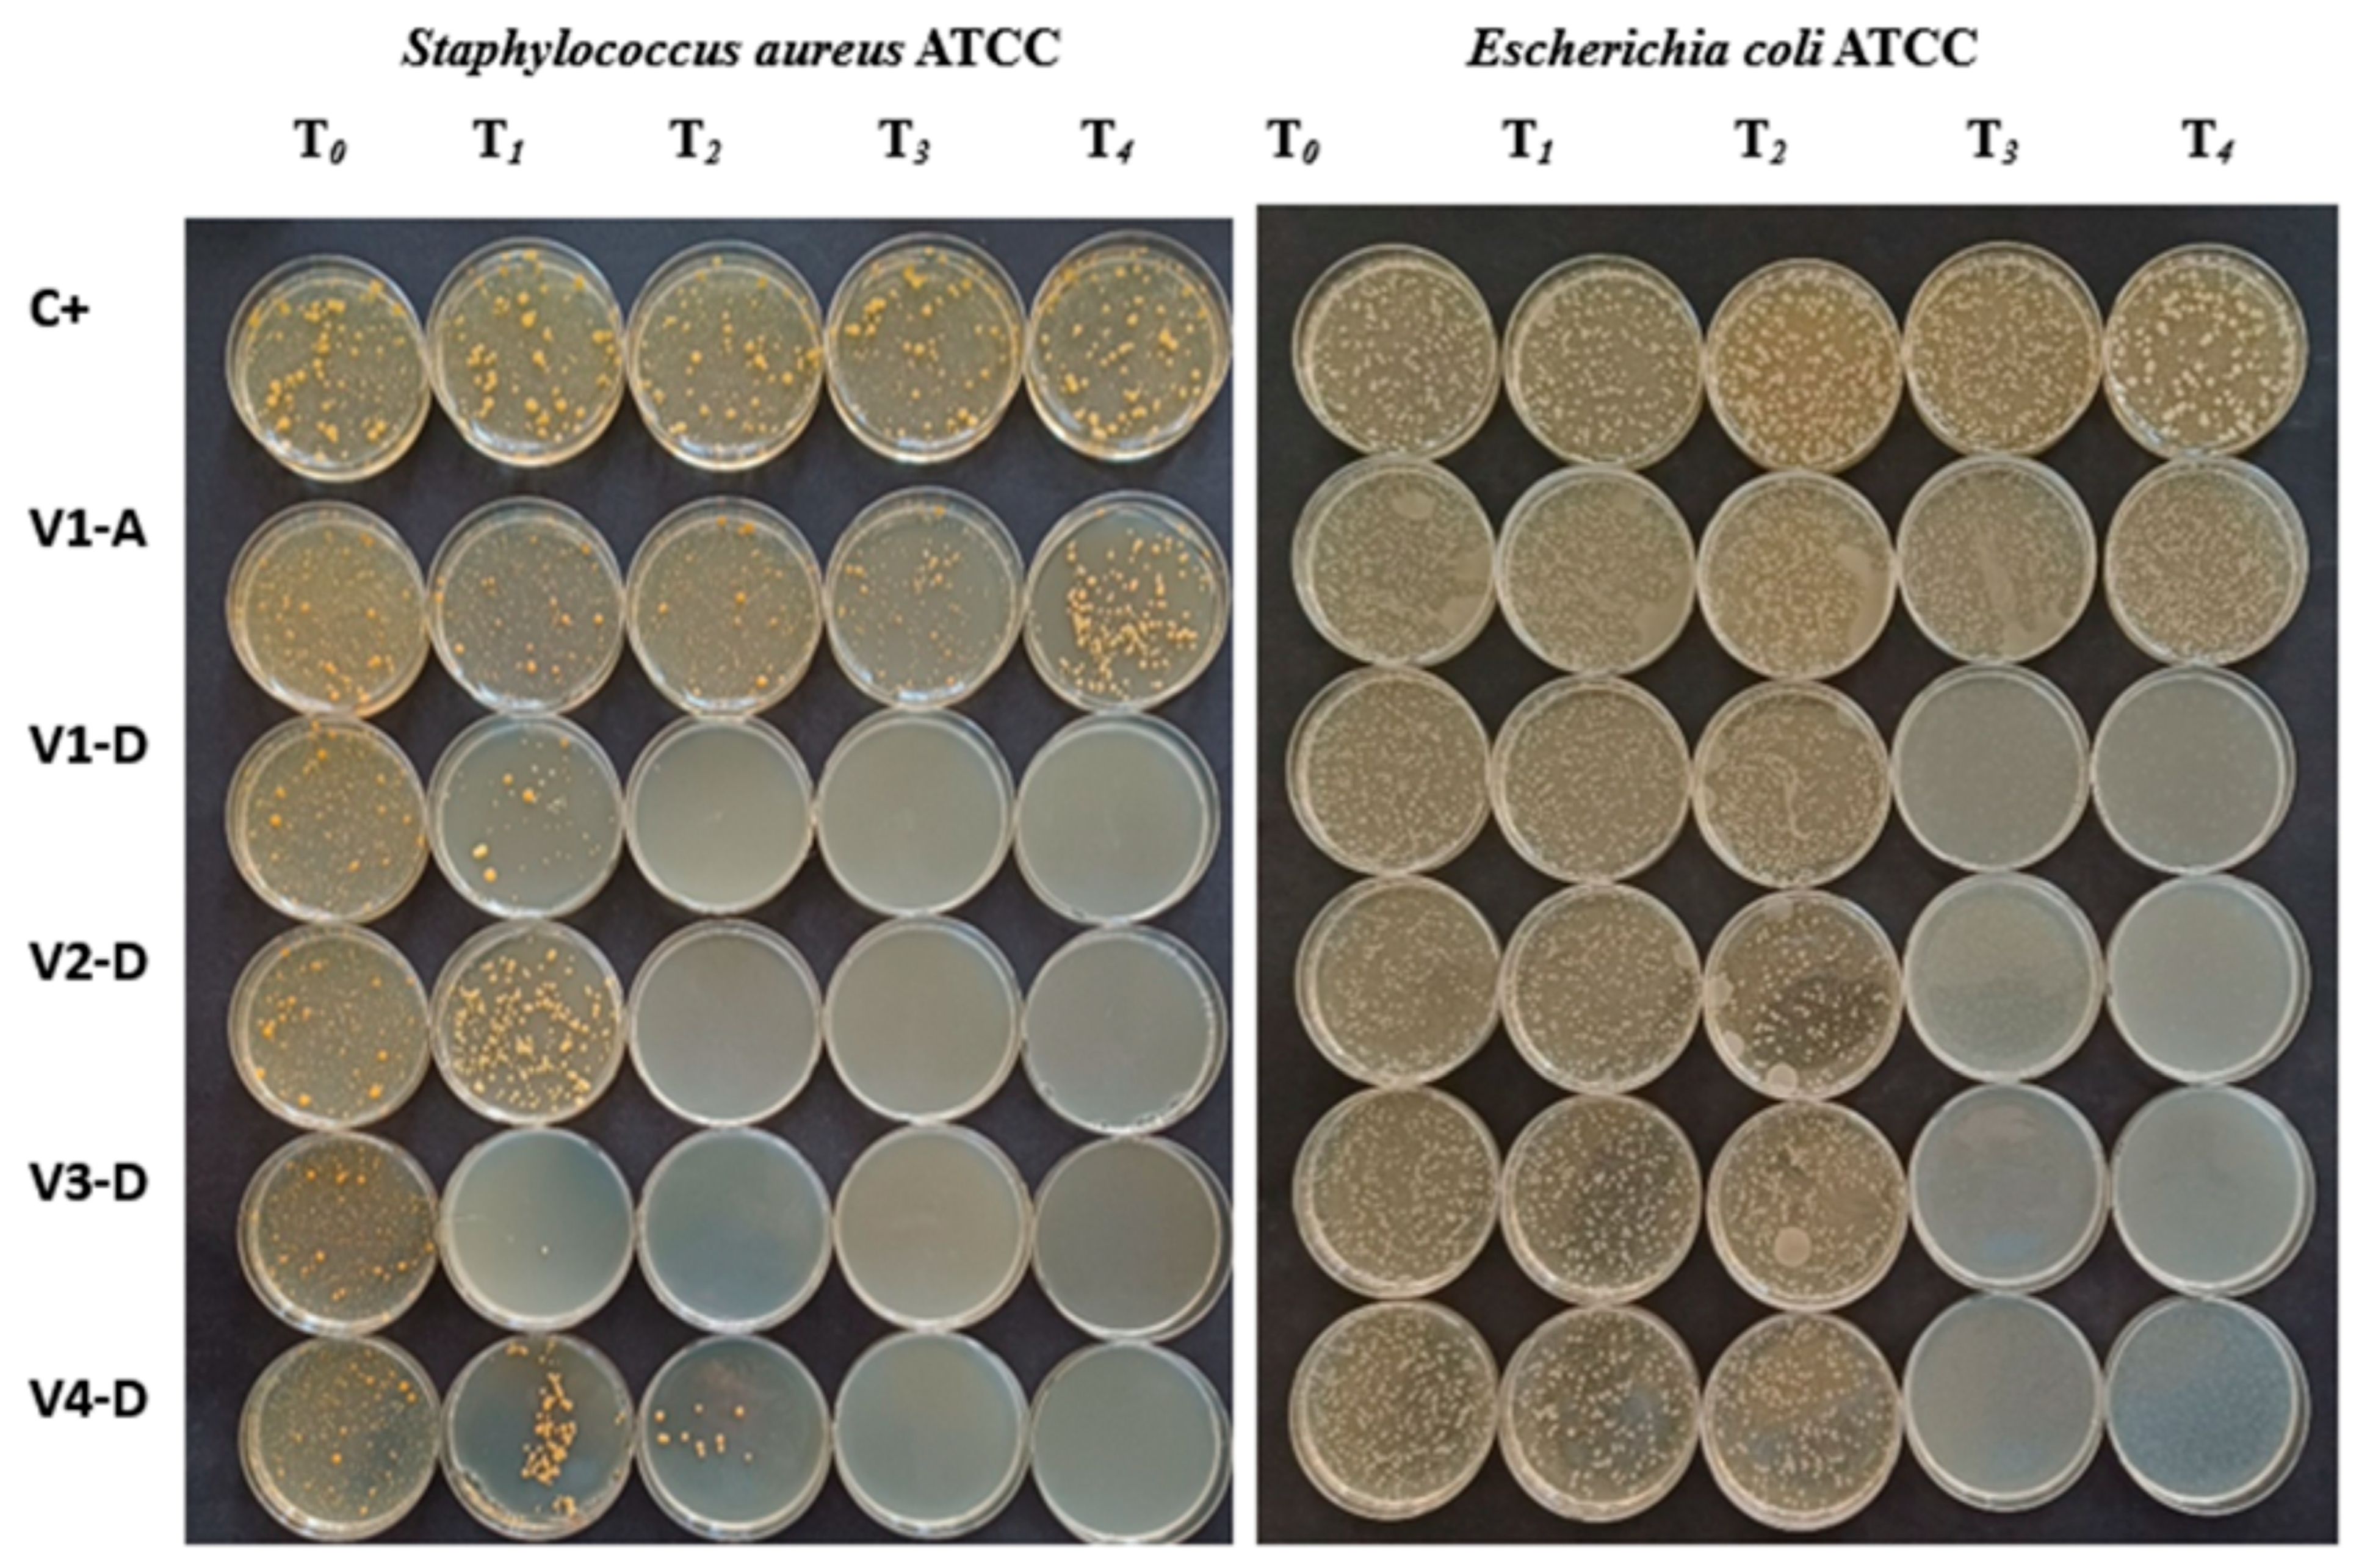
The antibacterial activity of the formulated soap samples was evaluated against the Gram-positive bacterium Staphylococcus aureus ATCC 25923 and the Gram-negative bacterium Escherichia coli ATCC 25922 using a modified Time–Kill assay adapted from the ASTM E2149 standard [52]. Changes in the viable bacterial population (log10 CFU/mL) were monitored at predefined contact times (T0, T1 = 30 s, T2 = 1 min, T3 = 2 min, and T4 = 5 min). The evolution of bacterial viability is presented in Figure 11, while the complete numerical data are provided in Tables S4 and S5.
The culture control remained essentially unchanged throughout the experiment, confirming that the observed reductions in bacterial viability resulted from the antibacterial activity of the investigated formulations rather than spontaneous bacterial inactivation (Tables S4 and S5).
Against Staphylococcus aureus, all formulations containing the encapsulated thyme EO exhibited rapid bactericidal activity. Formulation V1-D reduced the bacterial population from 6.009 log10 CFU/mL at T0 to 1.728 log10 CFU/mL after only 30 s, corresponding to a 4.281-log reduction (99.995%), while complete bacterial elimination was achieved after 1 min. Formulation V2-D showed a similar behaviour, reducing the bacterial count from 5.623 to 2.149 log10 CFU/mL after 30 s (3.474-log reduction; 99.966%) and reaching complete bacterial elimination after 1 min. Among all investigated formulations, V3-D exhibited the fastest antibacterial response, completely eliminating the bacterial population within 30 s (initial count: 5.154 log10 CFU/mL). Formulation V4-D showed a progressive antibacterial effect, decreasing from 5.549 to 1.635 log10 CFU/mL after 30 s (3.914-log reduction; 99.988%) and achieving complete bacterial elimination after 2 min. In contrast, the control formulation V1-A, prepared without the encapsulated EO system, reduced the bacterial population from 6.085 to 2.258 log10 CFU/mL after 5 min, corresponding to a 3.827-log reduction (99.985%), but did not achieve complete bacterial elimination during the investigated period (Table S4).
A different response was observed for Escherichia coli, which showed greater resistance to the investigated formulations. The control formulation V1-A exhibited only limited antibacterial activity, reducing the bacterial population from 6.130 to 5.974 log10 CFU/mL after 5 min, corresponding to a 0.156-log reduction (30.274%). In contrast, formulation V1-D reduced the bacterial count from 6.568 to 1.947 log10 CFU/mL, corresponding to a 4.619-log reduction (99.997%). Formulation V2-D exhibited the highest antibacterial activity against Escherichia coli, decreasing the bacterial population from 6.805 to 1.752 log10 CFU/mL after 5 min (5.053-log reduction; 99.999%). Formulations V3-D and V4-D also showed pronounced antibacterial activity, with final bacterial counts of 1.338 and 1.481 log10 CFU/mL, corresponding to 4.732-log (99.998%) and 4.620-log (99.997%) reductions, respectively (Table S5).
The comparison between formulations V1-A and V1-D clearly demonstrates the contribution of the thyme EO-containing inclusion system. Since both formulations were prepared using the same virgin olive and coconut oils, the markedly enhanced antibacterial activity of V1-D can be primarily attributed to the presence of thyme EO incorporated into the MCT–β-CD inclusion complex together with sorbitol and Dermowax GMS SE.
The formulations containing waste vegetable oils also exhibited pronounced antibacterial activity, although differences in bacterial inactivation kinetics were observed. Formulation V2-D, prepared with virgin coconut oil and waste olive oil, displayed antibacterial performance comparable to that of V1-D.

4. Discussion

4.1. Influence of Formulation Design on Inclusion Complex Formation and Stability

The present study demonstrates that the functional performance of the developed textile care formulations was governed primarily by formulation design rather than by encapsulation efficiency alone. Although all investigated formulations exhibited high encapsulation efficiencies (>95%), the combined FTIR, phenolphthalein and UV–Vis analyses revealed differences in the stability of the MCT–β-CD inclusion complexes, indicating that the formulation excipients influenced not only the amount of encapsulated thyme essential oil (EO) but also the organization and stability of the host–guest system.
FTIR spectroscopy confirmed the successful formation of inclusion complexes through modifications of the characteristic absorption bands associated with hydroxy groups and guest–host interactions, in agreement with previous reports describing the inclusion of essential oils into cyclodextrin cavities [25,29,30]. However, FTIR alone provides structural evidence of complex formation and does not allow discrimination between formulations exhibiting different functional stabilities.
For this reason, the qualitative phenolphthalein assay proved particularly valuable. Unlike the UV–Vis determination of encapsulation efficiency, which quantifies the proportion of EO incorporated into the cyclodextrin cavity, the phenolphthalein test provided complementary information regarding the resistance of the inclusion complexes to ethanol-induced disruption. The persistence of the characteristic magenta coloration after ethanol treatment indicated that the formulation components substantially affected inclusion complex stability. In particular, formulation V1-D exhibited the highest stability despite presenting a slightly lower encapsulation efficiency than V1-B. This observation further supports the conclusion that encapsulation efficiency alone does not fully describe the functional behaviour of cyclodextrin inclusion systems under conditions relevant to practical applications.
The quantitative UV–Vis results support this interpretation. Although formulation V1-B exhibited the highest encapsulation efficiency (98.16%), formulation V1-D showed superior stability during the qualitative phenolphthalein assay. Consequently, encapsulated EO and encapsulation efficiency should be regarded as complementary parameters rather than interchangeable indicators of formulation quality. Similar observations have been reported for cyclodextrin-based delivery systems, where the physicochemical environment surrounding the inclusion complex influences its stability, guest release behaviour and practical functionality [26,27].
It should also be considered that the encapsulation efficiency values were determined using the extraction protocol described in Section Determination of Encapsulation Efficiency (EE%). The qualitative phenolphthalein assay indicated that 96% ethanol did not induce complete dissociation of the inclusion complexes. Partial displacement of weakly bound EO cannot be excluded. Therefore, the reported encapsulation efficiency values should be interpreted within the context of the applied extraction protocol.
Taken together, these findings indicate that sorbitol and Dermowax GMS SE were associated with differences in inclusion complex formation and structural stability under simulated application conditions. Rather than maximizing encapsulation efficiency itself, the formulation strategy optimized the functional stability of the MCT–β-CD–EO system, providing the basis for the EO transfer, textile persistence and antibacterial performance.

4.2. Relationship Between Inclusion Complex Stability, Essential Oil Transfer and Textile Performance

The EO transfer experiments revealed distinct differences among the investigated formulations. Although all formulations exhibited similarly high encapsulation efficiencies (ranging from 95.58% for V1-D to 98.16% for V1-B, with V1-C and V1-E showing values of 97.89% and 97.86%, respectively), they displayed different EO transfer behaviour, indicating that encapsulation efficiency alone does not explain the amount of EO transferred to and associated with the textile substrates during washing. These observations suggest that formulation performance depends on additional factors, including inclusion complex stability and formulation composition.
The comparison between formulations V1-B and V1-D clearly illustrates this relationship. Formulation V1-B exhibited the highest encapsulation efficiency (98.16%), whereas formulation V1-D showed the lowest encapsulation efficiency (95.58%). Nevertheless, both formulations exhibited comparable initial EO transfer to the textile substrates. In contrast, formulations V1-C and V1-E, despite exhibiting encapsulation efficiencies comparable to that of V1-B, showed higher initial EO transfer. These observations indicate that encapsulation efficiency alone does not necessarily predict EO transfer during washing. Instead, the overall behaviour of the formulations appears to depend on the combined influence of encapsulation efficiency, inclusion complex stability and formulation composition. Previous studies have shown that both β-cyclodextrin inclusion complexes [66] and, more recently, microencapsulated essential oil delivery systems for textile applications [67] are strongly influenced by formulation design, which affects the controlled release and functional performance of the encapsulated bioactive compounds.
The qualitative phenolphthalein assay provides complementary information for interpreting these observations. Whereas encapsulation efficiency quantifies the amount of EO incorporated into the cyclodextrin cavity, the phenolphthalein assay reflects the relative stability of the inclusion complexes under ethanol treatment. The higher inclusion complex stability observed for formulation V1-D, despite its lower encapsulation efficiency, further supports the conclusion that encapsulation efficiency and inclusion complex stability should be considered complementary indicators of formulation performance [26,27,28,68].
The observed differences among formulations further indicate that formulation composition influenced EO transfer behaviour during washing. Although the present study was not designed to determine the individual contribution of sorbitol and Dermowax GMS SE or to elucidate the mechanisms responsible for the observed differences in EO transfer, previous studies have demonstrated that the design of cyclodextrin-based delivery systems [66] and, more recently, microencapsulated essential oil formulations for textile applications [67,69] plays an important role in the controlled release, durability and functional performance of bioactive textile finishes. Therefore, the present results provide a comparative evaluation of the investigated formulations under the experimental conditions employed in this study rather than direct evidence of the mechanisms governing EO transfer.
The persistence experiments further complement these observations. All formulations exhibited a progressive decrease in the estimated amount of EO associated with the textile substrates following the initial washing stage and the four successive rinsing stages. However, distinct persistence profiles were observed among the investigated formulations. Within the virgin oil-based formulations, V1-D combined relatively low initial EO transfer with comparatively higher EO persistence during the subsequent rinsing stages, whereas V1-C, despite exhibiting the highest initial EO transfer, showed a more pronounced decrease in the amount of EO remaining associated with the textile substrates. These findings indicate that a higher initial EO transfer does not necessarily ensure greater persistence throughout repeated rinsing. The progressive decrease in EO persistence observed during successive aqueous washing and rinsing stages is consistent with the behaviour generally reported for encapsulated essential oil delivery systems, in which repeated exposure to aqueous media gradually reduces the amount of active compound retained within the carrier matrix [69,70].
Notably, the formulations prepared with recycled waste vegetable oils (V2-D and V3-D) exhibited the highest EO persistence after completion of the washing–rinsing sequence, reaching 0.689% (0.798 mg EO/g textile) for the waste olive oil formulation and 0.615% (0.713 mg EO/g textile) for the waste coconut oil formulation. These findings suggest that the composition of the recycled lipid matrices may influence EO retention on the textile substrates. Repeated thermal use of vegetable oils is known to induce oxidation, hydrolysis and polymerization reactions, leading to the formation of free fatty acids and other polar degradation products that modify the physicochemical characteristics of the oil phase [71,72]. Such compositional changes could therefore contribute to the differences in EO persistence observed in the present study. Similar effects of oil-phase composition on the performance of lipid-based delivery systems have been reported for topical formulations, where the type of oil influenced the physicochemical properties and biological performance of nanostructured lipid carriers [73]. Although the present study was not designed to identify the molecular mechanisms responsible for the improved persistence of the recycled oil formulations, the results indicate that recycled vegetable oils represent promising carrier matrices for the development of durable and more sustainable EO-loaded textile care formulations.
Taken together, the encapsulation efficiency, inclusion complex stability, EO transfer and persistence results indicate that the overall performance of the investigated formulations depends on the combined influence of formulation composition and inclusion complex stability rather than on encapsulation efficiency alone. These complementary parameters provide a more comprehensive basis for evaluating EO-loaded textile care formulations during washing and successive rinsing. From a practical perspective, formulation V1-D exhibited the most favourable balance between inclusion complex stability, controlled EO transfer and EO persistence within the virgin oil series. Furthermore, the encouraging performance of the recycled oil formulations highlights their potential as sustainable carrier matrices for the development of multifunctional textile care products within a circular economy approach.

4.3. Functional Implications for Washing Efficiency and Antibacterial Performance

The washing experiments demonstrated that the incorporation of the MCT–β-CD inclusion complexes together with sorbitol and Dermowax GMS SE did not compromise the primary cleaning function of the formulated soaps. Despite the presence of additional functional ingredients, all formulations exhibited washing efficiencies comparable to that of the commercial reference detergent, while only moderate differences were observed in the CIELAB colour coordinates and Hidden Stain (Hs) indices. These findings indicate that the incorporation of MCT–β-CD inclusion complexes can be achieved without compromising detergent performance, an essential requirement for practical textile care applications.
The washing performance further reflected the combined influence of inclusion complex stability, EO transfer and EO persistence discussed in the previous section. Formulation V1-D, which exhibited balanced EO transfer together with satisfactory EO persistence during the successive rinsing stages, also achieved the highest washing efficiency and the lowest residual stain visibility. Similarly, formulation V1-B showed excellent washing performance despite exhibiting a different EO transfer profile. These observations indicate that optimizing formulation composition can simultaneously preserve washing efficiency and modulate EO transfer to textile substrates, demonstrating that multifunctionality does not necessarily require compromising the primary cleaning function. Comparable relationships between formulation composition, washing conditions and textile cleaning performance have been reported for detergent and textile care systems [49,62,63].
The antibacterial activity assays further demonstrated the practical significance of the developed cyclodextrin-based soap formulations. Formulations containing the complete inclusion system (MCT–β-CD, thyme EO, sorbitol and Dermowax GMS SE) produced rapid and pronounced antibacterial activity against both Staphylococcus aureus and Escherichia coli, whereas the control formulation lacking thyme EO showed only limited antimicrobial activity. These results indicate that thyme EO was the main contributor to the antibacterial activity of the soap formulations. The antibacterial activity of thyme EO is mainly attributed to its major phenolic constituents, thymol and carvacrol, which disrupt bacterial membrane integrity, increase membrane permeability and ultimately induce cell death [74].
The greater susceptibility of Staphylococcus aureus compared with Escherichia coli agrees with the well-established differences between Gram-positive and Gram-negative bacteria. The outer lipopolysaccharide membrane of Gram-negative bacteria represents an additional permeability barrier that limits the penetration of hydrophobic antimicrobial compounds, whereas Gram-positive bacteria are generally more susceptible to phenolic constituents such as thymol and carvacrol [24,44,75]. The rapid bacterial reductions achieved in the present study are consistent with the antimicrobial mechanisms of thyme essential oil described in previous investigations [31,32,65].
Although formulations prepared using partially substituted waste vegetable oils exhibited slight differences in bacterial inactivation kinetics, their antibacterial performance remained comparable to that of the corresponding virgin oil-based formulations. These minor differences may reflect changes in the physicochemical properties of the soap matrix associated with the use of thermally processed vegetable oils, which may have influenced the antibacterial activity of the soap formulations [73]. Nevertheless, the observed antibacterial efficacy remained high, indicating that partial substitution with waste vegetable oils did not compromise the antimicrobial functionality of the developed soap formulations. These findings support the feasibility of incorporating sustainably sourced raw materials into multifunctional textile care products without sacrificing biological performance.
Overall, the combined results indicate that the proposed formulation strategy successfully integrates high washing efficiency with effective EO transfer and persistence on textile substrates, while the soap formulations exhibited pronounced antibacterial activity. Together with the enhanced stability of the MCT–β-CD inclusion complexes discussed in the previous sections, these findings highlight the combined influence of formulation composition and inclusion complex stability in governing the performance of sustainable multifunctional textile care products.

4.4. Sustainable Formulation Strategy Based on Virgin and Waste Vegetable Oils

One of the most relevant outcomes of the present study is the finding that waste vegetable oils can be successfully incorporated into multifunctional textile care formulations without substantially affecting their functional performance. The physicochemical characterization of the waste oils confirmed that, despite the compositional changes associated with previous thermal processing, their quality remained suitable for soap production. The measured saponification and iodine values were within or close to the reference ranges reported by the Codex Alimentarius, indicating that the waste oils retained physicochemical characteristics compatible with efficient saponification and soap formulation.
The experimental results further demonstrated that the incorporation of waste vegetable oils did not markedly influence the overall quality of the formulated soaps. Although slight differences were observed in some physicochemical parameters, washing performance and antibacterial activity, the waste oil-based formulations remained comparable to those prepared exclusively from virgin oils. In particular, formulation V4-B exhibited the best washing performance among the waste oil-based formulations, whereas formulations V2-D and V3-D maintained higher EO persistence during the successive rinsing stages following washing. These observations indicate that replacing virgin oils with waste vegetable oils does not necessarily reduce the functional properties of the final product when an appropriate formulation strategy is adopted.
The present results agree with previous studies highlighting the potential of waste cooking oils for use as renewable raw materials for soap production and other value-added applications [6,7,8,72]. However, most previous studies have focused primarily on soap manufacture, waste oil valorisation or basic physicochemical characterization. In contrast, the present work extends these approaches by demonstrating that waste vegetable oils can be successfully integrated into multifunctional textile care formulations incorporating cyclodextrin inclusion complexes, effective EO transfer and persistence, high washing efficiency and pronounced antibacterial activity.
From a sustainability perspective, the proposed formulation strategy contributes simultaneously to waste valorisation and the development of environmentally friendly textile care products. The combination of renewable raw materials, biodegradable formulation components and cyclodextrin-based encapsulation of naturally derived antimicrobial compounds is consistent with current efforts to promote circular bioeconomy principles and reduce the environmental impact associated with conventional detergent formulations [1,2,3].
Overall, these findings indicate that the functional performance of sustainable textile care products depends not only on the selection of environmentally friendly raw materials but also on an integrated formulation approach capable of combining encapsulation technology, effective EO transfer, EO persistence, efficient washing performance and antibacterial functionality within a multifunctional system.

5. Conclusions

This study shows that the overall performance of the developed sustainable textile care formulations depends on the combined influence of formulation composition and inclusion complex stability rather than on encapsulation efficiency alone. Although all investigated formulations exhibited high encapsulation efficiencies (95.58–98.16%), differences in formulation composition markedly influenced essential oil transfer, EO persistence after rinsing (rinsing fastness), washing performance and antibacterial activity.
All formulations exhibited appropriate physicochemical characteristics and washing performances comparable to those of the reference detergent. The MCT–β-cyclodextrin inclusion system, combined with the investigated formulation compositions, enabled effective EO transfer and persistence on textile substrates while maintaining high washing efficiency. The developed soap formulations also exhibited pronounced antibacterial activity against Staphylococcus aureus and Escherichia coli. Among the investigated formulations, V1-D exhibited the most favourable balance between effective EO transfer, satisfactory persistence on textile substrates, and high washing efficiency, while the corresponding soap formulation showed rapid antibacterial activity against both Staphylococcus aureus and Escherichia coli.
An important outcome of this work is that soap formulations prepared from waste vegetable oils achieved functional performances comparable to those prepared from virgin oils and exhibited higher EO persistence on textile substrates following the washing–rinsing sequence. Despite minor differences in physicochemical properties, the waste oil formulations maintained good washing efficiency and exhibited higher EO persistence after the completion of the washing–rinsing sequence (reaching 0.798 mg EO/g textile for the waste olive oil formulation and 0.713 mg EO/g textile for the waste coconut oil formulation), and the corresponding soap formulations retained strong antibacterial activity. These findings support the suitability of waste vegetable oils as renewable raw materials for the development of sustainable functional textile care formulations.
Overall, these findings indicate that the performance of sustainable multifunctional textile care formulations depends on the combined influence of formulation composition and inclusion complex stability rather than by encapsulation efficiency alone. The proposed formulation strategy provides an effective approach for valorising waste vegetable oils while supporting the development of environmentally friendly textile care products that combine high washing efficiency, effective EO transfer and persistence on textile substrates, and antibacterial functionality within a circular bioeconomy framework.

Supplementary Materials

The following supporting information can be downloaded at https://www.mdpi.com/article/10.3390/textiles6030094/s1. Section S1. The main work steps for determining the antibacterial effect (Figure S1. The main work steps for determining the antibacterial effect); Section S2. Calculation relationships used in the article (Table S1. Calculation relationships for encapsulation efficiency (EE%), estimated EO transfer to textile substrates, and EO persistence on textile substrates during an initial washing stage followed by four successive rinsing stages); Section S3. FTIR analysis of additives (Table S2. FTIR fingerprints of additives in laundry soaps); Section S4. Qualitative assessment of inclusion complex behaviour using phenolphthalein (Table S3. Qualitative assessment of inclusion complex behaviour using phenolphthalein); Section S5. Antibacterial activity results (S. Aureus and E. coli) (Table S4. Antibacterial activity results (S. aureus); Table S5. Antibacterial activity results (E. coli)).

Author Contributions

V.-G.S.: Writing—review & editing, Writing—original draft, Conceptualization, Methodology, Investigation, Formal analysis, Data curation, Visualization. V.P.: Writing—review & editing, Writing—original draft, Conceptualization, Methodology, Investigation, Formal analysis, Data curation, Validation, Supervision, Visualization. C.M.R.: Investigation, Data curation, Visualization. G.P.: Software, Methodology, Investigation, Data curation, Validation, Visualization. V.V.: Methodology, Investigation, Data curation, Visualization. A.P.: Software, Methodology, Investigation, Data curation, Visualization. M.M.P.-B.: Methodology, Investigation, Formal analysis, Data curation, Visualization. M.P.: Methodology, Investigation, Formal analysis, Data curation, Visualization. All authors have read and agreed to the published version of the manuscript.

Funding

This research was funded by the Doctoral School of the “Gheorghe Asachi” Technical University of Iasi, Romania, based on M.E.C order No. 7048/22.12.2025 valid for doctoral research starting in 2026.

Data Availability Statement

The data that support the findings of this study are available from the corresponding author upon reasonable request.

Acknowledgments

The authors acknowledge the logistic support offered by the Centre for Research and Innovation in Textiles and Fashion Industry—SMART-Tex-IS, Iasi, Romania.

Conflicts of Interest

The authors declare no conflicts of interest.

References

  1. Giagnorio, M.; Amelio, A.; Grüttner, H.; Tiraferri, A. Environmental impacts of detergents and benefits of their recovery in the laundering industry. J. Clean. Prod. 2017, 154, 593–601. [Google Scholar] [CrossRef] [Scilit]
  2. Villota-Paz, J.M.; Osorio-Tejada, J.L.; Morales-Pinzón, T. Comparative life cycle assessment for the manufacture of bio-detergents. Environ. Sci. Pollut. Res. 2023, 30, 34243–34254. [Google Scholar] [CrossRef] [Scilit] [PubMed]
  3. Pareek, C.; Nirwan, N.; Pareek, G. Chemistry of detergents and their impact on environment. Int. J. Innov. Res. Sci. Eng. Technol. 2014, 3, 17116–17122. [Google Scholar] [CrossRef]
  4. Kogawa, A.C.; Cernic, B.G.; Domingos do Couto, L.G.; Salgado, H.R.N. Synthetic detergents: 100 years of history. Saudi Pharm. J. 2017, 25, 934–938. [Google Scholar] [CrossRef] [Scilit] [PubMed]
  5. Warwick, C.; Guerreiro, A.; Soares, A. Sensing and analysis of soluble phosphates in environmental samples: A review. Biosens. Bioelectron. 2013, 41, 1–11. [Google Scholar] [CrossRef] [Scilit] [PubMed]
  6. Azme, S.N.K.; Yusoff, N.S.I.M.; Chin, L.Y.; Mohd, Y.; Hamid, R.D.; Jalil, M.N.; Zaki, H.M.; Saleh, S.H.; Ahmat, N.; Manan, M.A.F.A.; et al. Recycling waste cooking oil into soap: Knowledge transfer through community service learning. Clean. Waste Syst. 2023, 4, 100084. [Google Scholar] [CrossRef] [Scilit]
  7. Cheng, G.; Zhang, M.; Lu, Y.; Zhang, Y.; Lin, B.; Lau, E.V. Novel method for the green utilization of waste fried oil. Particuology 2024, 84, 1–11. [Google Scholar] [CrossRef] [Scilit]
  8. Foo, W.H.; Koay, S.S.N.; Chia, S.R.; Chia, W.Y.; Tang, D.Y.Y.; Nomanbhay, S.; Chew, K.W. Waste cooking oil into value-added products: A review. Fuel 2022, 324, 124539. [Google Scholar] [CrossRef] [Scilit]
  9. Miron, V.G.; Mancași, N.V.; Popescu, V.; Popescu, A. Physico-Chemical Characteristics of Some Ecological Products Used for Textile Care. Bull. Polytech. Inst. Iași Sect. Chem. Chem. Eng. 2025, 71, 101–112. [Google Scholar] [CrossRef]
  10. Hubbe, M.A.; Koukoulas, A.A.; Rojas, O.J.; Lucia, L.A. Detergency Mechanisms and Cellulosic Surfaces. BioResources 2022, 17, 5833–5911. [Google Scholar] [CrossRef] [Scilit]
  11. Yousuf, M.A.B.; Yousuf, A.H.B. Textile Washing Process and Its Impacts. Int. J. Text. Sci. 2023, 12, 15–21. [Google Scholar] [CrossRef]
  12. Cesa, F.S.; Turra, A.; Checon, H.H.; Leonardi, B.; Baruque-Ramos, J. Laundering and textile parameters influence fibers release in household washings. Environ. Pollut. 2020, 257, 113553. [Google Scholar] [CrossRef] [Scilit] [PubMed]
  13. Mahar, K.S.; Rana, T.S.; Ranade, S.A. Molecular analyses of genetic variability in soap nut (Sapindus mukorossi Gaertn.). Ind. Crops Prod. 2011, 34, 1111–1118. [Google Scholar] [CrossRef] [Scilit]
  14. Thevamirtha, C.; Balasubramaniyam, A.; Srithayalan, S.; Selvakumar, P.M. An insight into the antioxidant activity of the facial cream, solid soap and liquid soap made using the carotenoid extract of palmyrah (Borassus flabellifer) fruit pulp. Ind. Crops Prod. 2023, 195, 116413. [Google Scholar] [CrossRef] [Scilit]
  15. Sisodiya, S.; Gautam, S.; Aneja, D.; Debnath, M. Exploring the usage of olive leaf and green synthesized olive leaf metallic nanoparticles as soap supplement for the formulation and optimization of innovative germicidal herbal soap. Ind. Crops Prod. 2024, 219, 119012. [Google Scholar] [CrossRef] [Scilit]
  16. Anbalagan, S.; Mani, M. Design and characterization of eco-friendly feminine hygiene sanitary napkins from pineapple leaf fiber (PALF) for a sustainable environment. Ind. Crops Prod. 2024, 219, 119031. [Google Scholar] [CrossRef] [Scilit]
  17. Dorman, H.J.D.; Deans, S.G. Antimicrobial agents from plants: Antibacterial activity of plant volatile oils. J. Appl. Microbiol. 2000, 88, 308–316. [Google Scholar] [CrossRef] [Scilit] [PubMed]
  18. Imelouane, B.; Amhamdi, H.; Wathelet, J.P.; Ankit, M.; Khedid, K.; El Bachiri, A. Chemical composition and antimicrobial activity of essential oil of thyme (Thymus vulgaris) from Eastern Morocco. Int. J. Agric. Biol. 2009, 11, 205–208. Available online: https://api.fspublishers.org/viewPaper/32863.pdf (accessed on 15 April 2026).
  19. Lusiak, P.; Różyło, R.; Mazur, J.; Sobczak, S.; Matwijczuk, A. Evaluation of physical parameters and spectral characterization of the quality of soaps containing by-products from the food industry. Sci. Rep. 2024, 14, 4687. [Google Scholar] [CrossRef] [Scilit] [PubMed]
  20. Stănescu, V.G.; Popescu, V.; Vasilache, V.; Popescu, G.; Rîmbu, C.M.; Popescu, A. Cleaner processes for making laundry soap from vegetable oils and an essential oil. Appl. Sci. 2025, 15, 3821. [Google Scholar] [CrossRef] [Scilit]
  21. Rahaman, M.T.; Moshwan, M.M. Sustainable Textile Functionalization Using Biodegradable Essential Oils: A Review of Sources, Applications, and Innovations. Hybrid Adv. 2026, 12, 100581. [Google Scholar] [CrossRef] [Scilit]
  22. Li, S.; Lewis, J.E.; Stewart, N.M.; Qian, L.; Boyter, H. Effect of Finishing Methods on Washing Durability of Microencapsulated Aroma Finishing. J. Text. Inst. 2008, 99, 177–183. [Google Scholar] [CrossRef] [Scilit]
  23. Orasugh, J.T.; Temane, L.T.; Pillai, S.K.; Ray, S.S. Advancements in Antimicrobial Textiles: Fabrication, Mechanisms of Action, and Applications. ACS Omega 2025, 10, 12772–12816. [Google Scholar] [CrossRef] [Scilit] [PubMed]
  24. Bakkali, F.; Averbeck, S.; Averbeck, D.; Idaomar, M. Biological effects of essential oils—A review. Food Chem. Toxicol. 2008, 46, 446–475. [Google Scholar] [CrossRef] [Scilit] [PubMed]
  25. Crini, G. Review: A history of cyclodextrins. Chem. Rev. 2014, 114, 10940–10975. [Google Scholar] [CrossRef] [Scilit] [PubMed]
  26. Loftsson, T.; Duchêne, D. Cyclodextrins and pharmaceutical applications. Int. J. Pharm. 2007, 329, 1–11. [Google Scholar] [CrossRef] [Scilit] [PubMed]
  27. Loftsson, T.; Brewster, M.E. Pharmaceutical applications of cyclodextrins: Basic science and product development. J. Pharm. Pharmacol. 2010, 62, 1607–1621. [Google Scholar] [CrossRef] [Scilit] [PubMed]
  28. Marques, C.S.; Carvalho, S.G.; Bertoli, L.D.; Villanova, J.C.O.; Pinheiro, P.F.; Dos Santos, D.C.M.; Yoshida, M.I.; Freitas, J.C.C.; Cipriano, D.F.; Bernardes, P.C. β-Cyclodextrin inclusion complexes with essential oils: Obtention, characterization, antimicrobial activity and potential application for food preservative sachets. Food Res. Int. 2019, 119, 499–509. [Google Scholar] [CrossRef] [Scilit] [PubMed]
  29. Ming, L.; Xiao, Z.; Nie, Z.; Xiao, N.; Wu, H.; Yang, S.; Tu, Y.; Zhong, H.; Liu, H.; Li, Z. Encapsulation of essential oil in cyclodextrin: An exploration of rational design, molecular interactions, and activity assessment. Ind. Crops Prod. 2025, 226, 120611. [Google Scholar] [CrossRef] [Scilit]
  30. Marques, H.M.C. A review on cyclodextrin encapsulation of essential oils and volatiles. Flavour Fragr. J. 2010, 25, 313–326. [Google Scholar] [CrossRef] [Scilit]
  31. Kon, K.; Rai, M. Antibacterial activity of Thymus vulgaris oil. Nusant. Biosci. 2012, 4, 50–56. [Google Scholar] [CrossRef] [Scilit]
  32. Soković, M.; Glamočlija, J.; Marin, P.D.; Brkić, D.; van Griensven, L.J.L.D. Antibacterial effects of the essential oils of commonly consumed medicinal herbs using an in vitro model. Molecules 2010, 15, 7532–7546. [Google Scholar] [CrossRef] [Scilit] [PubMed]
  33. Sagitani, H.; Komoriya, M. Stability conditions and mechanism of cream soaps: Effect of polyols. J. Oleo Sci. 2015, 64, 809–816. [Google Scholar] [CrossRef] [Scilit] [PubMed]
  34. AATCC. AATCC 1993 Standard Reference Detergent (WOB, Without Optical Brightener); American Association of Textile Chemists and Colorists: Research Triangle Park, NC, USA; Available online: https://www.aatcc.org/testing/standard-laundering/ (accessed on 26 April 2026).
  35. American Type Culture Collection (ATCC). Staphylococcus aureus ATCC 25923. Available online: https://www.atcc.org (accessed on 15 April 2025).
  36. American Type Culture Collection (ATCC). Escherichia coli ATCC 25922. Available online: https://www.atcc.org (accessed on 15 April 2025).
  37. AOCS. Official Methods and Recommended Practices of the American Oil Chemists’ Society; AOCS Press: Champaign, IL, USA, 1993. [Google Scholar]
  38. Odoom, W.; Edusei, V.O. Evaluation of saponification value, iodine value and insoluble impurities in coconut oils from Jomoro District in the Western Region of Ghana. Asian J. Agric. Food Sci. 2015, 3, 494–499. Available online: https://ajouronline.com/index.php/AJAFS/article/view/2938 (accessed on 15 April 2026).
  39. Rambabu, K.; Edathil, A.A.; Nirmala, G.S.; Hasan, S.H.; Yousef, A.F.; Show, P.L.; Banat, F. Date-fruit syrup waste extract as a natural additive for soap production with enhanced antioxidant and antibacterial activity. Environ. Technol. Innov. 2020, 20, 101153. [Google Scholar] [CrossRef] [Scilit]
  40. Chebet, J.; Kinyanjui, T.; Cheplogoi, P.K. Impact of frying on iodine value of vegetable oils before and after deep frying in different types of food in Kenya. J. Sci. Innov. Res. 2016, 5, 193–196. [Google Scholar] [CrossRef] [Scilit]
  41. Coates, J. Interpretation of Infrared Spectra: A Practical Approach. In Encyclopedia of Analytical Chemistry; Meyers, R.A., Ed.; John Wiley & Sons: Chichester, UK, 2000; Volume 12, pp. 10815–10837. [Google Scholar] [CrossRef] [Scilit]
  42. Stuart, B.H. Infrared Spectroscopy: Fundamentals and Applications; John Wiley & Sons Ltd.: Chichester, UK, 2005; p. 379. [Google Scholar] [CrossRef] [Scilit]
  43. Skoog, D.A.; Holler, F.J.; Crouch, S.R. Principles of Instrumental Analysis. In Applications of Ultraviolet–Visible Molecular Absorption Spectrometry, 7th ed.; Cengage Learning: Boston, MA, USA, 2018; Chapter 14; pp. 304–310. [Google Scholar]
  44. Burt, S. Essential oils: Their antibacterial properties and potential applications in foods—A review. Int. J. Food Microbiol. 2004, 94, 223–253. [Google Scholar] [CrossRef] [Scilit] [PubMed]
  45. Harris, D.C. Quantitative Chemical Analysis, 10th ed.; W.H. Freeman and Company: New York, NY, USA, 2020. [Google Scholar]
  46. Del Valle, E.M.M. Cyclodextrins and their uses: A review. Process Biochem. 2004, 39, 1033–1046. [Google Scholar] [CrossRef] [Scilit]
  47. Khanna, S.; Chakraborty, J.N. Optimization of monochlorotriazine β-cyclodextrin grafting on cotton and assessment of release behavior of essential oils from functionalized fabric. Fash. Text. 2017, 4, 6. [Google Scholar] [CrossRef] [Scilit]
  48. ISO 6330:2021; Textiles—Domestic Washing and Drying Procedures for Textile Testing. International Organization for Standardization: Geneva, Switzerland, 2021. Available online: https://www.iso.org/standard/75934.html (accessed on 26 April 2026).
  49. Kalak, T.; Cierpiszewski, R. Correlation analysis between particulate soil removal and surface properties of laundry detergent solutions. Text. Res. J. 2015, 85, 1884–1906. [Google Scholar] [CrossRef] [Scilit]
  50. AATCC Test Method 130-2000; Soil Release Test; American Association of Textile Chemists and Colorists: Research Triangle Park, NC, USA, 2000.
  51. CIE 015:2018; Colorimetry, 4th ed. Commission Internationale de l’Éclairage (CIE): Vienna, Austria, 2018. Available online: https://www.physicsnorm.com/NewSamples/CIE/145577175/CIE-015-2018-1.pdf (accessed on 16 April 2026).
  52. ASTM E2149-25; Standard Test Method for Determining the Antimicrobial Activity of Antimicrobial Agents Under Dynamic Contact Conditions. ASTM International: West Conshohocken, PA, USA, 2025. Available online: https://store.astm.org/e2149-25.html (accessed on 17 April 2026).
  53. Socrates, G. Infrared and Raman Characteristic Group Frequencies: Tables and Charts, 3rd ed.; John Wiley & Sons: Chichester, UK, 2001; p. 347. [Google Scholar]
  54. Silverstein, R.M.; Bassler, G.C.; Morrill, T.C. Spectrometric Identification of Organic Compounds. In Infrared Spectrometry, 5th ed.; John Wiley & Sons: New York, NY, USA, 1991; Chapter 3; pp. 71–143. [Google Scholar]
  55. CODEX Alimentarius. Standard for Olive Oils and Olive-Pomace Oils (CXS 33-1981, Revised 2024 FAO/WHO. 2024. Available online: https://www.fao.org/fao-who-codexalimentarius/sh-proxy/en/?lnk=1&url=https%253A%252F%252Fworkspace.fao.org%252Fsites%252Fcodex%252FStandards%252FCXS%2B33-1981%252FCXS_033e.pdf (accessed on 17 April 2026).
  56. CODEX Alimentarius. Standard for Named Vegetable Oils (CXS 210-1999), Revised 2024; FAO/WHO: Rome, Italy, 2024; Available online: https://www.fao.org/fao-who-codexalimentarius/sh-proxy/tr/?lnk=1&url=https%253A%252F%252Fworkspace.fao.org%252Fsites%252Fcodex%252FStandards%252FCXS%2B210-1999%252FCXS_210e.pdf (accessed on 17 April 2026).
  57. Mwanza, K.; Zombe, K. Comparative evaluation of some physicochemical properties on selected commercially available soaps on the Zambian market. OALib J. 2020, 7, e06147. [Google Scholar] [CrossRef]
  58. Warra, A.A. A report on soap in Nigeria using indigenous technology and raw materials. Afr. J. Pure Appl. Chem. 2013, 7, 139–145. [Google Scholar] [CrossRef] [Scilit]
  59. Mehta, S.; MacGillivray, M. Aromatherapy in Textiles: A systematic review of studies examining textiles as a potential carrier for the therapeutic effects of essential oils. Textiles 2022, 2, 29–49. [Google Scholar] [CrossRef] [Scilit]
  60. Klinkhammer, K.; Hohenbild, H.; Hoque, M.T.; Elze, L.; Teshay, H.; Mahltig, B. Functionalization of technical textiles with chitosan. Textiles 2024, 4, 70–90. [Google Scholar] [CrossRef] [Scilit]
  61. Šantak, V.; Pušić, T. Cotton knitwear as a carrier of specific stains for evaluation of temperature-specific behavior of detergents. Textiles 2025, 5, 50. [Google Scholar] [CrossRef] [Scilit]
  62. Zhao, X.; Xiong, M.; Jiang, L.; Yang, Q.; Zhou, C.; Liu, J. The effect of washing parameters on the quantity of dye discharge from clothes. Fash. Text. 2022, 9, 13. [Google Scholar] [CrossRef] [Scilit]
  63. Lee, S.; Park, S. Washing conditions for smart fabrics. RSC Adv. 2024, 14, 40098–40116. [Google Scholar] [CrossRef] [Scilit] [PubMed]
  64. Tonello, N.V.; D’Eramo, F.; Marioli, J.M.; Crevillen, A.G.; Escarpa, A. Extraction-free colorimetric determination of thymol and carvacrol isomers in essential oils by pH-dependent formation of gold nanoparticles. Microchim. Acta 2018, 185, 352. [Google Scholar] [CrossRef] [Scilit] [PubMed]
  65. Borugă, O.; Jianu, C.; Mişcă, C.; Goleț, I.; Gruia, A.T.; Horhat, F.G. Thymus vulgaris essential oil: Chemical composition and antimicrobial activity. J. Med. Life 2014, 7, 56–60. [Google Scholar] [PubMed]
  66. Lis, M.J.; García Carmona, Ó.; García Carmona, C.; Maestá Bezerra, F. Inclusion Complexes of Citronella Oil with β-Cyclodextrin for Controlled Release in Biofunctional Textiles. Polymers 2018, 10, 1324. [Google Scholar] [CrossRef] [Scilit] [PubMed]
  67. Cota, P.; Marqués, L.; Mijas, G.; Lezeck, H.; Saxena, S.; Mujal, R.; Lis, M.J.; Martí, M. Microencapsulation of Cinnamon Oil for Controlled Release in Textile Fabrics. Textiles 2026, 6, 90. [Google Scholar] [CrossRef] [Scilit]
  68. de Melo, M.O.; Maia Campos, P.M.B.G. Application of biophysical techniques to evaluate cosmetic formulations. Int. J. Cosmet. Sci. 2019, 41, 579–584. [Google Scholar] [CrossRef] [Scilit] [PubMed]
  69. Sharma, S.; Mulrey, L.; Byrne, M.; Jaiswal, A.K.; Jaiswal, S. Encapsulation of essential oils in nanocarriers for active food packaging. Foods 2022, 11, 2337. [Google Scholar] [CrossRef] [Scilit] [PubMed]
  70. Sousa, V.I.; Parente, J.F.; Marques, J.F.; Forte, M.A.; Tavares, C.J. Microencapsulation of essential oils: A review. Polymers 2022, 14, 1730. [Google Scholar] [CrossRef] [Scilit] [PubMed]
  71. Maotsela, T.; Danha, G.; Muzenda, E. Utilization of waste cooking oil and tallow for production of toilet “bath” soap. Procedia Manuf. 2019, 35, 541–545. [Google Scholar] [CrossRef] [Scilit]
  72. Chhetri, A.B.; Watts, K.C.; Islam, M.R. Waste cooking oil as an alternate feedstock for biodiesel production. Energies 2008, 1, 3–18. [Google Scholar] [CrossRef] [Scilit]
  73. de Barros, D.P.C.; Reed, P.; Alves, M.; Santos, R.; Oliva, A. Biocompatibility and antimicrobial activity of nanostructured lipid carriers for topical applications are affected by type of oils used in their composition. Pharmaceutics 2021, 13, 1950. [Google Scholar] [CrossRef] [Scilit] [PubMed]
  74. Serbezeanu, D.; Bargan, A.; Homocianu, M.; Aflori, M.; Rîmbu, C.M.; Enache, A.A.; Vlad-Bubulac, T. Electrospun polyvinyl alcohol loaded with phytotherapeutic agents for wound healing applications. Nanomaterials 2021, 11, 3336. [Google Scholar] [CrossRef] [Scilit] [PubMed]
  75. Lambert, P.A. Cellular impermeability and uptake of biocides and antibiotics in Gram-positive bacteria and mycobacteria. J. Appl. Microbiol. 2002, 92, 46S–54S. [Google Scholar] [CrossRef] [Scilit]
Figure 1. FTIR spectra of the soaps from the V1 series.
Textiles 06 00094 g001
Figure 2. FTIR spectra of the soaps from the V4 series.
Textiles 06 00094 g002
Figure 3. UV–Vis analysis results: (a) absorption spectra of thyme EO at different concentrations in 96% ethanol; (b) calibration curve of thyme EO in 96% ethanol.
Textiles 06 00094 g003
Figure 4. Colour variation in the encapsulation complexes after phase 1 of the test using 1% phenolphthalein (a) and after phase 2 of the test (1 mL phenolphthalein solution + 1 mL of 96% ethanol) (b): (1) V1C without EO; (2) V1-C; (3) V1-B without EO; (4) V1-B; (5) V1-D without EO; (6) V1-D; (7) V1-E without EO; (8) V1-E.
Textiles 06 00094 g004
Figure 5. UV–Vis absorption curves for the determination of free EO at 275 nm.
Textiles 06 00094 g005
Figure 6. Free EO, encapsulated EO and encapsulation efficiency (EE%) of the investigated formulations.
Textiles 06 00094 g006
Figure 7. pH values and foaming capacity of the formulated soaps.
Textiles 06 00094 g007
Figure 8. Estimated EO transfer to the cotton textile substrate during washing as a function of washing time.
Textiles 06 00094 g008
Figure 9. EO persistence (%) on textile substrates (a) and estimated total amount of EO associated with the textile substrates (b) during an initial washing stage followed by four successive rinsing stages.
Textiles 06 00094 g009
Figure 10. EO persistence (%) on textile substrates (a) and estimated total amount of EO associated with the textile substrates (b) for D-series formulations containing identical inclusion complexes but different vegetable oil compositions during an initial washing stage followed by four successive rinsing stages.
Textiles 06 00094 g010
Figure 11. Visual representation of changes in the viable bacterial counts of Staphylococcus aureus and Escherichia coli following contact with the soap formulations V1-A, V1-D, V2-D, V3-D, and V4-D. The corresponding quantitative results, expressed as Mean CFU/mL ± SD and log10 CFU/mL ± SD, are presented in Tables S4 and S5.
Textiles 06 00094 g011
Table 1. Experimental design of natural laundry soap formulations.
CodeCoconut Oil
(g)
Olive Oil
(g)
Stearic Acid
(g)
Potassium Alum
(g)
MCT–β-CD
(g)
Thyme Essential Oil (g)Sorbitol (g)Dermowax GMS SE
(g)
NaOH (g)Water (g)
V1-07.0015.000000003.518.93
V1-A7.0015.001.500.5000003.518.93
V1-C7.0015.001.500.501.000.73003.518.93
V1-B7.0015.001.500.501.000.730.6003.518.93
V1-E7.0015.001.500.501.000.7300.033.518.93
V1-D7.0015.001.500.501.000.730.600.033.518.93
V2-07.0015.00 (waste)0000003.518.93
V2-A7.0015.00 (waste)1.500.5000003.518.93
V2-C7.0015.00 (waste)1.500.501.000.73003.518.93
V2-B7.0015.00 (waste)1.500.501.000.730.6003.518.93
V2-E7.0015.00 (waste)1.500.501.000.7300.033.518.93
V2-D7.0015.00 (waste)1.500.501.000.730.600.033.518.93
V3-07.00 (waste)15.000000003.518.93
V3-A7.00 (waste)15.001.500.5000003.518.93
V3-C7.00 (waste)15.001.500.501.000.73003.518.93
V3-B7.00 (waste)15.001.500.501.000.730.6003.518.93
V3-E7.00 (waste)15.001.500.501.000.7300.033.518.93
V3-D7.00 (waste)15.001.500.501.000.730.600.033.518.93
V4-07.00 (waste)15.00 (waste)0000003.518.93
V4-A7.00 (waste)15.00 (waste)1.500.5000003.518.93
V4-C7.00 (waste)15.00 (waste)1.500.501.000.73003.518.93
V4-B7.00 (waste)15.00 (waste)1.500.501.000.730.6003.518.93
V4-E7.00 (waste)15.00 (waste)1.500.501.000.7300.033.518.93
V4-D7.00 (waste)15.00 (waste)1.500.501.000.730.600.033.518.93
Table 2. Quality indices of the vegetable oils and oil mixtures used in the saponification process.
Vegetable OilOil Fraction (%)SAP
(mg KOH/g Oil)
Standard SAP
(mg KOH/g Oil)
IV
(g I2/100 g Oil)
Standard IV
(g I2/100 g Oil)
INS
Olive pomace oil (virgin)63.83184.66184–196 [55]8275–94 [55]102.66
Coconut oil 76° (virgin)29.79255248–265 [56]108–12 [56]245
Stearic acid (vegetable)6.38198197–19910197
Virgin oil mixture100.00206.4755.38151.08
Olive pomace oil (waste)63.8319768129
Coconut oil 76° (waste)29.792608252
Stearic acid (vegetable)6.38198197–19910197
Waste oil mixture100.00215.8345.85169.98
Ref. [55] CODEX Alimentarius: CODEX STAN 33-1981; Ref. [56] CODEX Alimentarius: CODEX-STAN CXS 210–1999. Note: Codex Alimentarius reference values apply only to virgin edible oils and are provided for comparison purposes. No Codex reference values are available for waste oils obtained after repeated domestic frying cycles.
Table 3. Colorimetric parameters of cotton fabrics after washing with the V1–V4 soap formulations.
CodeL* ± SDa* ± SDb* ± SDC* ± SDh* ± SD
R-C91.95 ± 0.0371.53 ± 0.0442.52 ± 0.0352.95 ± 0.05358.66 ± 0.065
R-S41.99 ± 0.07813.65 ± 0.04911.40 ± 0.02217.79 ± 0.04639.86 ± 0.038
R-D82.56 ± 0.0194.47 ± 0.03410.57 ± 0.03111.47 ± 0.02167.09 ± 0.021
V1-A87.03 ± 0.782.82 ± 0.477.58 ± 0.828.09 ± 0.9369.66 ± 1.23
V1-B87.50 ± 1.092.64 ± 0.187.19 ± 0.577.66 ± 0.5969.82 ± 0.56
V1-C87.14 ± 0.383.10 ± 0.437.61 ± 0.508.23 ± 0.3567.72 ± 3.89
V1-D87.91 ± 0.542.84 ± 0.367.26 ± 0.277.79 ± 0.3868.73 ± 1.82
V1-E86.62 ± 0.793.58 ± 0.647.42 ± 0.148.25 ± 0.2064.26 ± 4.32
V2-A87.33 ± 0.343.30 ± 0.207.62 ± 0.528.31 ± 0.4266.52 ± 2.51
V2-B86.82 ± 0.513.55 ± 0.257.14 ± 0.387.98 ± 0.2563.56 ± 2.76
V2-C86.74 ± 1.543.44 ± 0.647.58 ± 0.558.32 ± 0.7665.74 ± 2.50
V2-D87.20 ± 0.413.19 ± 0.327.41 ± 0.378.07 ± 0.4466.75 ± 1.63
V2-E86.11 ± 0.593.91 ± 0.557.47 ± 0.308.44 ± 0.0962.38 ± 4.23
V3-A86.84 ± 1.483.19 ± 0.487.34 ± 1.028.01 ± 1.0466.43 ± 3.21
V3-B85.43 ± 0.214.10 ± 0.187.53 ± 0.398.58 ± 0.3061.37 ± 0.08
V3-C86.84 ± 0.213.43 ± 0.187.35 ± 0.398.12 ± 0.3065.15 ± 2.08
V3-D85.82 ± 0.613.93 ± 0.407.93 ± 0.788.86 ± 0.6563.50 ± 3.78
V3-E84.98 ± 1.054.43 ± 0.867.76 ± 0.558.95 ± 0.6760.35 ± 4.98
V4-A85.40 ± 0.284.14 ± 0.577.79 ± 0.448.84 ± 0.2061.99 ± 4.49
V4-B86.62 ± 0.563.62 ± 0.477.20 ± 0.168.06 ± 0.3363.35 ± 2.63
V4-C85.82 ± 1.303.89 ± 0.236.99 ± 0.478.01 ± 0.4660.87 ± 1.85
V4-D86.29 ± 2.283.79 ± 1.327.07 ± 0.868.05 ± 1.3562.39 ± 5.80
V4-E85.94 ± 0.463.76 ± 0.327.54 ± 0.538.44 ± 0.3663.38 ± 3.38
Note: R-C = untreated clean cotton fabric (reference); R-S = soiled cotton fabric; R-D = textile washed with the reference detergent.
Table 4. Hidden Stain (Hs) indices and washing efficiency of the investigated soap formulations.
CodeHs1 (%)Hs2 (%)Washing Efficiency (%)
V1-A5.36 ± 0.859.85 ± 1.5690.15 ± 1.56
V1-B4.85 ± 1.198.90 ± 2.1891.10 ± 2.18
V1-C5.24 ± 0.419.62 ± 0.7690.38 ± 0.76
V1-D4.40 ± 0.598.08 ± 1.0891.92 ± 1.08
V1-E5.81 ± 0.8610.67 ± 1.5689.33 ± 1.56
V2-A5.03 ± 0.379.24 ± 0.6890.76 ± 0.68
V2-B5.59 ± 0.5510.27 ± 1.0289.73 ± 1.02
V2-C5.68 ± 1.6710.44 ± 3.0889.56 ± 3.08
V2-D5.17 ± 0.459.50 ± 0.8290.50 ± 0.82
V2-E6.37 ± 0.6411.70 ± 1.1888.30 ± 1.18
V3-A5.57 ± 1.6110.23 ± 2.9689.77 ± 2.96
V3-B7.10 ± 0.2313.04 ± 0.4286.96 ± 0.42
V3-C5.57 ± 0.2310.23 ± 0.4289.77 ± 0.42
V3-D6.68 ± 0.6612.27 ± 1.2287.73 ± 1.22
V3-E7.59 ± 1.1413.94 ± 2.1086.06 ± 2.10
V4-A7.13 ± 0.3013.11 ± 0.5686.89 ± 0.56
V4-B5.81 ± 0.6110.68 ± 1.1289.32 ± 1.12
V4-C6.68 ± 1.4112.28 ± 2.6087.72 ± 2.60
V4-D6.16 ± 2.4811.32 ± 4.5788.68 ± 4.57
V4-E6.55 ± 0.5012.04 ± 0.9287.96 ± 0.92
Table 5. Colour difference of washed textile samples relative to the reference detergent.
CodeMean ± SDVisual Interpretation
ΔE* ± SDΔL* ± SDΔa* ± SDΔb* ± SDΔC* ± SDΔH* ± SD
V1-A5.63 ± 1.184.47 ± 0.78−1.64 ± 0.47−2.99 ± 0.81−3.38 ± 0.930.42 ± 0.182lighter less red less yellow
V1-B6.3 ± 0.934.94 ± 1.08−1.82 ± 0.17−3.38 ± 0.57−3.81 ± 0.590.44 ± 0.10lighter less red less yellow
V1-C5.66 ± 0.184.58 ± 0.38−1.36 ± 0.42−2.96 ± 0.50−3.24 ± 0.340.11 ± 0.66lighter less red less yellow
V1-D6.50 ± 0.665.35 ± 0.54−1.63 ± 0.36−3.31 ± 0.26−3.68 ± 0.370.26 ± 0.28lighter less red less yellow
V1-E5.25 ± 0.704.06 ± 0.79−0.88 ± 0.63−3.15 ± 0.13−3.22 ± 0.20−0.48 ± 0.73lighter less red less yellow
V2-A5.75 ± 0.084.77 ± 0.34−1.16 ± 0.18−2.94 ± 0.52−3.16 ± 0.41−0.09 ± 0.43lighter less red less yellow
V2-B5.56 ± 0.454.26 ± 0.51−0.92 ± 0.24−3.42 ± 0.38−3.49 ± 0.24−0.58 ± 0.44lighter less red less yellow
V2-C5.26 ± 1.654.18 ± 1.54−1.03 ± 0.63−2.99 ± 0.55−3.15 ± 0.75−0.24 ± 0.44lighter less red less yellow
V2-D5.76 ± 0.584.64 ± 0.40−1.27 ± 0.31−3.15 ± 0.37−3.40 ± 0.43−0.06 ± 0.27lighter less red less yellow
V2-E4.79 ± 0.323.55 ± 0.58−0.55 ± 0.55−3.1 ± 0.30−3.02 ± 0.09−0.80 ± 0.72lighter less red less yellow
V3-A5.53 ± 1.764.28 ±1.47−1.27 ± 0.48−3.23 ± 1.01−3.46 ± 1.03−0.10 ± 0.51lighter less red less yellow
V3-B4.22 ± 0.152.87 ± 0.20−0.36 ± 0.17−3.04 ± 0.39−2.89 ± 0.29−0.98 ± 0.34lighter less red less yellow
V3-C5.48 ± 1.334.28 ± 1.34−1.04 ± 0.63−3.21 ± 0.28−3.35 ± 0.49−0.33 ± 0.59lighter less red less yellow
V3-D4.28 ± 0.653.26 ± 0.61−0.53 ± 0.39−2.63 ± 0.77−2.60 ± 0.64−0.62 ± 0.65lighter less red less yellow
V3-E3.83 ± 0.892.42 ± 1.04−0.03 ± 0.86−2.81 ± 0.54−2.51 ± 0.67−1.19 ± 0.88lighter less red less yellow
V4-A4.03 ± 0.372.84 ± 0.28−0.32 ± 0.56−2.78 ± 0.43−2.63 ±0.19−0.89 ± 0.77lighter less red less yellow
V4-B5.36 ± 0.554.06 ± 0.55−0.84 ± 0.46−3.37 ± 0.15−3.41 ± 0.320.20 ± 0.44lighter less red less yellow
V4-C4.92 ± 1.093.25 ± 1.30−0.57 ± 0.22−3.57 ±0.47−3.45 ±0.45−1.03 ± 0.29lighter less red less yellow
V4-D5.29 ± 2.353.75 ± 2.27−0.67 ± 1.31−3.50 ± 0.85−3.4 ± 1.34−0.83 ±1.02lighter less red less yellow
V4-E4.63 ± 0.173.38 ± 0.45−0.70 ± 0.31−3.03 ± 0.53−3.03 ± 0.35−0.62 ± 0.57lighter less red less yellow
Table 6. Comparative washing performance of the selected soap formulations based on Hs2, washing efficiency and ΔE*.
SampleHs2 (%)Washing Efficiency (%)ΔE*
V1-D8.08 ± 1.0891.92 ± 1.086.50 ± 0.66
V1-B8.90 ± 2.1891.10 ± 2.186.30 ± 0.93
V2-A9.24 ± 0.6890.76 ± 0.685.75 ± 0.08
V2-D9.50 ± 0.8290.50 ± 0.825.76 ± 0.58
V1-C9.62 ± 0.7690.38 ± 0.765.66 ± 0.18
V4-B10.68 ± 1.1289.32 ± 1.125.36 ± 0.55
Table 7. Estimated EO persistence (%) remaining on the textile substrates after one washing stage followed by four successive rinsing stages.
StageV1-CV1-BV1-DV1-EV2-DV3-DV4-D
Washing14.25010.85910.64111.85910.68011.25210.666
Rinsing 14.1205.5635.1203.7524.4364.0214.607
Rinsing 22.8963.3553.0992.3023.4923.0772.161
Rinsing 31.6261.5141.8111.1542.4281.8031.335
Rinsing 40.4830.4320.3650.3020.6890.6150.391
Disclaimer/Publisher’s Note: The statements, opinions and data contained in all publications are solely those of the individual author(s) and contributor(s) and not of MDPI and/or the editor(s). MDPI and/or the editor(s) disclaim responsibility for any injury to people or property resulting from any ideas, methods, instructions or products referred to in the content.