Abstract
To develop cement-based composite materials with exceptional impact resistance, this study investigates the impact resistance performance of steel fiber- and glass fiber-reinforced specimens, as well as steel fiber and glass fiber textile-reinforced specimens, through drop weight impact tests. The results showed that the impact resistance of specimens increases with the number of glass fiber textile layers, glass fiber volume fractions, and glass fiber lengths, with 36GF1.5SF1.0 exhibitinh ultra-high impact resistance with a failure impact energy of 114 kJ. Compared to the specimens reinforced with glass textiles, the specimens with glass fiber showed better impact resistance at the same volume fraction. The failure mode of unreinforced specimens is divided into several pieces, while fiber-reinforced specimens have local punching shear failure at the impact site, maintaining better integrity. An impact damage evolution equation and life prediction model based on a two-parameter Weibull distribution are developed. The research results will provide a reference for the selection of fibers for engineering applications.
1. Introduction
Concrete is a widely used building material in engineering; however, concrete without any fibers often exhibits brittle characteristics under static and dynamic loads, posing a threat to its safety. To alter this brittleness and enhance ductility, researchers have sought to improve the mechanical properties of concrete by incorporating fibers [1,2,3,4]. Victor Li [5] designed an Engineered Cementitious Composite (ECC) based on micromechanics, which exhibits excellent deformation capacity and crack control ability [6,7,8,9,10,11,12,13,14].
Engineered Cementitious Composites (ECCs) are designed to withstand not only static loads during their service life but also potential dynamic loads such as impacts, fatigue, or explosions. Both domestic and international studies have been conducted on the impact resistance of ECCs [15,16,17]. Experiments by Truong et al. [18] and Heravi et al. [19] revealed that compared to various types of commercial textiles, glass fiber textiles exhibit sufficient bonding strength within the mortar matrix, enabling optimal reinforcement efficiency in glass fiber textiles. Truong [20] found that the strain capacity and energy absorption capacity of glass fiber textile-reinforced ECCs increase with the rise in strain rate. Liu et al. [21] demonstrated that the impact response of basalt fiber textile-reinforced specimens is significantly dependent on the investigated impact velocities. The 37.5 kg drop hammer achieves impact velocities ranging from 0.77 m/s to 4.75 m/s through adjustable drop height configurations, and the maximum impact force and energy absorption increase with the rise in impact velocity across different temperatures. Zeng [22] found that modified bamboo fibers significantly enhanced the impact resistance of ECCs. Wang et al. [23] and Fu et al. [24] reported that 2.0% PVA fiber-reinforced ECCs significantly increased the fracture energy of ECCs. Lin et al. [25] found that, compared to ECCs with 1.0% PVA fibers, the initial crack impact strength and ultimate crack impact strength of ECC incorporating 1.0% PVA fibers and 1.5% polypropylene (PP) fibers increased by 240% and 192%, respectively. These results suggest that the impact resistance of ECCs can be enhanced by utilizing a single layer of fiber textile and various configurations of low-modulus fibers in combination with steel fibers. However, previous studies have explored little regarding the impact resistance of cement-based composite panels reinforced with various lengths of glass fiber and various layers of glass fiber textiles, and at the same volume fraction, the differential impact of glass fiber textiles and glass fibers on the enhancement of impact resistance in cement-based composite panels.
Therefore, this study focused on cement-based composite panels reinforced with different lengths of glass fibers and with steel fibers, as well as panels reinforced with different layers of glass fiber textiles and with steel fibers. It investigated the effects of glass fiber volume fractions (1.0%, 1.5%), glass fiber lengths (24 mm, 36 mm), and glass fiber textile layers (2 layers, 3 layers) on the impact resistance of specimens. Additionally, it examined the magnitude and difference in impact enhancement on specimens with the same volume fraction of glass fiber textiles and glass fibers (with two-layer and three-layer glass fiber textiles corresponding to short glass fibers with volume fractions of 1.0% and 1.5%, respectively). This study aims to advance the application of hybrid fibers in Engineered Cementitious Composites (ECCs). Through a systematic investigation of the differential enhancement mechanisms of chopped glass fibers and glass fiber textiles on impact resistance, the research seeks to optimize fiber hybridization strategies under comparable cost constraints, thereby providing reliable guidance for engineering applications.
2. Experiment Program
2.1. Material Properties and Mix Proportions
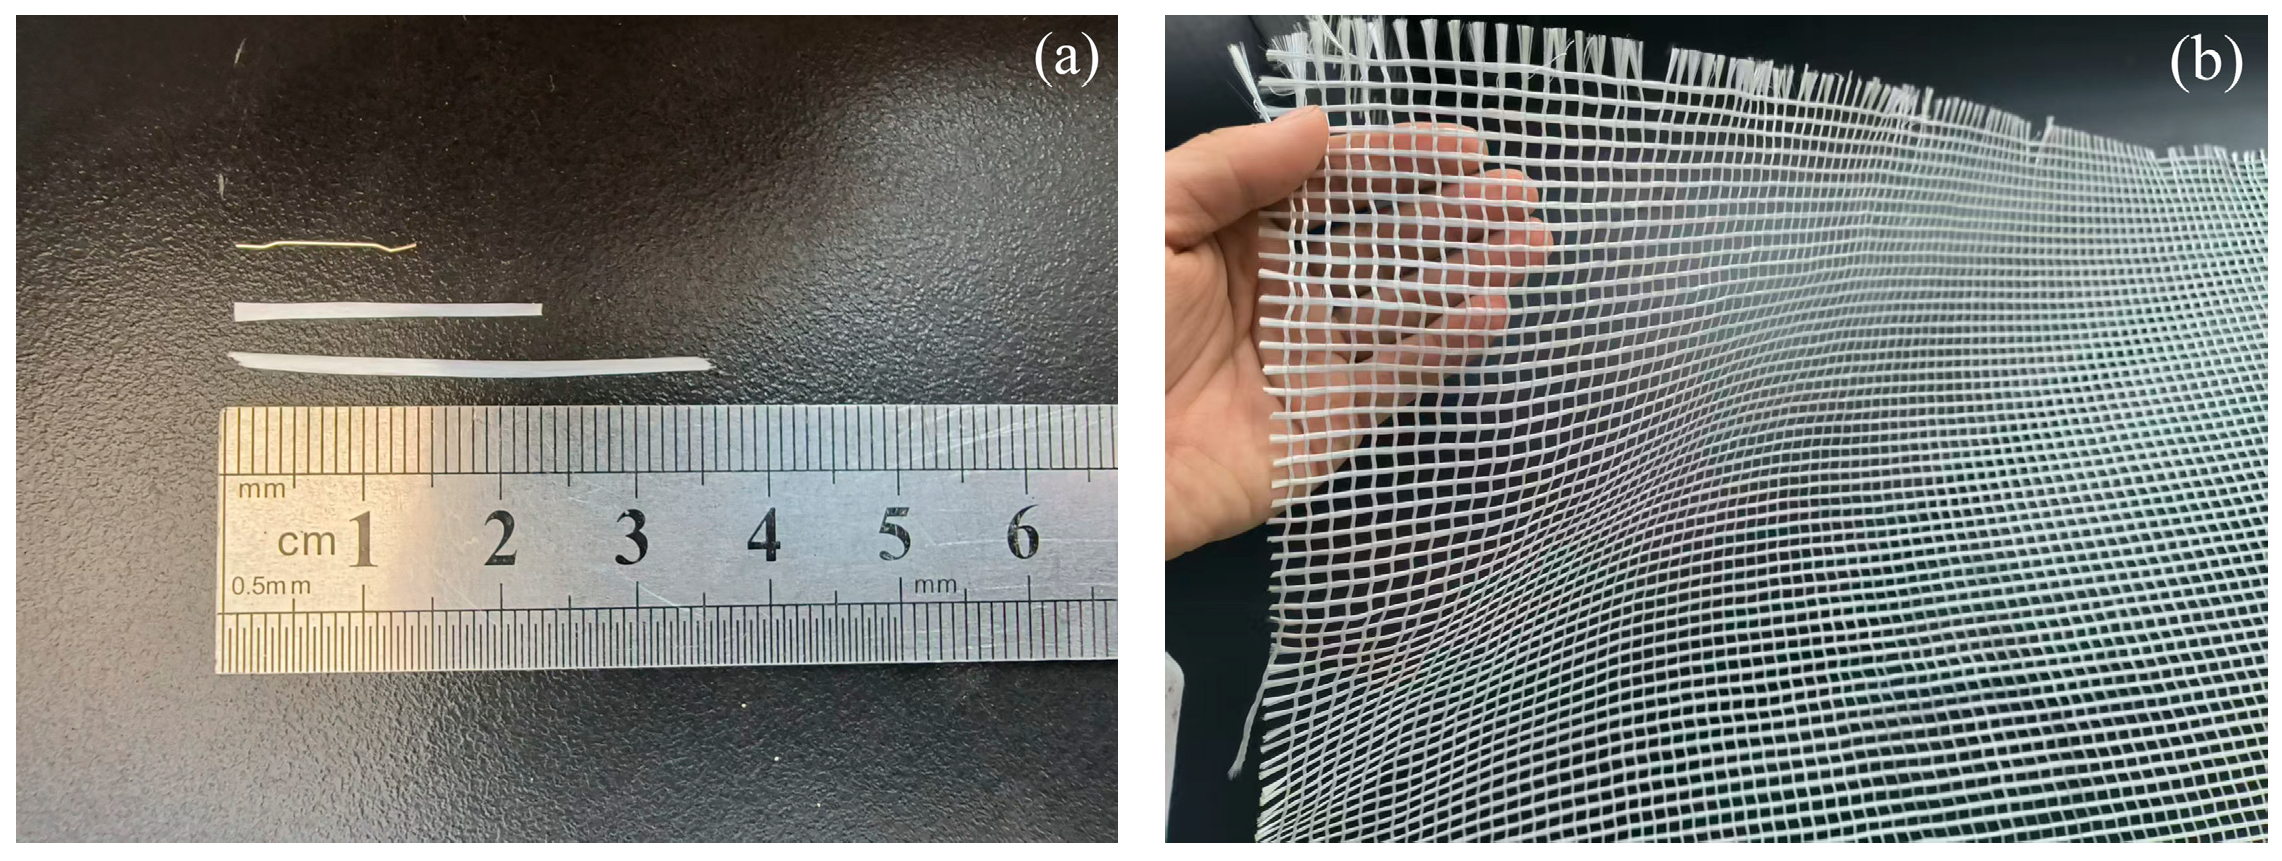
The composition of ECCs includes Portland cement (P.O 42.5R), GGBFS (S95), sand (with a fineness modulus of 2.3), water, water reducer, alkali-resistant glass fibers (24 mm, 36 mm), copper-coated steel fibers (13 mm), and glass fiber textiles. Portland cement, GGBFS, and sand are from the China Building Materials Academy (CBMA). The glass fibers and glass fiber textiles were produced by the Taishan Glass Fiber Company, the copper-coated steel fibers were manufactured by the Wuxi Steel Fiber Company. The glass fibers, steel fibers, and glass fiber textiles are shown in Figure 1. Fiber and fiber textile data can be found in Table 1 and Table 2. The data for glass fibers and glass fiber grids were obtained from the Taishan Glass Fiber Company, while the steel fiber data were provided by the Wuxi Steel Fiber Company. The water reducer used is a polycarboxylate water reducer.
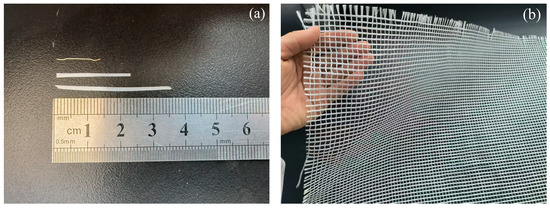
Figure 1.
(a) Steel fiber and glass fiber; (b) glass fiber textile.

Table 1.
Properties of glass fiber and steel fiber.
Table 2.
Properties of glass fiber textile.
In this study, the mixed proportion of ECCs is shown in Table 3, with a water–cement ratio of 0.17.
Table 3.
Mix ratio of cementitious composite (kg/m3).
According to Fu et al. [24], Lin et al. [25], and Li et al. [26], incorporating 2.0% by volume of fibers in ECCs ensures favorable fiber dispersion characteristics while effectively enhancing the impact resistance of the composite. Based on these findings, the present study adopts two fiber contents of 2.0% and 2.5% by volume in its experimental design. The volume of glass fiber is determined by the volume fraction of the glass fiber textile. The two-layer glass fiber textile and three-layer glass fiber textile correspond to glass fiber volume fractions of 1.0% and 1.5%, respectively. The specimen naming conventions are shown in Table 4, where CCP refers to the specimens without any fibers. The numerical values following “SF” in SF1.0 indicate the volume fraction of steel fibers, while the values following “G” in G2SF1.0 (G3SF1.0) correspond to the number of glass fiber textile layers. The values preceding “GF” in 24GF1.0SF1.0 (24GF1.5SF1.0, 36GF1.0SF1.0, and 36GF1.5SF1.0) denote the lengths of the glass fibers, and the values following “GF” indicate the volume fraction of glass fibers.
Table 4.
Groups of fiber-reinforced cementitious composite specimens.
2.2. Testing Methods
2.2.1. Fabrication and Maintenance of the Specimen
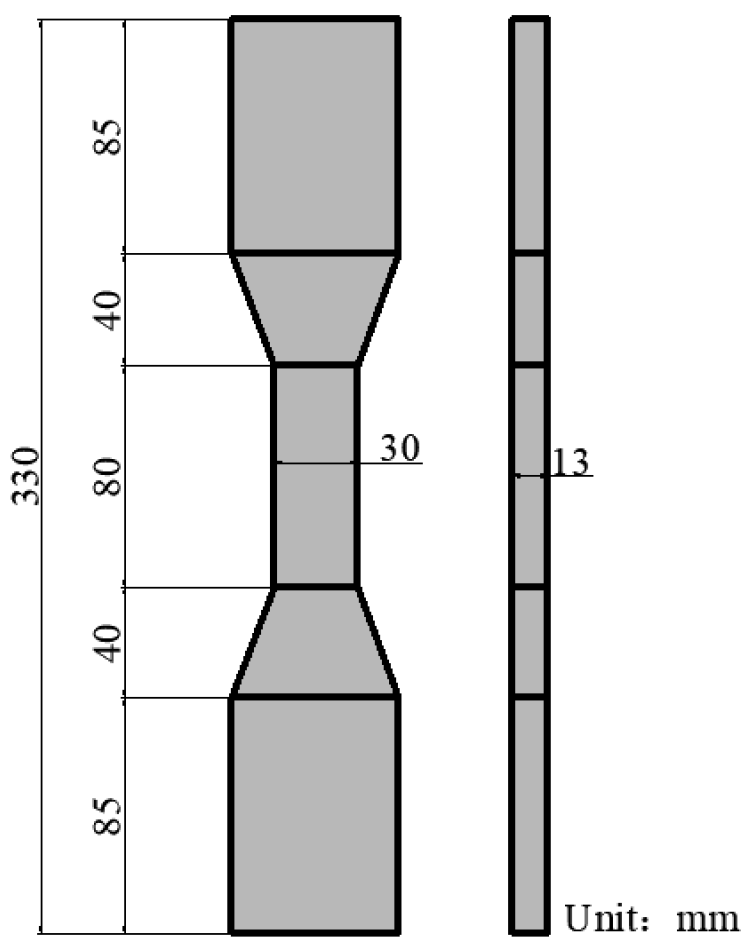
According to CECS 13: 2009 [26], in addition to the glass fiber textile-reinforced specimens, six experimental groups of compressive specimens were prepared. Each experimental group prepared three 100 mm × 100 mm × 100 mm cubes for compressive experiments. For tensile testing, dog-bone specimens (Figure 2) were exclusively prepared for five distinct fiber-reinforced ECC groups, with six replicates per group. The drop weight impact tests involved preparing 500 mm × 500 mm × 50 mm bidirectional panels across eight experimental groups, each comprising three specimens. The casting process is illustrated using a steel fiber-reinforced Engineered Cementitious Composite (ECC) with three layers of glass fiber textile as an example. Following the complete mixing of the cementitious matrix, steel fibers, and other materials, the procedure involved, sequentially, (1) pouring a 3 mm thick layer of the ECC, (2) overlaying it with one layer of glass fiber textile, (3) pouring another 3 mm cementitious layer, (4) placing the second glass fiber textile layer, (5) casting a third 3 mm cementitious layer, and (6) applying the final glass fiber textile layer, with the remaining height of the formwork then cast with the ECC, ultimately completing the specimen casting. All specimens were placed in a standard curing room and removed from the molds after approximately 24 h and then cured in the curing room for 28 days before conducting compression, tensile, and drop weight impact tests.

Figure 2.
Dimensions of dog-bone specimen.
2.2.2. Compression Test
Compression tests were conducted according to CECS 13: 2009 [26] using a compression machine with 8000 kN capacity with a loading rate of 0.5 MPa/s. Compressive tests were conducted using samples measuring 100 mm × 100 mm × 100 mm, and the compressive strength was determined as the average of three cubic specimens.
2.2.3. Tension Test
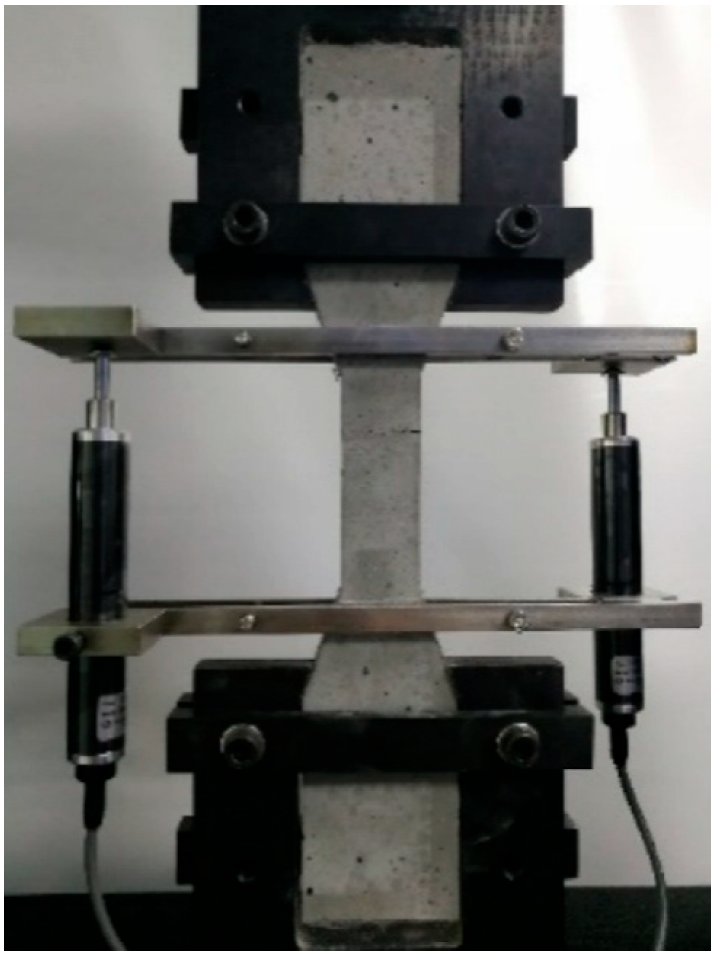
Tensile tests were conducted following JCT 2461-2018 [27], using an MTS electro-hydraulic servo-controlled testing machine, with the testing apparatus illustrated in Figure 3. The tests were carried out under quasi-static loading conditions with a displacement control rate of 0.5 mm/min. The stress–strain data were calculated based on the obtained measurements.

Figure 3.
Tensile test set-up.
2.2.4. Drop Weight Impact Tests
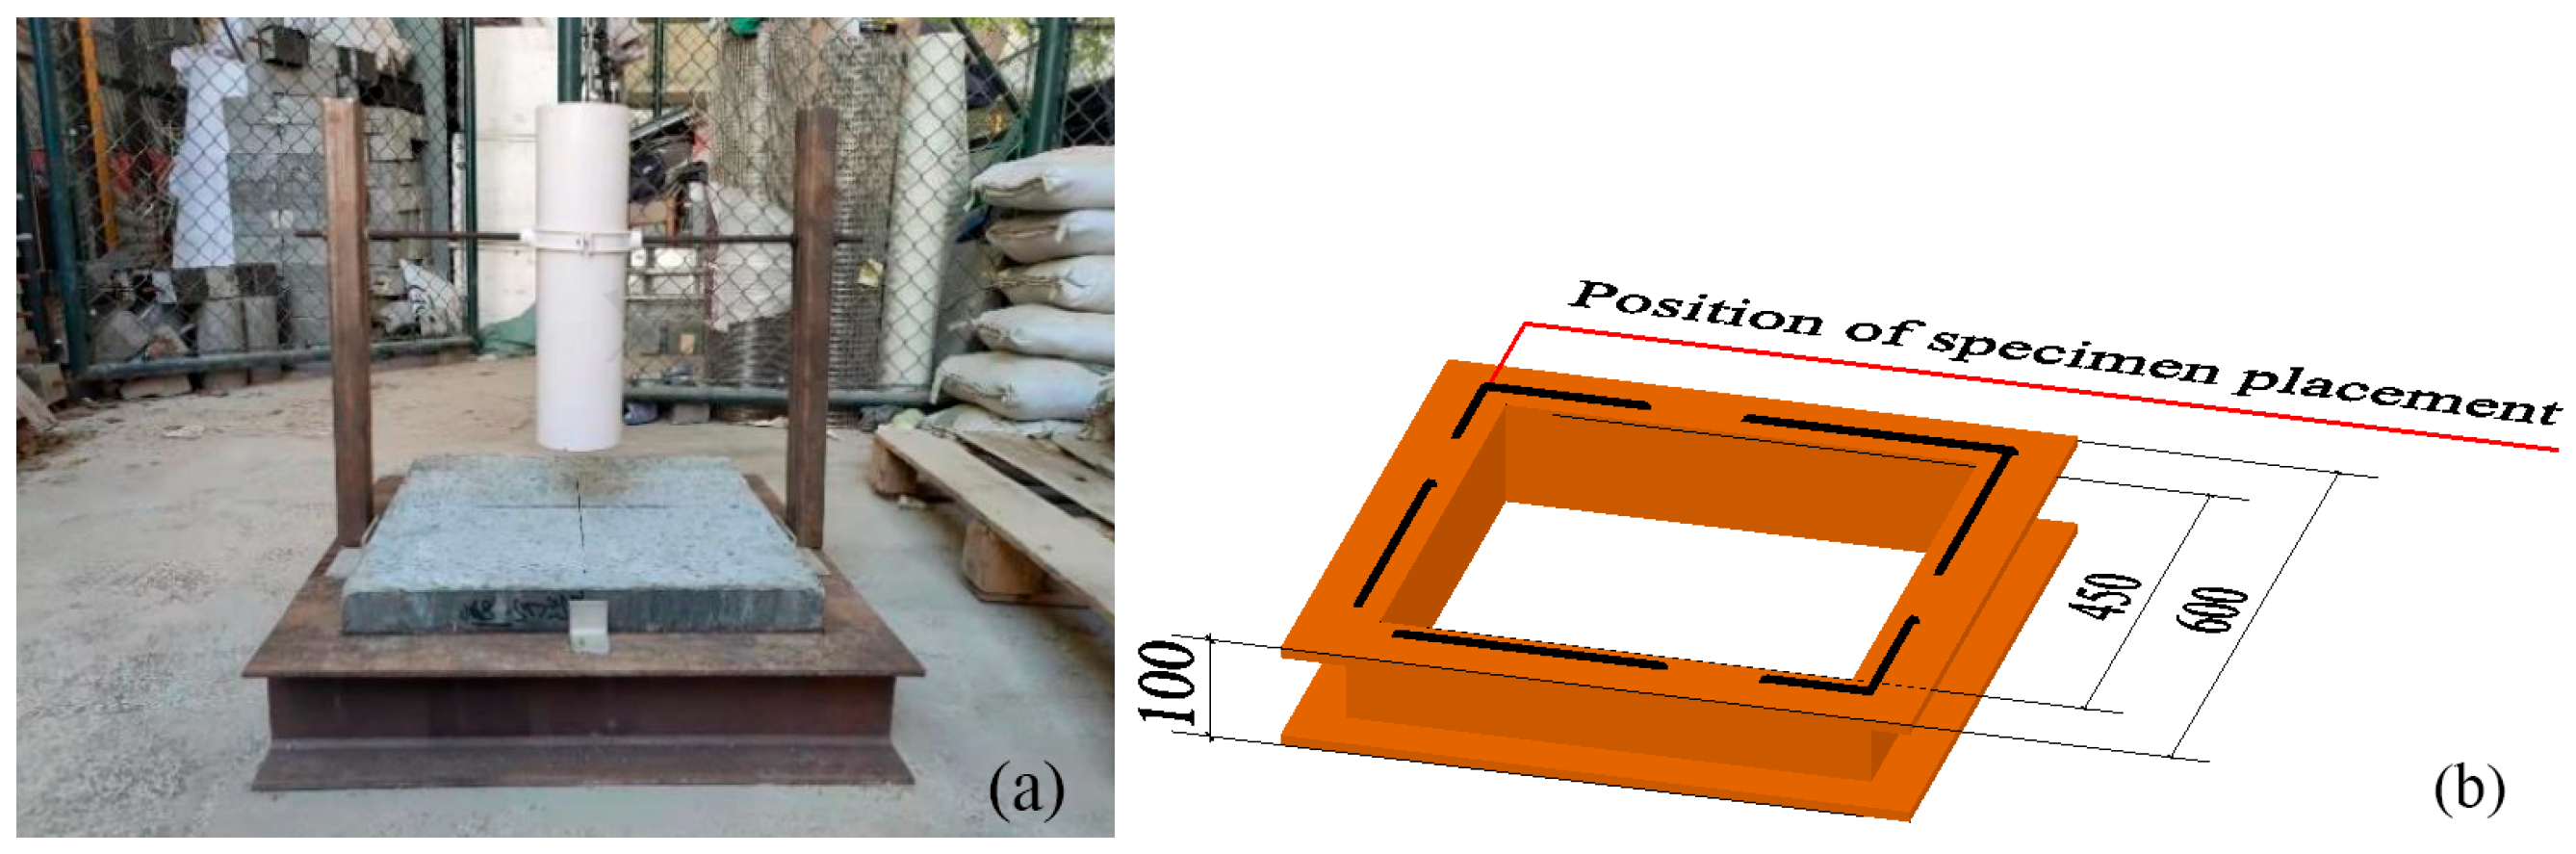
The drop weight impact test method for fiber0reinforced concrete was conducted per the guidelines from the “Standards for Testing Fiber Reinforced Concrete” (CECS: 13-2009) [26] and ACI 544.2R-89 [28] recommendations. An impact testing device was employed as shown in Figure 4. During the tests, a steel ball weighing 3 kg was lifted to an impact height of 500 mm and repeatedly struck the specimens. The specimens experienced a bidirectional bending state during impact. The first visible crack on the bottom surface indicated the initial crack impact number, denoted as . As cracks propagated and the specimen ultimately fractured into several pieces or the bottom surface noticeably bulged due to impact, this indicated the failure impact number, denoted as . The corresponding impact energies and were calculated.
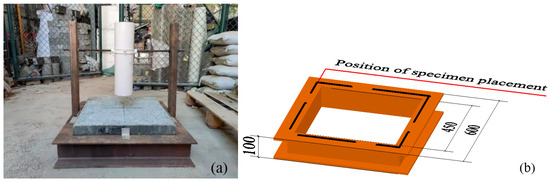
Figure 4.
(a) Drop weight impact test device; (b) bedplate.
The calculation of impact energy for cement-based composites is based on Equations (1) and (2):
where is the impact energy of the initial cracking, is the impact energy of the failure impact, is the impact number of the initial cracking, is the impact number of the failure impact, is the mass of the impact hammer, is the acceleration due to gravity, which is 9.81 m/s2, and is the height from which the impact hammer falls, which is 500 mm.
3. Results and Analysis
3.1. Explore the Mechanical Properties of Glass Fiber- and Steel Fiber-Reinforced Specimens
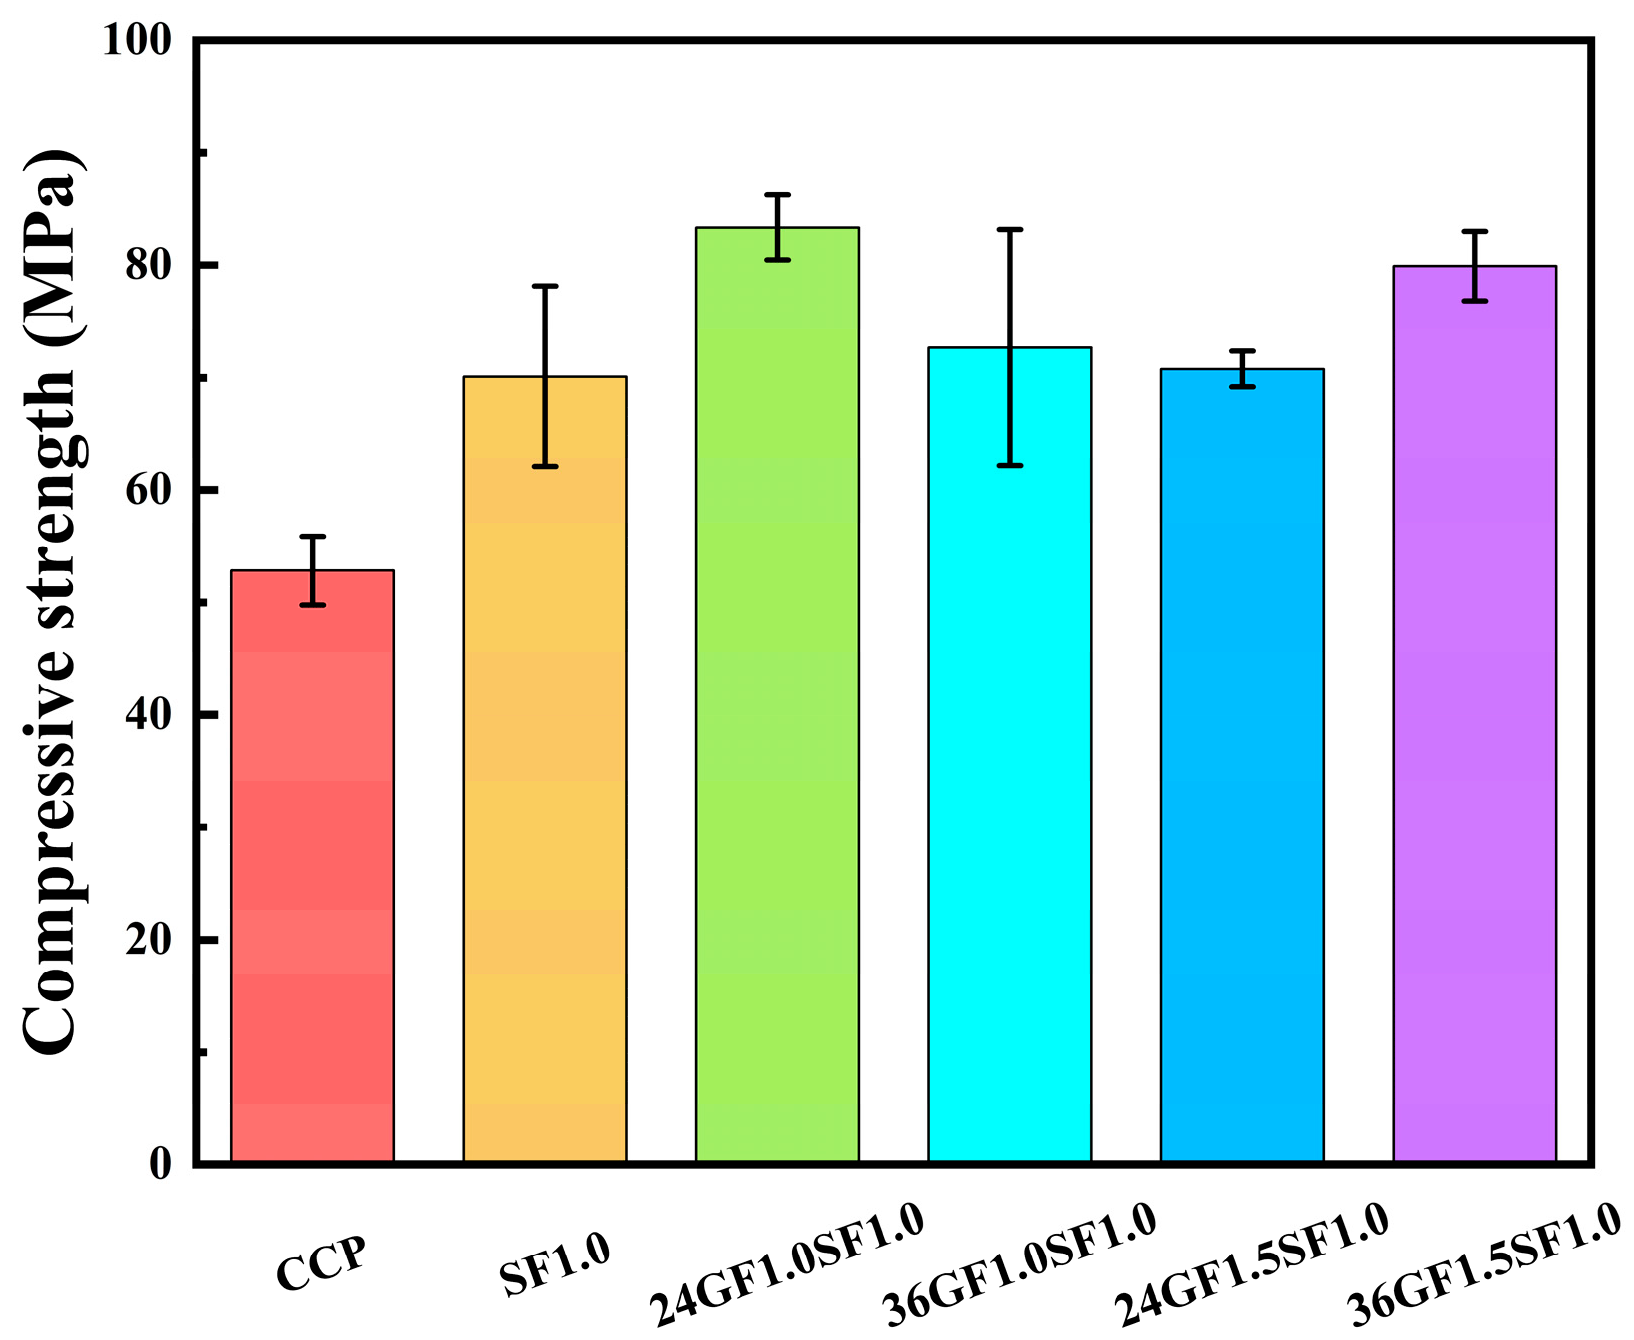
Figure 5 demonstrates the influence of various fiber combinations on the 28-day compressive strength of specimens, revealing that both individual steel fiber (SF) incorporation and its hybridization with glass fibers (GFs) effectively enhance compressive strength, with particularly notable improvement observed when adding glass fibers to specimens containing 1.0 vol% steel fibers due to their synergistic effect in constraining lateral expansion and thereby boosting compressive resistance. The 24GF1.0SF1.0 specimen exhibited the highest compressive strength among all tested specimens. The higher compressive strength of 24GF1.0SF1.0 compared to 36GF1.0SF1.0 stems from its greater number of shorter 24 mm glass fibers per unit area, providing superior crack-blocking capability; at a fiber content of 1.0 vol% by volume, 24 mm glass fibers demonstrate superior dispersibility compared to 36 mm glass fibers.

Figure 5.
Compressive strength of specimens.
The effect of different fiber combinations on the tensile strength and peak strain of the specimens after 28 days is presented in Table 5. Table 5 indicates that the tensile strength and peak strain of the specimens increased with the increasing glass fiber volume. The addition of glass fibers allows the peak strain of the specimens to exceed 1%, and the tensile strength and peak strain of the specimen show minor improvements from hybrid fibers.
Table 5.
Tensile strength and ultimate strain of specimens.
3.2. Impact Resistance
3.2.1. The Development Process of Impact Cracks
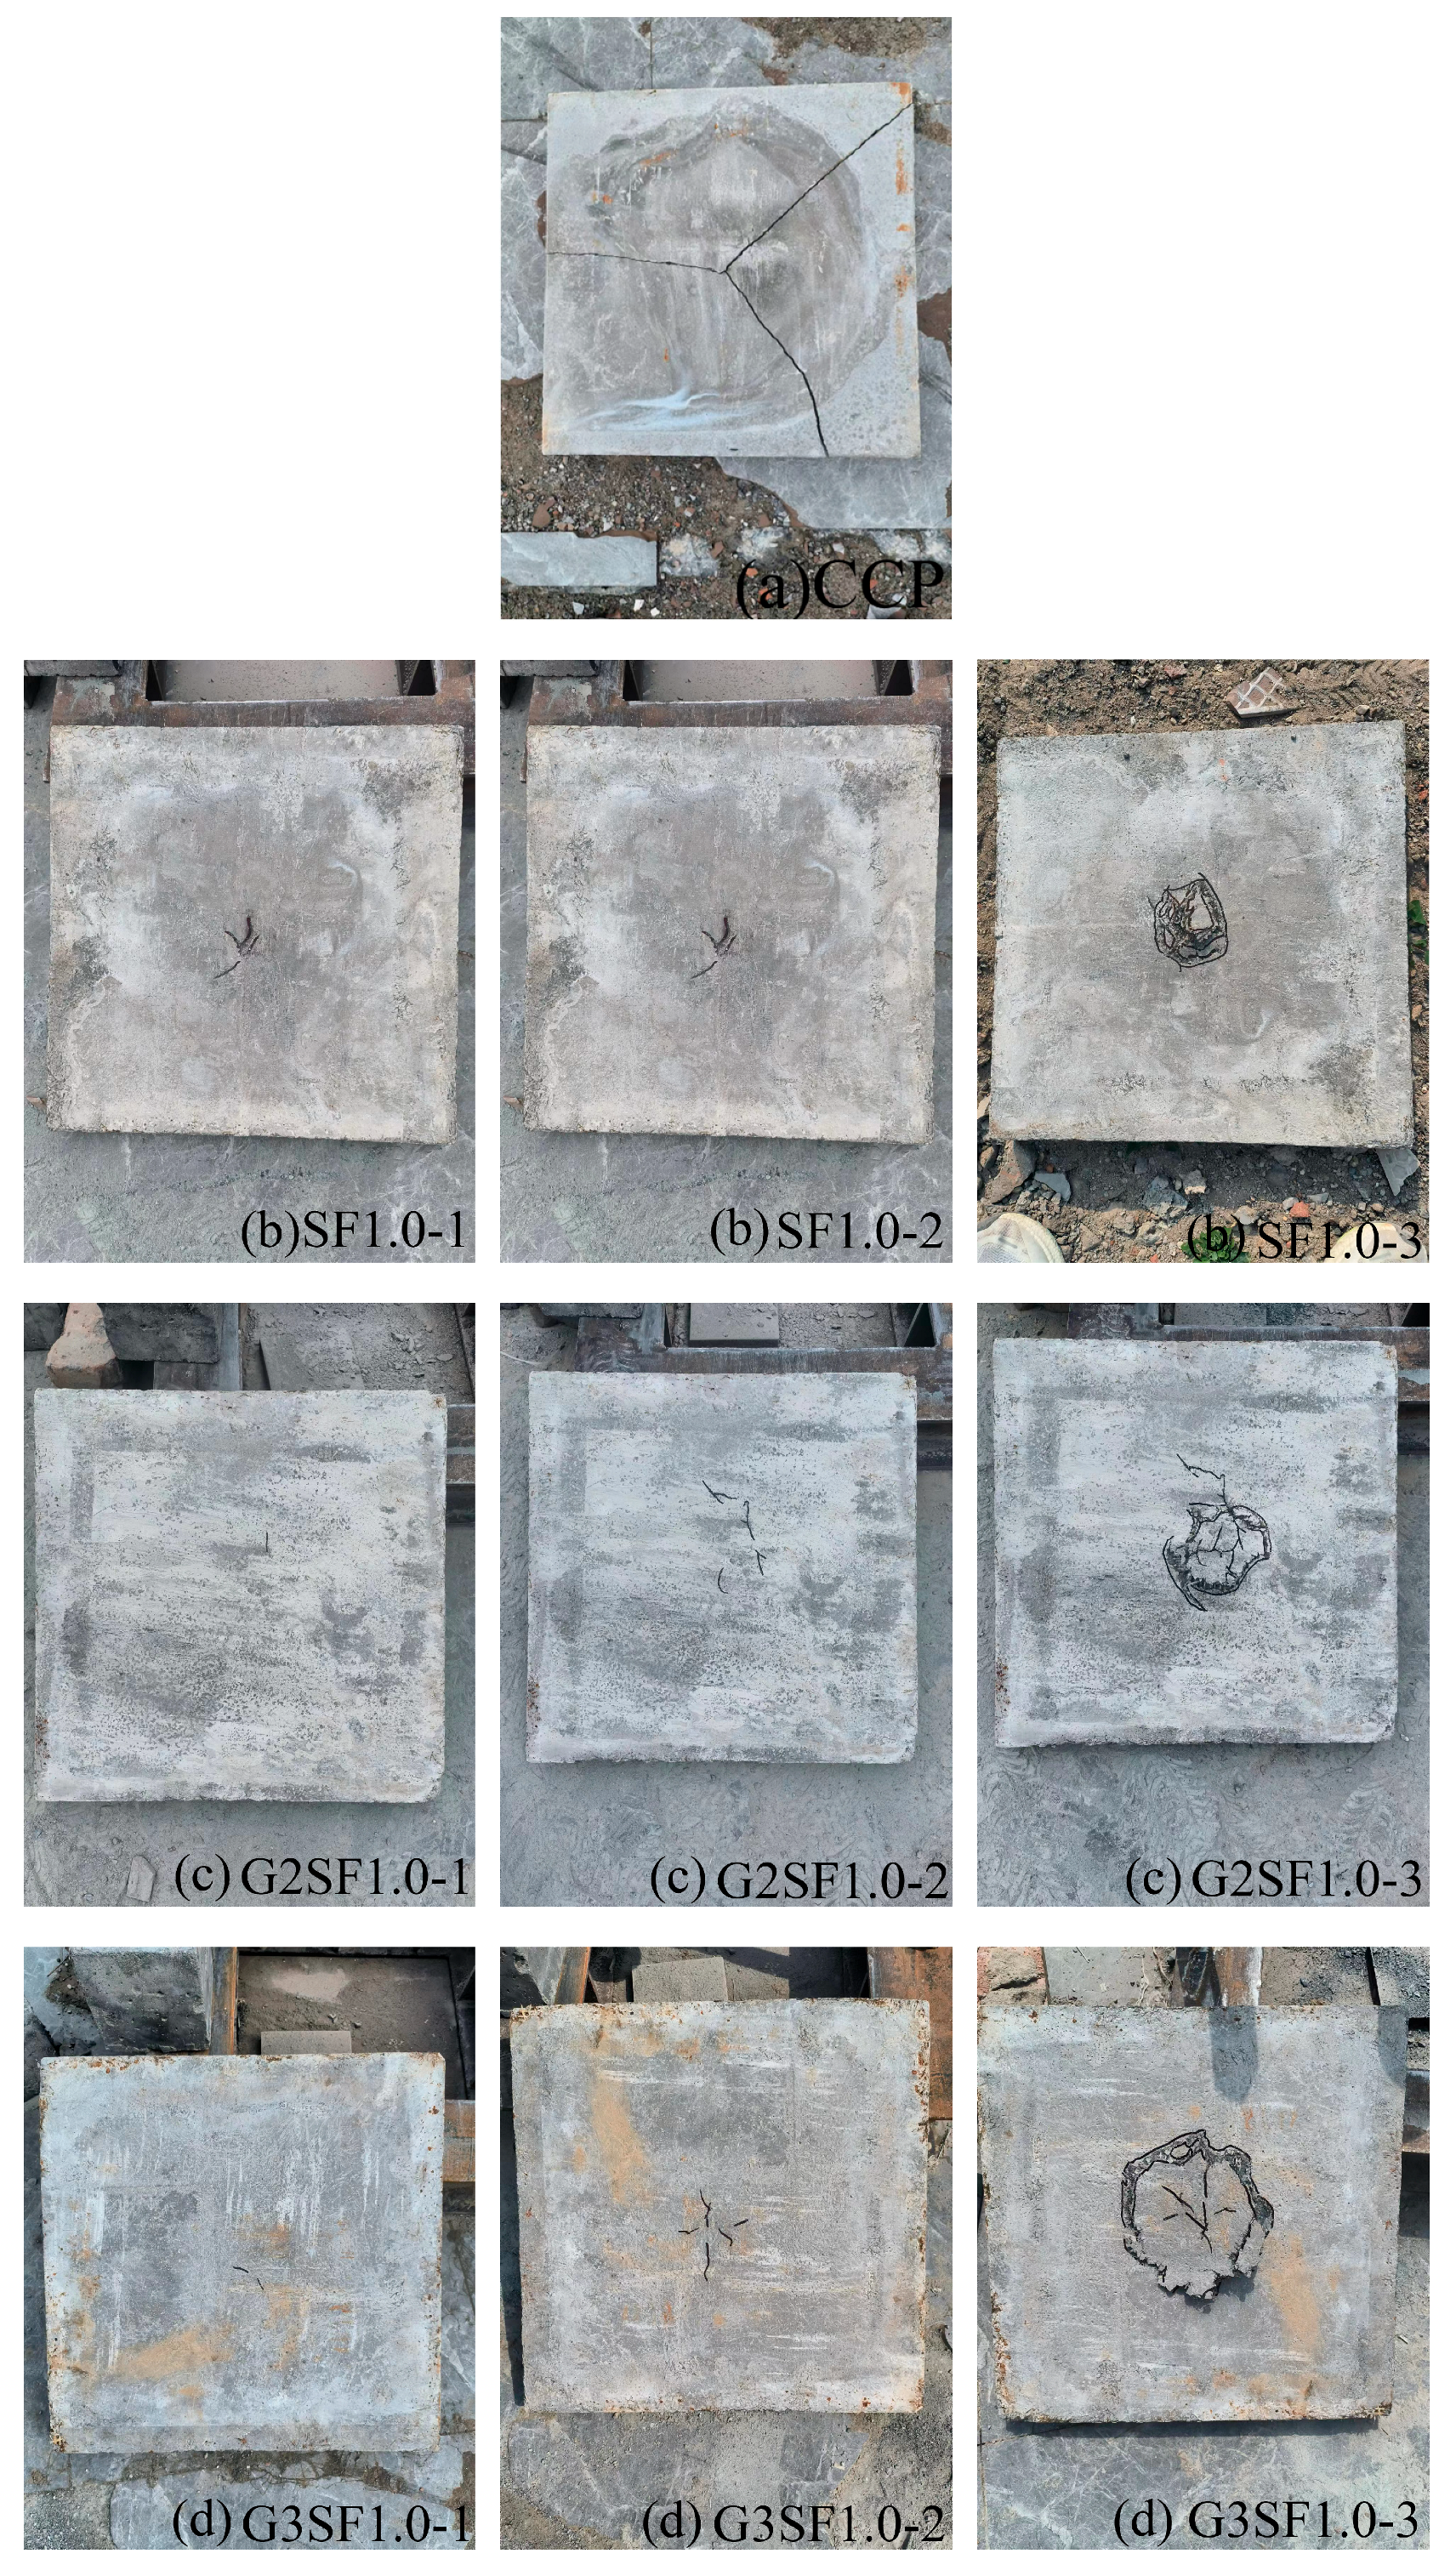
The failure mode of the unreinforced specimens, as shown in Figure 6a, indicates that cracks on the bottom surface developed radially. These cracks extended to the edges of the panel, ultimately resulting in the panel breaking into several pieces, characterizing the brittle failure.

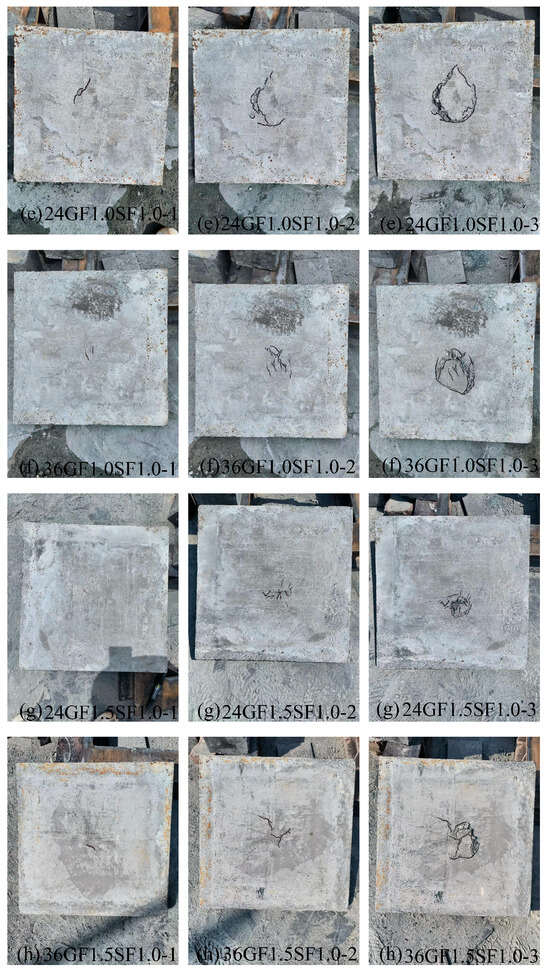
Figure 6.
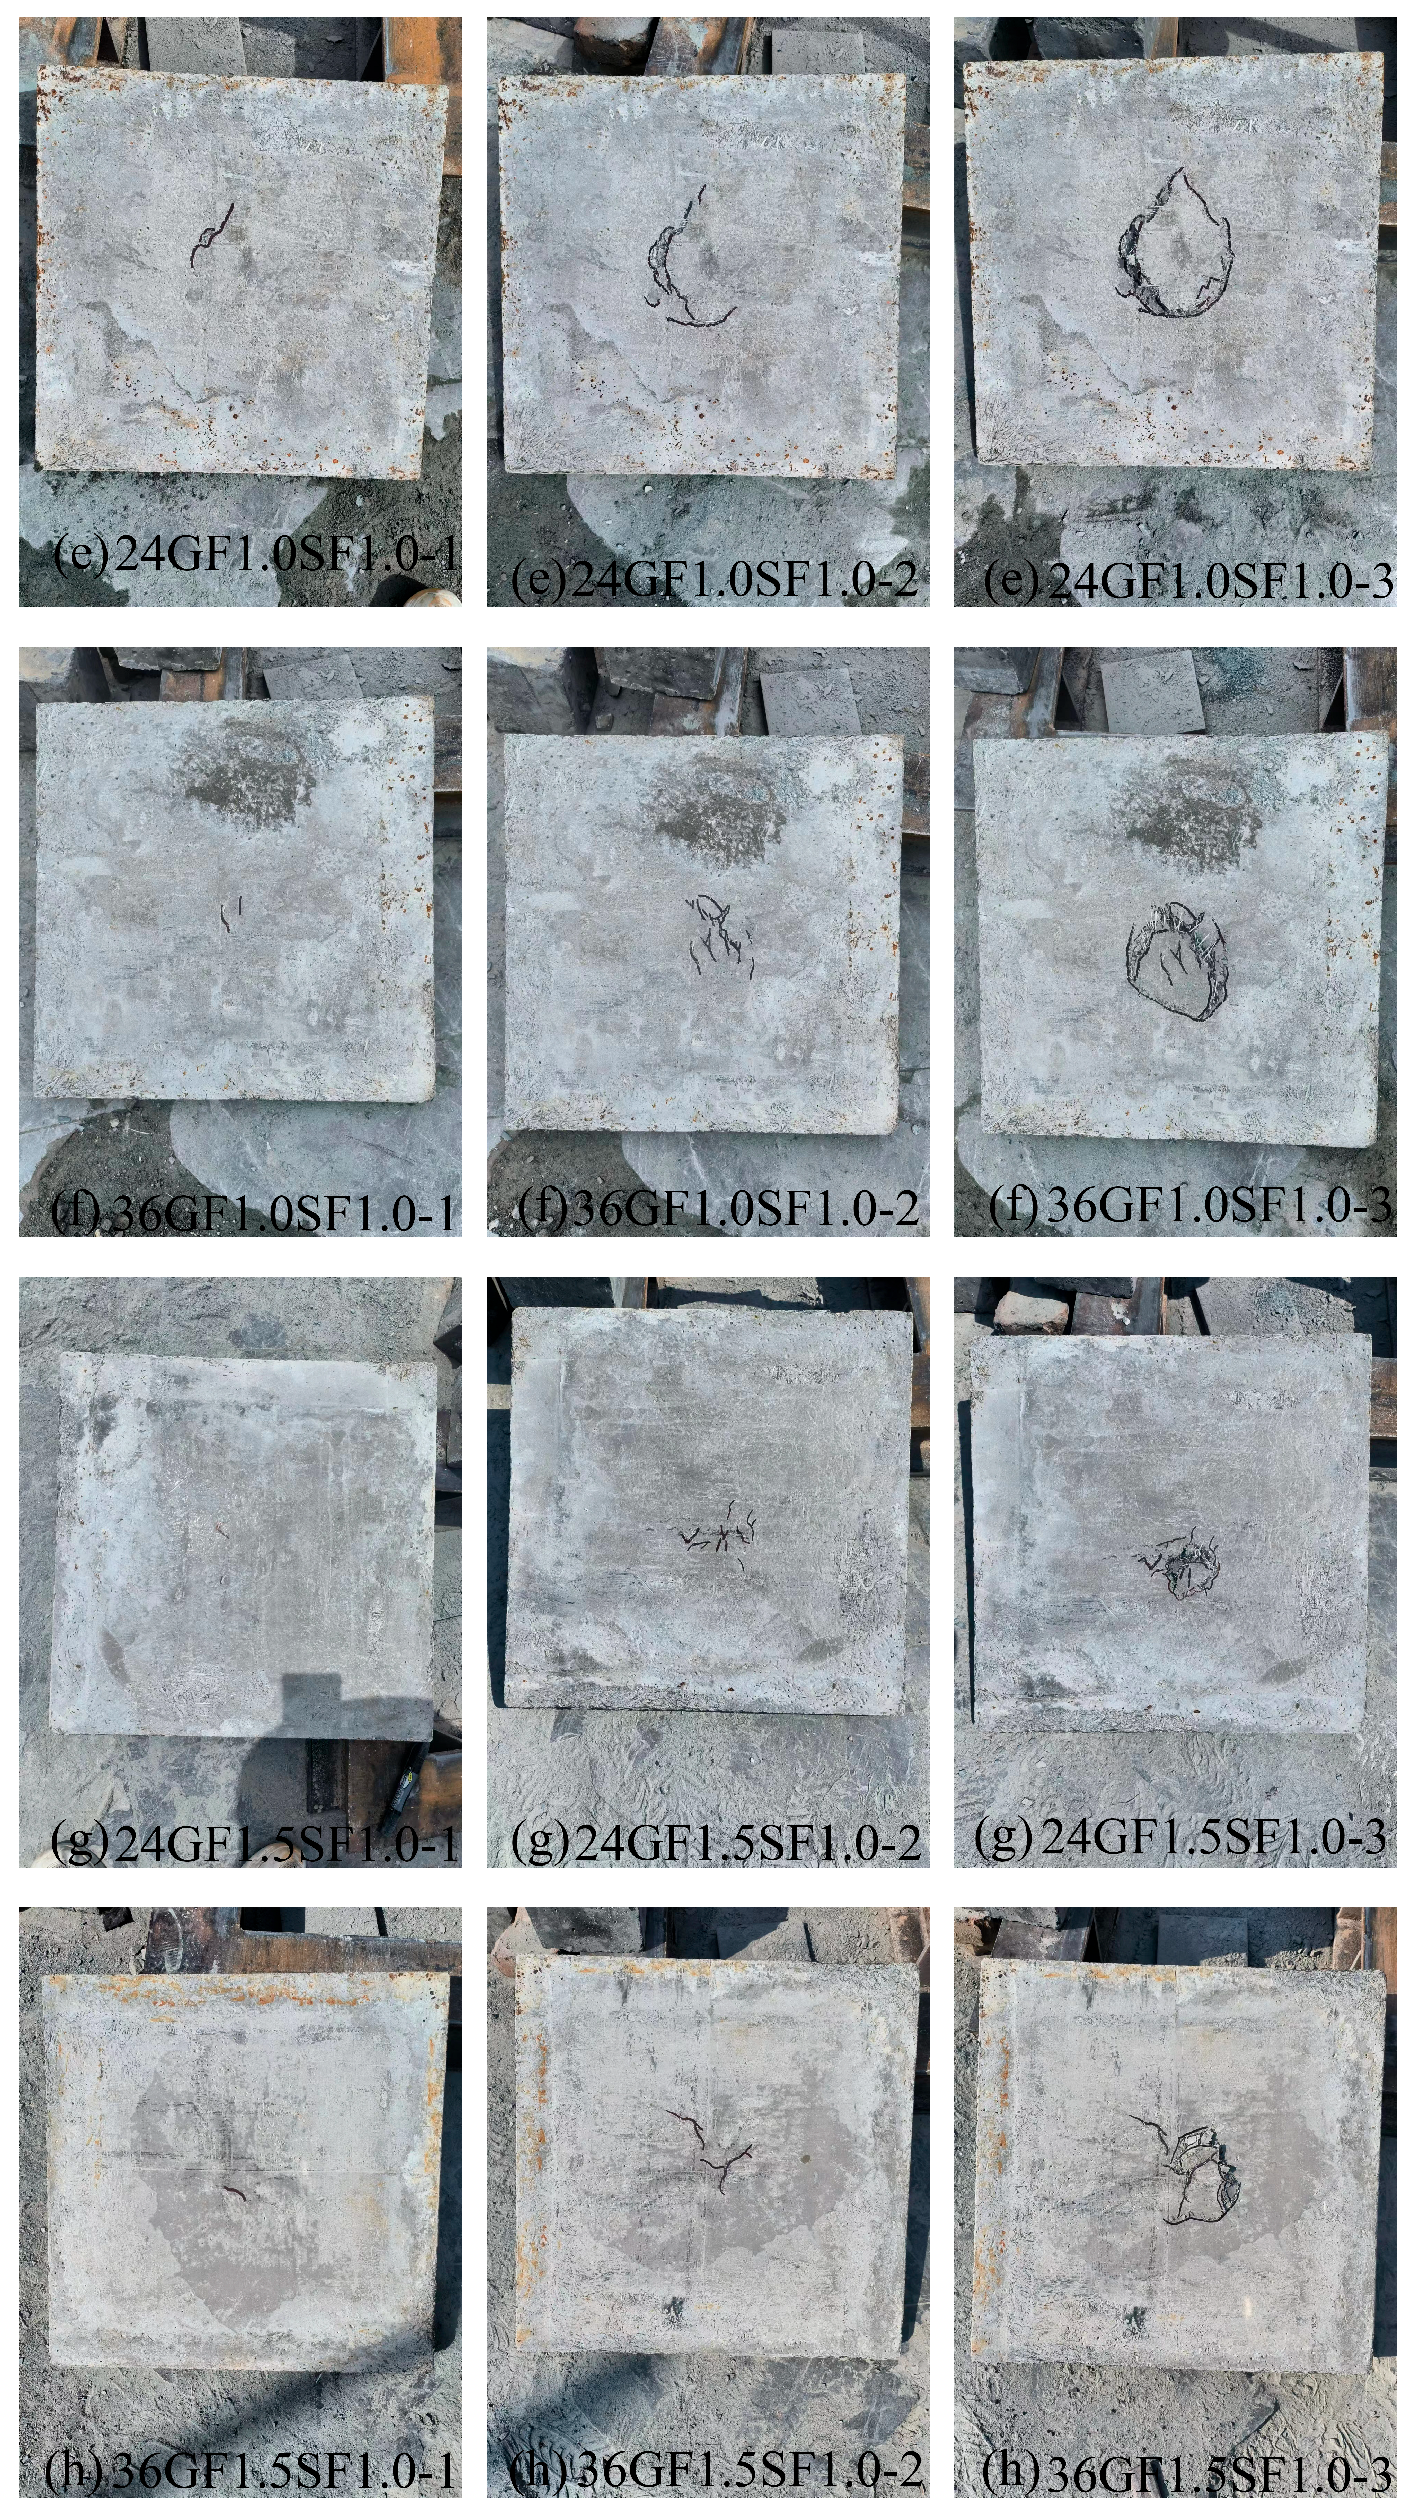
The development process of impact cracks on the bottom surface of specimens.
Figure 6b–h illustrates the crack development process of fiber-reinforced specimens under impact loading. Unlike the failure mode of unreinforced specimens, the failure modes of the fiber reinforced specimens exhibited localized punching shear failure at the impact site. The crack development can be roughly divided into three stages:
- Crack initiation stage: as the number of impacts increases, the bottom surface of the specimen transitions from having no cracks to developing the first visible crack.
- Stable crack development stage: with further increases in the number of impacts, cracks on the bottom surface of the specimen develop stably.
- Accelerated crack development stage: as the number of impacts increases, new cracks appear less frequently, while existing cracks lengthen rapidly, leading to final specimen failure.
From Figure 6, it is evident that the cement-based composite panels with different fiber combinations exhibited distinct failure characteristics under impact loading, but all specimens maintained good integrity.
The failure mode of the single-doped steel fiber-reinforced specimens, as seen in Figure 6b, indicates that for the SF1.0 specimen, as the impact tests progressed, the first crack appeared with a small width, and no significant bulging occurred on the bottom surface, with no steel fibers being pulled out. During the stable crack development stage, new cracks continuously emerged while existing cracks expanded, leading to gradual bulging of the specimen’s bottom surface. Steel fibers were pulled out as the cracks developed, but no fiber breakage occurred. In the accelerated crack development stage, new cracks appeared less frequently, while the lengths of existing cracks expanded rapidly, with steel fibers only experiencing pull-out failure without any breakage. The failure mode was characterized by localized punching shear failure at the impact site, maintaining good specimen integrity, indicating a ductile failure mode.
For the specimens reinforced with both glass fiber textiles and steel fibers, as shown in Figure 6c,d, the G2SF1.0 and G3SF1.0 specimens exhibited similar behavior during the impact tests. The first two stages of failure in the glass fiber textile-reinforced specimens are identical to the single-doped steel fiber-reinforced specimens. In the accelerated crack development stage, new cracks appeared less frequently, but existing crack lengths expanded rapidly; in the G2SF1.0 specimen, the glass fiber textile experienced breakage, while no breakage occurred in the G3SF1.0 specimen. The failure mode was characterized by localized punching shear failure at the impact site, with good integrity maintained, indicating a ductile failure mode.
3.2.2. The Effect of Glass Fiber Volume on the Impact Resistance of the Specimen
As shown in Figure 7 and Table 6, with increasing glass fiber volume, both the initial crack impact number and the failure impact number correspondingly increased, with maximum values achieved at a glass fiber volume of 1.5%. The initial crack impact number of the 24GF1.5SF1.0 specimen is 2520 times, 0.73 times, and 0.67 times higher than that of CCP, SF1.0, and 24GF1.0SF1.0, respectively. The failure impact number of the 24GF1.5SF1.0 specimen is 7210 times, 2.41 times, and 1.20 times higher than that of CCP, SF1.0, and 24GF1.0SF1.0, respectively. The initial crack impact number of the 36GF1.5SF1.0 specimen is 3025 times, 2.28 times, and 0.3 times higher than that of CCP, SF1.0, and 36GF1.0SF1.0, respectively. The failure impact number of the 36GF1.5SF1.0 specimen is 7751 times, 2.66 times, and 0.88 times higher than that of CCP, SF1.0, and 36GF1.0SF1.0, respectively. This improvement can be attributed to the addition of increasing glass fiber volume in the specimens, which generated a spring-like cushioning effect through the interaction of steel fibers and glass fibers when subjected to impact loading, dissipating part of the impact energy and delaying the appearance of cracks. After the initial crack appeared, the steel and glass fibers bridging across the crack not only dissipated energy through the pull-out process but also prevented further crack propagation through a bridging effect. The higher the glass fiber volume, the more fibers span the cracks, resulting in better crack resistance.
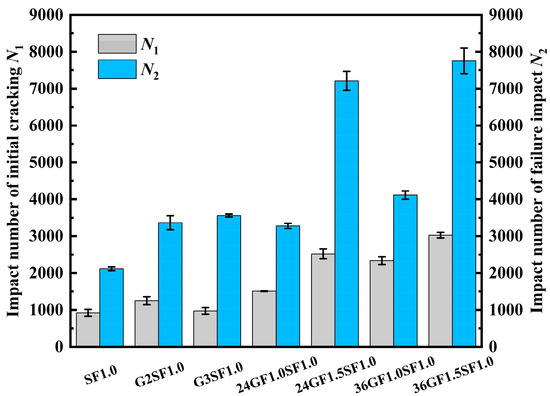
Figure 7.
Impact number diagram of specimens.
Table 6.
The impact test results of fiber-reinforced cementitious composite specimens.
3.2.3. The Effect of Short Glass Fiber Length on the Impact Resistance of the Specimen
Figure 7 and Table 6 show the effect of glass fiber length on the impact resistance of the specimen. With increasing lengths of glass fibers, both the initial cracking impact number and the failure impact number correspondingly increased, the maximum values for the initial cracking impact number and the failure impact number were achieved with the 36GF1.5SF1.0 specimens, which improved by 20% and 8%, compared to the 24GF1.5SF1.0 specimens, respectively. This can be attributed to the longer glass fibers being better at bridging macro-cracks, thereby increasing the impact resistance of the specimens.
3.2.4. The Effect of the Number of Glass Fiber Textile Layers on the Impact Resistance of the Specimen
From Figure 7 and Table 6, it can be observed that the impact resistance of the specimens increases with the number of layers of glass fiber textile, with a particularly notable enhancement in the failure impact number. The enhancement observed in G3SF1.0 is the highest, showing an increase of 3559 times, 0.68 times compared to the CCP and the SF1.0 specimens. This significant improvement is primarily attributed to the addition of glass fiber textiles and steel fibers, which help to distribute the impact force. The glass fiber textiles and steel fibers enhance the integrity of the matrix, and the bonding strength between the glass fiber textiles, steel fibers, and the matrix plays a crucial role. Additionally, the steel fibers can penetrate the textile pores, creating a “plugging” effect that delays matrix cracking and the propagation of cracks, thereby improving the impact resistance of the specimens.
3.2.5. Testing the Addition of the Same Volume Fraction of Glass Fiber Fabric and Glass Fiber to Compare the Impact Resistance of the Sample
At the same volume content, the relationship between the impact resistance of cement-based composite panels with glass fiber textiles and those with glass fibers is illustrated in Figure 7. At a fiber volume content of 1.0%, the failure impact numbers of the 24GF1.0SF1.0 and 36GF1.0SF1.0 specimens demonstrate a −2.7% change and 22% improvement, respectively, compared to G2SF1.0. When the volume content is 1.5%, the failure impact number for the 24GF1.5SF1.0 and 36GF1.5SF1.0 specimens improve by 103% and 118%, respectively, compared to the G3SF1.0. This improvement is attributed to the addition of longer glass fibers, which not only allow for a continuous overlapping distribution of glass fibers and steel fibers throughout the matrix, forming a network structure, but also indicate that the glass fiber textiles only reinforce the lower half of the specimens. The combination of long glass fibers and short steel fibers cooperatively enhanced the crack resistance of the specimens, leading to a greater improvement in impact resistance compared to specimens with added glass fiber textiles.
4. Impact Life and Damage Analysis Based on the Weibull Distribution
4.1. Distribution of the Impact Number
Due to the inherent heterogeneity of ECC materials, the experimentally obtained impact counts exhibit significant dispersion. Therefore, the Weibull distribution was employed to investigate the failure impact counts at different probability levels. Previous studies have indicated that the drop weight impact failure of specimens exhibits a similar failure mechanism to that of bending fatigue. The relevant literature [29] suggests that the impact number of the specimens follows a Weibull distribution, and the probability density function and distribution function can be expressed as [30] Equations (3) and (4):
where is the shape parameter, is the scale parameter, is the location parameter, is the impact resistance number of the specimens, and the conditions are > 0, > , and .
The survival probability of the specimens when the impact number exceeds can be calculated using Equation (5):
The location parameter in three-parameter Weibull distributions often introduces statistical uncertainty when modeling early-stage damage. To consider the stability and reliability of the specimens during usage, the three-parameter Weibull distribution is simplified to a two-parameter Weibull distribution. The distribution equation is simplified as follows in Equations (6) and (7):
Through equation transformation, we obtain Equation (8):
; we obtain Equation (9):
where and exhibit an approximately linear relationship. Linear regression analysis was utilized to determine the values of parameters and and the correlation coefficient R2. A larger R2 indicates a good fit of the data, suggesting that the results conform to a two-parameter Weibull distribution.
The survival probability of the specimens can be calculated using Equation (10):
where denotes the index of a set of experimental data arranged in ascending order, where ( = 1, 2, 3, …, ), and represents the total number of samples in each group. In this test, is set to 3.
Figure 8 shows the Weibull distribution fitting curves for the initial crack impact numbers and the failure impact numbers of various specimen groups. Table 7 presents the Weibull distribution linear fitting parameters for the impact resistance data.
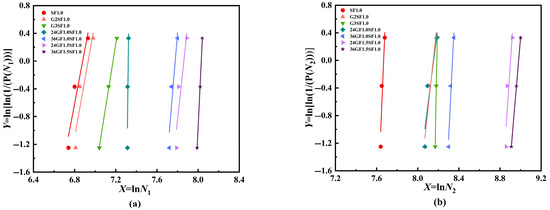
Figure 8.
Linear fitting of Weibull distribution: (a) impact number of the initial cracking and (b) impact number of the failure impact .
Table 7.
Weibull distribution linear fitting parameters of impact number.
From Table 7, it can be observed that the linear fit R2 for the impact numbers of fiber-reinforced specimens ranges from 0.8239 up to 0.9999. All samples have R2 values exceeding 0.8, indicating that the mathematical model possesses sufficient reliability [31]. The reliability model proposed by Rahmani et al. [32] indicates a strong linear relationship between and As shown in Figure 8, the experimental data points for the impact numbers of various specimen groups are distributed on a straight line, demonstrating that the two-parameter Weibull distribution accurately characterizes the impact numbers of fiber-reinforced specimens.
4.2. Impact Damage Evolution Equation
Many researchers utilize the Weibull distribution damage evolution model, a statistical damage model [33,34]. Equations (11)–(13):
The statistical laws governing the damage variable and variable are as follows [35]:
where is the shape parameter, and is the scale parameter.
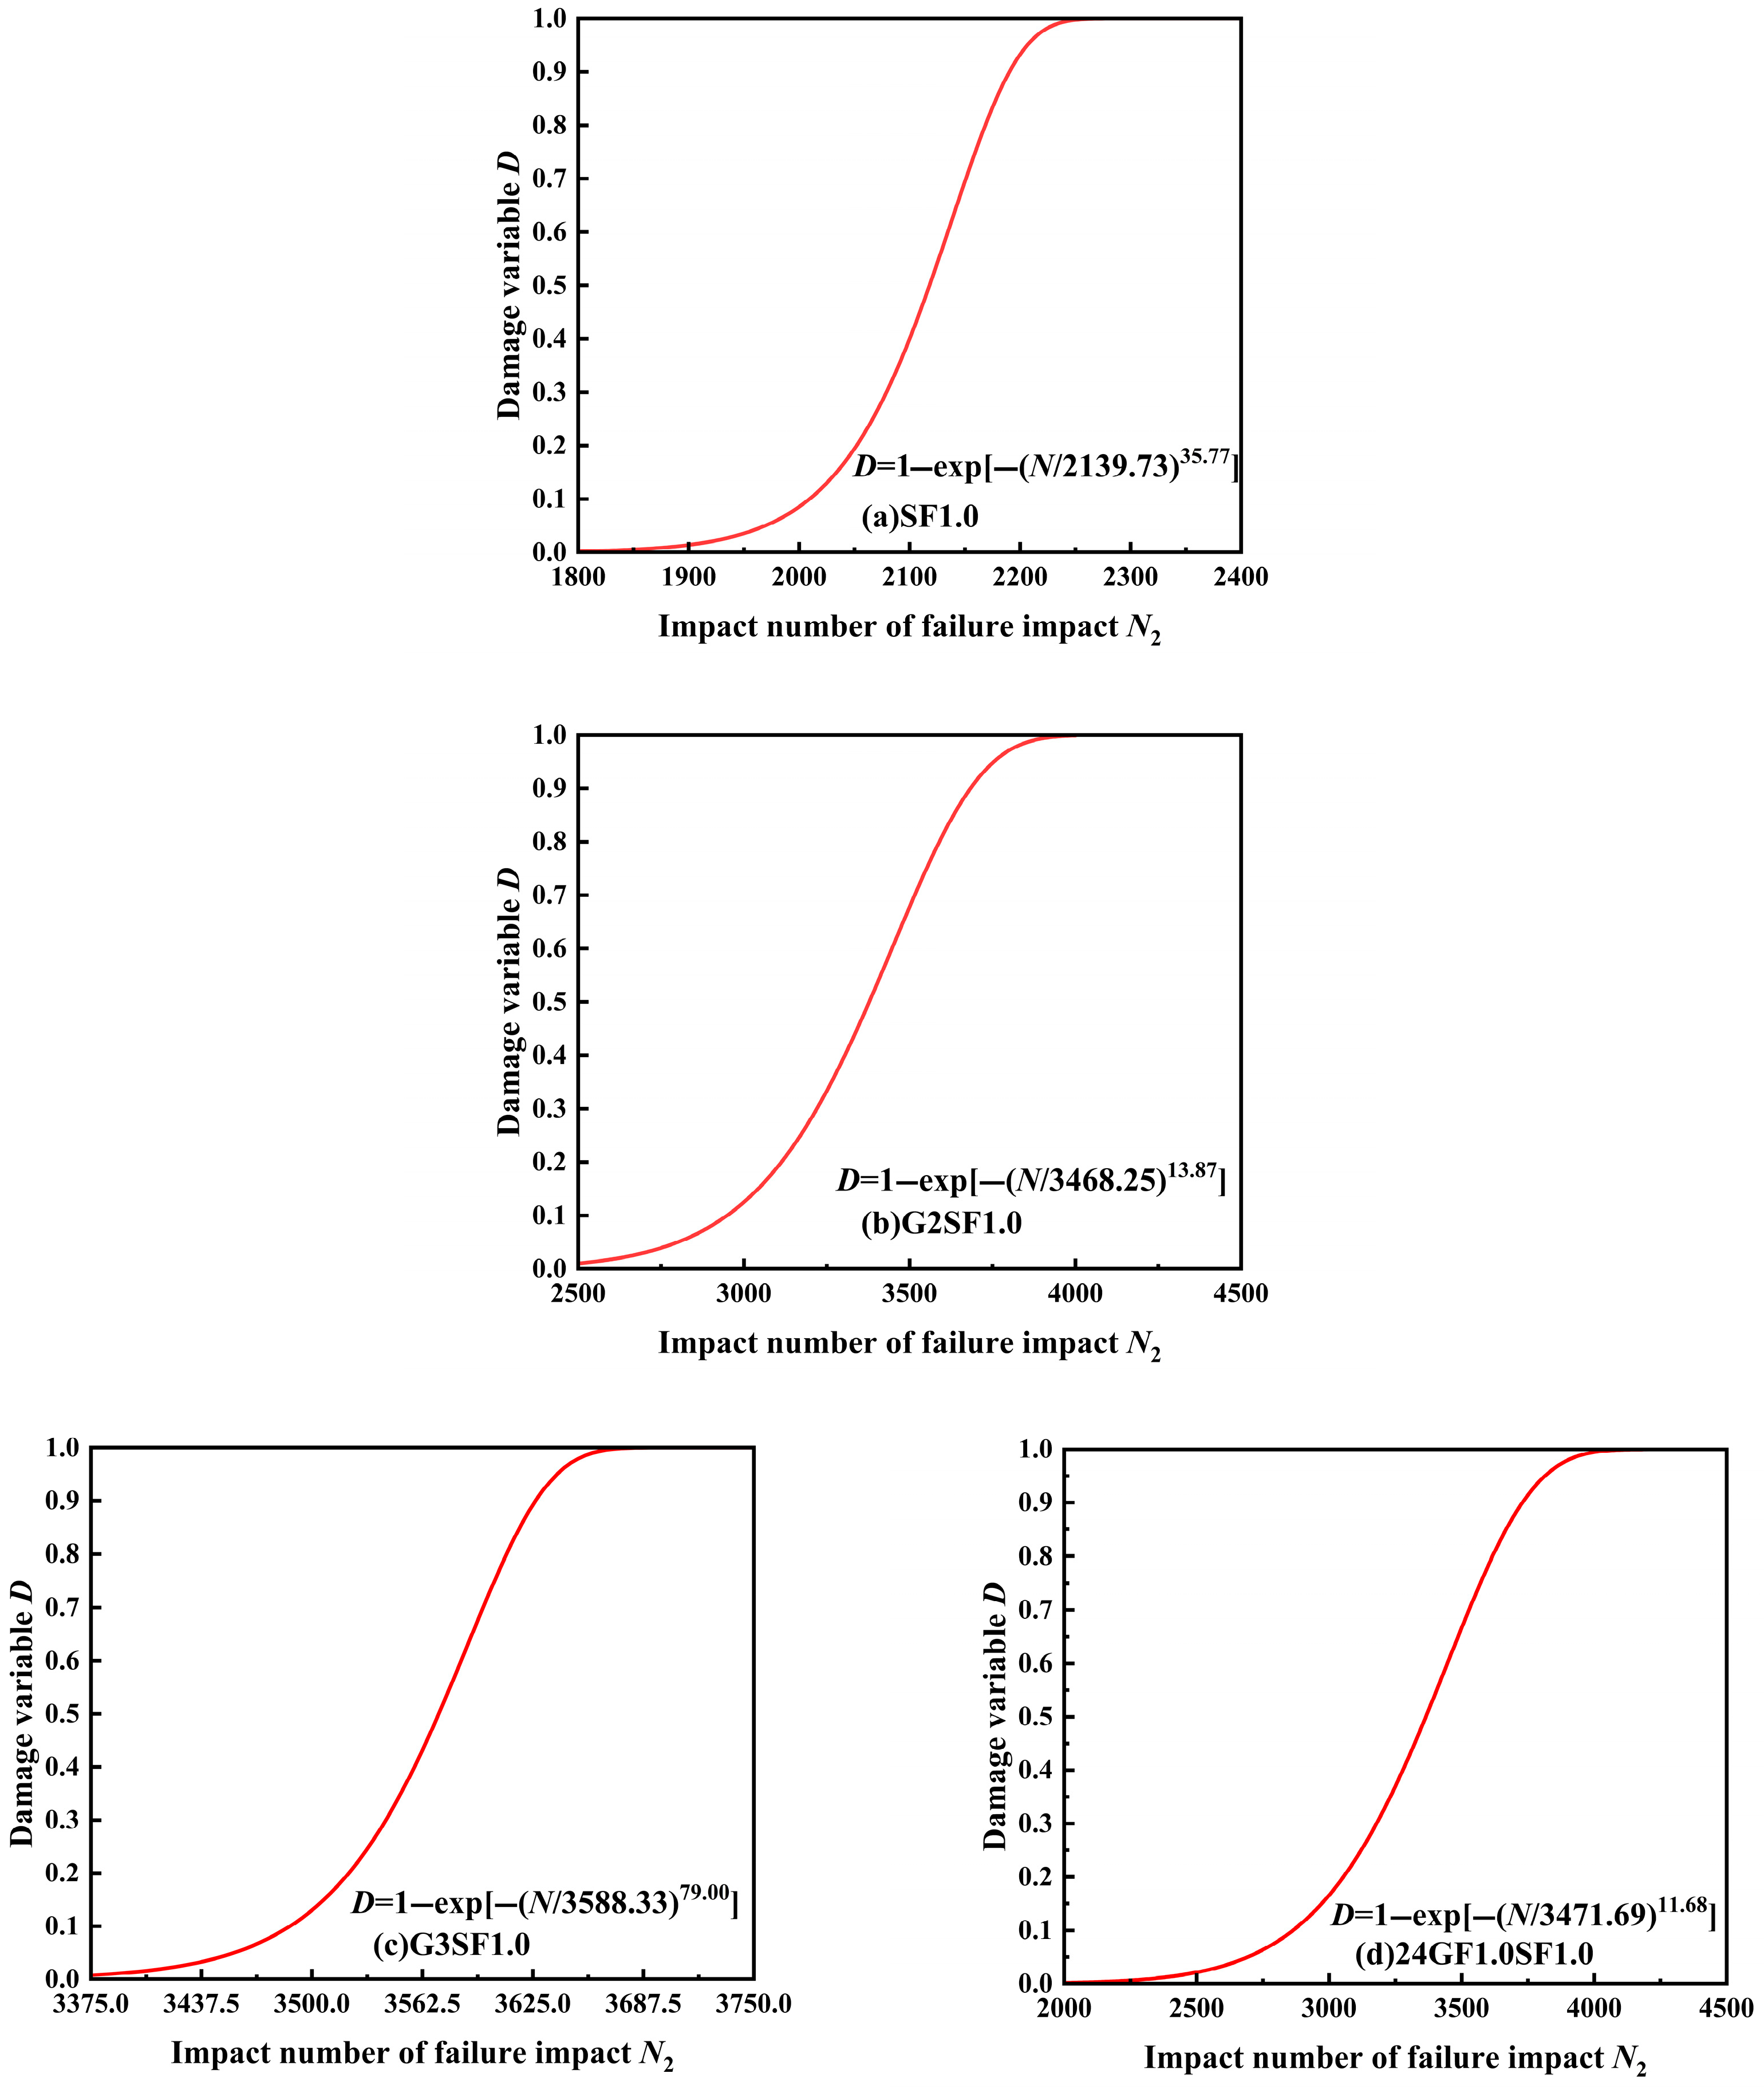
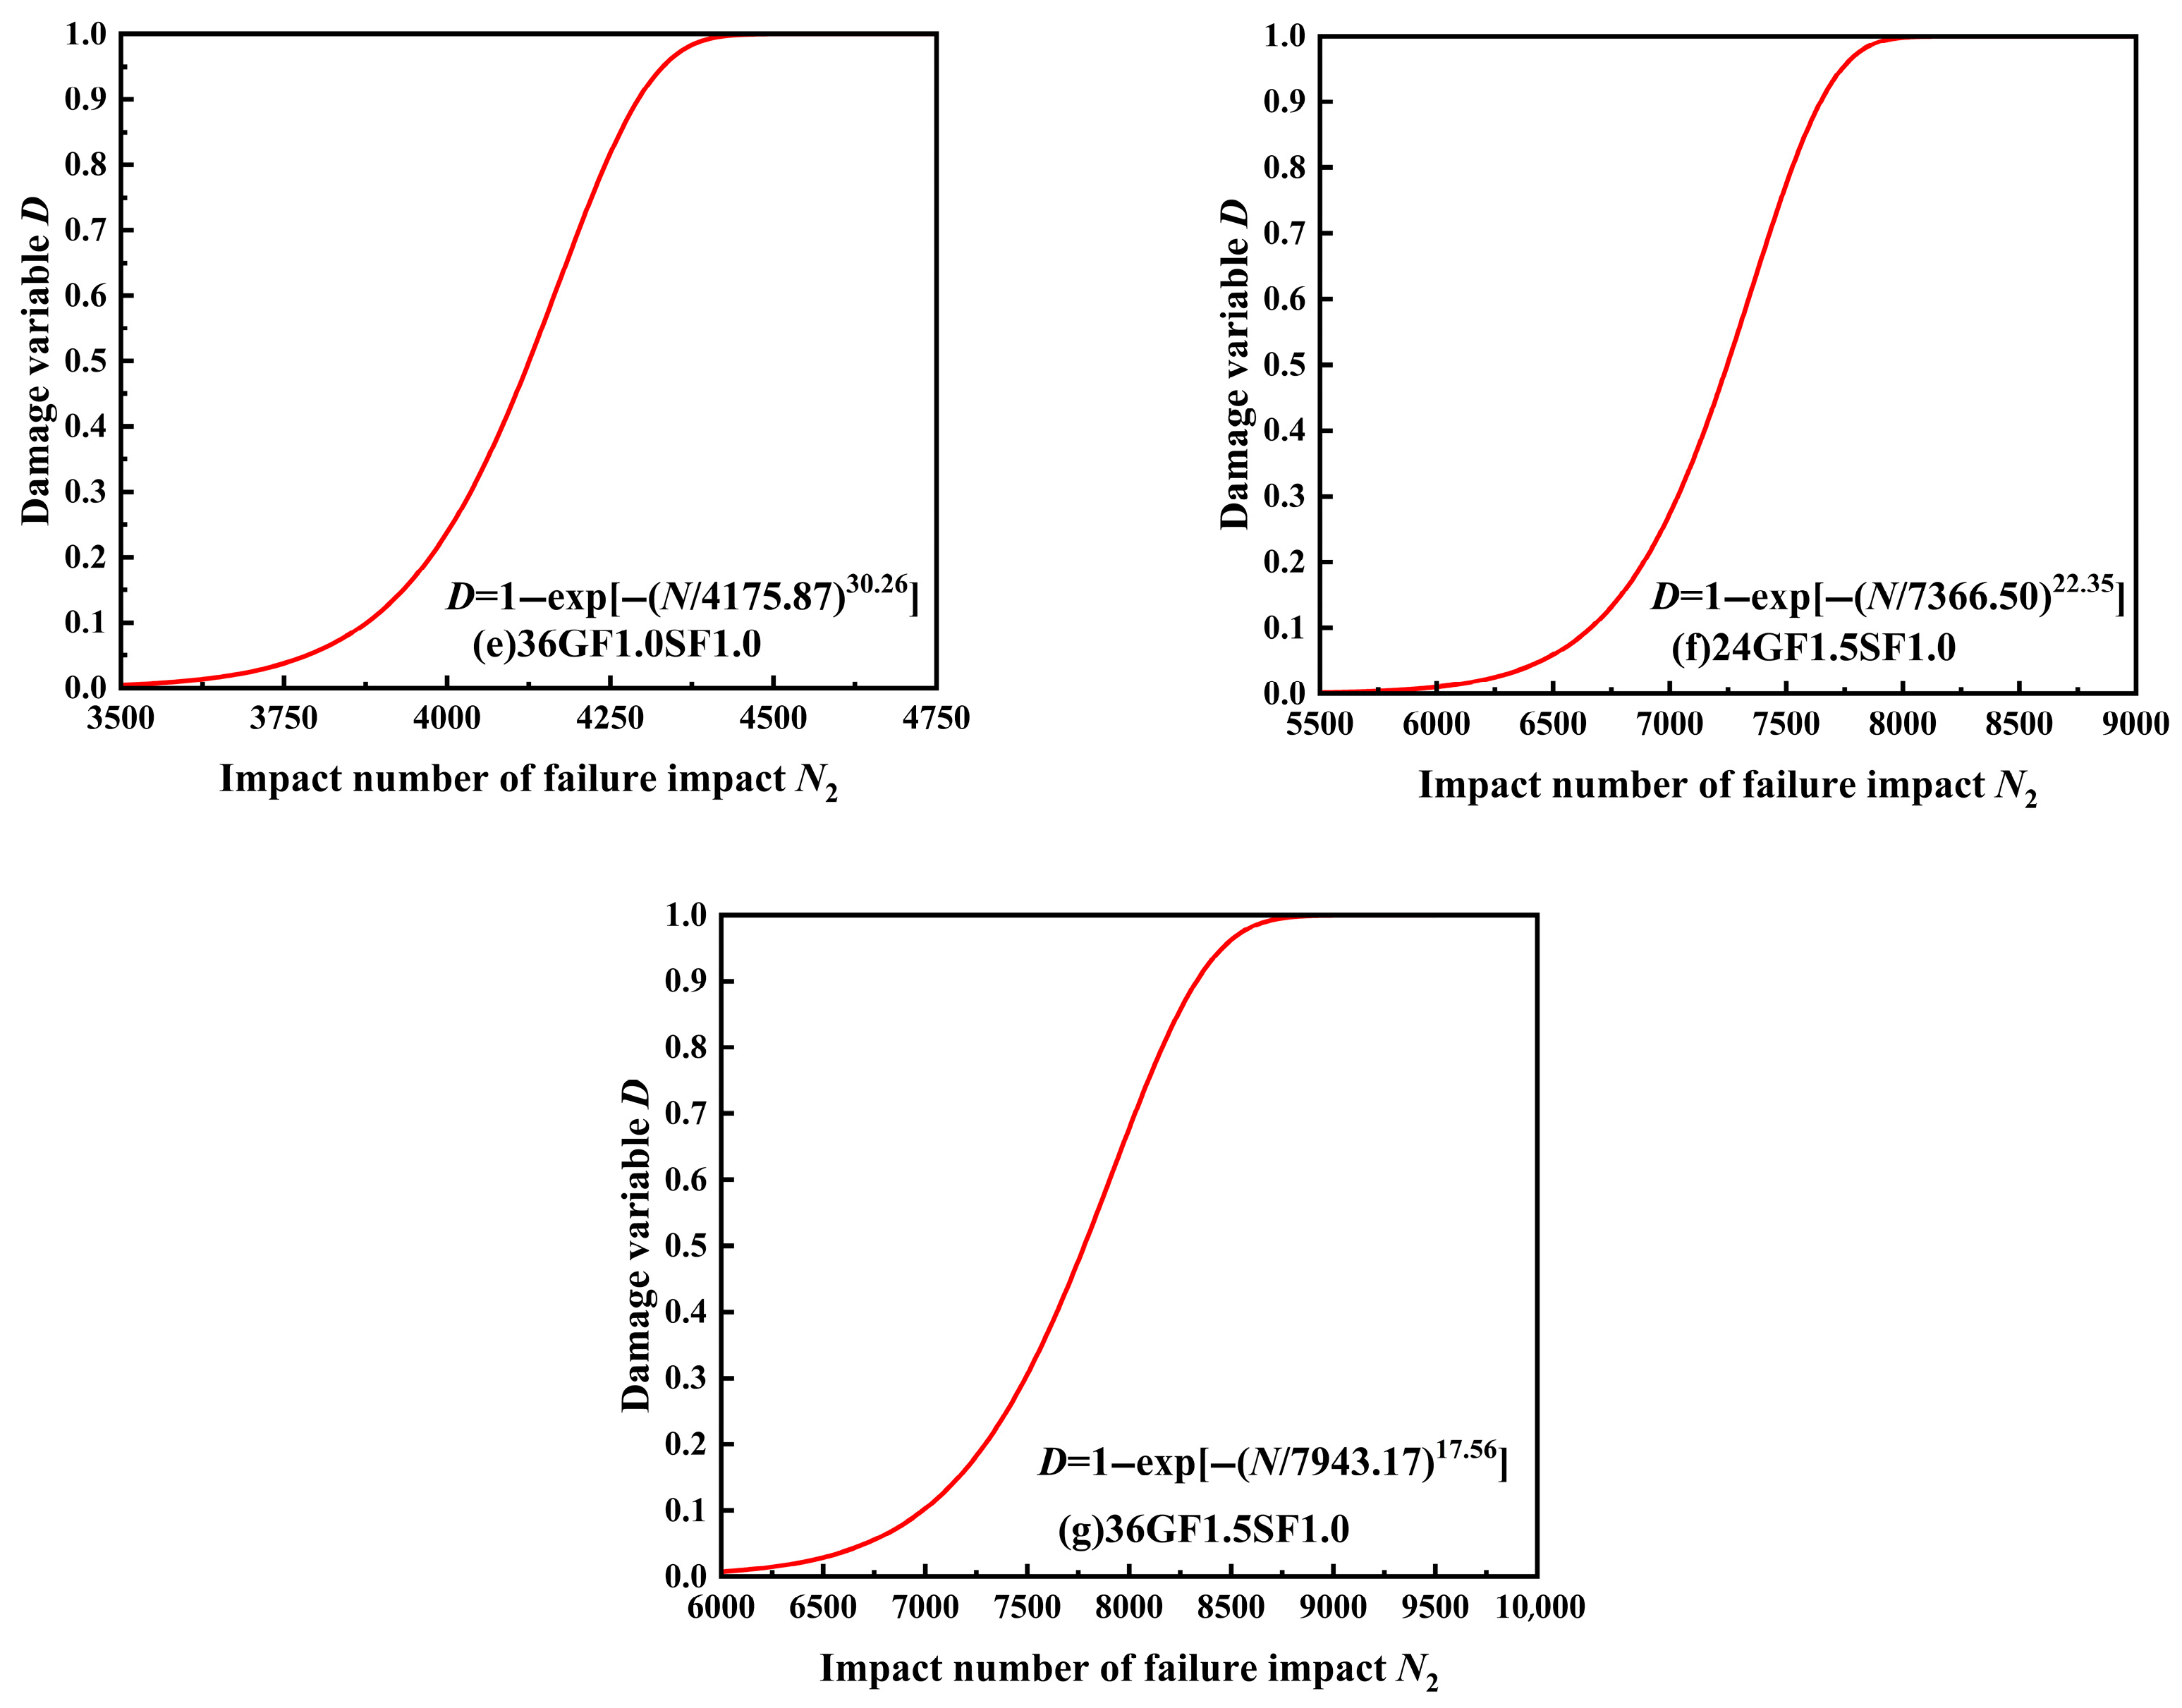
Using Equations (9), (11), and (13), combined with Table 7, the damage evolution equation of specimen failure impact life was established and the damage evolution diagrams for each group of specimens were plotted, as shown in Figure 9.
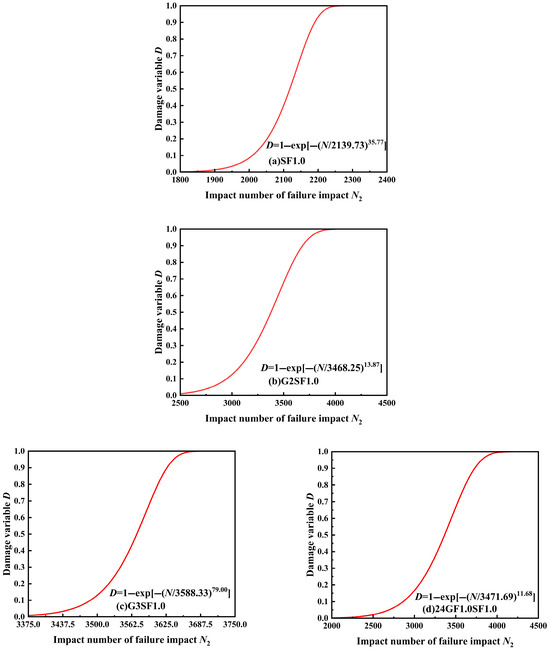

Figure 9.
Evolution diagram of impact damage evolution.
For the same damage variable , the failure impact numbers for different glass fiber textile layers and glass fiber volumes were calculated, with the results displayed in Table 8.
Table 8.
The impact number of the failure impact corresponds to each damage variable of specimens.
From Table 8, it can be observed that for the same value, the impact resistance of the specimens increases with the increase in glass fiber volume. Specifically, at = 0.9, the failure impact number for the 24GF1.0SF1.0 and 24GF1.5SF1.0 specimens improved by 70% and 249%, compared to the SF1.0 specimen, respectively. For the 36GF1.0SF1.0 and 36GF1.5SF1.0 specimens, the failure impact number increased by 96% and 280%, compared to the SF1.0 specimen, respectively. This suggests that incorporating longer glass fibers is more beneficial for enhancing the impact resistance of the specimens, consistent with the analysis results in Section 3.2.3.
From Table 8, at = 0.9, it is also evident that the failure impact numbers for the 24GF1.5SF1.0 and 36GF1.5SF1.0 specimens are enhanced by 111% and 130%, respectively, compared to the G3SF1.0 specimen. The above analysis indicates that adding longer glass fibers or short glass fibers yields better improvements in the impact resistance of the specimens than adding glass fiber textiles, which aligns with the analysis results in Section 3.2.5.
The damage evolution model based on the Weibull distribution can predict the impact life under different failure probabilities, and the use of this model can effectively save time. The two-parameter Weibull distribution derived from drop weight impact tests holds significant application value in the construction industry.
5. Conclusions
In this study, drop weight impact tests are employed to investigate the impact resistance and failure modes of specimens. Based on the findings, the following conclusions can be drawn:
- High-modulus fibers dissipate more impact energy under the same deformation compared to low-modulus fibers, leading to better utilization of the spring effect and restraining crack propagation. As a result, the failure mode of the fiber-reinforced specimens in this experiment is characterized by localized punching shear damage occurring only in the impacted site, without the specimen fracturing into multiple pieces.
- The impact resistance of specimens increases with the increase in glass fiber volume fraction, length, and the number of textile layers. A specimen combined with 1.5 vol% 36 mm length glass fibers and 1.0 vol% steel fibers exhibited ultra-high impact resistance, achieving a failure impact energy of 114 kJ.
- At the same volume fraction, compared with the combination of glass fiber textile and steel fiber, the combination of glass fiber and steel fiber can better improve the impact resistance of the specimen. This is because glass fibers and steel fibers form a network structure in the matrix, while the glass fiber textile only reinforces the lower part of the specimen.
- The damage evolution equation established based on a two-parameter Weibull distribution accurately describes the distribution characteristics of the impact numbers of fiber reinforced specimens, guiding structural design under different failure probabilities.
Author Contributions
Z.D.: Writing—Original Draft, Investigation, Methodology. D.L.: Writing—Review and Editing. All authors have read and agreed to the published version of the manuscript.
Funding
The study was supported by the Beijing Natural Science Foundation for Distinguished Young Scholars (Project Title: Service Performance Enhancement and Intelligent Monitoring of Existing Urban Bridges for City Renewal; Duration: 2023–2026; Grant No.: JQ23036).
Data Availability Statement
The raw data supporting the conclusions of this article will be made available by the authors on request.
Conflicts of Interest
The authors declare that they have no known competing financial interests or personal relationships that could have appeared to influence the work reported in this paper.
References
- Al-Gemeel, A.N.; Zhuge, Y.; Youssf, O. Experimental investigation of basalt textile reinforced engineered cementitious composite under apparent hoop tensile loading. J. Build. Eng. 2019, 23, 270–279. [Google Scholar] [CrossRef]
- Yu, K.Q.; Wang, Y.C.; Yu, J.T.; Xu, S.L. A strain-hardening cementitious composites with the tensile capacity up to 8%. Constr. Build. Mater. 2017, 137, 410–419. [Google Scholar] [CrossRef]
- Yu, J.; Leung, C.K.Y. Strength improvement of strain-hardening cementitious composites with ultrahigh-volume fly ash. J. Mater. Civ. Eng. 2017, 9, 05017003. [Google Scholar] [CrossRef]
- Lu, C.; Yu, J.; Leung, C.K.Y. Tensile performance and impact resistance of strain hardening cementitious composites (SHCC) with recycled fibers. Constr. Build. Mater. 2018, 171, 566–576. [Google Scholar] [CrossRef]
- Huang, B.T.; Zhu, J.X.; Weng, K.F.; Li, V.C.; Dai, J.G. Ultra-high-strength engineered/strain-hardening cementitious composites (ECC/SHCC): Material design and effect of fiber hybridization. Cem. Concr. Res. 2022, 129, 104464. [Google Scholar] [CrossRef]
- Yu, K.Q.; Zhu, W.J.; Ding, Y.; Lu, Z.D.; Yue, J.T.; Xiao, J.Z. Micro-structural and mechanical properties of ultra-high performance engineered cementitious composites (UHP-ECC) incorporation of recycled fine powder (RFP). Cem. Concr. Res. 2019, 124, 125–134. [Google Scholar] [CrossRef]
- Zhou, J.; Qian, S.Z.; Beltran, M.G.S.; Ye, G.; Breugel, K.; Li, V.C. Development of engineered cementitious composites with limestone powder and blast furnace slag. Mater. Struct. 2010, 6, 803–814. [Google Scholar] [CrossRef]
- Zhang, Y.J.; Wang, Y.C.; Xu, D.L.; Li, S. Mechanical performance and hydration mechanism of geopolymer composite reinforced by resin. Mater. Sci. Eng. A 2010, 527, 24–25. [Google Scholar] [CrossRef]
- Akcay, B. Experimental investigation on uniaxial tensile strength of hybrid fibre concrete. Compos. Part B Eng. 2012, 2, 766–778. [Google Scholar] [CrossRef]
- Li, V.C. Tailoring ECC for special attributes: A review. Int. J. Concr. Struct. Mater. 2012, 3, 135–144. [Google Scholar] [CrossRef]
- Singh, M.; Saini, B.; Chalak, H.D. Performance and composition analysis of engineered cementitious composite (ECC)—A review. J. Build. Eng. 2019, 26, 100851. [Google Scholar] [CrossRef]
- Liao, Q.; Su, Y.R.; Yu, J.T.; Yao, Q.Y.; Meng, D.; Yu, K.Q. Experimental and theoretical investigation on compression-shear properties of high-strength engineered cementitious composites (HS-ECC). J. Build. Eng. 2023, 67, 106015. [Google Scholar] [CrossRef]
- Xu, S.L.; Cai, X.R. Experimental study and theoretical models on compressive properties of ultrahigh toughness cementitious composites. J. Mater. Civ. Eng. 2010, 10, 1067–1077. [Google Scholar] [CrossRef]
- Ding, Z.D.; Wen, J.C.; Li, X.Q.; Fu, J.; Ji, X.F. Mechanical behaviour of polyvinyl alcohol-engineered cementitious composites (PVA-ECC) tunnel linings subjected to vertical load. Tunneling Undergr. Space Technol. 2020, 95, 103151. [Google Scholar] [CrossRef]
- Maalej, M.; Quek, S.T.; Zhang, J. Behavior of hybrid-fiber engineered cementitious composites subjected to dynamic tensile loading and projectile impact. J. Mater. Civ. Eng. 2005, 2, 143–152. [Google Scholar] [CrossRef]
- Li, Q.H.; Zhao, X.; Xu, S.L.; Gao, X. Influence of steel fiber on dynamic compressive behavior of hybrid fiber ultra high toughness cementitious composites at different strain rates. Constr. Build. Mater. 2016, 125, 490–500. [Google Scholar] [CrossRef]
- Zhu, D.; Mobasher, B.; Rajan, S.D. Non-contacting strain measurement for cement-based composites in dynamic tensile testing. Cem. Concr. Compos. 2012, 2, 147–155. [Google Scholar] [CrossRef]
- Truong, V.D.; Noh, H.W.; Kim, D.J. Effects of adding short fibers on impact resistance of glass textile reinforced cementitious composites under direct tension. Constr. Build. Mater. 2023, 379, 131220. [Google Scholar] [CrossRef]
- Heravi, A.A.; Fuchs, A.; Gong, T. Mechanical characterization of textile reinforced cementitious composites under impact tensile loading using the split Hopkinson tension bar. Cem. Concr. Compos. 2020, 114, 103769. [Google Scholar] [CrossRef]
- Truong, V.D.; Noh, H.W.; Kim, D.J. Rate-sensitive tensile resistance of glass textile reinforced cementitious composites. Constr. Build. Mater. 2022, 360, 129553. [Google Scholar] [CrossRef]
- Liu, S.; Zhu, D.; Ou, Y. Impact response of basalt textile reinforced concrete subjected to different velocities and temperatures. Constr. Build. Mater. 2018, 175, 381–391. [Google Scholar] [CrossRef]
- Zeng, X.D. Research on impact resistance of modified bamboo fiber cement-based composites. Cent. South Univ. For. Technol. 2022, 12, 000344. [Google Scholar]
- Wang, D.H.; Ju, Y.Z.; Shen, H.; Xu, L.B. Mechanical properties of high performance concrete reinforced with basalt fiber and polypropylene fiber. Constr. Build. Mater. 2019, 197, 464–473. [Google Scholar] [CrossRef]
- Fu, Q.; Niu, D.T.; Zhang, J.; Huang, D.G.; Hong, M.S. Impact response of concrete reinforced with hybrid basalt-polypropylene fibers. Powder Technol. 2018, 326, 411–424. [Google Scholar] [CrossRef]
- Lin, J.X.; Song, Y.; Xie, Z.H.; Guo, Y.C.; Yuan, B.; Zeng, J.J.; Wei, X. Static and dynamic mechanical behavior of engineered cementitious composites with PP and PVA fibers. J. Build. Eng. 2020, 29, 101097. [Google Scholar] [CrossRef]
- CECS 13-2009; Standard Test Methods for Fiber Reinforced Concrete. CECS: Beijing, China, 2009.
- JC/T 2461-2018; MIIT Standard Test Method for the Mechanical Properties of Ductile Fiber Reinforced Cementitious Composites. MIIT: Beijing, China, 2018.
- ACI544.2R-89; American Concrete Institute Measurement of Properties of Fiber Reinforced Concrete. American Concrete Institute: Farmington Hills, MI, USA, 1989.
- Singh, S.P.; Kaushik, S.K. Flexural fatigue life distributions and failure probability of steel fibrous concrete. ACI Mater. J. 2000, 6, 658–667. [Google Scholar]
- Chen, X.D.; Liu, Z.H.; Guo, S.S.; Huang, Y.B.; Xu, W.L. Experimental study on fatigue properties of normal and rubberized self-compacting concrete under bending. Constr. Build. Mater. 2019, 205, 10–20. [Google Scholar] [CrossRef]
- Asrani, N.P.; Murali, G.; Parthiban, K. A feasibility of enhancing the impact resistance of hybrid fibrous geopolymer composites: Experiments and modelling. Constr. Build. Mater. 2019, 203, 56–68. [Google Scholar] [CrossRef]
- Rahmani, T.; Kiani, B.; Shekarchi, M.; Safari, A. Statistical and experimental analysis on the behavior of fiber reinforced concretes subjected to drop weight test. Constr. Build. Mater. 2012, 37, 360–369. [Google Scholar] [CrossRef]
- Chang, T.P. Performance comparison of six numerical methods in estimating weibull parameters for wind energy application. Appl. Energy 2011, 1, 272–282. [Google Scholar] [CrossRef]
- Murali, G.; Abid, S.R.; Karthikeyan, K.; Haridharan, M.K.; Amran, M.; Siva, A. Low-velocity impact response of novel prepacked expanded clay aggregate fibrous concrete produced with carbon nano tube, glass fiber mesh and steel fiber. Constr. Build. Mater. 2021, 284, 122749. [Google Scholar] [CrossRef]
- Mahesh, S.; Phoenix, S.L.; Beyerlein, I.J. Strength distributions and size effects for 2D and 3D composites with weibull fibers in an elastic matrix. Int. J. Fract. 2002, 1, 41–85. [Google Scholar] [CrossRef]


Disclaimer/Publisher’s Note: The statements, opinions and data contained in all publications are solely those of the individual author(s) and contributor(s) and not of MDPI and/or the editor(s). MDPI and/or the editor(s) disclaim responsibility for any injury to people or property resulting from any ideas, methods, instructions or products referred to in the content. |
© 2025 by the authors. Licensee MDPI, Basel, Switzerland. This article is an open access article distributed under the terms and conditions of the Creative Commons Attribution (CC BY) license (https://creativecommons.org/licenses/by/4.0/).