Article

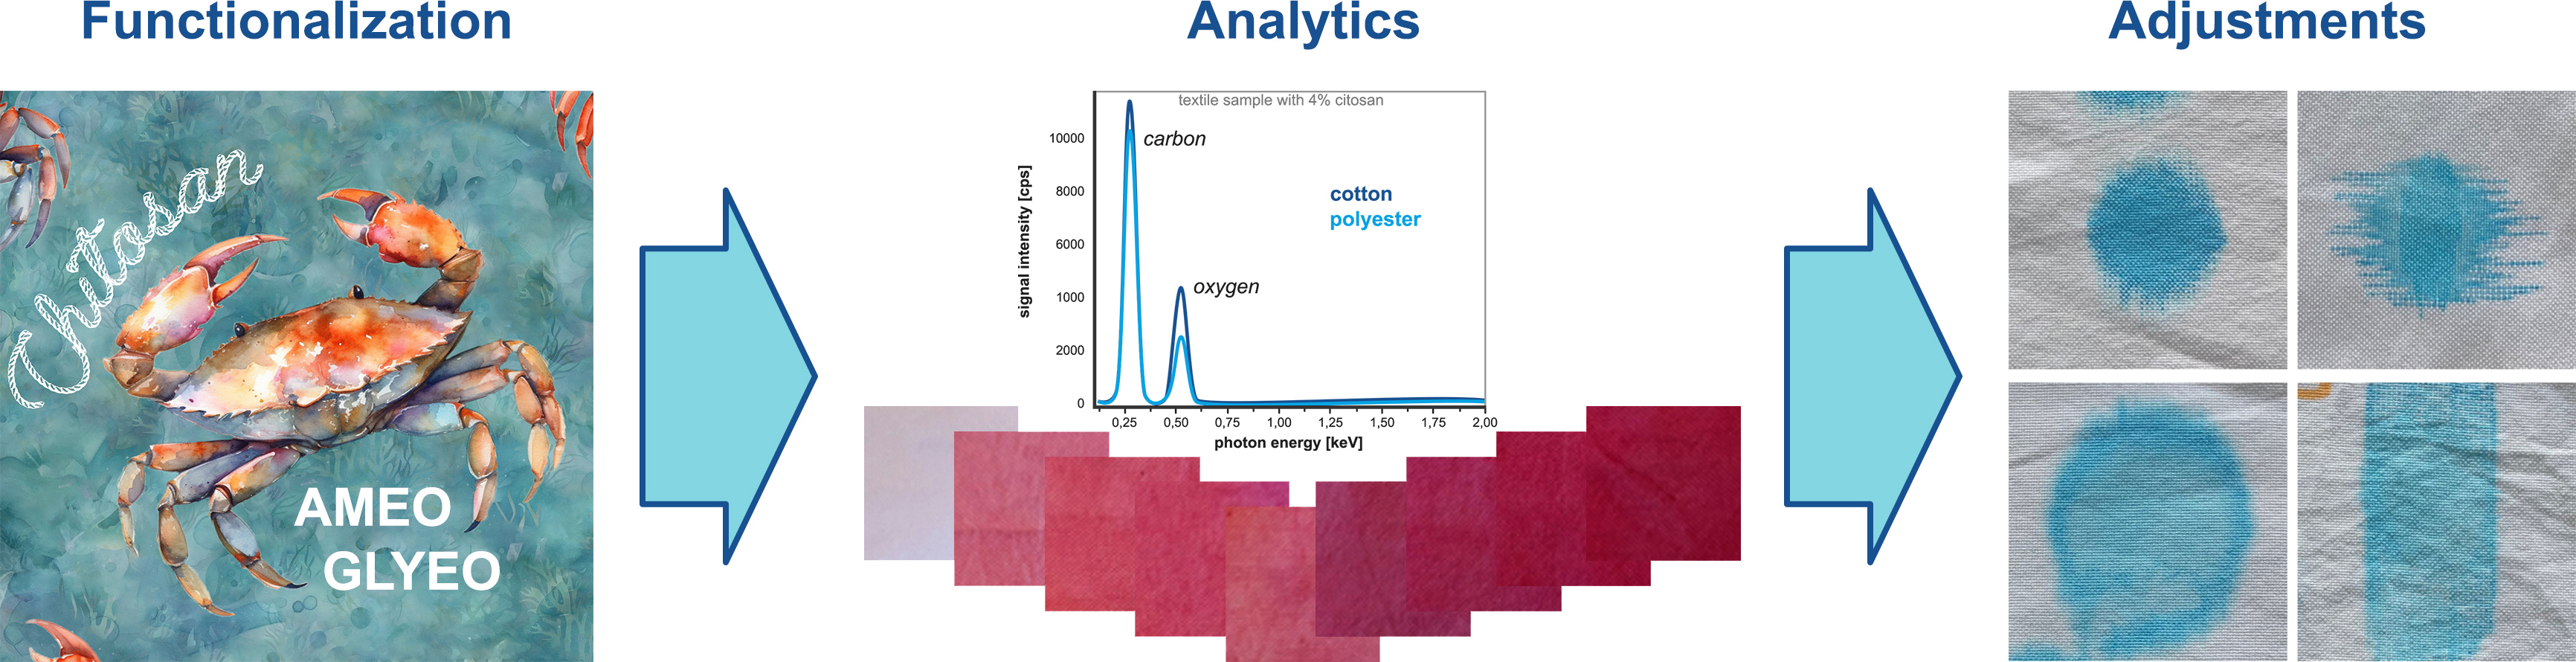
Functionalization of Technical Textiles with Chitosan

1
Research Institute for Textile and Clothing, Niederrhein University of Applied Sciences (FTB), 41065 Mönchengladbach, Germany
2
Faculty of Textile and Clothing Technology, Niederrhein University of Applied Sciences, 41065 Mönchengladbach, Germany
*
Author to whom correspondence should be addressed.
Textiles 2024, 4(1), 70-90; https://doi.org/10.3390/textiles4010006
Submission received: 27 October 2023 / Revised: 9 January 2024 / Accepted: 22 January 2024 / Published: 15 February 2024

Abstract

:
Textiles are used for many different applications and require a variety of properties. Wet functionalization improve textiles’ properties, such as hydrophilicity or antimicrobial activity. Chitosan is a bio-based polymer widely investigated in the textile industry for this purpose. A weaving comprising a cotton/polyester mix and a pure-polyester weaving was functionalized with different concentrations of chitosan to determine the most robust method for chitosan detection in both cotton- and polyester-containing materials. Additionally, mixtures of chitosan with 3-glycidyloxypropyltriethoxy silane (GLYEO) or 3-aminopropyltriethoxy silane (AMEO) were applied in a one-step or two-step procedure on the same fabrics. Scanning electron microscopy (SEM) combined with energy-dispersive X-ray spectroscopy (EDS) and dyeing with Remazol Brilliant Red F3B demonstrated the presence of chitosan and silanes on the textiles’ surfaces. While non-functionalized textiles were not stained, the dependency of the dyeing depths on the chitosan concentrations enabled us to infer the efficacy of the very short processing time and a mild dyeing temperature. The one-step application of AMEO and chitosan resulted in the highest presence of silicon on the textile and the greatest color intensity. The functionalization with GLYEO reduced the water sink-in time of polyester, while chitosan-containing solutions increased the hydrophobicity of the material. Washing experiments demonstrated the increasing hydrophilicity of the cotton/polyester samples, independent of the type of functionalization. These experiments show that chitosan-containing recipes can be used as part of a useful method, and the type of functionalization can be used to adjust the hydrophilic properties of polyester and cotton/polyester textiles. Via this first step, in the future, new combinations of bio-based polymers with inorganic binder systems can be developed, ultimately leading to sustainable antimicrobial materials with modified hydrophilic properties.

Graphical Abstract

1. Introduction

The functionalization of textiles generally refers to all processes used to add new functional properties to a textile substrate [1]. These functional properties can be related to totally different fields, e.g., flame retardant, antimicrobial activity, UV protection, or hydrophilic or hydrophobic properties [2,3,4,5]. One main method used to realize functionalization is wet chemical processing, by which a chemical component or an additive with a certain functional property is applied to a textile fabric that does not have this specific property.
A current trend is the use of bio-based and sustainable chemicals [6,7,8]. To make textile processes more environmentally friendly, it is possible to use bio-based polymers for functionalization. One bio-based polymer that has been evaluated for textile treatments is chitosan [9,10,11,12], which is derived from the biopolymer chitin via a deacetylation process. Chitin sourced from insects or crustaceans is a widely available raw material [13,14]. The deacetylation of chitin results in the formation of primary amino groups in the polymer structure of chitosan. The proportion of acetyl groups to amino groups (that is, the “degree of deacetylation” (DD)) and the molecular weight significantly influence the chemical and physical properties of chitosan, such as its solubility, viscosity and biological function [15]. Chitosan has been investigated as an agent for use in textile treatments for decades [16,17]. Special interest has been placed on chitosan because of its antimicrobial properties [10,18]. Using this method, bio-based antimicrobial properties can be realized. However, antistatic, hydrophilic or hydrophobic modifications of textile fabrics can be realized by applying chitosan, too [19,20]. In pure water, chitosan is not soluble. However, it is soluble in acidic solutions due to the protonation of the amino groups -NH2 leading to charged -NH3+ units [21,22]. Because of this, many applications using chitosan in textiles simply dissolve chitosan in acidic solutions. However, chitosan not only influences the properties mentioned above, but also affects the dyeing behavior of cotton [12,23] or polyester [24,25] textiles. The dyeing of cotton with direct dyes or reactive dyes in neutral or slightly alkaline solutions works very well, while polyester is commonly dyed with disperse dyes at high temperatures [26,27]. The effects of chitosan on the dyeing behavior of textiles have here been utilized to establish a robust method for detecting chitosan in both a cotton/polyester mix and pure polyester fabrics, and additionally, a comparison with spectroscopic methods (scanning electron microscopy (SEM) and energy dispersive spectroscopy (EDS)) was conducted.
Besides this simple approach of using chitosan for textile functionalization, it is of interest to modify chitosan applications via the addition of hydrolyzed alkoxysilane components [19]. Alkoxysilane components can be used as precursors in sol–gel processes, and also in combination with chitosan, as reported previously [18]. In contrast, in the present study, only amino- and epoxy-functionalized trialkoxy silanes have been used in combination with chitosan for textile treatments. PES and CO/PES woven fabrics for use in technical textiles have been functionalized with chitosan and two alkoxy silane components—3-aminoproplytriethoxy silane (AMEO) and 3-glycidyloxypropyltriethoxy silane (GLYEO). Analyses of the textiles’ surfaces and the determination of changes in their properties caused by the functionalization were performed. In this way, the washing fastness of textiles with chitosan applied on their surfaces could be improved due to the adhesive effects of a silica-based binder system.
Finally, a proof of concept was achieved by endowing the alkoxy silane components with the properties and washing stability of chitosan, allowing textile substrates to be modified. A new combination of a bio-based polymer and an inorganic binder system can be developed to create sustainable antimicrobial materials with modified hydrophilic properties.

2. Materials and Methods

2.1. Textiles

Polyester (PES) and cotton/polyester mix (CO/PES) woven materials, delivered by an industrial partner (Wenzel & Hoos GmbH, Lauterbach, Germany), were used as received. The cotton/polyester blended material contained a ratio of around 80% cotton and 20% polyester mixed in the yarns. Table 1 gives information about the textiles’ parameters.

2.2. Textile Finishing

Textiles were finished with chitosan solutions in different concentrations and with silane/chitosan mixtures in a one-step or two-step procedure.

2.2.1. Chitosan Dispersion

For the functionalization of textiles with chitosan solutions, chitosan (ChD; 90% DD; BioLog Heppe GmbH, Landsberg, Germany) was diluted in a warm solution (60 °C) of acetic acid (1 or 2%, prepared from 100% acetic acid, VWR International GmbH, Darmstadt, Germany) by intensive stirring with a magnetic stirrer (Carl Roth GmbH & Co. KG, Karlsruhe, Germany) for approx. 30 min. The homogeneous chitosan solution was applied by padding twice with a padding machine (Ernst Benz, Rümlang-Zurich, Switzerland or Wichelhaus GmbH & Co. KG, Solingen, Germany). Afterwards, textiles were dried in an oven at 130 °C for five minutes and condensed at 170 °C for one minute. For each sample, the liquor pickup during functionalization was determined by weighing the dry, non-functionalized sample and the wet, functionalized samples, as described elsewhere [28].

2.2.2. Silane Hydrolyzation

Silanes (3-glycidyloxypropyltriethoxy silane (GLYEO) or 3-aminopropyltriethoxy silane (AMEO)) were purchased from ABCR GmbH (Karlsruhe, Germany) and hydrolyzed before usage. For this, one part of ethanol (99.7% + MEK, AnalytiChem GmbH, Duisburg, Germany) was placed in a glass beaker, and then one part of AMEO or GLYEO was added. Additionally, one part of acetic acid (50%) was added under intensive stirring (ethanol:silane:acetic acid = 1:1:1 v/v/v). The mixtures were stirred for 30 min at room temperature until a one-phase, homogeneous solution (hydrolyzate) was obtained. A 2% diluted silane solution was prepared in water from this mixture for further use.

2.2.3. One-Step Procedure for Application of Chitosan and Silane

For the one-step finishing procedure, 46.5 mL diluted acetic acid (2%), 3 mL silane hydrolyzate, and 0.5 g chitosan powder were mixed in a beaker and stirred for 30 min at 60 °C. Afterwards, this solution was applied by padding and the treated textiles were dried as described above.

2.2.4. Two-Step Procedure for Application of Chitosan and Silane

Initially, the silane hydrolyzate was applied using a horizontal padding machine in the two-step finishing procedure. Later, the textile was placed in a bowl with 1% chitosan dispersion in acetic acid (2%) (see Section 2.2.1), manually squeezed, and then squeezed by a padding machine. After that, the textile was dried as described above.

2.3. Dyeing

For the detection of chitosan, the textiles were dyed with a reactive dye. The samples were dyed in an aqueous solution of 2% Remazol Brilliant Red F3B (DyStar Colours Distribution GmbH, Raunheim, Germany) and 0.1% (w/v) Triton X-100 (Carl Roth GmbH & Co KG, Karlsruhe, Germany) (see [29]). To prepare the dye solution, a stock solution was first prepared at a ratio of 1:100. The samples were stained for 5 min at 50 °C in a dyeing apparatus (Ahiba IR pro, Datacolor GmbH, Marl, Germany). The heating rate was 3 °C per minute. The temperature was measured via a temperature sensor in one of the staining bombs. Immediately after dyeing, the samples were cold-rinsed twice for 3 min in one liter of soft water each. The samples were left to dry at room temperature while lying down.

2.4. Washing

Washing tests were performed with selected samples, using an industrial washing machine (Electrolux Professional, WH6-11CV, Stockholm, Sweden). In total, 30 mL of a liquid laundry detergent (Persil Power Gel, Henkel AG & Co. KGaA, Düsseldorf, Germany) was added and the textiles were washed at 40 °C with a standard colored washing program. A cotton lab coat was added to the load to ensure even washing. The samples were washed up to five times and then line-dried. These samples were named “B”. The unwashed samples were named “A”, where necessary.

2.5. Analytics

2.5.1. Viscosity

The viscosity of the chitosan dispersions was measured with a rotary rheometer (Haake viscotester iQ, thermos scientific, Karlsruhe, Germany) at a temperature of 30 °C. Exemplary measurement was performed for 0.5% and 3% ChD.

2.5.2. Thickness Measurement

The thickness of the fabrics was determined according to the standard DIN EN ISO 5084_1996 with a Micrometer universal S16502, Frank-PTI GmbH, Birkenau, Germany. Five measurements were performed per sample. The average and the standard deviation were calculated.

2.5.3. Air Permeability

The air permeability of the fabrics was determined according to DIN EN ISO 9237_1995 (DIN German Institute for Standardization, Berlin, Germany) with an FX3300 Lab Air, Textest AG, Zurich, Switzerland. Five measurements per fabric were performed with a differential pressure of 100 Pa and a test area of 20 cm2. The average and the standard deviation were calculated.

2.5.4. Microscopy

An overview of the fabric structure was obtained using light microscopy (Digital Microscope VXH and VH-Z2OR, Keyence Deutschland, Neu-Isenberg, Germany). Images were taken at 30× magnification. The textiles’ surfaces were investigated using a scanning electron microscope (SEM) (Tabletop TM4000 Plus, Hitachi High-Technologies GmbH Europe, Krefeld, Germany) and images were taken at 100×, 300×, and 1000× magnification. For the detection of chemical elements on the samples’ surfaces, mapping was performed using energy-dispersive X-ray spectroscopy (EDS) (Bruker SCU, Brucker Nano GmbH, Berlin, Germany). EDS mapping was performed at a magnification of 300×. For each sample, the atom distribution in atom % was evaluated three times and the mean value and standard deviation were calculated.

2.5.5. UV-Vis Spectroscopy

The absorption of the textile samples after dyeing with Remazol Brilliant Red F3B was measured by clamping the textiles without tension in a special sample holder in the UV-Vis spectrometer UV2600 from Shimadzu (Kyōto, Japan). Each sample was measured at three different points in the wavelength range of 400–700 nm. The mean value over all three measurement curves was determined and standard deviations were calculated for the mean absorptions at 550 nm.

2.5.6. TEGEWA Drop-Test

The water absorption properties of the finished textiles were tested using the TEGEWA drop-test with an aqueous solution of Patent Blue V (2%), as described elsewhere [30]. The test involved recording the sink-in time of the droplets, and measuring the spreading of the droplets in the weft and warp directions. The test was conducted three times for each sample, and the mean values were calculated. Samples with a sink-in time greater than five minutes were tested only once.

3. Results and Discussion

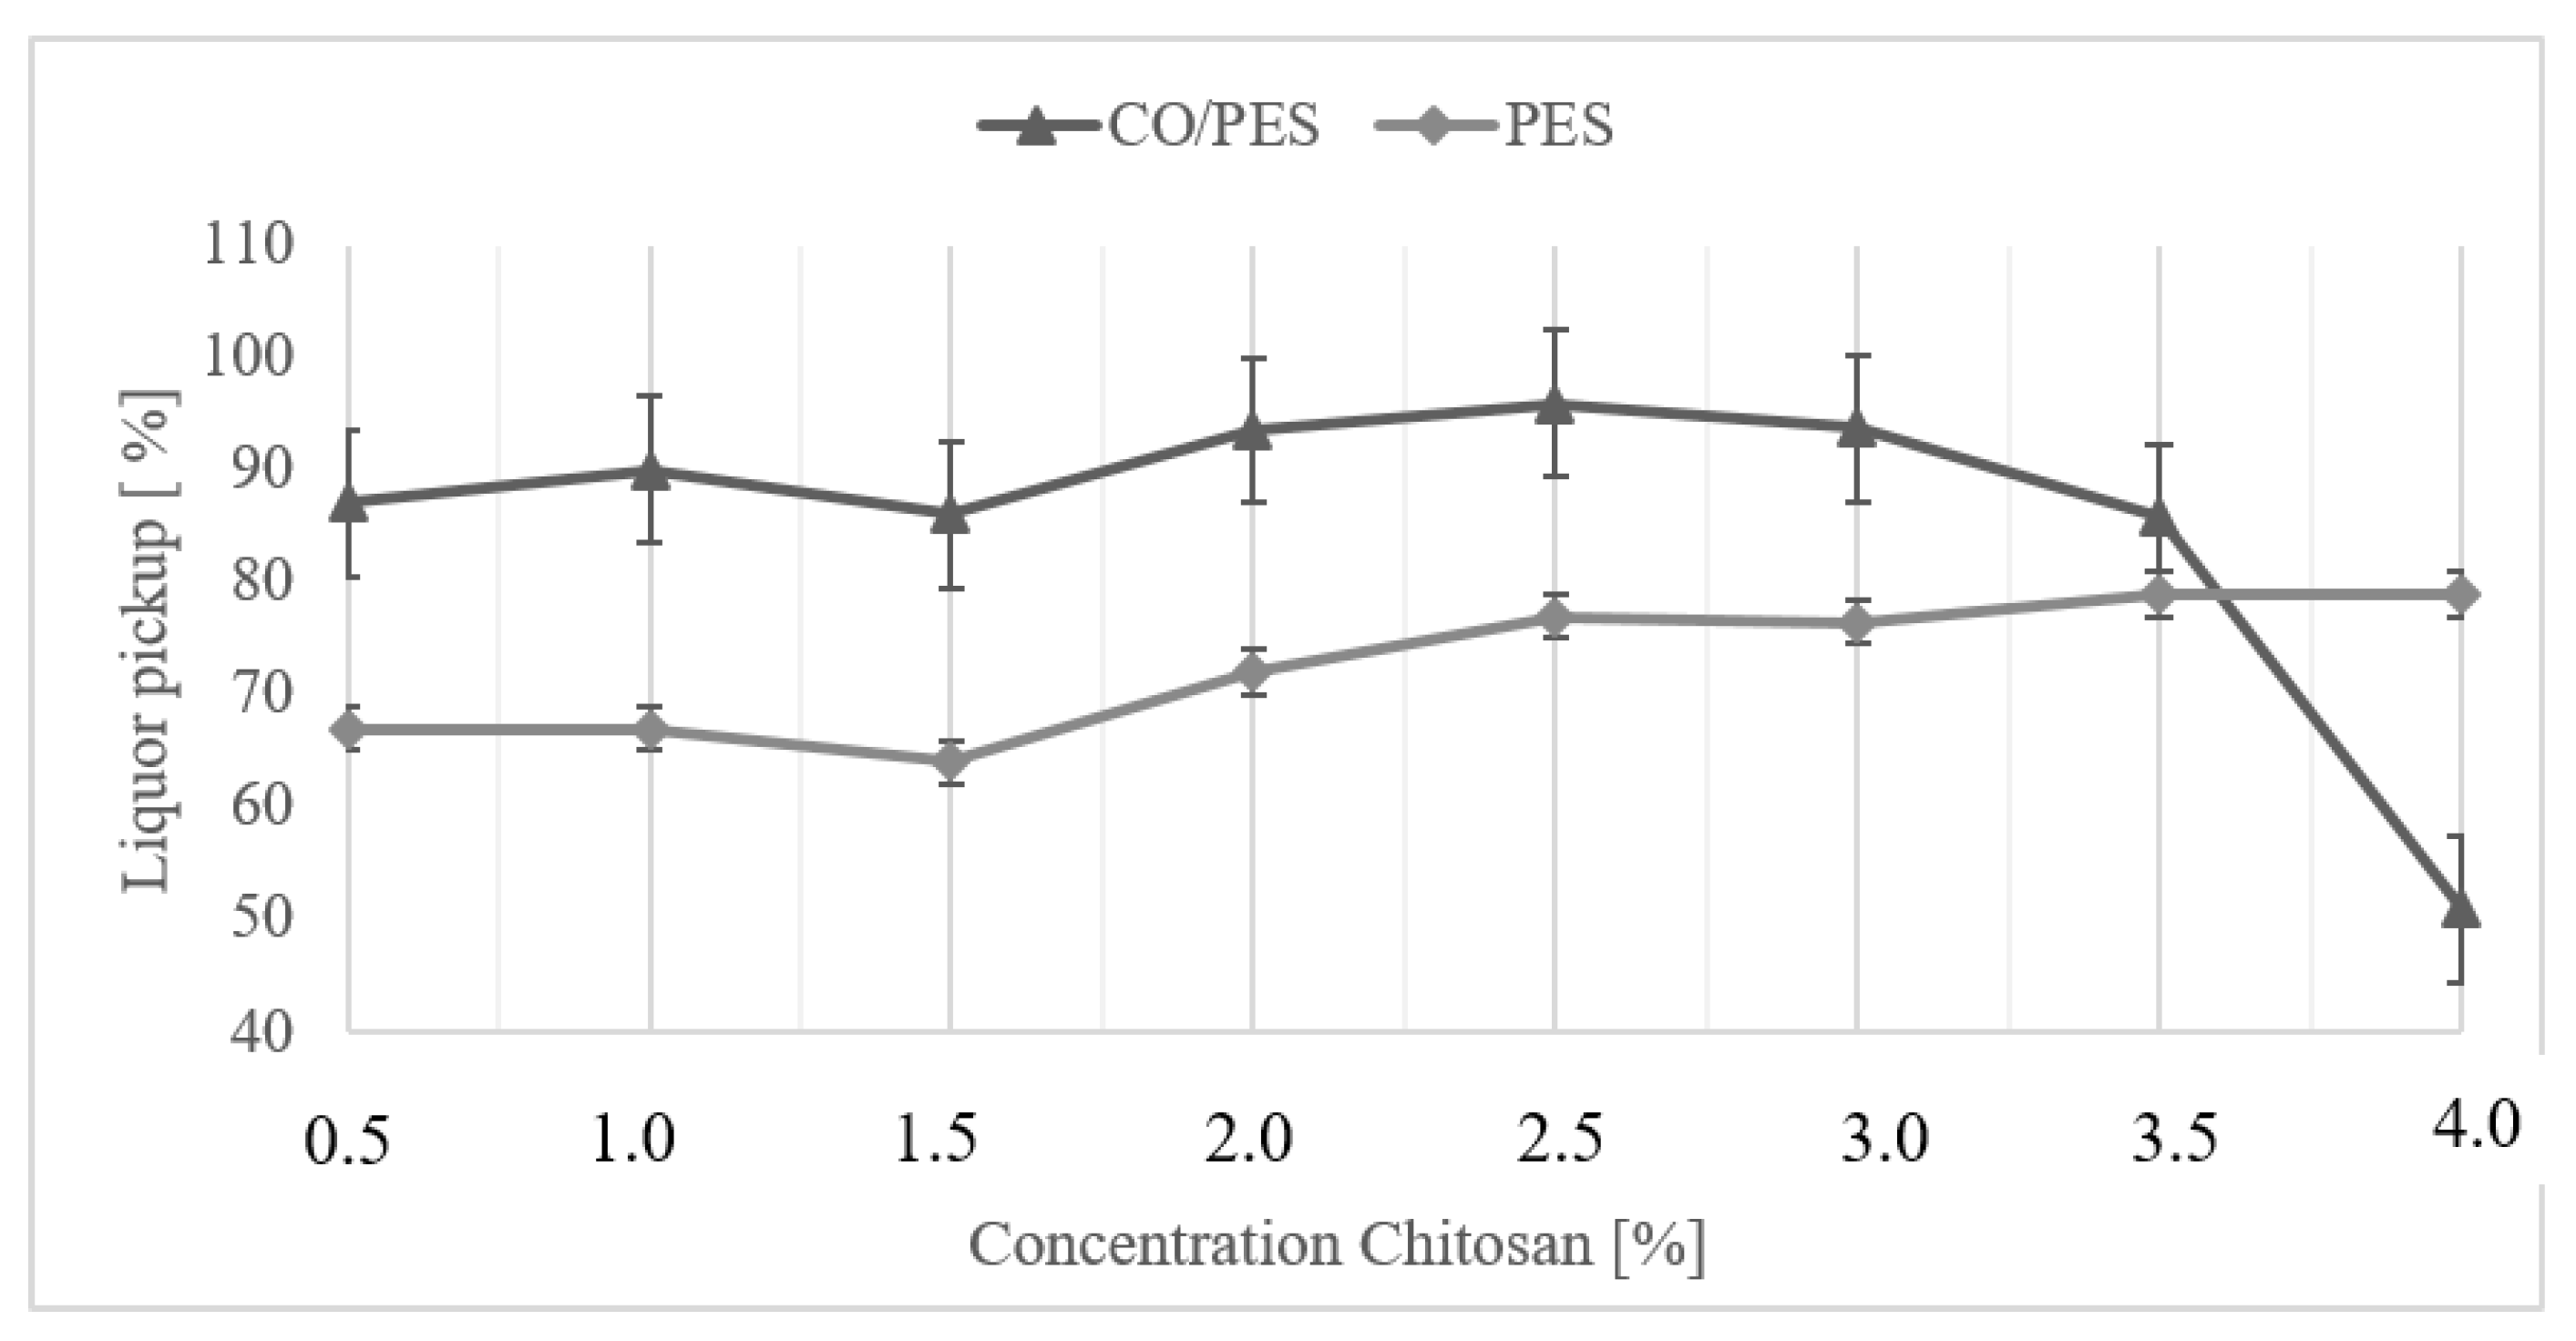
3.1. Different Concentrations of Chitosan

The first experiments were performed to establish a robust detection method of chitosan. Thus, chitosan in different concentrations was applied to the textiles and different analytic methods were evaluated. For this, ChD was dissolved in 1% acetic acid with concentrations ranging from 0.5 to 4%. The solution was then applied to cotton/polyester and polyester fabrics via a padding process. In addition to the results described in [28], higher chitosan concentrations were analyzed with REM/EDS. Also the dyeing of chitosan functionalized samples with reactive dye Remazol Red was performed.
For each sample, the liquor pickup during functionalization was determined by a method described elsewhere [28]. The liquid pickups were determined twice for concentrations of 1% and 3% ChD each. The standard deviations of these measurements were calculated. These were 2% for PES and 6.5% for CO/PES textiles, measured independently of the chitosan concentration. Thus, these values were applied to all liquor pickups for the different materials. Figure 1 shows the values of both materials.
Figure 1 shows the liquor pickup of the functionalized PES and CO/PES samples. The liquor pickup of the CO/PES samples was up to 20% higher due to its higher water absorption capacity, based on the higher hydrophilicity of the cellulose monomer, compared to the terephthalate monomer in polyester. With both materials, samples containing a chitosan content up to 3% tended to show an increase in liquor pickup with an increase in concentration. This tendency is very similar in CO/PES and PES. The viscosity of the chitosan solution increased significantly with an increasing concentration (e.g., from 91 mPa·s for 0.5%ChD to 862 mPa·s for 3% ChD), making it very difficult to apply a high-concentration solution via padding onto the textile, especially for the CO/PES textile. This resulted in unfavorable and uneven liquor application, and lower liquor pickups characterized the samples with 3.5% and 4% chitosan. However, it is striking that the degree of liquor pickup of the 1.5% chitosan varied for both textiles.

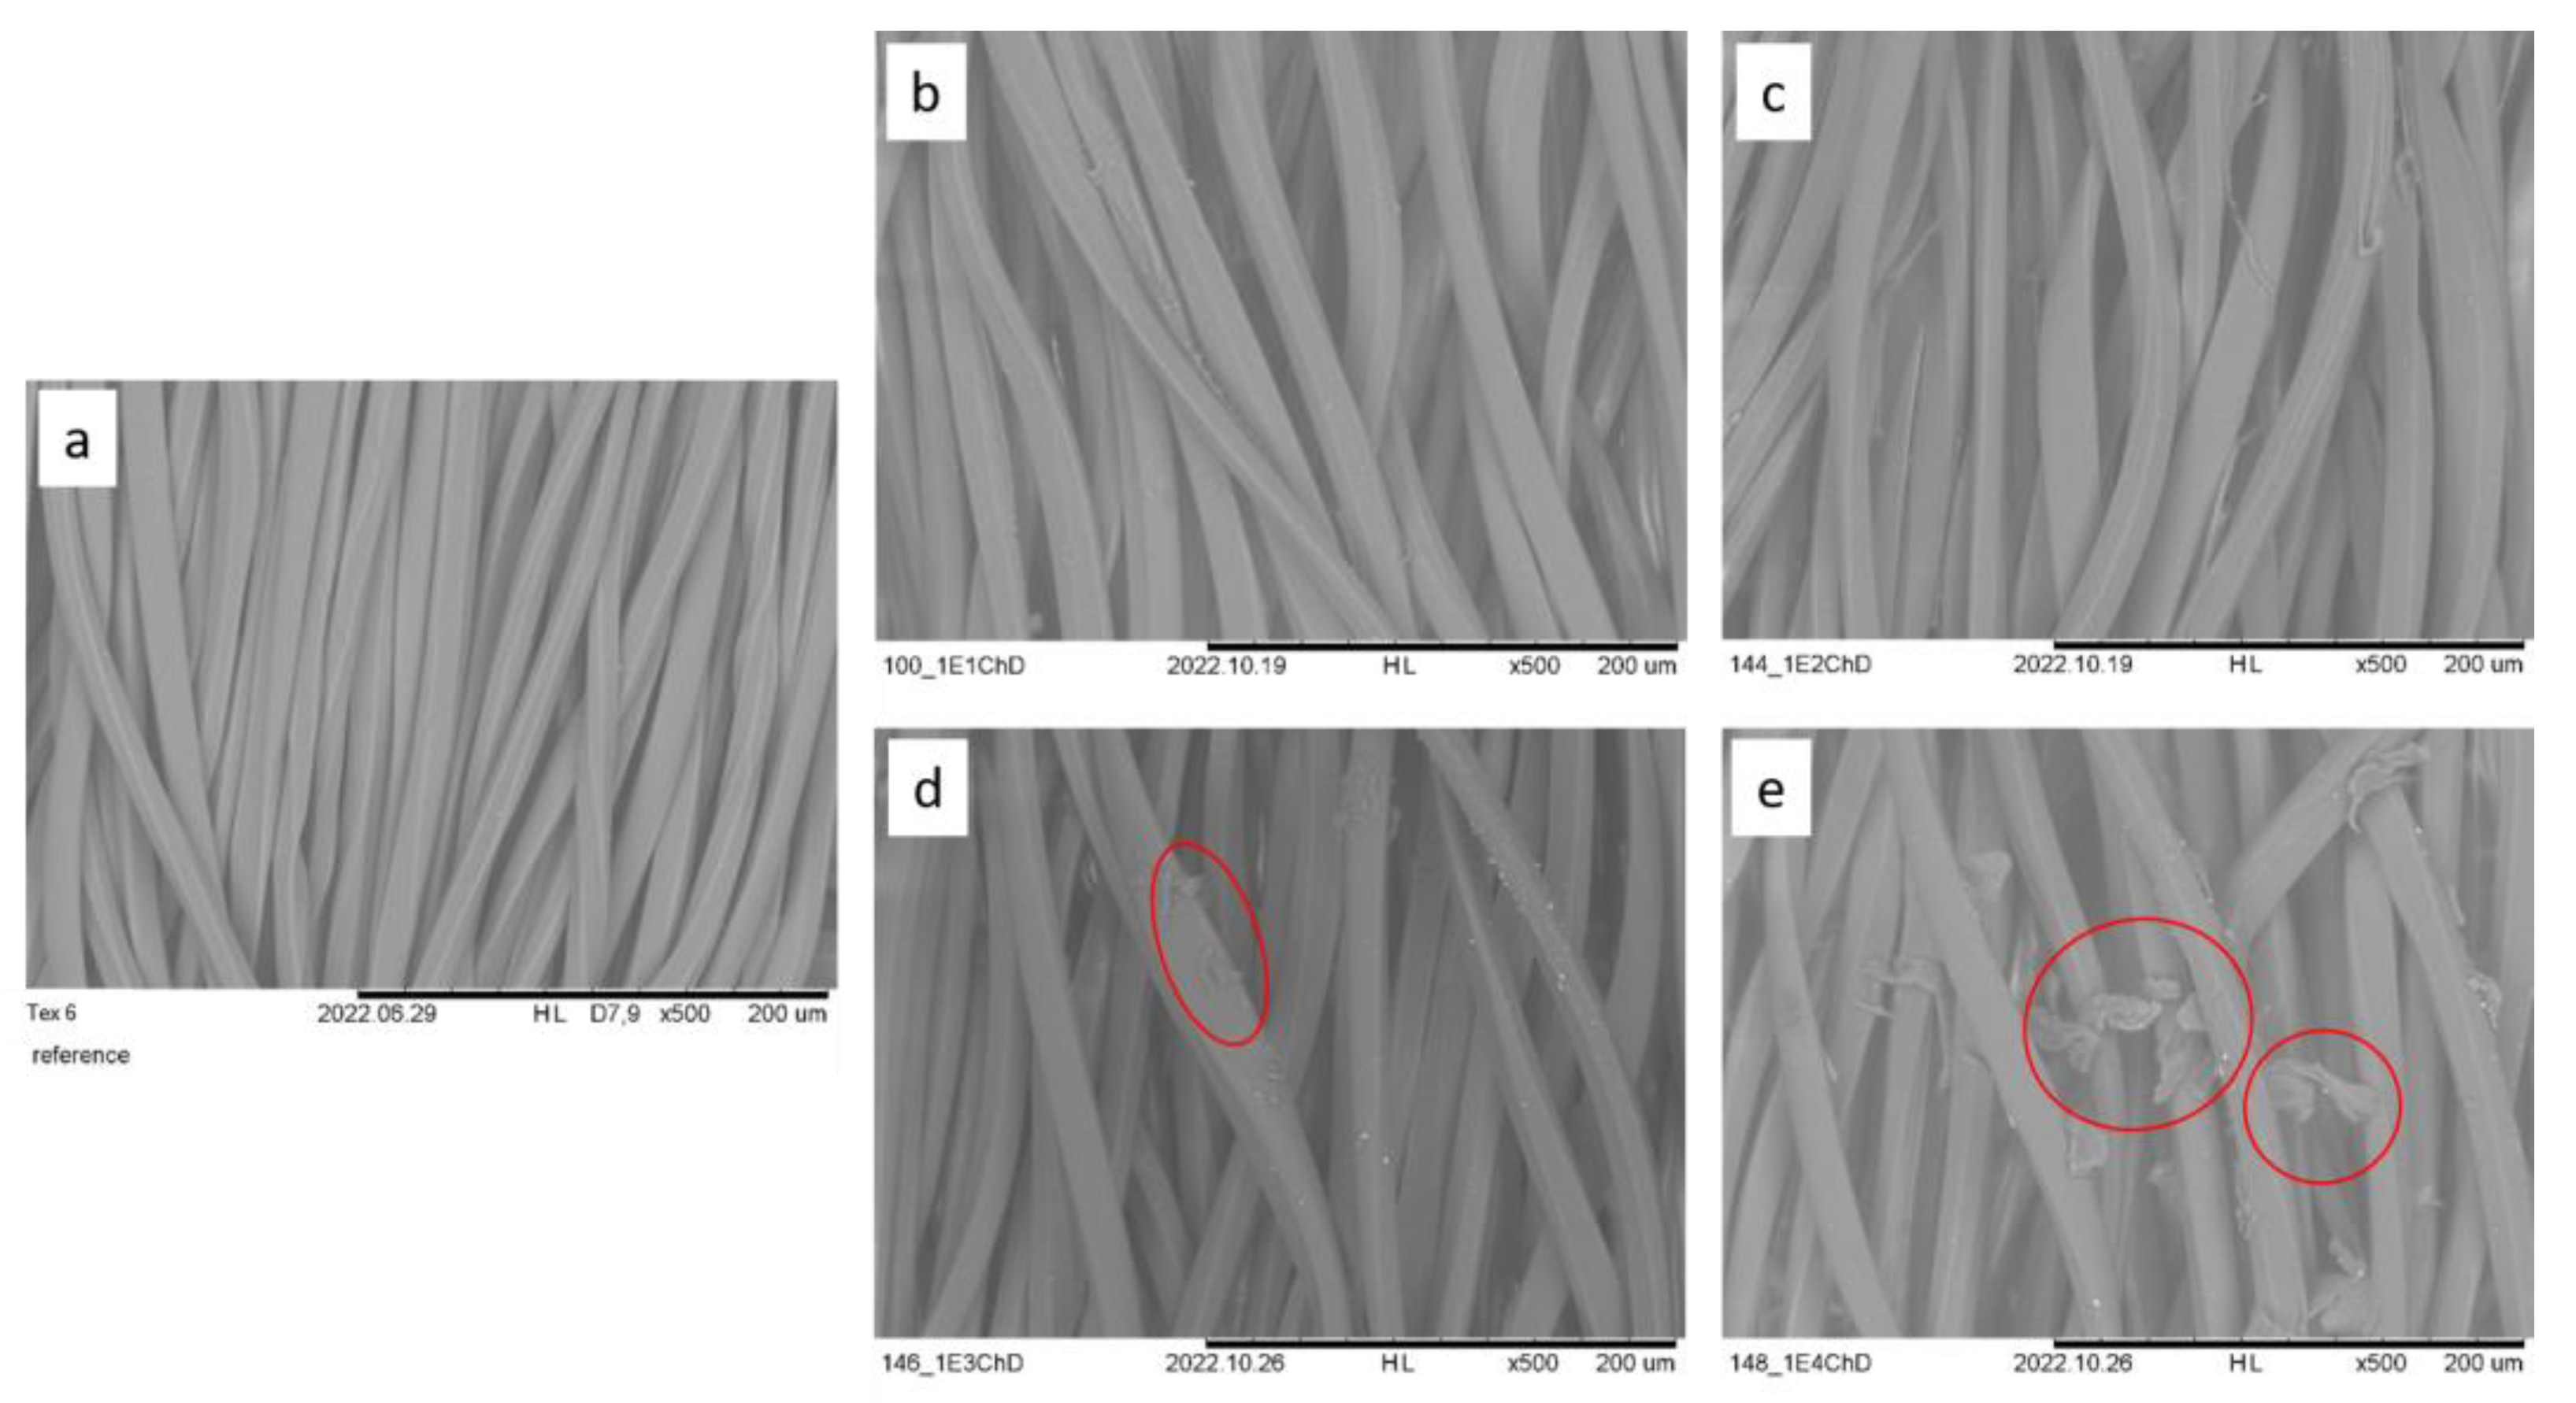
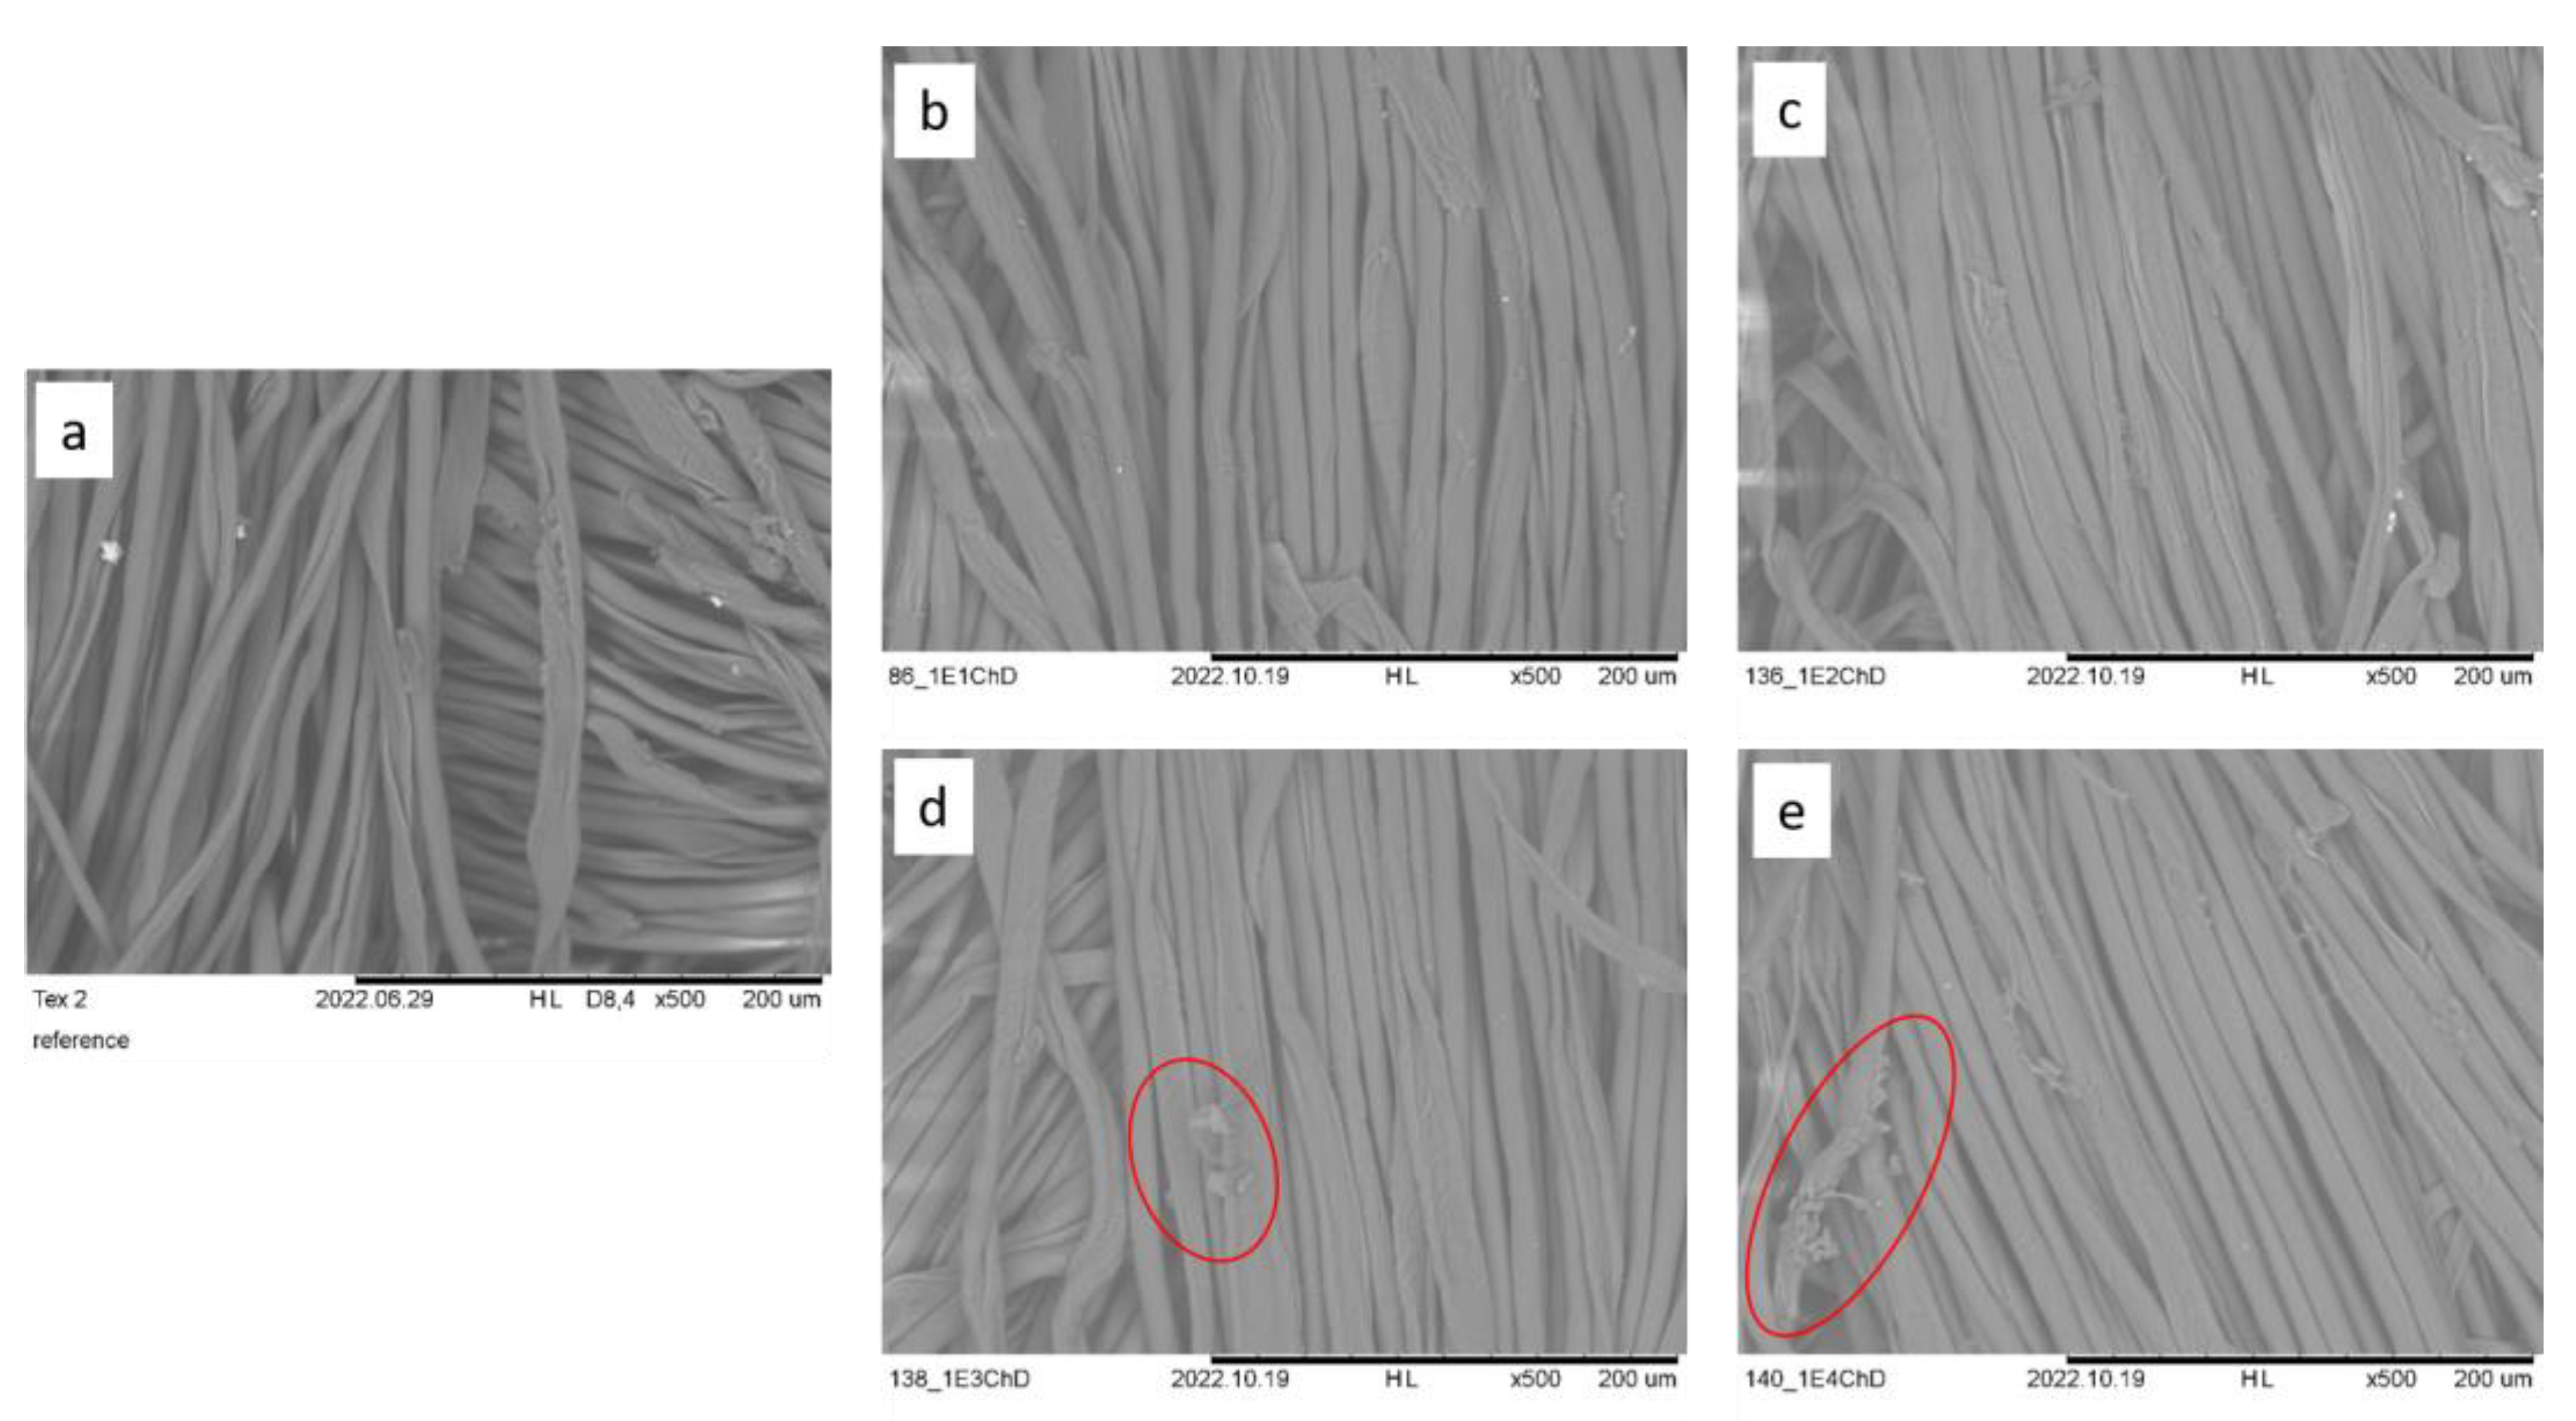
3.1.1. SEM/EDS Analysis

Figure 2 and Figure 3 show SEM images of polyester and cotton/polyester samples functionalized with increasing chitosan concentrations.
SEM images have been used to provide visual evidence of the presence of chitosan on the functionalized fabrics. The first step was to observe chitosan as a film on and between the fibers, including undissolved particles on the fibers and in the spaces between them (as seen in Figure 2 and Figure 3). When dissolved, chitosan can be detected in the form of a streak-like coating of varying thickness and density on the fibers. The SEM images also reveal the presence of undissolved chitosan particles, particularly at 3% and 4% chitosan concentrations (seen in Figure 2d,e and Figure 3d,e in red circles).
The images confirm the presence of chitosan on both the PES and CO/PES fabrics. A change in the chitosan concentration is also evident, but not further quantifiable. Additionally, it has been confirmed that the applied chitosan was not completely dissolved in higher concentrations, starting at approximately 3%.
EDS coupled to REM was used to determine the elemental distribution on the textiles’ surfaces. Table 2 shows the mean values with standard deviation (SD).
The chemical structures of polyester and cotton do not contain nitrogen, but nitrogen exits in chitosan [15]. When the concentration of chitosan increased, the amount of nitrogen on the textiles’ surfaces was expected to increase as well. However, although carbon and oxygen were detected in different proportions in all samples, no nitrogen was found (Table 2). The sensitivity of the EDS method to the chemical element nitrogen is low, and so the amount of nitrogen applied to the chitosan was obviously not high enough to detect it on the prepared samples. Although high chitosan concentrations were identified qualitatively via SEM analysis, these experiments show that SEM/EDS analysis was unsuitable for the quantitative detection of chitosan, confirming the former results of the authors [28]. Therefore, another analytic method used for the detection of chitosan on the textiles was evaluated.

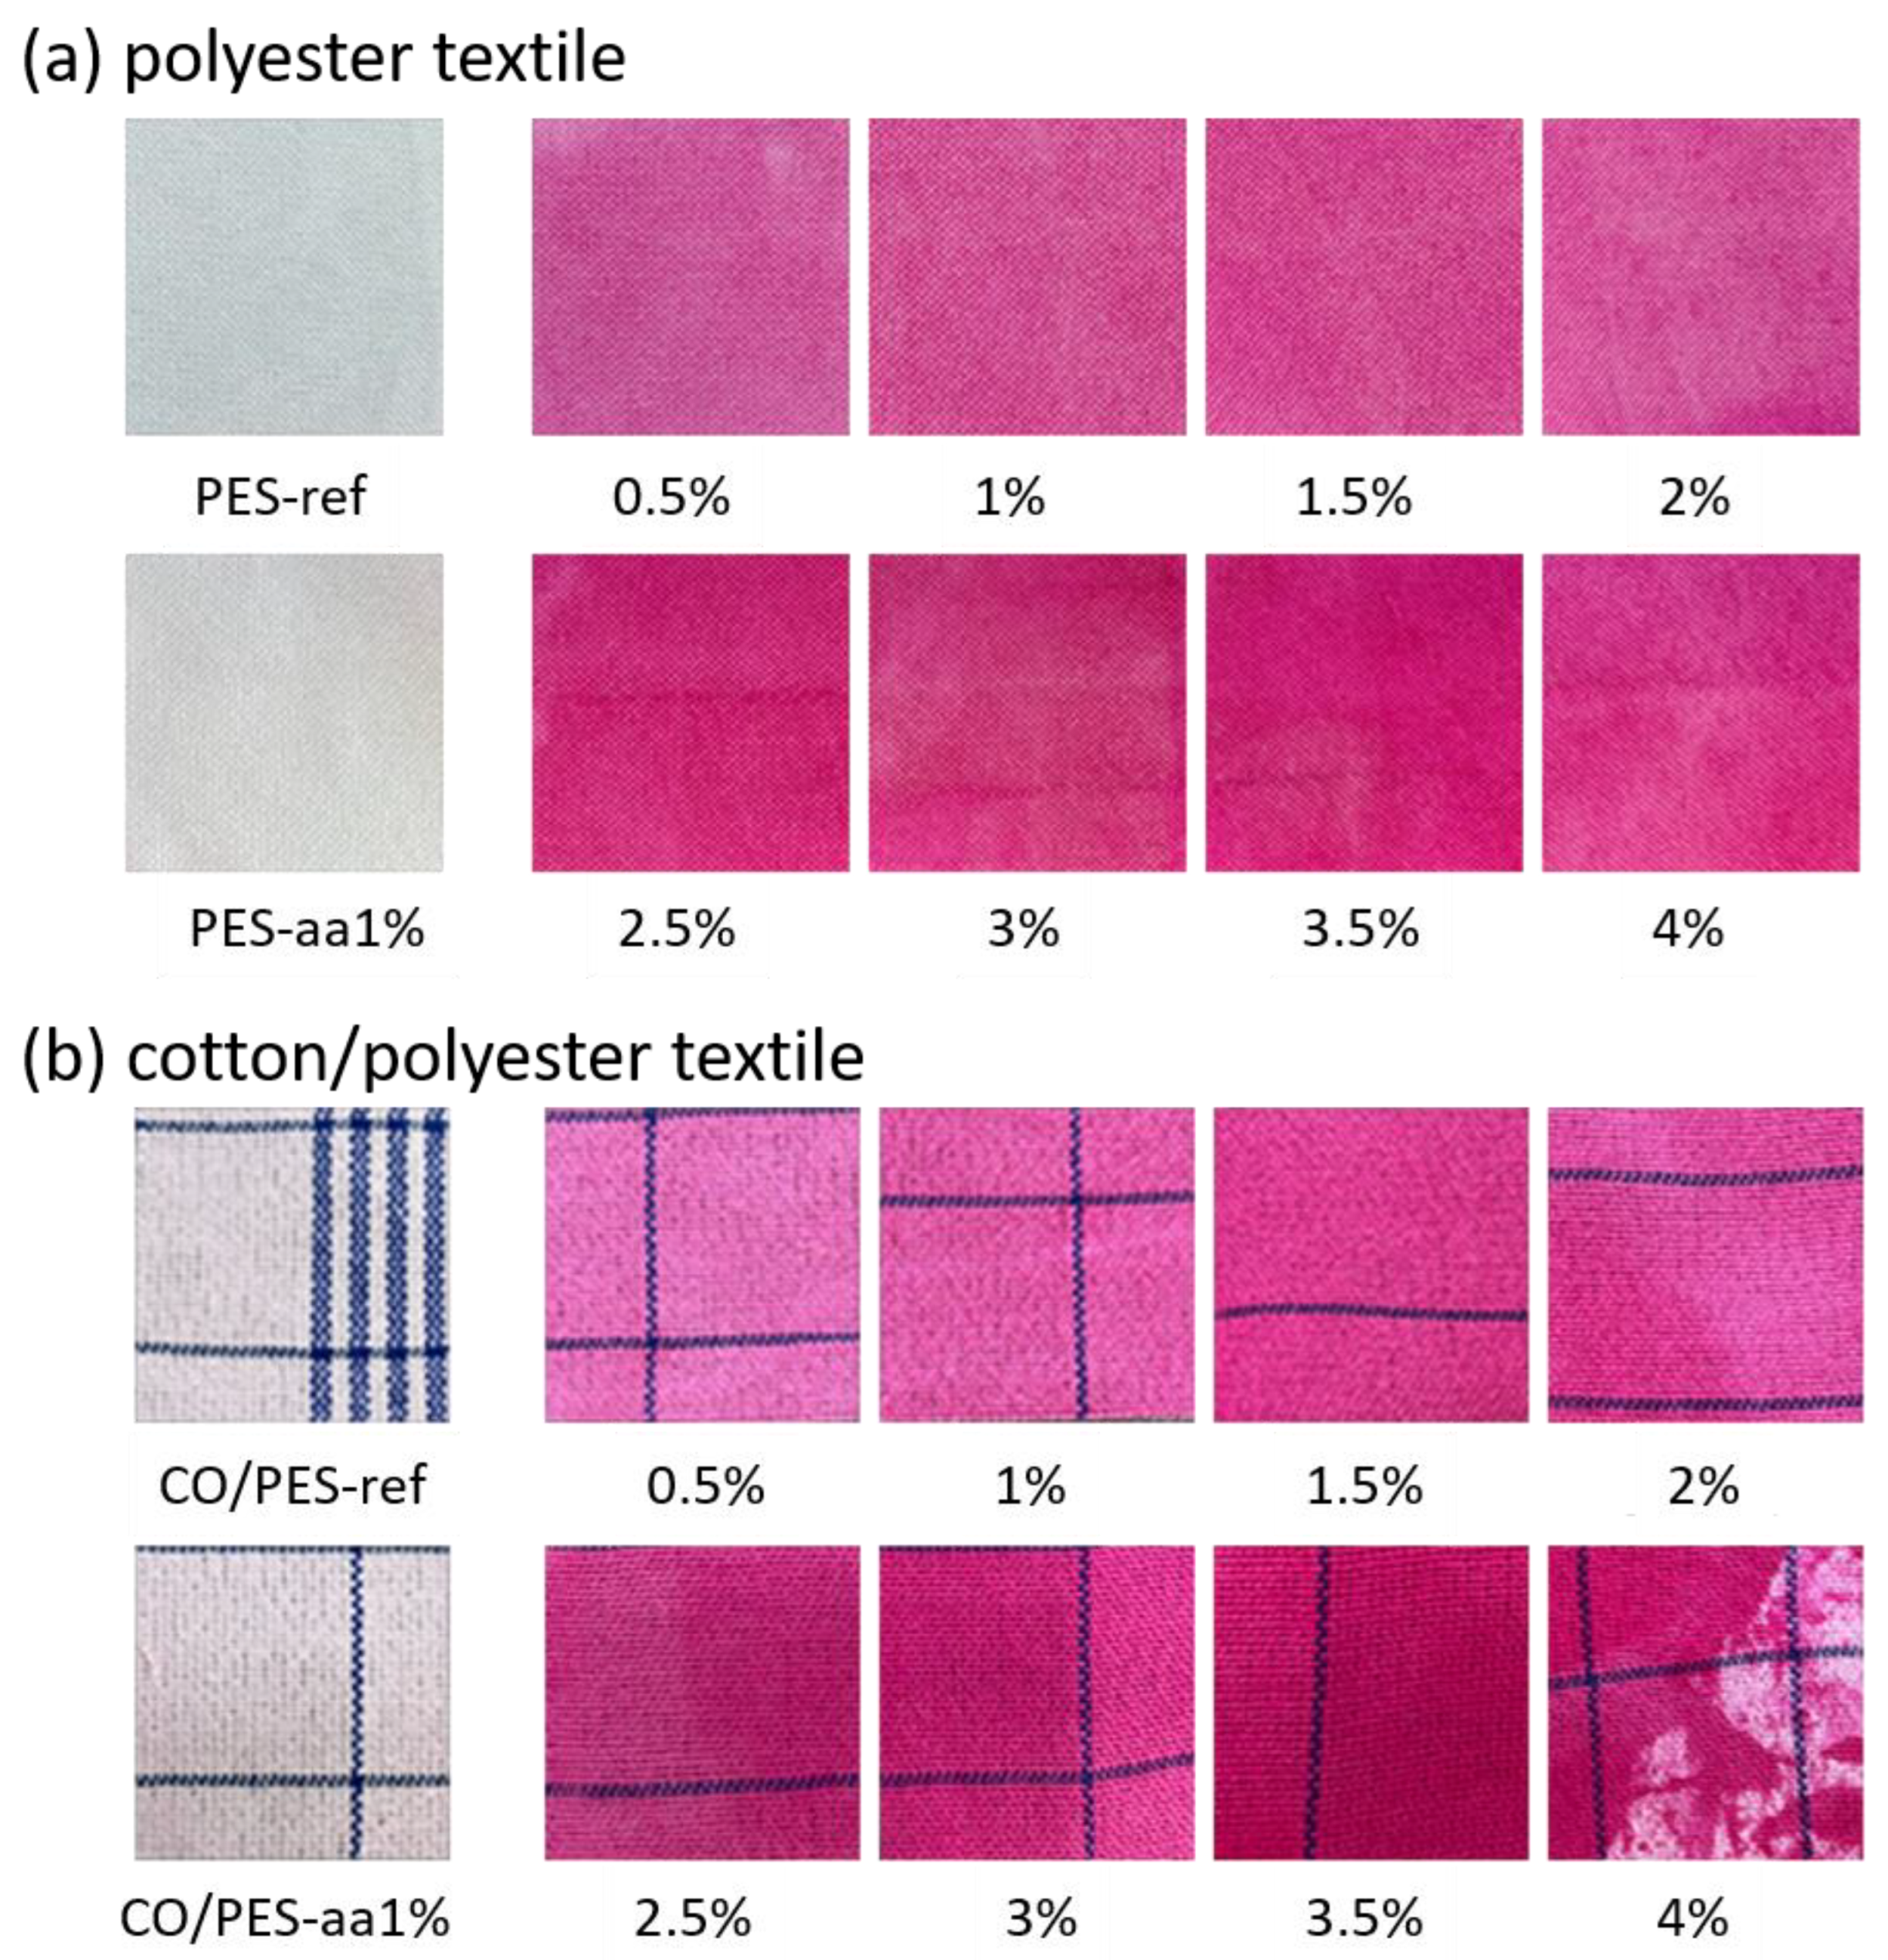
3.1.2. Dyeing with Remazol Brilliant Red F3B

Dyeing was carried out with the reactive dye Remazol Brilliant Red F3B. The dye’s anionic sulphonyl groups should interact with the chitosan’s amino groups due to ionic interactions [32], but not with the textile fibers themselves. Figure 4 shows images of the dyed PES (Figure 4a) and CO/PES (Figure 4b) textiles.
Cotton fibers are conventionally stained with reactive dyes under alkaline conditions via the reaction of the cellulose hydroxyl group with suitable functional dye groups [26,27]. Polyester fibers lack these functional groups and are commonly dyed with dispersed dyes at high temperatures, where the dye molecules migrate into the amorphous parts of the polymer chain. Figure 4 shows that CO/PES fibers without any functionalization were not visibly stained. The same is true for samples treated with 1% acetic acid (aa). Although cotton fibers have a high affinity with reactive dyes in general, the low dyeing temperature of only 50 °C and the short dyeing time of only 5 min for the dyeing process applied here prevent the significant adherence of the dyestuff to cotton. However, a slight reddish coloring can be seen on the CO/PES references, which allows for a better visual assessment and targeted measurement of the samples (please compare “ref” in Figure 5b). As expected, pure polyester textiles have no affinity with the reactive dye, and no visible staining was observed here (see also “ref” in Figure 5a).
Overall, the staining appears to be relatively uniform for all chitosan-functionalized textiles, except for the CO/PES-4% sample, which shows a large area that is not stained. This can be attributed to the low application of the very viscous solution during the padding process. Table 3 compares the chitosan concentration applied in the padding bath with the chitosan concentration present on the textiles, calculated using liquor pickup.
The calculated values demonstrate that with PES, the chitosan content on the textiles increased with an increasing chitosan concentration in the bath. In contrast, this was different for CO/PES. Due to the low liquor pickup of 4% ChD here, much less chitosan was applied to the textiles than was planned.
UV-Vis spectroscopy was used in the quantified analyses of the stained samples. Figure 5 shows the UV-Vis spectra of the stained textiles (Figure 5a: PES samples; Figure 5b: CO/PES samples), and compares the values at the absorption maximum of Remazol Brilliant Red F3B at 550 nm for varying chitosan concentrations. In Figure 5c, we used the concentration of chitosan on the textiles that was calculated using liquor pickup (see Figure 1 and Table 3).
The absorbance values of staining with Remazol Brillant Red F3B seen in Figure 5 show a trend of generally increasing with chitosan concentration. The standard deviations from the three measurements were small for small concentrations of chitosan. With higher chitosan concentrations, the standard deviations became greater, and the staining became more inhomogeneous (see also Figure 4). However, for polyester, the highest chitosan concentration of 4% (calculated 3.2%) did not result in the deepest staining. The absorption values were comparable for those derived with 2.5% (calculated 1.9%) chitosan. The uneven application of chitosan may be the reason for this, as can be seen from the SEM images in Figure 2 and the uneven staining in Figure 4. This results in deviations in the absorbance values, despite triplicate determination. The differences in liquor uptake (see Figure 1) may also indicate that the chitosan content on textiles does not increase continuously with the chitosan concentration in the finishing solution. With cotton/polyester, from about 2% chitosan and up, a form of saturation occurs—higher chitosan concentrations do not lead to an increase in color depth. Again, uneven finishing occurs, as can be seen from the staining in Figure 4b. Highly concentrated chitosan solutions are very viscous, making even application difficult. Unsolved chitosan can be seen in the SEM images in Figure 3.
The results show that staining with Remazol Brillant Red F3B is suitable for use in the detection of chitosan on both CO/PES mixed and pure PES textiles: chitosan-functionalized samples were stained, whereas the references were not. The stainability of the chitosan-functionalized fabrics is attributed to the presence of primary amino groups in chitosan, which can form covalent bonds with reactive dyes, or build electrostatic interactions with the dye anions in their protonated form (NH3)+ [33]. Several experiments have been previously reported using reactive red dyes to stain chitosan-functionalized textiles, but using more intense reaction conditions with temperatures between 40 and 60 °C and reaction times of 30–160 min [25,34,35], showing similar effects. The conditions used here with a mild dyeing temperature of 50 °C and a very short reaction time of 5 min have already been studied by Al-Bahra for cotton [29], but were applied to polyester textiles. This method allows for the fast and reliable detection of chitosan on both cotton and polyester textiles.
The results of applying chitosan to PES and CO/PES textiles with SEM/EDX are unsatisfactory. However, in the tested dyeing process, a robust and fast detection method was developed for both materials that did not require any pre-treatment of the textiles.

3.2. Different Application Methods of Chitosan and Addition of Silanes

In a second experimental series, chitosan-functionalized textiles with silanes as the binder were analyzed, and different application methods were tested. These experiments aimed to determine whether an amino- and a glycidoxy silane were suitable for changing the surface properties of chitosan textiles, as described before for tetraethoxy silane (TEOS) [19], and furthermore, whether the washing fastness could be improved. Table 4 gives an overview of the functionalization of PES and CO/PES textiles. All samples were analyzed directly after functionalization and after five washing cycles to determine the washing fastness of the properties. The washed samples were called “B”, and the unwashed samples were called “A”.

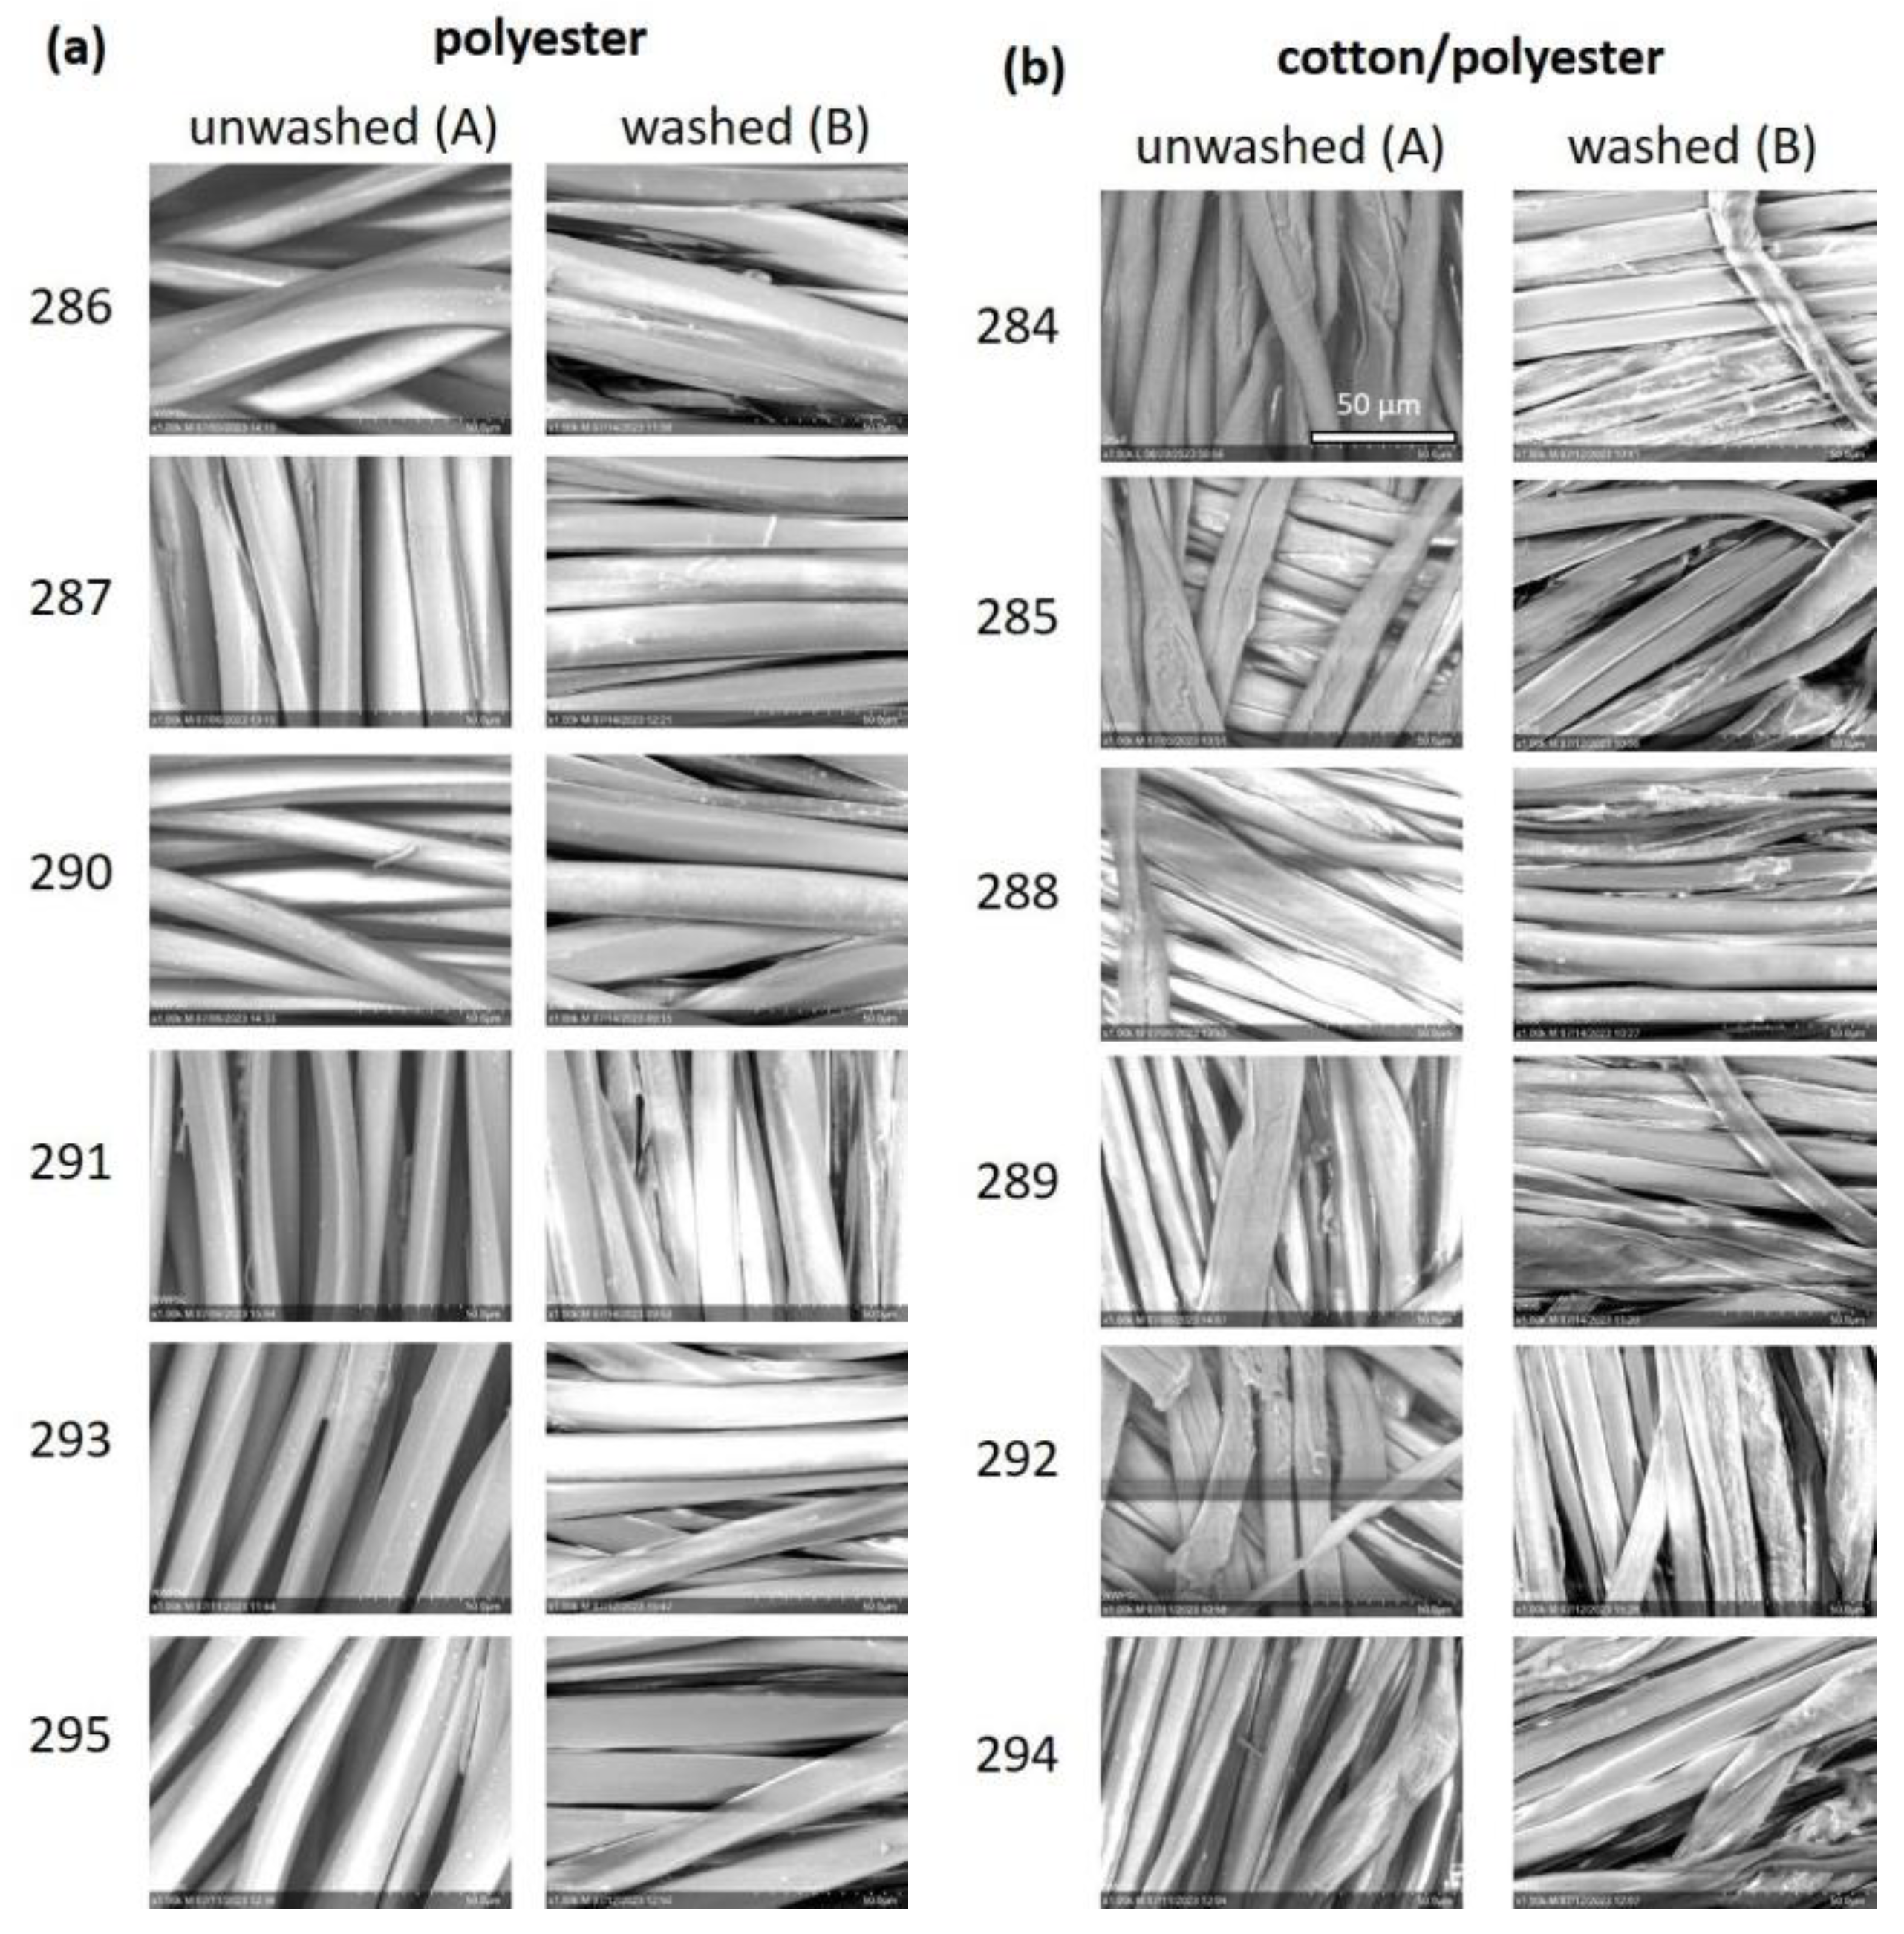
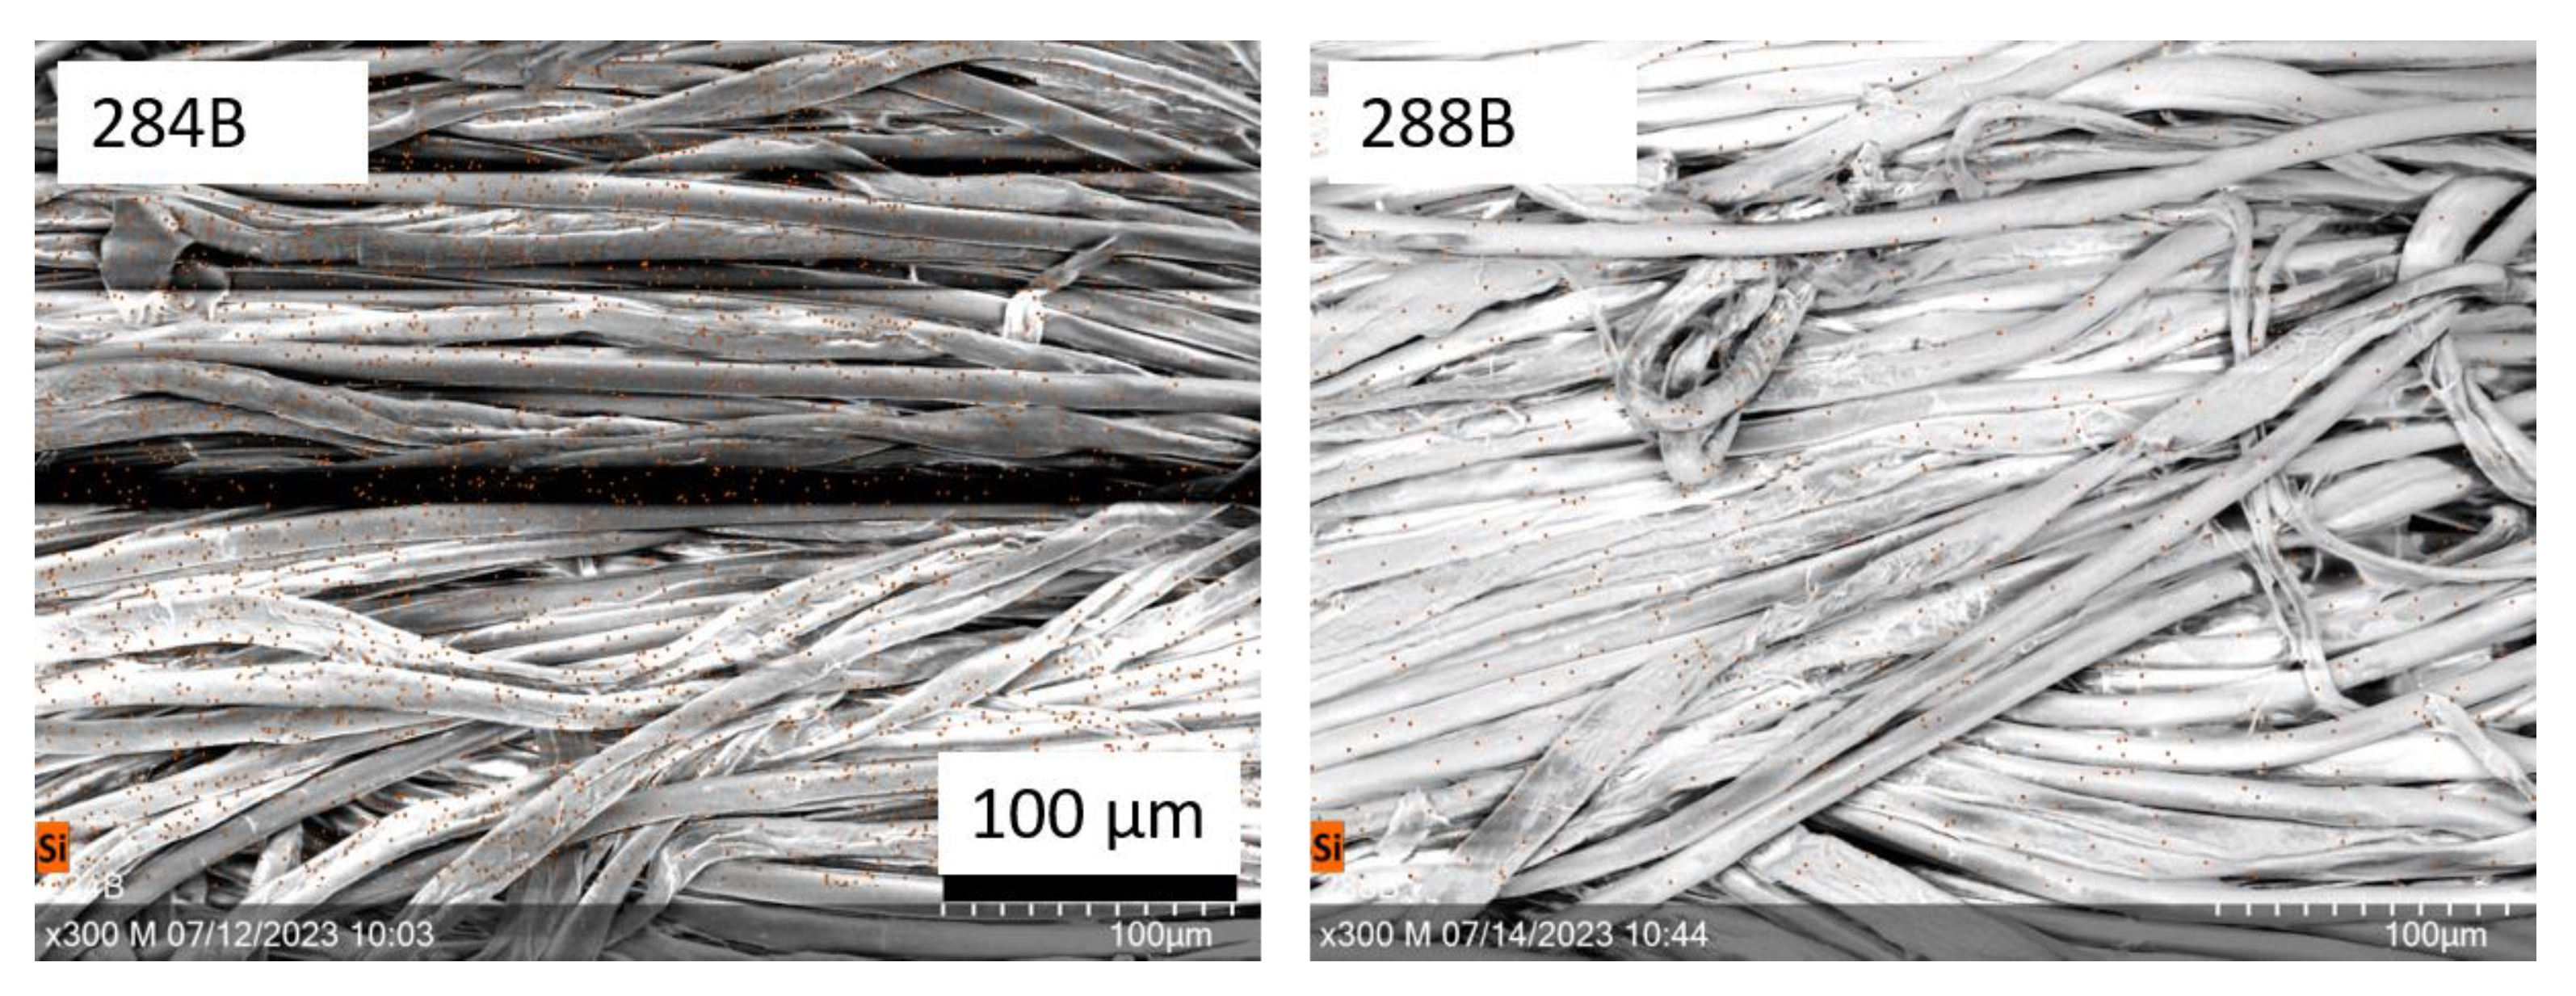
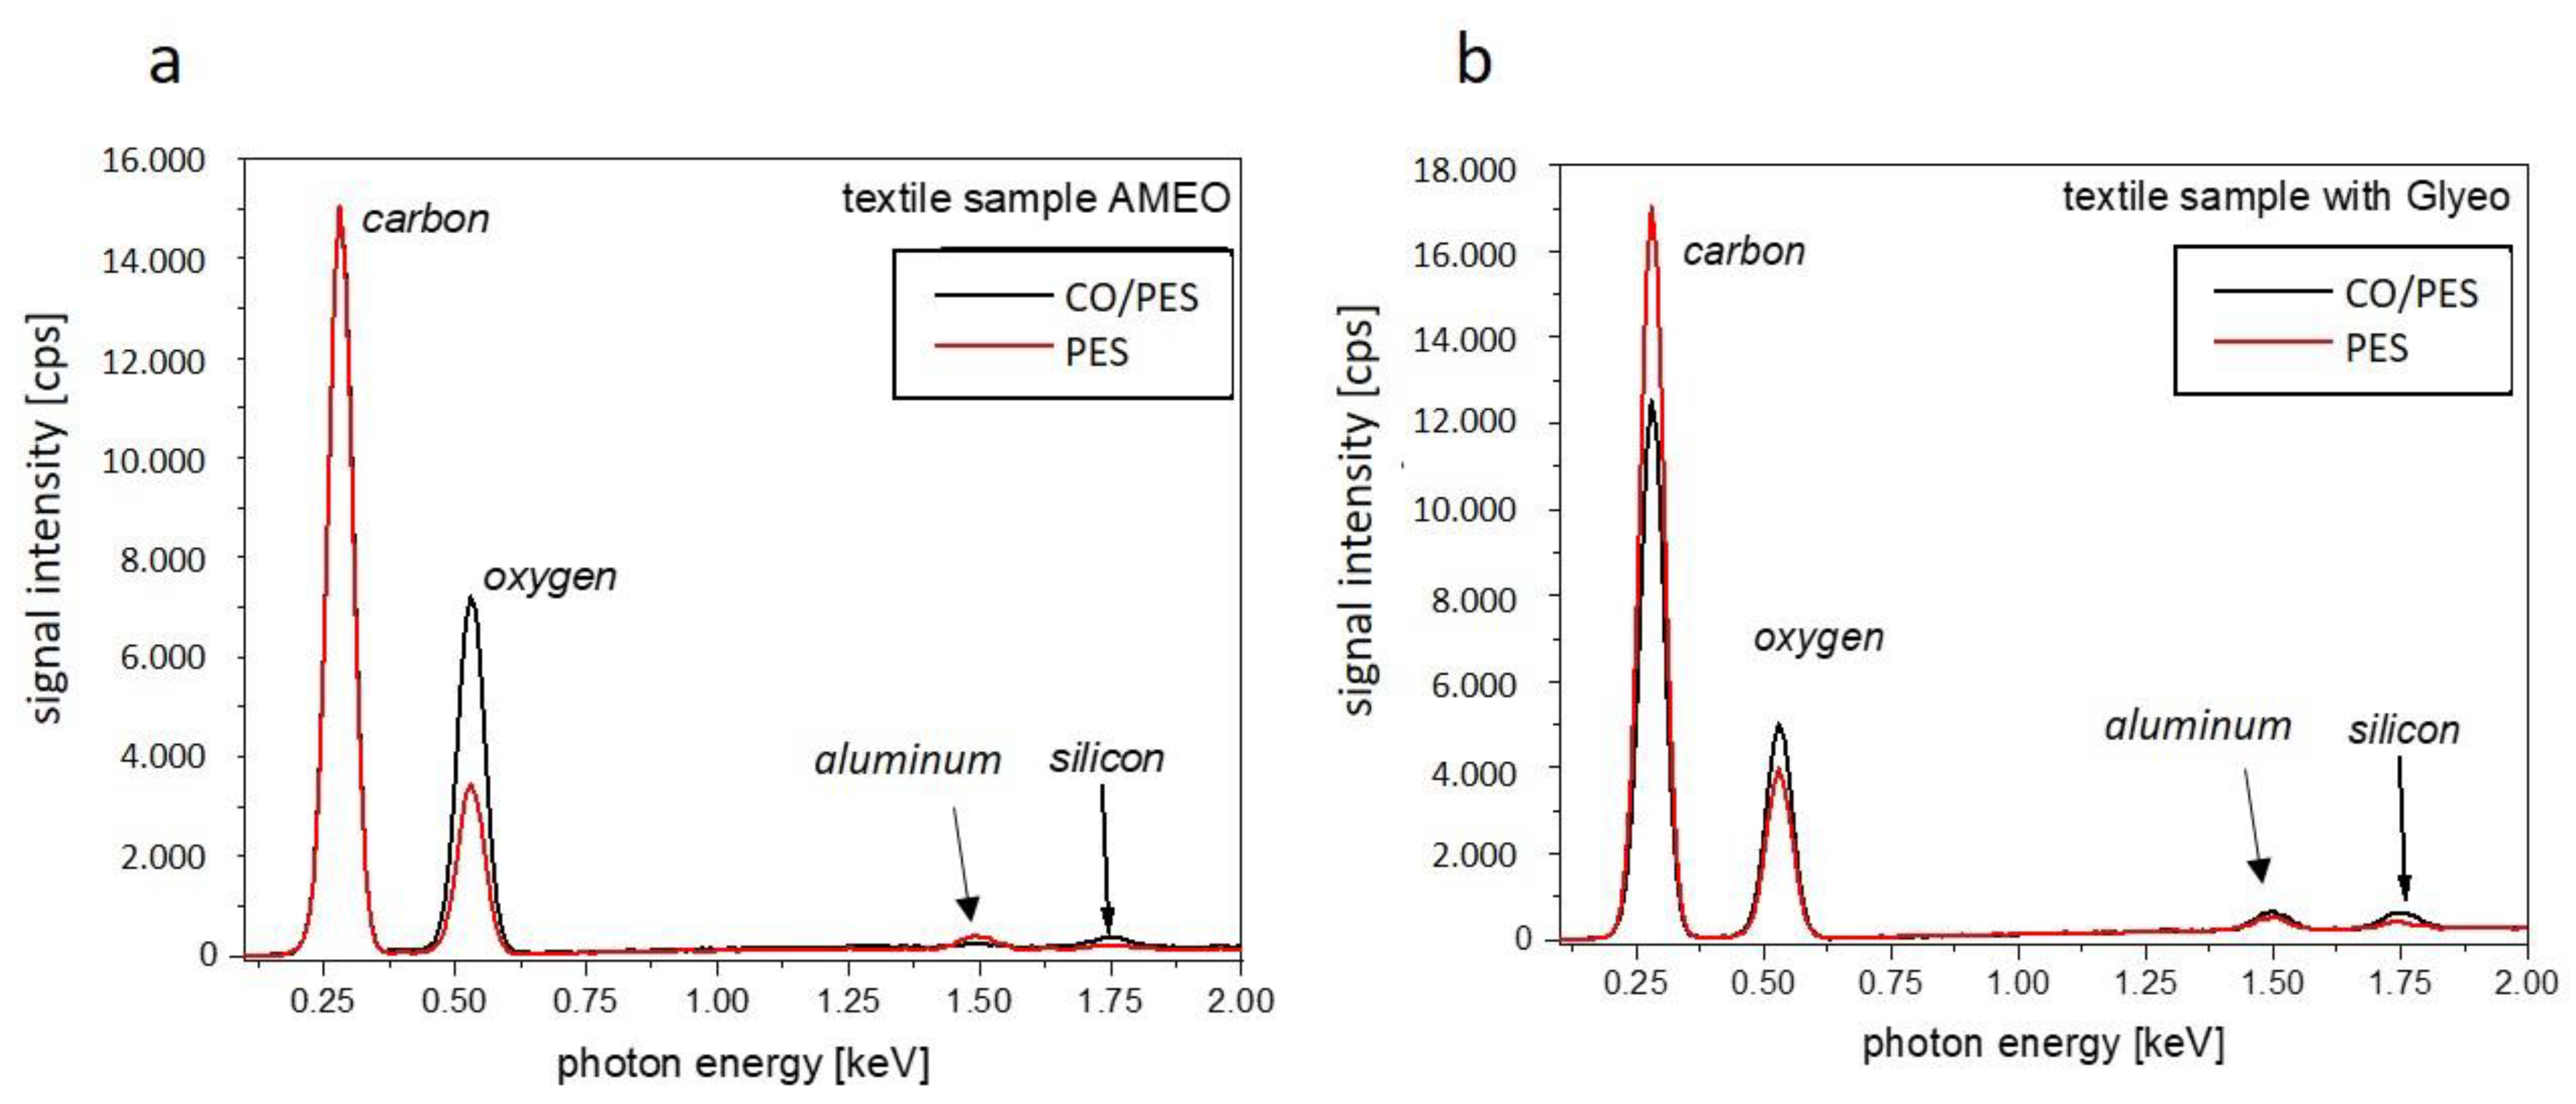
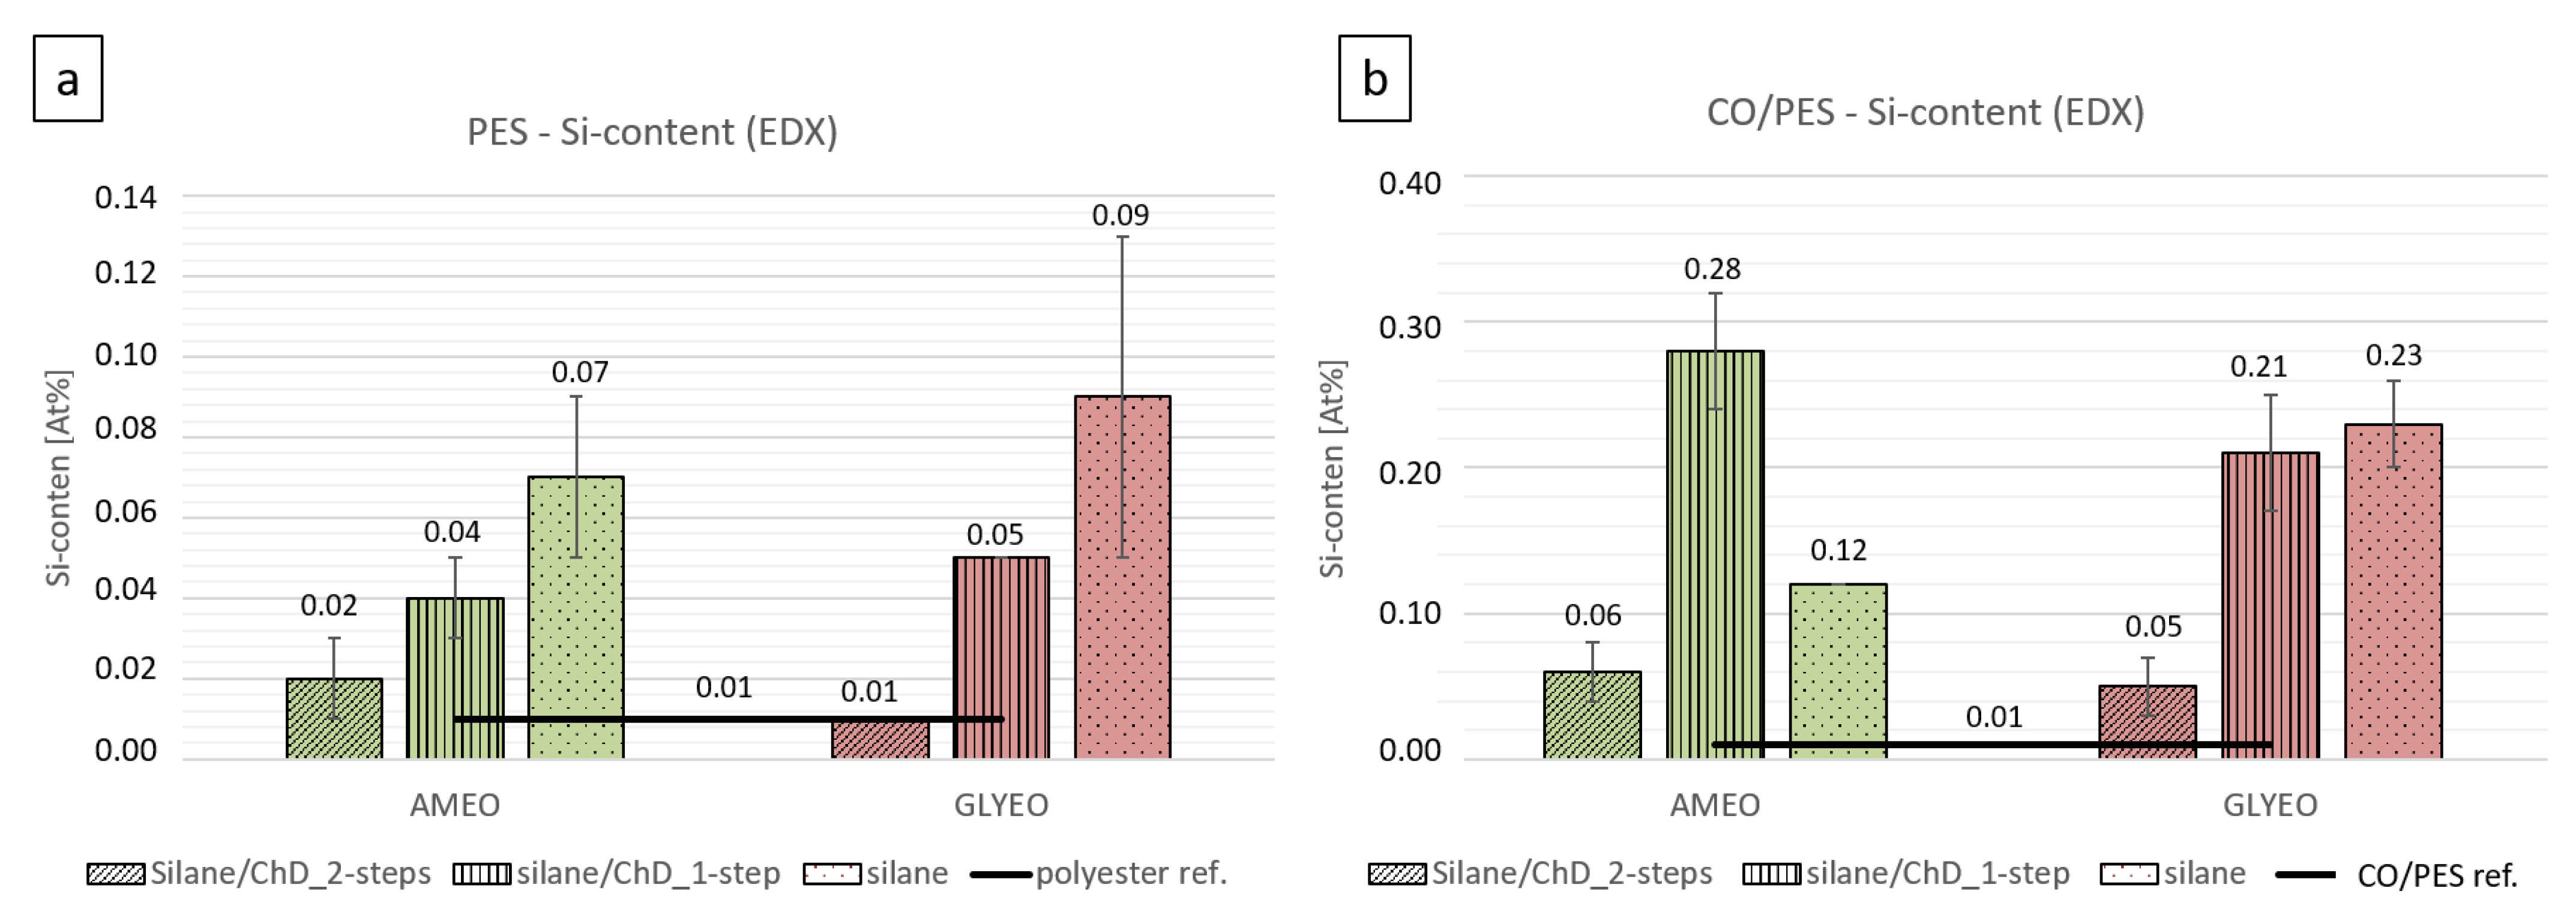
3.2.1. SEM/EDS Analysis

Freshly functionalized samples (indicated with “A”) and samples washed five times (indicated with “B”) were analyzed with SEM/EDS. Figure 6 shows SEM images of the different samples.
The SEM images show a smooth surface for all polyester samples (Figure 6a).Unlike unfunctionalized polyester textiles (see Figure 2a), no differences due to the finishing were detected. The chitosan concentration was too low (cf. Figure 2), and silanes could not be detected visually. No changes occurred after washing. The surfaces of the cotton/polyester fibers were not as uniform (Figure 6b), since this was a natural fiber. Like polyester samples, the chitosan concentration was too low for detection via SEM imaging (cf. Figure 3). The images of samples of 284B and 288B show unidentified streaks. Examples of washed samples (284B and 288B) are shown in Figure 7.
The distribution of silicon was not limited to individual areas, but was uniform over entire samples. Accordingly, no clear evidence could be provided via EDS mapping of the silane finish. Overall, detecting chitosan on the textiles’ surfaces by EDS was difficult, since the functionalization only slightly changed the distributions of the chemical elements oxygen and carbon, while nitrogen could not be detected (see Table 2). However, the functionalization with silanes involved applying silicon to the surface, which is neither found in chitosan nor in the polymeric structure of the textile materials. Although mapping is not suitable for silicon detection, the spectroscopic detection of silicon on the textiles’ surfaces was possible with SEM/EDS. This can be used to detect functionalization with silanes. Figure 8 shows the respective EDS spectra.
The carbon peak (0.27 keV) is the most prominent signal, followed by the oxygen peak (0.53 keV). Because of their chemical structures, cotton and polyester have different C to O peak ratios (see also Table 2). In both spectra (Figure 8a,b), the silicon peak at 1.75 keV proves the presence of AMEO and GLYEO on the textiles, respectively. A peak at 1.48 eV was found, which can be assigned to aluminum and is considered an artifact from the aluminum sample holder used for EDS measurement.
Figure 9 compares the silicon contents on the textiles’ surfaces for the different finishes described in Table 4.
The values for the PES (Figure 9a) and CO/PES (Figure 9b) materials showed clear differences. Although the silane concentrations were the same for both materials in the finishing solutions, only a very small amount of silane was detected on the polyester samples (Figure 9a). The normalized Si content ranged between 0.02% and 0.09%. In this regard, almost no differences were found between AMEO and GLYEO. Compared to cotton, the Si contents on the polyesters were reduced by one-quarter to one-third. This was due to the general hydrophobicity of the polyester, caused by its chemical structure. Therefore, a reduced affinity of polyester materials to aqueous finishing solutions could be found, which was approximately 20% lower than with cotton (see Figure 1).
For cotton/polyester samples (Figure 9b), the silicone content on the textile surface following the two-step application process of AMEO was also very low, at 0.06% (AMEO). A lower affinity of AMEO for the cotton fibers seems to have been responsible for this, as was evident when AMEO was applied alone (0.12%). When using the one-step application procedure, much more silicon was detected (0.28%). Chemically, there is a high affinity between chitosan and cotton, as the structures are very similar. Hydrogen bonds can be formed between the hydroxyl groups of the hydrolyzed AMEO and amino and hydroxyl groups on the chitosan, such that AMEO adsorbs on chitosan. Thus, in the one-step procedure, AMEO can be more effectively applied to the textile via the affinity of the chitosan for the cotton. In the two-step procedure, this type of adsorption was blocked.
When finishing cotton/polyester with chitosan and GLYEO using the one-step procedure, only low levels of silicon (0.05%) were detected on the textile surface. On the other hand, applying GLYEO or GLYEO along with chitosan, using the one-step procedure, led to silicon levels of 0.23% and 0.21%, respectively. The epoxy ring of GLYEO can open and react with the hydroxyl groups of cotton fibers [36,37] or chitosan. In the two-step application process, chitosan can block the silane, making it undetectable.
Very low silicon levels of 0.01% were detected in both the chitosan samples (296 and 297) and the textile references (298 and 299), and have not been integrated in the graph. These levels are within the range of the measurement error.
After the samples had been washed, the silicon values decreased and were within the range of the measurement error for almost all samples. However, sample 289B (GLYEO/ChD 1-step) had still a very low silicon content, of 0.04%. On the other hand, sample 294B (GLYEO) had a consistent silicon content of 0.23% before washing, which was 0.24% after washing. This suggests that silanes are not suitable for use as binders for chitosan when applied in this way. However, there is a strong affinity between GLYEO and the cotton/polyester fiber. Due to the low concentration overall, this cannot be confirmed visually using SEM images (see Figure 6).

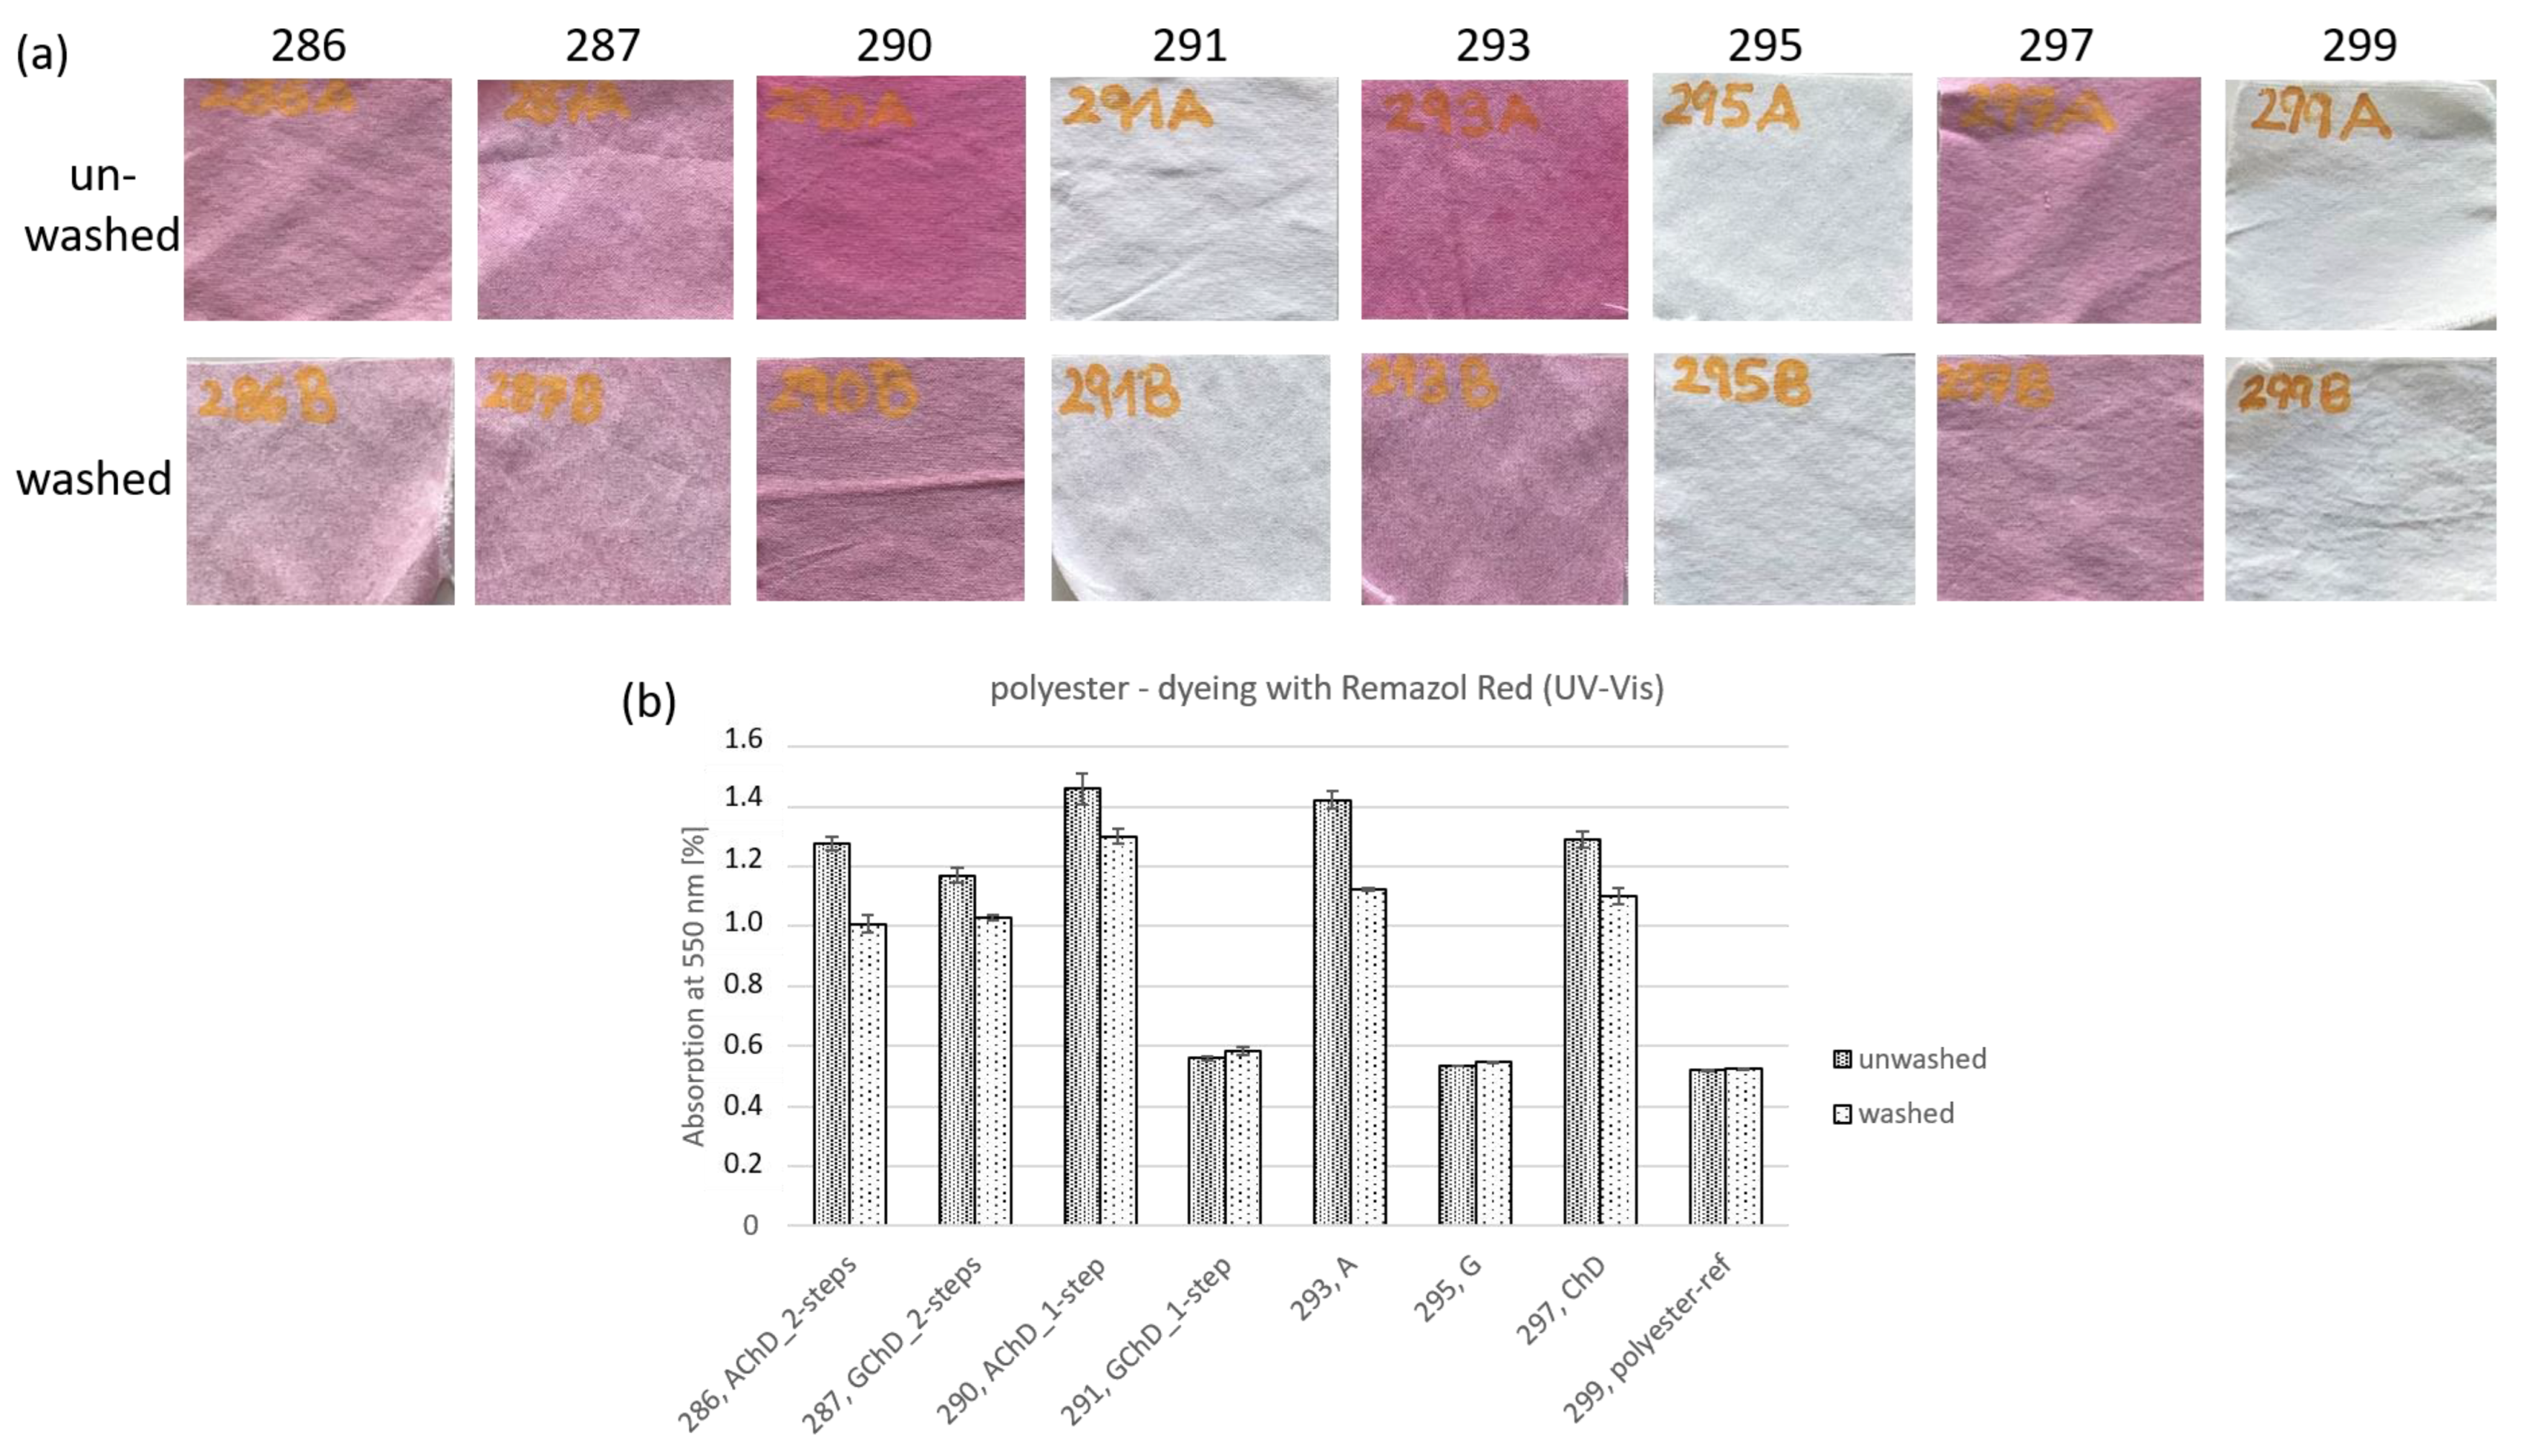
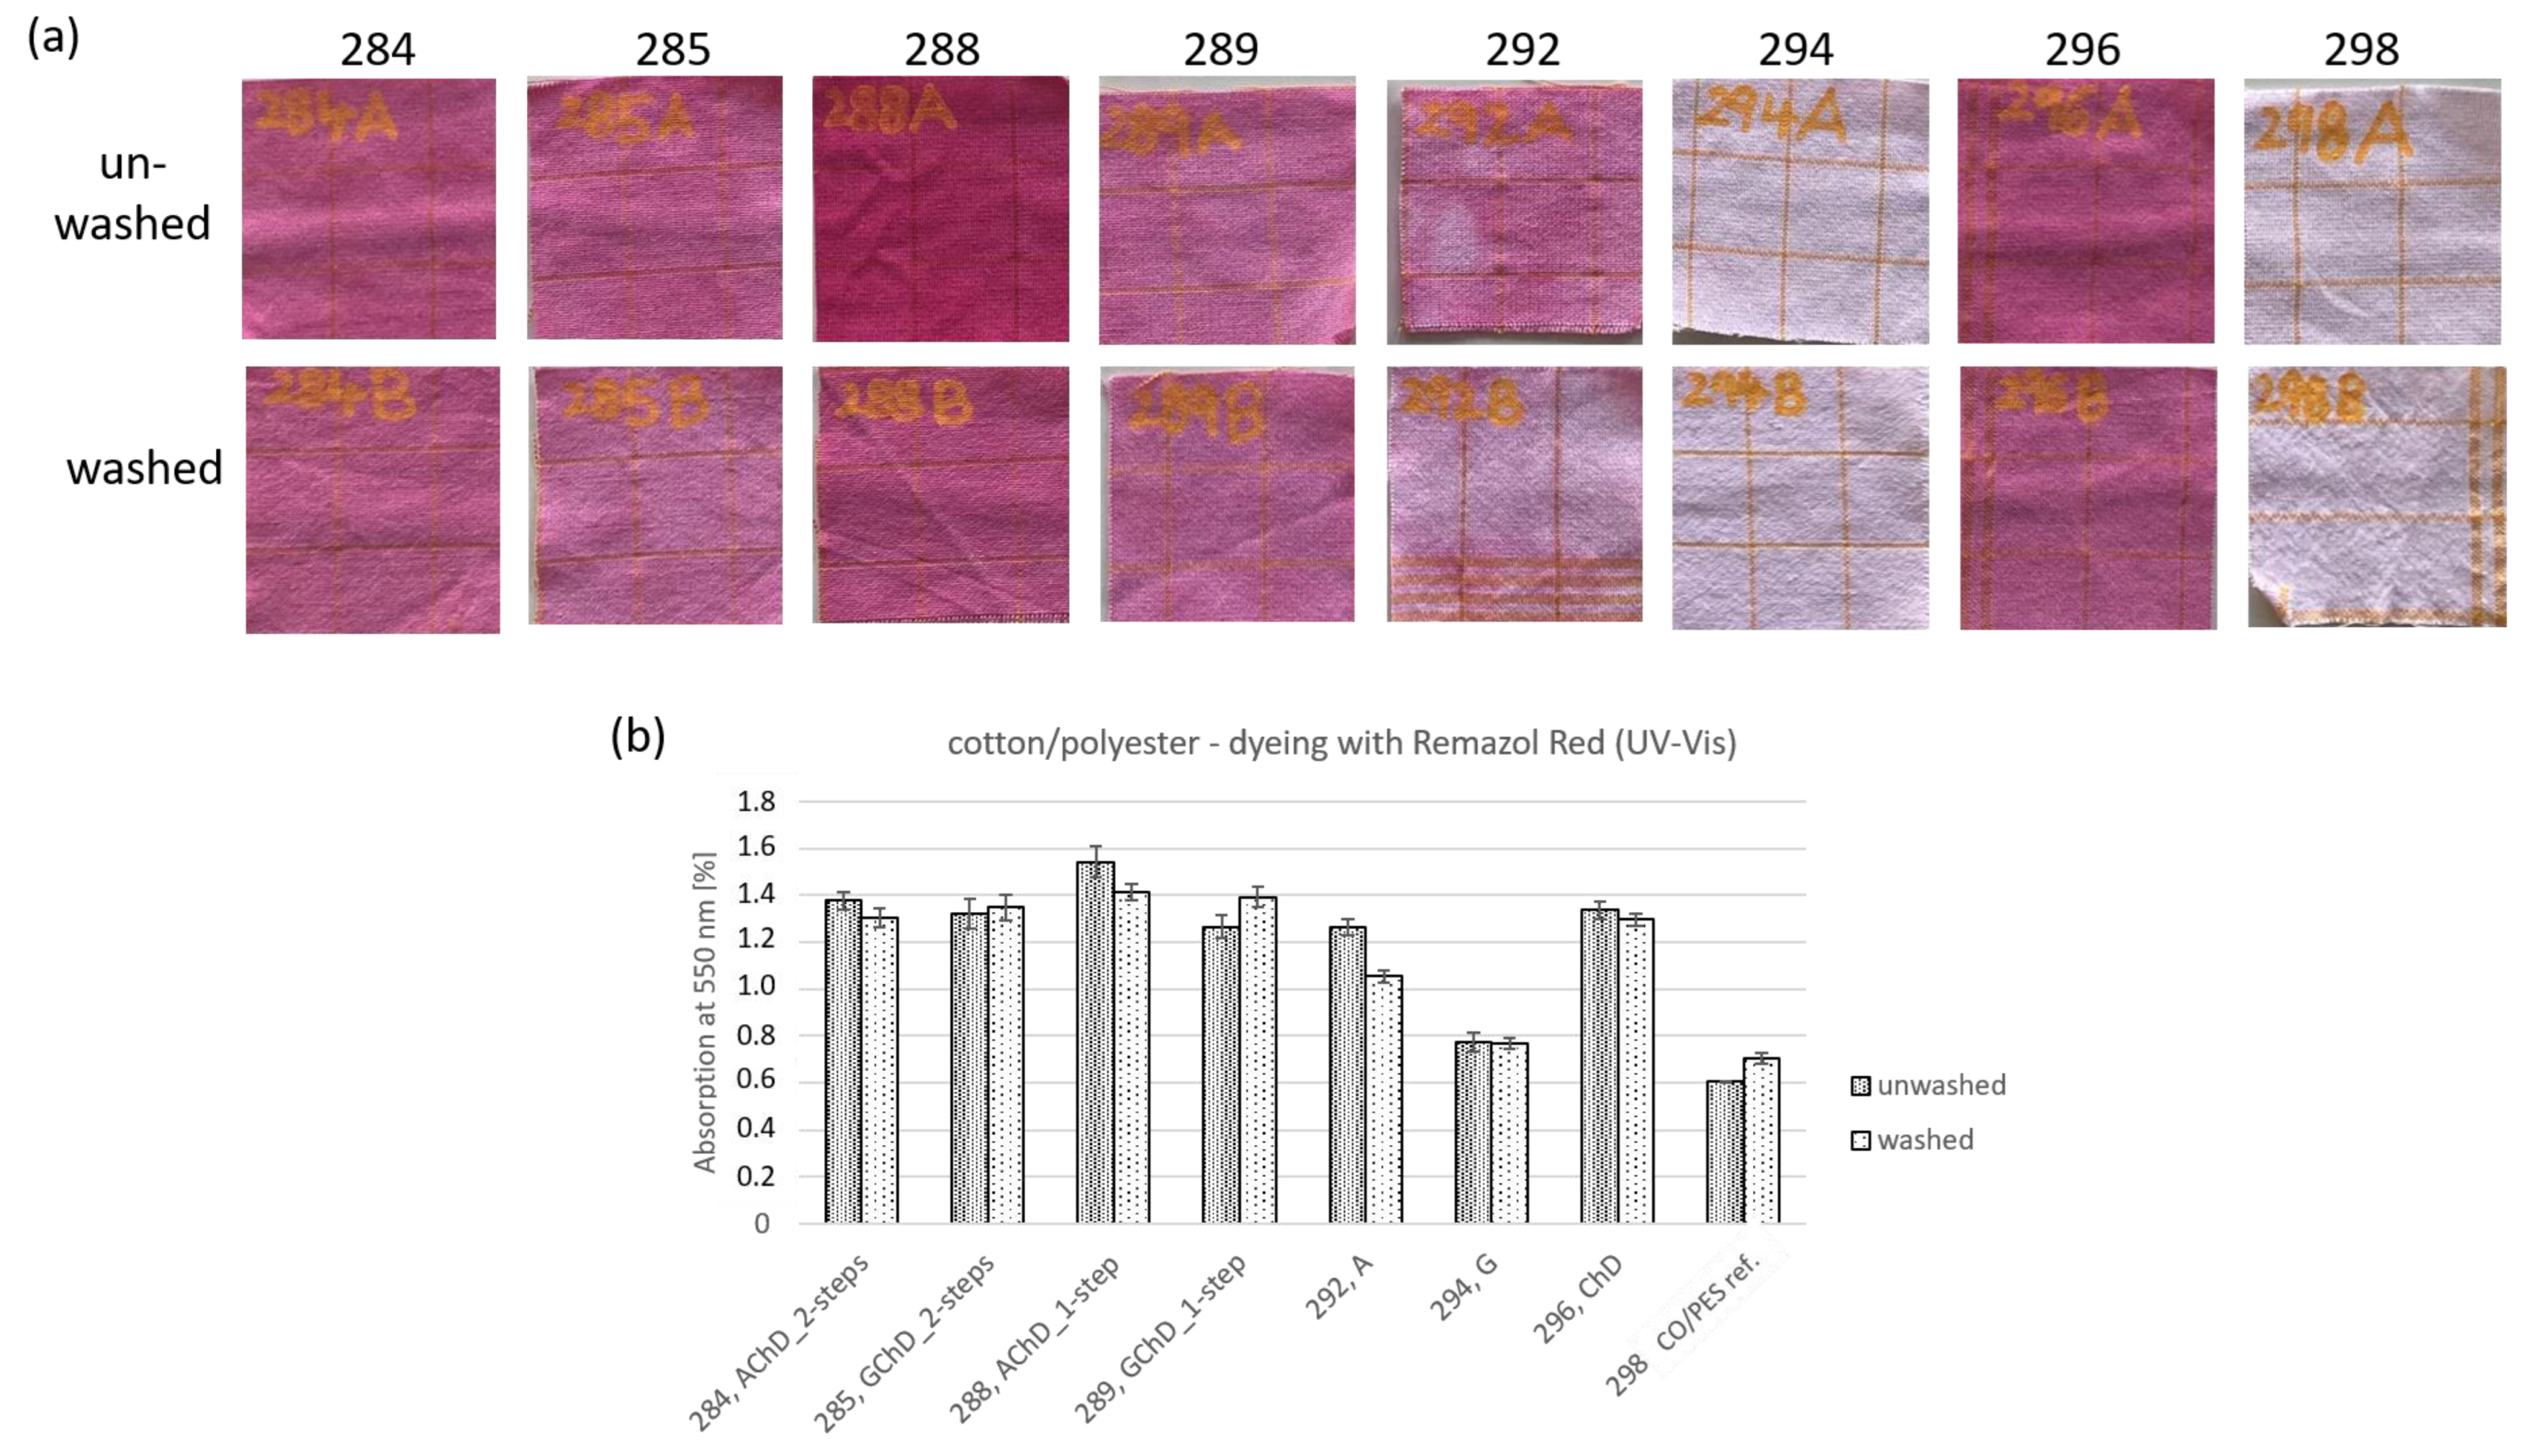
3.2.2. Dyeing with Remazol Brilliant Red F3B
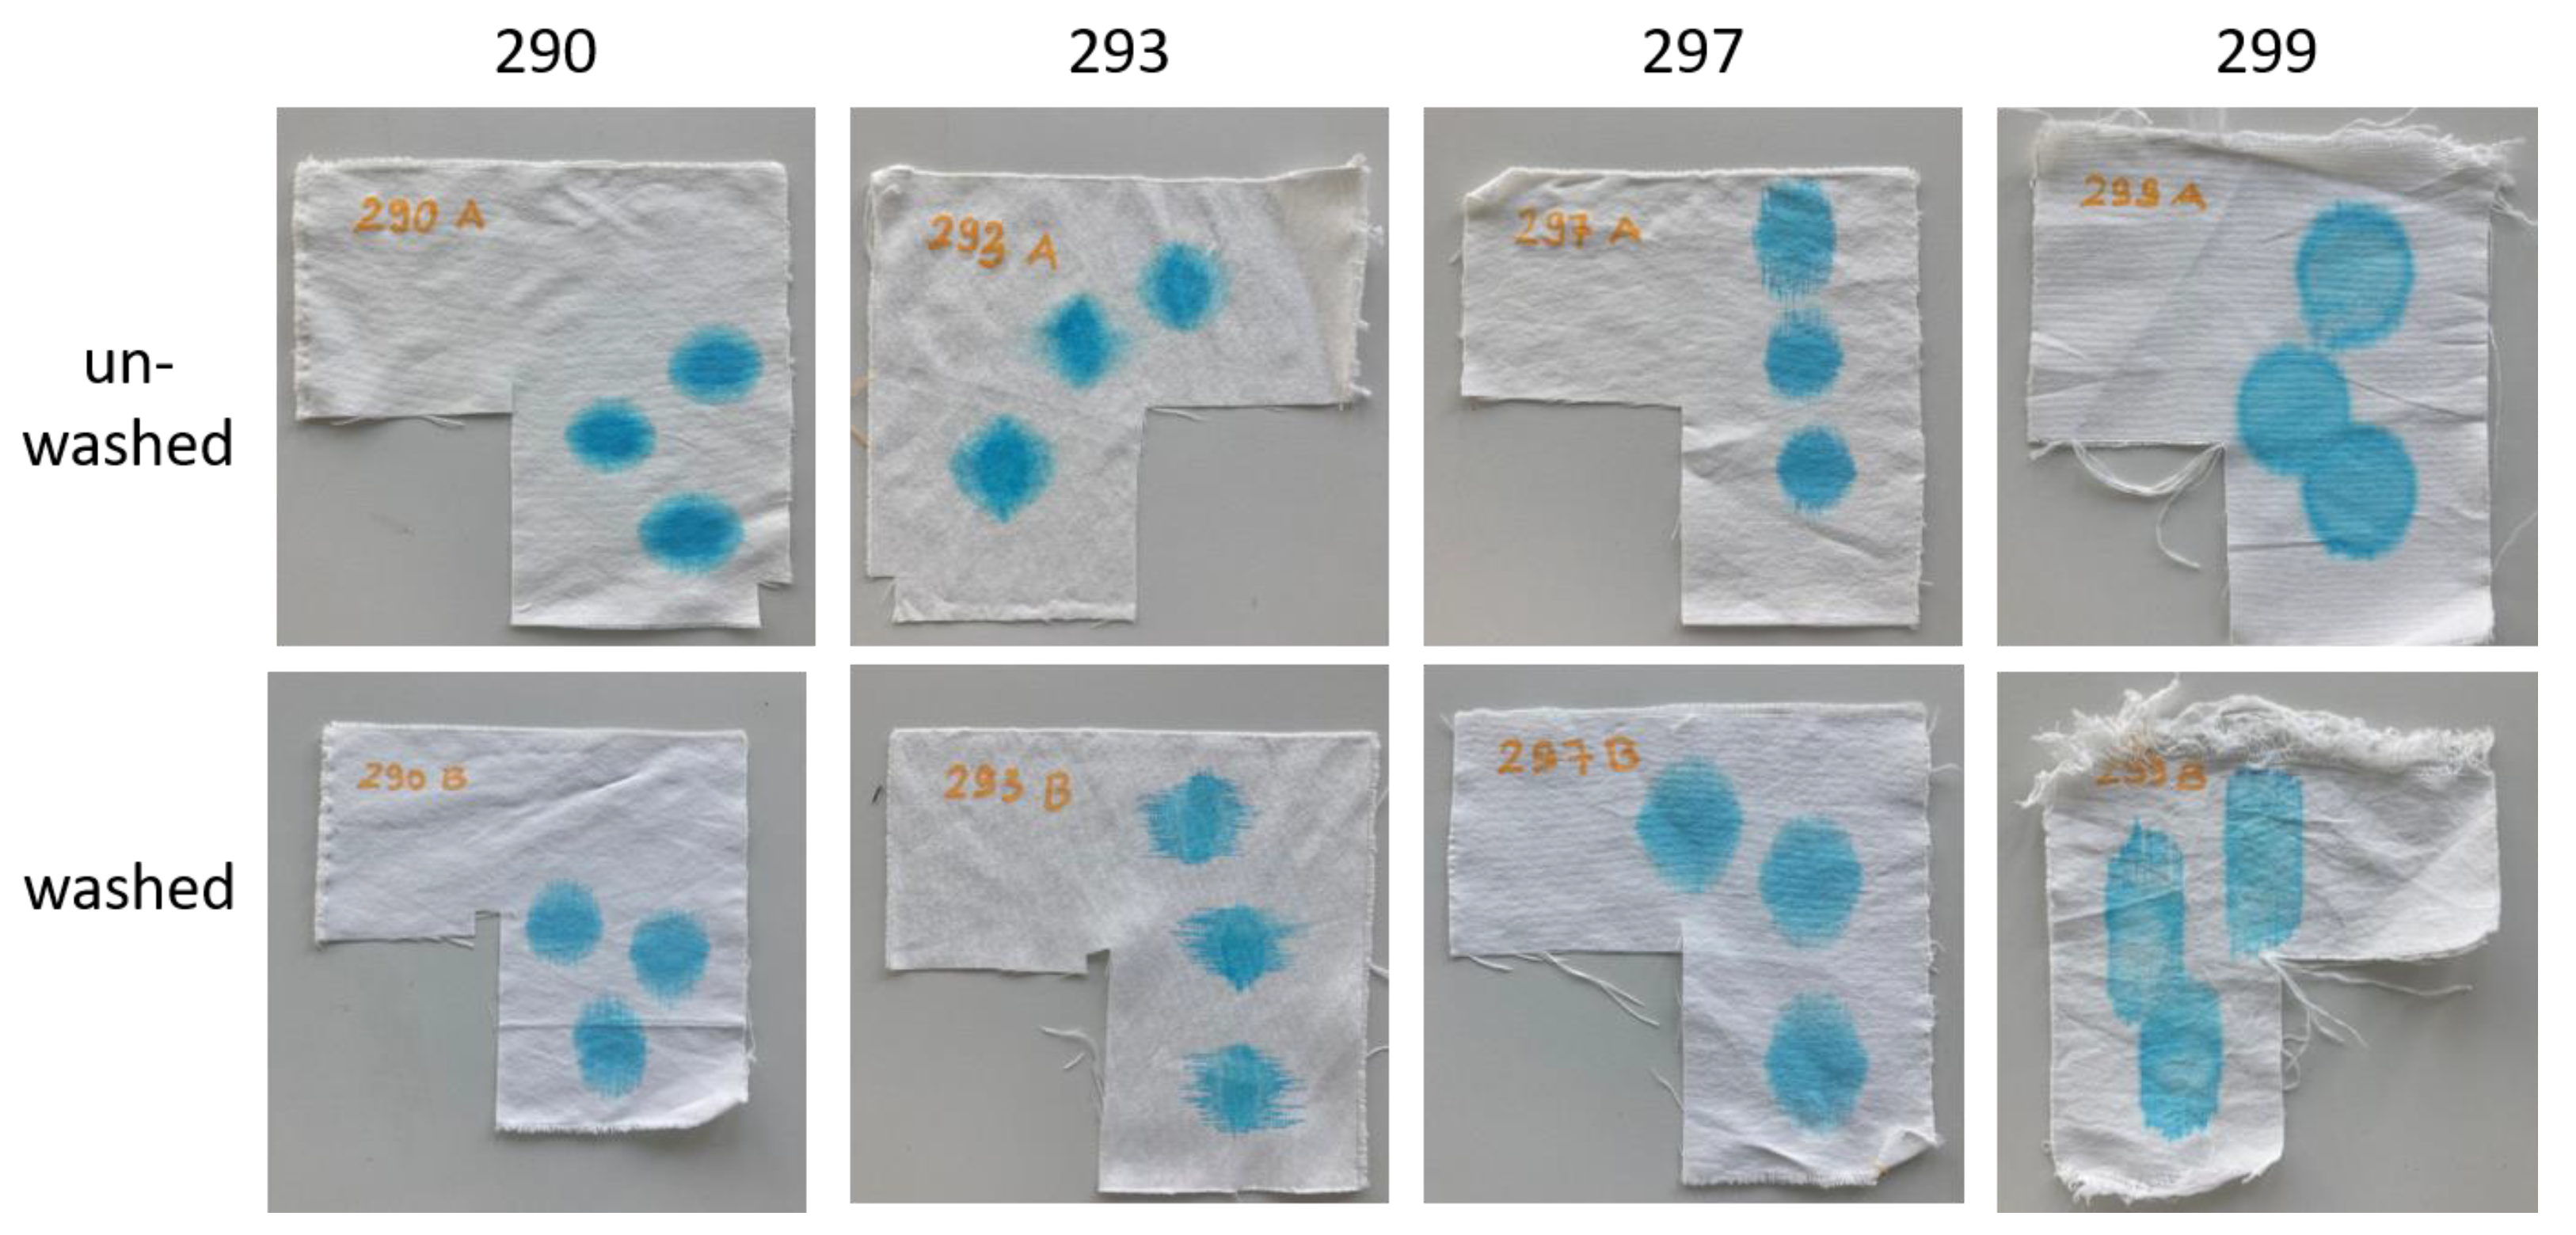
The observation of textiles with different chitosan concentrations showed that chitosan could be detected by staining with Remazol Red (see Figure 4 and Figure 5). This method was also used in the second series of experiments. The staining of the samples and UV-Vis measurements of the dyed samples were performed. Figure 10 (PES) and Figure 11 (CO/PES) show images of textiles subjected to different functionalization procedures and dyeing with Remazol Brillant Red F3B directly after functionalization. The images of textiles washed five times before staining are also shown (Figure 10a and Figure 11a). Figure 10b and Figure 11b show the absorption maxima at 550 nm of the measured UV-Vis spectra.
The AMEO-functionalized textiles showed significantly stronger dyeing than the GLYEO samples with polyester textiles (Figure 10a). The one-step application procedure with AMEO and chitosan (samples 290) and functionalization with AMEO only (sample 293) led to the strongest dye uptake. The samples finished with chitosan only (sample 297) and the ones finished with the two-step application of AMEO and chitosan (sample 286) showed slightly weaker uptake. This is because the free amino groups present in chitosan can react with the anionic dye molecules, as mentioned in a study by Huang [32]. A similar effect appears to occur with AMEO, which includes free amino groups as well.
When finished with GLYEO, only the sample subjected to the two-step application procedure (sample 287) was stained. Other samples showed no or only very weak staining. After washing, the staining with Remazol Red was weaker. No differences could be observed in samples that showed almost no staining before washing (samples 291, 295, and 299; see Figure 10).
Most of the cotton/polyester samples were clearly colored by Remazol Brilliant Red F3B, except for the cotton reference (sample 298) and the GLYEO-treated samples (294) (see Figure 11a). As with polyester, the one-step application of AMEO and chitosan (sample 288) led to the strongest staining, and this was also the sample with the highest silicon content detected on the textile surface (see Figure 9b). The staining depths were comparable with the other samples. The washed samples showed just slightly lighter coloring after washing. Notably, samples subjected to the two-step application of chitosan with AMEO (sample 284) and GLYEO (sample 285), as well as chitosan alone (sample 286), showed washing stability (see Figure 11b).
The results show that the washing fastness of chitosan on CO/PES textiles was very high, and was not further improved by GLYEO or AMEO. On polyester textiles, the absorption of the dye was reduced after washing, indicating a reduction in the amount of chitosan on the fabric. However, neither the addition of GLYEO nor of AMEO could improve this.

3.2.3. Water Uptake

The hydrophilic/hydrophobic properties of the functionalized samples were analyzed using the TEGEWA drop test. Here, the spreading of the dyed water droplet and its sink-in time were measured. Short sink-in times imply the hydrophilicity of the textiles [19]. The results are displayed in Table 5.
Figure 12 shows examples of PES samples and Figure 13 of CO/PES samples.
The blue dye solution spread nearly equally, and in a circular shape, on the unwashed PES samples. The yarn density, differing by 2 yarns/cm in the warp and weft direction (see Table 1), did not influence the droplet’s absorption. The sink-in times were in the range of one to two seconds. GLYEO alone or with chitosan (one-step) increased the hydrophilicity of the fabric slightly, while with all other modes of functionalization, the textiles became more hydrophobic. Although the sink-in times differed in very small ranges, the effects of the functionalization became more obvious when comparing the spreading of the droplets (see Figure 12). After washing, only small changes were noticed in the spreading and sink-in times. The unwashed CO/PES samples showed much more significant spreading of the droplet in the warp direction than in the weft direction. The sink-in times were very long and ranged from 4 (sample 294A) to over 24 min (sample 285A). Finer-yarn counts in the warp direction and possibly an unknown pretreatment contributed to this result. After washing, this effect was negligible, and spreading in the weft and warp direction was more homogeneous. The sink-in times were dramatically decreased to around 0.5 to 1 s.
Applyingf GLYEO was supposed to increase the hydrophilicity of functionalized textiles [19]. The samples functionalized with GLYEO here showed the shortest sink-in time for polyester (sample 295A) as well as for cotton (sample 294A), demonstrating their high hydrophilicity and confirming our expectations. AMEO had only a small effect on the sink-in time. Chitosan products with a high DD, like the ChD used in this study (DD of 90%), are expected to increase the hydrophilicity of functionalized textiles when using polyester (see [19]), as seen in Table 5. In contrast, the chemical structure of chitosan is less polar than that of cotton due to the presence of an acetylation group, which results in a more hydrophobic surface of the CO/PES mix fabric. Additionally, the air permeability, which is influenced by the porosity, is decreased by the application of chitosan, thus having an influence on the water absorption properties. As regards the CO/PES textile, the air permeability was reduced from 862 L/m2/s for the unfunctionalized material (see Table 1) to 507 ± 12 L/m2/s, and for the PES textile from 185 ± 9 L/s2/m to 123 ± 3 L/m2/s. Combinations of chitosan with silanes made textiles more hydrophobic, depending on the application method. The reason for this effect is probably the different affinities of the functionalization compounds for the polymeric textile material, as described above. These results demonstrate the different possibilities of adjusting the hydrophilic and hydrophobic properties of both cotton and polyester textiles using different combinations of chitosan with silanes. Enhancing the water-uptake properties of polyester samples should reduce the electrical resistance of the samples, and thus increase the antistatic properties of the samples [19]. Beside the microstructure of a surface, soiling with dry soil depends on electrostatic interactions [38,39], and reducing the electrostatic resistance can result in reduced soiling. In contrast, increasing the hydrophobic properties of cotton (or cotton/polyester) textiles reduces the fast soiling of these materials with aqueous soils.

4. Conclusions

This study presents the evaluation of a robust method for analyzing chitosan on cotton/polyester and pure polyester textiles, and the functionalization of these textiles with chitosan, AMEO, or GLYEO silanes. The properties of the textiles were altered and analyzed using various methods. The SEM images show that high concentrations of chitosan (3.5% or higher) were present on the textiles’ surfaces, while EDS spectroscopy did not confirm this. The presence of chitosan on the surface was confirmed by the adsorption of Remazol Brilliant Red F3B reactive dye. This method was suitable for use in distinguishing between non-functionalized and functionalized textiles with different chitosan concentrations. The experiments also showed that the chitosan on the textiles had good washing resistance. Silanes did not improve functionalization stability, but increased textile hydrophilicity without chitosan. Chitosan made textiles hydrophobic and increased the sink-in time in the TEGEWA drop test. In conclusion, these investigations show that recipes incorporating chitosan can be part of a method of functionalization used to adjust the hydrophilic properties of polyester and cotton textiles. Via this first step, in the future, a new combination of bio-based polymers with inorganic binder systems can be developed, ultimately leading to sustainable antimicrobial materials with modified hydrophilic properties.

Author Contributions

Conceptualization, K.K. and B.M.; methodology, K.K. and H.H.; investigation, K.K. (especially silane functionalization), H.H. (especially chitosan detection methods and analysis), L.E. (analysis) and H.T. (analysis); data evaluation, K.K., H.T., L.E., H.H. and M.T.H.; writing—original draft preparation, K.K. and B.M.; writing—review and editing, H.H., M.T.H., L.E. and H.T.; supervision, B.M.; project administration, B.M.; funding acquisition, K.K. and B.M. All authors have read and agreed to the published version of the manuscript.

Funding

This research work was funded by Zentrales Innovationsprogramm Mittelstand (ZIM) by the Federal Ministry for Economic Affairs and Climate Action on the basis of a decision of the German Bundestag (Reference Number: KK5163005PK1).

Data Availability Statement

Data are contained within the article.

Acknowledgments

The authors owe many thanks to Simone Wagner and to Gudrun Lieutenant-Bister (Niederrhein University of Applied Science, Faculty of Textile and Clothing Technology) for their technical assistance in the lab. The authors would like to thank Lisa-Marie Brodka for her support in designing the graphic abstract.

Conflicts of Interest

The authors declare no conflicts of interest. The funders had no role in the design of the study, in the collection, analyses, or interpretation of data; in the writing of the manuscript, or in the decision to publish the results.

References

  1. Singh, M.K. Textiles functionalization-a review of materials, processes, and assessment. In Textiles for Functional Application; Kumar, B., Ed.; IntechOpen: London, UK, 2021; Volume 43. [Google Scholar] [CrossRef]
  2. Joseph, P.; Tretsiakova-McNally, S. Chemical modification of natural and synthetic textile fibres to improve flame retardancy. In Handbook of Fire Resistant Textiles; Kilinc, F.S., Ed.; Woodhead Publishing: Camebridge, UK, 2013; Volume 140, pp. 37–67. [Google Scholar]
  3. Saleh, N.S.; Khaffaga, M.M.; Ali, N.M.; Hassan, M.S.; El-Naggar, A.W.M.; Rabi, A.G.M. Antibacterial functionalization of cotton and cotton/polyester fabrics applying hybrid coating of copper/chitosan nanocomposites loaded polymer blends via gamma irradiation. Int. J. Biol. Macromol. 2021, 183, 23–34. [Google Scholar] [CrossRef]
  4. Guimond, S.; Hanselmann, B.; Amberg, M.; Hegemann, D. Plasma functionalization of textiles: Specifics and possibilities. Pure Appl. Chem. 2010, 82, 1239–1245. [Google Scholar] [CrossRef]
  5. Kappes, R.S.; Urbainczyk, T.; Artz, U.; Textor, T.; Gutmann, J.S. Flame retardants based on amino silanes and phenylphosphonic acid. Polym. Degrad. Stab. 2016, 129, 168–179. [Google Scholar] [CrossRef]
  6. Ragab, M.M.; Hassabo, A.G. Various uses of natural plants extracts for functionalization textile based materials. J. Text. Color. Polym. Sci. 2021, 18, 143–158. [Google Scholar] [CrossRef]
  7. Singh, M.; Vajpayee, M.; Ledwani, L. Eco-friendly surface modification and nanofinishing of textile polymers to enhance functionalisation. In Nanotechnology for Energy and Environmental Engineering; Springer: Cham, Switzerland, 2020; pp. 529–559. [Google Scholar] [CrossRef]
  8. Yılmaz, F.; Aydınlıoğlu, Ö.; Benli, H.; Gültepe, G.; Bahtiyari, M.İ. Natural functionalisation of a traditional textile “Ehram”. Color. Technol. 2023, 139, 182–189. [Google Scholar] [CrossRef]
  9. Zhou, B.C.E.; Kan, C.W.; Sun, C.; Du, J.; Xu, C. A review of chitosan textile applications. AATCC J. Res. 2019, 6 (Suppl. S1), 8–14. [Google Scholar] [CrossRef]
  10. Butola, B.S. Recent advances in chitosan polysaccharide and its derivatives in antimicrobial modification of textile materials. Int. J. Biol. Macromol. 2019, 121, 905–912. [Google Scholar] [CrossRef]
  11. Grgac, S.F.; Tarbuk, A.; Dekanić, T.; Sujka, W.; Draczynski, Z. The Chitosan Implementation into Cotton and Polyester/Cotton Blend Fabrics. Materials 2020, 13, 1616. [Google Scholar] [CrossRef]
  12. Hoque, M.T.; Benrui, T.; Grethe, T.; Mahltig, B. Evaluation of chitosan based pretreatment for cotton and linen dyeing with direct dyes and reactive dyes. Commun. Dev. Assem. Text. Prod. 2023, 4, 187–200. [Google Scholar] [CrossRef]
  13. No, H.K.; Meyers, S.P. Preparation and characterization of chitin and chitosan—A review. J. Aquat. Food Prod. Technol. 1995, 4, 27–52. [Google Scholar] [CrossRef]
  14. Kou, S.G.; Peters, L.M.; Mucalo, M.R. Chitosan: A review of sources and preparation methods. Int. J. Biol. Macromol. 2021, 169, 85–94. [Google Scholar] [CrossRef]
  15. Kumari, S.; Kishor, R. Chitin and chitosan: Origin, properties, and applications. In Handbook of Chitin and Chitosan; Gopi, S., Thomas, S., Pius, A., Eds.; Elsevier: Amsterdam, The Netherlands, 2020; Volume 1, pp. 1–34. [Google Scholar]
  16. Sharaf, S.; Opwis, K.; Knittel, D.; Gutmann, J.S. Comparative investigations on the efficiency of different anchoring chemicals for the permanent finishing of cotton with chitosan. AUTEX Res. J. 2011, 11, 71–77. [Google Scholar] [CrossRef]
  17. Fouda, M.M.; Wittke, R.; Knittel, D.; Schollmeyer, E. Use of chitosan/polyamine biopolymers based cotton as a model system to prepare antimicrobial wound dressing. Int. J. Diabetes Mellit. 2009, 1, 61–64. [Google Scholar] [CrossRef]
  18. Haufe, H.; Thron, A.; Fiedler, D.; Mahltig, B.; Böttcher, H. Biocidal nanosol coatings. Surf. Coat. Int. Part B Coat. Trans. 2005, 88, 55–60. [Google Scholar] [CrossRef]
  19. Chen, G.; Haase, H.; Mahltig, B. Chitosan-modified silica sol applications for the treatment of textile fabrics: A view on hydrophilic, antistatic and antimicrobial properties. J. Sol-Gel Sci. Technol. 2019, 91, 461–470. [Google Scholar] [CrossRef]
  20. Abdel-Halim, E.S.; Abdel-Mohdy, F.A.; Al-Deyab, S.S.; El-Newehy, M.H. Chitosan and monochlorotriazinyl-β-cyclodextrin finishes improve antistatic properties of cotton/polyester blend and polyester fabrics. Carbohydr. Polym. 2010, 82, 202–208. [Google Scholar] [CrossRef]
  21. Zargar, V.; Asghari, M.; Dashti, A. A review on chitin and chitosan polymers: Structure, chemistry, solubility, derivatives, and applications. ChemBioEng Rev. 2015, 2, 204–226. [Google Scholar] [CrossRef]
  22. Qin, C.; Li, H.; Xiao, Q.; Liu, Y.; Zhu, J.; Du, Y. Water-solubility of chitosan and its antimicrobial activity. Carbohydr. Polym. 2006, 63, 367–374. [Google Scholar] [CrossRef]
  23. Hong, K.H. Preparation and properties of cotton fabrics dyed by Aronia (Aronia melanocarpa) extract and chitosan. Fash. Text. 2023, 10, 14. [Google Scholar] [CrossRef]
  24. Hilal, N.M.; Gomaa, S.H.; ELsisi, A.A. Improving Dyeing Parameters of Polyester/Cotton Blended Fabrics by Caustic Soda, Chitosan, and Their Hybrid. Egypt. J. Chem. 2020, 63, 2379–2393. [Google Scholar] [CrossRef]
  25. Najafzadeh, N.; Habibi, S.; Ghasri, M.A. Dyeing of Polyester with Reactive Dyestuffs Using Nano-Chitosan. J. Eng. Fibers Fabr. 2018, 13, 47–51. [Google Scholar] [CrossRef]
  26. Hunger, K. (Ed.) Industrial Dyes–Chemistry, Properties, Applications; Wiley-VCH: Weinheim, Germany, 2003; p. 4ff. [Google Scholar]
  27. Muralidharan, B.; Laya, S. A New Approach to Dyeing of 80:20 Polyester/Cotton Blended Fabric Using Disperse and Reactive Dyes. ISRN Mater. Sci. 2011, 2011, 90749. [Google Scholar] [CrossRef]
  28. Hoque, M.-T.; Klinkhammer, K.; Mahltig, B. HT process for treatment of PET fabrics with chitosan containing recipes. Commun. Dev. Assem. Text. Prod. 2023, 4, 222–230. [Google Scholar] [CrossRef]
  29. Al-Bahra, M.M. Darstellung von Chitinderivaten zur Antimikrobiellen Ausrüstung von Textilien. Ph.D. Dissertation, RWTH Aachen University, Aachen, Germany, 2004. [Google Scholar]
  30. Schmidt, G.; Wurster, P. Der TEGEWA-Tropftest–eine Methode zur schnellen Bestimmung der Saugfähigkeit an textilen Flächengebilden. Melliand Textilberichte 1987, 68, 581–583. [Google Scholar]
  31. Hohenbild, H. Evaluation Quantitativer Nachweismethoden von Chitosan auf Textilien aus Baumwolle und Polyester. Master’s Thesis, Niederrhein University of Applied Sciences, Mönchengladbach, Germany, 2023. [Google Scholar]
  32. Huang, L.; Xiao, L.; Yang, G. Chitosan Application in Textile Processing. Curr. Trends Fash. Technol. Text. Eng. 2018, 4, 555635. [Google Scholar] [CrossRef]
  33. Ristic, N.; Jovancic, P.; Canal, C.; Jocic, D. One-bath One-dye Class Dyeing of PES/Cotton Blends after Corona and Chitosan Treatment. Fibers Polym. 2009, 10, 466–475. [Google Scholar] [CrossRef]
  34. Roy, M.N.; Hossain, M.T.; Hasan, M.Z.; Islam, K.; Rokonuzzaman, M.; Islam, M.A.; Khandaker, S.; Bashar, M.M. Adsorption, Kinetics and Thermodynamics of Reactive Dyes on Chitosan Treated Cotton Fabric. Text. Leather Rev. 2023, 6, 211–232. [Google Scholar] [CrossRef]
  35. Pušić, T.; Kaurin, T.; Liplin, M.; Budimir, A.; Čurlin, M.; Grgić, K.; Sutlović, A.; Volmajer Valh, J. The Stability of the Chitosan Coating on Polyester Fabric in the Washing Process. Tekstilec 2023, 66, 85–104. [Google Scholar] [CrossRef]
  36. Zhu, Q.; Gao, Q.; Guo, Y.; Yang, C.Q.; Shen, L. Modified silica sol coatings for highly hydrophobic cotton and polyester fabrics using a one-step procedure. Ind. Eng. Chem. Res. 2011, 50, 5881–5888. [Google Scholar] [CrossRef]
  37. Riegel, B.; Kiefer, W.; Hofacker, S.; Schottner, G. FT-Raman Spectroscopic Investigations on the Organic Crosslinking in Hybrid Polymers Part II: Reactions of Epoxy Silanes. J. Sol-Gel Sci. Technol. 2002, 24, 139–145. [Google Scholar] [CrossRef]
  38. Hochreiter, R. Schmutzabweisende Ausrüstungen von Textilien. Fette Seifen Anstrichm. 1966, 68, 31–41. [Google Scholar] [CrossRef]
  39. Jacobasch, H.-J.; Freitag, K.-H. Zur Adhäsion von Polymeren. Acta Polym. 1979, 30 Pt B, 453–469. [Google Scholar] [CrossRef]
Figure 1. Liquor pickup of polyester and cotton/polyester fabrics during functionalization with different chitosan concentrations. Standard deviations were calculated as 2% for PES and 6.5% for CO/PES. This image was modified according to results from [31].
Textiles 04 00006 g001
Figure 2. SEM images of PES fabrics functionalized with chitosan, (a) reference, 0% ChD, (b) 1% ChD, (c) 2% ChD, (d) 3% ChD, (e) 4% ChD; scale bar = 200 µm. Red circles highlight undissolved chitosan. Images are used with permission from [31].
Textiles 04 00006 g002
Figure 3. SEM images of CO/PES fabrics functionalized with chitosan, (a) reference, 0% ChD, (b) 1% ChD, (c) 2% ChD, (d) 3% ChD, (e) 4% ChD; scale bar = 200 µm. Red circles highlight undissolved chitosan. Images are used with permission from [31].
Textiles 04 00006 g003
Figure 4. Polyester (a) and cotton/polyester (b) textiles, functionalized with different chitosan concentrations and dyed with Remazol Brilliant Red F3B. aa: Reference textiles, wetted with 1% acetic acid, but without chitosan. Images are used with permission from [31].
Textiles 04 00006 g004
Figure 5. UV-Vis spectroscopy of dyed chitosan samples. (a) UV-Vis spectra for stained PES samples. (b) UV-Vis spectra for stained CO/PES samples. (c) Absorption at the absorption peak of 550 nm at different chitosan concentrations. The mean and standard deviations calculated from three measurements are shown. Image modified according to data from [31].
Textiles 04 00006 g005
Figure 6. SEM images of polyester (a) and cotton/polyester (b) samples, directly after finishing (A) and after five washing cycles (B). The magnification is the same in all images and the scale bars (=50 µm) presented in the first pictures can be used for all images.
Textiles 04 00006 g006
Figure 7. SEM images of samples 284B and 288B, combined with EDS mapping of silicon (Si) in orange (scale bars = 100 µm).
Textiles 04 00006 g007
Figure 8. EDS spectra of textiles functionalized with AMEO (a) and with GLYEO (b).
Textiles 04 00006 g008
Figure 9. Silicon (Si) contents of differently functionalized polyester (a) and cotton/polyester textiles (b). Mean values and standard deviations (as error bars) of three measurements are presented. If no error bar is seen, the standard deviation is 0.00%.
Textiles 04 00006 g009
Figure 10. Polyester fabrics functionalized in different ways and dyed with Remazol Brilliant Red F3B; (a) photographs of unwashed and washed samples; (b) UV-Vis absorption of dyed samples at 550 nm.
Textiles 04 00006 g010
Figure 11. Cotton/polyester fabrics functionalized in different ways and dyed with Remazol Brilliant Red F3B; (a) photographs of unwashed and washed samples; (b) UV-Vis absorption of dyed samples at 550 nm.
Textiles 04 00006 g011
Figure 12. Water uptake on polyester samples before and after washing.
Textiles 04 00006 g012
Figure 13. Water uptake on cotton/polyester samples before and after washing.
Textiles 04 00006 g013
Table 1. Textile parameter of woven fabrics. Images were taken using a light microscope with a magnification of 30×.
PropertyPESCO/PES
image (scale bar = 1 mm)Textiles 04 00006 i001Textiles 04 00006 i002
warp density 16.5 yarns/cm
filament yarn
18 yarns/cm
ply yarn
weft density14.5 yarns/cm
filament yarn
13 yarns/cm
ply yarn
grammage 150 g/m2190 g/m2
thickness0.44 ± 0.007 mm0.67 ± 0.057 mm
type of textile weaveplainplain
air permeability185 ± 9.l/m2/s862 ± 10 L/m2/s
Table 2. Elemental distribution of textiles’ surfaces analyzed by REM/EDS with mean values and standard deviation (SD) for three measurements per sample.
Reference1% Chitosan2% Chitosan3% Chitosan4% Chitosan
PESmean (At. %)SDmean (At. %)SDmean (At. %)SDmean (At. %)SDmean (At. %)SD
carbon68.90.568.50.3468.60.6467.90.2368.40.22
oxygen31.10.531.50.3431.40.6432.10.2331.60.22
Reference1% Chitosan2% Chitosan3% Chitosan4% Chitosan
CO/PESmean (At. %)SDmean (At. %)SDmean (At. %)SDmean (At. %)SDmean (At. %)SD
carbon58.80.960.51.6560.91.0959.90.5560.71.34
oxygen41.20.939.51.6539.11.0940.10.5539.31.34
Table 3. Calculated chitosan concentration for PES and CO/PES textiles.
Chitosan Concentration in Padding Bath (%)PES CO/PES
liquor Pickup (%)Calculated Chitosan Concentration (%)Liquor Pickup (%)Calculated Chitosan Concentration (%)
0.5670.3870.4
1.0740.7900.9
1.5641.0861.3
2.0721.4941.9
2.5771.9962.4
3.0832.5942.8
3.5792.8863.0
4.0793.2512.0
Table 4. Sample number and functionalization with concentration of acetic acid (2%); ChD = chitosan (1%); AMEO (2%); GLYEO (2%).
Sample NumberFunctionalizationTextileProcedureApplication 1st StepApplication 2nd Step
284AMEO/ChDCO/PES2-stepspaddingdipping, padding
285GLYEO/ChDCO/PES2-stepspaddingdipping, padding
286AMEO/ChDPES2-stepspaddingdipping, padding
287GLYEO/ChDPES2-stepspaddingdipping, padding
288AMEO/ChDCO/PES1-steppadding-
289GLYEO/ChDCO/PES1-steppadding-
290AMEO/ChDPES1-steppadding-
291GLYEO/ChDPES1-steppadding-
292AMEOCO/PES1-steppadding-
293AMEOPES1-steppadding-
294GLYEOCO/PES1-steppadding-
295GLYEOPES1-steppadding-
296ChDCO/PES1-steppadding-
297ChDPES1-steppadding-
298referenceCO/PES---
299referencePES---
Table 5. Droplet spreading in weft and warp directions and sink-in time for the droplets for functionalized polyester and cotton/polyester samples. Mean values and standard deviations (SD) were calculated following three measurements per sample. If the sink-in time was greater than 5 min, just one measurement (meas.) was performed. A: Unwashed samples. B: Samples after five washing cycles.
Cotton/PolyesterFunctionalizationPolyester
SampleWeft (cm)Warp (cm)Sink-in Time (s)SampleWeft (cm)Warp (cm)Sink-in Time (s)
284A0.62.519.5 min1 meas.AMEO/
ChD
2-steps
286A3.033.101.97mean
SD
0.050.080.30
284B2.832.970.32mean
SD
286B3.873.570.75mean
SD
0.210.050.100.240.120.02
285A0.62.1>24 min1 meas.GLYEO/
ChD
2-steps
287A4.372.972.39mean
0.390.120.11
285B3.082.670.32mean
SD
287B4.333.671.28SD
0.090.050.100.120.050.16
288A0.61.114.02 min1 meas.AMEO/
ChD
1-step1
290A3.672.831.88mean
0.240.050.06
288B3.931.571.23mean
SD
290B3.233.332.71SD
0.190.050.140.170.170.32
289A0.61.2>15 min1 meas.GLYEO/
ChD
1-step1
291A4.203.501.65mean
0.420.220.24
289B2.333.071.05mean
SD
291B5.133.971.37SD
0.170.050.060.260.050.06
292A0.043.38.01 min1 meas.AMEO293A3.703.802.01mean
0.080.220.30
292B3.072.100.99mean
SD
293B3.503.232.69SD
0.050.080.220.080.210.66
294A0.65.44.38 min1 meas.GLYEO295A4.034.371.57mean
0.050.210.30
294B2.432.970.31mean
SD
295B3.535.330.86SD
0.090.090.000.120.250.21
296A0.70.6>15 min1 meas.ChD297A3.233.002.29mean
0.290.000.14
296B3.002.531.06mean
SD
297B3.503.630.71SD
0.140.050.120.080.050.08
298A0.63.68.22 min1 meas.reference299A4.074.771.87mean
0.190.400.32
298B3.472.230.68mean299B3.075.570.72SD
0.050.120.18SD0.120.050.09
Disclaimer/Publisher’s Note: The statements, opinions and data contained in all publications are solely those of the individual author(s) and contributor(s) and not of MDPI and/or the editor(s). MDPI and/or the editor(s) disclaim responsibility for any injury to people or property resulting from any ideas, methods, instructions or products referred to in the content.

