Article

Abandoned, Lost or Otherwise Discarded Fishing Gear (ALDFG) and the Perceptions of Vietnamese Fishers


1
Northern Research Center for Marine Fisheries, Vietnam Academy of Fishery Sciences, Haiphong City 180000, Vietnam
2
Institute of Recycling, Ostfalia University of Applied Sciences, 38440 Wolfsburg, Germany
3
Faculty of Biology, University of Science, Vietnam National University, Hanoi City 100000, Vietnam
*
Authors to whom correspondence should be addressed.
Conservation 2026, 6(2), 67; https://doi.org/10.3390/conservation6020067
Submission received: 27 February 2026 / Revised: 6 April 2026 / Accepted: 8 May 2026 / Published: 1 June 2026

Abstract

Abandoned, lost or otherwise discarded fishing gear (ALDFG) is a global challenge that negatively affects marine ecosystems and fishers’ livelihoods. Survey results from 1864 capture fishers in Vietnam show that the total mass of ALDFG is 82,720 kg/year, with an average loss rate of 0.24% of the total plastic used. The average ALDFG mass from gillnet fisheries is 26.0 ± 1.2 kg/vessel/year, trap fisheries 16.1 ± 2.6 kg/vessel/year, hook and line fisheries 13.8 ± 1.4 kg/vessel/year, trawl fisheries 8.8 ± 1.1 kg/vessel/year, stick-held falling net fisheries 5.1 ± 2.1 kg/vessel/year, and purse seine fisheries 4.2 ± 1.4 kg/vessel/year. Polyethylene (PE) accounts for 47.4%, polyamide (PA) 29.5% and polypropylene (PP) 17.2% of the total ALDFG mass. Results from the selected partial proportional odds model show that fishers’ concern about ALDFG increases with education, fishing experience, vessel length, and stronger awareness of environmental and economic impacts, whereas age, days at sea, perceived navigation hazards, and perceived impacts on fish stocks are negatively associated with concern; perceived tourism impacts show a statistically significant threshold-varying effect across concern levels. These findings provide a scientific basis for developing sustainable fishing-gear management policies, aiming to reduce marine plastic pollution in Vietnam. These findings provide evidence for conservation-oriented fishing-gear management in Vietnam by identifying the gear types and fisher perceptions most relevant to reducing ghost fishing, marine plastic leakage, and risks to marine biodiversity and coastal ecosystems.

1. Introduction

Abandoned, lost or otherwise discarded fishing gear (ALDFG) is a global challenge that negatively affects both marine ecosystems and fishers’ livelihoods [1]. ALDFG accounts for about 10% of the total amount of marine litter globally but causes disproportionately severe impacts [2]. Common causes leading to ALDFG include weather conditions, gear entanglement during fishing operations, and in particular, a lack of awareness among fishing communities [3].
One of the most serious consequences is “ghost fishing”, where lost gear continues to catch and kill marine organisms over long periods, leading to declines in fish stocks and threatening biodiversity [2,4]. In addition, ALDFG can damage vessels, obstruct navigation, injure marine organisms and adversely affect coastal tourism [2,5]. In the Asia–Pacific region, marine litter causes losses of nearly 11 billion USD annually, and this figure is projected to reach 216 billion USD by 2050 [6]. These consequences show that ALDFG is not only an environmental problem but also a challenge to sustainable socio-economic development.
A recent global estimate based on fisher interviews suggested that about 1.82% of fishing gear is lost to the ocean annually worldwide. The reported average loss rates by main gear type were 0.81% for gillnets, 1.51% for purse seines, 3.57% for trawl nets, 3.33% for longline mainlines, and 0.74% for pots and traps; at the subgear level, the estimated losses were 3.94% for bottom trawls, 0.76% for midwater trawls, 3.58% for longline branchlines, and 2.86% for longline hooks [5]. Bottom-contact gear such as trawls, gillnets and hooks and lines have a higher risk of becoming ALDFG than other gear because they are more likely to snag on the seabed or coral reefs, compared to gear operating in mid-water or at the surface [7]. Once abandoned or lost, this gear can become “ghost gear” that continues to catch fish at substantial rates [2,7,8].
Studies in Canada [9], Brazil [2], the EU [10] and Indonesia [11] have shown that fishers’ awareness of ALDFG strongly influences their gear disposal behavior and their willingness to participate in retrieval programs. However, most existing research still focuses on technical or policy aspects, while the role of fishers—who are both contributors to and key actors in solving ALDFG-has not been fully explored [12,13]. Some recent work has approached the issue from sociological and psychological perspectives, indicating that the awareness of environmental consequences can promote pro-environmental behavior [14,15].
Recent global quantitative estimates of ALDFG have often relied on survey data, especially interviews with fishers regarding annual gear loss [5]. It is difficult to reliably estimate the type and quantity of discarded fishing gear without considering the characteristics of the gear used in different fishing grounds, where each gear type comprises different materials and plastic compositions [3]. Aside from the main gear body, auxiliary components such as floatlines, leadlines or buoys may also be included in estimates [5,16], which improves the reliability of gear-loss estimates.
Plastic waste entering the marine environment has become a serious issue in Vietnam, including plastic waste associated with fisheries activities [17]. In recent years, more research on ALDFG and gear-loss estimation has been carried out as this topic receives growing attention [17,18,19,20]. However, most studies to date have been limited to a few coastal localities. Recent research in Khanh Hoa Province shows that fishers are quite aware of the economic and environmental consequences of ALDFG, but their participation in retrieval activities remains limited due to transportation costs, lack of recycling facilities and time constraints [1]. Although Vietnam has adopted policy targets and voluntary measures to address ALDFG, important gaps remain in the practical implementation of economic incentives, gear recovery, port-side collection, and downstream recycling arrangements [21].
In the context where ALDFG is becoming a severe threat to marine environments and fishers’ livelihoods, this study focuses on two main objectives: (1) to estimate the mass of fishing gear that is lost, abandoned or discarded at sea by fishing method and gear material in Vietnam; (2) to assess the relationship between fishers’ demographic characteristics, their awareness of ALDFG consequences, and their level of concern. The results contribute to guiding sustainable fishing-gear management policies in Vietnam, aiming to reduce marine plastic litter and protect marine ecosystems. The analysis proceeds by first outlining the study design and methods, then presenting the empirical results, and finally discussing their implications for ALDFG management in Vietnam. By linking gear-loss estimation and fishers’ perceptions to the prevention of ghost fishing, marine plastic leakage, and associated risks to biodiversity, habitats, and ecosystem services, this study contributes directly to the evidence base for marine conservation in Vietnam.

2. Methods

2.1. Study Area and Data Collection

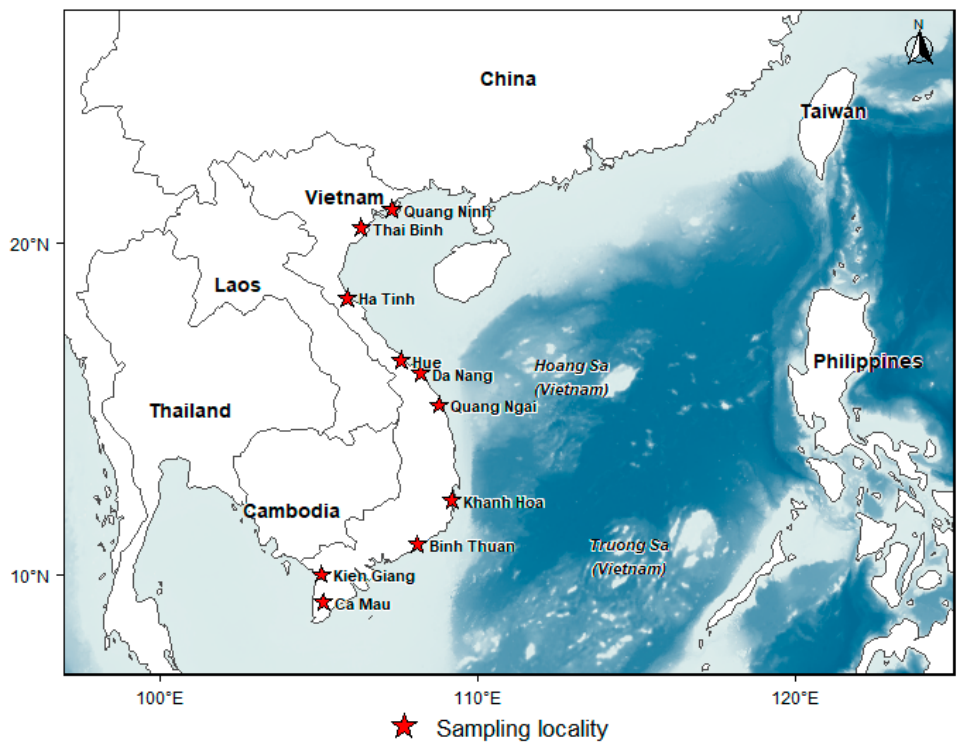
Vietnam has 28 coastal provinces and centrally governed cities engaged in capture fisheries, with a total of 80,075 fishing vessels. Data collection was conducted in 10 provinces and cities with the largest fishing vessels in Vietnam: Quang Ninh, Thai Binh, Ha Tinh, Hue, Da Nang, Quang Ngai, Khanh Hoa, Binh Thuan, Kien Giang and Ca Mau (Figure 1). The total number of fishing vessels in these localities is 42,802, accounting for 53.5% of the national fleet. Of these, gillnet vessels number 16,345, hook and line vessels 11,145, trawls 5344, purse seiners 2045, and stick-held falling nets 359, and the remaining 7564 vessels operate traps or other gear. The study localities were distributed across the northern, central, and southern coasts of Vietnam. The remaining 18 coastal provinces/cities account for 37,273 vessels (46.5% of the national fleet) and were not included in the field survey.
The sampling strategy followed FAO guidelines [22], as a stratified approach by locality and landing site. The sampling frame was established from the system of fishing ports officially announced by the Ministry of Agriculture and Environment and the provincial Departments of Agriculture and Environment in the 10 selected provinces/cities. The selection of study localities and fishing ports was purposive and intended to capture variation in fleet size, fishing-gear composition, fishing-ground conditions, and operational characteristics across the study regions while covering the provinces with the largest fishing fleets. Within selected ports, respondents were recruited through an intercept approach among fishers who were present during the survey period and had not previously been interviewed. Sample coverage across the surveyed provinces/cities ranged from 4.0% to 5.9% of the existing fleet in each locality: Quang Ninh (5.6%), Thai Binh (5.9%), Ha Tinh (4.2%), Hue (5.7%), Da Nang (4.5%), Quang Ngai (4.3%), Khanh Hoa (5.8%), Binh Thuan (4.0%), Ca Mau (4.9%), and Kien Giang (4.0%).
Data were collected through face-to-face interviews with fishers at fishing ports. Before field implementation, the draft questionnaire was reviewed by the research team for content relevance and field applicability and was then piloted in a preliminary survey with 40 respondents to improve the wording, ordering and comprehension. The main survey was conducted from January to December 2024 with a total of 1864 fishers, corresponding to 1864 fishing vessels (Table 1).
At the surveyed ports, fishers who were present during the survey period and had not been interviewed previously were invited to participate. To avoid duplicate reporting, only one fisher was interviewed for each fishing vessel.
Each interview was conducted with one fisher and lasted about 30–45 min. The questionnaire was designed to collect both qualitative and quantitative data, including socio-demographic characteristics and fishing activities; the amount of gear used and ALDFG per trip by gear component (main/cover net, ropes/lines, floats); knowledge and concern about ALDFG; and operational aspects related to gear use, loss and end-of-life management. The structured questionnaire used in the survey is provided in Appendix A. In this study, the category “Others” included fishing methods that did not fall within the six main gear groups (e.g., set nets, stow nets, lift nets, scoop nets) and was retained as an aggregated category, because the sample size for each individual method was too small for separate analysis.

2.2. Data Analysis

The mean annual ALDFG mass per vessel in each fleet was calculated as follows [23]:
X ¯ A L D F G = 1 n i = 1 n X i
where X ¯ A L D F G is the mean ALDFG mass of the vessel (kg/vessel/year); Xi is the ALDFG mass of vessel i per year (kg/year); N is the number of surveyed vessels.
To reduce the influence of outliers in the comparative analysis, ALDFG data were processed using the Interquartile Range (IQR) rule, where IQR = Q3 − Q1, and the lower bound was defined as Q1 − 1.5 × IQR and the upper bound as Q3 + 1.5 × IQR. Based on this criterion, 211 observations fell outside these limits and were identified as statistical outliers. Outliers were concentrated mainly in gillnet fisheries (131 cases), followed by trap (28), trawl (25), hook-and-line (16), and other gear (9), while only two cases were identified in purse seine fisheries and none in stick-held falling nets. These observations were not automatically treated as data errors or invalid values; rather, they were considered extreme values that could exert a disproportionate influence on comparisons of the mean ALDFG among fishing-method groups. Therefore, they were excluded only from the cleaned dataset used for comparative group analysis, while being retained in the full dataset for estimating the total annual amount of ALDFG, in order to avoid removing real variation that may occur in fishing activities. This procedure reduced the influence of extreme observations while preserving the overall comparative pattern among fishing methods in the cleaned dataset. After cleaning, the mean and standard error (SE) of ALDFG were calculated for each fishing-method group. The Shapiro–Wilk test was applied to check the normality assumption. The result (W = 0.662; p < 0.001) indicated that the data were not normally distributed; therefore, the non-parametric Kruskal–Wallis test was used to assess differences in mean ALDFG among fishing vessels.
Because the dependent variable reflecting fishers’ concern about ALDFG consequences was measured on an ordinal scale, the cumulative ordered logit model was first employed as the baseline model to identify the factors influencing this concern. The baseline model can be expressed in latent-variable form as follows [24]:
Y i * = X i β + u i
where Y i * is the latent response variable representing the fisher’s underlying propensity for concern; X i is the vector of explanatory variables for fisher i; β is the vector of parameters to be estimated, and u i is a random error term.
The observed variable Yi is determined by the response thresholds of Yi*:
Y i =   1   i f Y i * μ 1 j   i f   μ j 1 < Y i * μ j J   i f   μ J 1 < Y i *
where j is the observed response category; J is the total number of response categories of the dependent variable; and µj represents unknown threshold parameters to be estimated. Accordingly, the cumulative logit form of the model is written as
l o g P ( Y i j ) P ( Y i > j ) = α j X i β
where αj represents the threshold parameters defining the boundaries between adjacent response categories of the dependent variable. This model assumes that the regression coefficients β remain constant across response thresholds; that is, the proportional odds assumption holds [25]. The estimation results are presented as odds ratios (ORs), where OR > 1 indicates that the explanatory variable increases the likelihood that a fisher belongs to a higher category of concern, whereas OR < 1 indicates the opposite effect.
After estimation of the baseline cumulative ordered logit model, the proportional odds assumption was assessed using likelihood-ratio tests comparing the proportional odds model with less restrictive models in which each explanatory variable was, in turn, allowed to vary across response thresholds. Variables with p < 0.05 were considered to indicate a violation of the constant-coefficient assumption. The Brant test was additionally employed as a supplementary diagnostic to assess the parallel-lines assumption [26]. Final model specification was based primarily on likelihood-ratio nominal tests and nested model comparisons within the cumulative link framework. When the proportional odds assumption was violated for a subset of explanatory variables, a partial proportional odds (PPO) model was estimated, in which only those variables were allowed to have threshold-specific coefficients, while the remaining variables retained the proportional odds structure [27,28]. The general form of the PPO model is expressed as follows:
l o g P ( Y i j ) P ( Y i > j ) = α j X i β Z i δ j
where Xi denotes the set of explanatory variables satisfying the proportional odds assumption; Zi denotes the set of explanatory variables violating this assumption; and δj is the vector of coefficients that varies across response thresholds.
The final model was selected based on (i) consistency with the proportional odds assumption; (ii) the Akaike Information Criterion (AIC), with preference given to the model with the lower AIC; and (iii) likelihood-ratio tests comparing the restricted and extended models [28]. In the present study, the likelihood-ratio-based nominal test identified Tourism as the only variable with clear evidence of non-parallelism (LRT = 8.045; p = 0.018). Therefore, the final PPO specification allowed only Tourism to vary across response thresholds.
In this study, the dependent variable is fishers’ level of concern about ALDFG consequences, measured on a 4-point Likert scale. During the interviews, respondents were asked to indicate their overall level of concern about the consequences of ALDFG and selected one of four ordered response categories: 1 is “not concerned”, 2 is “somewhat concerned”, 3 is “concerned”, and 4 is “extremely concerned”. The explanatory variables included demographic characteristics (such as age, education and fishing experience), operational factors (such as vessel length and days at sea per year) and awareness of ALDFG consequences (economic losses to fishing, environmental damage, navigation risks, impacts on fish stocks, tourism impacts and damage to fishing gear. Variables describing ALDFG quantity, polymer composition, gear replacement frequency, and end-of-life treatment were examined separately in the descriptive analysis and were not included in the ordinal regression model. Multicollinearity among the explanatory variables was assessed using the variance inflation factor (VIF). VIF values ranged from 1.01 to 2.42, indicating the absence of serious multicollinearity in the model.

3. Results

3.1. Fishing Activities in Vietnam

According to statistics, Vietnam’s fishing fleet currently comprises 80,075 vessels, of which offshore vessels account for 32.8%. Gillnet vessels dominate with 29,943 boats (37.4%), followed by hook and line (18,755 vessels, 23.4%), trawl (12,606 vessels, 15.7%), and the remainder made up of purse seines, stick-held falling nets, traps and other gear (Table 2).
Survey results from 1864 fishers reveal that the workforce is mainly middle-aged, with an average age of 49.1 years and mean fishing experience of 23.0 years. About 86.9% of respondents had an education level of lower secondary school or below, while only 11.8% had completed upper secondary school and 1.3% vocational college or higher. The mean vessel length was 13.0 m (ranging from 2.5 to 32.0 m), and the number of crew per vessel ranged from 1 to 30 (Table 3), indicating significant variation in fleet scale.

3.2. Abandoned, Lost or Otherwise Discarded Fishing Gear (ALDFG)

3.2.1. Estimation of ALDFG

Survey results from 1864 fishers show that the total mass of plastic used in their fishing gear is 34,262,998 kg/year (Table 4). Of this total, polyamide (PA) accounts for 9,053,787 kg (26.4%), polyethylene (PE) for 12,690,568 kg (37.0%), polypropylene (PP) for 11,261,168 kg (32.9%), polystyrene (PS) for 1,031,899 kg (3.0%) and polyvinyl chloride (PVC) for 225,576 kg (0.7%).
Among the respondents, 957 cases of ALDFG were reported in one year, with a total ALDFG mass of 82,720 kg/year, corresponding to an overall average loss rate of about 0.24% across all fleets. The variable “Number of ALDFG report cases” in Table 4 refers to interview-based fisher reports rather than to official administrative statistics. Hook and line fisheries showed the highest gear-loss rate (2.12%), followed by gillnet fisheries (0.40%), while purse seines recorded only 0.01% (Table 4).
The frequency of gear-loss incidents ranged from 12.5% to 76.9% across gear types. In general, these frequencies correlate with the mean ALDFG mass per vessel per year, except for hook and line, which had a relatively low average loss mass (13.8 kg/vessel/year) but a high loss frequency (62.4% of vessels) (Table 4).
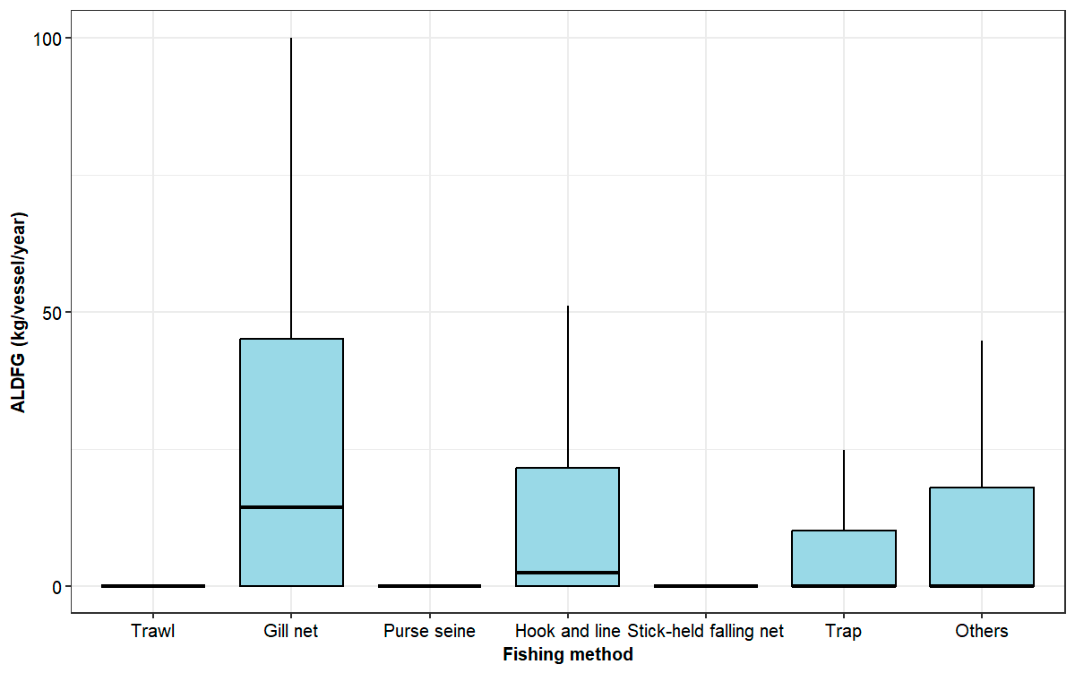
The cleaned data (after outlier removal) were used to calculate the mean ALDFG mass for each fishing-method group (Figure 2). Gillnet vessels had the highest mean ALDFG mass (26.0 ± 1.2 kg/vessel/year), followed by traps (16.1 ± 2.6 kg/vessel/year). Hook and line, “other gear” and trawls also had substantial ALDFG masses (13.8 ± 1.4, 13.3 ± 1.9, and 8.8 ± 1.1 kg/vessel/year, respectively). In contrast, stick-held falling nets and purse seines had much lower mean ALDFG masses (5.1 ± 2.1 and 4.2 ± 1.4 kg/vessel/year, respectively) (Figure 2). The Kruskal–Wallis test (χ2 = 321.05, p < 0.001) indicates statistically significant differences in the ALDFG among fishing methods.
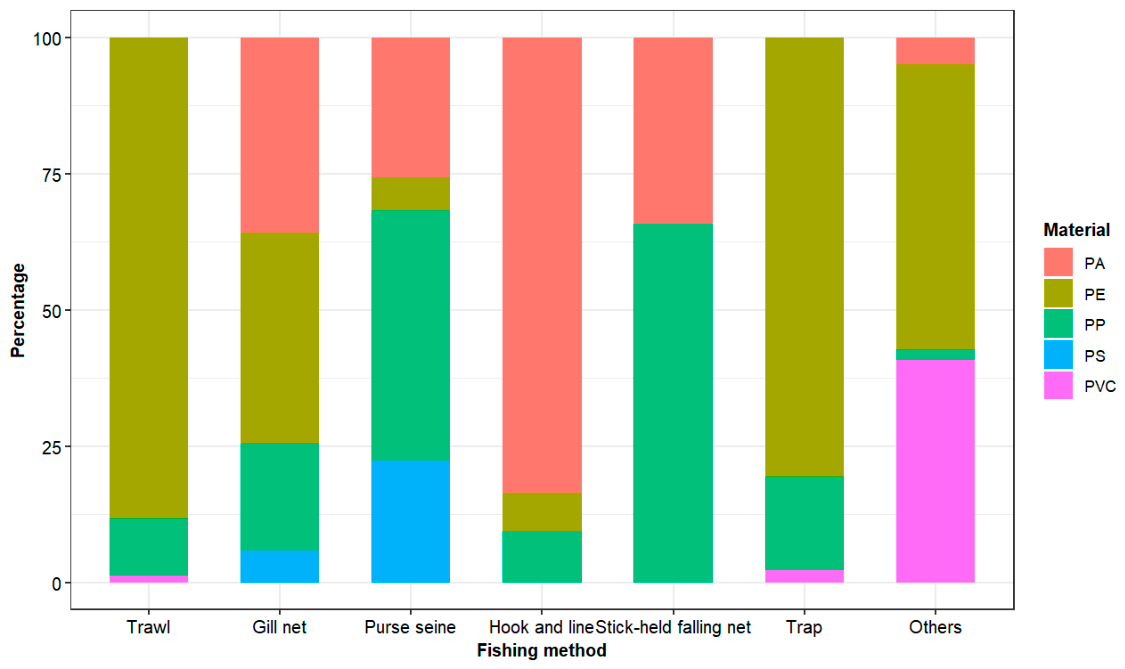
Analysis of the material composition of ALDFG reveals clear differences in polymer shares among gear types. Trawl ALDFG was dominated by PE (88.4%), indicating a highly concentrated material profile, whereas hook-and-line ALDFG consisted mainly of PA (83.6%). Purse seine ALDFG showed the highest share of PP (46.0%) among the gear groups. In contrast, gillnet ALDFG had the most mixed composition, with PE (38.8%), PA (35.8%), and PP (19.6%) all contributing substantial proportions, together with PS (5.8%). These results indicate that gillnet fisheries use a broader range of polymer materials than the other fishing methods. The polymer composition of ALDFG by fishing method is shown in Figure 3.

3.2.2. Frequency of Gear Replacement and End-of-Life Treatment

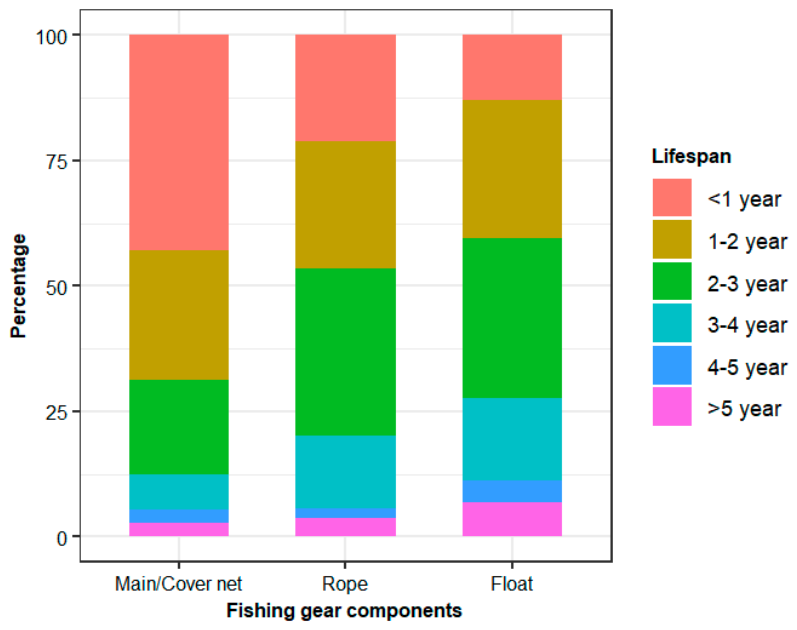
Data on the replacement frequency of gear components show substantial variation in service life. Netting tends to be replaced the earliest: 42.9% of netting is replaced within less than one year and 25.8% within 1–2 years. Replacement rates decline sharply after 3 years, reflecting the short lifespan and high wear of netting in fishing operations.
In contrast, ropes/lines have a longer service life, with the highest replacement rate in the 2–3-year range (33.4%), with 3.8% still in use after more than 5 years. For floats, replacement times are relatively evenly distributed from 1 to <4 years, with the highest share (31.7%) in the 2–3-year range (Figure 4). Notably, 6.9% of floats are used for more than 5 years, highlighting their higher durability compared with other components.
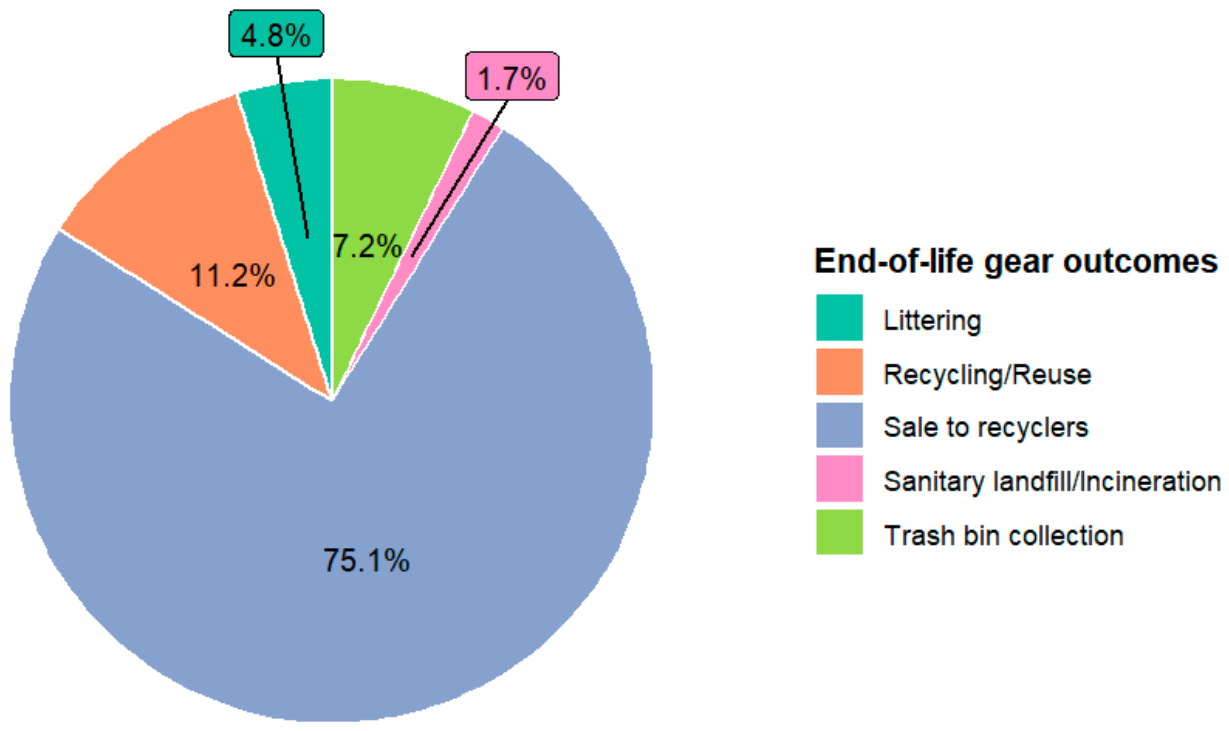
When asked about how they treat gear at end of life, fishers listed several disposal options. Selling gear to scrap dealers was the most common option, accounting for about 75.1% of end-of-life gear, followed by reuse for other purposes such as fences or ropes (11.2%), disposal in waste bins (7.2%), and burial or open burning (1.7%) (Figure 5). However, 4.8% of end-of-life fishing gear was reported to be dumped directly into the environment. Although this share is not high, it remains a concern given the alarming status of marine plastic pollution.

3.3. Fishers’ Concern About ALDFG

3.3.1. Perceptions of ALDFG Consequences

Survey results on the level of concern about abandoned, lost or discarded fishing gear indicate that fishers are well aware of the negative impacts of ALDFG. However, the perceived severity of each impact varies by the impact type and gear type.
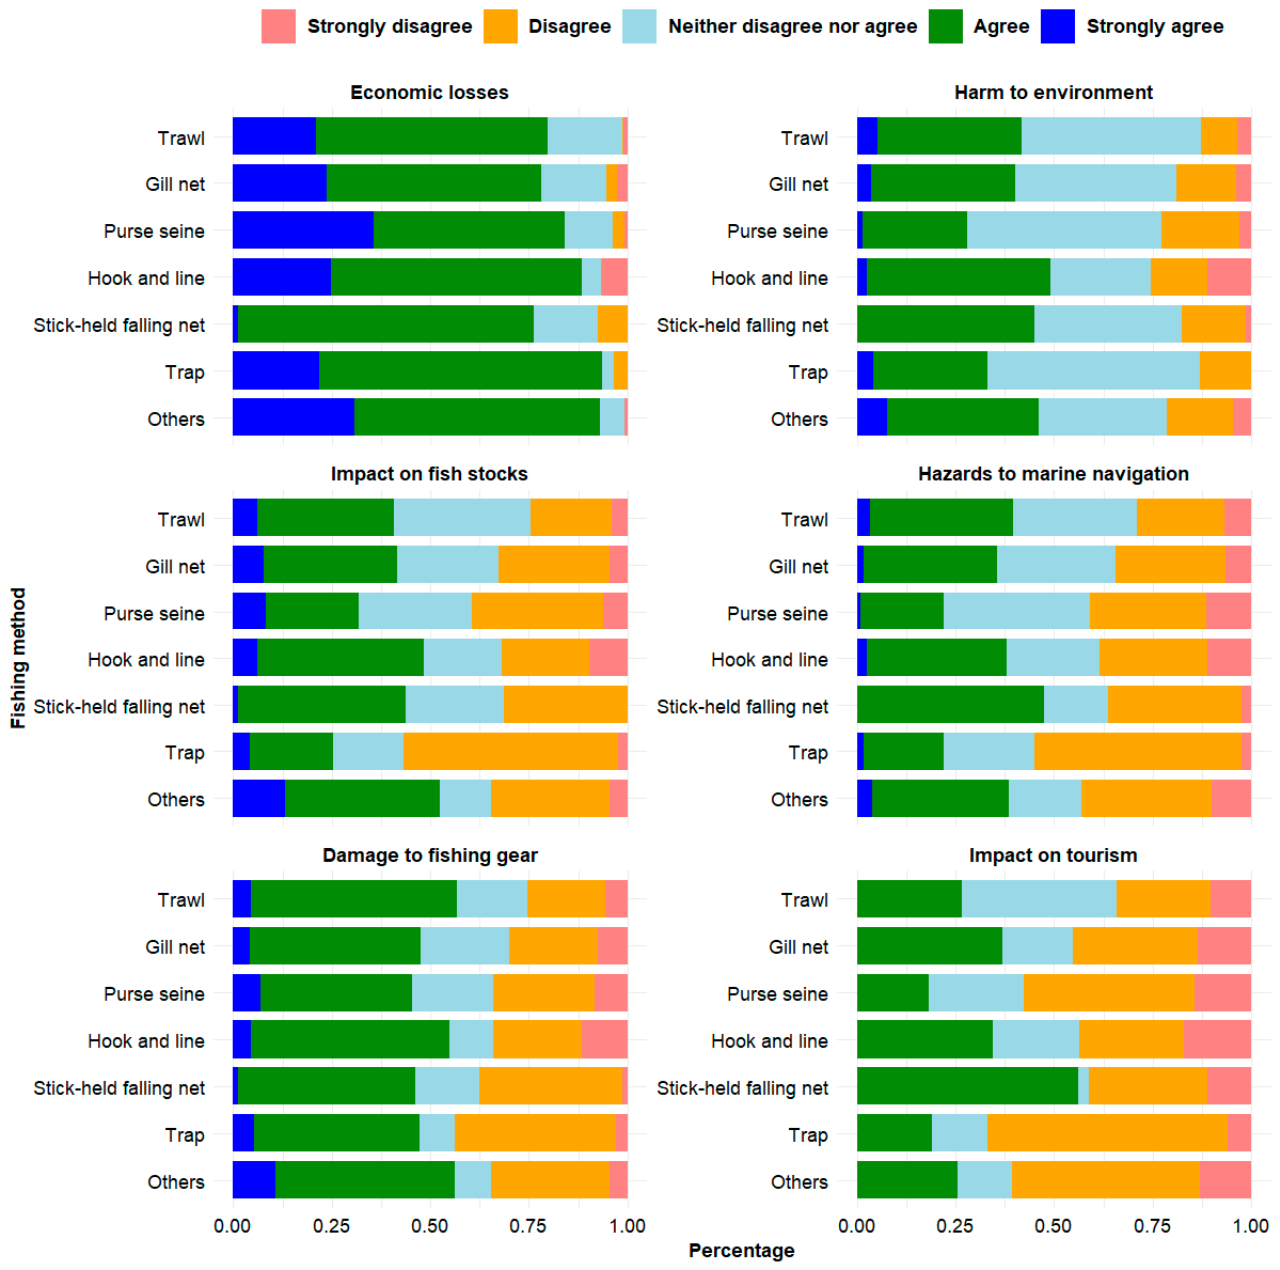
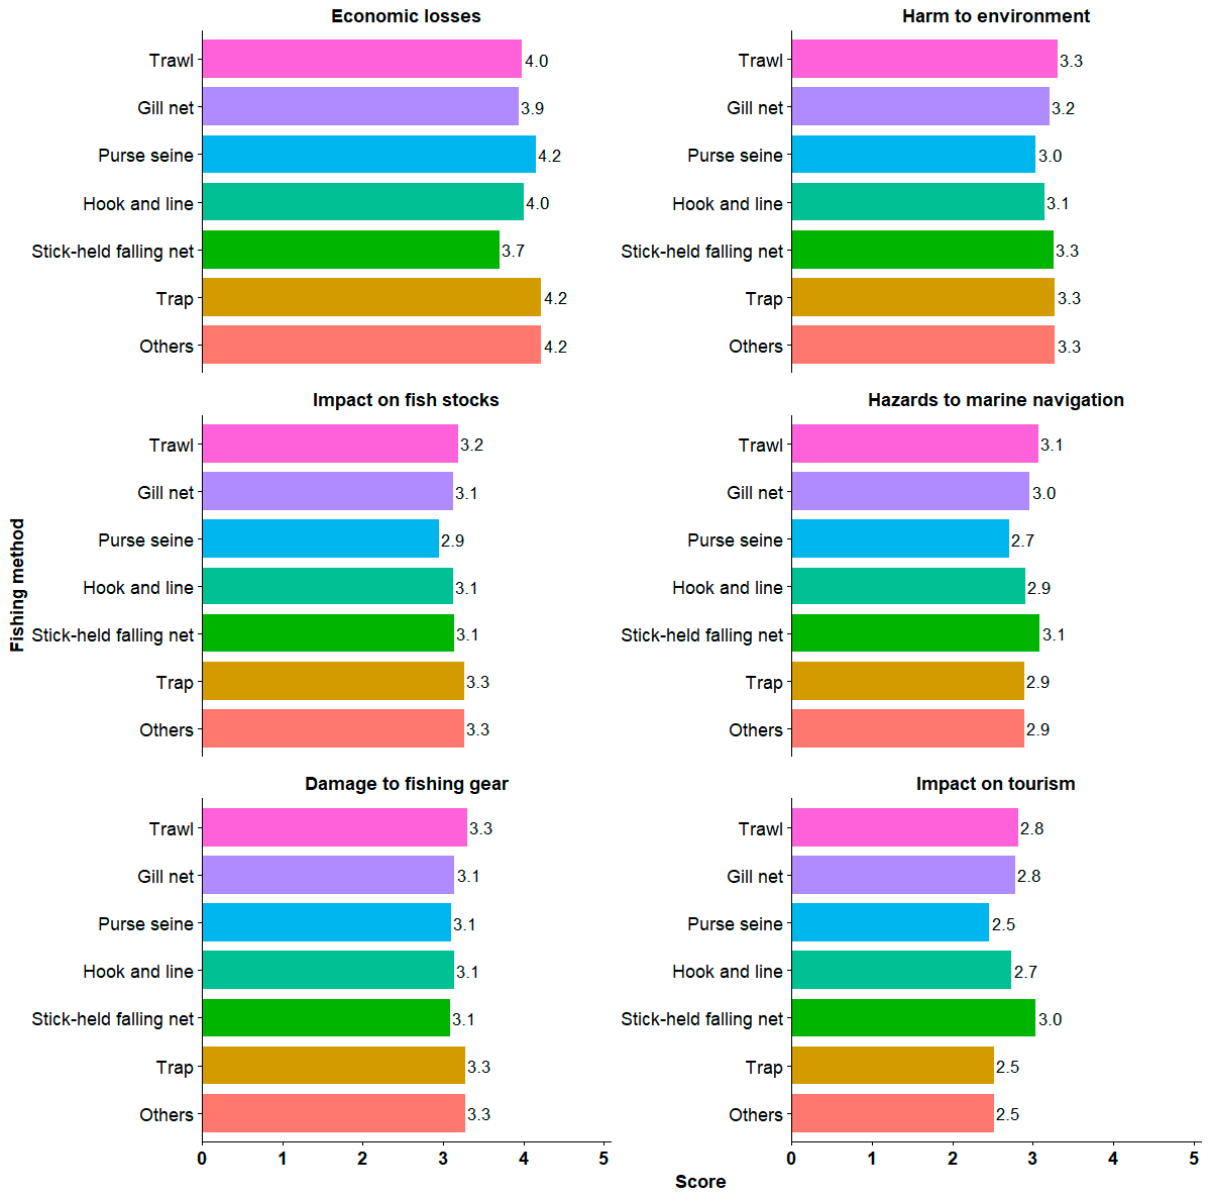
Economic losses are the impact that fishers agree on most strongly. For most gear types, more than 80% of fishers “agree” or “strongly agree” that ALDFG causes substantial economic losses (Figure 6). Purse seines and traps are perceived as causing the most severe economic damage, with the highest mean scores (4.2), followed by trawls and hook and line (both 4.0) (Figure 7). This suggests that loss of fishing gear is seen by fishers as a direct and significant loss of assets.
Regarding ecosystem impacts, trawls and traps are considered the most harmful gear types. Lost trawls and traps are perceived as having the most negative impact on the environment (3.3 points) and on fish stocks (3.2–3.3 points). Fishers also rate lost trawls and traps as the largest threat to other fishing activities, including navigation hazards (2.9–3.1 points) and damage to active fishing gear (3.3 points) (Figure 7). Stick-held falling nets and gillnets are also perceived as having notable environmental and stock impacts, although with lower mean scores than trawls.
One notable finding is that the impact of ALDFG on tourism is rated lowest among all impact categories. Mean scores for tourism impacts range only from 2.5 to 3.0 for all gear types (Figure 7), and the shares of “neither agree nor disagree” or “disagree” responses are noticeably higher than for other impacts (Figure 6).
The Kruskal–Wallis test results showed that fishers’ ratings differed significantly across fishing-method groups for several specific consequences of ALDFG, including economic losses to fishing activities (χ2 = 43.659; p < 0.001), depletion of fishing stocks (χ2 = 37.977; p < 0.001), navigation hazards (χ2 = 34.015; p < 0.001) and impacts on tourism (χ2 = 40.719; p < 0.001). By contrast, differences among fishing methods were not statistically significant at the 5% level for environmental damage (χ2 = 12.174; p = 0.058) or the risk of damage to fishing gear during fishing operations (χ2 = 12.193; p = 0.058). These results indicate that perceptions are not entirely uniform across fishing methods; however, the differences are concentrated mainly on the consequences directly related to production efficiency, operational safety, and specific socio-economic impacts.
Conversely, the Friedman test was used to assess differences among types of ALDFG consequences within each fishing-method group. The results showed that these differences were statistically significant for all groups, including trawl (χ2 = 395.228; p < 0.001), gillnet (χ2 = 653.043; p < 0.001), purse seine (χ2 = 198.762; p < 0.001), hook and line (χ2 = 325.301; p < 0.001), stick-held falling net (χ2 = 47.888; p < 0.001), trap (χ2 = 366.880; p < 0.001) and the group of other fishing methods (χ2 = 203.401; p < 0.001). This finding suggests that, within each fishing-method group, fishers distinguished relatively clearly among different consequences of ALDFG rather than viewing them as homogeneous impacts. Overall, the consequences directly associated with economic losses, operational safety, and resource depletion were rated as more serious than indirect impacts, particularly those related to tourism.

3.3.2. Determinants of Concern About ALDFG

The cumulative ordered logit model provided an appropriate baseline for analyzing fishers’ level of concern about the impacts of ALDFG. Within the cumulative link framework, the likelihood-ratio nominal test indicated that Tourism was the only variable that violated the proportional odds assumption (LRT = 8.045; df = 2; p = 0.018), while no other variable showed evidence of violation at the 5% level. A partial proportional odds (PPO) model was therefore estimated by allowing only Tourism to vary across response thresholds. Although the supplementary Brant test suggested broader departures from the parallel-lines assumption, nested model comparison showed that relaxing only Tourism provided the most parsimonious improvement in model fit. The selected PPO model also had a lower AIC than the baseline proportional-odds model (2563.257 vs. 2567.302) and was therefore retained for interpretation.
The results show that socio-economic and perceptual factors significantly influence fishers’ level of concern about ALDFG (Table 5). Because the explanatory variables were measured on different scales and units, the reported odds ratios (ORs) should be interpreted in terms of direction and statistical association rather than as direct measures of relative importance. Among the perception-related variables, awareness of environmental harm and economic losses to fishing activities emerged as strong positive predictors of concern. Fishers who more strongly recognized the environmental impacts of ALDFG were significantly more likely to report a higher level of concern (OR = 1.412; p < 0.001). A similar effect was found for perceived economic losses to fishing activities (OR = 1.321; p < 0.001).
Demographic characteristics and operational scale also played an important role. Fishers with higher education levels (OR = 1.530; p = 0.002) tend to be more concerned about ALDFG, likely because education equips them with better capacity to access and process complex environmental information. Similarly, fishing experience (OR = 1.053; p < 0.001) and vessel length (OR = 1.169; p < 0.001) are positively associated with concern, suggesting that more professional or offshore-oriented fishers may better recognize long-term threats to their livelihoods.
In contrast, some factors show a negative association with concern. The number of days at sea (OR = 0.988; p < 0.001) was negatively associated with concern, which may reflect a stronger focus on fishing operations than on environmental issues among more active fishers. Likewise, awareness of navigation hazards (OR = 0.673; p < 0.001) and impacts on fish stocks (OR = 0.654; p < 0.001) were associated with lower concern, suggesting that these aspects are not yet perceived as direct threats. In addition, fishers’ age (OR = 0.936; p < 0.001) showed a negative effect, indicating that older fishers tended to be less concerned about ALDFG.
Interestingly, awareness of the risk of damage to fishing gear (OR = 1.023; p = 0.733) does not have a statistically significant effect, indicating that this factor does not play a key role in shaping concern about ALDFG. By contrast, Tourism was estimated with threshold-specific coefficients in the PPO model. The coefficients were negative and statistically significant at all three cut-points (1|2: −0.220, p = 0.007; 2|3: −0.229, p = 0.005; 3|4: −0.325, p < 0.001), indicating that its association with concern was non-constant and became stronger toward the highest concern category.

4. Discussion

The generation of ALDFG depends largely on the fishing method, gear characteristics and fleet scale. Survey results from 1864 fishers show that the total ALDFG in Vietnam amounts to 82,720 kg/year, with an average rate of 0.24% of the total plastic used in fishing gear (34,262,998 kg/year) (Table 4). This corresponds to approximately 4.2–26.0 kg ALDFG/vessel/year depending on the fishing method, representing a substantial source of plastic emissions from fisheries.
Richardson et al. [5] estimated that, globally, about 1.82% of fishing gear is lost annually, including 2963 km2 of gillnets, 75,049 km2 of purse seines, 218 km2 of trawls, 739,583 km2 of longlines and more than 25 million traps, with average loss rates ranging from 0.74% to 3.94% depending on the fishery. The gear-loss rates reported by Vietnam’s fishers in this study are generally much lower than recent global estimates [3,5]. The difference may reflect reductions in some loss-inducing factors and improvements in gear and vessel technology. For instance, fishers may increasingly use higher-quality and more selective gear, alongside advances in fish-finding technology and weather forecasting [29,30,31]. Lower losses may also reflect fisheries-management measures that facilitate gear marking, tracking, reporting and retrieval [2,29].
In terms of material composition, this study shows that ALDFG in Vietnam mainly consists of PE (47.4%), PA (29.5%) and PP (17.2%). These polymers are widely used in fishing-gear manufacture due to their light weight, durability, corrosion resistance and low cost. However, these very properties make them particularly harmful to the marine environment. PE and PA can persist in the marine environment for decades to hundreds of years, contributing to ghost fishing and the unintended capture of marine organisms, thereby depleting resources and threatening biodiversity [3].
Detailed analysis of ALDFG material composition not only helps to identify plastic-pollution risks but also provides a scientific basis for designing programs to retrieve, recycle and replace fishing gear with more environmentally friendly materials [12,32]. This is a necessary step toward a more sustainable fisheries sector and reduced impacts on marine ecosystems.
Several countries have successfully developed circular-economy models based on ALDFG recycling. For example, the “Net-Works” program in the Philippines established a community-based supply chain, in which discarded fishing nets are collected and recycled into nylon yarn for carpet tile production, thereby generating livelihood opportunities for coastal communities [33]. In the EU, the “Fishing for Litter” scheme has helped institutionalize fisher-led retrieval through port-based collection systems, while circular business models in the fishing-gear sector demonstrate that discarded nets, ropes, and components can be reprocessed into secondary materials and new products with both environmental and economic value [34,35]. These models show that, with investment in processing technologies and supportive mechanisms for communities, ALDFG can be transformed from waste into a resource. In Thailand, gillnet fishers in five Gulf provinces have already been surveyed specifically regarding fishing-gear marking, and awareness of marking practice was found to be higher among industrial than small-scale fishers, indicating a more advanced discussion of traceability and gear identification [36]. In Indonesia, recent gillnet research from Central Java estimated average marine debris from gillnet components at about 11.1 kg/fisher/year and highlighted seabed snagging, currents, and fisher conflict as major drivers [37]. Together, these examples suggest that Southeast Asian responses are moving toward a combination of gear marking, retrieval incentives, and circular reuse rather than end-of-pipe disposal alone.
Compared with neighboring Southeast Asian contexts, the Vietnamese case highlights both progress and remaining institutional gaps. Thailand has moved further in discussing fishing-gear marking and traceability among gillnet fishers, while Indonesian studies have quantified debris from specific gear components and identified operational drivers of gear loss. The Philippine Net-Works’ experience further illustrates how community collection can be linked to downstream recycling markets. Taken together, these examples suggest that Vietnam would benefit from a more integrated framework that combines gear traceability, fisher reporting, port reception, retrieval incentives, and circular-value-chain development rather than relying on end-of-pipe disposal alone.
From a management perspective, gear-marking requirements, mandatory reporting of gear loss and the establishment of retrieval systems at ports are essential measures to control ALDFG sources. At the same time, raising fishers’ awareness of environmental impacts and the recycling value of gear plays a crucial role in changing disposal behavior. The quantitative assessment of ALDFG volume and material composition in Vietnam provides a solid scientific foundation for designing sustainable fishing-gear management policies, with the goal of reducing marine plastic litter and protecting marine ecosystems.
Fishers’ awareness of ALDFG consequences is central to shaping their attitudes and behavior. Our analysis shows that fishers are particularly concerned about direct economic impacts, such as reduced catches and gear-replacement costs, reflecting practical worries closely tied to their livelihoods. This aligns with Quach Thi Khanh Ngoc et al. [1], who found that fishers in Khanh Hoa Province were deeply concerned about economic losses caused by ALDFG, with more than 45% of respondents rating damages as “high” or “very high”.
However, awareness of environmental and social impacts is more uneven. Barbosa-Filho et al. [38] report that traditional fishers in Brazil show strong attachment to the marine environment and clear understanding of ghost fishing. In Vietnam, although fishers acknowledge that trawls and gillnets can harm ecosystems, mean scores for environmental impacts (3.2–3.3) remain lower than those for economic impacts (3.9–4.0). This suggests that indirect and long-term consequences, such as biodiversity loss and tourism impacts, are not yet fully appreciated. The PPO results further suggest that tourism impacts become more salient at higher concern thresholds, implying that this consequence matters especially among fishers who already perceive ALDFG as a broader coastal-management issue.
Other studies also indicate that awareness of marine litter is closely linked to intentions to act, particularly when impacts are connected to daily livelihoods [39,40]. In Vietnam, this is evident in the fact that fishers with higher education (OR = 1.530) and longer fishing experience (OR = 1.053) are more concerned about ALDFG. This highlights the importance of information access and practical experience in enhancing awareness [41,42].
The survey covered the largest fishing provinces and three coastal regions, but the province selection was purposive, and respondent recruitment at ports followed an intercept convenience approach rather than a probability sample. In addition, the ALDFG estimates rely on fisher self-reports for the previous year and may therefore be affected by recall error or social-desirability bias. The surveyed rates shown in Table 1 should thus be interpreted as sample coverage statistics rather than sampling weights, and the findings should be read as strong evidence from major fishing regions rather than fully design-based national prevalence estimates.
Nonetheless, a gap remains between awareness and behavior. Although fishers recognize the seriousness of ALDFG, participation in retrieval activities is still limited. Barriers such as transportation costs, lack of recycling facilities and time constraints reduce the motivation to act, even when awareness is relatively high [43].

5. Conclusions

This study provides important quantitative and qualitative evidence on ALDFG in Vietnam. The results show that the mass of ALDFG is substantial, with average levels of 4.2–26.0 kg/vessel/year depending on the fishing method. ALDFG consists mainly of durable polymers such as PE, PA and PP, which pose long-term risks of ghost fishing and marine pollution.
The analysis of fishers’ perceptions reveals clear contrasts: while direct economic impacts are well recognized, indirect environmental and social consequences are not yet fully appreciated. The study confirms the role of demographic factors, showing that education and fishing experience are positively correlated with concern about ALDFG. The perceived impact on tourism also varies across response thresholds, becoming more pronounced at higher levels of concern. Despite relatively high overall awareness, a gap persists between awareness and behavior, with limited action due to financial and infrastructural constraints.
Based on these findings, we propose several policy implications to reduce ALDFG in Vietnam. First, effective management measures are needed, such as gear-marking systems and mandatory reporting of gear loss. Second, circular-economy models should be promoted through investment in infrastructure and technologies for collecting and recycling ALDFG, thereby turning plastic waste into a resource. Finally, communication programs should be specifically designed to enhance comprehensive awareness of ecological and social impacts, thereby encouraging behavior change among fishing communities. Addressing ALDFG requires an integrated approach that treats it as a key priority for ensuring the sustainable development of the fisheries sector and the protection of Vietnam’s marine ecosystems.

Author Contributions

N.V.N.: Supervision, Conceptualization, Methodology, Interpretation, Visualization, Investigation, Formal analysis, Writing—review and editing. L.D.P.: Conceptualization, Investigation, Methodology, Formal analysis, Writing—review and editing. A.M.: Visualization, Methodology, Writing—review and editing. T.V.D.: Conceptualization, Investigation, Methodology, Formal analysis, Writing—review and editing. T.S.P.: Conceptualization, Investigation, Methodology, Formal analysis, Writing—review and editing. T.P.: Visualization, Methodology, Writing—review and editing. S.V.V.: Visualization, Investigation, Writing—review and editing. M.E.: Visualization, Methodology, Writing—review and editing. All authors have read and agreed to the published version of the manuscript.

Funding

This research was funded by the Federal Ministry for the Environment, Nature Conservation, Nuclear Safety and Consumer Protection (BMUV) based on a resolution of the German Bundestag, grant number FKZ 67MM0007. The APC was funded by the REVFIN project.

Institutional Review Board Statement

The study was conducted in accordance with the Declaration of Helsinki, and approved by the RESEARCH INSTITUTE FORMARINE FISHERIESCOUNCIL FOR ACADEMIC ANDRESEARCH AFFAIRS (protocol code RIMF-CARA-2024-01 and date of approval 10 January 2024).

Informed Consent Statement

Informed consent was obtained from all subjects involved in the study.

Data Availability Statement

The raw data supporting the conclusions of this article will be made available by the authors on request.

Acknowledgments

The authors would like to thank the project “Prevention, reduction and recycling of fishnets polluting Vietnamese coastal waters (REVFIN)” for supporting this study.

Conflicts of Interest

The authors declare that they have no known competing financial interests or personal relationships that could have appeared to influence the work reported in this paper.

Appendix A. Structured Fisher Questionnaire Used in the Survey

This survey belongs to the REVFIN project. Through this questionnaire, we would like to learn about the socio-economic aspects and use phrase of fish nets in Vietnam. The information you provide will be confidential and only used for research purposes.
Q1. Gender: □ Male (1)    □ Female (0)Q4. Fishing experience (years): ……………
Q2. Year of birth: ...............Q5. Crew size (persons): .........
Q3. Education level:Q5. Fishing gear:
□ Primary school and below (1)   □ Trawl (1)
□ Secondary school (2)    □ Gillnet (2)
□ High school (3)   □ Hook and line (3)
□ Vocational college or higher (4)   □ Purse seine (4)
   □ Stick-held falling net (5)
   □ Trap (6)
   □ Others (7): …………………..
Q6. Hull length (m): .................. Q8. Average number of fishing days per month: ….
Q7. Average number of operation months in year: ......Q9. Average number of fishing trips per month: ….
Q10. Please provide information about fishing gear:
1. Number of set-nets: ……………………….
2. Number of hook and line sets: ………………….
3. Number of hooks: …………………………….
4. Number of Traplines:……………………
Table A1. Fundamental information of fishing gear.
Fishing GearUnitMaterialsQuantityInvestment Cost
(Million VND)
1Main nets/Cover netskg☐ PA (1)
☐ PE (2)
☐ PP (3)
☐ PS (4)
☐ PVC (5)
☐ Others (6)
2Rope kg☐ PA (1)
☐ PE (2)
☐ PP (3)
☐ PS (4)
☐ PVC (5)
☐ Others (6)
3Buoykg☐ PA (1)
☐ PE (2)
☐ PP (3)
☐ PS (4)
☐ PVC (5)
☐ Others (6)
4Others: ……………
Total
Table A2. Level of concern about the ALDFG (abandoned, lost or otherwise discarded fishing gear)?
☐ Not concerned (1) ☐ Concerned (3)
☐ Somewhat concerned (2) ☐ Extremely concerned (4)
Table A3. Reasons for concern?
Strongly Disagree
(1)
Disagree
(2)
In-Different
(3)
Agree
(4)
Strongly Agree
(5)
1. Economic losses
2. Harm to environment
3. Impact on fish stocks
4. Hazards to navigation
5. Damage to gear
6. Tourism impact
Table A4. What is the shelf life of fishing gear materials?
Fishing GearReplacement Time/Lifespan (Months)Notes
1Main nets/Cover nets
2Rope
3Buoy
4Others: ………………………………
Table A5. How much gear you lose per trip?
UnitThe Rate of Fishing Gear Lost in Each Fishing Trip
Fishing GearMaterialsAmount to Take Along Amount Brought AshoreDisposal Into the Sea
1Main nets/Cover nets kg
2Rope kg
3Buoy kg
4Others:..................
Table A6. What is the amount of additional net material in each time?
Fishing GearUnitAdditional Quantity per Trip (At Sea)Additional Quantity After Each Trip (Onshore)
1Main nets/Cover netskg
2Ropekg
3Buoykg
4Others: ……………
Table A7. Where is end-of-life fishing gear sent to while on land/port?
Handling While on Land/PortPercentage (%)
1Garbage collection area at the port
2Public recycle bin
3Anywhere
4For change
5Reuse/recycling
6Incineration
7Others

References

  1. Ngoc, Q.T.K.; Mychkova, A.; Ngan, N.T.; Hung, P.Q.; Potempa, T.; Ehleben, M.P. Vietnamese fishers’ perceptions on the effects of abandoned, lost, and discarded fishing gear and their willingness to participate in retrieval efforts. Mar. Policy 2025, 179, 106765. [Google Scholar] [CrossRef] [Scilit]
  2. Macfadyen, G.; Huntington, T.; Cappell, R. Abandoned, Lost or Otherwise Discarded Fishing Gear; United Nations Environment Programme Nairobi: Nairobi, Kenya, 2009; Volume 523. [Google Scholar]
  3. Richardson, K.; Hardesty, B.D.; Wilcox, C. Estimates of fishing gear loss rates at a global scale: A literature review and meta-analysis. Fish Fish. 2019, 20, 1218–1231. [Google Scholar] [CrossRef] [Scilit]
  4. Gilman, E.; Chopin, F.; Suuronen, P. Abandoned, Lost and Discarded Gillnets and Trammel Nets: Methods to Estimate Ghost Fishing Mortality, and the Status of Regional Monitoring and Management; FAO: Rome, Italy, 2016. [Google Scholar]
  5. Richardson, K.; Hardesty, B.D.; Vince, J.; Wilcox, C. Global estimates of fishing gear lost to the ocean each year. Sci. Adv. 2022, 8, eabq0135. [Google Scholar] [CrossRef] [Scilit]
  6. Asia-Pacific Economic Cooperation (APEC). Update of the 2009 APEC Report on Economic Costs of Marine Debris to APEC Economies; APEC Secretariat: Singapore, 2020. [Google Scholar]
  7. GESAMP. Sea-based sources of marine litter. In IMO/FAO/UNESCO-IOC/UNIDO/WMO/IAEA/UN/UNEP/UNDP/ISA Joint Group of Experts; Gilardi, K., Ed.; GESAMP: London, UK, 2021; 109p. [Google Scholar]
  8. Harding, S. Marine Debris: Understanding, Preventing and Mitigating the Significant Adverse Impacts on Marine and Coastal Biodiversity; Secretariat of the Convention on Biological Diversity: Montreal, PQ, Canada, 2016. [Google Scholar]
  9. Jambeck, J.R.; Geyer, R.; Wilcox, C.; Siegler, T.R.; Perryman, M.; Andrady, A.; Narayan, R.; Law, K.L. Plastic waste inputs from land into the ocean. Science 2015, 347, 768–771. [Google Scholar] [CrossRef] [Scilit]
  10. Directive (EU) 2019/904 of the European Parliament and of the Council of 5 June 2019 on the Reduction of the Impact of Certain Plastic Products on the Environment; EU: Brussels, Belgium, 2019.
  11. World Bank. Management, Retrieval and Recycling of End-of-Life and Abandoned, Lost and Discarded Fishing Gear—The Evidence Base from Capture Fisheries (English); World Bank: Washington, DC, USA, 2023. [Google Scholar]
  12. Do, H.-L.; Cherry, T.L. Ghost fishing and the voluntary adoption of biodegradable gear. Resour. Energy Econ. 2025, 84, 101534. [Google Scholar] [CrossRef] [Scilit]
  13. Matthews, T.R.; Glazer, R.A. Assessing opinions on abandoned, lost, or discarded fishing gear in the Caribbean. In Proceedings of the Gulf and Caribbean Fisheries Institute; Gulf and Caribbean Fisheries Institute, c/o Harbor Branch Oceanographic Institution, Inc.: Fort Pierce, FL, USA, 2010; pp. 12–22. [Google Scholar]
  14. Giskes, I.; Baziuk, J.; Pragnell-Raasch, H.; Roda, A.P. Report on Good Practices to Prevent and Reduce Marine Plastic Litter from Fishing Activities; Food & Agriculture Org.: Rome, Italy, 2022. [Google Scholar]
  15. Stern, P. Toward a Coherent Theory of Environmentally Significant Behavior. J. Soc. Issues 2000, 56, 407–424. [Google Scholar] [CrossRef] [Scilit]
  16. Richardson, K.; Hardesty, B.D.; Vince, J.Z.; Wilcox, C. Global Causes, Drivers, and Prevention Measures for Lost Fishing Gear. Front. Mar. Sci. 2021, 8, 690447. [Google Scholar] [CrossRef] [Scilit]
  17. Tran, N.V.N.; Nguyen, P.Q. Assessing the Economic and Environmental Impact of Plastic Waste from Fishing Gear: A Survey of Fishermen in Khanh Hoa Province, Vietnam. In Proceedings of the 4th International Vietnam Conference on Earth and Environmental Sciences 2024 (iVCEES-2024); International Centre for Interdisciplinary Science and Education: Quy Nhon, Vietnam, 2025. [Google Scholar]
  18. Cuong, C.T.; Hien, B.T.T.; Trang, N.T.T.; Quynh, N.M. Vietnam Coastal Plastic Waste Monitoring and Assessment Program, 2020 Report; IUCN Viet Nam Country Office: Ha Noi city, Vietnam, 2021. [Google Scholar]
  19. WWF. National Survey on the Contribution of Plastic Waste from Fisheries and Aquaculture to Ocean Plastic, Summary Report; WWF: Gland, Switzerland, 2020. [Google Scholar]
  20. WWF. Research and Proposal on Incentive Mechanisms for the Collection and Recycling of Plastic Waste in Fisheries, Project Summary Report; WWF: Gland, Switzerland, 2022. [Google Scholar]
  21. Raes, L.; Jain, A.; Ba, T.N.; Savels, R. The Economic Impact of Marine Plastics, Including Ghost Fishing, on Fishing Boats in Phước Tinh and Loc An, Ba Ria Vung Tau Province, Vietnam; International Union for Conservation of Nature and Natural Resources (IUCN): Gland, Switzerland, 2022. [Google Scholar]
  22. Brander, K. Guidelines for Collection and Compilation of Fishery Statistics; Food and Agriculture Organization of the United Nations: Rome, Italy, 1975. [Google Scholar]
  23. Yamane, T. Elementary Sampling Theory; Prentice-Hall: Englewood Cliffs, NJ, USA, 1967. [Google Scholar]
  24. Greene, W.H.; Hensher, D.A. Ordered choices and heterogeneity in attribute processing. J. Transp. Econ. Policy (JTEP) 2010, 44, 331–364. [Google Scholar] [CrossRef] [Scilit]
  25. McCullagh, P. Regression Models for Ordinal Data. J. R. Stat. Soc. Ser. B 1980, 42, 109–127. [Google Scholar] [CrossRef] [Scilit]
  26. Brant, R. Assessing Proportionality in the Proportional Odds Model for Ordinal Logistic Regression. Biometrics 1891, 46, 1171–1178. [Google Scholar] [CrossRef] [Scilit]
  27. Peterson, B.; Harrel, F. Partial Proportional Odds Model for Ordinal Response Variables. J. R. Stat. Soc. Ser. C Appl. Stat. 1990, 39, 205–217. [Google Scholar] [CrossRef] [Scilit]
  28. Williams, R. Generalized Ordered Logit/Partial Proportional Odds Models for Ordinal Dependent Variables. Stata J. 2006, 6, 58–82. [Google Scholar] [CrossRef] [Scilit]
  29. Richardson, K.; Gunn, R.; Wilcox, C.; Hardesty, B.D. Understanding causes of gear loss provides a sound basis for fisheries management. Mar. Policy 2018, 96, 278–284. [Google Scholar] [CrossRef] [Scilit]
  30. Valdemarsen, J.; Suuronen, P. Modifying fishing gear to achieve ecosystem objectives. In Responsible Fisheries in the Marine Ecosystem; CABI Digital Library: Oxfordshire, UK, 2003; pp. 321–341. [Google Scholar] [CrossRef] [Scilit]
  31. Depestele, J.; Lenoir, H. ICES Workshop on Innovative Fishing Gear (WKING); International Council for the Exploration of the Sea: Copenhagen, Denmark, 2020. [Google Scholar]
  32. Havas, V.; Cantillo, J.; Deshpande, P. Comparing the end-of-life circularity potential of commercial fishing gear deployed in Norway by applying multi-criteria decision analysis (MCDA). Mar. Pollut. Bull. 2024, 209, 117066. [Google Scholar] [CrossRef] [Scilit] [PubMed]
  33. IUCN. PANORAMA—Solutions for a Healthy Ocean; International Union for Conservation of Nature: Gland, Switzerland, 2018. [Google Scholar]
  34. Mannaart, M.; Bentley, A. Fishing for Litter: From the implementation of practical actions locally, to its spin-offs and the adoption of a new legally adopted waste type at continental scale, a success story. Mar. Policy 2022, 145, 105256. [Google Scholar] [CrossRef] [Scilit]
  35. Ahmed, S.; Glavee-Geo, R.; Grimstad, S.; Engeseth, M. Circular Business Models for SMEs in the Fishing Gear Industry. In Marine Plastics: Innovative Solutions to Tackling Waste; Springer Nature: Cham, Switzerland, 2023; pp. 61–79. [Google Scholar]
  36. Chumchuen, W.; Krueajun, K. Fishing activities and viewpoints on fishing gear marking of gillnet fishers in small-scale and industrial fishery in the Gulf of Thailand. Mar. Pollut. Bull. 2021, 172, 112827. [Google Scholar] [CrossRef] [Scilit]
  37. Maksum, K.; Purnama, F.A.; Sasmita, S. Estimation and causes of marine debris of gillnet fishing equipment components in the northern sea of Central Java Indonesia. AACL Bioflux 2023, 16, 2369–2379. [Google Scholar]
  38. Barbosa-Filho, M.L.V.; Seminara, C.I.; Tavares, D.C.; Siciliano, S.; Hauser-Davis, R.A.; da Silva Mourão, J. Artisanal fisher perceptions on ghost nets in a tropical South Atlantic marine biodiversity hotspot: Challenges to traditional fishing culture and implications for conservation strategies. Ocean Coast. Manag. 2020, 192, 105189. [Google Scholar] [CrossRef] [Scilit]
  39. Bergmann, M.; Gutow, L.; Klages, M. Marine Anthropogenic Litter; Springer Nature: Cham, Switzerland, 2015. [Google Scholar]
  40. Fossi, M.C.; Panti, C. The impact of marine litter in marine protected areas (MPAs) in the Mediterranean Sea: How can we protect MPAs? In Mare Plasticum-The Plastic Sea: Combatting Plastic Pollution Through Science and Art; Springer: Berlin/Heidelberg, Germany, 2020; pp. 117–128. [Google Scholar]
  41. Sánchez-Jiménez, A.; Macmillan, D.; Wolff, M.; Schlüter, A.; Fujitani, M. The Importance of Values in Predicting and Encouraging Environmental Behavior: Reflections from a Costa Rican Small-Scale Fishery. Front. Mar. Sci. 2021, 8, 18. [Google Scholar] [CrossRef] [Scilit]
  42. Stephenson, R.; Paul, S.; Pastoors, M.; Kraan, M.; Holm, P.; Wiber, M.; Mackinson, S.; Dankel, D.; Brooks, K.; Benson, A. Integrating fishers’ knowledge research in science and management. ICES J. Mar. Sci. 2016, 73, 1459–1465. [Google Scholar] [CrossRef] [Scilit]
  43. Gleim, M.R.; Smith, J.S.; Andrews, D.; Cronin, J.J., Jr. Against the green: A multi-method examination of the barriers to green consumption. J. Retail. 2013, 89, 44–61. [Google Scholar] [CrossRef] [Scilit]
Figure 1. Map of survey area.
Conservation 06 00067 g001
Figure 2. Average mass of ALDFG by fishing method from surveyed vessels in 10 coastal provinces/cities in Vietnam.
Conservation 06 00067 g002
Figure 3. Material composition of ALDFG by fishing method among surveyed vessels in 10 coastal provinces/cities in Vietnam.
Conservation 06 00067 g003
Figure 4. Frequency of gear replacement among surveyed fishers in 10 coastal provinces/cities in Vietnam.
Conservation 06 00067 g004
Figure 5. End-of-life gear outcomes reported by surveyed fishers in 10 coastal provinces/cities in Vietnam.
Conservation 06 00067 g005
Figure 6. Distribution of fisher perception of ALDFG consequences in 10 coastal provinces/cities in Vietnam.
Conservation 06 00067 g006
Figure 7. Mean ratings of different consequences of ALDFG by fishing method in 10 coastal provinces/cities in Vietnam (1—Strongly disagree; 2—Disagree; 3—Neither disagree nor agree; 4—Agree; 5—Strongly agree).
Conservation 06 00067 g007
Table 1. Proportion of surveyed vessels by fishing method in 10 coastal provinces/cities in Vietnam.
Fishing MethodSurveyed (Vessels) Total Number of Vessels in Vietnam (Vessels)Sample Coverage (%)
Trawl43112,6063.4%
Gill net67229,9432.2%
Purse seine13255982.4%
Hook and line25018,7551.3%
Stick-held falling net8021343.7%
Trap16969242.4%
Others13041153.2%
Total186480,0752.3%
Table 2. Number of fishing vessels in Vietnam.
Fishing MethodNumber of Fishing Vessels by Length Group (Vessels)Totals (Vessels)
<12 m12–15 m≥15 m
Trawl12843099822312,606
Gill net21,3963905464229,943
Purse seine725122836455598
Hook and line95862779639018,755
Stick-held falling net10228017522134
Trap62135721396924
Others325233514554115
Totals39,63114,19826,24680,075
Table 3. Profile of fishing vessels in 10 coastal provinces/cities in Vietnam.
VariableObsMeanStd. Dev.MinMax
Age186449.14.82280
Crew members (people)18644.74.0130
Fishing experience (years)186423.010.3160
Education (%)
Secondary school or below161986.9
High school22011.8
Vocational college251.3
Vessel length (m)186413.04.02.532.0
Days at sea in month (days)186419.65.1130
Days at sea in year (days)1864191.963.140360
Table 4. Total mass of ALDFG reported by surveyed vessels in 10 coastal provinces/cities in Vietnam.
Fishing MethodNumber of Surveyed VesselsNumber of ALDFG Report CasesRates of Lost Case Reported (%)Total Plastic Mass Used in Fishing Gear in Surveyed Vessels (kg/year)Total Amount of ALDFG (kg/year)Rate of ALDFG Mass (%)
Trawl43111226.03,917,89798220.25
Gill net67251776.913,030,89651,8930.40
Purse seine1321712.911,474,3338330.01
Hook and line25015662.4300,62563762.12
Stick-held falling net801012.5255,1804100.16
Trap1697645.03,290,59410,2800.31
Others1306953.11,993,47331060.16
Totals186495751.334,262,99882,7200.24
Table 5. Common effects from the selected partial proportional odds model of fishers’ concern about ALDFG among surveyed fishers in 10 coastal provinces/cities in Vietnam.
Odds RatioStd. Error (β)z Valuep-Value[95% Conf. Interval]
Age0.9360.013−5.203<0.0010.9130.960
Education1.5300.1373.1020.0021.1692.001
Fishing experience1.0530.0068.225<0.0011.0401.066
Vessel length1.1690.01510.555<0.0011.1351.203
Days at sea0.9880.001−11.675<0.0010.9860.990
Economic losses to fishing activities1.3210.0763.679<0.0011.1391.532
Harm to environment1.4120.0873.955<0.0011.1901.675
Hazards to navigation0.6730.089−4.459<0.0010.5650.801
Impact on fish stocks0.6540.080−5.325<0.0010.5590.764
Damage to fishing gear1.0230.0660.3420.7330.8991.164
Model statistics
Log likelihood−1265.628
AIC2563.257
McFadden’s pseudo R20.160
LR χ2482.591
p<0.001
Disclaimer/Publisher’s Note: The statements, opinions and data contained in all publications are solely those of the individual author(s) and contributor(s) and not of MDPI and/or the editor(s). MDPI and/or the editor(s) disclaim responsibility for any injury to people or property resulting from any ideas, methods, instructions or products referred to in the content.