Brief Report

Should Conservation Cut-In Wind Speed Be Tailored to Site-Specific Conditions? Insights from Bat Activity Patterns at Wind Farms in Northern Portugal


1
Laboratory of Fluvial and Terrestrial Ecology, Innovation and Development Center, University of Trás-os-Montes e Alto Douro, 5000-911 Vila Real, Portugal
2
Athene—Ecological Indicators and Modelling Research Group, Centre for the Research and Technology of Agro-Environment and Biological Sciences (CITAB), Institute for Innovation, Capacity Building and Sustainability of Agrifood Production (Inov4Agro), Quinta de Prados, 5000-801 Vila Real, Portugal
3
Research Group on Ecology and Conservation of Amazonian Biodiversity, Campus Itaituba, Federal Institute of Education, Science and Technology of Para, Itaituba 68183-300, PA, Brazil
4
Department of Biology and Environment, School of Life and Environmental Sciences, University of Trás-os-Montes e Alto Douro, 5000-801 Vila Real, Portugal
*
Author to whom correspondence should be addressed.
Conservation 2026, 6(2), 43; https://doi.org/10.3390/conservation6020043
Submission received: 10 February 2026 / Revised: 31 March 2026 / Accepted: 6 April 2026 / Published: 9 April 2026

Abstract

Wind energy stands as one of the most technologically mature renewable sources, playing a pivotal role in the mitigation of greenhouse gas emissions. However, wind farms and associated infrastructures increase collision risk for flying organisms. Implementing higher cut-in speeds is a proven mitigation strategy to significantly decrease wildlife mortality rates, particularly for bat species, by preventing turbine operation during low-wind periods of high activity. The suggested, non-standard, increased cut-in speed for wind turbines is generally 5.0 m/s. To test the effectiveness of cut-in speed increase, bat activity was monitored at three wind farms in northern Portugal (Gevancas, Azinheira, and Lagoa de Dom João e Feirão), to characterize spatial and temporal activity patterns and assess the potential associated risk. Ultrasonic acoustic detection was carried out at fixed stations, at heights of 55 m above ground level from March to October. Wind speed data were recorded concurrently using anemometers mounted on meteorological towers. Contradicting recommendations, the results show that significant bat activity might occur at wind speeds above the current curtailment values. Since turbine operation coincides with peak bat activity, it is imperative to implement site-specific mitigation strategies, such as optimized cut-in speeds, to minimize mortality risk.

1. Introduction

Wind energy production is one of the strategies contributing to reduce human-induced greenhouse gas emissions, by decreasing the dependency from fossil fuels [1]. However, its spatial positioning should be planned within a rigorous ecological framework [2]. Indeed, wind turbines may cause barrier effects, disturbance and displacement of species, habitat loss, and fragmentation, apart from casualties of birds and bats [3]. To minimize impacts on wildlife, it is important to use optimal sitting strategies for wind turbines, e.g., avoiding sensitive habitats [4] or keeping minimum distances from raptor nests and bat roosts [5,6].
Bats are long-lived, low fecundity mammals and, therefore, may be particularly vulnerable to large-scale sustained mortality events, such as those resulting from wind turbines [7]. As global wind energy development expands to meet energy demands and mitigate climate change [8], it is essential to manage these impacts, especially since several species of bats are endangered and most provide crucial ecosystem services (i.e., pest control, pollination, seed dispersal) [9].
Effective positioning of wind turbines is a promising approach to reduce impacts on bats [10]. However, as many species’ habitat requirements exhibit temporal variation over the annual cycle, the success in reducing collision risk from the turbines’ location is rather uncertain [10]. A promising approach to mitigate on-site impacts on bats is to increase the cut-in wind speed—the threshold at which a wind turbine starts rotating and generating power (usually circa 3 m/s)—to higher values. Recent works have highlighted the strong correlation between acoustic exposure, i.e., passes detected near the rotor-swept zone when turbines are operational, with bat fatalities at turbines [11,12]. Even if there is no single, universal “standard” cut-in speed for conservation, it often involves increasing this value to 5.0 m/s (sometimes to higher values) [12]. Since bats exhibit peak flight activity at low wind speeds, this adjustment is expected to substantially mitigate collision risk with minimal impact on energy yields [13].
Drawing on data from three wind farms located in northern Portugal, we assess the wind speeds at a height of 55 m above ground, to evaluate whether regular curtailment thresholds align with local activity patterns. Objectives include debating whether general rules associated with curtailing turbine operation results in effective lowering of mortality risk or if they should be tailored to specific locations and periods.

2. Materials and Methods

2.1. Study Area

This study was conducted in three wind farms located in mainland north and central Portugal, Gevancas wind farm (Serra do Alvão), Lagoa de Dom João and Feirão wind farm (Serra de Montemuro), and Azinheira wind farm (Serra do Viso) (complementary information in Supplementary Materials S1), from 2017 to 2025, combining historical monitoring datasets with additional field surveys.

2.2. Estimating Wind Speeds

According to the Portuguese national authority for nature conservation (ICNF—Institute for Nature Conservation and Forests) and UNEP/EUROBATS guidelines, approximately 90% of bat activity occurs at wind speeds up to 3 m/s [14]. However, this pattern refers to near-ground conditions and cannot be directly applied to turbine heights, considered collision-prone hot-spots. In fact, studies demonstrate that species susceptibility to collision is highly correlated with their propensity to spend time at height. Therefore, bat activity was monitored at 55 m above ground level, encompassing flight paths superimposed to the rotor-swept zone [15]. Due to the impossibility of collecting wind speed at this height, the wind speed measurements were obtained from anemometers NRG S1 (NRG Systems, Hinesburg, VT 05461, USA) [16] placed in nearby meteorological towers or wind turbines (at 45 m or 85 m, respectively). To relate with bat activity, wind speed at 55 m was extrapolated using the wind profile (Hellmann) power law [17]:
μ z = μ z r e f z z r e f α
where
  • μ(z) is the estimated wind speed at the desired height at 55 m;
  • μ z r e f is the known wind speed at the reference height at 45 m (meteorological towers) or 85 m (wind turbines);
  • z is the target height for wind speed estimation (55 m);
  • z r e f is the reference height at which wind speed is known (45 m or 85 m);
  • α is the roughness factor, with values between approximately 0.14 and 0.20 commonly adopted for moderately rough terrain dominated by low shrublands and pastures, typical of mountainous landscapes in north-central Portugal [18,19,20]. An α value of 0.18 was adopted, and sensitivity analyses were conducted using the lower and upper bounds of the typical range (0.14 and 0.20) for wind speed calculations (Supplementary Materials S2).

2.3. Bat Activity Monitoring

Bat activity recording was carried out using fixed monitoring points at 55 m. For this purpose, meteorological towers at each wind farm were used to mount the equipment (automatic detectors Song Meter SM4BAT FS and microphones SMM-U2 Ultrasonic Microphone, Maynard, MA 01754-2657, USA) [21,22], configured specifically for the targeted bat community. Detectors remained active for seven consecutive nights each month, from March to October, comprising 56 nights of sampling (each night, recordings began at sunset and continued until sunrise). Wind speed values at each sampling point were obtained from anemometers mounted on the meteorological towers (at 45 m) or on the wind turbine (85 m) (see Section 2.2). The collected parameters allowed researchers to analyze the influence of wind speed on bat activity.

2.4. Data Processing

Species identification was performed via the AutoID function of Kaleidoscope Pro® (Wildlife Acoustics Inc., Maynard, MA 01754-2657, USA), with subsequent manual auditing to ensure accuracy [23,24]. Whenever necessary, pulse identification was confirmed with reference works [25,26]. Bat activity patterns were evaluated based on the number of passes recorded per hour (bat passes/h). Additionally, the cumulative distribution of bat activity (the cumulative number of passes) by wind speed at 55 m was used to determine the velocities corresponding to 90% (and 80%) of total bat activity, to facilitate comparison against ICNF/UNEP/EUROBATS reference value for near-ground data, i.e., 90% of bat activity occurring at wind speeds up to 3 m/s. Actually, the 5 m/s cut-in threshold—often adopted in mitigation studies—serves as a trade-off between optimizing energy production and reducing collision risk, established taking into account the ICNF/UNEP/EUROBATS reference. To assess the influence of wind speed on bat activity patterns (bat passes/h) recorded at 55 m, a Generalized Linear Mixed Model (GLMMs) was implemented, considering the random effects associated with the wind farm and month of the year. As the data consisted of counts, the negative binomial distribution with a log link function was considered, to account for overdispersion in the count data. All statistical analyses were performed using the R statistical software (version 4.5.3) and the TMB package (version 1.9.21) [27].

3. Results

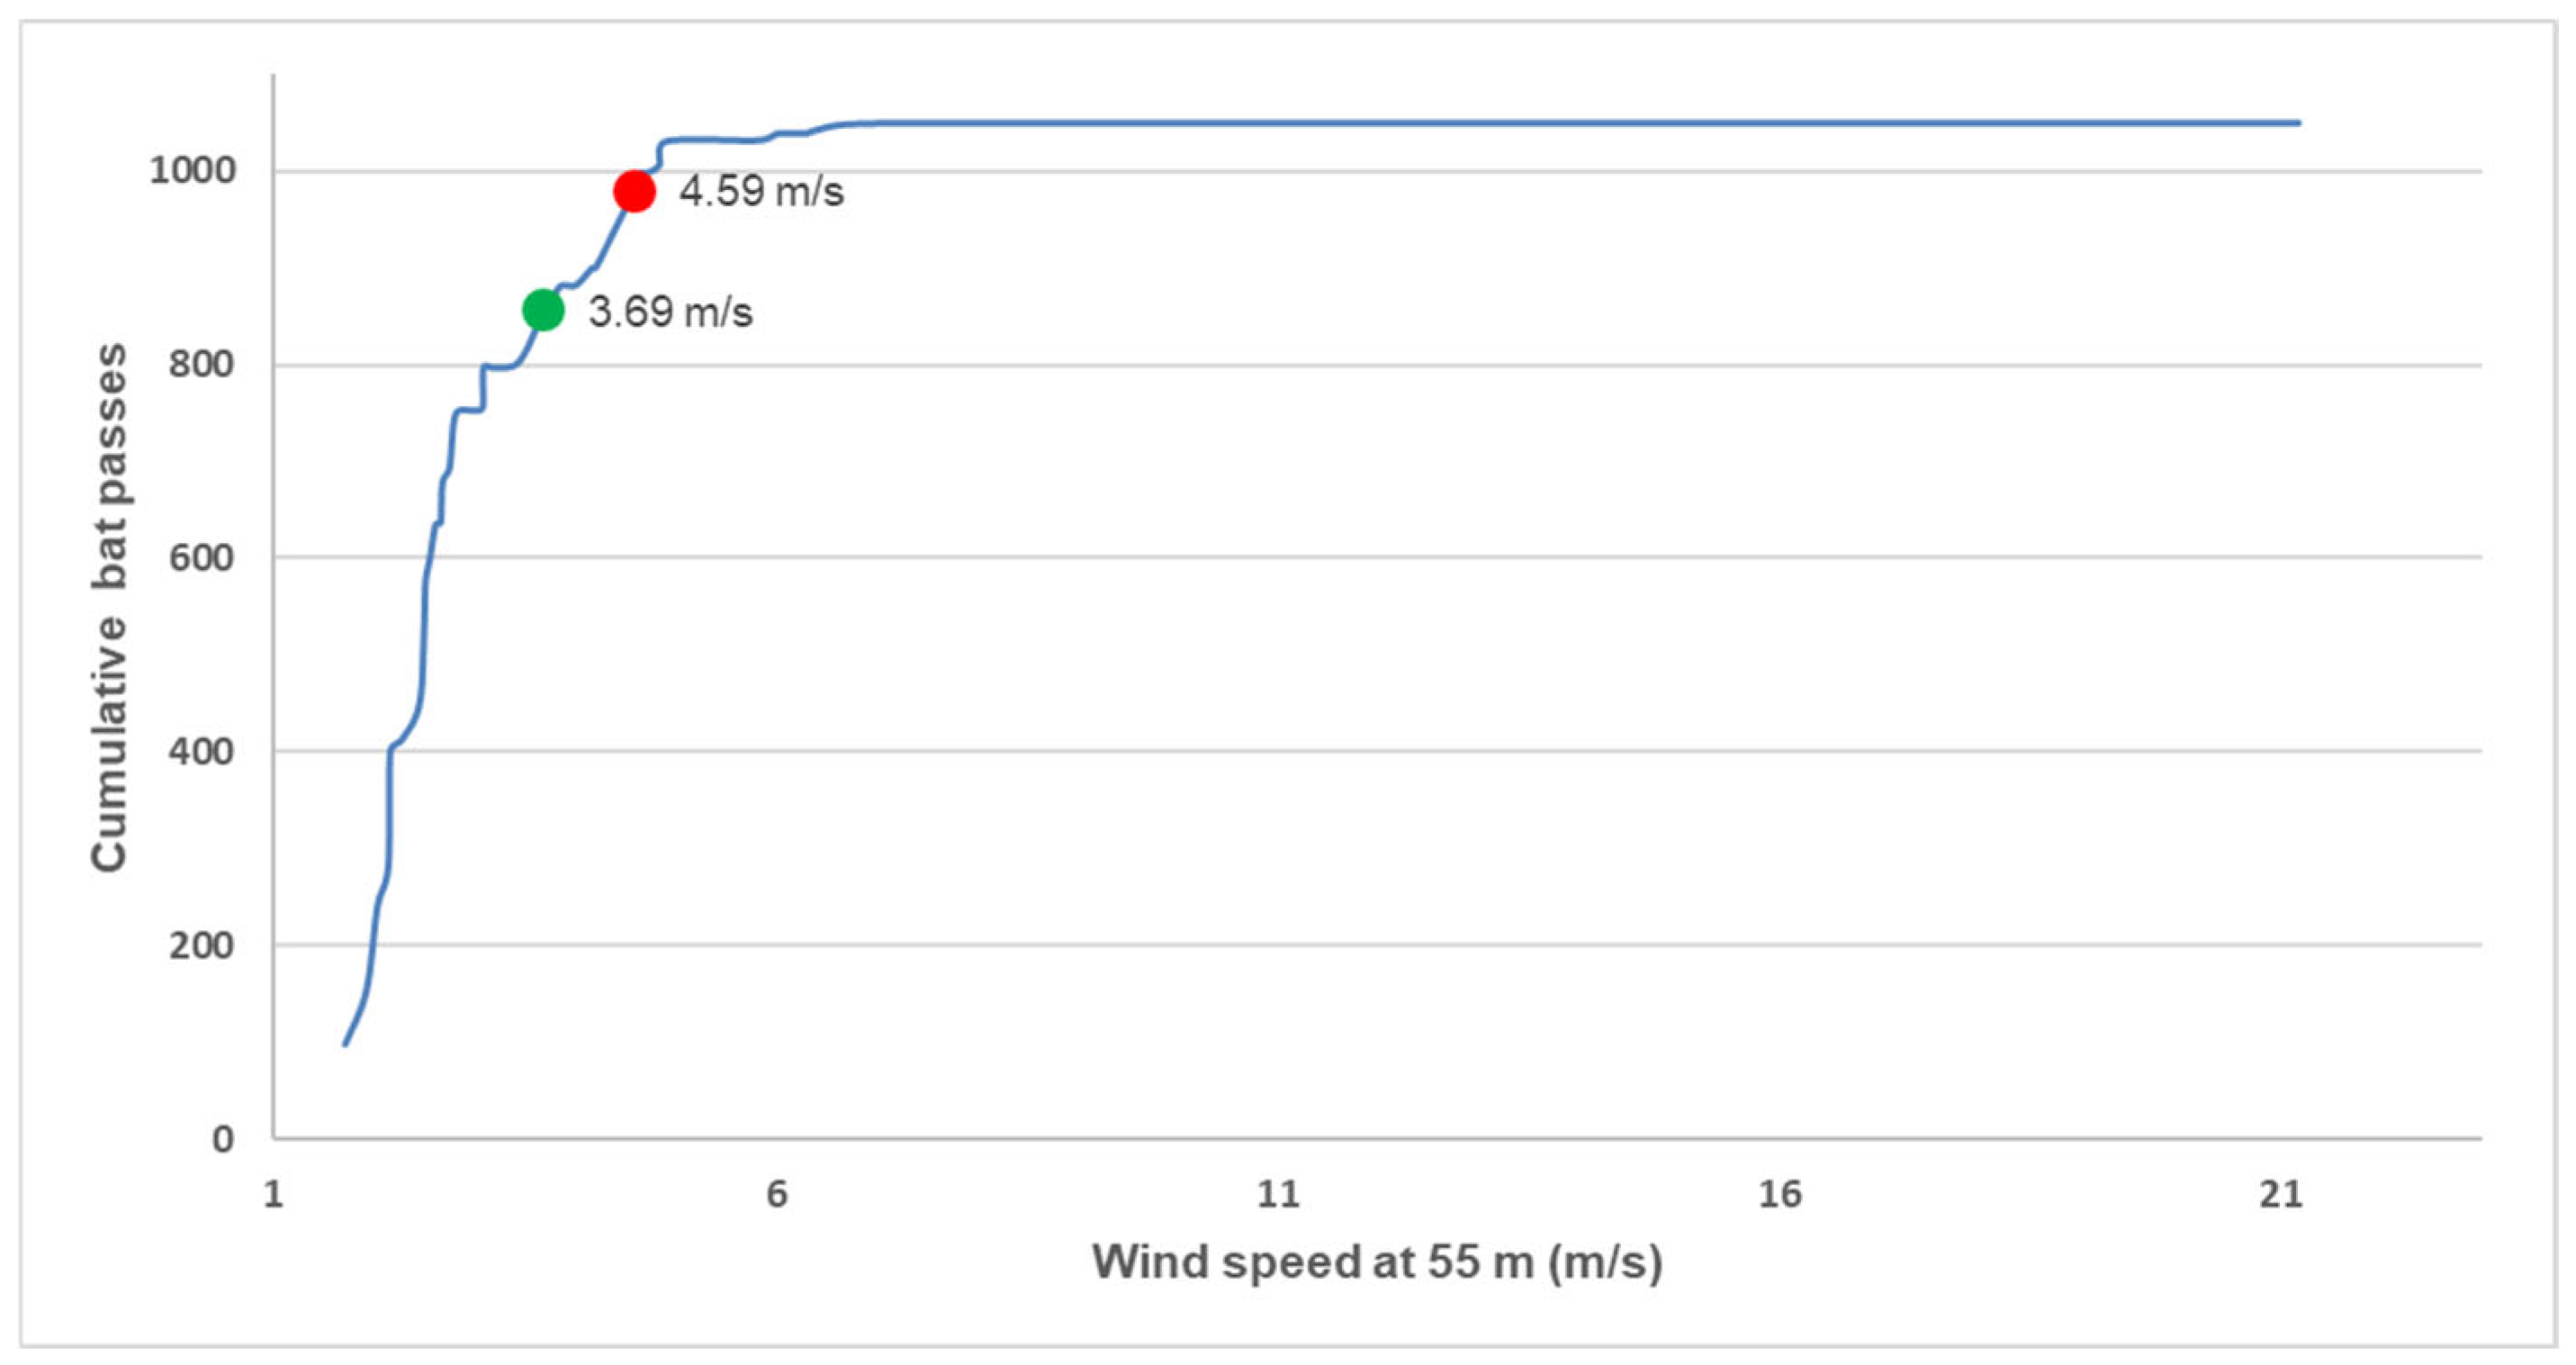
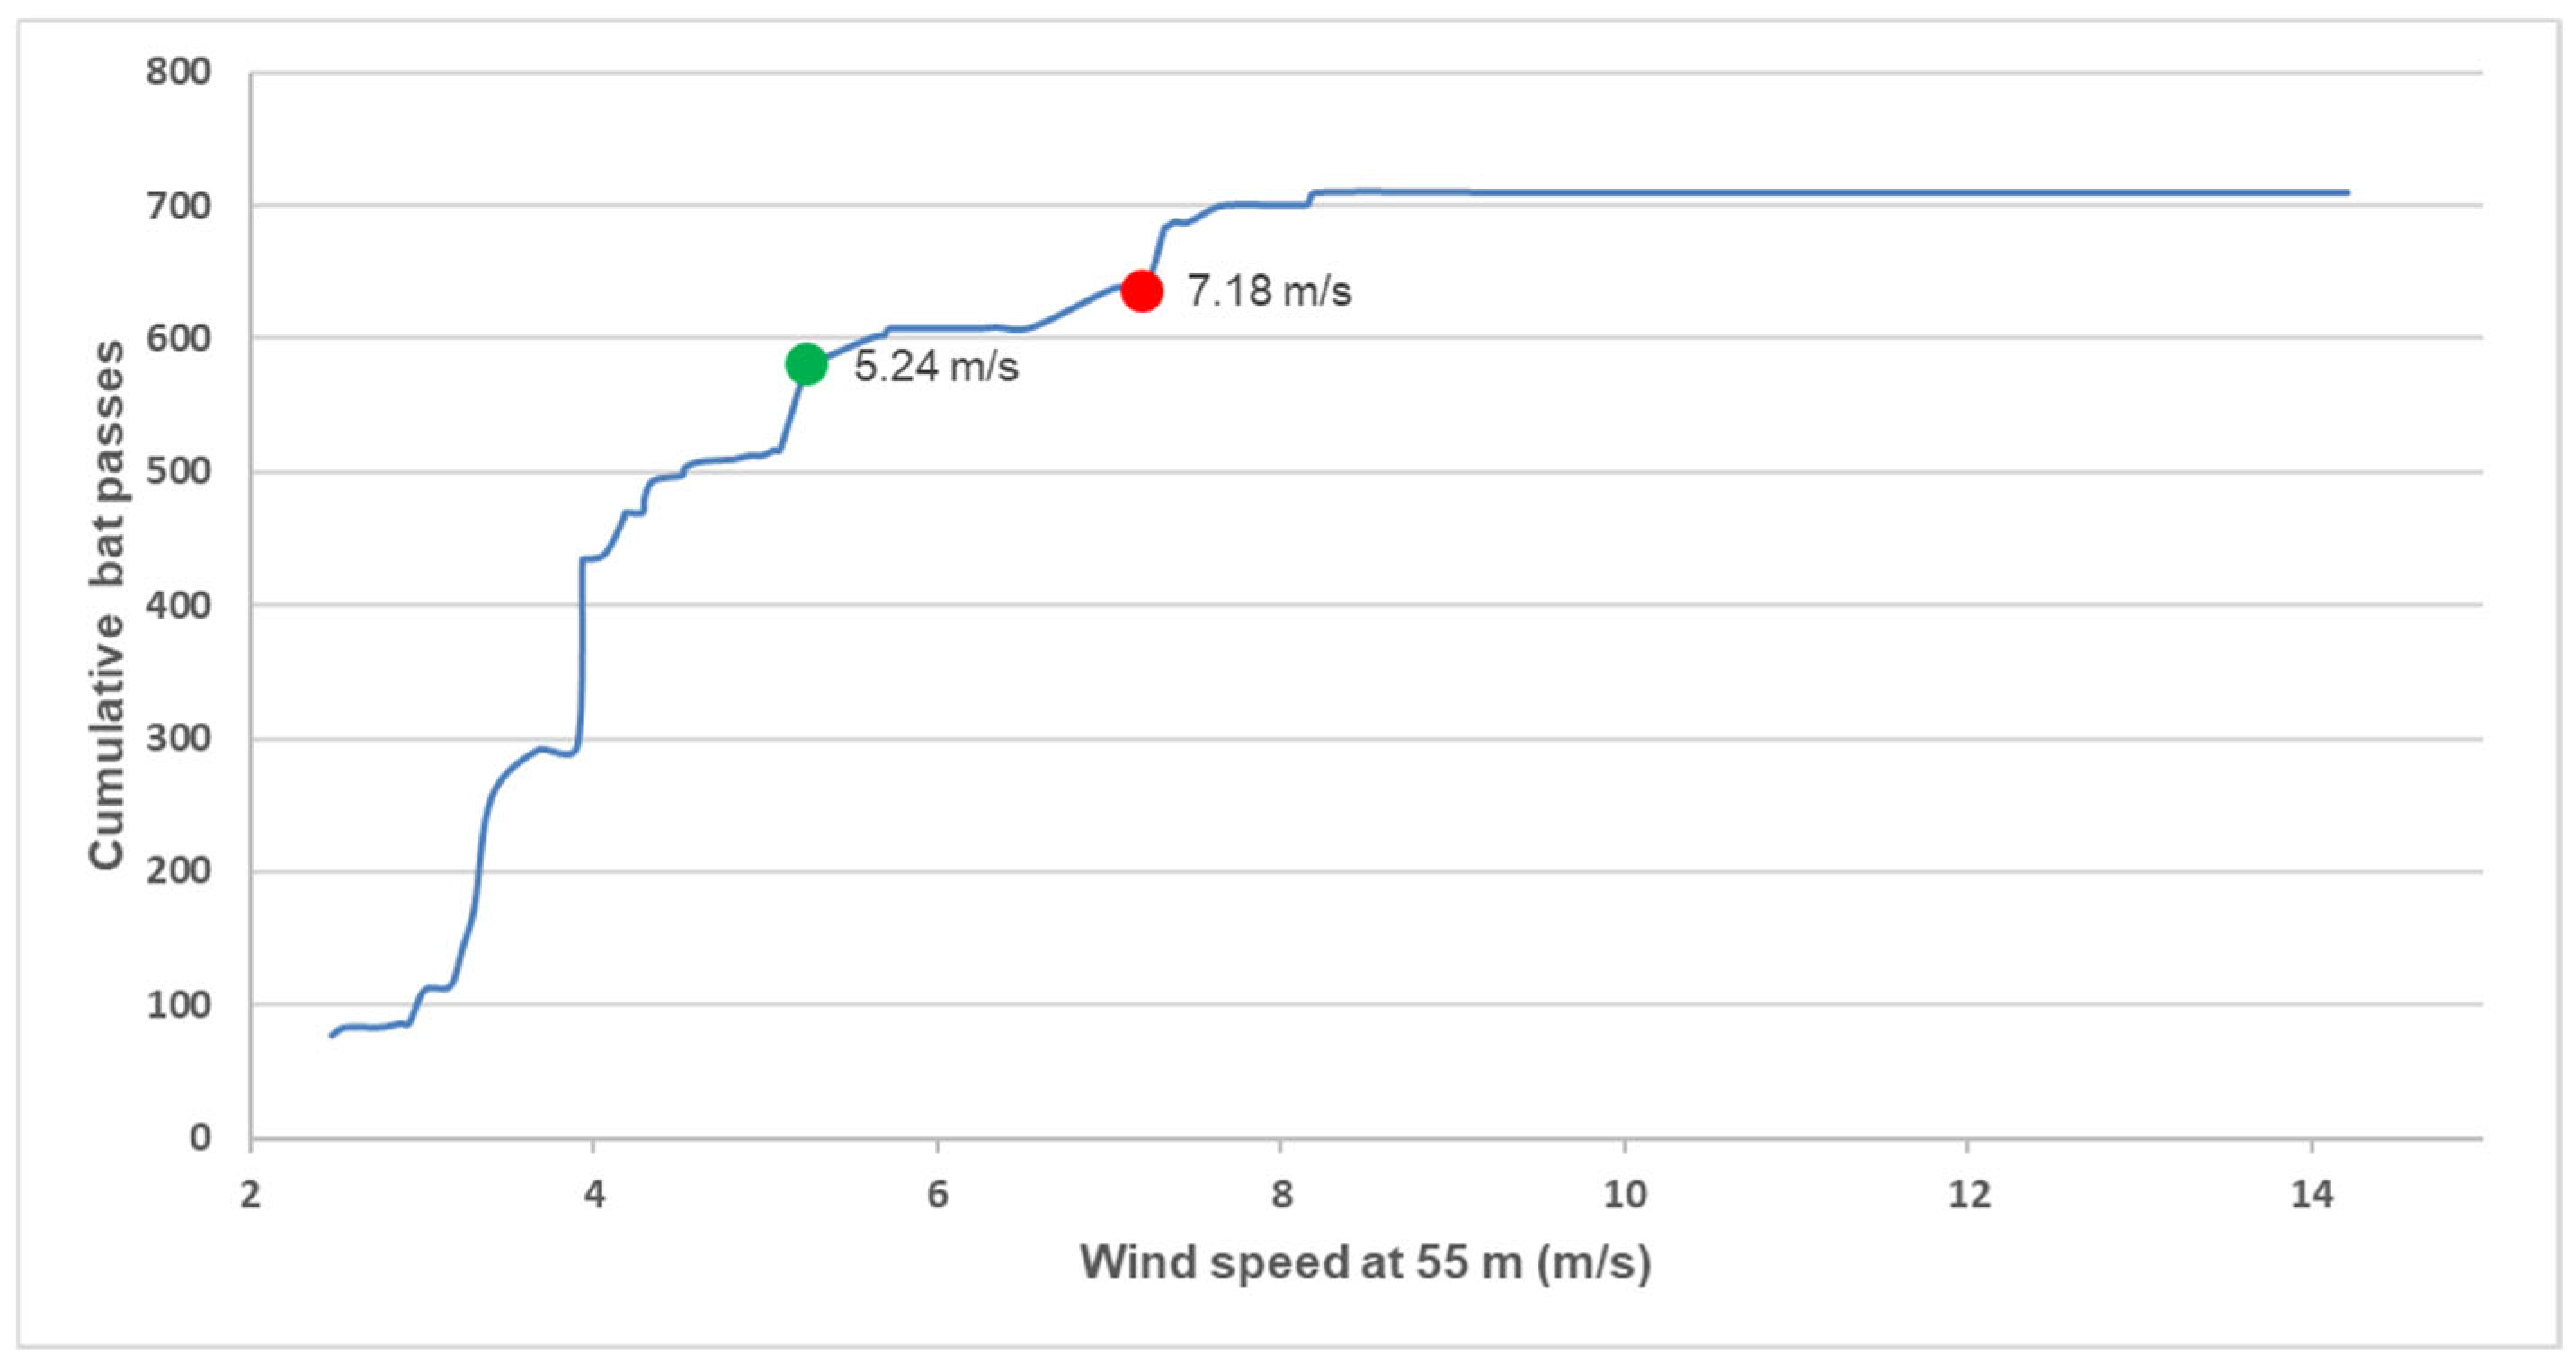
Most recorded activity involved three species — Pipistrellus pipistrellus, Nyctalus leisleri, and Tadarida teniotis—all of which are considered to have a high probability of collision with wind turbines (Supplementary Materials S3). Each wind farm showed distinct annual peaks in activity: Azinheira in May (with a smaller peak in August), Gevancas in September, and Lagoa de Dom João and Feirão in July (Supplementary Materials S4). The relationship between cumulative bat activity and wind speed at 55 m diverged across wind farms: (a) at Gevancas, 90% of cumulative bat activity occurred at wind speeds up to 5.87 m/s (80% at wind speeds up to 5.30 m/s) m/s (Figure 1); (b) at Azinheira, 90% of cumulative bat activity was registered at wind speeds up to 4.59 m/s (80% at wind speeds up to 3.69 m/s) (Figure 2); (c) finally, at Lagoa de Dom João e Feirão, 90% occurred at wind speeds up to 7.18 m/s (80% at wind speeds up to 5.24 m/s) (Figure 3).
The mixed-effects model depicts the random influence of time (month; σ2 = 0.36) and location (wind farm; σ2 = 0.01) in the patterns of bat activity observed (passes/h). Even when considering the previous randomness, bat activity decreased significantly with increasing wind speed (β = −0.32 ± 0.05 SE, z = −6.87, p < 0.001) (Table 1). The simulation-based residual diagnostics for the negative binomial model showed no evidence of overdispersion (dispersion = 1.49, p = 0.312) (Supplementary Materials S5). The marginal R2 of the selected negative binomial model indicated that wind explained approximately 34% of the variance while the conditional R2 (including random effects) increased to approximately 45%, suggesting that variation among months and wind farms also contributed meaningfully to explaining the number of passes recorded (Supplementary Materials S5).

4. Discussion

The results of the Generalized Linear Mixed Model revealed substantial seasonal variation in bat activity, as indicated by the relatively high variance, mostly associated with the random effect of the month. This variability corresponds to an approximately 1.8-fold difference in expected bat activity among months after accounting for wind speed effects (Supplementary Materials S6). This pattern aligns with previous studies e.g., [13,15] and highlights the importance of getting more information to incorporate seasonal variation when defining operational mitigation thresholds for wind turbines. However, the wind speed thresholds at which most bat activity occurred differed also among the three wind farms, emphasizing the importance of local ecological and landscape factors in shaping this relationship [28]. In fact, bat activity and wind speed are expected to be site-dependent, probably reflecting differences in bat community composition, habitat structure, prey availability, and proximity to landscape features such as forest edges and watercourses [28,29]. Studies have proven that wind farms located in more complex and heterogeneous landscapes tend to concentrate higher bat activity, which can increase collision risk [30].
Nevertheless, acoustic sampling conducted at a single detector height may not represent the vertical stratification of the bat activity, which varies according to morphology, echolocation functional types, among other variables [31]. Studies incorporating multi-height sampling frequently report substantial differences in activity patterns across vertical strata, particularly in structurally complex habitats such as forests [31,32]. Consequently, the obtained results should be interpreted as representative primarily of the sampled height stratum, and extrapolation to overall bat community activity should be made with caution.
The risk of bat collisions with wind turbines is directly related to both activity levels and turbine operation [33,34]. Although most activity occurs up to wind speeds of 9 m/s, bats tend to be more active under moderate wind speeds conditions (below 6–7 m/s). Windmills typically begin operating at wind speeds above 3 m/s, partially coinciding with the wind speed at which bat activity is highest. Therefore, the periods of highest risk occur when turbines are active and bat activity is favored [35]. Additionally, the risk of collision is prominent for taller turbines and, therefore, mitigation must be tailored to the rotor-swept zone, especially when bat activity is relevant at the nacelle height [36].
Based on UNEP/EUROBATS guidelines and related scientific reports, the recommended wind speed threshold to trigger cut-in speed for wind turbines to protect bats is typically around 5 m/s (from 3 to 6.5 m/s), but with no clear indication on the heights associated [14]. These thresholds emerge from approximately 90% of bat activity near ground level (5 m) occurring under such low-wind conditions [36]. However, bat activity at ground level is associated with a low risk zone, whereas the heights at which turbine rotors operate correspond to areas of real risk of collision [36]. This threshold therefore does not account for the vertical gradient in wind speed and bat activity, and its implication for turbine related mortality. By translating this reference value to relevant heights, our results suggest that a uniform cut-in speed may not adequately capture site specific risk conditions [31]. In some cases, applying generalized thresholds could even lead to an unnecessary energy production loss [36].
Overall, our humble findings emphasize the need for adaptive, site-specific mitigation strategies at wind farms. Rather than relying on uniform curtailment thresholds, novel management measures should be informed by local bat activity patterns and environmental conditions. Algorithmic curtailment, moving beyond ‘blanket’ rules, allow for a more nuanced integration of complementary environmental variables like temperature and seasonal activity [28]. Additionally, the combination of machine learning and real-time data could minimize energy losses while providing high-resolution information on bat passes [37]. Ultimately, the shift from static to adaptive operational logic is fundamental for enabling the large-scale deployment of wind energy and for supporting more robust analyses in complex decision-making contexts [38]. Such tailored approaches have the potential to enhance bat conservation while maintaining wind energy efficiency and sustainability. With this, we envision adaptive regulatory thresholds to turbine operational conditions, ensuring that mitigation measures are effective where the risk of mortality is real.
Gathering detailed, specific data on bat activity and wind speed profiles is essential to effectively determine the most appropriate cut-in speeds and implemented mitigation measures that maximize bat protection while minimizing energy production loss. Management should move beyond pre-defined curtailment towards data-driven trade-off analysis—production vs. activity. This will ensure that mitigation efforts are effective for conservation but also operationally sustainable, namely by focusing on high-risk periods.

5. Conclusions

Given the variation in results across the studied wind farms, the authors advocate that turbine cut-in speeds should not be pre-defined or standardized, but rather adjusted based on prior studies and site-specific data to effectively reduce bat mortality risk. This study provides empirical support by moving beyond uniform curtailment thresholds, underscoring the importance of integrating site-specific ecological data into wind farm planning and management.
Nevertheless, the authors acknowledge limitations that warrant further investigation: (a) bat activity is a proxy for potential collision risk, not a direct measure of mortality, because activity levels do not necessarily translate into fatality rates; (b) using the Hellmann power law to calculate wind speed introduces uncertainty, particularly in complex terrain where vertical wind profiles may deviate from theoretical assumptions; (c) reliance on single-height acoustic sampling restrains our ability to capture vertical variation in bat activity and may hinder our ability to find species-specific differences in behavior, which are known to influence collision vulnerability.

Supplementary Materials

The following supporting information can be downloaded at: https://www.mdpi.com/article/10.3390/conservation6020043/s1, Supplementary Materials S1: Brief description of the windfarms studied; Supplementary Materials S2: Sensitivity of the Hellmann power law estimates to the roughness factor variation; Supplementary Materials S3: Relative bat activity for each species or taxonomic group at the three sampling sites (Gevancas, Azinheira, and Lagoa de Dom João and Feirão), along with conservation status according to the Portuguese Red Book of Mammals, migratory behaviour category, and probability of collision with wind turbines [39,40,41]; Supplementary Materials S4: Seasonal variation in bat activity recorded at the three wind farms (Azinheira, Gevancas, and Lagoa de Dom João and Feirão) between March and October (monthly mean number of passes per hour); Supplementary Materials S5: Model diagnostics; Supplementary Materials S6: Expected bat activity per hour and month, using the mean of the random effect for month (0) and ±1 SD for variation.

Author Contributions

Conceptualization, P.B. and M.S.; methodology, P.B. and M.S.; formal analysis, S.S., P.B. and M.S.; investigation, S.S., P.B. and M.S.; resources, P.B. and M.S.; data curation, P.B.; writing—original draft preparation, S.S., P.B. and M.S.; writing—review and editing, M.S.; visualization, P.B. and M.S.; supervision, M.S.; project administration, P.B.; funding acquisition, M.S. All authors have read and agreed to the published version of the manuscript.

Funding

This research was funded by National Funds by FCT—Portuguese Foundation for Science and Technology, under the projects UID/04033/2025: Centre for the Research and Technology of Agro-Environmental and Biological Sciences (https://doi.org/10.54499/UID/04033/2025) and LA/P/0126/2020 (https://doi.org/10.54499/LA/P/0126/2020).

Institutional Review Board Statement

Not applicable.

Informed Consent Statement

Not applicable.

Data Availability Statement

No new data were created and the raw data will be made available by the authors on request.

Acknowledgments

The authors would like to acknowledge all students and researchers that have participated in fieldworks and to the staff of the Laboratory of Fluvial and Terrestrial Ecology, integrated in the Innovation and Development Center of the University of Trás-os-Montes e Alto Douro.

Conflicts of Interest

The authors declare no conflict of interest.

References

  1. Rahman, A.; Murad, S.W.; Mohsin, A.K.M.; Wang, X. Does renewable energy proactively contribute to mitigating carbon emissions in major fossil fuels consuming countries? J. Clean. Prod. 2024, 452, 142113. [Google Scholar] [CrossRef]
  2. Josimović, B.; Cvjetić, A.; Furundžić, D. Strategic Environmental Assessment and the precautionary principle in the spatial planning of wind farms–European experience in Serbia. Renew. Sustain. Energy Rev. 2021, 136, 110459. [Google Scholar]
  3. Katzner, T.E.; Nelson, D.M.; Marques, A.T.; Voigt, C.C.; Lambertucci, S.A.; Rebolo, N.; Bernard, E.; Diehl, R.; Murgatroyd, M. Impacts of onshore wind energy production on biodiversity. Nat. Rev. Biodivers. 2025, 1, 567–580. [Google Scholar] [CrossRef]
  4. Balotari-Chiebao, F.; Santangeli, A.; Piirainen, S.; Byholm, P. Wind energy expansion and birds: Identifying priority areas for impact avoidance at a national level. Biol. Conserv. 2023, 277, 109851. [Google Scholar] [CrossRef]
  5. Estellés-Domingo, I.; López-López, P. Effects of wind farms on raptors: A systematic review of the current knowledge and the potential solutions to mitigate negative impacts. Anim. Conserv. 2025, 28, 334–352. [Google Scholar] [CrossRef]
  6. Reusch, C.; Paul, A.A.; Fritze, M.; Kramer-Schadt, S.; Voigt, C.C. Wind energy production in forests conflicts with tree-roosting bats. Curr. Biol. 2023, 33, 737–743.e3. [Google Scholar] [CrossRef] [PubMed]
  7. Northrup, J.M.; Wittemyer, G. Characterising the impacts of emerging energy development on wildlife, with an eye towards mitigation. Ecol. Lett. 2013, 16, 112–125. [Google Scholar] [CrossRef]
  8. Intergovernmental Panel on Climate Change (IPCC). Special Report Renewable Energy Sources and Climate Change Mitigation; Cambridge University Press: Cambridge, UK, 2011. [Google Scholar]
  9. Ghanem, S.J.; Voigt, C.C. Chapter 7—Increasing Awareness of Ecosystem Services Provided by Bats; Brockmann, H.J., Roper, T.J., Naguib, M., Mitani, J.C., Simmons, L.W., Eds.; ScienceDirect: Amsterdam, The Netherlands; Academic Press: Cambridge, MA, USA, 2012; Available online: https://www.sciencedirect.com/science/article/abs/pii/B9780123942883000071 (accessed on 7 January 2026).
  10. Arnett, E.B.; Huso, M.M.; Schirmacher, M.R.; Hayes, J.P. Altering turbine speed reduces bat mortality at wind-energy facilities. Front. Ecol. Environ. 2010, 9, 209–214. [Google Scholar] [CrossRef]
  11. Raposeira, H.; Horta, P.; Heleno, R.; Rebelo, H. Changing with the times: Seasonal environmental gradients unveil dynamic bat assemblages and vulnerability. Ecol. Evol. 2023, 13, e10246. [Google Scholar] [CrossRef]
  12. Adams, E.M.; Gulka, J.; Williams, K.A. A review of the effectiveness of operational curtailment for reducing bat fatalities at terrestrial wind farms in North America. PLoS ONE 2021, 16, e0256382. [Google Scholar] [CrossRef]
  13. Ellerbrok, J.S.; Farwig, N.; Peter, F.; Voigt, C.C. Forest bat activity declines with increasing wind speed in proximity of operating wind turbines. Glob. Ecol. Conserv. 2024, 49, e02782. [Google Scholar] [CrossRef]
  14. Barré, K.; Froidevaux, J.S.; Leroux, C.; Mariton, L.; Fritze, M.; Kerbiriou, C.; Le Viol, I.; Bas, Y.; Roemer, C. Over a decade of failure to implement UNEP/EUROBATS guidelines in wind energy planning: A call for action. Conserv. Sci. Pract. 2022, 4, e12805. [Google Scholar] [CrossRef]
  15. Roemer, C.; Disca, T.; Coulon, A.; Bas, Y. Bat flight height monitored from wind masts predicts mortality risk at wind farms. Biol. Conserv. 2017, 215, 116–122. [Google Scholar] [CrossRef]
  16. NRG Systems. NRG S1 Anemometer: Technical Product Sheet. 2019. Available online: https://www.nrgsystems.com/assets/resources/NRG_S1_Tech_Product_Sheet_2023_V1.pdf (accessed on 7 January 2026).
  17. Bañuelos-Ruedas, F.; Angeles-Camacho, C.; Rios-Marcuello, S. Analysis and validation of the methodology used in the extrapolation of wind speed data at different heights. Renew. Sustain. Energy Rev. 2010, 14, 2383–2391. [Google Scholar] [CrossRef]
  18. Burton, T.; Jenkins, N.; Sharpe, D.; Bossanyi, E. Wind Energy Handbook; John Wiley Sons: Hoboken, NJ, USA, 2011. [Google Scholar]
  19. Lázár, I.; Hadnagy, I.; Bertalan-Balázs, B.; Bertalan, L.; Szegedi, S. Comparative examinations of wind speed and energy extrapolation methods using remotely sensed data–A case study from Hungary. Energy Convers. Manag. X 2024, 24, 100760. [Google Scholar] [CrossRef]
  20. Pintor, A.; Pinto, C.; Mendonça, J.; Pilão, R.M.; Pinto, P. Insights on the use of wind speed vertical extrapolation methods. Renew. Energy Power Qual. J. (REPQJ) 2022, 20, 713–718. [Google Scholar] [CrossRef]
  21. Wildlife Acoustics, Inc. Song Meter SM4BAT FS User Guide; 2025 Version; Wildlife Acoustics, Inc.: Maynard, MA, USA, 2025; Available online: https://www.wildlifeacoustics.com/uploads/user-guides/SM4-BAT-FS-USER-GUIDE-EN-2025-06-04.pdf (accessed on 7 January 2026).
  22. Wildlife Acoustics. SMM-U2 Ultrasonic Microphone [Apparatus]. 2022. Available online: https://www.wildlifeacoustics.com/ (accessed on 7 January 2026).
  23. López-Baucells, A.; Torrent, L.; Rocha, R.; Bobrowiec, P.E.; Palmeirim, J.M.; Meyer, C.F. Stronger together: Combining automated classifiers with manual post-validation optimizes the workload vs reliability trade-off of species identification in bat acoustic surveys. Eco. Inform. 2019, 49, 45–53. [Google Scholar] [CrossRef]
  24. Rydell, J.; Nyman, S.; Eklöf, J.; Jones, G.; Russo, D. Testing the performances of automated identification of bat echolocation calls: A request for prudence. Ecol. Indic. 2017, 78, 416–420. [Google Scholar] [CrossRef]
  25. Russ, J. Bat Calls of Britain and Europe; Pelagic Publishing: London, UK, 2021. [Google Scholar]
  26. Rainho, A.; Amorim, F.; Marques, J.T.; Alves, P.; Rebelo, H. Chave de identificaçao de vocalizações dos morcegos de Portugal continental. Versão Electrónica De 2011, 5, 16. [Google Scholar]
  27. Kristensen, K.; Nielsen, A.; Berg, C.W.; Skaug, H.; Bell, B.M. TMB: Automatic Differentiation and Laplace Approximation. J. Stat. Softw. 2016, 70, 1–21. [Google Scholar] [CrossRef]
  28. Barré, K.; Froidevaux, J.S.; Sotillo, A.; Roemer, C.; Kerbiriou, C. Drivers of bat activity at wind turbines advocate for mitigating bat exposure using multicriteria algorithm-based curtailment. Sci. Total Environ. 2023, 866, 161404. [Google Scholar] [CrossRef] [PubMed]
  29. Rnjak, D.; Janeš, M.; Križan, J.; Antonić, O. Reducing bat mortality at wind farms using site-specific mitigation measures: A case study in the Mediterranean region, Croatia. Mammalia 2023, 87, 259–270. [Google Scholar] [CrossRef]
  30. Lloyd, J.D.; Butryn, R.; Pearman-Gillman, S.; Allison, T.D. Seasonal patterns of bird and bat collision fatalities at wind turbines. PLoS ONE 2023, 18, e0284778. [Google Scholar] [CrossRef]
  31. Hermans, C.; Koblitz, J.C.; Bartholomeus, H.; Stilz, P.; Visser, M.E.; Spoelstra, K. Combining acoustic tracking and LiDAR to study bat flight behaviour in three-dimensional space. Mov. Ecol. 2023, 11, 25. [Google Scholar] [CrossRef] [PubMed]
  32. Müller, J.; Brandl, R.; Buchner, J.; Pretzsch, H.; Seifert, S.; Strätz, C.; Veith, M.; Fenton, B. From ground to above canopy—Bat activity in mature forests is driven by vegetation density and height. For. Ecol. Manag. 2013, 306, 179–184. [Google Scholar] [CrossRef]
  33. Guest, E.E.; Stamps, B.F.; Durish, N.D.; Hale, A.M.; Hein, C.D.; Morton, B.P.; Weaver, S.P.; Fritts, S.R. An Updated Review of Hypotheses Regarding Bat Attraction to Wind Turbines. Animals 2022, 12, 343. [Google Scholar] [CrossRef]
  34. Hartmann, S.A.; Hochradel, K.; Greule, S.; Günther, F.; Luedtke, B.; Schauer-Weisshahn, H.; Brinkmann, R. Collision risk of bats with small wind turbines: Worst-case scenarios near roosts, commuting and hunting structures. PLoS ONE 2021, 16, e0253782. [Google Scholar] [CrossRef] [PubMed]
  35. Peterson, T.; Rusk, A.; Byrne, C.; Aghababian, S.; Edwards, S. Acoustic exposure reveals variation in curtailment effectiveness at reducing bat fatality at wind turbines. Ecosphere 2025, 16, e70277. [Google Scholar] [CrossRef]
  36. Maclaurin, G.; Hein, C.; Williams, T.; Roberts, O.; Lantz, E.; Buster, G.; Lopez, A. National-scale impacts on wind energy production under curtailment scenarios to reduce bat fatalities. Wind Energy 2022, 25, 1514–1529. [Google Scholar] [CrossRef]
  37. González-Barbosa, J.J.; Rangel, I.C.; Ramírez-Pedraza, A.; Ramírez-Pedraza, R.; Bárcenas-Reyes, I.; González-Barbosa, E.A.; Razo-Razo, M. Deep Learning for Wildlife Monitoring: Near-Infrared Bat Detection Using YOLO Frameworks. Signals 2025, 6, 46. [Google Scholar] [CrossRef]
  38. Froidevaux, J.S.; Le Viol, I.; Barré, K.; Bas, Y.; Kerbiriou, C. A modeling framework for biodiversity assessment in renewable energy development: A case study on European bats and wind turbines. Renew. Sustain. Energy Rev. 2025, 211, 115323. [Google Scholar] [CrossRef]
  39. Mathias, M.L.; Fonseca, C.; Rodrigues, L.; Grilo, C.; Lopes-Fernandes, M.; Palmeirim, J.M.; Santos-Reis, M.; Alves, P.C.; Cabral, J.A.; Ferreira, M.; et al. Livro Vermelho dos Mamíferos de Portugal Continental; FCiências.ID: Lisbon, Portugal, 2023. [Google Scholar]
  40. Hutterer, R.; Ivanova, T.; Meyer-Cords, C.; Rodrigues, L. Bat Migrations in Europe: A Review of Banding Data and Literature; BfN-Schriftenvertrieb im Landwirtschaftsverlag: Münster, Germany, 2005. [Google Scholar]
  41. Rodrigues, L.; Bach, L.; Dubourg-Savage, M.; Karapandža, B.; Kovač, D.; Kervyn, T.; Dekker, J.; Kepel, A.; Bach, P.; Collins, J.; et al. Guidelines for Consideration of Bats in Wind Farm Projects: Revision 2014; UNEP/EUROBATS: Bonn, Germany, 2015. [Google Scholar]
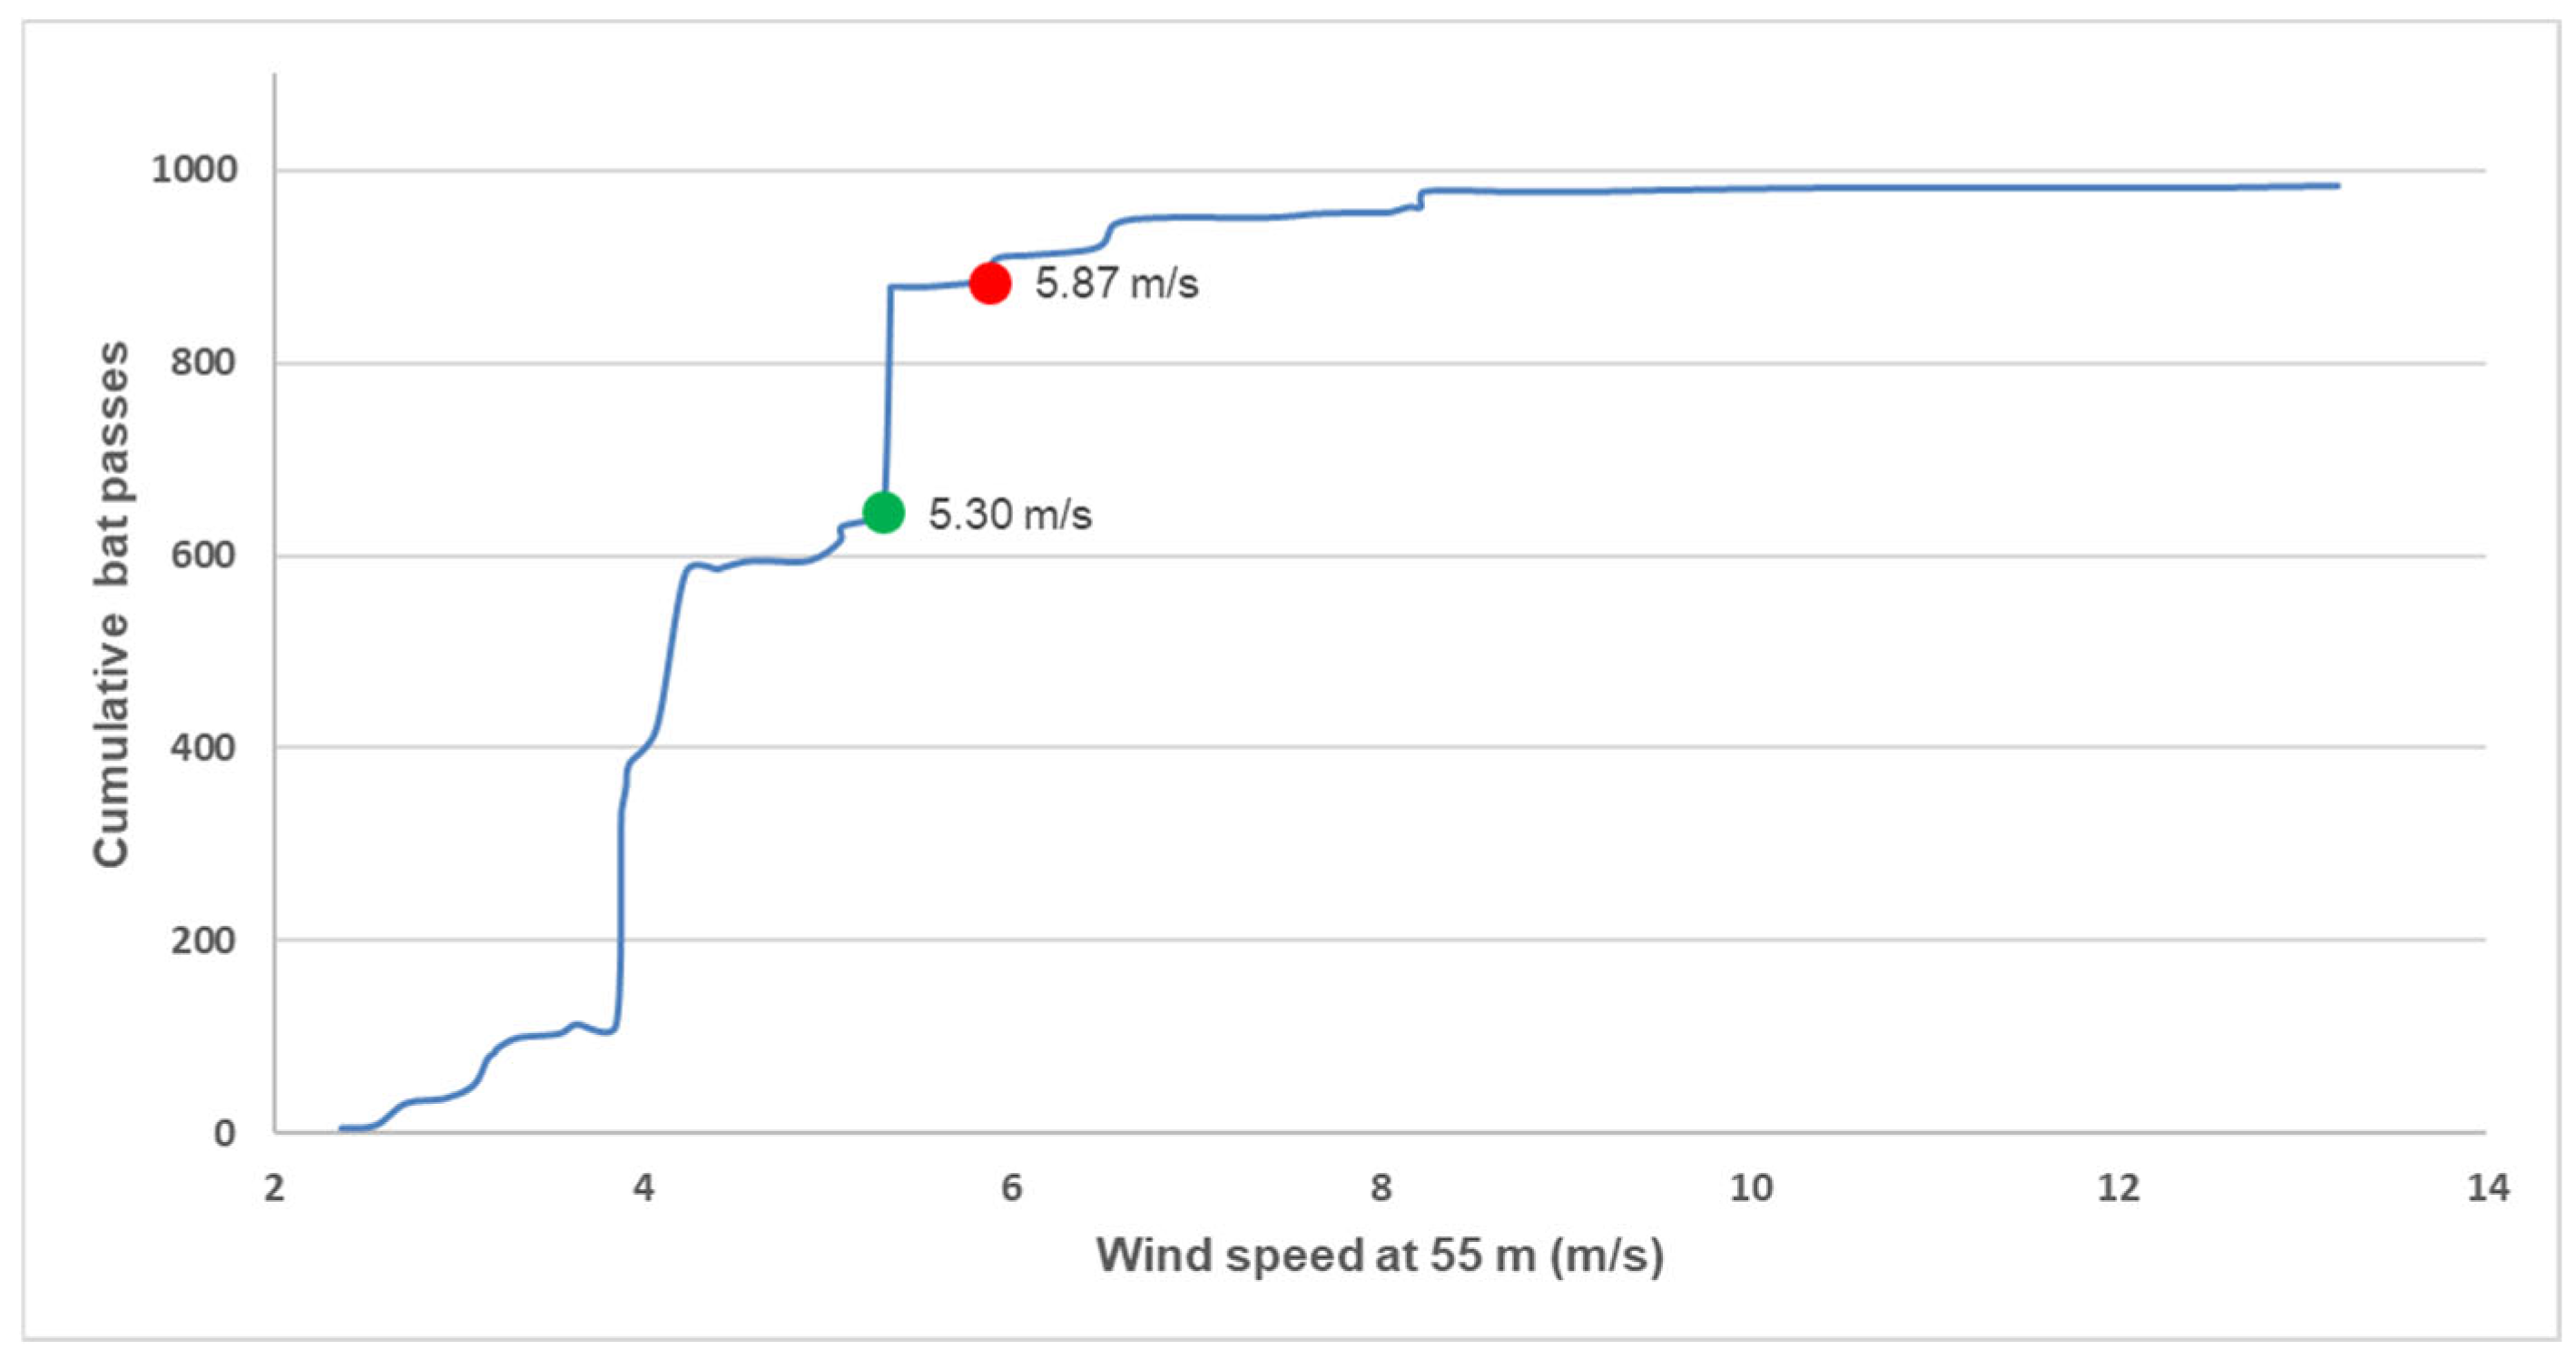
Figure 1. Cumulative bat activity by wind speed at 55 m height (Gevancas wind farm, Serra do Alvão). Blue line—cumulative bat activity; green dot—80% cumulative bat activity; red dot—90% cumulative bat activity.
Conservation 06 00043 g001
Figure 2. Cumulative bat activity by wind speed at 55 m height (Azinheira wind farm, Serra do Viso). Blue line—cumulative bat activity; green dot—80% cumulative bat activity; red dot—90% cumulative bat activity.
Conservation 06 00043 g002
Figure 3. Cumulative bat activity by wind speed at 55 m height (Lagoa de Dom João and Feirão Wind Farm, Serra de Montemuro). Blue line—cumulative bat activity; green dot—80% cumulative bat activity; red dot—90% cumulative bat activity.
Conservation 06 00043 g003
Table 1. Results of the Generalized Linear Mixed Model (GLMM) relating bat activity (passes/h) with wind speed (m/s), considering the different locations (wind farm) and times of the year (month). ***: highly significant.
Random effects
GroupVarianceStd. Dev
Month0.354910.5957
Wind farm0.012160.1103
Fixed effects
EstimateStd. Errorz valuePr (>|z|)
Intercept4.14270.326412.693<0.001 ***
Wind (m/s)−0.32310.0470−6.874<0.001 ***
Disclaimer/Publisher’s Note: The statements, opinions and data contained in all publications are solely those of the individual author(s) and contributor(s) and not of MDPI and/or the editor(s). MDPI and/or the editor(s) disclaim responsibility for any injury to people or property resulting from any ideas, methods, instructions or products referred to in the content.