Abstract
The Asian elephant is mostly confined to mountainous ranges and therefore risks population fragmentation if hard protected area (PA) boundaries near steep slopes prevent movement. We tested whether elephant gene flow is (i) controlled by slope and (ii) affected by the interplay between barriers and slope. We used 176 unique genotypes obtained non-invasively from fresh elephant dung to assess individual-by-individual genetic distance across the Western Ghats of India, a biodiversity hotspot. To assess landscape distance, 36 resistance models were produced by transforming a slope raster. Core areas and corridors were calculated from the raster that provided the best correlation between the genetic and distance matrices. The influence of the closure of PAs on gene flow was examined for one region, the Nilgiri Biosphere Reserve. The best resistance raster obtained by transforming the slope occupancy model was better than Euclidean distance for explaining genetic distance, indicating that slope partially controls gene flow. Fencing elephant PAs on hilly terrain reduces core areas and disrupts corridors. Consequently, hard PA boundaries abutting slopes can fragment elephant populations, but this can be ameliorated by protecting the adjacent flatter terrain.
1. Introduction
The location and design of terrestrial protected areas (PAs) have been influenced by administrative convenience, economics, and human occupancy [1], with limited consideration for optimal conservation outcomes. Reserve boundaries often mark abrupt transitions between habitat and human-dominated areas because human population growth near PAs has been especially rapid in recent decades [2,3], driving the destruction of peripheral habitats [4]. In order to mitigate issues with problematic animals along hard boundaries between natural and human-dominated landscapes, reserve boundaries can be partially or totally closed with fences or trenches [5], for example in Sri Lanka [6], India [7], or Africa [8]. The question then arises whether enclosures alter gene flow within PAs.
The Asian elephant (Elephas maximus, called “the elephant” unless specified otherwise) was historically present across most of south and southeast Asia but is now largely confined to mountainous ranges [9]. Elephants avoid steep inclines [10] due to the energy required to transport their mass uphill [11] and probably also because of heat dissipation [12], relative body strength [13], and risk perception [14]. Reserve boundaries that become impenetrable to elephant movement may combine with the effect of slope to fragment populations within PAs.
Landscape genetics can help to understand how geographical and environmental features structure genetic variation and gene flow [15]. Genetic data collected at multiple locations, from dung samples, for example, can be used to calculate genetic distance among individuals (see Peterson et al. [16] for a critical review). Genetic distance matrices among individuals can then be compared to landscape distance matrices among the same animals. Landscape distances are measured on resistance rasters provided by the transformations of variables hypothesized to be important for animal movement [17]. The transformations are essentially hypotheses regarding the functional effect the variables of interest have on the genetic distance among individuals. The best fit is obtained by comparing genetic and landscape distance matrices in a model selection framework. The raster providing the best fit is then selected to be a resistance layer in subsequent modeling to predict core areas and corridors [18].
In order to determine whether the closure of reserves reduces the gene flow of elephant populations within PAs, we focused on the Western Ghats of India (WG) (Figure 1), a biodiversity hotspot [19] where the elephant range spreads from 8°23′ N to around 16° N [9].
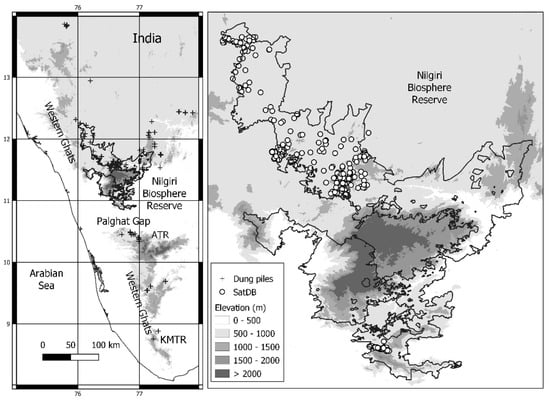
Figure 1.
Study area: distribution of the dung samples over the Western Ghats and locations of the satellites fixed north (Nilgiri Biosphere Reserve) and south (Anamalai Tiger Reserve (ATR)—Kalakkad Mundanthurai Tiger Reserve (KMTR) of the Palghat Gap).
The WG is an escarpment running north–south along the western coastline of India, interrupted towards the south by the low-lying Palghat Gap that separates the northern from the southern elephant populations. This gap has been transformed by agriculture for several centuries, is 3 km at its narrowest, and 40 km at its widest. The northern part of the WG includes the Nilgiri Biosphere Reserve (NBR) and its surrounding PAs, which contain the largest remaining population of wild elephants, ca. 6000 animals [20]. The large number of recorded incidents with elephants at some sites [21] could potentially lead to the closure of PAs.
We used genetic data obtained over most of the WG for the landscape genetic analysis (Figure 1). A recent paper [22] across the elephant ranges in India found a partial genetic differentiation between the northern and southern WG populations. Our objective was to focus on the genetic distance among individuals, not to study the elephant population genetics structure per se, which has already been covered in detail by De et al. [22]. We verified whether genetic differentiation between the northern and the southern parts of the WG affected the selection of the best connectivity model.
We calculated pairwise, individual-by-individual genetic distances for 176 elephant genotypes generated with seven microsatellite markers. We transformed a slope raster over the WG to select various resistance hypotheses (Figure 2). From these resistance maps, 35 landscape distance matrices among the 176 genotyped elephants were obtained, to which a Euclidean distance matrix was added. Correlations between genetic distance and landscape distance matrices were assessed by linear mixed-effect models [20].
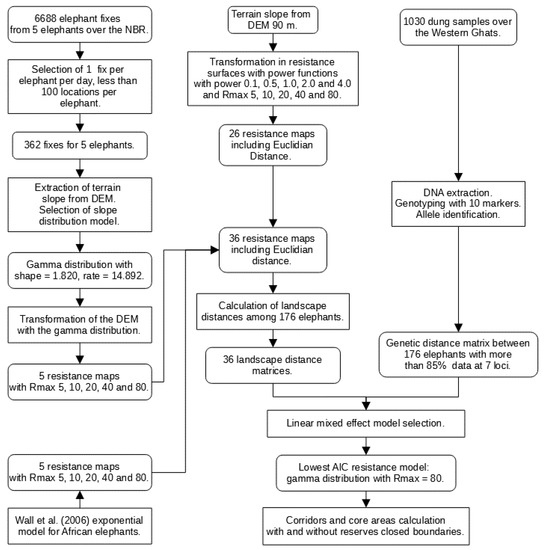
Figure 2.
Method flowchart with the main components: (i) production of 36 resistance maps, (ii) calculation of landscape distance matrices, (iii) calculation of the genetic distance matrix, and (iv) calculation of core areas and corridors [11].
Genetic connectivity relative to slope was described by modeling core areas and corridors from the best resistance raster over the NBR. The NBR provides an adequate scale for examining the shrinkage of core areas and the disruption of corridors with fencing. For both core areas and corridor maps, we assumed two opposite and extreme situations. The first set of simulations considered the NBR boundary to be entirely porous, and the second considered it completely closed. These conditions are extreme, as in reality, most reserves have locations with porous boundaries and others with closed boundaries. The two scenarios—entirely open or entirely closed PAs—can nevertheless address the question of whether enclosure affects the connectivity adjacent to the PA boundary.
We tested the null hypotheses that (i) elephant gene flow is associated with Euclidean distance instead of terrain slope and (ii) that gene flow within the NBR was not affected by the interplay between the closure of its boundaries and slopes.
2. Materials and Methods
2.1. Study Area and Sample Collection
The sampling was carried out at the administrative subdivision level (called “range”) in each PA to maximize the coverage of elephant distribution (Figure 1). The northern elephant population in the NBR (which includes the Nilgiri–Brahmagiri–Eastern Ghats range) numbers around 6000 and the southern range (including the Anamalais–Nelliampathy–High Range and Megamalai–Periyar–Agastyamalai), here termed ATR-KMTR (Anamalai Tiger Reserve and Kalakad Mundanthurai Tiger Reserve), harbors around 4500 elephants [20]. Fresh elephant dung samples were collected between 2014 and 2018 from 1030 locations. The geographic coordinates were noted, and the surface layer of the dung was scraped into 50 mL Tarson tubes with absolute ethanol. Samples were stored at −20 °C after transportation to the laboratory.
2.2. DNA Extraction and Analysis
DNA extraction and analysis follow Parida et al. [23]. DNA was extracted using a QIAamp DNA stool kit (Qiagen, Hilden, Germany). We originally used ten polymorphic di-nucleotide markers identified in the Asian elephant—EMU03, EMU04, EMU06, EMU10, EMU11, EMU12, EMU13, EMU14, EMU15, and EMU17 [24]. Uniplex PCRs were performed for a 15 µL reaction volume, containing 1.5 µL 10× Taq buffer (TaKaRa Extaq Hot Start version, TaKaRa, Shiga, Japan), 1.5 µL of dNTP, 1.5 µL of 10 mg bovine serum albumin (BSA), 0.5 pM of both forward and reverse primer, 0.75U of Taq polymerase (TaKaRa Extaq Hot Start version, TaKaRa, Shiga, Japan), 5.75 µL of nuclease-free water, and 3 µL of template DNA. PCR started with an initial denaturation at 95 °C for 10 min, followed by 45 cycles of denaturation at 95 °C for 45 s, annealing at 58 °C for 45 s, and extension at 72 °C for 45 s, followed by a final extension at 72 °C for 10 min. PCRs were carried out in triplicate for each locus. All reactions included positive and negative controls to account for contamination and PCR failure. Reaction success was checked electrophoretically in 2% agarose gel. PCR amplification was carried out in three replicates and then subjected in triplicate to capillary electrophoresis in an ABI 3730 Automated Genetic Analyser along with Genescan LIZ500 internal size standard to identify alleles, which were then analyzed with GENEMAPPER 5.0 (Thermofisher Scientific, Waltham, USA). Consensus genotypes for a homozygote consistent in three replicates and a heterozygote in two replications were taken, and data generated at ten loci were used for further analysis. Mismatches in two loci were accepted and were manually re-examined to rule out scoring or entry errors. Recaptures were detected with the identity analysis module in CERVUS 3.0.7 [25]. The error rates in individual genotyping, ADO (allelic dropout), FA (false alleles), and successful PCRs were estimated with GIMLET v.1.3.3 [26]. GIMLET was also used to construct a consensus multi-locus genotype from a set of PCRs and to calculate genotyping error rates comparing the repeated genotypes and their consensus.
The genotyped data showed the occurrence of missing data across the originally 399 genotyped individuals and ten microsatellite loci. The percentage of missing data varied across loci (between 16 and 46%) and individuals (between 10 and 40%). Missing genotypes and genotyping errors cause bias in the genetic diversity estimates and also impact the accuracy of population structure inference [27]. For studies with low-quality DNA, the most-used approach is to eliminate problematic individuals or loci. Therefore, samples missing data in three microsatellite loci with over 30% of genotype calls were discarded, resulting in a final panel of seven loci. Of the 399 total individuals, 223 were observed with more than 15% missing genotypes at all loci. These individuals were hence excluded from the analyses, resulting in a final panel of 176 individuals from the north (n = 136, NBR) and south (n = 40, ATR-KMTR) of the Palghat Gap. The Probability of Identity (PID and PIDsibs) was calculated in CERVUS 3.0.7 and the Hardy–Weinberg Equilibrium (HWE) was estimated for each locus. We found homozygosity excess; therefore, we searched for evidence of null alleles using FreeNA [28] and sought to infer the most probable technical cause of departures from HWE. The frequency of null alleles was also calculated for each locus with FreeNA [28], using the maximum likelihood estimation from Dempster et al. [29].
We calculated pairwise, individual-by-individual (NxN) genetic distance for elephant genotypes after obtaining the proportion of shared alleles with Adegenet [30] in R version 3.5.3 [31]. A PCA-based genetic distance matrix was generated by calculating principal components from allele usage in the population [32].
2.3. Population Structure
Population differentiation was estimated by total and pairwise Fst [33], Gst [34], and Djost [35] values between the two regions (north and south of the Palghat Gap) using the R package in diveRsity [36] based on a confidence interval of 95% by bootstrap resampling (n = 9999). The partition of genetic variation within and among populations was estimated through Analysis of Molecular Variance (AMOVA) [37] with Arlequin 3.11 [38]. We tested for isolation by distance (IBD) using the Mantel test for correlations between pairwise genetic and geographic distances among individuals with GenALEx 6.5.
2.4. Slope Distribution Models
Landscape variables such as slope can be transformed by mathematical functions to obtain resistance rasters [17]. It is also informative to transform landscape variables based on movement data when available, as the transformation is likely to provide a better correlation between the genetic distance and the landscape distance [39]. To do so, we used 6688 location records of five radio-collared elephants ranging over parts of the NBR (Figure 1) in order to predict elephant distributions relative to slope. We did not observe any long-distance displacement, and our database is likely to represent daily foraging movement. We randomly extracted a maximum of one record per day per elephant and selected no more than 100 records per elephant (Appendix A) to minimize spatial autocorrelation and avoid the over-representation of some elephants. This reduced the database (SatDB) to 362 records.
All SatDB fixes were superimposed on the Shuttle Radar Topography Mission (SRTM) digital elevation model (DEM) with a spatial resolution of 3 arc seconds (approximately 90 m) [40]. Slope angles in degrees were extracted for each fix and transformed to their tangent (slope) in GRASS GIS [41]. The collars used to locate elephants were GPS+VHF Collars (African Wildlife Tracking Company) with a spatial accuracy of 5 to 10 m. We used a GPS (Trimble Juno SB with 2 to 5 m accuracy) to georeference the dung pile locations. Overall, the total error on the relative locations of the sampling points over the DEM was in the range of 30 m. As slopes are autocorrelated and as elephants in general use moderate slopes, the risk of introducing a bias towards steeper slopes was low. We did not notice outliers.
Model selection was carried out with the package fitdistrplus [42]. The best distribution followed a gamma model (see Results). The function [1-(gamma cdf)] (“cdf” for cumulative distribution function) represented decreasing elephant density.
Radio-collaring elephants in India is infrequent because of the conservation status of the species. As our sample size was small, we also utilized a slope distribution model obtained from 54 African savanna elephants (Loxodonta africana) in a hilly area [11] (Appendix B), evaluated from a 30 m spatial resolution DEM. A Kolmogorov–Smirnov test indicated that we could not reject the hypothesis that the distributions obtained with a 30 m or 90 m spatial resolution were similar (D = 0.139, p = 0.28). The model’s cdf was adjusted to integrate to 1 to represent decreasing elephant density. The mass of the African savanna elephant is close to that of the Asian elephant, and we expect slope usage to be similar under comparable conditions.
2.5. Resistance Maps
We produced a series of candidate resistance maps (Figure 2) with the R package raster [43], transforming the slope into resistance values varying between 1 and a maximum of 5, 10, 20, 40, and 80 [17]. We observed that elephants used slopes below 0.857 (40.6 degrees). Slopes equal to 0.857 were considered to offer maximum resistance and were given a prohibitive resistance of 100,000 together with canals and pipelines. The gamma transformations were carried out according to Equation (1):
where R is resistance, Rmax is maximum resistance, and F is the cumulative distribution function of the empirical gamma distributions of elephant presence and slope varying between 0 and 0.857.
The power transformations followed Equation (2):
where p is the power of the transformation varying between p = 0.1, 0.5, 1.0, 2.0, and 4.0 [17], and other variables are defined as above in Equation (1). The power transformations change the shape of the function to explore non-linear relationships between landscape features and resistance to gene flow.
We also used the exponential model for the African savanna elephant [11] to produce resistance maps (Equation (3)):
Varying Rmax enables the optimization of the relative influence of variation in landscape features on resistance to gene flow [17,44]. Here, we did not compare multiple variables but a minimum resistance of 1 when Rmax = 5 has a different effect on the least-cost path slope resistance than a minimum resistance of 1 with Rmax = 80. The transformation scheme consequently helped explore this effect.
In total, 35 resistance maps (25 power transformations, 5 gamma transformations, and 5 exponential transformations) were produced. The least-cost path resistance matrix among the 176 genotyped elephants’ locations was calculated with the R package sGD [45]. We included a Euclidean distance matrix as an alternative model to obtain 36 distance matrices.
2.6. Model Optimization and Gene Flow
The 36 distance matrices were correlated with the genetic distance matrix by applying linear mixed-effect models [46] with the R package “ResistanceGA” [47]. Candidate models were compared based on their AIC scores. The northern and southern elephant populations were considered independently and provided the same best model (Appendix C).
We used an individual-based approach to predict core areas and expected movement corridors on the best resistance model in the NBR. We considered as sources and destinations a set of 1194 simulated elephants in a regular grid within the NBR only. This grid represented a homogeneous distribution of adult elephants in the NBR at an overall density of ca. 0.45 km2, the approximate elephant density of the NBR [20]. We used the UNICOR-resistant kernel [48] connectivity modeling option to detect core areas relative to slope, implemented with a 15,000 cost unit threshold. We applied the factorial least-cost path modeling method of UNICOR [49] to detect least-cost paths. The maximum cost unit threshold of 15,000 represented corridors outside the NBR that would not extend beyond areas where elephants had been observed in the recent past [21].
For both kernel and corridor maps, we assumed two opposite and extreme relationships between elephant movement and the boundary of the protected area. The first set of simulations considered the NBR boundary to be completely open. The second set of simulations made the NBR boundary impassable in order to represent the reserve as if it were self-contained.
3. Results
After excluding three microsatellite loci (EMU06, EMU13, and EMU15) and 223 individuals (55%) from the original dataset of 399 genotyped individuals, 176 elephants with more than 85% genotypes were used to estimate connectivity among elephant populations in the north and south of the Palghat Gap in the Western Ghats using occurrence and population genetics analyses. The PID and PID sib values for seven loci were 1.7 × 10⁻⁷ and 2.1 × 10⁻³, respectively, indicating that seven-loci genotypes were sufficient to identify unrelated individuals as well as siblings in the population. Null allele frequency across polymorphic loci was below 12% both north and south of the Palghat elephant populations. A low level of genotyping error was observed across the seven loci and most loci showed high amplification success, ranging between 89 and 97%. The mean allelic dropout (ADO) rate across loci was 0.06% and the false allele (FA) rate was 0.03%. All seven microsatellites were polymorphic with between four and 14 alleles per locus.
A moderate level of genetic differentiation (pairwise Fst = 0.08; Gst = 0.04, and Djost = 0.12) was observed between the two populations in the north and south of the Palghat Gap, suggesting limited gene flow between populations. Pairwise values of Gst and Djost, which correct the dependency of Fst on the amount of within-population variation, were also moderate and statistically significant (α = 0.05) based on 9999 bootstrap resamplings. Moreover, the global Fst and the Fst values for each locus were similar when calculated with and without estimating a null allele correction (Fst ENA = 0.077, Fst = 0.08). This shows that the presence of null alleles has not affected our calculations of genetic differentiation. AMOVA analyses revealed that 8% of the total variation was found among populations, while the rest (92%) was within populations (p < 0.001). The Mantel test of IBD was not significant (p values > 0.05) and yielded a very low correlation coefficient (rXY ≤ 0.04).
We evaluated seven candidate distribution models with the SatDB to describe the distributions of elephants relative to slope. The best distribution model was the gamma distribution (Table 1). The empirical SatDB distribution was close to its theoretical distribution (Kolmogorov–Smirnov statistic = 0.087). The estimated parameters of the gamma distributions were used to produce resistance layers. The gamma model and the exponential model (obtained for the African savanna elephant) were close to each other with the same average of 0.12 (6.8 deg) at this level of precision.

Table 1.
Parameters of the gamma distribution obtained from the SatDB elephant locations.
Gamma, power, the exponential transformations of slopes with varying Rmax, and the Euclidean distance among elephants provided 36 landscape least-cost distance matrices (Table 2) among 176 elephants. The SatDB gamma-transformed slope had the lowest AIC at Rmax = 80 and was consequently the best model to explain gene flow in the studied landscape. It was valid over the entire WG, in the northern and the southern populations (Appendix C). The exponential distribution (Rmax = 80) was the next best model after two gamma-transformed models (with Rmax = 40 and 20) and the power model with Rmax = 80 and p = 1.0. The Euclidean distance had the second lowest support among the studied models.
Table 2.
Correlation between least-cost path landscape distance with genetic distance measured by the AIC. The resistance raster models are indicated with the transformation, maximum resistance, and power applied to the slope.
Using the best resistance model, we estimated that in approximately 28% of the NBR, the probability of the presence of elephants was below 0.05. The topographically inaccessible areas occur mostly in the southern and northeastern parts of the reserve. Most reserves in the Western Ghats seem to be in sub-optimal habitats as far as slope is concerned (Figure 3).
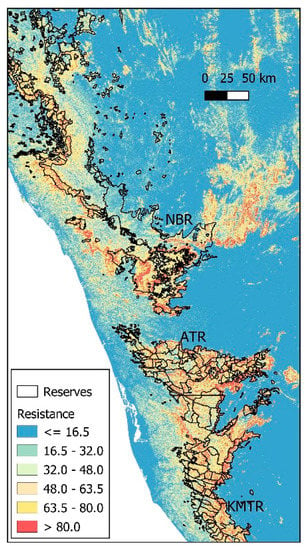
Figure 3.
Representation of elephant gene flow resistance over the Western Ghats of India relative to slope (see text for detail). Gene flow resistance would be very high beyond the reserve limits if other factors such as land use had been taken into consideration. Reserve boundaries were obtained from the India Biodiversity Portal (https://indiabiodiversity.org/ accessed on 23 March 2020).
Core areas relative to slope were often found outside of the PA boundaries (Figure 4a). When the boundary was made impassable, the core areas were split (Figure 4b (i, iii)), populations isolated (Figure 4b (ii, iv)), and connectivity disrupted around the NBR (Figure 4b (v)). Corridors tended to occur outside the NBR whenever the reserve boundary had a U shape (Figure 5a,c), except when a river formed the boundary (Figure 5a, southern part). When the boundary was made impassable, corridors still existed, and connectivity was preserved wherever the terrain was flat (Figure 5b). However, enclosing the reserve removed corridors that circled mountain outcrops, and some corridors within the NBR also disappeared (compare Figure 5c,d).
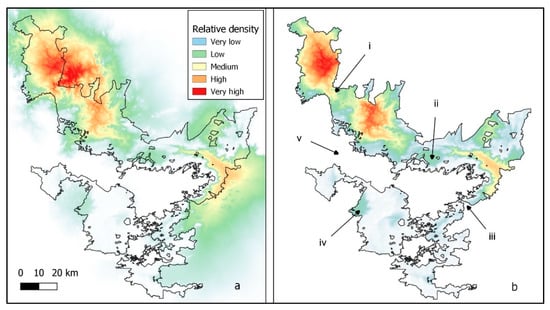
Figure 4.
Elephant population core areas relative to slope with boundary completely open to elephant movement (a). Elephant population core areas relative to slope with boundary completely closed to elephant movement (b) with (i) and (iii) split core areas, (ii) and (iv) isolated populations, and (v) the severance of a major connection outside the NBR. Reserve boundaries were obtained from the India Biodiversity Portal (https://indiabiodiversity.org/ accessed on 23 March 2020).

Figure 5.
Elephant corridors in the Nilgiri Biosphere Reserve with boundaries open to movement (a,c) and with boundaries closed to movement (b,d). Water bodies (in blue), including an artificial lake, were not considered to oppose resistance to movement.
4. Discussion
Protected areas are increasingly isolated due to land-use changes in the surrounding matrix [50,51], with negative outcomes for the genetic makeup of species [52]. Isolation also increases the edge effect [53], plant invasion [54], and exposure to degradation [55]. Moreover, the transition between ecosystems and human-dominated areas is often abrupt due to activities and people who are intolerant of wandering wildlife. To avoid problems, managers often choose to enclose PAs [56], which can further affect population connectivity, as suggested by the present study.
Genetic distance among individuals can be used to measure gene flow over the landscape and help test whether fencing PAs can by itself fragment populations of particular species. We chose to collect noninvasive elephant DNA samples, but genetic material from scats may generate missing genotypes and errors associated with the amplification of minute quantities of DNA, which may impact downstream analyses [27,57]. Despite stringent control measures for allele scoring, our replicate genotypes revealed missing and null alleles.
Three independent series of PCRs helped decrease the probability of genotyping errors in the consensus individual genotypes. To obtain reliable estimates of genetic variation and population subdivision (pairwise Fst), we kept the missing data below a frequency of 0.3 and thus excluded three loci and a substantial number of individuals (~55%) from the final data set, as in Parida et al. [23].
The two populations north and south of the Palghat Gap in the Western Ghats showed moderate genetic differentiation (Fst (0.08), Gst (0.04), and Djost (0.12)), suggesting that some restriction in gene flow occurred between these populations. These results agree with De et al. [22], who found similar values (Fst = 0.07 and Djost = 0.10) along the Western Ghats using 14 microsatellites. However, these values are smaller when compared to those observed in elephant populations across India (e.g., [22,58]).
In order to compare genetic distance and landscape distance, resistance rasters had to be created as competing hypotheses. These resistance maps were slope transformation rasters over most of the WG. In particular, it was important to establish a slope occupancy model for the Asian elephant, as statistical models derived from empirical movement data may correlate better with genetic distance than power transformations [39]. The occupancy model was obtained from the location records of five elephants ranging over parts of the NBR. The database was considerably reduced for statistical reliability by avoiding autocorrelation and the over-representation of some elephants. The best slope occupancy distribution model was a gamma probability density function (Table 1). Since the model was obtained with a small sample size, we compared it to that obtained from the African savanna elephant [11]. The distribution models were close to each other; the exponential model from Wall et al. [11] had the same average slope (or tangent) of 0.12 (or 6.8 degrees) as the gamma model at this level of precision.
In total, 36 resistance rasters were produced from (i) a slope occupancy model for the Asian elephant, (ii) the power transformation of slopes, and (iii) a slope occupancy model for the African savanna elephant. The genetic distance matrix among 176 individuals was correlated to the 36 landscape distance matrices obtained from the resistance rasters. The highest correlation (lowest AIC) between genetic distance and landscape distance was obtained with the terrain slope transformed with the empirical gamma distribution with resistance varying between 1 and 80 (Table 2). This model performed better than the exponential distribution or any other power transformation. Among the transformation models evaluated, it best represented resistance to gene flow at the landscape level (Figure 3). This confirms that the occupancy model for the elephant is robust despite the small sample size from which it was derived. It is to be noted that the slope alone, again expressed in tangent, with no power transformation (power = 1.0) and with Rmax = 80 (Table 2), provides a simple but satisfactory resistance model.
Gene flow among populations is usually measured by pairwise FST values. Instead, we used here individual-based genetic distances for all alleles in the population. This genetic distance matrix was then correlated with landscape distance matrices. The best correlation between genetic and landscape distances provided the resistance map that was also the best possible depiction of resistance to gene flow over the landscape (Figure 3). Since the correlation was much better than for Euclidean distance, it can be concluded that gene flow is partially controlled by terrain slope, as expected from the energetics of movement for heavier animals [59].
From Figure 3, it seems that most reserves in the WG were established on rough terrain probably less suitable for agriculture. Therefore, gene flow is constrained over most of the remaining elephant range. The NBR contains near-optimal habitats in the northern reserves (Nagar Hole, Bandipur, and Mudumalai Tiger Reserves), and field surveys provide the highest elephant density in these areas [20]. According to the best resistance model, approximately 28% of the NBR’s extent (5670 km2) has terrain with a probability of elephant presence below 5%. These topographically inaccessible areas occur mostly in the southern and northeastern parts of the reserve. Elephant censuses rely on the block count method [60] with extrapolation from surveyed blocks to other blocks. As census data do not seem to be available to the public, it is impossible to verify the impact of terrain on density estimates. There is a risk of overestimating the elephant population by a failure to adjust for topographical accessibility and censuses conducted to date should be evaluated for potential bias leading to overestimating population density.
To assess NBR elephant core areas and movement corridors in relation to topographical slope, we used UNICOR [49]. We adopted simplified assumptions considering that (i) slope was the only variable affecting elephant movements; (ii) the matrix outside the protected area network was similar to the elephant habitat, except that elephants were originating only from within the NBR; and (iii) to simulate the closure of the NBR, the matrix was completely closed to elephant movement. These assumptions are obvious simplifications: the terrain slope is one among many variables interfering with elephant movement; the matrix outside elephant habitats differs from the habitat within, and enclosures rarely seal entire reserves.
With these models, we observed that a considerable amount of connectivity exists outside the NBR (Figure 4a). In particular, two major core areas, one in the northwest and the other in the east of the NBR, extend beyond the reserve: this land is relatively flat and is a natural range for dispersal. Of course, the core areas beyond the NBR boundary are now utilized for agriculture but would otherwise attract elephants due to their relatively flat terrain. The Palghat Gap, the major interruption of the WG, is relatively flat and consequently easily negotiable by elephants. Even though it could be considered a major barrier for animals with little vagility or even for elephants [61], it seems to be an obstacle to elephants only because of land transformation to agriculture and settlements. This hypothesis is in agreement with the likelihood of recent historical connectivity [22]. In the south of the NBR particularly, the reserve boundary tends to follow contour lines that mark the difference between steep and flat land (following the maxima of the second derivative of elevation) suitable for agriculture (Figure 1). Therefore, whenever the reserve boundary is digitated, i.e., forms finger-like protrusions into the matrix, the land within the protrusions that lie outside the reserve has high connectivity and contains least-cost passages (Figure 5a,c). Remarkably, boundaries that are established along rivers (southwestern part of Figure 5a) do not have external corridors because the least-cost paths follow rivers.
When the reserve is totally barricaded (Figure 4b), connectivity reduces (Figure 4b (i)) or breaks off (Figure 4b (iii,v)). Core areas become more compact and isolated (Figure 4b (i,ii,iv)). Corridors still exist on flat terrain within the reserve (Figure 5b) but can be interrupted by hilly habitats within the reserve (Figure 4d).
The proximate causes of animal dispersal are many, including food availability, search strategies, or patch isolation [62]. Elephants are wide-ranging animals, possibly in response to habitat productivity [63], among other things. It has been proposed that the search for food is a major reason for elephants venturing out of their protected areas [64]. We show in this study that this might be more nuanced. Elephants are highly mobile and the difficulties in negotiating steep terrain might bring them near villages that occupy valleys. This by itself might be a cause of incidents with humans.
5. Conclusions
Over millennia, elephants ranged from India and Southeast Asia to China, but due to anthropic pressures, they have been progressively restricted to mountain chains where they now exist as remnant populations [65]. We show that terrain slope partly controls gene flow for the Asian elephant. The sensitivity of this animal to slope raises the question of whether mountainous habitats, where most elephant reserves are found today, are best-suited as PAs. On islands, elephants tend to get smaller as an adaptation to the restricted area [66], but the effect of steep terrain on the elephant’s evolution is unknown. With this uncertainty, reserves on relatively flat terrain should be strictly preserved, as they may be more suitable for this animal.
The study also suggests that some incidents with humans may have their origin in the design of reserves relative to slope. Villages often occupy valleys and lie in areas that are easier for elephants to negotiate. Villages in narrow valleys probably need specially designed protection measures that would also maintain elephant population connectivity.
Lastly, we demonstrated that closing reserves without taking into consideration the boundary position relative to slopes can have negative impacts on gene flow within reserves. With the increasing human domination of landscapes, managers often prefer enclosing elephant reserves to any other wildlife-friendly solution such as maintaining corridors [67], buffering with appropriate crops [68], or more generally adopting biodiversity-based land management [69]. The minimum requirement before fencing, however, is to verify that elephants have sufficient buffer space between the slope of a mountain and the fences in order to maintain the possibility of moving from one valley to another.
Author Contributions
Conceptualization, P.D., S.A.C., P.A.R. and J.-P.P.; methodology, J.-P.P., S.A.C., P.A.R., R.S. and P.D.; software, J.-P.P., S.A.C., P.A.R., T.K. and R.S.; validation, P.D., S.A.C., R.S., R.D. and S.P.G.; formal analysis, J.-P.P., P.D. and R.S.; investigation, P.A.R., D.B. and N.M.; resources, K.M.S., S.A., A.R., S.U., A.L., M.U.I.N., B.M.K. and K.R.; data curation, J.-P.P., P.A.R., T.K. and D.B.; writing—original draft preparation, J.-P.P., P.D. and R.S.; writing—review and editing, J.-P.P., P.D., R.S., S.P.G. and S.A.C.; visualization, J.-P.P.; supervision, P.D., N.A. and S.P.G.; project administration, P.D. and N.A.; funding acquisition, P.D. and N.A. All authors have read and agreed to the published version of the manuscript.
Funding
The study was funded in 2015 by grants from the United States Fish and Wildlife Service (FWS F12AP01186_1G016) and the International Elephant Foundation. There was no provision for APC charges.
Institutional Review Board Statement
Not applicable.
Informed Consent Statement
Not applicable.
Data Availability Statement
Not applicable.
Acknowledgments
We dedicate this paper to the memory of Ajay Desai. Permits for research and elephant dung collection were generously approved by the Forest Departments of Tamil Nadu, Karnataka, and Kerala. Dipankar Ghose, Director Species and Landscapes division of WWF-India facilitated this research. We thank WWF-India and Sejal Worah for their support. Jyotirmayee Parida helped with some laboratory analyses. We used a map of the world provided by Bjorn Sandvik (thematicmapping.org accessed on 23 March 2020). We thank the reviewers for the comments on the earlier version of the manuscript.
Conflicts of Interest
The authors declare no conflict of interest.
Appendix A
In order to predict elephant distributions relative to slope we used 6688 location records of elephants ranging over parts of the Nilgiri Biosphere Reserve (Figure 1). The locations were obtained from the satellite telemetry of four bulls and one cow over a period of nine years (2010–2019). The number of radio-collared elephants in India is low because there is a reluctance to undertake a procedure that can be dangerous for an endangered species. The temporal sampling interval varied among elephants from one record every two days to approximately one record per hour (Table A1). Slope records were strongly spatially autocorrelated (Moran I = 0.3952, expected = −0.0003, sd = 0.0019, p << 0.001), and the number of records per elephant varied between 86 and 2695. In order to reduce spatial autocorrelation and avoid the over-representation of some elephants, we randomly (i) extracted a maximum of one record per day per elephant, and (ii) selected no more than 100 records per elephant. This reduced the database (SatDB) to 362 records.
Table A1.
Comparison of resistance model correlation with genetic distance.
Table A1.
Comparison of resistance model correlation with genetic distance.
| Elephant | Start Date | End Date | Number of Records | Number of Days | Records per Day | Same Locations |
|---|---|---|---|---|---|---|
| Sat4 | 03/01/13 | 08/22/16 | 1752 | 1270 | 1.4 | 9 |
| Sat2 | 05/23/13 | 12/14/13 | 2695 | 205 | 13.1 | 14 |
| 69c5 | 06/07/10 | 11/22/10 | 105 | 168 | 0.6 | 2 |
| 59b6 | 10/24/10 | 11/16/10 | 86 | 23 | 3.7 | 4 |
| mdm | 12/19/18 | 04/04/19 | 2089 | 106 | 19.7 | 10 |
Appendix B
A total of 54 African savanna elephants were radio-collared [11]. The number of “fixes” relative to the terrain slope were grouped in one-degree bins. From the scatter plot ([11] supplement) we extracted the gradient and elephant fix density with WebPlotDigitizer (https://automeris.io/WebPlotDigitizer/ accessed on 15 February 2020). The center value of each bin was 0.5, 1.5, …, 29.5 degrees, which allowed the examination of the error made in extracting values. The maximum deviation was 0.0385 (less than 5% of a degree) and the standard deviation of error was 3.22 × 10⁻⁴ degrees. We considered that the error obtained by extracting data from the figure was negligible. We fitted a linear model over the gradient and log-transformed density. One data point with zero density appeared to be an outlier and was eliminated. The linear model was highly significant (R2 = 0.81, n = 29, p <<< 0.001) with parameters: log(density) = −5.774.gradient + 4.47.
Appendix C
Table A2.
Correlation between least-cost path landscape distance with genetic distance measured by the AIC. The resistance raster models are indicated with the transformation, maximum resistance, and power applied to the slope.
Table A2.
Correlation between least-cost path landscape distance with genetic distance measured by the AIC. The resistance raster models are indicated with the transformation, maximum resistance, and power applied to the slope.
| Northern Population | Southern Population | ||||||
|---|---|---|---|---|---|---|---|
| Transformation | Rmax | Power | AIC | Transformation | Rmax | Power | AIC |
| Gamma | 80 | - | 26,569 | Gamma | 80 | - | 2714 |
| Gamma | 40 | - | 26,592 | Gamma | 40 | - | 2731 |
| Power | 80 | 1.0 | 26,618 | Gamma | 20 | - | 2749 |
| Gamma | 20 | 2.0 | 26,622 | Exponential | 80 | - | 2752 |
| Power | 40 | 1.0 | 26,640 | Power | 80 | 1.0 | 2756 |
| Power | 80 | 2.0 | 26,643 | Exponential | 40 | - | 2758 |
| Exponential | 80 | - | 26,645 | Gamma | 10 | - | 2764 |
| Exponential | 40 | - | 26,653 | Power | 40 | 1.0 | 2765 |
| Gamma | 10 | - | 26,654 | Exponential | 20 | - | 2766 |
| Exponential | 20 | - | 26,665 | Power | 80 | 2.0 | 2768 |
| Power | 20 | 1.0 | 26,669 | Exponential | 10 | 1.0 | 2774 |
| Power | 40 | 2.0 | 26,684 | Power | 20 | 1.0 | 2775 |
| Exponential | 10 | - | 26,684 | Power | 80 | 0.5 | 2777 |
| Gamma | 5 | - | 26,695 | Gamma | 5 | 0.5 | 2777 |
| Power | 80 | 0.5 | 26,695 | Power | 40 | 0.5 | 2778 |
| Power | 40 | 0.5 | 26,699 | Power | 40 | 2.0 | 2780 |
| Power | 10 | 1.0 | 26,706 | Power | 20 | 0.5 | 2781 |
| Power | 20 | 0.5 | 26,706 | Exponential | 5 | - | 2783 |
| Power | 20 | 2.0 | 26,714 | Power | 10 | 1.0 | 2784 |
| Exponential | 5 | - | 26,715 | Power | 10 | 0.5 | 2785 |
| Power | 10 | 0.5 | 26,717 | Power | 20 | 2.0 | 2787 |
| Power | 5 | 0.5 | 26,736 | Power | 5 | 1.0 | 2790 |
| Power | 5 | 1.0 | 26,738 | Power | 5 | 0.5 | 2790 |
| Power | 10 | 2.0 | 26,741 | Power | 10 | 2.0 | 2791 |
| Power | 80 | 4.0 | 26,745 | Power | 80 | 4.0 | 2791 |
| Power | 80 | 0.1 | 26,751 | Power | 5 | 2.0 | 2793 |
| Power | 40 | 0.1 | 26,751 | Power | 40 | 4.0 | 2793 |
| Power | 20 | 0.1 | 26,752 | Power | 20 | 4.0 | 2795 |
| Power | 10 | 0.1 | 26,754 | Power | 10 | 4.0 | 2796 |
| Power | 40 | 4.0 | 26,757 | Power | 5 | 4.0 | 2797 |
| Power | 5 | 0.1 | 26,758 | Euclidean | - | - | 2798 |
| Power | 5 | 2.0 | 26,760 | Power | 5 | 0.1 | 2801 |
| Power | 20 | 4.0 | 26,765 | Power | 10 | 0.1 | 2803 |
| Power | 10 | 4.0 | 26,774 | Power | 20 | 0.1 | 2803 |
| Euclidean | - | - | 26,781 | Power | 40 | 0.1 | 2804 |
| Power | 5 | 4.0 | 26,782 | Power | 80 | 0.1 | 2804 |
References
- West, P.; Igoe, J.; Brockington, D. Parks and peoples: The social impact of protected areas. Annu. Rev. Anthropol. 2006, 35, 251–277. [Google Scholar] [CrossRef]
- Wittemyer, G.; Elsen, P.; Bean, W.T.; Burton, A.C.O.; Brashares, J.S. Accelerated human population growth at protected area edges. Science 2008, 321, 123–126. [Google Scholar] [CrossRef] [PubMed]
- Jones, K.R.; Venter, O.; Fuller, R.A.; Allan, J.R.; Maxwell, S.L.; Negret, P.J.; Watson, J.E.M. One-third of global protected land is under intense human pressure. Science 2018, 360, 788–791. [Google Scholar] [CrossRef] [PubMed]
- Watson, J.E.M.; Shanahan, D.F.; Di Marco, M.; Allan, J.; Laurance, W.F.; Sanderson, E.W.; Mackey, B.; Venter, O. Catastrophic declines in wilderness areas undermine global environment targets. Curr. Biol. 2016, 26, 2929–2934. [Google Scholar] [CrossRef]
- Shaffer, L.J.; Khadka, K.K.; Van Den Hoek, J.; Naithani, K.J. Human-elephant conflict: A review of current management strategies and future directions. Front. Ecol. Evol. 2019, 6, 235. [Google Scholar] [CrossRef]
- Fernando, P.; Ekanayaka, S.K.K.; Pastorini, J. The elephant at the fence: Almsman, panhandler, friend or foe? Eur. J. Wildl. Res. 2020, 66, 97. [Google Scholar] [CrossRef]
- Kalam, T.; Puttaveeraswamy, T.A.; Srivastava, R.K.; Puyravaud, J.-P.; Davidar, P. Spatial aggregation and specificity of incidents with wildlife make tea plantations in southern India potential buffers with protected areas. J. Threat. Taxa 2020, 12, 16478–16493. [Google Scholar] [CrossRef]
- Wilkinson, C.E.; McInturff, A.; Kelly, M.; Brashares, J.S. Quantifying wildlife responses to conservation fencing in East Africa. Biol. Conserv. 2021, 256, 109071. [Google Scholar] [CrossRef]
- Olivier, R. Distribution and status of the Asian elephant. Oryx 1978, 14, 379–424. [Google Scholar] [CrossRef]
- Feng, L.; Zhang, L. Habitat selection by Asian elephant (Elephas maximus) in Xishuangbanna, Yunnan, China. Acta Theriol. Sin. 2005, 25, 229–236. [Google Scholar]
- Wall, J.; Douglas-Hamilton, I.; Vollrath, F. Elephants avoid costly mountaineering. Curr. Biol. 2006, 16, R527–R529. [Google Scholar] [CrossRef]
- Speakman, J.R.; Król, E. Maximal heat dissipation capacity and hyperthermia risk: Neglected key factors in the ecology of endotherms. J. Anim. Ecol. 2010, 79, 726–746. [Google Scholar] [CrossRef] [PubMed]
- Schmidt-Nielsen, K. Scaling: Why Is Animal Size So Important? Cambridge University Press: Cambridge, UK; New York, NY, USA, 1984; ISBN 978-0-521-26657-4. [Google Scholar]
- Wheatley, R.; Buettel, J.C.; Brook, B.W.; Johnson, C.N.; Wilson, R.P. Accidents alter animal fitness landscapes. Ecol. Lett. 2021, 24, 920–934. [Google Scholar] [CrossRef] [PubMed]
- Balkenhol, N.; Cushman, S.A.; Storfer, A.T.; Waits, L.P. (Eds.) Landscape Genetics; John Wiley & Sons, Ltd.: Chichester, UK, 2015; ISBN 978-1-118-52525-8. [Google Scholar]
- Peterson, E.E.; Hanks, E.M.; Hooten, M.B.; Ver Hoef, J.M.; Fortin, M.-J. Spatially structured statistical network models for landscape genetics. Ecol. Monogr. 2019, 89, e01355. [Google Scholar] [CrossRef]
- Shirk, A.J.; Wallin, D.O.; Cushman, S.A.; Rice, C.G.; Warheit, K.I. Inferring landscape effects on gene flow: A new model selection framework. Mol. Ecol. 2010, 19, 3603–3619. [Google Scholar] [CrossRef]
- Ruiz-González, A.; Gurrutxaga, M.; Cushman, S.A.; Madeira, M.J.; Randi, E.; Gómez-Moliner, B.J. Landscape genetics for the empirical assessment of resistance surfaces: The European pine marten (Martes martes) as a target-species of a regional ecological network. PLoS ONE 2014, 9, e110552. [Google Scholar] [CrossRef]
- Myers, N.; Mittermeier, R.; Mittermeier, C.; da Fonseca, G.; Kent, J. Biodiversity hotspots for conservation priorities. Nature 2000, 403, 853–858. [Google Scholar] [CrossRef]
- Baskaran, N. An overview of Asian elephants in the Western Ghats, southern India: Implications for the conservation of Western Ghats ecology. J. Threat. Taxa 2013, 5, 4854–4870. [Google Scholar] [CrossRef]
- Gubbi, S.; Swaminath, M.H.; Poornesha, H.C.; Bhat, R.; Raghunath, R. An elephantine challenge: Human–elephant conflict distribution in the largest Asian elephant population, southern India. Biodivers. Conserv. 2014, 23, 633–647. [Google Scholar] [CrossRef]
- De, R.; Sharma, R.; Davidar, P.; Arumugam, N.; Sedhupathy, A.; Puyravaud, J.-P.; Selvan, K.M.; Rahim, P.P.A.; Udayraj, S.; Parida, J.; et al. Pan-India population genetics signifies the importance of habitat connectivity for wild Asian elephant conservation. Glob. Ecol. Conserv. 2021, 32, e01888. [Google Scholar] [CrossRef]
- Parida, J.; Sharma, R.; De, R.; Kalam, T.; Sedhupathy, A.; Digal, D.K.; Reddy, P.A.; Goyal, S.P.; Puyravaud, J.-P.; Davidar, P. Genetic characterisation of fragmented Asian elephant populations with one recent extinction in its eastern-central Indian range. Ecol. Genet. Genom. 2022, 24, 100132. [Google Scholar] [CrossRef]
- Kongrit, C.; Siripunkaw, C.; Brockelman, W.Y.; Akkarapatumwong, V.; Wright, T.F.; Eggert, L.S. Isolation and Characterization of Dinucleotide Microsatellite Loci in the Asian Elephant (Elephas Maximus). Mol. Ecol. Resour. 2008, 8, 175–177. [Google Scholar] [CrossRef] [PubMed]
- Kalinowski, S.T.; Taper, M.L.; Marshall, T.C. Revising how the computer program Cervus accommodates genotyping error increases success in paternity assignment: Cervus likelihood model. Mol. Ecol. 2007, 16, 1099–1106. [Google Scholar] [CrossRef] [PubMed]
- Valière, N. Gimlet: A computer program for analysing genetic individual identification data: Program note. Mol. Ecol. Notes 2002, 2, 377–379. [Google Scholar] [CrossRef]
- Pompanon, F.; Bonin, A.; Bellemain, E.; Taberlet, P. Genotyping errors: Causes, consequences and solutions. Nat. Rev. Genet. 2005, 6, 847–859. [Google Scholar] [CrossRef]
- Chapuis, M.-P.; Estoup, A. Microsatellite null alleles and estimation of population differentiation. Mol. Biol. Evol. 2007, 24, 621–631. [Google Scholar] [CrossRef]
- Dempster, A.P.; Laird, N.M.; Rubin, D.B. Maximum likelihood from incomplete data via the EM algorithm. J. R. Stat. Soc. Ser. B Methodol. 1977, 39, 1–22. [Google Scholar] [CrossRef]
- Jombart, T. Adegenet: A R package for the multivariate analysis of genetic markers. Bioinformatics 2008, 24, 1403–1405. [Google Scholar] [CrossRef]
- R Core Team. R: A Language and Environment for Statistical Computing, R version 4.0.0 (24-04-2020); R Core Team: Vienna, Austria, 2020. [Google Scholar]
- Shirk, A.J.; Landguth, E.L.; Cushman, S.A. A comparison of individual-based genetic distance metrics for landscape genetics. Mol. Ecol. Resour. 2017, 17, 1308–1317. [Google Scholar] [CrossRef]
- Weir, B.S.; Cockerham, C.C. Estimating F-statistics for the analysis of population structure. Evolution 1984, 38, 1358–1370. [Google Scholar] [CrossRef]
- Nei, M. Genetic distances between populations. Am. Nat. 1972, 106, 283–292. [Google Scholar] [CrossRef]
- Jost, L. GST and its relatives do not measure differentiation. Mol. Ecol. 2008, 17, 4015–4026. [Google Scholar] [CrossRef] [PubMed]
- Keenan, K.; McGinnity, P.; Cross, T.F.; Crozier, W.W.; Prodöhl, P.A. DiveRsity: An R package for the estimation and exploration of population genetics parameters and their associated errors. Methods Ecol. Evol. 2013, 4, 782–788. [Google Scholar] [CrossRef]
- Excoffier, L.; Smouse, P.E.; Quattro, J.M. Analysis of molecular variance inferred from metric distances among DNA haplotypes: Application to human mitochondrial DNA restriction data. Genetics 1992, 131, 479–491. [Google Scholar] [CrossRef]
- Excoffier, L.; Laval, G.; Schneider, S. Arlequin (Version 3.0): An integrated software package for population genetics data analysis. Evol. Bioinform. Online 2005, 1, 47–50. [Google Scholar] [CrossRef]
- Cushman, S.A.; Lewis, J.S. Movement behavior explains genetic differentiation in American black bears. Landsc. Ecol. 2010, 25, 1613–1625. [Google Scholar] [CrossRef]
- Reuter, H.I.; Nelson, A.; Jarvis, A. An evaluation of void filling interpolation methods for SRTM data. Int. J. Geogr. Inf. Sci. 2007, 21, 983–1008. [Google Scholar] [CrossRef]
- GRASS Development Team. Geographic Resources Analysis Support System (GRASS) Software; Version 7.8.2; Open Source Geospatial Foundation: Beaverton, OR, USA, 2020. [Google Scholar]
- Delignette-Muller, M.-L.; Dutang, C. Fitdistrplus: An R package for fitting distributions. J. Stat. Softw. 2015, 64, 1–34. [Google Scholar] [CrossRef]
- Hijmans, R.J. Raster: Geographic Data Analysis and Modeling, R package version 3.3-13; CRAN: Vienna, Austria, 2020. [Google Scholar]
- Castillo, J.A.; Epps, C.W.; Davis, A.R.; Cushman, S.A. Landscape effects on gene flow for a climate-sensitive montane species, the American Pika. Mol. Ecol. 2014, 23, 843–856. [Google Scholar] [CrossRef]
- Shirk, A.J.; Landguth, E.L.; Cushman, S.A. A comparison of regression methods for model selection in individual-based landscape genetic analysis. Mol. Ecol. Resour. 2018, 18, 55–67. [Google Scholar] [CrossRef]
- Shirk, A.J.; Cushman, S.A. sGD: Software for estimating spatially explicit indices of genetic diversity. Mol. Ecol. Resour. 2011, 11, 922–934. [Google Scholar] [CrossRef] [PubMed]
- Peterman, W.E. ResistanceGA: An R package for the optimization of resistance surfaces using genetic algorithms. Methods Ecol. Evol. 2018, 9, 1638–1647. [Google Scholar] [CrossRef]
- Compton, B.W.; McGarigal, K.; Cushman, S.A.; Gamble, L.R. A resistant-kernel model of connectivity for amphibians that breed in vernal pools. Conserv. Biol. 2007, 21, 788–799. [Google Scholar] [CrossRef] [PubMed]
- Landguth, E.L.; Hand, B.K.; Glassy, J.; Cushman, S.A.; Sawaya, M.A. UNICOR: A species connectivity and corridor network simulator. Ecography 2012, 35, 9–14. [Google Scholar] [CrossRef]
- DeFries, R.; Hansen, A.; Newton, A.C.; Hansen, M.C. Increasing isolation of protected areas in tropical forests over the past twenty years. Ecol. Appl. 2005, 15, 19–26. [Google Scholar] [CrossRef]
- Saura, S.; Bertzky, B.; Bastin, L.; Battistella, L.; Mandrici, A.; Dubois, G. Global trends in protected area connectivity from 2010 to 2018. Biol. Conserv. 2019, 238, 108183. [Google Scholar] [CrossRef]
- Frankham, R.; Ballou, J.D.; Briscoe, D.A. Introduction to Conservation Genetics, 2nd ed.; Cambridge University Press: Cambridge, UK; New York, NY, USA, 2010; ISBN 978-0-521-87847-0. [Google Scholar]
- Woodroffe, R.; Ginsberg, J.R. Edge Effects and the extinction of populations inside protected areas. Science 1998, 280, 2126–2128. [Google Scholar] [CrossRef]
- Pauchard, A.; Alaback, P.B. Influence of elevation, land use, and landscape context on patterns of alien plant invasions along roadsides in protected areas of South-Central Chile. Conserv. Biol. 2004, 18, 238–248. [Google Scholar] [CrossRef]
- Burivalova, Z.; Butler, R.A.; Wilcove, D.S. Analyzing Google Search data to debunk myths about the public’s interest in conservation. Front. Ecol. Environ. 2018, 16, 509–514. [Google Scholar] [CrossRef]
- Cushman, S.A.; Elliot, N.B.; Macdonald, D.W.; Loveridge, A.J. A multi-scale assessment of population connectivity in African lions (Panthera leo) in response to landscape change. Landsc. Ecol. 2016, 31, 1337–1353. [Google Scholar] [CrossRef]
- Broquet, T.; Petit, E. Quantifying genotyping errors in noninvasive population genetics. Mol. Ecol. 2004, 13, 3601–3608. [Google Scholar] [CrossRef] [PubMed]
- Vidya, T.N.C.; Fernando, P.; Melnick, D.J.; Sukumar, R. Population genetic structure and conservation of Asian elephants (Elephas maximus) across India. Anim. Conserv. 2005, 8, 377–388. [Google Scholar] [CrossRef]
- Halsey, L.G.; White, C.R. A different angle: Comparative analyses of whole-animal transport costs when running uphill. J. Exp. Biol. 2017, 220, 161–166. [Google Scholar] [CrossRef] [PubMed]
- Baskaran, N.; Sukumar, R. Karnataka Elephant Census 2010; Centre for Ecological Sciences, Indian Institute of Science & Asian Nature Conservation Foundation; Indian Institute of Science: Bangalore, India, 2011; p. 33. [Google Scholar]
- Vidya, T.N.C.; Sukumar, R. Social organization of the Asian elephant (Elephas maximus) in southern India inferred from microsatellite DNA. J. Ethol. 2005, 23, 205–210. [Google Scholar] [CrossRef]
- Bowler, D.E.; Benton, T.G. Causes and consequences of animal dispersal strategies: Relating individual behaviour to spatial dynamics. Biol. Rev. 2005, 80, 205–225. [Google Scholar] [CrossRef]
- Fernando, P.; Wikramanayake, E.D.; Janaka, H.K.; Jayasinghe, L.K.A.; Gunawardena, M.; Kotagama, S.W.; Weerakoon, D.; Pastorini, J. Ranging behavior of the Asian elephant in Sri Lanka. Mamm. Biol. 2008, 73, 2–13. [Google Scholar] [CrossRef]
- Sukumar, R. Ecology of the Asian elephant in southern India. II. Feeding habits and crop raiding patterns. J. Trop. Ecol. 1990, 6, 33–53. [Google Scholar] [CrossRef]
- Trautmann, T.R. Elephants and Kings: An Environmental History; The University of Chicago Press: Chicago, IL, USA, 2015; ISBN 978-0-226-26422-6. [Google Scholar]
- Baleka, S.; Herridge, V.L.; Catalano, G.; Lister, A.M.; Dickinson, M.R.; Di Patti, C.; Barlow, A.; Penkman, K.E.H.; Hofreiter, M.; Paijmans, J.L.A. Estimating the dwarfing rate of an extinct Sicilian elephant. Curr. Biol. 2021, 31, 3606–3612.E7. [Google Scholar] [CrossRef]
- Davidar, E.R.C.; Davidar, P.; Davidar, P.; Puyravaud, J.-P. Elephant (Elephas maximus Linnaeus Proboscidea: Elephantidae) migration paths in the Nilgiri Hills, India in the late 1970s. J. Threat. Taxa 2012, 4, 3284–3293. [Google Scholar] [CrossRef]
- Santiapillai, C.; Wijeyamohan, S.; Bandara, G.; Athurupana, R.; Dissanayake, N.; Read, B. An assessment of the human-elephant conflict in Sri Lanka. Ceylon J. Sci. Biol. Sci. 2010, 39, 21–33. [Google Scholar] [CrossRef]
- Kremen, C.; Merenlender, A.M. Landscapes that work for biodiversity and people. Science 2018, 362, eaau6020. [Google Scholar] [CrossRef] [PubMed]


Publisher’s Note: MDPI stays neutral with regard to jurisdictional claims in published maps and institutional affiliations. |
© 2022 by the authors. Licensee MDPI, Basel, Switzerland. This article is an open access article distributed under the terms and conditions of the Creative Commons Attribution (CC BY) license (https://creativecommons.org/licenses/by/4.0/).