Article

Fish Diversity in Relation to Salinity Gradient in the Meghna River Estuary, Bangladesh

1
Coastal and Marine Dynamics Laboratory, Department of Fisheries Management, Bangabandhu Sheikh Mujibur Rahman Agricultural University, Gazipur 1706, Bangladesh
2
National Oceanographic and Maritime Institute (NOAMI), 10/8 Eastern Plaza, Sonargaon Road, Hatirpool, Dhaka 1219, Bangladesh
3
WorldFish, Bangladesh and South Asia Office, House 42/A, Road 114, Gulshan 2, Dhaka 1212, Bangladesh
*
Author to whom correspondence should be addressed.
Conservation 2022, 2(3), 414-434; https://doi.org/10.3390/conservation2030028
Submission received: 30 May 2022 / Revised: 27 June 2022 / Accepted: 1 July 2022 / Published: 5 July 2022

Abstract

:
Variation in salinity is one of the major environmental factors influencing the species diversity of fish in an estuary. Therefore, evaluating the relationship between salinity and species diversity is important. In this study, fish diversity was assessed by fish sampling and visiting local fish markets from February to November 2021. Mean salinity was 10.59 psu (Practical Salinity Unit) and 0.46 psu during the dry and wet seasons, respectively. Harpadon nehereus, Odontamblyopus rubicundus and Pseudapocryptes elongatus species were found as polyhaline (0.06~18.1 psu) species. Anguilla japonica and Arius gagora were abundant in brackish water conditions (0.35~14.2 psu). However, Acanthopagrus latus and Setipinna phasa were found in freshwater conditions (0.06~0.11 psu). The suitability index indicates that commercially important fish species such as Liza parsia, Macrobrachium rosenbergii, Mugil cephalus, Penaeus monodon and Scylla serrata can be used for mariculture during the dry season, and Acanthopagrus latus, Pethia canius and Setipinna phasa during the wet season. Overall, these findings suggest that salinity, water temperature, and chlorophyll-a had a significant (p < 0.05) effect on the fish distribution and assemblage composition in the study area. This finding will be helpful in developing policies for the conservation and management of the aquatic resources in the coastal zone to enrich the blue economy.

1. Introduction

An estuary is a semi-enclosed body of water with open or intermittently open connections to the ocean [1]. A healthy estuary can be considered as an ecosystem with multiple components (physical, chemical and biological) functioning effectively to maintain the ecosystem within the limits of natural change. The coastal region of Bangladesh has been experiencing a complicated situation regarding freshwater and saline water interactions. Changes in tide and freshwater flow result in the advance and retreat of the salinity limit. Under this process, during the wet season, local rainfall associated with flooding flows from upstream and keeps the salinity limited near the coastline. In contrast, salinity starts increasing and intruding towards upstream from the beginning of November due to reducing river flows which reached maximum values of ~22 psu (Practical Salinity Unit) in June 2014 [2]. The freshwater flowing from the Ganges through the Padma River governs the state of the salinity of the Meghna River basin. But the Ganges’ outflow during the dry season has been decreasing due to commissioning of the Farakka barrage (18 km from the western border of Bangladesh) in 1975 [3]. As a consequence, salinity intrusion occurs during the dry season in the lower Meghna River estuary (MRE). This disparity in salinity intrusion is because of a vast flow of freshwater into the MRE from the upstream that results from three rivers: the Padma, the Brahmaputra, and the Kalni River. As a result of the reduced freshwater flow to the coastal region, the intrusion of saline water towards upstream has made the region vulnerable to increasing impacts of salinity [4]. Hence, the salinity pattern of Bangladesh is highly dependent on the volume of the freshwater flow coming from upstream.
The freshwater of rivers, ponds or lakes has a salinity of 0.5 psu or less. Within an estuary, salinity levels are known as oligohaline (0.5–5.0 psu), mesohaline (5.0–18.0 psu), or polyhaline (18.0–30.0 psu) [5]. Adjacent to the open sea, estuarine waters may be euryhaline, in which area salinity levels are similar to the sea (>30 psu). Different fish species have different salinity tolerance levels and show significant responses to slight changes in the salinity of their surrounding water. Over the years, inland open water fisheries of the coastal region have faced increasing threats from over-exploitation of fishery resources, indiscriminate fishing with inappropriate fishing gears, increased water pollution and intrusion of salinity [6]. Human activities, like agriculture or salt mining along with climatic acidification and rising sea levels, are increasing salt concentrations in inland freshwaters and coastal regions [7], which produces severe, negative economic and biological effects [8]. Among climate-related threats, increasing salinity from sea level rise and climate-induced changes in temperature, rainfall, and riverine flows are the most important [9].
Fisheries makes an important contribution to the economy of the coastal region of Bangladesh [6]. Marine fisheries, inland open water or capture fisheries, and closed water fisheries offer an essential source of livelihood for tens of thousands of poor people and supply a significant portion of their protein intake [10]. Because of salinity intrusion, significant changes have taken place in the fisheries sector. In the case of the fishery, increased salinity affects spawning grounds, leading to substantial reductions in the inland open water fishery [11]. The changes in salinity gradient will adversely affect the diversity and availability of many fish species. However, fish diversity, a major portion of biodiversity, is correlated with the stability and resilience of an ecosystem which would have a positive relationship with the well-being of the existing species structure including the humans. As a result, reduced fish diversity is a serious threat to the environment and local people’s foodstuff. Consequently, adverse impacts are anticipated for the incomes of small-scale fishermen (SSF) dependent on the captured fishery of the whole coastal region due to increased salinity in these areas. However, an increase in brackish water will enhance opportunities for brackish water aquaculture, for example, farming of Lates calcarifer, Liza parsia, Macrobrachium rosenbergii, Mugil cephalus, Penaeus indicus, Penaeus monodon and Scylla serrata etc.
Fish assemblage structure in the estuaries of Bangladesh has not been well studied; although there are some scattered works on different biological aspects of the coastal estuarine system of Bangladesh [12,13,14], none of them examined the species assemblage structure in relation to salinity gradients. The Meghna River estuary (MRE) is the largest estuarine ecosystem of Bangladesh, which is still unknown, unmanaged, and unmonitored. In this study we investigated the changes in the diversity of finfish and crustaceans with changing salinity gradient in the MRE, assessed the salinity tolerance level for individual finfish and crustaceans, and identified the commercially important fish species for mariculture based on the salinity gradient.

2. Materials and Methods
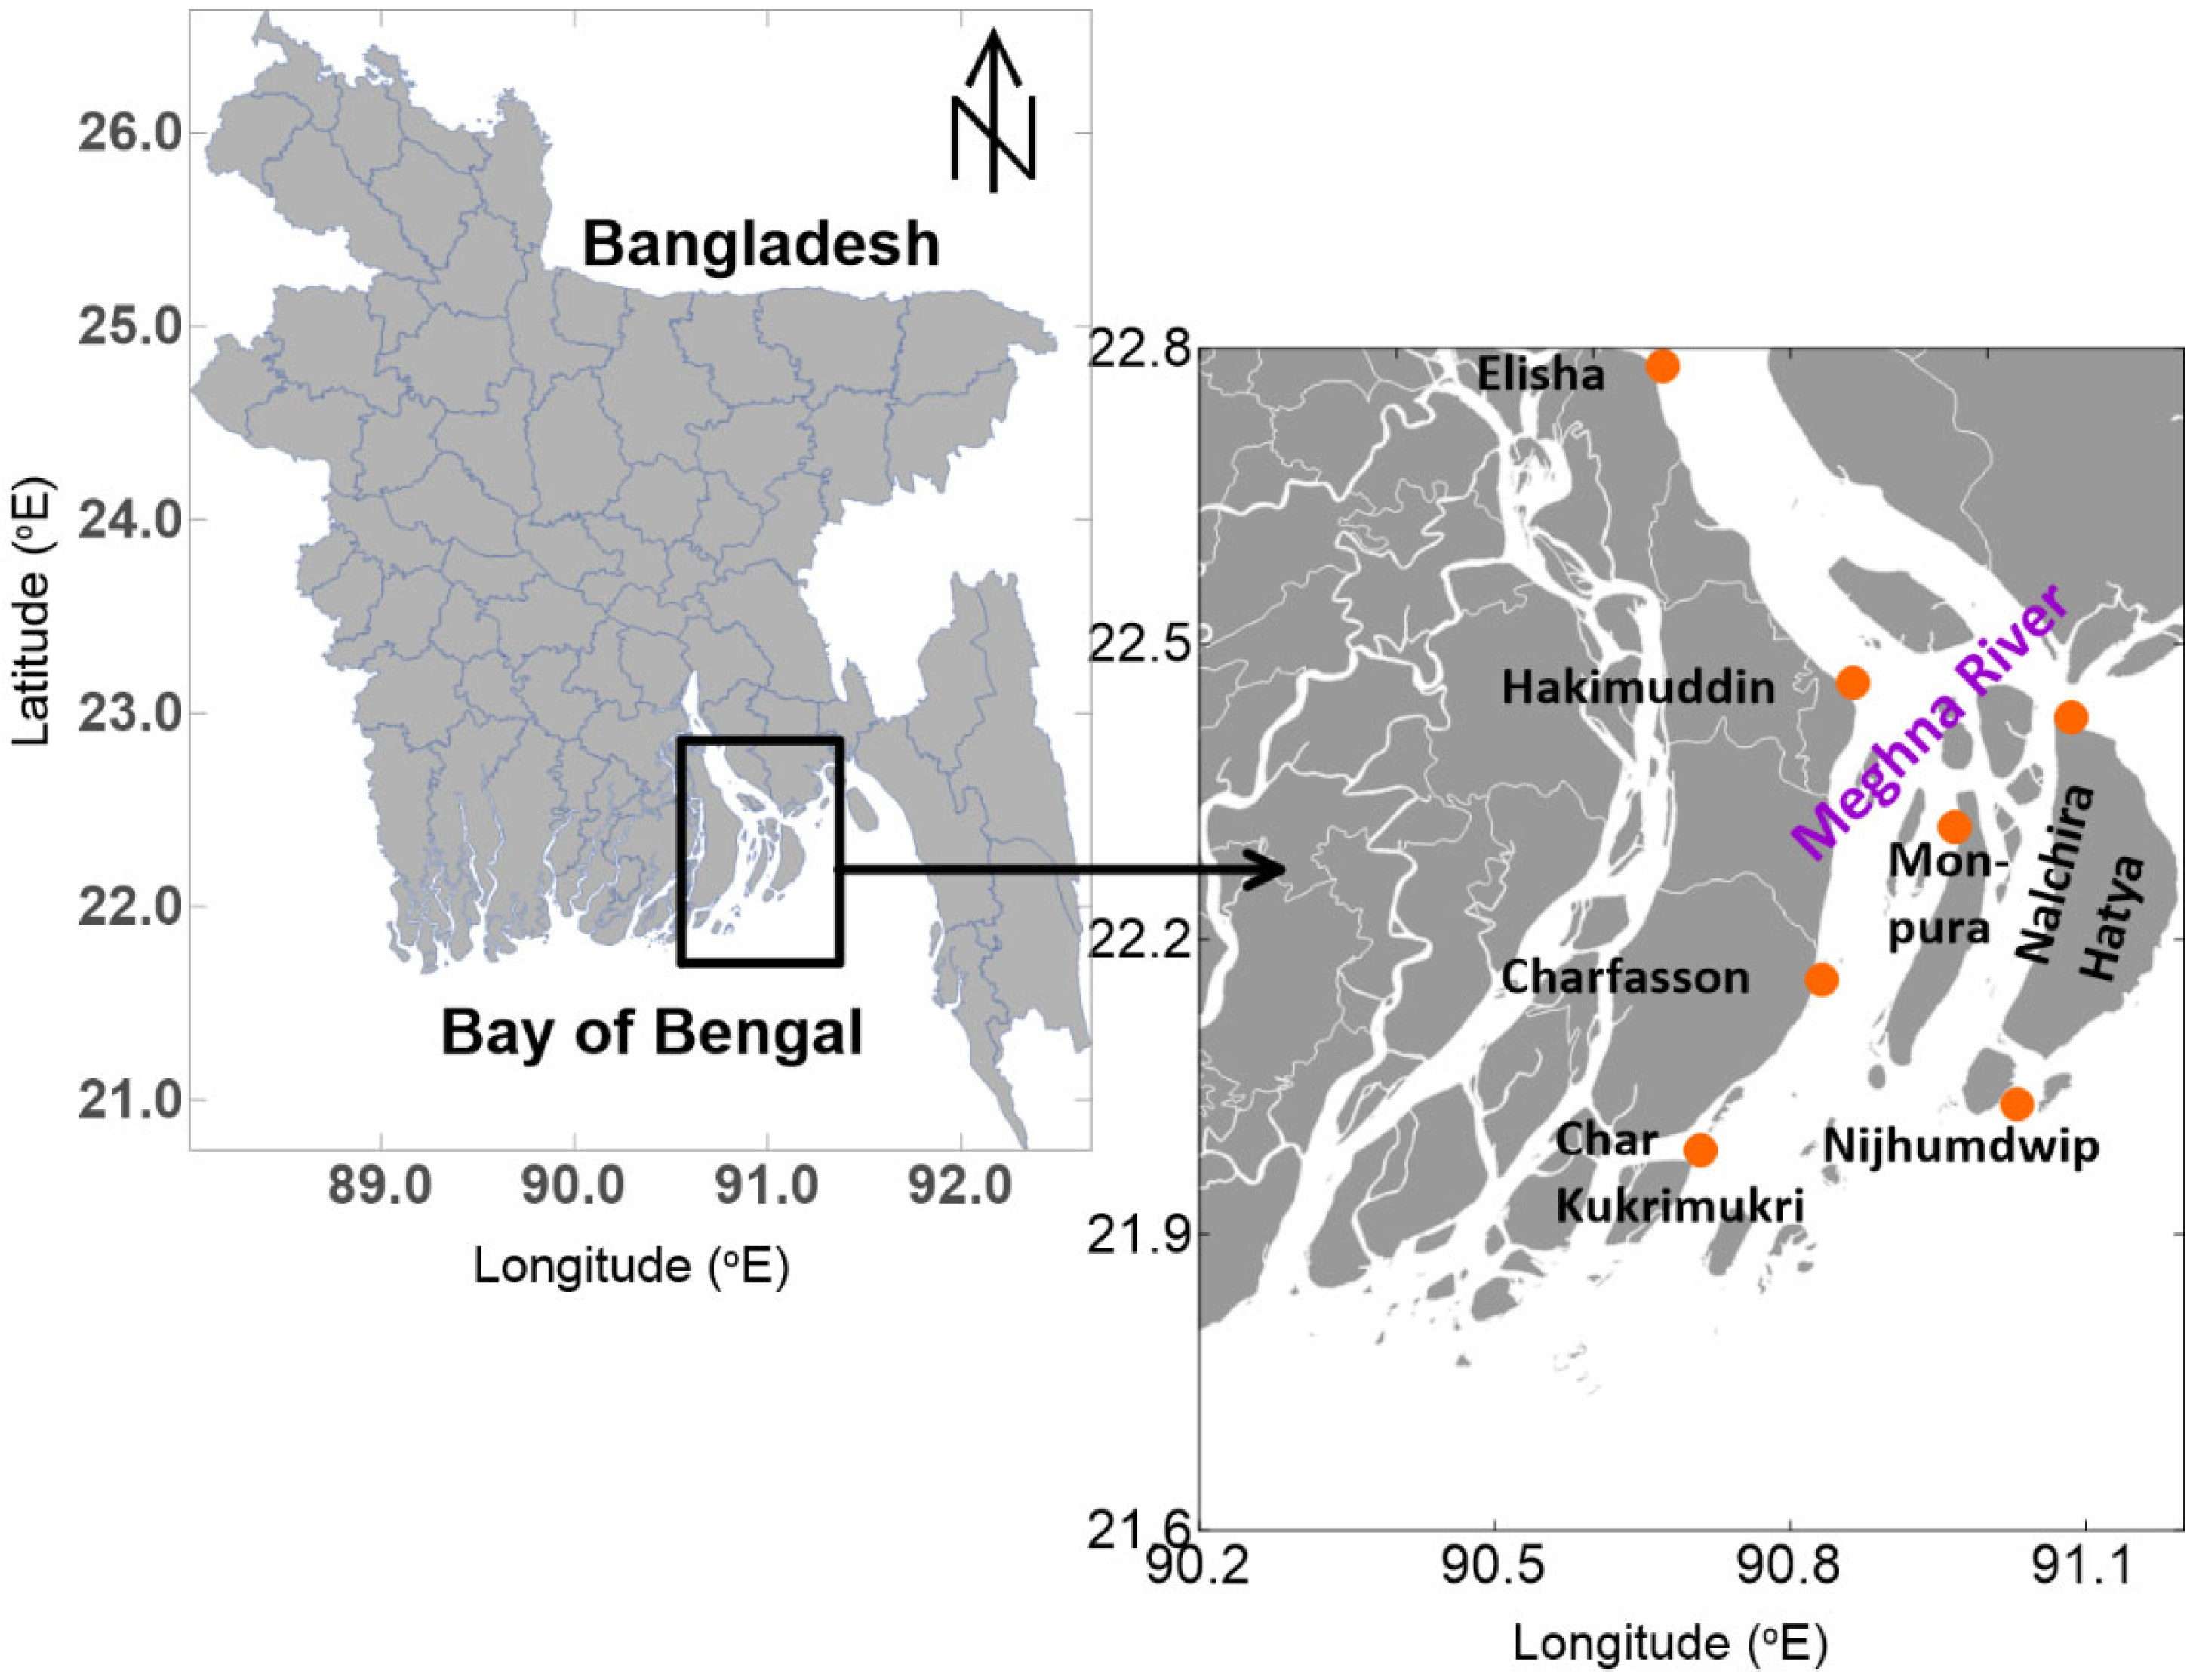
2.1. Study Area

The Meghna River is directly connected to the freshwater source of the Ganges. The Ganges was unregulated prior to the construction of the Farakka Barrage in India in 1975. This diversion diminished the average dry season flow in the Ganges from 3114 m3 s−1 during the pre-Farakka period to 2010 m3 s−1 in the post-Farakka period [15,16].
The Ganges–Brahmaputra–Meghna River system is the third largest freshwater outlet in the world. This system brings immense river discharge (∼1.5 × 10¹² m3 year−1) with billions of tons of associated sediment load into the Bay of Bengal; salinity structure is correlated with this river discharge and other atmospheric variables like rainfall [17]. River discharge is driven by the Indian Monsoon, with a maximum discharge of about 82,000 m3 s−1 in rainy season, a minimum of <10,000 m3 s−1 in winter season, and an annual average of about 32,000 m3 s−1. Huge river discharge and rainfall during the summer monsoon and the small ones during the winter largely control water temperature, current, density and salinity, nutrients export, and primary of the Meghna River basin. Consequently, saltwater intrusion has extended from the estuarine mouth to the upstream during the spring tide in the dry season in the MRE (Figure 1).

2.2. Spatio-Temporal Salinity Observation

Seven stations in the Meghna River estuary were selected for sampling of the salinity and other water quality parameters. The use of a global positioning system (GPS) ensured that precise data were obtained at the sampling stations. Salinity and temperature profile were taken using a conductivity-temperature-depth (CTD) profiler (Model: In-situ Aqua TROLL 500, In-Situ Inc., Fort Collins, CO, USA) at the sampling stations of the Meghna River estuary. A mechanized boat was used to collect data during the dry and wet seasons from February 2021 to November 2021 in the MRE. Five transects were taken during the dry and wet seasons. In addition, water samples were taken using a Kemmerer water sampler (Wildco Instruments, Wildlife Supply Company, Gene Lasserre Blvd., Yulee, FL, USA) for water quality measurement. Dissolve oxygen (DO) concentrations were determined by a DO meter (HACH HQ30d) and pH determined by a pH meter (sensION + EC71).

2.3. Fish Sampling

Data were collected from an artisanal catch of the local fishermen. In addition, local fish markets (Hatya fish market, Monpura fish market, Char fasson fish market, Elisha fish market and Koccopia fish market) were surveyed for collected riverine fish species to enhance the species checklists at each section. Where possible, fish were identified on collection then released. Where not possible, they were preserved in 10% formalin solution and taken to the laboratory for identification. Fishermen interviews and a focused group discussion (FGD) were completed for the collection of information on vulnerable, endangered, and disappeared fish species. Collected fish species were identified up to species level using the morphometric study. All fish specimens and the scientific name was corrected were identified according to [18,19].

2.4. Laboratory Analysis

Nutrients analyses, including the estimation of nitrite, nitrate, ammonia, inorganic phosphate, and silicate, were carried out in the laboratory [20] and the values were determined by spectrophotometric method (HACH, DR-6000, Germany, S/N: 1824775). Nitrite was analyzed by the USEPA diazotization method, ammonia was analyzed by the USEPA Nessler method, and phosphorus was analyzed by the USEPA Ascorbic acid method. Nitrate was analyzed by the HACH cadmium reduction method and silica was analyzed by the HACH Heteropoly blue method. Chlorophyll-a anlaysis followed the Parson’s method [21].

2.5. Fish Diversity Indices

This study evaluates the diversity of fish species using three diversity analysis tools: Shannon Weaver diversity index (H′), Evenness by Pielou’s index (J′) and Species richness index (d) [22,23].

2.6. Site Suitability Index

Every species needs a standard range of various environmental parameters for their growth and survival. If salinity and most of the other water quality parameters of an estuary are found within a standard range for a species, then it can be said that the species is feasible for mariculture in that estuary. In this study, we have calculated the site suitability index in order to identify suitable sites for different mariculture species. According to the salinity and other water quality parameters, this study concludes that some species are feasible during the dry season, and some are feasible during the wet season for mariculture in the MRE region of Bangladesh. The suitability index is a count of the number of ‘optimal’ variables divided by the number of variables taken into account. The index ranges between 0 (no variables are in the optimal range) and 1 (all variables in optimal range). A maximum of 8 variables were used [24]. For example, in one zone of the study area, 6 variables were in an optimal range, and so the suitability index score was 6/8 = 0.75. The value greater than 0.5 was taken as suitable for that individual for mariculture. If the value was 0.5 or less than 0.5 for a species during a particular season in a specific area, then that species was considered as unsuitable for mariculture in that area during that season.

2.7. Statistical Analysis

The R program version 4.0.3 [25] was used for performing multivariate statistical analysis for variation in the Meghna River estuarine habitat. In this present study, nine water quality parameters and thirteen fish orders were considered for multivariate statistical analysis. As a complement, boxplot analysis was performed using the ‘heatmaply’ package [26]. The relations among the environmental factors (physical and chemical parameters, dissolved nutrients, and chlorophyll a) in the study area were analyzed using the principal component analysis (PCA). A PCA was performed on the correlation matrix. In order to confirm the existence of variation among water quality parameters and fish orders, the principal component analysis (PCA) and cluster analysis (CA), using the Euclidean distance method, were employed in the present study. The PCAs were executed using the ‘FactoMineR’ package [26,27]. Furthermore, the contributions of variables to principal components (PCs) were also examined to determine which environmental factors were most varied among the different compartments of the MRE habitat. The cluster analysis was completed using the ‘dendextend’ package [26].

3. Results

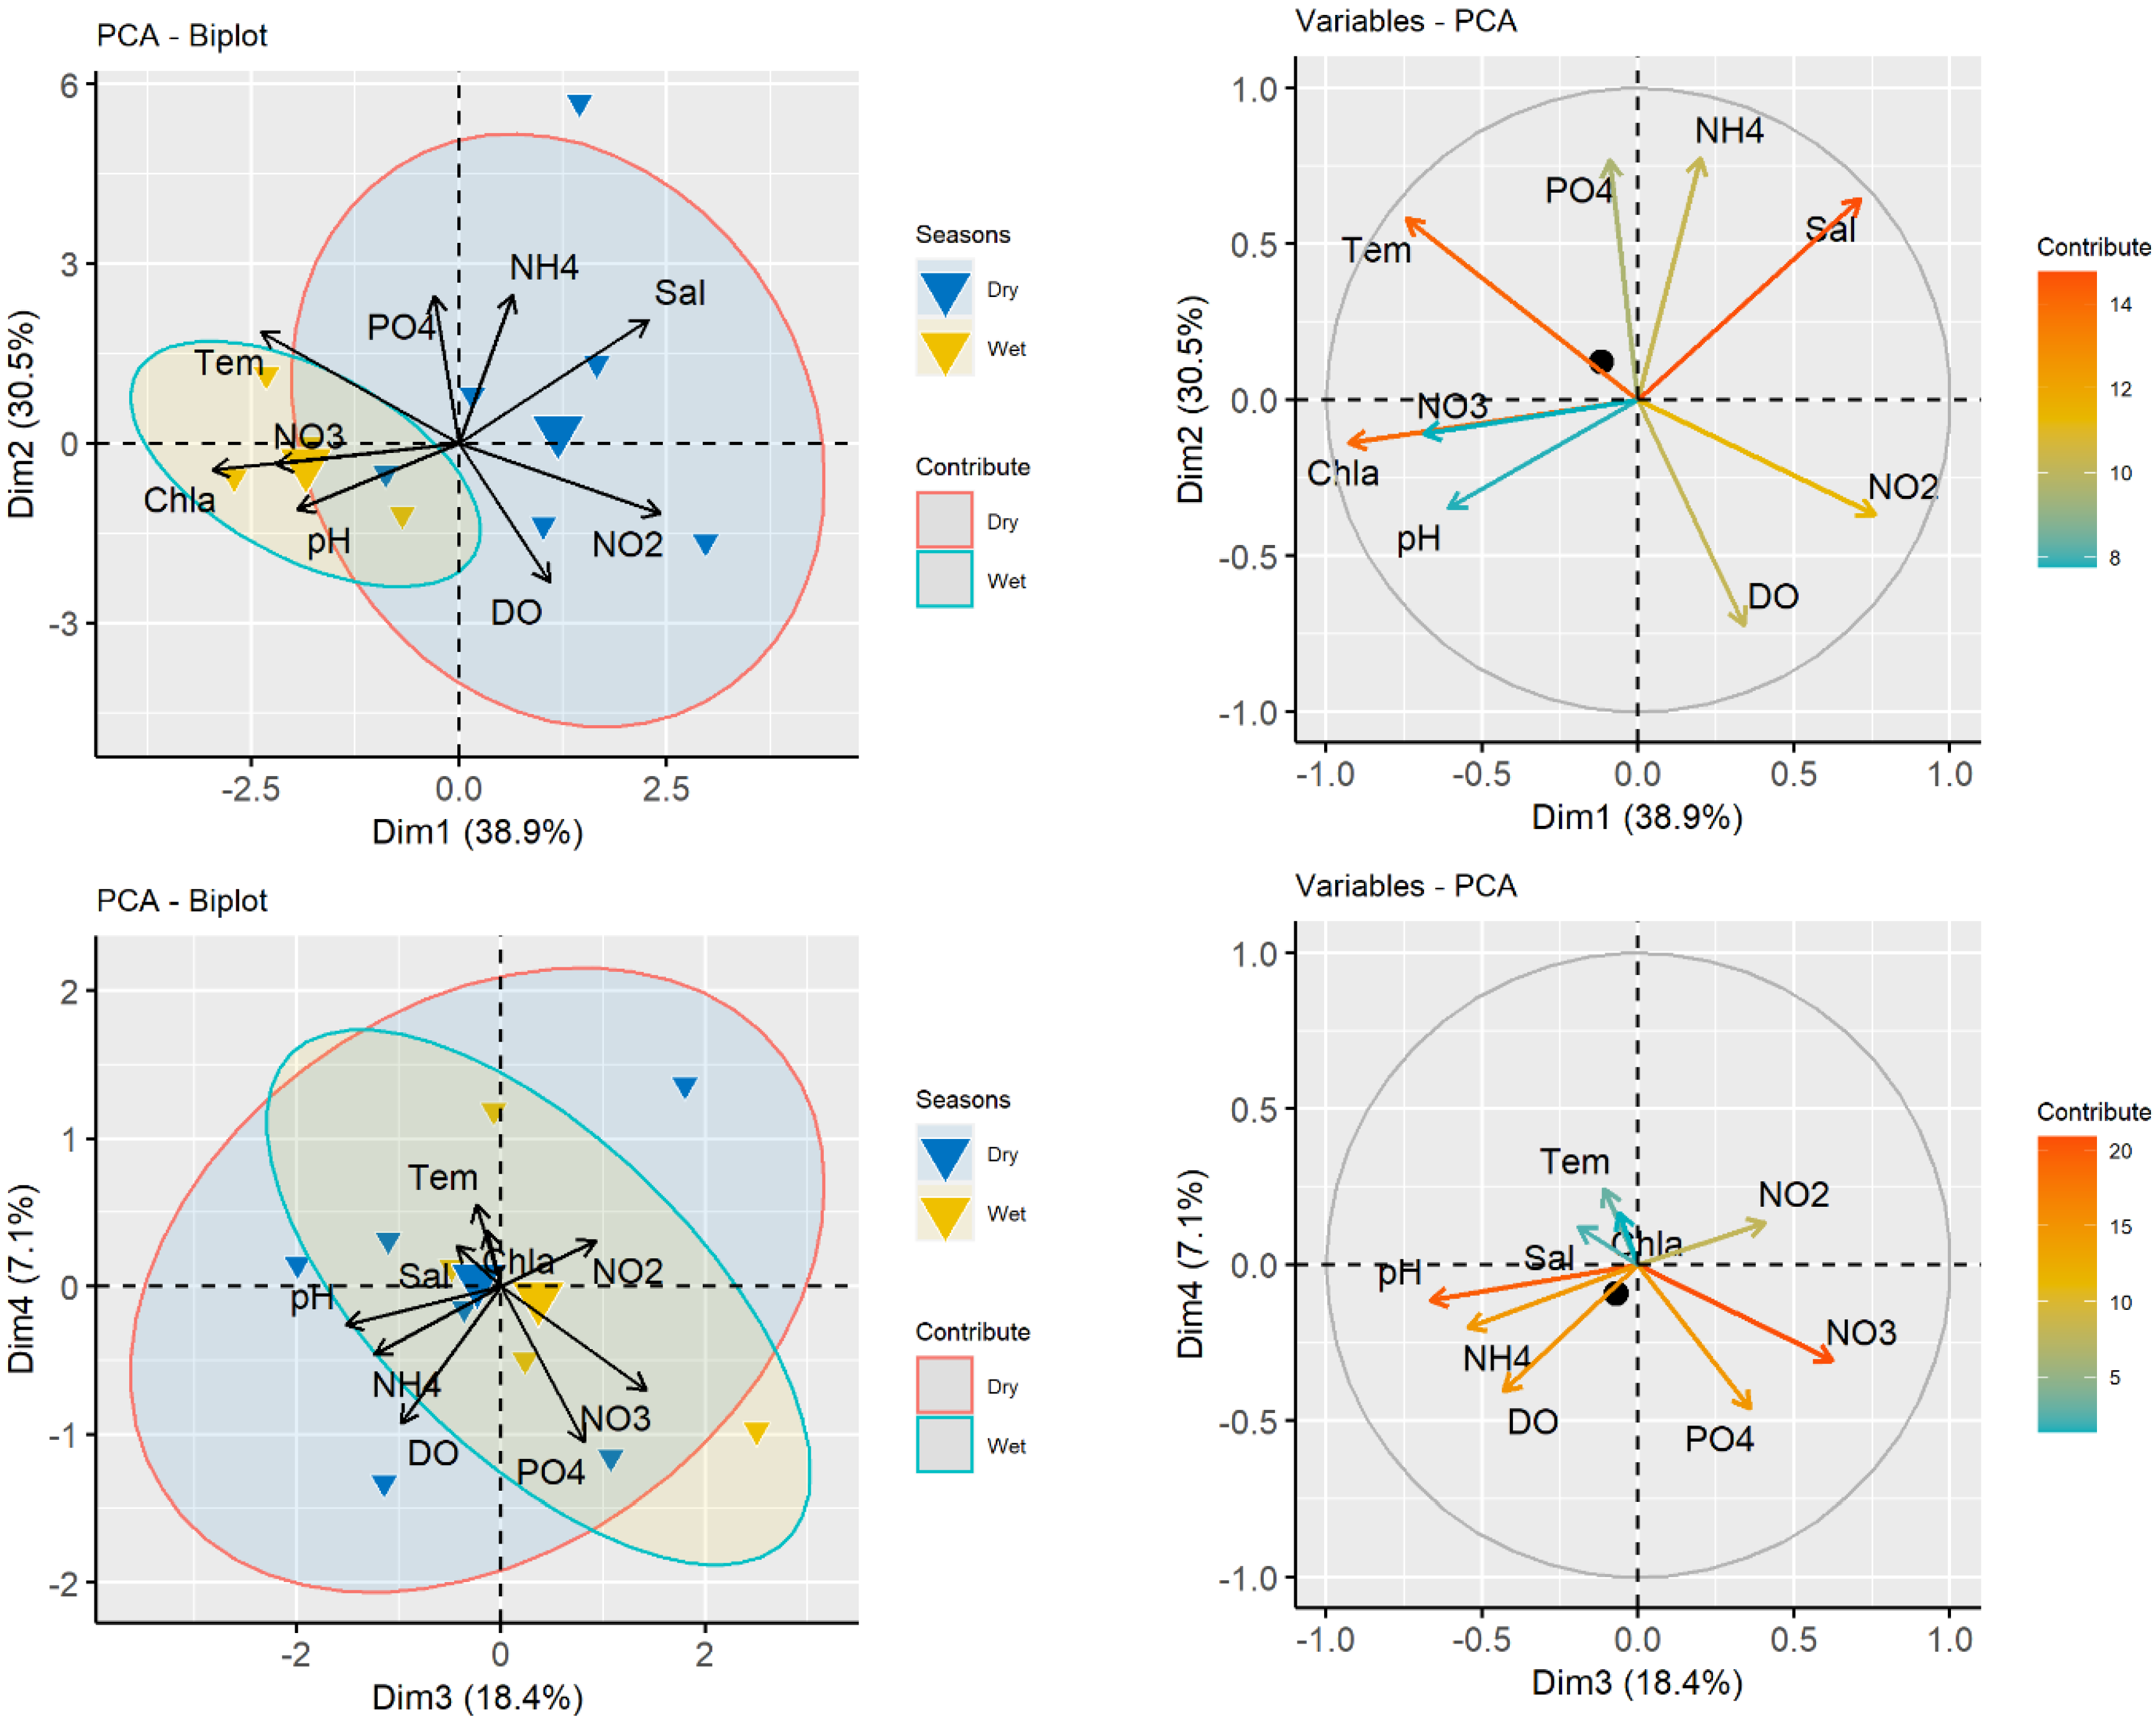
3.1. Water Quality Parameter

Dissolved oxygen (DO) values ranged from 6.72 to 9.99 mg/L with an average of 7.94 mg/L during the dry season and 6.64 to 7.94 mg/L with an average value of 7.32 mg/L during the wet season. Temperatures ranged from 19.68–29.89 °C with an average of 24.67 °C during the dry season and 26.24–31.16 °C with an average of 28.39 °C during the wet season in the Meghna River estuary (Table 1).
During the dry season, mean salinity was 10.59 psu with a maximum value of 18.07 psu and a minimum value of 0.12 psu in the Meghna River estuary. During the wet season, the mean salinity was 0.46 psu, where maximum salinity was 3.16 psu and the minimum value was 0.06 psu (Table 1). DO, temperature, chlorophyll-a, dissolved inorganic nitrogen (DIN = Nitrate + Nitrite + Ammonia), and salinity were significantly (p < 0.05) varied between the dry and wet seasons. However, pH showed insignificant (p > 0.05) variation between the dry and wet seasons. In this study, the pH value ranged from 6.30 to 9.09 with an average of 7.87 during the dry season and 7.10 to 8.79 with an average of 7.98 during the wet season (Table 1).
The multivariate analysis showed a seasonal gradient for the water quality parameters, forming two different groups for the dry and wet seasons (Figure 2). The measured water quality parameter is summarized in Table 1. Dissolved inorganic nitrogen (DIN) concentrations were significantly (p < 0.05) higher during the dry season (0.55 mg/L) than during the wet season (0.35 mg/L) (Table 1). On the other hand, dissolved inorganic phosphate (DIP) concentrations were also insignificantly (p > 0.05) higher during the dry season (0.43 mg/L) than during the wet season (0.36 mg/L). The mean chlorophyll-a concentrations in the dry season and wet season were 3.81 µg/L and 7.57 µg/L, respectively. That means that chlorophyll-a concentrations were significantly higher (p < 0.05) in the wet season than the dry season (Table 1). Principal components 1 and 2 contributed about 69.4% of the variability, where salinity, chlorophyll-a, and temperature contributed most, indicating seasonal variation of salinity, chlorophyll-a and temperature in water. On the contrary, component 3 and 4 contributes 25.5% of the variation in water, where the contribution of NO3 and pH was highest. Dry season showed a higher variation than the wet season where salinity, NO2 and NH4+ were dominant during the dry season. By contrast, Chl-a, NO3 and pH dominated during the wet season.
Cluster analysis grouped the nine water quality parameters (Temperature, NO3, Chl-a, pH, PO43−, NH4+, salinity, NO2 and DO) and thirteen fish orders (Clupeiformes, Aulopiformes, Scombriformes, Gadiformes, Anguiliformes, Myliobatiformes, Gobiiformes, Siluriformes, Mugiliformes, Pleuronectiformes, Scorpaeniformes, Beloniformes, Synbranchiformes, Anabantiformes, Perciformes and Decapoda) into two different clusters (Figure 3). The first cluster included temperature, NO3, Chl-a and pH which showed their correlation with the rest of the parameters and the various fish orders. The second cluster included the thirteen fish orders and the rest of the parameters. The second cluster was divided into two subclasses, where the first subclass included all the fish orders and three water quality parameters salinity, PO43− and NH4+ where the salinity was the dominant factor. The second subclass included a correlation of DO with the first subgroup (Figure 3). Overall, these findings suggest that water temperature, salinity and chlorophyll-a had a significant effect on the fish distribution and assemblage composition in the study area (p < 0.05).

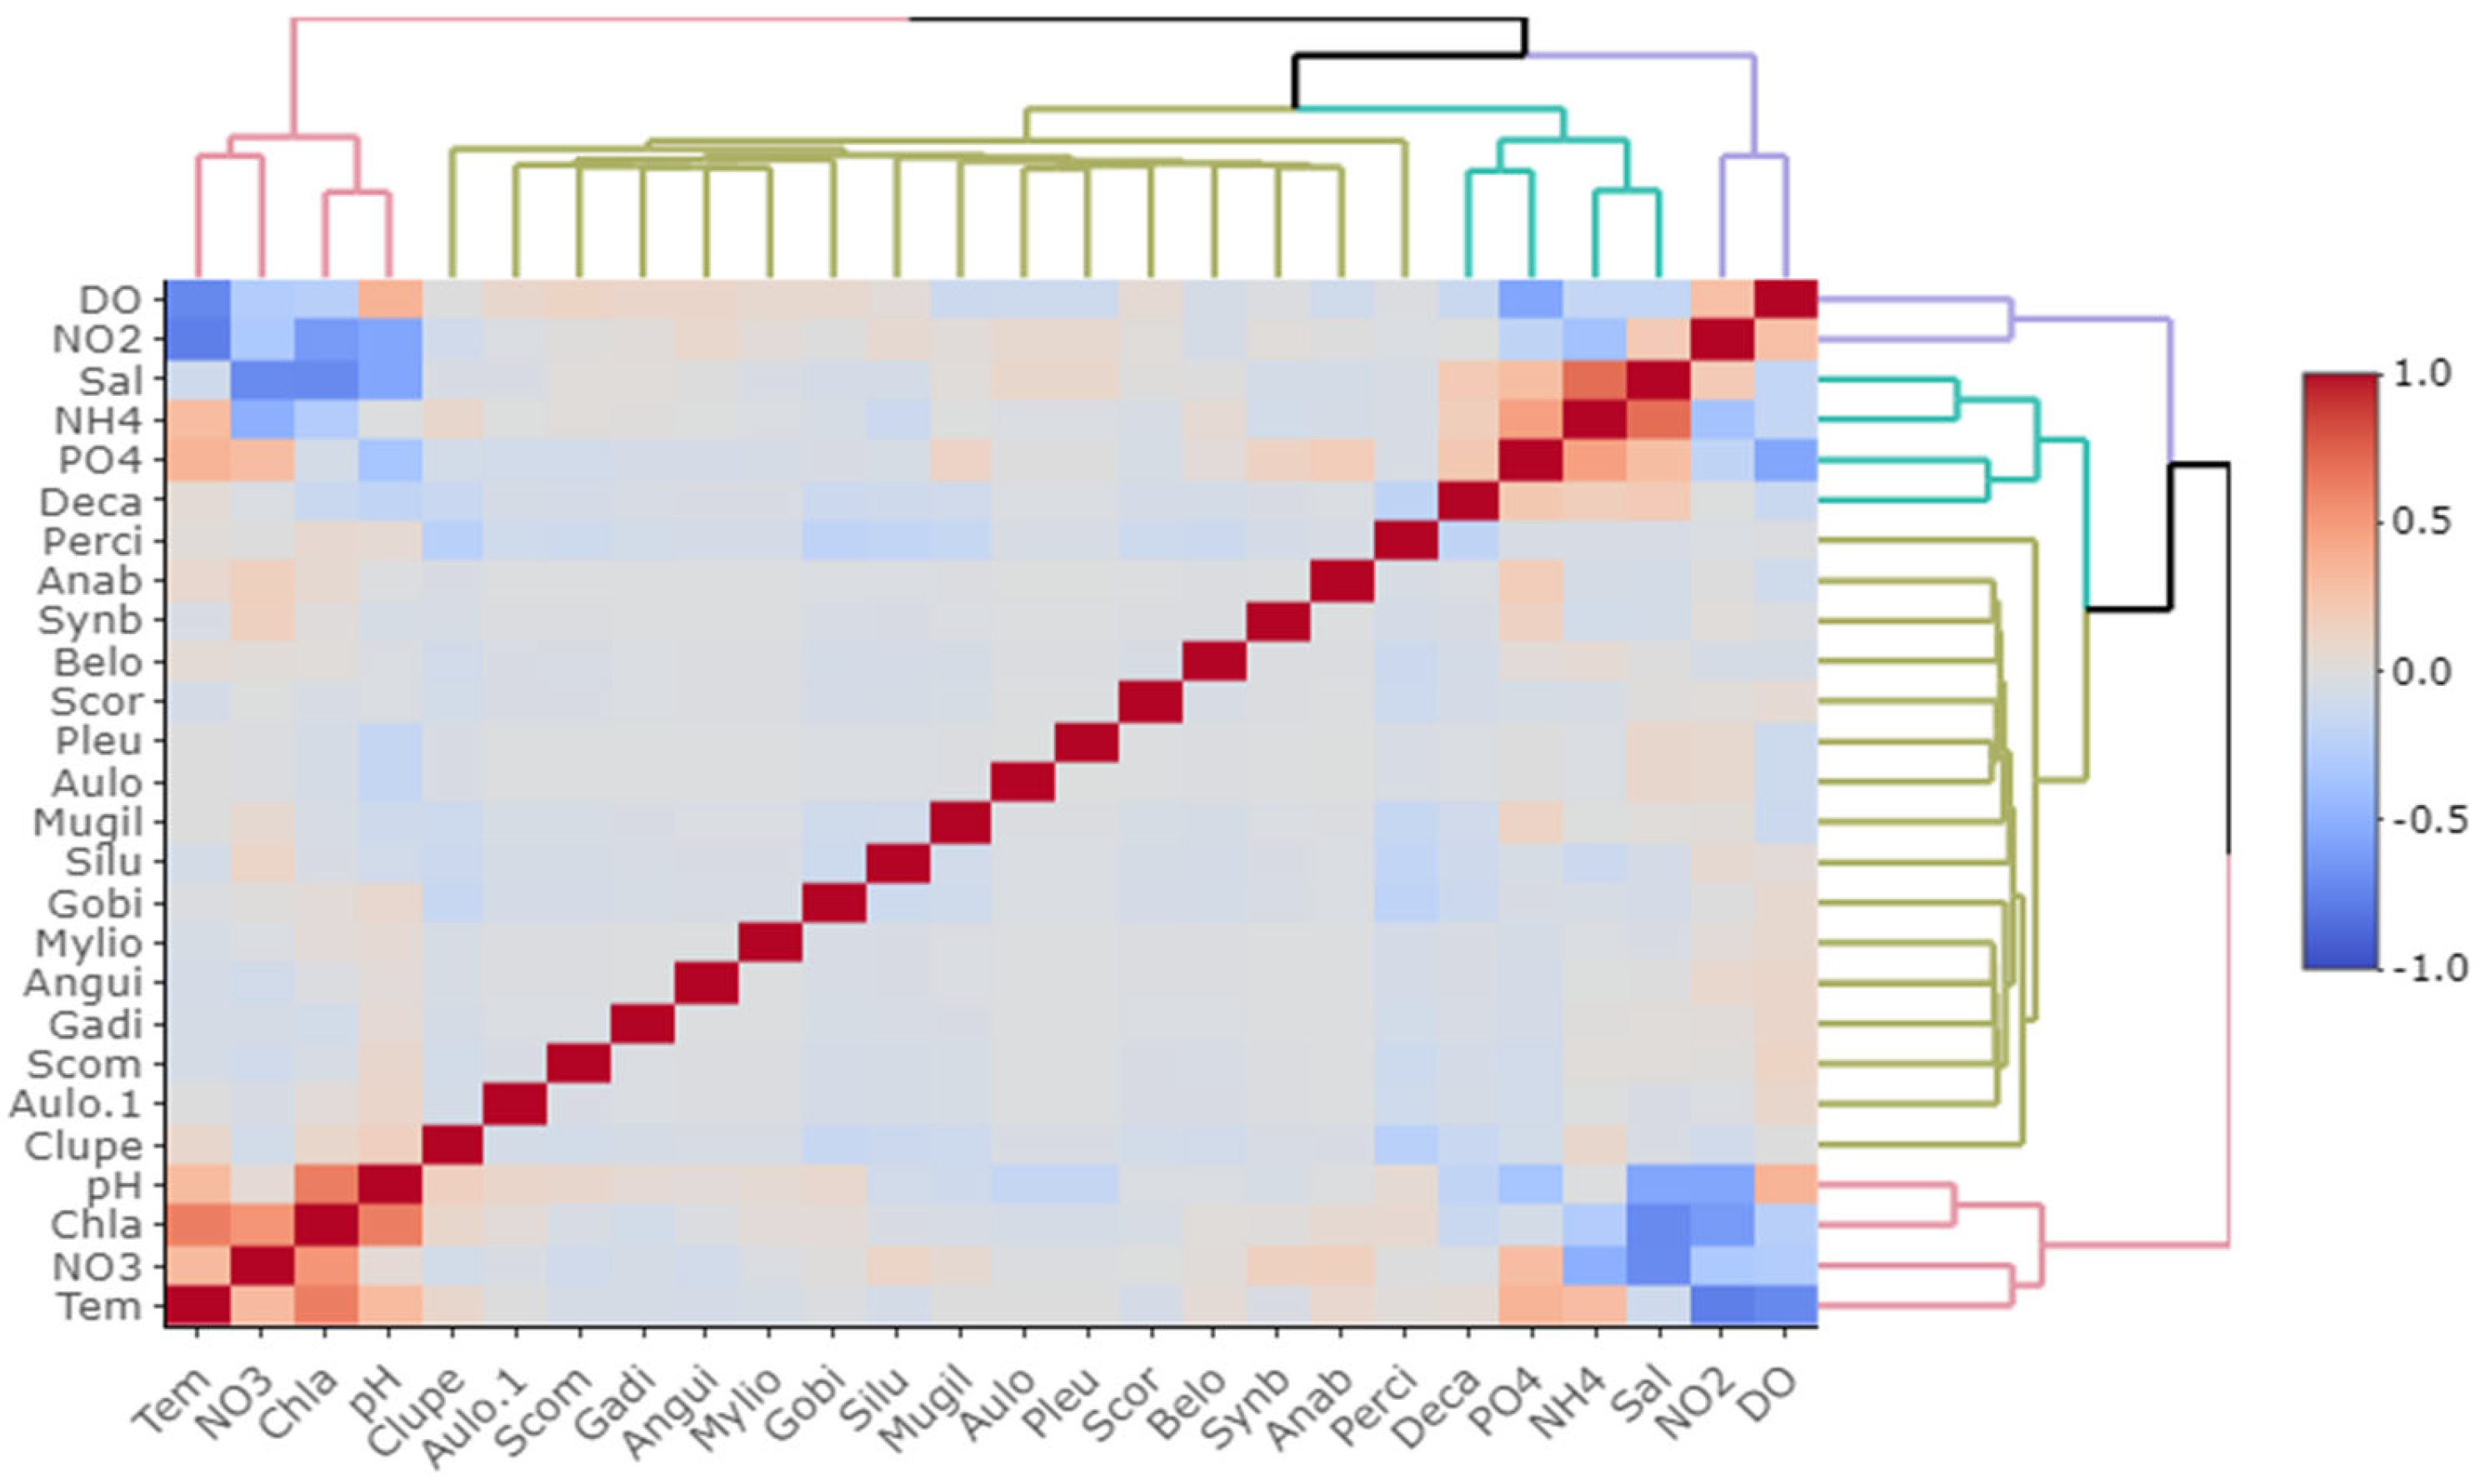
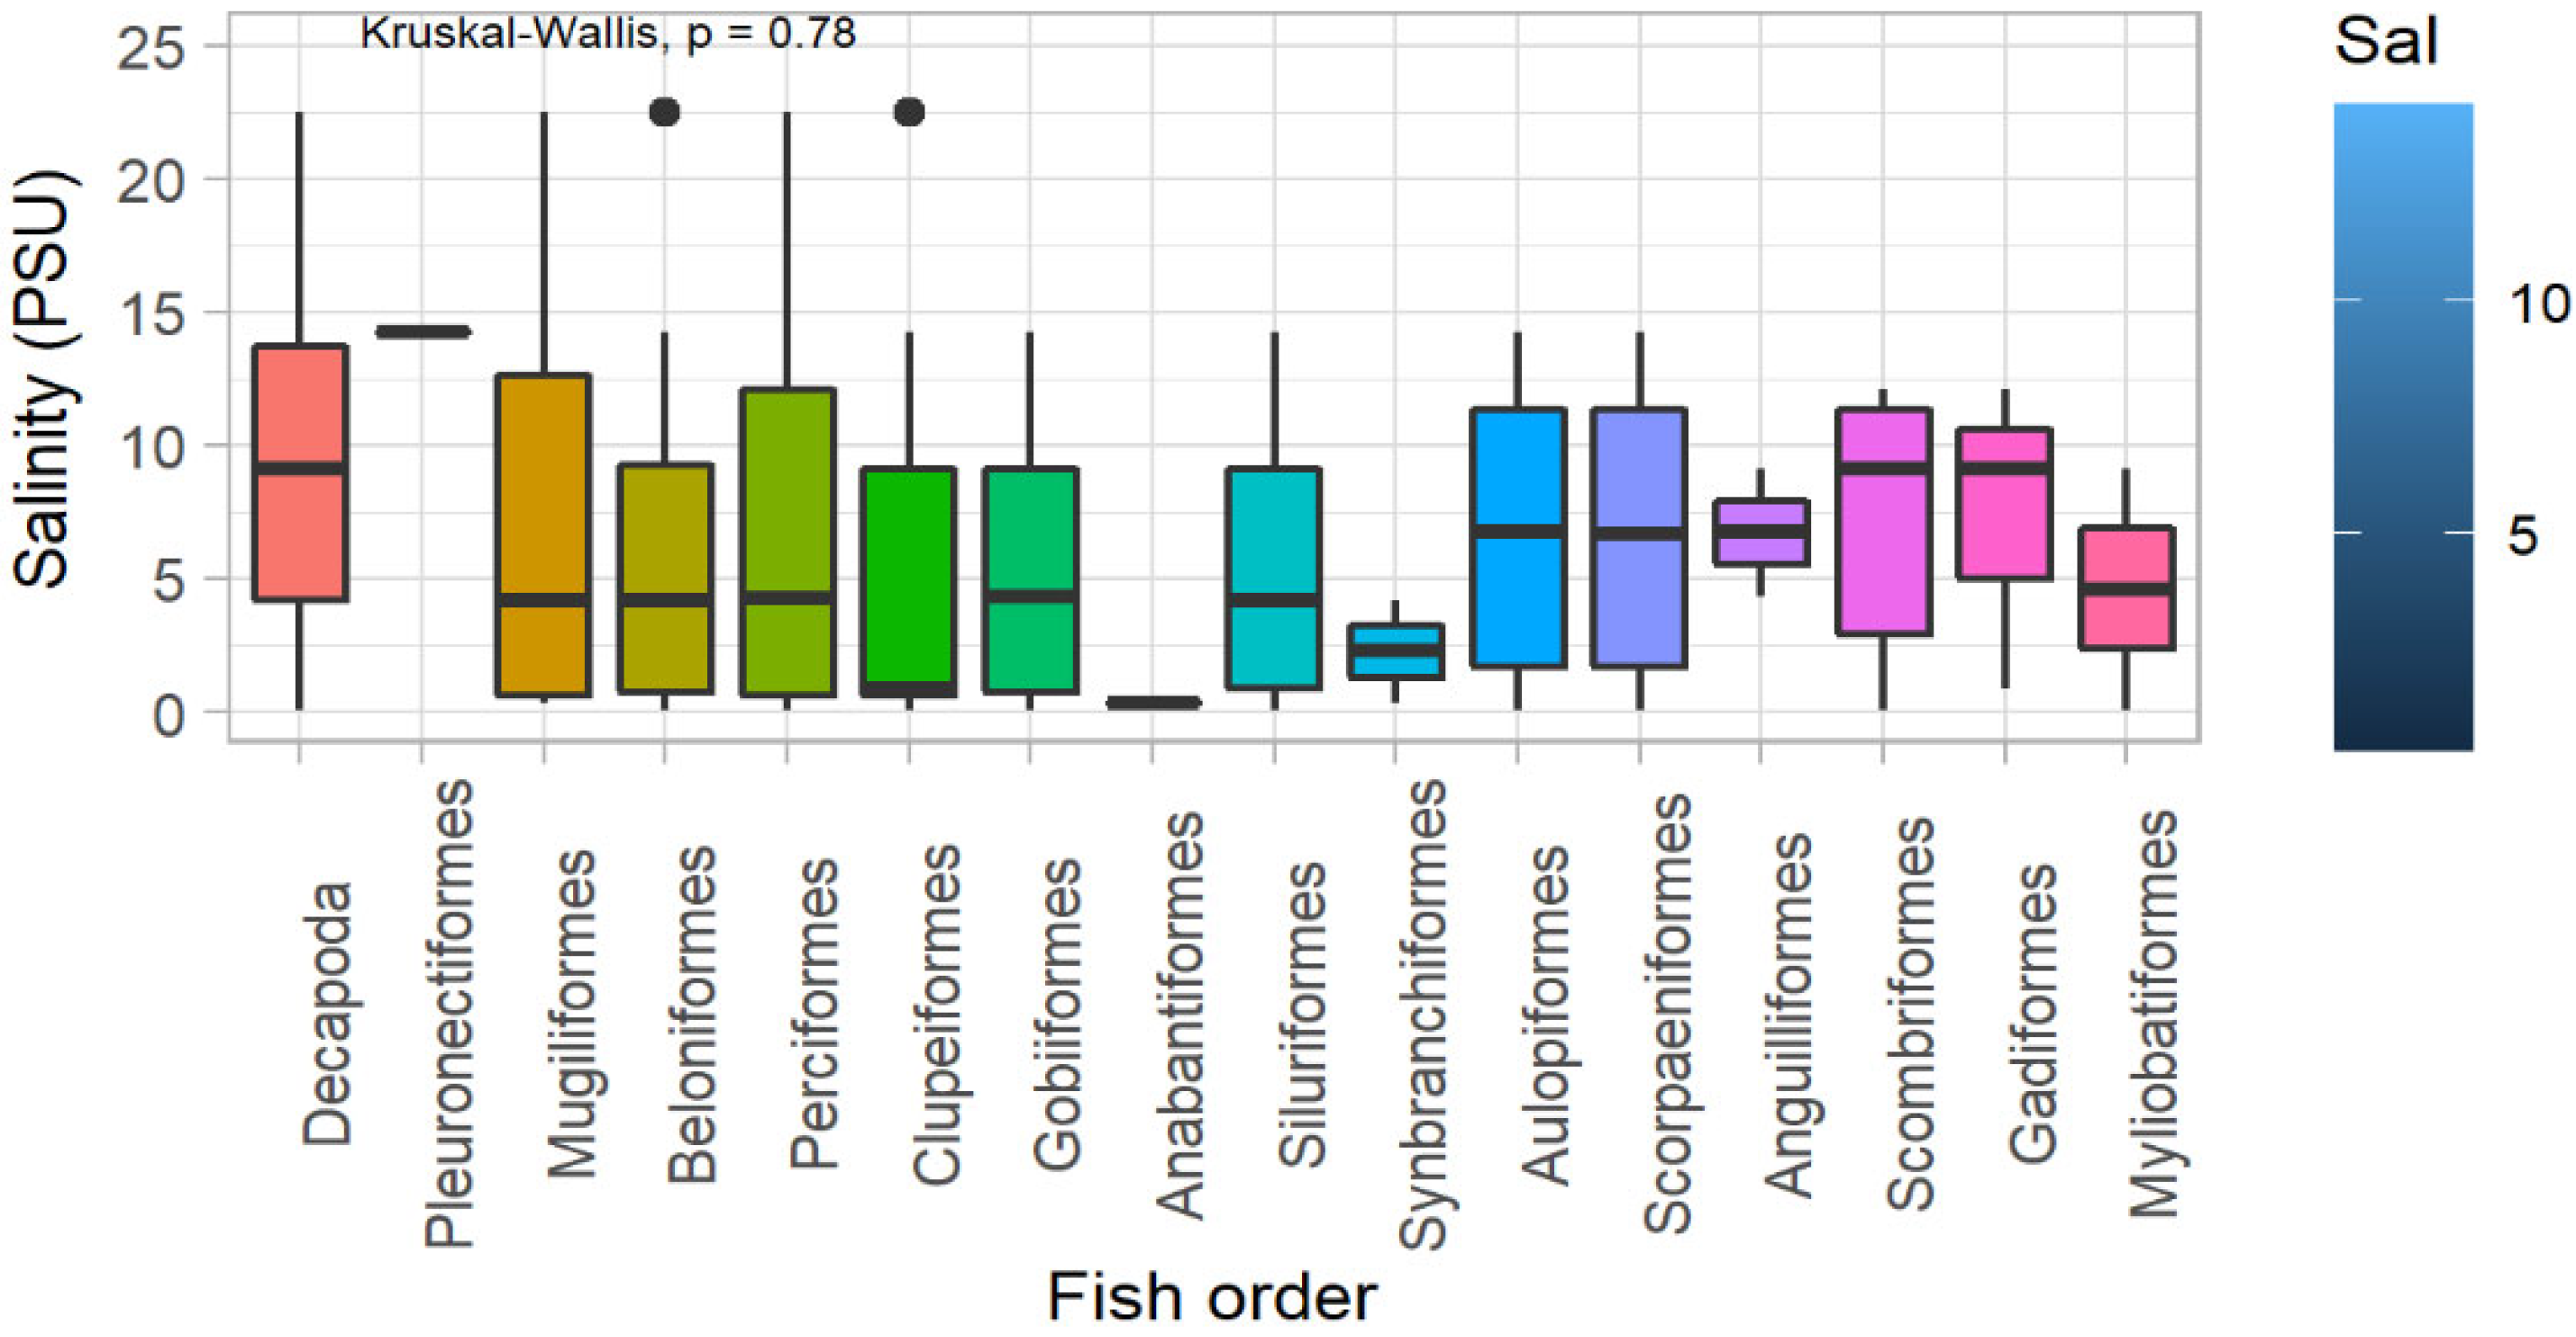
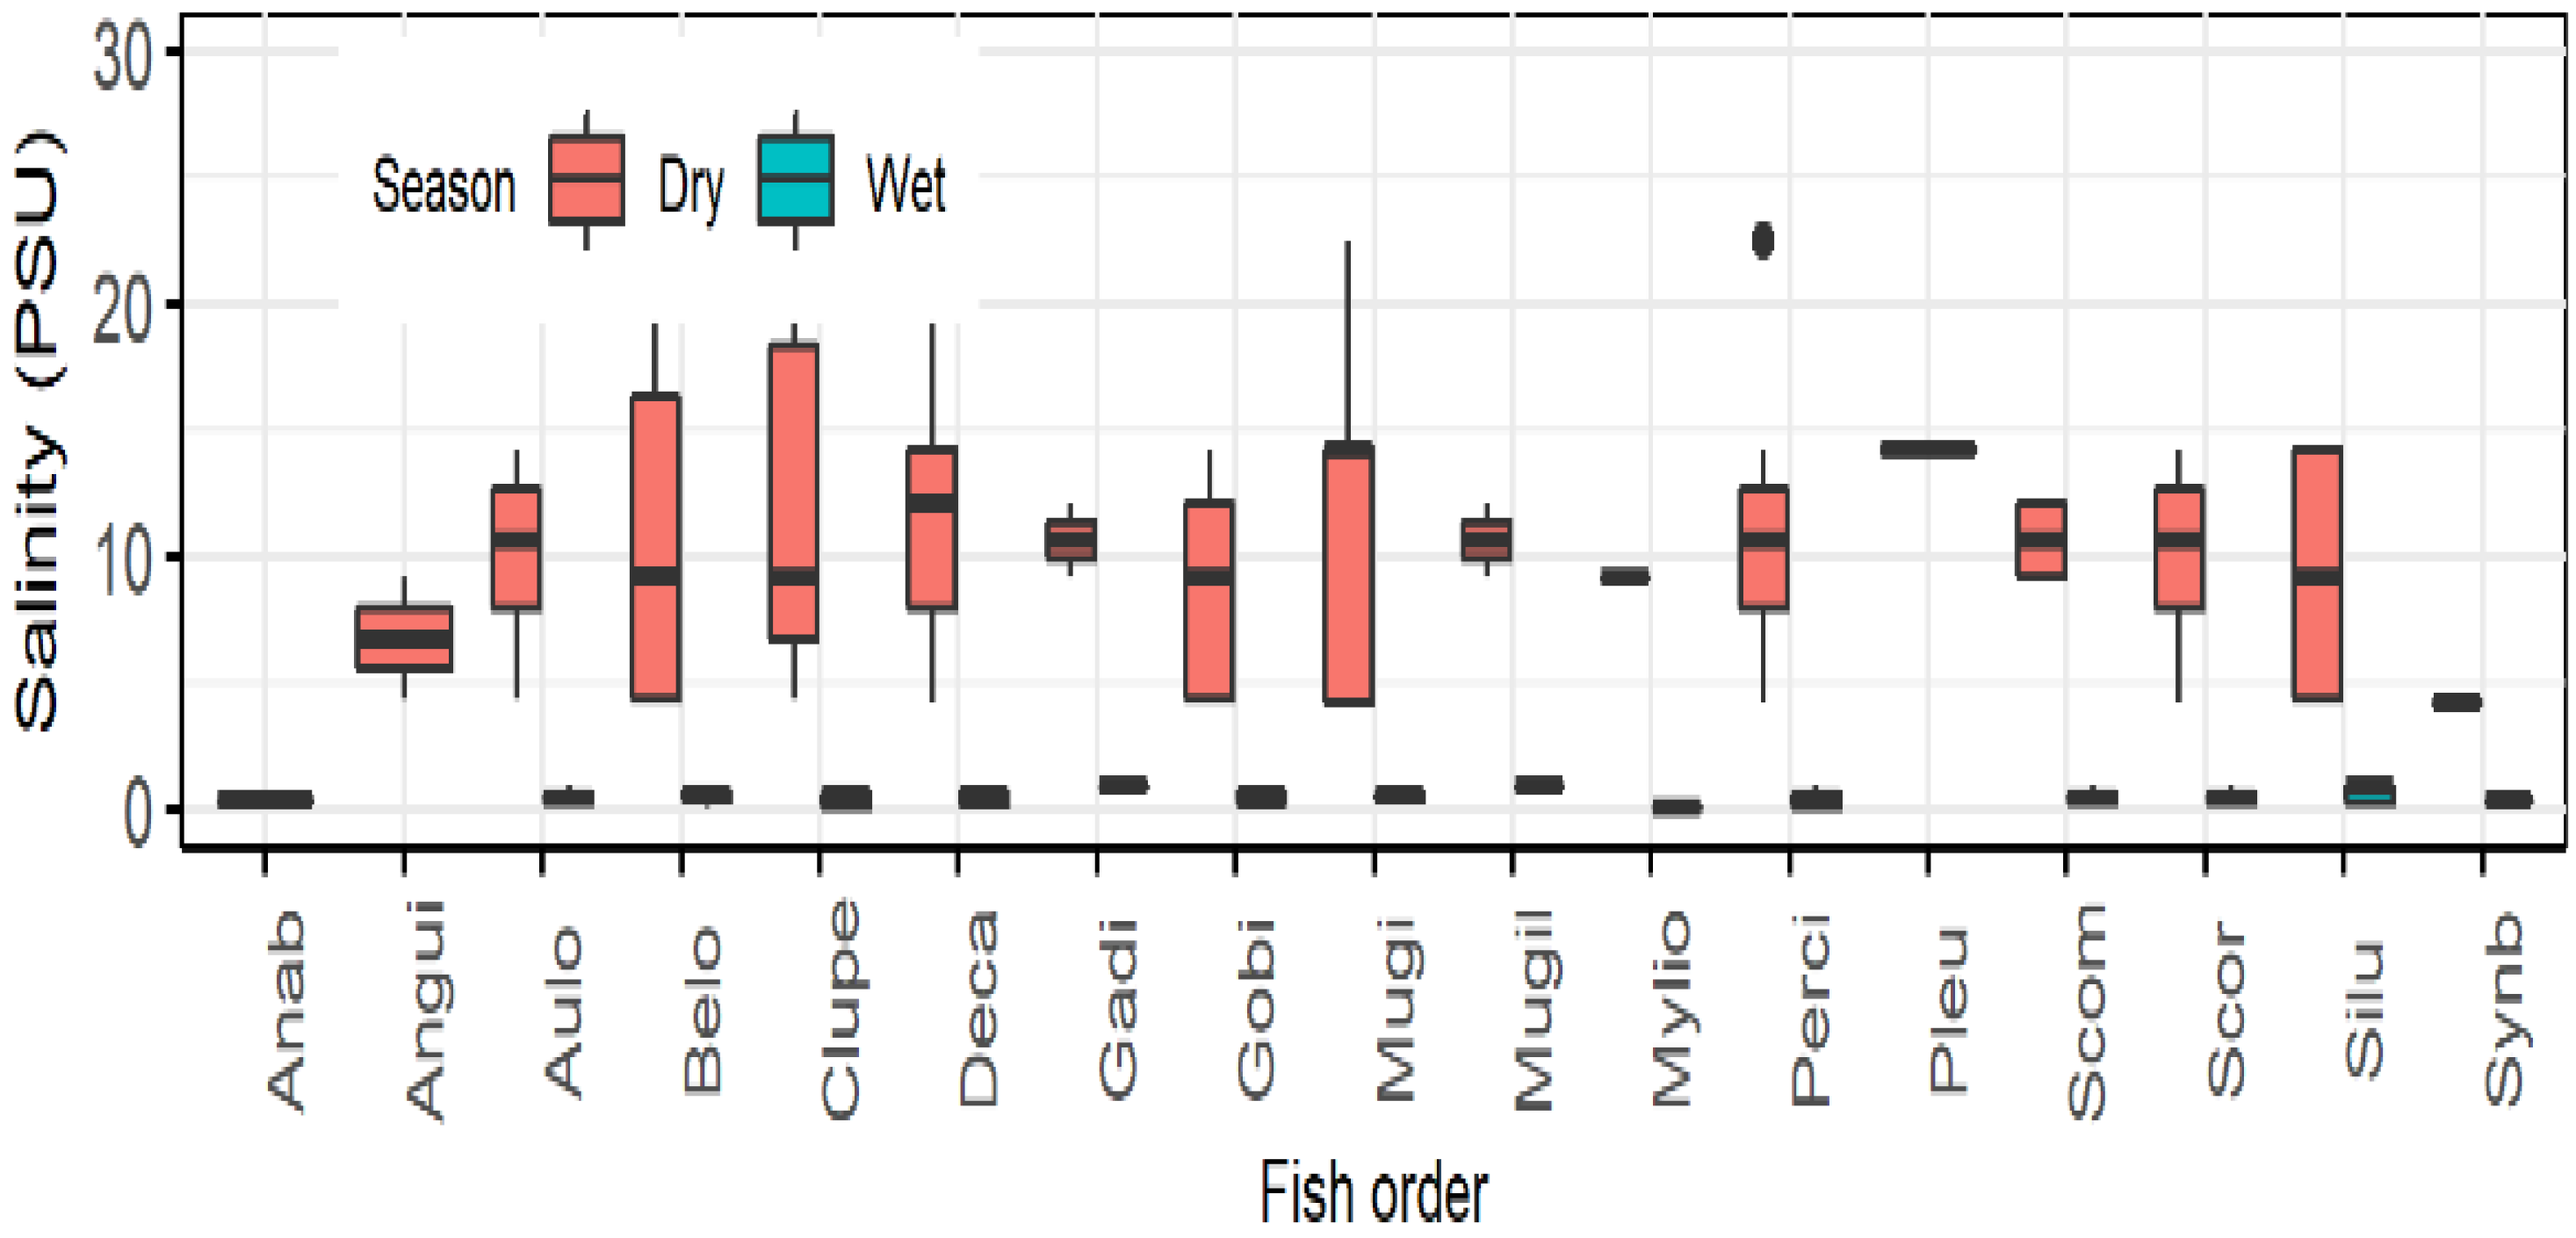
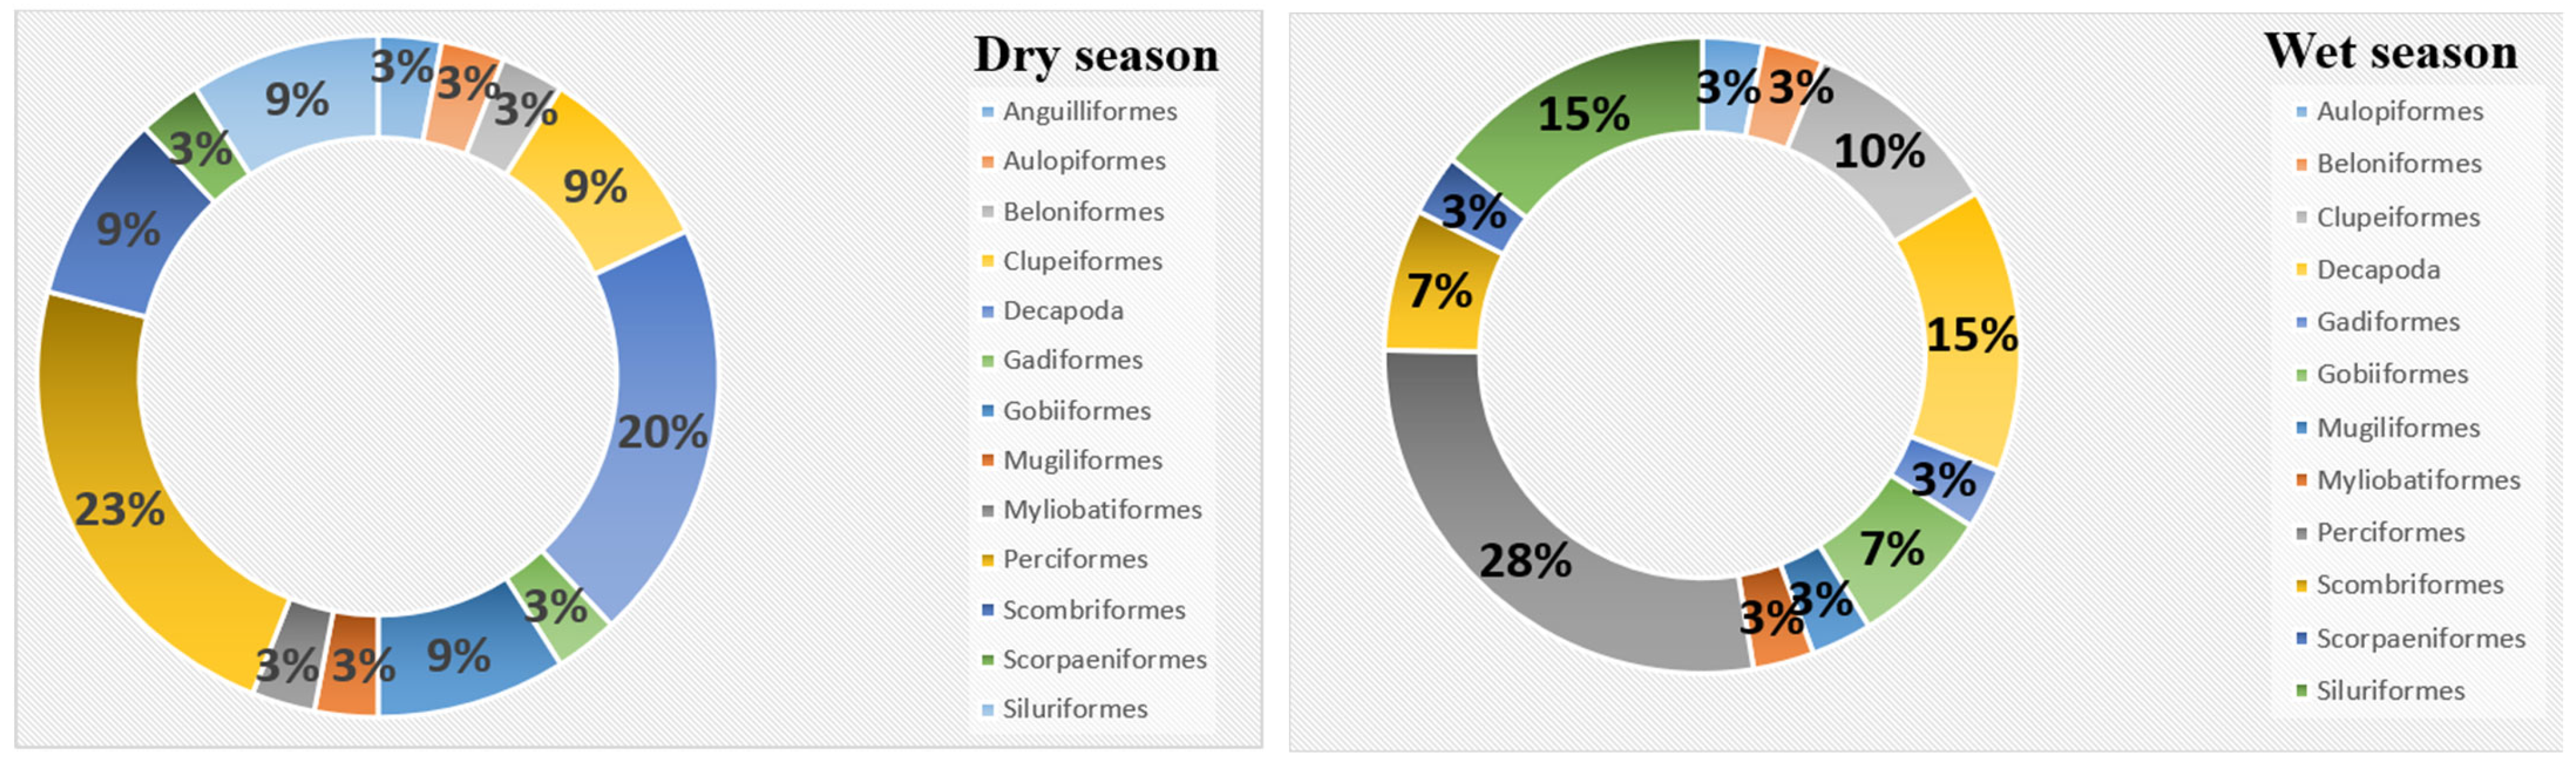
3.2. Fish Diversity and Distribution in Relation to Salinity in the Meghna River Estuary

A total of 38 fish species were found under 27 families and 13 orders, where 33 species were found during the dry season and 29 species were found during the wet season in the Meghna River estuary (MRE) (Table 2, Figure 4). Among these, Palaemonidae and Penaeidae were the dominant families during the dry season, and Oxudercidae was the most dominant family during the wet season. Among these orders, Perciformes and Decapoda were dominant during the dry season comprising 23% and 20%, respectively, of the total fish found during the dry season. Perciformes and Siluriformes were dominant during the wet season comprising 27% and 14% of the total fish species, respectively, found during that season. Aulopiformes, Beloniformes, Gadiformes, Mugiliformes and Myliobatiformes were the submissive orders during the wet season. H. nehereus, O. rubicundus and P. elongatus species were found in all the sampling months indicating that these fish are polyhaline (0.06~18.1 psu) species. A. japonica and A. gagora were abundant in brackish water conditions (0.35~14.2 psu). A. latus and S. phasa were found in freshwater conditions (0.06~0.11 psu).
Species identified during the wet season in the MRE are as follows: A. latus, B. walga, C. ramacarati, E. tetradactylum, G. morhua, G. giuris, H. nehereus, K. pelamis, L. calcarifer, M. nobilii, M. spinulatus, M. cephalus, M. gulio, O. rubicundus, O. pama, P. argenteus, P. hypophthalmus, P. monodon, P. indicus, P. canius, P. elongatus, S. argus, S. phasa, S. panijus, S. silondia, T. ilisha, T. curvirostris, T. lepturus and X. cancila (Table 2).
Recorded fish species from the orders Decapoda (4.0–13.5 psu), Mugiliformes (1.0–13.0 psu), Beloniformes (1.0–9.0 psu), Perciformes (1.0–12.5 psu), Clupeiformes (1.0–9.0 psu), Gobiiformes (1.5–9.0 psu), Siluriformes (1.5–8.5 psu), Aulopiformes (2.0–12.0 psu), Scorpaeniformes (2.5–12.5 psu) and Scombriformes (2.5–12.0 psu) were found to tolerate wide ranges of salinity. Meanwhile, fish species from the orders Gadiformes (6.0–11.0 psu) and Myliobatiformes (2.5–7.0 psu) were available in moderate ranges of salinity. However, Pleuronectifomes (14.0–14.5 psu), Anabantiformes (0.0–0.1 psu), Synbranchiformes (1.0–3.0 psu) and Anguiliformes (6.0–7.5 psu), were found in narrow ranges of salinity (Table 3, Figure 5).
Fish species from the orders Beloniformes, Clupeiformes, Decapoda, Gobiiformes, Mugiliformes and Siluriformes were found during the dry season when salinity was near to 18 psu (Figure 6). Fish species from the orders Anguiliformes, Aulopiformes, Gadiformes, Myliobatiformes, Perciformes, Pleuronectifomes, Scombriformes and Scorpaeniformes were also available during the dry season, but at that time salinity was comparatively lower (≃11 psu). However, Anabantiformes and Synbranchiformes were available mostly in fresh water during the wet season when the salinity was near to 0 psu.

3.3. Suitability Index for Mariculture of the Commercially Important Fisheries Species

Suitability for the mariculture of commercially important fish species was calculated using suitability indices of various environmental parameters (Table 4). The value of the suitability index for the Sea cucumber in the Meghna River estuary (MRE) was calculated; during the dry and wet season, the suitability index value was 0.5 and 0.3, respectively. The suitability index for scallop in the MRE was found to be 0.4 during both the dry and wet seasons, respectively. Clam and coral are important mariculture species. We found that the suitability index value for clam was 1.00 and 0.25 during the dry and wet seasons, respectively. However, the suitability index value for coral species was 1.00 and 0.25 during the dry and wet season, respectively. In the consideration of mussel, the suitability index value was found to be 0.25 during the dry season and 0.4 during the wet season.
Oyster is one of the most popular mariculture species, and they also have large economic value. In the study area, the suitability index values of oyster were in 0.8 during the dry season, whereas they were 0.4 during the wet season. Grey mullet is the most common and suitable species for culture in both saline water and fresh water. The suitability index value for the mariculture of Grey mullet was found to be 1.00 and 0.9 during the dry and wet seasons, respectively. Seaweed culture is very new culture in the Asian subcontinent. In Bangladesh, seaweed culture is still less popular. The suitability index value was found to be 0.5 during the dry season and 0.25 during the wet season. Mud crab is another common and popular species in Bangladesh, with a value of 0.8 during the wet season. Prawn (M. rosenbergii) is called white gold. Prawn is the most popular and demanding species. From the suitability index calculation, we found it to be 0.5 during the dry season in the study area. On the other hand, it was 1.00 during the wet season. Shrimp (P. monodon) is another commercially important species which contributes to our economy. The suitability index value was found to be 1.00 during the dry season, whereas it was 0.4 during the wet season. The suitability index value for M. vittatus was found to be 0.5 during the dry season and 0.75 during the wet season in the study area.

3.4. Fish Species Diversity Indices

In the study area, the highest Shannon–Weaver diversity index (H′), Pielou’s species evenness and Margalef’s species richness index value was observed in the dry season, where the lowest values were observed in the wet season (Table 5). Shannon–Weaver diversity index (H′) was measured 0.37 in the MRE (Table 5) which indicates a very poor diversity of fishes. The highest Shannon–Weaver diversity index value (0.33) was found during the dry winter season in the estuary due to low water volume, which results in less dilution.
The lowest value (0.25) was found during the rainy monsoon due to a high volume of water flow which results in more dilution. The lowest evenness value was 0.07 (wet season) and the highest value was 0.09 (dry season), which is exhibited in Table 5. The seasonal mean evenness value in the MRE was 0.11, which also indicates an unbalanced evenness of fish species in the MRE. The seasonal mean richness index (d) value was 8.0 in the MRE, whereas the highest value (7.9) was found during the dry summer due to a high concentration of nutrients. The species richness shows the lowest value (7.3) during the rainy monsoon.

4. Discussion

The rapid increase in human activity in the estuaries and coastal areas has increased the nutrient transport from land to sea in the past decades, resulting in environmental deterioration and changes to biogeochemical processes [64]. The quality of water is defined by its physical, chemical, and biological parameters, and all these characteristics directly or indirectly influence the survival and production of aquatic species [65]. The changes recorded in physico-chemical characteristics of the MRE clearly showed that the variability of the estuarine regime is mostly conditioned by seasonal changes. Seasonality brings about changes in water temperature, pH, salinity, DO and primary production in the estuary. Generally, rainfall plays an important role in seasonal cyclic phenomena in the tropical environment, causing important changes in the hydrology of the estuarine environment. In the present study, rainfall showed a good connection with changes in salinity and water temperature in this estuarine system [65]. Our results indicate two broad patterns of change: the brackish water expanding moderately to upstream during the dry season and the freshwater habitat expanding to downstream during the wet season. These changes will adversely affect many fish species, with significant impacts on their reproductive cycles, reproductive capacities, suitable spawning areas, feeding, breeding and longitudinal migration [6]. The key indicator of an estuary is its salinity profile. A general increase in water temperature in the wet season in the MRE could be the result of high solar radiation and higher atmospheric temperature, whereas the lower temperature in the dry season was due to foggy weather. The presence of higher pH in the wet season is probably induced by the photosynthesizing organisms and high biological activity of aquatic flora and fauna [66]. However, the lower pH during dry season might be linked to the low temperature and organic matter decomposition.
Chlorophyll-a constitutes the chief photosynthetic pigment of phytoplankton and acts as an index that provides the primary production potential, biodiversity, and biomass in an estuarine ecosystem [65]. Higher values of chlorophyll-a were observed during the wet season, which could be due to the high nutrients and higher phytoplankton abundance in the corresponding seasons [67]. A significant negative correlation was observed between chlorophyll-a and salinity (p < 0.05). The concentration of chlorophyll-a had a positive correlation with the concentrations of nitrate and temperature, but a negative correlation with salinity in this study, which was also reported by [68,69,70]. This indicates that if salinity increases, chlorophyll-a concentration decreases. It is natural for chlorophyll-a levels to fluctuate over time. Chlorophyll-a concentrations are often higher after rainfall, particularly if the rain has flushed nutrients into the water. In addition, chlorophyll-a also showed different spatial patterns during the two seasons. Dissolved inorganic nutrients such as nitrite, nitrate, ammonium, and phosphate are the major essential nutrients for the phytoplankton growth [71]. In an aquatic ecosystem, dissolved inorganic nitrogenous (DIN = NH4+ + NO3 + NO2) substances are therefore very much dependent on biological uptake and regeneration [72]. Among the DIN substances, the ammonia-nitrogen is preferentially used by plants and produced by the bacterial breakdown of organic matter and animal excretion. Dissolved nitrate (NO3), nitrite (NO2), and ammonium (NH4+) ions are the three major sources of nitrogen, which are required by phytoplankton; nitrate that is an important source of nitrogen is present in large quantities, and nitrite is present in much lower quantities [73]. In the present study, the higher ammonium concentration in the dry season could be linked to the death and decay of the species that are less tolerant of salinity [65].
However, salinity gradient was found to be a major factor that affects the diversity and distribution of various fish species in the middle coastal region of Bangladesh over different spatial and temporal scales. Fishes are the most studied group of species and the best indicators of geographical patterns. Due to water dynamic changes, salinity intrusion and other human activity limited the flow of nutrients, organisms, matter, energy, and genetic information in aquatic habitats [74]. Further analyses revealed that most species were saline water species. Different fish species prefer different ranges of salinity for growth, survival, feeding, breeding, nursing etc. throughout their life cycle. Similarly, thirteen fish orders were found under this study in the MRE. Among them, some orders of fish were found to tolerate a wide range of salinity, whereas others were found to tolerate moderate or narrow ranges of salinity. Fish species from the orders Anguiliformes, Aulopiformes, Gadiformes, Myliobatiformes, Perciformes, Pleuronectifomes, Scombriformes and Scorpaeniformes were also available during the dry season but, at that time, salinity was comparatively lower (≃11 psu). However, Anabantiformes and Synbranchiformes were available mostly in fresh water during the wet season when the salinity was near to 0 psu. Many studies have also found that the changes of environmental factors, such as dissolved oxygen, pH, water depth and turbidity, affected fish assemblages [75]. The results indicated that environmental factors also affected fish distributions and assemblage composition. Therefore, the probable decline in the biodiversity of freshwater, low-value, wild fish species with increased river salinity may have significant implications for the nutrition of the rural poor [6].
The suitability index value indicates that both grey mullet and mud crab species are suitable for mariculture in the Meghna River estuary during both the dry and wet seasons. In contrast, the value of suitability index indicates that sea cucumber, scallop, mussel, and seaweed species are unsuitable for mariculture during both the dry and wet seasons in the MRE. Clam, coral, oyster, and P. monodon are also an important mariculture species. Similarly, the suitability index value indicating that these species are suitable for mariculture in the MRE during the dry season only. On the other hand, M. rosenbergii, M. vittatus and M. gulio are also an important mariculture species. The suitability index value indicates that this species is suitable for mariculture in the MRE during the wet season only. The authors will try to consult our relevant ministry by combining the results of the study with our current studies, and by preparing a detailed report developing policies for the conservation and management of the aquatic resources in the coastal zone to enrich the blue economy.
Diversity indices are used to quantify the species diversity of a habitat. The higher the diversity index, the more diverse the site is. In the study area, the highest Shannon–Weaver diversity index (H′), Pielou’s species evenness, and Margalef’s species richness index value was observed in the dry season, where the lowest values were observed in the wet season. It indicates that fish species abundance was higher in the brackish water (0.35~14.2 psu) compared to freshwater (0.06~0.11 psu). The Shannon–Weaver diversity index value during dry winter resulted in a higher fish abundance in the study area. The lowest evenness value was 0.07 (wet season) and the highest value was 0.09 (dry season). In each case of the highest Shannon–Weaver (dry season), the diversity index was involved with a high number of individuals, and the lowest diversity (wet season) was involved with a low number of individuals. The seasonal mean evenness value in the MRE was 0.11, which also indicates an unbalanced evenness of fish species in the MRE. Our study revealed that the Shannon–Weaver diversity index (H’), Margalef and Pielou indices presented a significant difference between the dry and wet seasons of this study, as fish biodiversity was higher in the dry season compared to the wet season. Fish biodiversity had positively correlated with the Shannon–weaver index, Pielou’s evenness and Margalef’s index. Margalef’s richness is the simplest measure of biodiversity and is simply a count of the number of different species in a given area. Pielou’s evenness index (J’) measures the evenness in which individuals are divided among the taxa present [76]. Therefore, the species equitability index in the different months reveals that the distribution of the fish population of the Meghna River estuary is more or less equally distributed. Fish species richness is a good allusion of healthy fish diversity in the waters, which could be conserved. On the contrary, the poor availability status and decreasing trend of many fish species intimates the alarming situation of the fisheries resources. Furthermore, the current study also observed that the freshwater fish species are affected by a range of anthropogenic and natural threats.

5. Conclusions

The Meghna River estuary plays a significant role in maintaining and replenishing the fish resources. The results have further shown that fish composition and diversity have significant differences between the dry and wet seasons. The multivariate analysis showed a seasonal gradient for the water quality parameters, forming two different groups for the dry and wet seasons. The results showed that salinity, chlorophyll-a and water temperature significantly affected fish distribution and assemblage composition. Overall, 31 fish species were identified in the study area where 33 species were found during the dry season and 29 species were found during the wet season. Among them, H. nehereus, O. rubicundus and P. elongatus were found as polyhaline. A. japonica and A. gagora were abundant in brackish water conditions. However, A. latus and S. phasa were found in freshwater conditions (0.06~0.11 psu). Commercially important species such as L. parsia, M. rosenbergii, M. cephalus, P. monodon and S. serrata, which prefer higher salinity for their growth, survival, feeding, nursing, and breeding purposes, are feasible for mariculture during the dry season (January–May) when water salinity is comparatively higher. On the contrary, A. Latus, P. canius and S. phasa are feasible during the wet season when water salinity is low. Thus, the conservation of fish has become urgent, and an integrated coastal management plan should be developed and effectively implemented to enrich our blue economy.

Author Contributions

Conceptualization, D.C.S.; data curation, S.A. and J.H.; formal analysis, J.H. and D.C.S.; investigation, D.C.S.; J.H.; methodology, S.A., J.H.; S.R.K. and D.C.S.; resources, D.C.S.; visualization, D.C.S.; writing—original draft, S.A.; S.R.K. and J.H.; writing—review and editing, M.J.R.; M.A.W.; M.N.; F.H.; J.H. and D.C.S. All authors have read and agreed to the published version of the manuscript.

Funding

This research was carried out under a sub-project of Enhanced Coastal Fisheries in Bangladesh (ECOFISH-BD) activity, which is funded by the United States Agency for International Development (USAID) and jointly implemented by the WorldFish, Bangladesh and South Asia Office, and the Department of Fisheries (DOF), Bangladesh. This sub-project was under the collaborative agreement among WorldFish, Department of Fisheries Management, Bangabandhu Sheikh Mujibur Rahman Agricultural University, Gazipur 1706, and a part of the ECOFISH-BD project activity. Sub-grant agreement no: PLA12258.

Institutional Review Board Statement

Not applicable.

Informed Consent Statement

Not applicable.

Data Availability Statement

The datasets used and analyzed during the current study will be provided on request to the corresponding author.

Acknowledgments

The authors are thankful to the Department of Fisheries Management, Bangabandhu Sheikh Mujibur Rahman Agricultural University, Gazipur, for providing laboratory facilities and ECOFISH-II, WorldFish, Bangladesh for their funding.

Conflicts of Interest

The authors declare no conflict of interest.

References

  1. Valle-Levinson, A. Contemporary Issues in Estuarine Physics; Cambridge University Press: Cambridge, UK, 2010. [Google Scholar]
  2. Shaha, D.C.; Cho, Y.K. Salt plug formation caused by decreased river discharge in a multi-channel estuary. Sci. Rep. 2016, 6, 27176. [Google Scholar] [CrossRef] [PubMed]
  3. Rahman, M.M.; Hassan, M.Q.; Islam, M.S.; Shamsad, S.Z.K.M. Environmental impact assessment on water quality deterioration caused by the decreased Ganges outflow and saline water intrusion in south-western Bangladesh. Environ. Geol. 2000, 40, 31–40. [Google Scholar] [CrossRef]
  4. Akhter, S.; Hasan, M.; Khan, Z.H. Impact of climate change on saltwater intrusion in the coastal area of Bangladesh. In Proceedings of the Eighth International Conference on Coastal and Port Engineering in Developing Countries, Chennai, India, 20–24 February 2012; pp. 20–24. [Google Scholar]
  5. Montagna, P.; Palmer, P.; Pollack, J. Hydrological Changes and Estuarine Dynamics. Springer Briefs Environ. Sci. 2013, 8, 94. [Google Scholar]
  6. Dasgupta, S.; Huq, M.; Mustafa, M.G.; Sobhan, M.I.; Wheeler, D. The impact of aquatic salinization on fish habitats and poor communities in a changing climate: Evidence from southwest coastal Bangladesh. Ecol. Econ. 2017, 139, 128–139. [Google Scholar] [CrossRef] [Green Version]
  7. Venancio, C.; Castro, B.B.; Ribeiro, R.; Antunes, S.C.; Abrantes, N.; Soares, A.M.V.M.; Lopes, I. Sensitivity of freshwater species under single and multigenerational exposure to seawater intrusion. Philos. Trans. R. Soc. B 2019, 374, 20180252. [Google Scholar] [CrossRef] [Green Version]
  8. Canedo-Arguelles, M.; Hawkins, C.P.; Kefford, B.J.; Schäfer, R.B.; Dyack, B.J.; Brucet, S.; Timpano, A.J. Saving freshwater from salts. Science 2016, 351, 914–916. [Google Scholar] [CrossRef]
  9. Nicholls, R.J.; Cazenave, A. Sea-level rise and its impact on coastal zones. Science 2010, 328, 1517–1520. [Google Scholar] [CrossRef]
  10. Farnandes, J.A.; Kay, S.H.; Mostafa, A.R.; Ahmed, M.; Cheung, W.W.L.; Lazar, A.N.; Barange, M. Projecting marine fish production and catch potential in Bangladesh in the 21st century under long-term environmental change and management scenario. ICES J. Mar. Sci. 2015, 73, 1357–1369. [Google Scholar] [CrossRef] [Green Version]
  11. Rabbi, M.F.; Ahmed, E. Environmental degradation of the southwest region of Bangladesh and need for a barrage on the Ganges. In Proceedings of the International Conference on Large Scale Water Resources Development in Developing Countries: New Dimensions of Prospects and Problems, Kathmandu, Nepal, 20–23 October 1997. [Google Scholar]
  12. Hossain, M.S.; Das, N.G.; Chowdhury, M.S.N. Fisheries Management of the Naaf River; Chittagong, Coastal and Ocean Research Group of Bangladesh: Chittagong, Bangladesh, 2007; p. 257. [Google Scholar]
  13. Nabi, M.R.U.; Mamun, M.A.A.; Ullah, M.H.; Mustafa, M.G. Temporal and spatial distribution of fish and shrimp assemblage in the Bakkhali river estuary of Bangladesh in relation to some waterquality parameters. Mar. Biol. Res. 2011, 7, 436452. [Google Scholar]
  14. Hossain, M.S.; Das, N.G.; Sarker, S.; Rahaman, M.Z. Fish diversity and habitat relationship with environmental variables at Meghna river estuary, Bangladesh. Egypt. J. Aquat. Res. 2012, 38, 213–226. [Google Scholar] [CrossRef] [Green Version]
  15. Islam, S.N.; Gnauck, A. Water shortage in the Gorai river basin and damage of mangrove wetland ecosystems in Sundarbans, Bangladesh. In Proceedings of the 3rd International Conference on Water & Food Management (ICWFM-2011), Dhaka, Bangladesh, 8–10 January 2011; pp. 8–10. [Google Scholar]
  16. Mirza, M.M.Q. The Ganges water diversion: Environmental effects and implications an introduction. J. Hydrol. 2004, 44, 214–223. [Google Scholar]
  17. Otero, P.; Ruiz-Villarreal, M.; Peliz, A.; Cabanas, J.M. Climatology and reconstruction of runoff time series in northwest Iberia: Influence in the shelf buoyancy budget off Ria de Vigo. Sci. Mar. 2010, 74, 247–266. [Google Scholar] [CrossRef]
  18. Ahsan, M.E. Coastal Zone of Bangladesh: Fisheries Resources and Its Potentials; Lap LAMBERT Academic Publishing: Chisinau, Republic of Moldova, 2013. [Google Scholar]
  19. Hanif, M.A.; Siddik, M.A.B.; Chaklader, M.R.; Nahar, A.; Mahmud, S. Fish diversity in the southern coastal waters of Bangladesh: Present status, threats and conservation perspectives. Croat. J. Fish. Ribar. 2015, 73, 148–161. [Google Scholar] [CrossRef]
  20. Hach Company. Water Analysis Handbook Hach Company, 7th ed.; Hach Company: Loveland, CO, USA, 2012. [Google Scholar]
  21. Parsons, T.R.; Maita, Y.; Lalli, C.M. A Manual of Chemical and Biological Methods for Seawater Analysis; Pergamon Press: Oxford, UK, 1984; p. 173. [Google Scholar]
  22. Hu, M.; Wang, C.; Liu, Y.; Zhang, X.; Jian, S. Fish species composition, distribution and community structure in the lower reaches of Ganjiang River, Jiangxi, China. Sci. Rep. 2019, 9, 10100. [Google Scholar] [CrossRef] [PubMed] [Green Version]
  23. Krishnan, A.; Das, R.; Vimexen, V. Seasonal phytoplankton succession in Netravathi–Gurupura estuary, Karnataka, India: Study on a three tier hydrographic platform. Estuar. Coast. Shelf Sci. 2020, 242, 106830. [Google Scholar]
  24. Brown, A.R.; Daniels, C.; Jeffery, K.; Tyler, C.R.; Brown, A.R.; Daniels, C.; Tyler, C.R. Developing general rules to facilitate evidence-based policy for mariculture development in and around Marine Protected Areas (MPAs) in England. In Final Report to Research England (Strategic Priorities Fund); Strategic Priorities Fund: London, UK, 2020. [Google Scholar]
  25. Pinheiro, J.; Bates, D.; Deb, R.S.; Sarkar, D.; R Core Team. Linear and Nonlinear Mixed Effects Models, R Package Version; Springer: Berlin/Heidelberg, Germany, 2007; Volume 3, pp. 1–89. [Google Scholar]
  26. Galili, T.; Callaghan, A.O.; Sidi, J.; Sievert, C. Heatmaply: An R package for creating interactive cluster heatmaps for online publishing. Bioinformatics 2018, 34, 1600–1602. [Google Scholar] [CrossRef]
  27. Le, S.; Josse, J.; Husson, F. FactoMineR: An R package for multivariate analysis. J. Stat. Softw. 2008, 25, 1–18. [Google Scholar] [CrossRef] [Green Version]
  28. Chen, J.; Zhou, F.; Huang, J.; Ma, Z.; Jiang, S.; Qiu, L.; Qin, J.G. Ammonia and salinity tolerance of P. monodon across eight breeding families. Springer Plus 2016, 5, 171. [Google Scholar] [CrossRef] [Green Version]
  29. Tuwo, A.; Tresnati, J. Sea Cucumber Farming in Southeast Asia (Malaysia, Philippines, Indonesia, Vietnam). In Echinoderm Aquaculture; John Wiley & Sons, Inc.: New York, NY, USA, 2015; pp. 331–352. [Google Scholar]
  30. Laing, I. Effect of salinity on growth and survival of king scallop spat (Pecten maximus). Aquaculture 2002, 205, 171–181. [Google Scholar] [CrossRef]
  31. Morse, D.L.; Cowperthwaite, H.S.; Perry, N.; Britsch, M. Methods and Materials for Aquaculture Production of Sea Scallops (Placopecten magellanicus). National Oceanic and Atmospheric Administration, 2020, 1–12. Available online: https://repository.library.noaa.gov/view/noaa/38586 (accessed on 20 May 2022).
  32. Ellis, S. Nursery and Grow-Out Techniques for Giant Clams (Bivalvia: Tridacnidae); Center for Tropical and Subtropical Aquaculture: Waimanalo, HI, USA, 2000; p. 99. [Google Scholar]
  33. Hadley, N.H.; Whetstone, J.M. Hard clam hatchery and nursery production. South. Reg. Aquac. Cent. Publ. 2007, 4301, 1–8. [Google Scholar]
  34. Narasimham, K.A.; Laxmilatha, P. Clam culture. CMFRI Bull.-Artif. Reefs Seafar. Technol. 1996, 48, 76–87. [Google Scholar]
  35. Monwar, M.M.; Sarker, A.R.A.; Das, N.G. Polyculture of seabass with tilapia for the utilization of brown fields in the coastal areas of Cox’s Bazar, Bangladesh. Int. J. Fish. Aquac. 2013, 6, 104–109. [Google Scholar]
  36. Haque, M.A.; Hossain, M.I.; Uddin, S.A.; Dey, P.K. Review on distribution, culture practices, food and feeding, brood development and artificial breeding of Seabass, Lates calcarifer (BLOCH 1790): Bangladesh perspective. Res. Agric. Livest. Fish. 2019, 6, 405–414. [Google Scholar] [CrossRef]
  37. Ahmed, A.; Akter, N.; Hasan, S.; Ataullah, M. Spatio-temporal variations of water quality and phytoplankton diversity of the different rivers flowing within the Sundarbans mangrove wetland ecosystem of Bangladesh. J. Biodivers. Conserv. Bio-Resour. Manag. 2019, 5, 61–76. [Google Scholar] [CrossRef]
  38. Hoque, N.; Shakil, A.; Sultana, F.; Wahab, M.; Rahman, M.; Nahidujjaman, M.; Asaduzzaman, M. Feasibility study of green mussel Perna viridis farming in the south-east Bangladesh coast of the Bay of Bengal. J. Indian Soc. Coast. Agric. Res. 2021, 39, 195–205. [Google Scholar] [CrossRef]
  39. Prema, D. Site selection and water quality in mariculture. In CMFRI Manual Customized Training Book. Karala; Central Marine Fisheries Research Institute: Kochi, India, 2013; pp. 36–39. [Google Scholar]
  40. Wilson, C.; Scotto, L.; Scarpa, J.; Volety, A.; Laramore, S.; Haunert, D. Survey of water quality, oyster reproduction and oyster health status in the St. Lucie Estuary. J. Shellfish. Res. 2005, 24, 157–165. [Google Scholar]
  41. Rybovich, M.; La Peyre, M.K.; Hall, S.G.; La Peyre, J.F. Increased temperatures combined with lowered salinities differentially impact oyster size class growth and mortality. J. Shellfish. Res. 2016, 35, 101–113. [Google Scholar] [CrossRef]
  42. Aypa, S.M. Mussel culture. Food and Agriculture Organization of the United Nations (FAO) 1990, Chapter 4. Available online: http://www.fao.org/3/ab737e/AB737E04.htm (accessed on 11 January 2019).
  43. Mandal, S.K. A Note on Salinity Tolerance of L. parsia HAM. J. Ichthyol. 1987, 46, 534–544. [Google Scholar]
  44. Joseph, S. Different species used for coastal pond farming in India. Aquaculture 2015, 30, 178–285. [Google Scholar]
  45. Siddiqui, A.A.M.; Kashem, M.A.; Mondal, M.A.I.; Shafiuddin, M. Commercially important seaweed cultivation and its potentials for the coastal areas of Cox’s Bazar, Bangladesh. Int. J. Fish Aquac. Study 2019, 7, 463–470. [Google Scholar]
  46. Shelley, C.; Lovatelli, A. Mud Crab Aquaculture: A Practical Manual. In FAO Fisheries and Aquaculture Technical Paper; FAO: Rome, Italy, 2011; Volume 567, p. I. [Google Scholar]
  47. Davenport, J.; Wong, T.M. Responses of adult mud crabs (Scylla serrata) (Forskal) to salinity and low oxygen tension. Comp. Biochem. Physiol. Part A Physiol. 1987, 86, 43–47. [Google Scholar] [CrossRef]
  48. Tran, N.H.; Nguyen, T.P.; Le, Q.V.; Huynh, K.H.; Do, T.T.H. Giant freshwater prawn (M. rosenbergii de Man, 1879) farming in brackish water areas of the Mekong Delta, Vietnam. Can Tho University. J. Sci. 2017, 7, 82–90. [Google Scholar]
  49. Chand, B.K.; Trivedi, R.K.; Dubey, S.K.; Rout, S.K.; Beg, M.M.; Das, U.K. Effect of salinity on survival and growth of giant freshwater prawn M. rosenbergii (de Man). Aquac. Rep. 2015, 2, 26–33. [Google Scholar] [CrossRef] [Green Version]
  50. Cardona, L. Effects of salinity on the habitat selection and growth performance of Mediterranean flathead grey mullet M. cephalus (Osteichthyes, Mugilidae). Estuar. Coast. Shelf Sci. 2000, 50, 727–737. [Google Scholar] [CrossRef]
  51. Karim, E.; Haque, M.A.; Shahabuddin, M.; Rahman, M.J.; Rahman, M.M. Effects of supplementary feeds on growth and survival of stripe mullets (Mugil cephalus) in outdoor cistern ponds of MFTS, Cox’s Bazar. Int. J. Anim. Fish. Sci. 2012, 5, 428–432. [Google Scholar]
  52. Shailender, M.; Suresh Babu, C.H.; Srikanth, B.; Kishor, B.; Silambarasan, D.; Jayagopal, P. Sustainable culture method of giant black tiger shrimp, Penaeus monodon (Fabricius) in Andhra Pradesh, India. J. Agric. Vet. Sci. 2012, 1, 12–16. [Google Scholar]
  53. Choudhury, H.A. Polyculture System of Thai pangus at Alpha Fisheries, Trishal, Mymensingh. In Unpublished Master’s Thesis; Bangladesh Agricultural University: Mymensingh, Bangladesh, 2000. [Google Scholar]
  54. Sayeed, M.A.B.; Hossain, G.S.; Mistry, S.K.; Huq, K.A. Growth performance of Thai pangus (Pangasius hypophthalmus) in polyculture system using different supplementary feeds. Univ. J. Zool. Rajshahi Univ. 2008, 27, 59–62. [Google Scholar] [CrossRef] [Green Version]
  55. Ruby, M.; Michael, M.G.; Mario, V. Pangasius juveniles tolerate moderate salinity in test. Glob. Aquac. Alliance 2016, 67, 218–223. [Google Scholar]
  56. Lalramchhani, C.; Balasubramanian, C.P.; Panigrahi, A.; Ghoshal, T.K.; Das, S.; Shyne Anand, P.S.; Vijayan, K.K. Polyculture of Indian white shrimp (P. indicus) with milkfish (Chanos chanos) and its effect on growth performances, water quality and microbial load in brackishwater pond. J. Coast. Res. 2019, 86, 43–48. [Google Scholar] [CrossRef]
  57. Kumlu, M.; Jones, D.A. Salinity tolerance of hatchery-reared post larvae of P. indicus H. Milne Edwards originating from India. Aquaculture 1995, 130, 287–296. [Google Scholar] [CrossRef]
  58. Mondal, A.; Chakravartty, D.; Zaman, S. Feeding Ecology with Prey Electivity and Growth Performance of Indigenous Asian Striped Dwarf Catfish, M. vittatus (Bloch, 1794) in Low Saline Earthen Ponds of Indian Sundarbans. Ann. Mar. Sci. 2017, 1, 032–038. [Google Scholar] [CrossRef]
  59. Arunachalam, S.; Reddy, S.R. Food intake, growth, food conversion, and body composition of catfish exposed to different salinities. Aquaculture 1979, 16, 163–171. [Google Scholar] [CrossRef] [Green Version]
  60. Hossain, M.M.; Ahamed, S.; Mostafiz, M.; Akter, T.; Hassan, M.M.; Islam, M.A.; Islam, M.M. Polyculture of M. gulio (Hamilton 1822) in salinity intrusion prone areas of Bangladesh. Bangladesh J. Fish. 2019, 31, 91–99. [Google Scholar]
  61. Bhaumik, U.; Sharma, A.P. The fishery of Indian Shad (T. ilisha) in the Bhagirathi-Hooghly river system. Fish. Chimes 2011, 31, 21–27. [Google Scholar]
  62. Jorgensen, S.E.; Xu, F.L.; Salas, F.; Marques, J.C. Application of indicators for the assessment of ecosystem health. Handb. Ecol. Indic. Assess. Ecosyst. Health 2005, 2, 5–65. [Google Scholar]
  63. Smith, B.; Wilson, J.B. A consumer’s guide to evenness indices. Oikos 1996, 76, 70–82. [Google Scholar] [CrossRef]
  64. Li, R.H.; Liu, S.M.; Li, Y.W.; Zhang, G.L.; Ren, J.L.; Zhang, J. Nutrient dynamics in tropical rivers, lagoons, and coastal ecosystems of eastern Hainan Island, South China Sea. Biogeosciences 2014, 11, 481–506. [Google Scholar] [CrossRef] [Green Version]
  65. Saifullah, A.S.M.; Kamal, A.H.M.; Idris, M.H.; Rajaee, A.H.; Bhuiyan, M.K.A.; Hoque, M.N. Inter-linkage among some physico-chemical and biological factors in the tropical mangrove estuary. Zool. Ecol. 2016, 26, 141–149. [Google Scholar] [CrossRef]
  66. Sridhar, R.T.; Thangaradjou, S.; Kumar, S.; Kannan, L. Water Quality and the Phytoplankton Characteristics in the Palk Bay, South East Coast of India. J. Environ. Biol. 2006, 27, 561–566. [Google Scholar]
  67. Rajasekar, K.T.; Rajkumar, M.; Jun, S.; Prabu, A.; Perumal, P. Seasonal Variations of Phytoplankton Diversity in the Coleroon Coastal Waters, Southeast Coast of India. Acta Oceanol. Sin. 2010, 29, 97–108. [Google Scholar]
  68. Macedo, M.; Duarte, P.; Mendes, P.; Ferreira, J.G. Annual variation of environmental variables, phytoplankton species composition and photosynthetic parameters in a coastal lagoon. J. Plankton Res. 2001, 23, 719–732. [Google Scholar] [CrossRef]
  69. Yin, K. Monsoonal influence on seasonal variations in nutrients and phytoplankton biomass in coastal waters of Hong Kong in the vicinity of the Pearl River estuary. Mar. Ecol. Prog. Ser. 2002, 245, 111–122. [Google Scholar] [CrossRef] [Green Version]
  70. Verity, P.G.; Blanton, J.O.; Amft, J.; Barans, C.; Knott, D.; Stender, B.; Wenner, E. Influences of physical oceanographic processes on chlorophyll distributions in coastal and estuarine waters of the South Atlantic Bight. J. Mar. Res. 1998, 56, 681–711. [Google Scholar] [CrossRef]
  71. Dyer, K. Coastal and Estuarine Sediment Dynamics; John Wiley Sons: Chichester, UK, 1986; p. 358. [Google Scholar]
  72. Flynn, K.J.; Butler, I. Nitrogen sources for the growth of marine microalgae: Role of dissolved free amino acids. Mar. Ecol. Prog. Ser. 1986, 34, 281–304. [Google Scholar] [CrossRef]
  73. Boney, A.D. Phytoplanktons; Edward, Arnold Company: London, UK, 1983. [Google Scholar]
  74. Guo, Q.; Liu, X.; Ao, X.; Qin, J.; Wu, X.; Ouyang, S. Fish diversity in the middle and lower reaches of the Ganjiang River of China: Threats and conservation. PLoS ONE 2018, 13, e0205116. [Google Scholar] [CrossRef] [Green Version]
  75. Matthews, W.J.; Hill, L.G. Influence of physico-chemical factors on habitat selection by red shiners, Notropis lutrensis (Pisces: Cyprinidae). Copeia 1979, 1, 70–81. [Google Scholar] [CrossRef] [Green Version]
  76. Siddique, M.A.B.; Hussain, M.A.; Flowra, F.A.; Alam, M.M. Assessment of fish fauna in relation to biodiversity indices of Chalan Beel, Bangladesh. Int. J. Aquat. Biol. 2016, 4, 345–352. [Google Scholar]
Figure 1. Map of the study area.
Conservation 02 00028 g001
Figure 2. Principal component analysis (PCA) showed that water temperature, salinity and chlorophyll-a had a significant effect on fish distribution and assemblage composition.
Conservation 02 00028 g002
Figure 3. Dendrogram showing clustering of the water quality parameters and fish orders found in the MRE (Tem: Temperature, NO3: Nitrate, Chla: Chlorophyll-a, Clupe: Clupeiformes, Aulo: Aulopiformes, Scom: Scombriformes, Gadi: Gadiformes, Angui: Anguiliformes, Mylio: Myliobatiformes, Gobi: Gobiiformes, Silu: Siluriformes, Mugil: Mugiliformes, Pleu: Pleuronectiformes, Scor: Scorpaeniformes, Belo: Beloniformes, Synb: Synbranchiformes, Anab: Anabantiformes, Perci: Perciformes, Deca: Decapoda, PO43−: Phosphate, NH4+: Ammonia, Sal: Salinity, NO2: Nitrite and DO: Dissolved oxygen).
Conservation 02 00028 g003
Figure 4. Percentage orders of fish species in the MRE during the dry and wet seasons.
Conservation 02 00028 g004
Figure 5. Fish orders availability with salinity variation. Note: the top, bottom and middle lines of the Box plot represent the upper quartile, the lower quartile and the median, respectively; the black spot represents the percentiles; the vertical part of the box body extending upward and downward represents the range of data distribution.
Conservation 02 00028 g005
Figure 6. Seasonal distribution of fish orders with salinity variation. Note: the top, bottom and middle lines of the Box plot represent the upper quartile, the lower quartile and the median, respectively; the black spot represents the percentiles; the vertical part of the box body extending upward and downward represents the range of data distribution (Anab: Anabantiformes, Angui: Anguiliformes, Aulo: Aulopi-formes, Belo: Beloniformes, Clupe: Clupeiformes, Deca: Decapoda, Gadi: Gadiformes, Gobi: Gobiiformes, Mugil: Mugiliformes, Mylio: Myliobatiformes, Perci: Perciformes, Pleu: Pleuronectiformes, Scom: Scombriformes, Scor: Scorpaeniformes, Silu: Siluriformes, Synb: Synbranchiformes).
Conservation 02 00028 g006
Table 1. Water quality parameter of the Meghna River estuary.
ParameterDry SeasonWet Seasonp Value
Temperature °C 24.67 ± 5.3428.39 ± 1.24p < 0.05
Salinity (psu)10.59 ± 6.370.46 ± 0.12p < 0.05
DO (mg/L)7.94 ± 1.237.32 ± 0.26p < 0.05
pH7.87 ± 0.237.98 ± 0.17p > 0.05
Chlorophyll-a (µg/L)3.81 ± 1.087.57 ± 3.27p < 0.05
Nitrate (mg/L)0.03 ± 0.0020.14 ± 0.001p < 0.05
Nitrite (mg/L)0.01 ± 0.0010.01 ± 0.003p > 0.05
Ammonia (mg/L)0.52 ± 0.200.20 ± 0.04p < 0.05
DIN (mg/L)0.55 ± 0.230.35 ± 0.05p < 0.05
DIP (mg/L)0.43 ± 0.050.36 ± 1.24p > 0.05
Table 2. Salinity tolerance level of fish species found in the Meghna River estuary (MRE).
SL
No
Scientific NameLocal NameSalinity (psu) of Observed Months and SeasonsSalinity (psu)
for Individual
Species
February 21March 21June 21September 21November 21DryWet
0.35–14.20.6–18.070.06–9.80.06–0.110.14–3.20.35~18.10.06~3.2
Trichiuridae Family
01Trichiurus lepturusChuri++ + ++0.06~18.1
Anguillidae Family
02A. japonicaKuchia+ + + 0.35~14.2
Ariidae Family
03A. gagoraGagra tengra+ + 0.35~14.2
Palaemonidae Family
04Macrobrachium dolichodactylusGoda chingri+++ + 0.35~18.1
05M. rosenbergiiGolda chingri + + 0.6~18.1
06Macrobrachium nobiliiLal icha + +++0.06~9.8
Bagridae Family
07M. gulioGulia+ ++++0.06~14.2
Clupeidae Family
08Tenualosa ilishaIlish+ ++++0.06~14.2
09Escualosa thoracataBoccha+ + + 0.06~14.2
Belonidae Family
10Xenentodon cancilaKakila +++++0.06~9.8
Schilbeidae Family
11Silonia silondiaShillong ++ +0.06~3.2
Lactariidae Family
12Lactarius lactariusParava+ + + 0.06~9.8
Platycephalidae Family
13Platycephalus indicusChota bele++ ++++0.06~18.1
Penaeidae Family
14Trachysalambria curvirostrisKharkharia chingri++ + ++0.06~18.1
15Metapenaeus spinulatusLalia/chama chingri++ + ++0.06~18.1
16P. monodonBagda ++ +++0.06~18.1
Synodontidae Family
17H. nehereusLoitta+++++++0.06~18.1
Sciaenidae Family
18Otolithoides pamaBhola/Poa++ + ++0.06~18.1
Polynemidae Family
19Polynemus paradiseusRicksha++ + 0.35~18.1
20Eleutheronema tetradactylumTarail ++ +++0.06~18.1
Mugilidae Family
21M. cephalusBata++ +++0.14~18.1
Latidae Family
22L. calcariferCoral + ++++0.06~18.1
Sparidae Family
23Acanthopagrus latusDatina/Java bhola + +0.06~0.11
Scombridae Family
24Katsuwonus pelamisRupsha++ +++0.14~18.1
25Scomberomorus guttatusSurmai + + 0.6~18.1
Sillaginidae Family
26Sillaginopsis panijusTular dandi ++++++0.06~18.1
Gadidae Family
27Gadus morhuaTara fish++ +++0.14~18.1
Engraulidae Family
28S. phasaPhasa + +0.06~0.11
29Colia ramacaratiOula +++++0.06~9.8
Plotosidae Family
30Pethia caniusKain magur + +0.14~3.2
Pangasiidae Family
31Pangasianodon hypophthalmusSamudrik pangas + +++0.06~9.8
Sactophagidae Family
32Scatophagus argusChitra++ + ++0.06~18.1
Gobiidae Family
33Glossogobius giurisBailla/Bele ++ +0.06~3.2
Oxudercidae Family
34O. rubicundusLal chewa+++++++0.06~18.1
35Apocryptes batoChiring+++ + 0.06~18.1
36P. elongatusChewa/chemu+++++++0.06~18.1
Stromateidae Family
37Pampus argenteusFoli chanda+ + ++0.06~14.2
Dasyatidae Family
38Brevitrygon walgaShapla pata+ + ++0.06~14.2
The identified 33 fish species during the dry season in the MRE are as follows: A. japonica, A. bato, A. gagora, B. walga, C. ramacarati, E. tetradactylum, E. thoracata, G. morhua, H. nehereus, K. pelamis, L. lactarius, L. calcarifer, M. dolichodactylus, M. rosenbergii, M. nobilii, M. spinulatus, M. cephalus, M. gulio, O. rubicundus, O. pama, P. argenteus, P. hypophthalmus, P. monodon, P. indicus, P. paradiseus, P. elongatus, S. argus, S. guttatus, S. panijus, T. ilisha, T. curvirostris, T. lepturus and X. cancila (Table 2).
Table 3. Number and percent composition of families and species under various orders of fishes recorded in the Meghna River estuary (MRE).
OrderNo. of FamilyNo. of Species% Family% Species
DryWetDryWetDryWetDryWetDryWet
AnguilliformesAulopiformes11114433
AulopiformesBeloniformes11114433
BeloniformesClupeiformes121347310
ClupeiformesDecapoda223497914
DecapodaGadiformes217194203
GadiformesGobiiformes11124437
GobiiformesMugiliformes11314493
MugiliformesMyliobatiformes11114433
MyliobatiformesPerciformes1818431327
PerciformesScombriformes7282298237
ScombriformesScorpaeniformes21318493
ScorpaeniformesSiluriformes1414415314
Siluriformes 3 3 13 9
Total = 131126243329100100100100
Table 4. Suitability index for mariculture of the commercially important fisheries species in the MRE.
SeasonTemp. (°C)Salinity (psu)pHDO (mg/L)Ammonia
(mg/L)
Nitrate
(mg/L)
Nitrite
(mg/L)
Inorganic Phosphorus
(mg/L)
Suitability of Species for MaricultureReference
Dry19.68–29.890.12–18.077.30–9.096.72–9.990.01–2.840.01–0.180.00–0.090.02–2.08ValueS *
/NS **
This study value
Wet26.24–31.160.06–3.167.10–8.796.64–7.940.09–0.370.10–0.230.00–0.010.09–1.77
Sea cucumber 10–3028–374.6–8.6>60.4–0.7 <0.01 [28]
[29]
DryS *NS **S *S *NS ** NS **0.42NS **
WetS *NS **NS **S *NS ** NS **0.33NS **
Scallop 10–1823–357.5–8.2>4.5 0.01–0.02 [30]
[31]
DryNS **NS **S *S * NS ** 0.40NS **
WetNS **NS **S *S * NS ** 0.40NS **
Clam 18–2620–3094.5–6.5 [32]
[33]
[34]
DryS *S *S *S * 1.00S *
WetNS **NS **NS **S * 0.25NS **
L. calcarifer (Coral/Sea bass) 15–4010–307.5–8.54–9<1 <0.02 [35]
[36]
DryS *S *S *S *S * S * 1.00S *
WetS *NS **NS **S *S * NS ** 0.42NS **
Mussel 26–3227–357.9–8.2>8<0.4 [37]
[38]
[39]
DryS *NS **S *NS **NS ** 0.40NS **
WetS *NS **NS **S *NS ** 0.40NS **
Oyster 17–3310–286.32–5<1.2 [40]
[41]
[42]
DryS *S *NS **NS **S * 0.60S *
WetS *NS **NS **NS **S * 0.40NS **
L. parsia (Grey mullet) 3–350–386.5–9>40–0.50.1–4.50.03–0.26>0.06 [43]
[44]
DryS *S *S *S *S *S *S *S *1.00S *
WetS *S *S *S *S *S *NS **S *0.87S *
Sea weed 24–3227–357.5–9.134–8.5 0.03–0.05 [45]
[39]
DryNS **NS **NS **S * S *0.40NS **
WetS *NS **S *NS ** NS **0.40NS **
S. serrata (Mud crab) 21–350–305–94–9 0.31–0.570–0.007 [46]
[47]
[39]
DryS *S *S *S * NS **S * 0.83S *
WetS *S *S *S * NS **S * 0.83S *
M. rosenbergii 25–290–157–8.54.4–7.1 [48]
[49]
[39]
DryS *NS **NS **S * 0.40NS **
WetS *S *S *S * 1.00S *
M. cephalus 26–29.3<307.8–8.25.7–6.1 [50]
[51]
DryS *S *S *NS ** 0.75S *
WetS *NS **S *NS ** 0.40NS **
P. monodon 26–30.810–557–8.94.5–7.20.1–0.30.09–0.20.01–0.050.31 [28]
[52]
[39]
DryS *S *S *S *S *S *S *S *1.00S *
WetS *NS **S *S *NS **S *NS **NS **0.44NS **
P. hypophthalmus 20–35<206.7–8.65–8 [53]
[54]
[55]
DryNS **NS **S *NS ** 0.25NS **
WetS *S *NS **S * 0.75S *
P. indicus 30.3–31.610.25–307.8–7.95.6–5.9 [56]
[57]
[39]
DryS *S *S *NS ** 0.75S *
WetS *NS **S *NS ** 0.40NS **
M. vittatus 26.1–28<107.1–8.25.9–6.5 [58]
[59]
DryS *NS **S *NS ** 0.40NS **
WetS *S *S *NS ** 0.75S *
M. gulio 25.8–291.73–37.1–7.64.9–5.60.34–0.360.05–0.080.02–0.050.42 [60]
DryS *NS **S *NS **S *S *NS **NS **0.45NS **
WetS *S *S *NS **S *NS **NS **S *0.73S *
T. ilisha 29.3–30.8<0.17.7–8.44.8–6.8 [61]
DryS *NS **S *NS ** 0.40NS **
WetNS **S *S *S * 0.75S *
Here, S * = Suitable and NS ** = Not Suitable.
Table 5. Fish species diversity index values in the MRE during the dry and wet seasons.
AverageDry SeasonWet SeasonStandardReferences
Total number of species (S)383329
Total number of individuals (N)1026240
Shannon-Weaver diversity index (H′)0.370.340.250–5[62]
Pielou’s species evenness (J’)0.110.090.070–1[63]
Margalef species richness (d)8.007.907.30>5[62]
Publisher’s Note: MDPI stays neutral with regard to jurisdictional claims in published maps and institutional affiliations.

