Article

Distinct Adaptive Patterns in Root System Architecture of Synthetically Derived Wheat Lines Under High-Air-Temperature Stress


by
Sultan Md Monwarul Islam
1,
Izzat Sidahmed Ali Tahir
2,3 and
Kinya Akashi
1,3,4,*
1
United Graduate School of Agricultural Sciences, Tottori University, 4-101 Koyama-Cho-Minami, Tottori 680-0945, Japan
2
Wheat Research Program, Agricultural Research Corporation, Wad Medani P.O. Box 126, Sudan
3
International Platform for Dryland Research and Education, Tottori University, 1390 Hamasaka, Tottori 680-0001, Japan
4
Faculty of Agriculture, Tottori University, 4-101 Koyama-Cho-Minami, Tottori 680-0945, Japan
*
Author to whom correspondence should be addressed.
Stresses 2026, 6(2), 33; https://doi.org/10.3390/stresses6020033

Submission received: 29 April 2026 / Revised: 29 May 2026 / Accepted: 4 June 2026 / Published: 8 June 2026
(This article belongs to the Section Plant and Photoautotrophic Stresses)

Abstract

High-temperature stress poses a major threat to wheat productivity across multiple developmental stages, including early seedling growth. Root system architecture (RSA) contributes to stress adaptation; however, its responses to high-temperature stress remain insufficiently characterized in genetically diverse wheat populations. In this study, RSA responses of representative genotypes from a Multiple Synthetic Derivative (MSD) wheat population were evaluated under control and high-air-temperature conditions using a time-resolved, two-dimensional phenotyping platform. High-air-temperature stress significantly affected most root traits, with traits associated with lateral root expansion, including the second-pair seminal root length, root system width, and convex hull area, being more responsive than vertical root traits. MSD417 and MSD034 maintained relatively higher root performance under high-temperature stress, whereas MSD392 showed pronounced sensitivity. In contrast, MSD054 exhibited relatively small changes in root traits but consistently low overall performance. Multivariate analyses and stress indices consistently differentiated tolerant, sensitive, and low-responsive genotypes. These findings highlight the importance of distinguishing active stress tolerance from passive stability and suggest that lateral-root-related traits may serve as useful targets for breeding heat-resilient wheat.

1. Introduction

Wheat (Triticum aestivum L.) is the most widely cultivated cereal crop worldwide and provides a major source of calories for more than 35% of the global population [1]. With the global population projected to reach 9.6 billion by 2050, a substantial increase in wheat production will be required to meet future food demand [2]. However, climate change, particularly rising global temperatures, poses a significant threat to wheat productivity [3]. It has been estimated that wheat yield declines by 4.1–6.4% for every 1 °C increase in temperature [4,5]. Elevated root-zone temperature, either alone or in combination with elevated shoot temperature, significantly reduced wheat growth, photosynthetic performance, and grain yield at various developmental stages [6,7]. Therefore, developing heat-resilient wheat cultivars for sustainable crop production under changing climatic conditions is critical.
Adaptation to heat stress involves multiple physiological and morphological traits. While breeding efforts have focused on above-ground characteristics, increasing evidence suggests that below-ground traits also contribute substantially to heat resilience. Root system architecture (RSA), defined by traits such as root length, number, angle, and spatial distribution, plays a critical role in plant growth by regulating water and nutrient acquisition and mediating adaptation to environmental conditions [8,9]. RSA has been proposed as a key target for breeding climate-resilient crops, particularly due to its plasticity in response to environmental stresses [10,11,12]. Moreover, early-stage root development is especially important, as it can influence subsequent root system formation and overall plant performance [13]. Despite its importance, RSA remains underutilized in wheat breeding programs, largely due to the difficulty of root phenotyping. Evaluating RSA under field conditions remains challenging due to limited accessibility, destructive sampling requirements, and low temporal resolution, making it difficult to capture dynamic root responses [8,14,15,16,17]. Although various root phenotyping platforms have been developed [18,19,20,21,22,23,24,25,26,27], continuous high-resolution monitoring of RSA dynamics remains a major challenge. To address this bottleneck, a practical two-dimensional RSA phenotyping platform has recently been developed [28]. However, its validation has so far been limited to a single synthetic derivative wheat line, which restricts confidence in its broader applicability.
In parallel, progress in improving RSA is limited by the narrow genetic diversity of modern bread wheat, particularly in the D genome. Aegilops tauschii, the D-genome donor of bread wheat, is a valuable source of novel alleles associated with resource acquisition and abiotic stress adaptation [29,30,31,32]. In addition to general stress responses, alleles derived from this wild relative have been associated with root system traits and nutrient uptake, suggesting its potential role in shaping RSA under stress conditions [31,33,34,35]. The Multiple Synthetic Derivative (MSD) wheat population represents a powerful platform for exploring Ae. tauschii-derived genetic effects. This population was developed through repeated crossing and backcrossing of 43 synthetic wheat lines with the common wheat cultivar Norin 61 [29,30]. Consequently, the D-genome contribution from Ae. tauschii within this population provides an opportunity to investigate RSA diversity.
Based on field performance in Sudan, one of the hottest wheat-growing regions in the world, several MSD genotypes (MSD034, MSD054, MSD296, MSD392, and MSD417) were identified as heat-tolerant candidates, with accompanying physiological and molecular analyses revealing distinct stress-response patterns among these genotypes [36,37]. However, apart from MSD417, the RSA responses of the selected MSD lines have not been systematically characterized. Therefore, the objectives of this study were to (i) further validate a recently developed RSA phenotyping method by expanding its evaluation across multiple genotypes under control and high-air-temperature conditions and (ii) characterize RSA variation and identify promising root traits potentially associated with high-temperature stress adaptation. The findings of this study are expected to strengthen the methodological basis for RSA phenotyping and support the use of MSD germplasm in breeding programs to improve wheat heat resilience.

2. Results

2.1. Comparison of the Trait Parameters

Root and shoot traits of various MSD genotypes and their recurrent parent N61 were compared at control temperatures (22 °C/18 °C day/night) and at high air temperatures (42 °C/18 °C day/night) during the second half of the eight-day growth period. To quantitatively evaluate root system characteristics, the trait parameters were measured as mentioned in Table 1. Analysis of variance (ANOVA) revealed that genotypes (G), temperature conditions (treatment, T), and their interaction (G × T) significantly influenced most root and shoot traits measured under both conditions (Table 1). Highly significant genotypic differences (p < 0.001) were observed for nearly all traits, including total root length (TRL), root system width (RSW), and convex hull area (CHA), indicating substantial genetic variability within the selected lines. Notably, mean square values for treatment were markedly higher than those for genotype across most traits, suggesting that high temperature was the primary driver of phenotypic variation. While treatment significantly impacted nearly all measured traits under both conditions (p < 0.001), shoot dry weight (SDW) remained notably stable across treatments. Significant G × T interactions for traits such as root dry weight (RDW) and CHA (p < 0.01) indicate differential genotypic plasticity in root biomass allocation under high-temperature stress. In contrast, the lack of significant G × T interaction for rooting depth (RD) and specific root length (SRL) suggests these traits were more genetically stable across treatments.
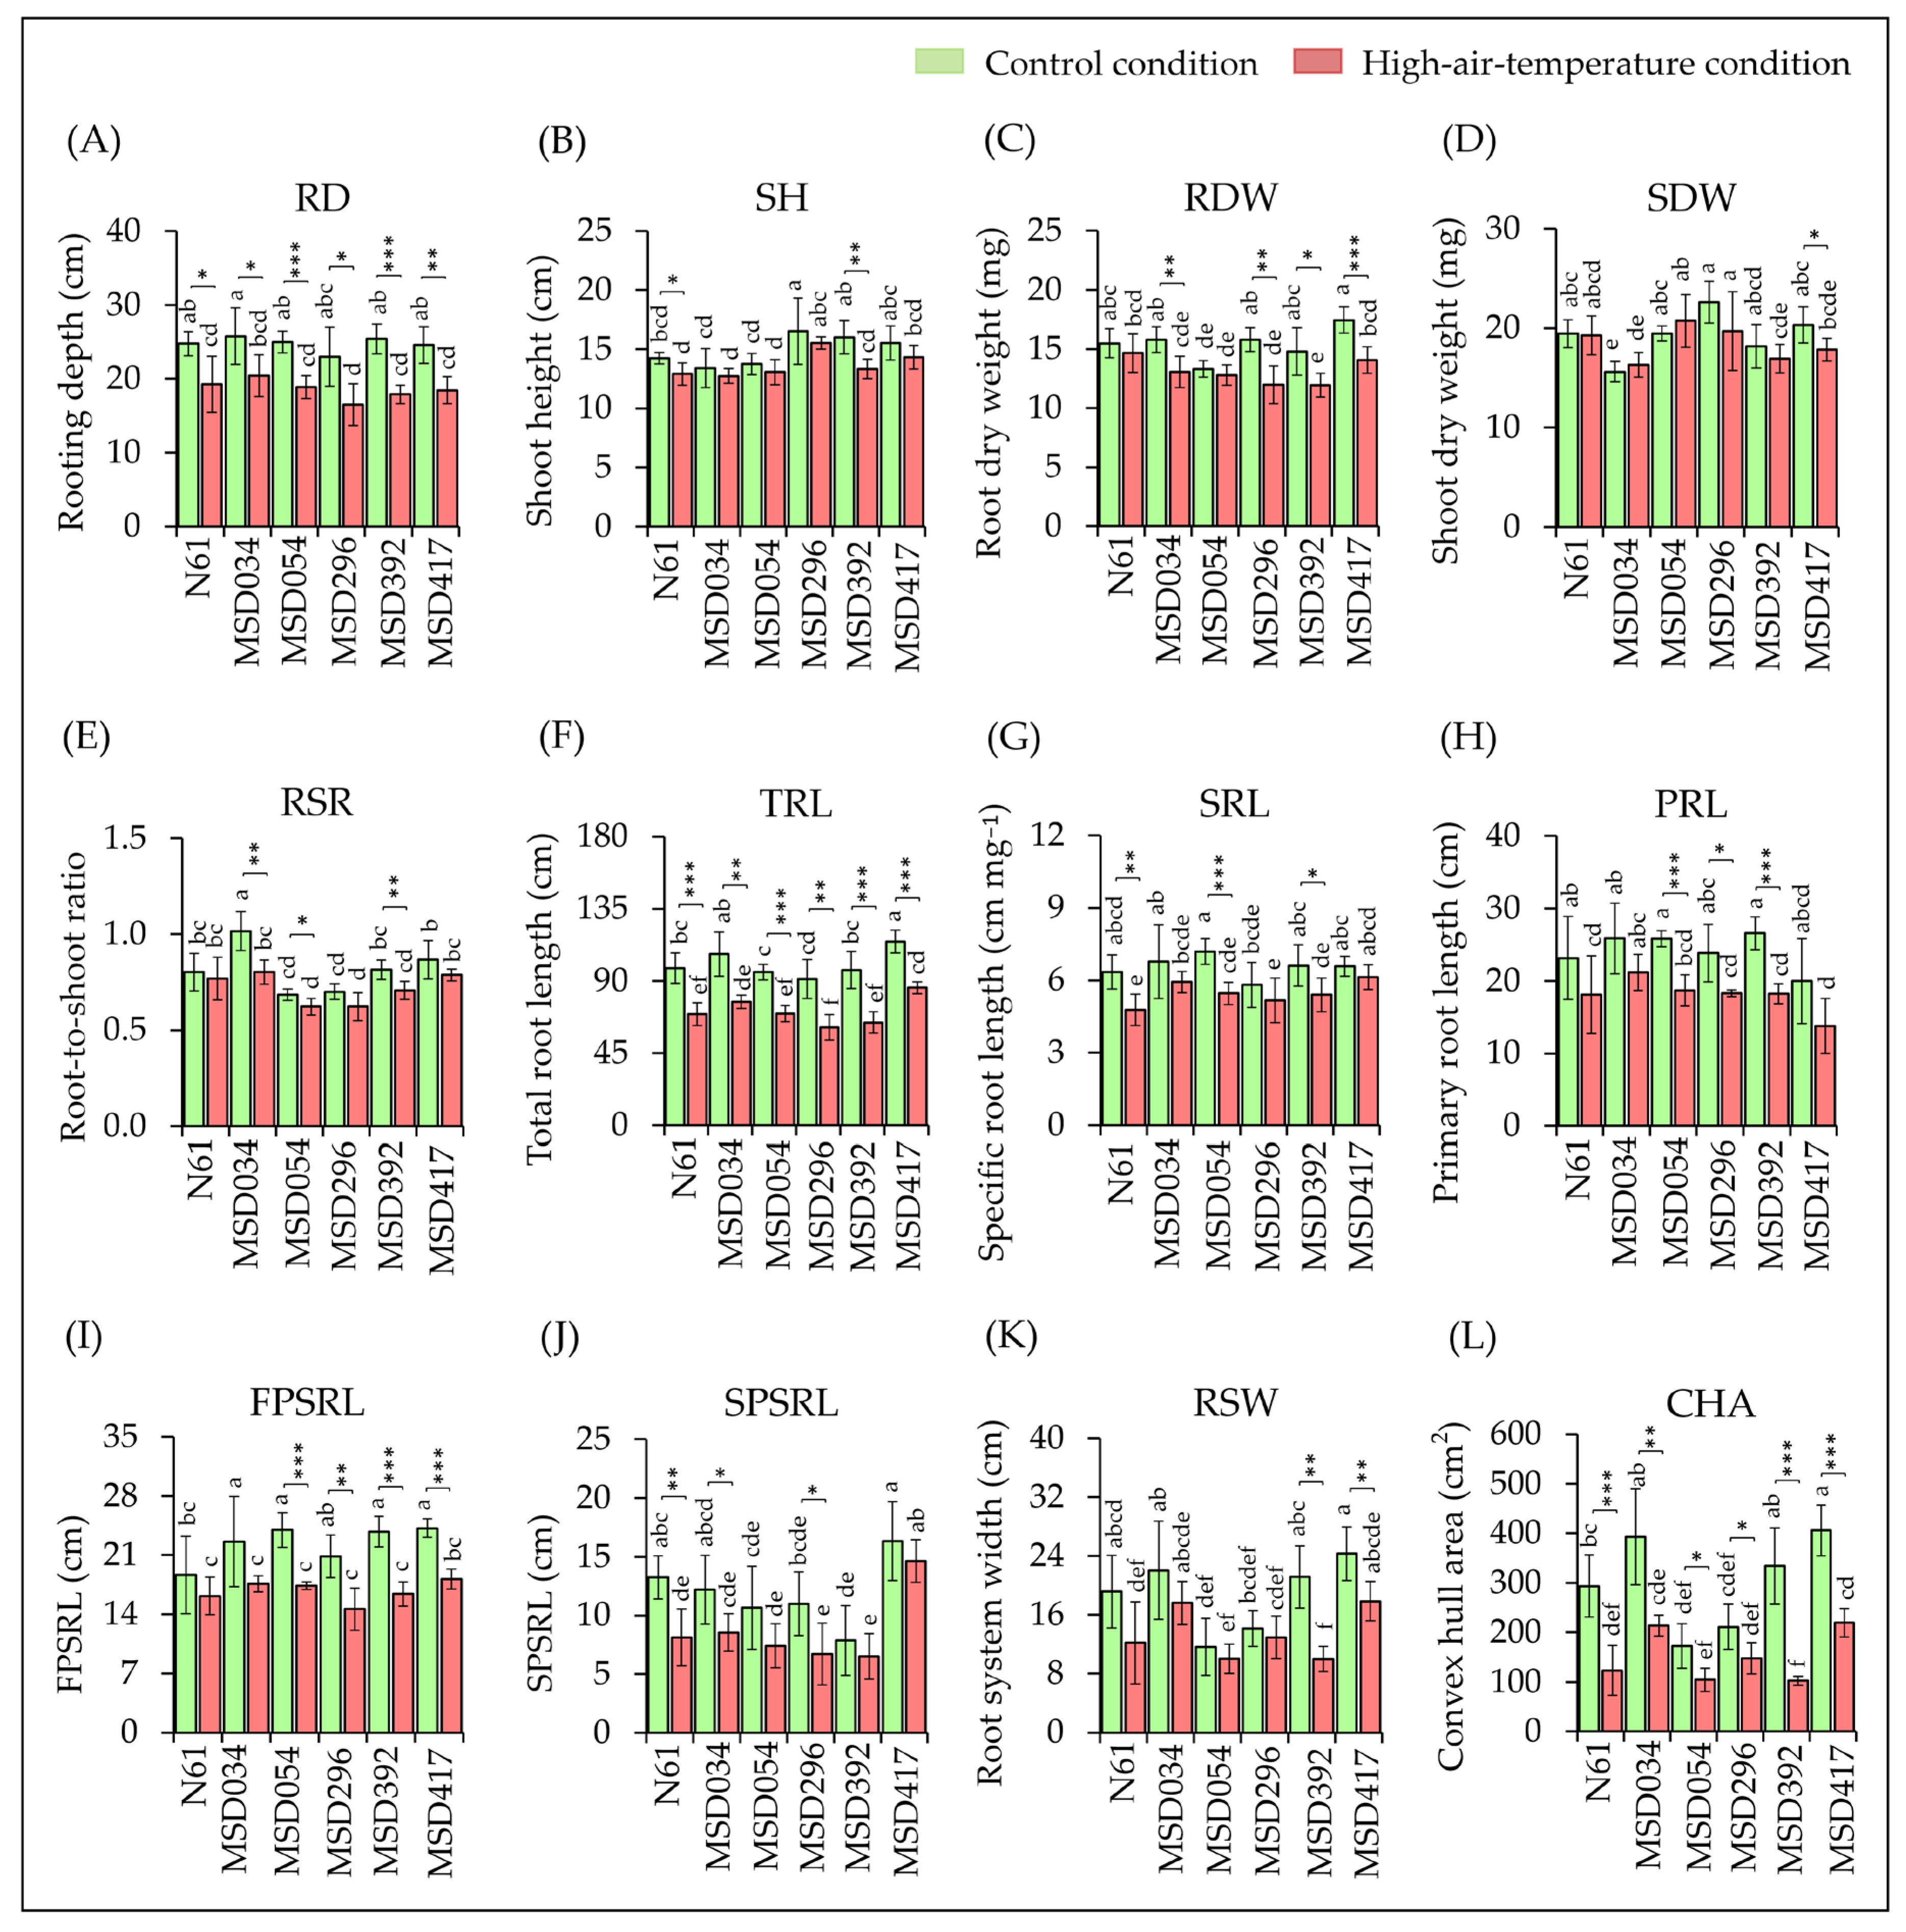
Figure 1 presents genotype-wise comparisons of root architectural traits under control and high-air-temperature conditions. Among these traits, rooting depth (RD) was significantly reduced (by 20.76% to 27.35%) due to high-temperature stress across all genotypes, with no significant differences among genotypes under either control or high-temperature stress (Figure 1A and Supplementary Tables S1 and S2). In contrast, the response of shoot height (SH) to high-temperature stress varied among genotypes (Figure 1B). Under control conditions, MSD417 and MSD296 exhibited the highest root dry weight (RDW) and shoot dry weight (SDW), reflecting high growth potential (Figure 1C,D). RDW remained stable in N61 and MSD054 under high-temperature stress, whereas it was significantly reduced in the other four genotypes (Figure 1C and Supplementary Table S1). Although the mean SDW values were generally lower under stress conditions across several genotypes, these differences were not statistically significant except for MSD417 (Figure 1D). Biomass partitioning, expressed as the root-to-shoot ratio (RSR), varied significantly among genotypes. Under control conditions, MSD034 exhibited the highest RSR (1.02 ± 0.10), while other genotypes ranged from 0.68 ± 0.03 to 0.87 ± 0.10 (Figure 1E and Supplementary Table S1). High-temperature stress significantly reduced RSR in MSD034, MSD054, and MSD392, whereas RSR changes were not significant in the other genotypes. These observations suggest that root development was more sensitive to high-temperature stress than shoot growth in the affected genotypes.
To evaluate the geometric configuration and soil coverage potential of the root system, total root length (TRL), specific root length (SRL), and the lengths of major roots were analyzed (Figure 1F–J, Supplementary Table S1). Under control conditions, TRL of the genotypes ranged from 91.14 ± 12.01 to 114.56 ± 7.20 cm, where MSD417 had the highest mean value (Figure 1F and Supplementary Table S1). High-temperature stress significantly reduced TRL across all genotypes, and MSD417 maintained the highest mean values with the smallest reduction (25.18%), whereas MSD392 exhibited the greatest sensitivity (33.76% reduction). Under control conditions, mean SRL values, an indicator of root fineness and resource acquisition efficiency, ranged from 5.81 ± 0.94 to 7.20 ± 0.53 cm mg−1. MSD054 exhibited the highest value, indicating a strategy of producing greater root length per unit root biomass (Figure 1G, Supplementary Table S1). Under high-temperature stress, N61, MSD054, and MSD392 showed significant reductions in SRL, whereas the reductions in the other three genotypes were not significant (Supplementary Tables S1 and S2). While primary root length (PRL) showed little significant genotypic differences in the control conditions, considerable genotypic variations were observed in the first and second pair of seminal root length (FPSRL and SPSRL), with greater mean values for MSD417 (Figure 1H–J, Supplementary Table S1). FPSRL was highly sensitive to high temperatures in MSD054, MSD296, MSD392, and MSD417, whereas no statistically significant changes were detected in other genotypes. Similarly, SPSRL was significantly reduced (p < 0.001) in N61 (percentage reduction of 38.56%), MSD034 (29.88%), and MSD296 (38.94%), whereas changes in MSD054 (20.07%), MSD392 (17.28%) and MSD417 (10.38%) were not statistically significant, likely due to relatively higher within-genotype variation in SPSRL measurements (Figure 1J, Supplementary Table S2). Nevertheless, MSD417 maintained the highest absolute SPSRL even under high-temperature stress, with the smallest percent reduction (10.38%), despite significant reductions in TRL and FPSRL, suggesting prioritized maintenance of certain root types in this genotype.
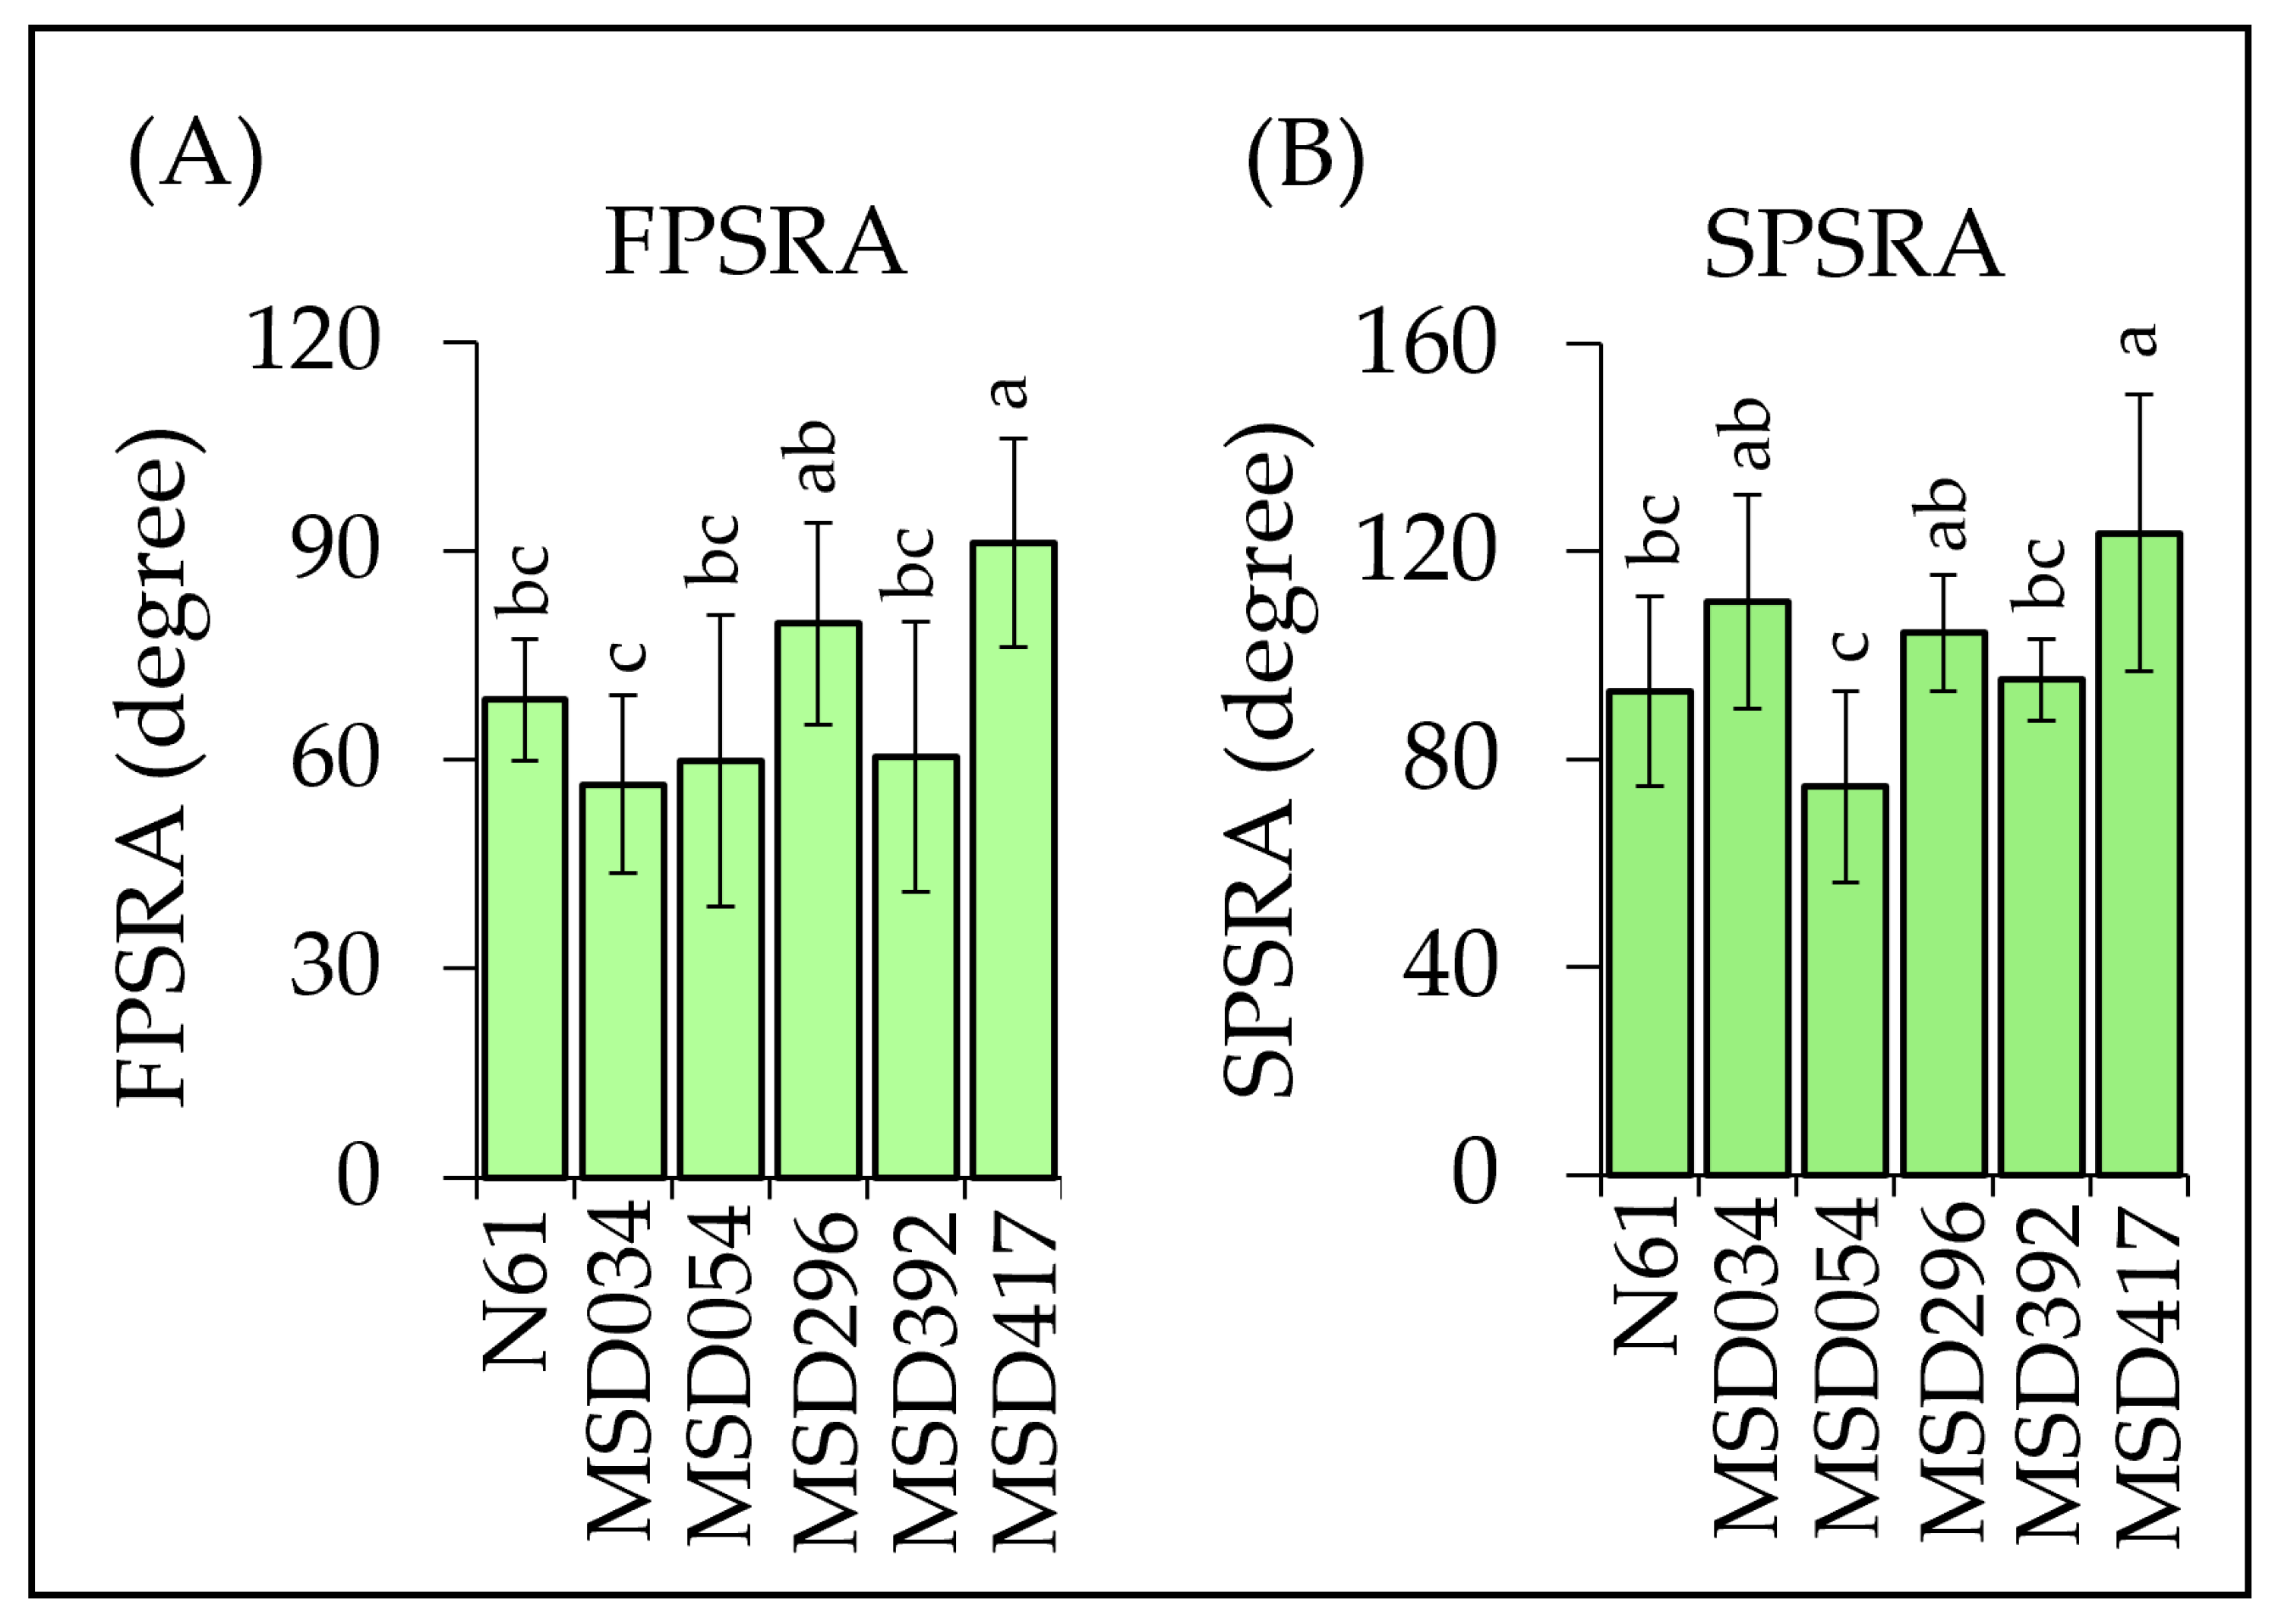
Seminal root angles were established during the early stages of seedling development, prior to high temperature treatment, and differed markedly among genotypes (Figure 2). MSD417 exhibited the widest angles for both the first and second pairs of seminal roots (FPSRA and SPSRA, respectively). MSD034 and MSD296 also had a wide SPSRA, comparable to MSD417, suggesting that these genotypes possess a naturally broader basal footprint than the other genotypes, which had more vertically oriented root systems. Under control conditions, the mean root system width (RSW), which is influenced by the angle and length of the second pair of seminal roots, was greatest in MSD417, followed by MSD034 and MSD392 (Figure 1K, Supplementary Table S1). High-temperature stress significantly reduced RSW in MSD392 and MSD417; however, MSD417 and MSD034 retained higher RSW values than the other genotypes. The convex hull area (CHA), which reflects total soil area explored by roots, varied significantly among genotypes. Under control conditions, MSD417 and MSD034 exhibited higher mean CHA values than the other genotypes (Figure 1L and Supplementary Table S1). High-temperature stress significantly reduced CHA in all genotypes, with percentage reductions ranging from 30.08% to 58.04%. MSD417 and MSD034 retained higher mean CHA values than the other genotypes.

2.2. Hierarchical Cluster Analysis and Distance Matrix of the Traits

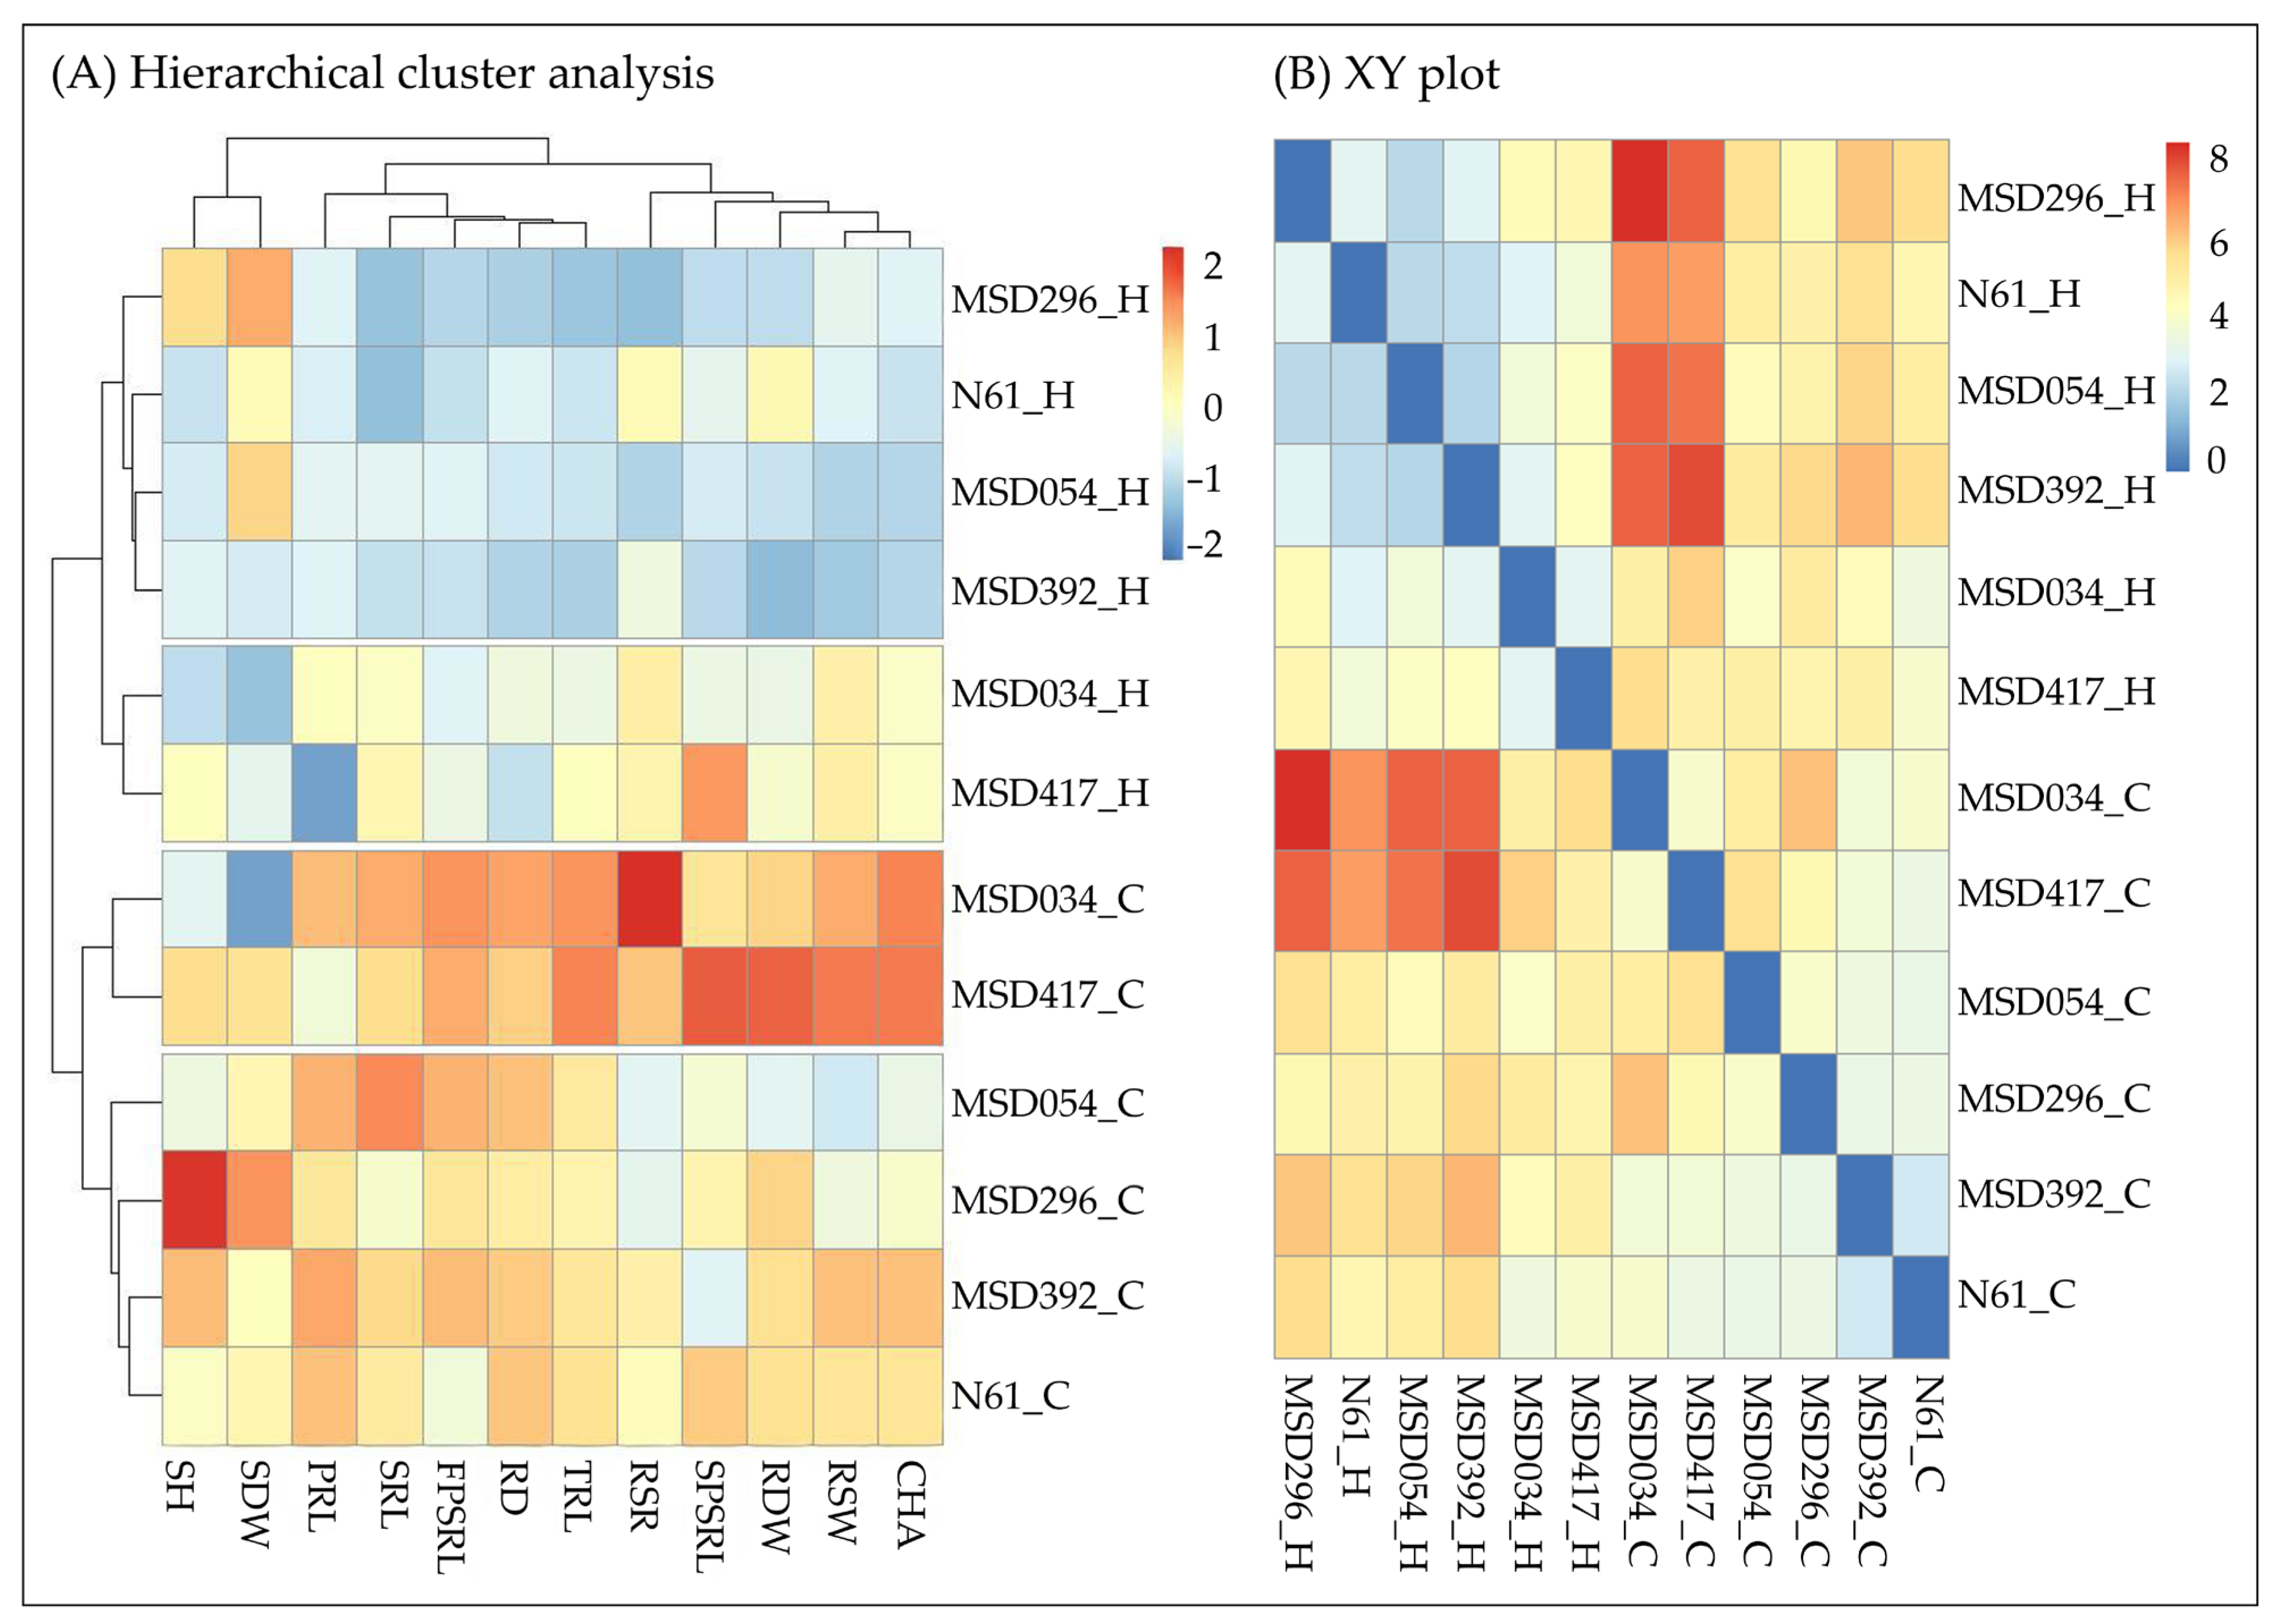
To evaluate the relationships between genotypes and their morphological responses to high-air-temperature stress, hierarchical cluster analysis (HCA) and a pairwise distance matrix were performed (Figure 3). The HCA dendrogram and heatmap partitioned the genotypes into distinct clusters based on their phenotypic profiles under control and high temperature conditions (Figure 3A). The most significant result was the clear separation between control plants and those stressed by high temperature. The control group exhibited higher values for biomass and architectural traits, including RDW, TRL, RSW, and CHA. In contrast, the high-temperature-stress clade was characterized by widespread reductions in root traits, with N61, MSD054, MSD296, and MSD392 showing the most pronounced declines in RD, TRL, SPSRL, and CHA. The horizontal dendrogram at the top revealed characteristic trait correlations, including a close association between RSW and CHA, indicating that these architectural parameters respond similarly to heat stress.
The heatmap of pairwise phenotypic distances revealed large distances between the control samples (MSD034 and MSD417) and the high-temperature-stressed samples (MSD296, N61, MSD054, and MSD392), indicating pronounced phenotypic divergence between the high-performing genotypes under control conditions and the other genotypes under high-temperature conditions (Figure 3B). Under control conditions, N61 and MSD392 exhibited shorter distances, suggesting similar baseline growth strategies. Interestingly, several genotypes (MSD296, N61, MSD054, and MSD392) showed reduced pairwise distances under high-temperature stress compared with control conditions, forming a region of higher similarity in the distance matrix. This suggests that high-temperature stress acts as a physiological bottleneck, forcing different genotypes toward a similarly stunted phenotype.

2.3. Comparative Evaluation of Stress Indices and Genotypic Stability

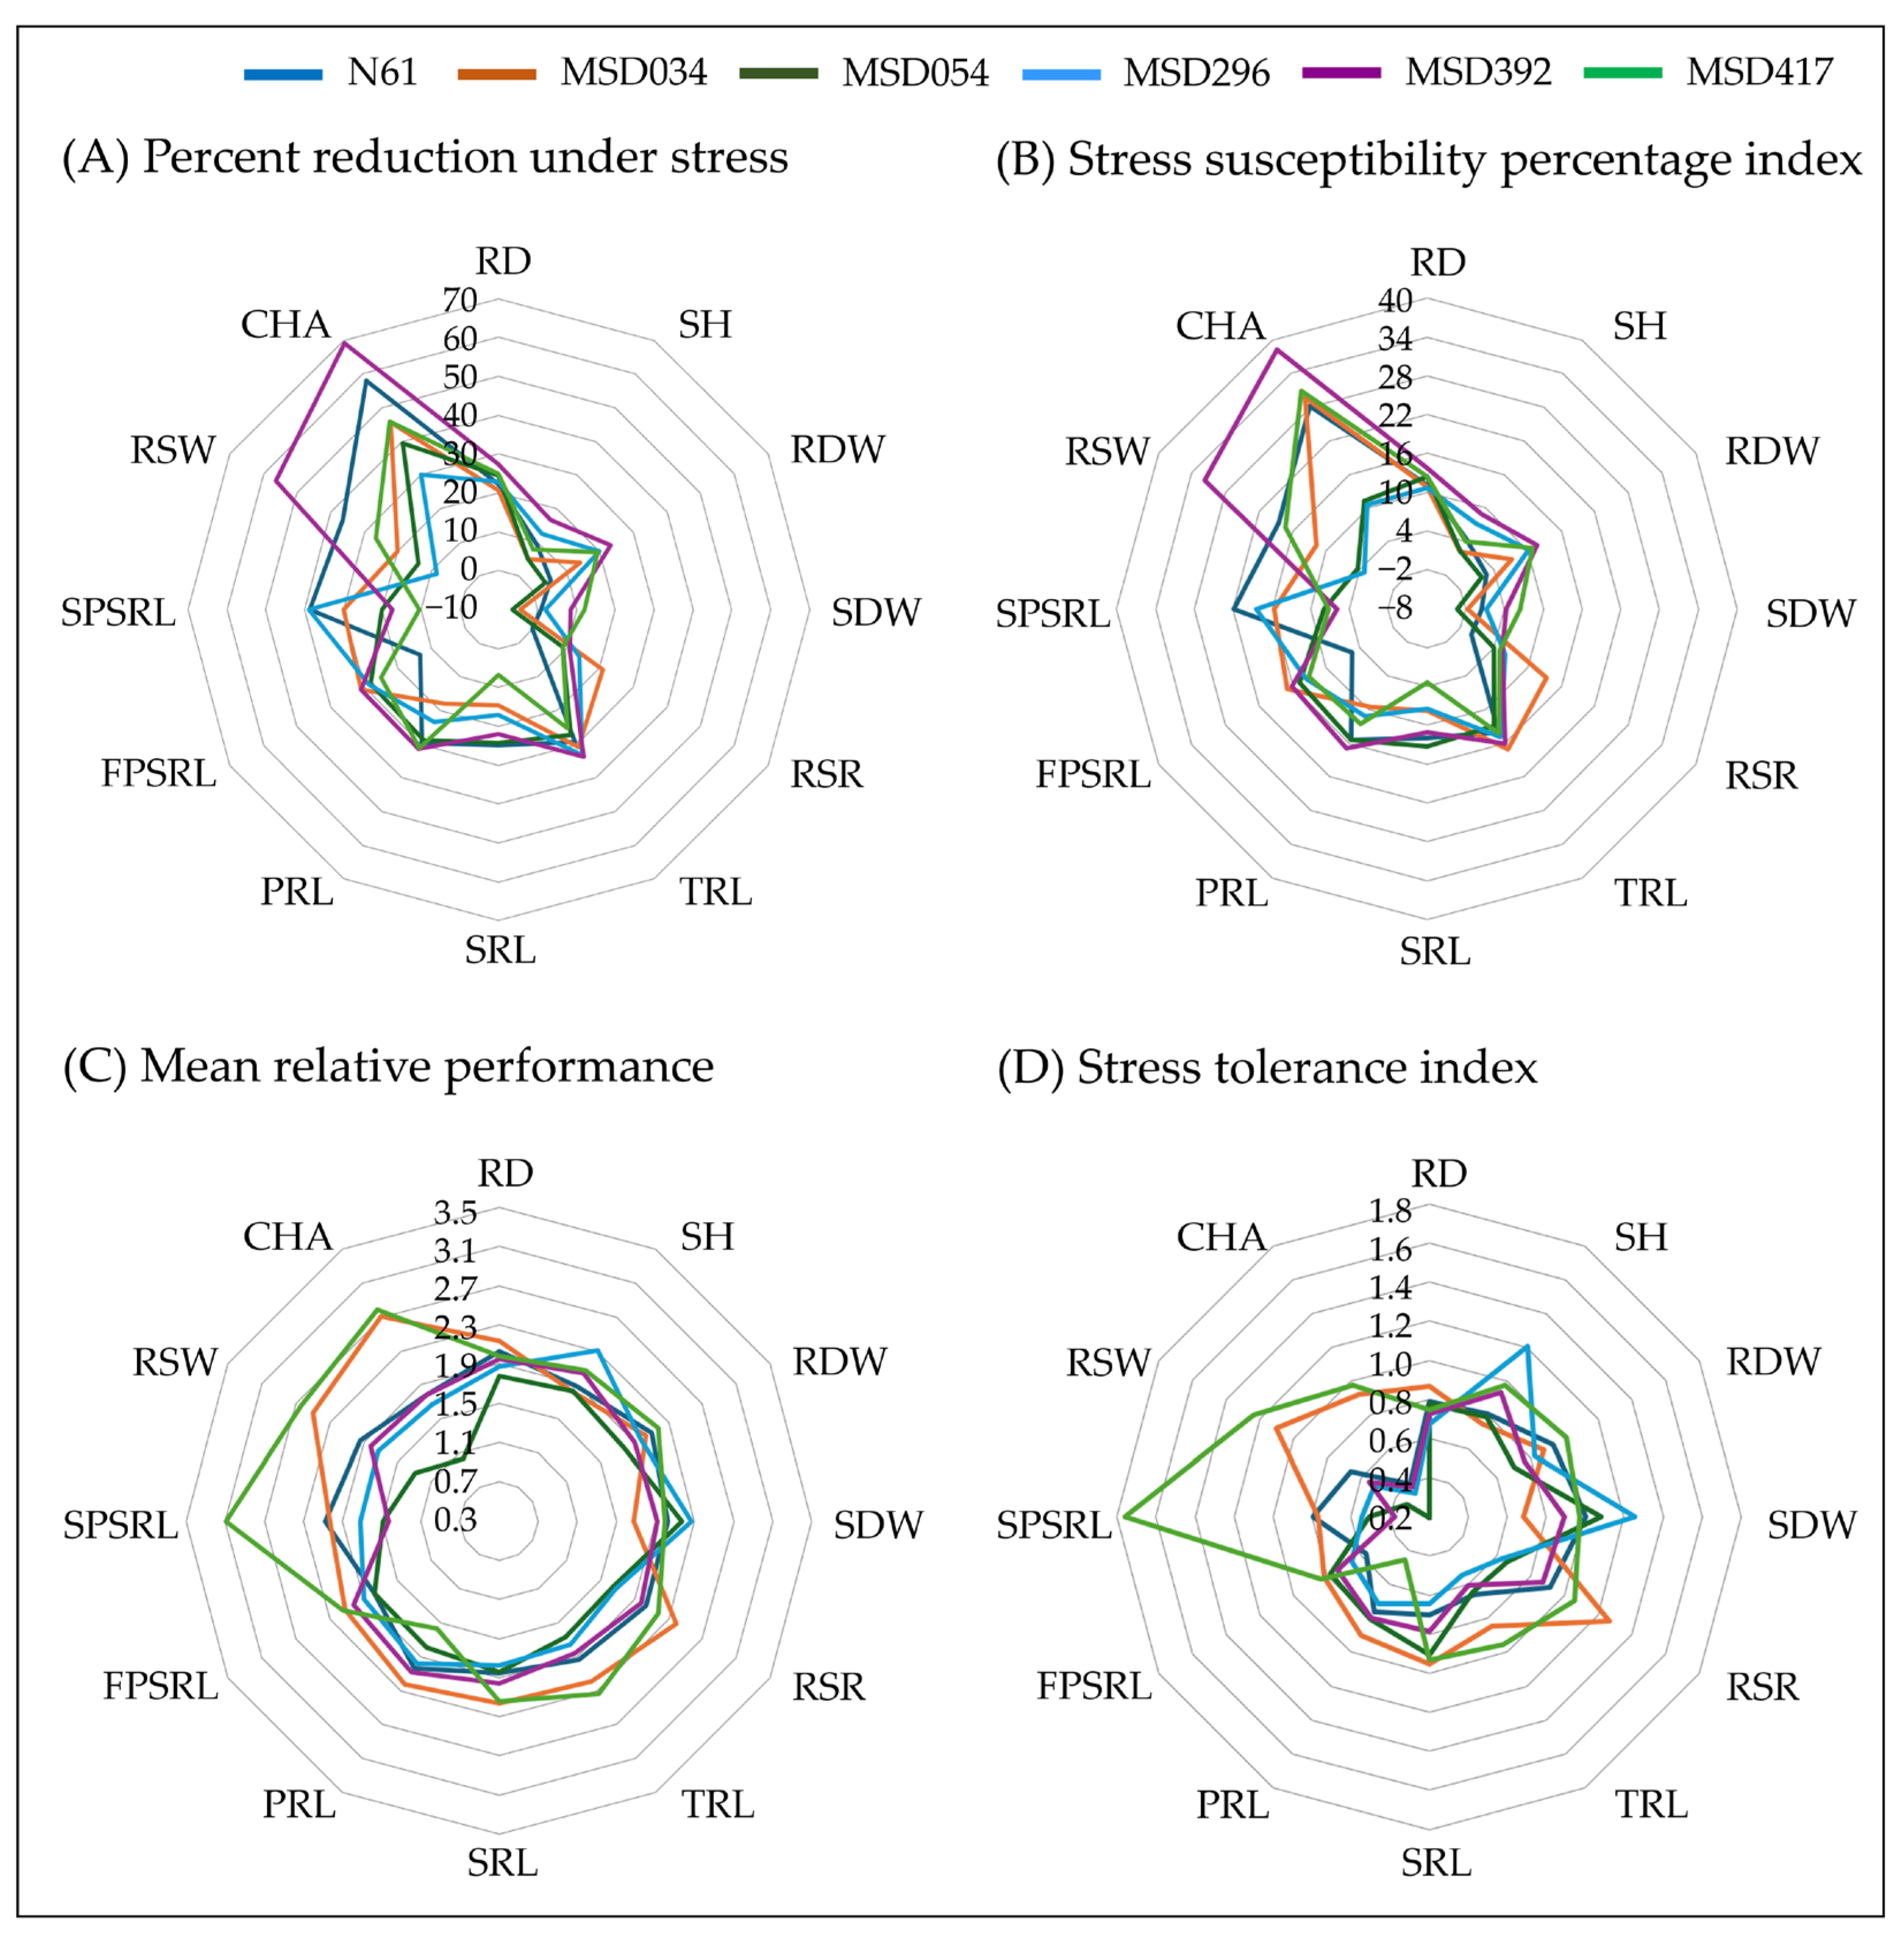
To enable an integrated comparison of genotypic performance under high-air-temperature stress, several stress indices were calculated from trait performance under control and stress conditions. Percent reduction (PR), stress susceptibility percentage index (SSPI), mean relative performance (MRP), and stress tolerance index (STI) were computed for all measured traits under both conditions (Supplementary Tables S2–S5), and the resulting profiles were visualized using radar plots (Figure 4).
PR analysis identified the convex hull area (CHA), root system width (RSW), and second pair seminal root length (SPSRL) as the traits most severely affected by high temperature (Figure 4A, Supplementary Table S2). The largest reductions were observed in MSD392 (69.22% and 56.29% for CHA and RSW, respectively) and in N61 (38.56% for SPSRL). Across genotypes, MSD392 showed consistently high reduction in root traits, including RD (27.35%) and TRL (33.76%). In contrast, SDW was the most stable trait, with minimal reduction in N61 (0.93%) and slight increases in MSD054 and MSD034, as indicated by negative PR values (−6.51% and −4.35%, respectively). Overall, N61, MSD034, and MSD417 exhibited relatively greater stability, maintaining lower reductions across multiple root traits.
SSPI was used to quantify relative performance declines, with lower values indicating greater stability (Figure 4B, Supplementary Table S3). Overall, most genotypes exhibited moderate susceptibility across root length traits (RD, TRL, and PRL). Notably, MSD392 showed pronounced sensitivity in root expansion traits, particularly CHA (38.31) and RSW (31.75). In contrast, MSD054 exhibited the lowest overall SSPI (mean = 8.06), indicating greater stability. N61, MSD034, and MSD417 showed comparable performance, with mean SSPI values ranging from 11.18 to 11.67.
Mean relative performance (MRP) values indicated that certain genotypes performed better under high-temperature stress (Figure 4C, Supplementary Table S4). MSD417 showed the highest overall performance (mean MRP = 2.26), followed by MSD034 (2.17). The high performance of MSD417 was associated with certain root traits, with the highest values observed for SPSRL (3.09), CHA (2.79), and RSW (2.64). MSD034 exhibited consistently high values across traits, including RSR (2.39) and RSW (2.50), indicating stable performance. In contrast, MSD296 showed relatively high values in shoot traits, particularly SH (2.31) and SDW (2.27). MSD054 exhibited the lowest values across most traits.
The stress tolerance index (STI) further revealed patterns of genotypic variation under high-temperature stress (Figure 4D; Supplementary Table S5). MSD417 exhibited the highest overall tolerance (mean STI = 0.99), with elevated values in SPSRL (1.76) and RSW (1.24). MSD034 followed (mean STI = 0.90), showing high values in RSR (1.27) and RSW (1.11). In contrast, MSD054 exhibited the lowest STI values (mean = 0.68), reflecting reduced performance, particularly in CHA (0.20) and RSW (0.33).

2.4. Principal Component Analysis of Genotypic Performance Under High-Air-Temperature Stress

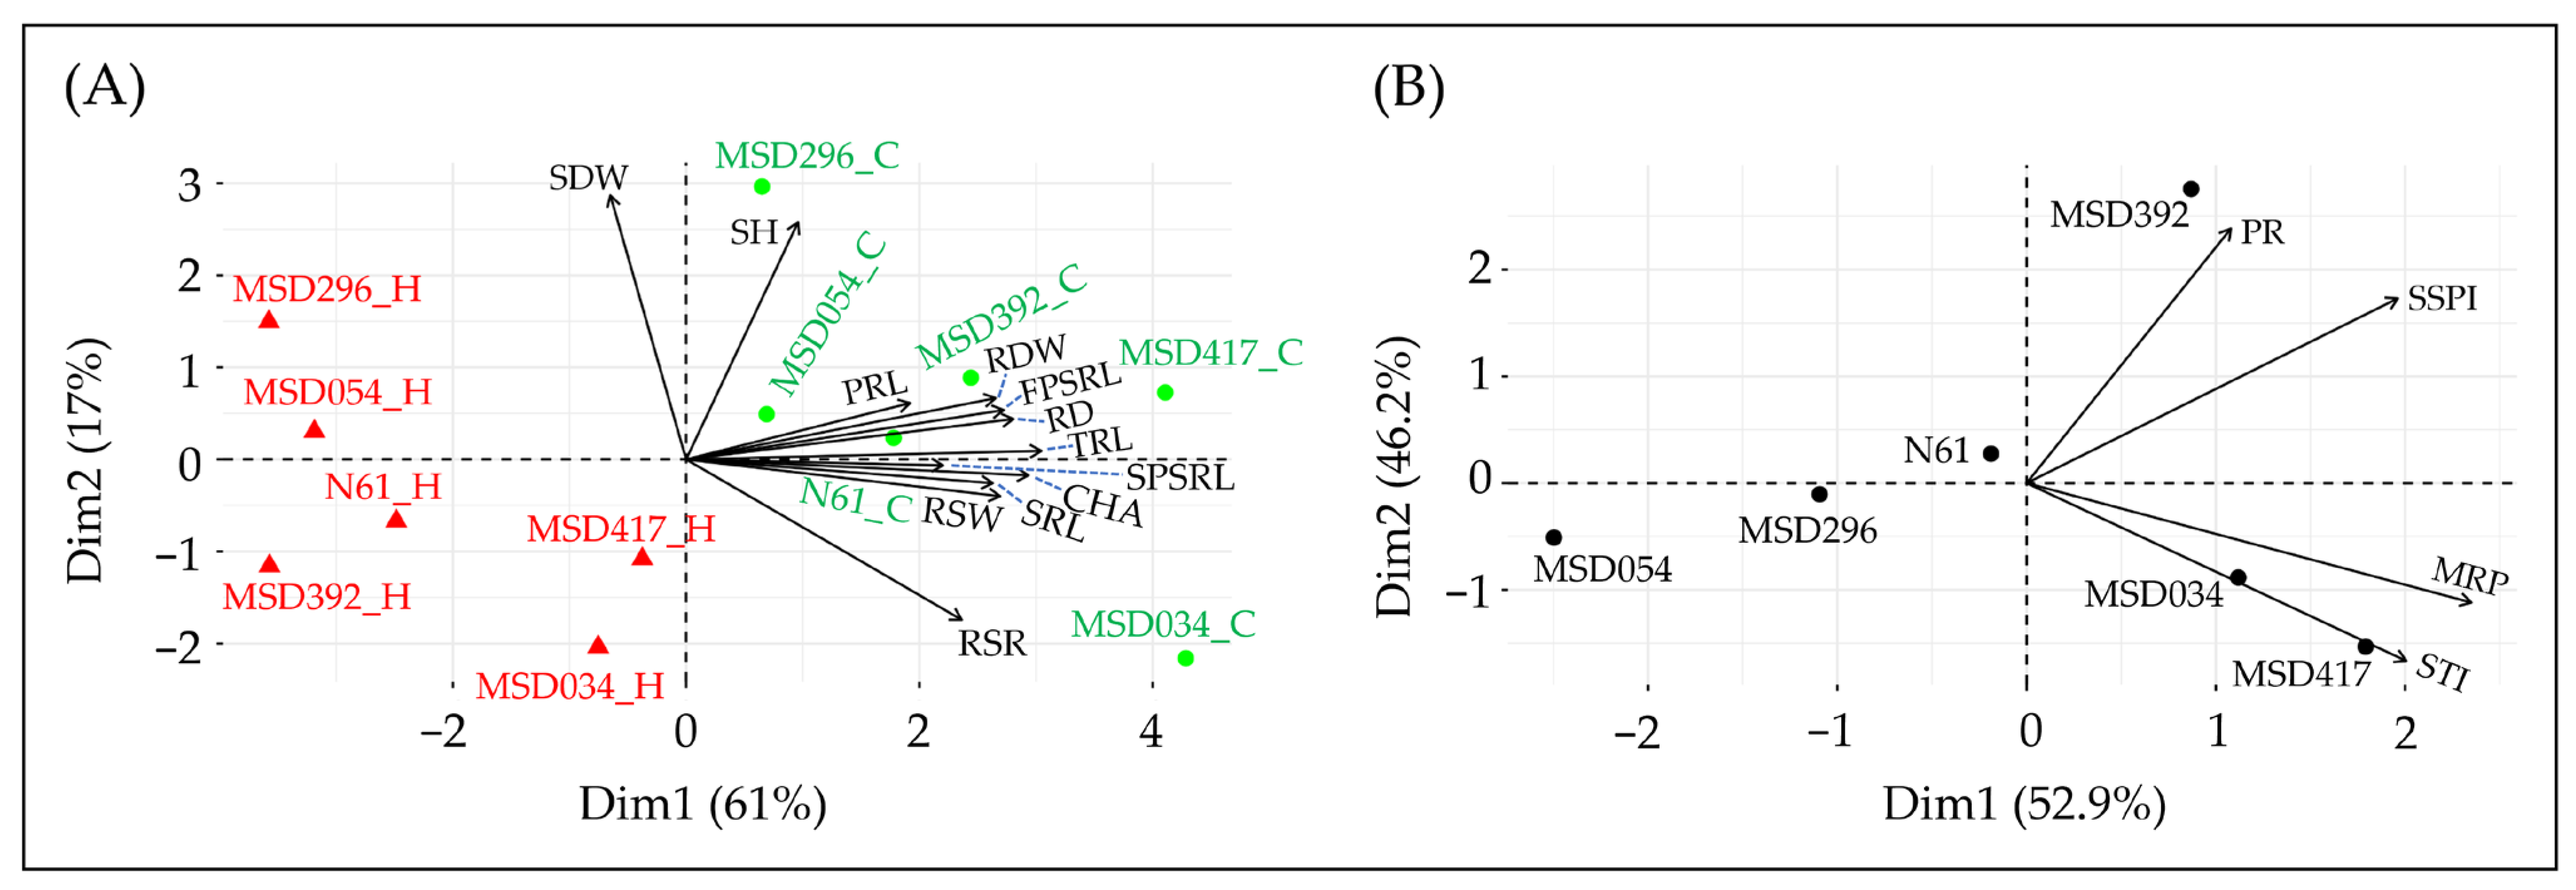
To comprehensively characterize genotypic responses to high-temperature stress, two complementary principal component analyses (PCAs) were performed: one based on raw phenotypic traits (Figure 5A) and the other based on stress indices (Figure 5B). In Figure 5A, the first two principal components explained 78% of the total phenotypic variation, with Dim1 and Dim2 accounting for 61% and 17%, respectively. Dim1 clearly separated genotypes by high-temperature treatment: Control conditions (green circles) were distributed on the positive side, whereas high-temperature-stressed genotypes (red triangles) were located on the negative side. This separation was mainly associated with root architectural traits, including total root length (TRL), convex hull area (CHA), rooting depth (RD), and root system width (RSW), which had strong positive loadings on Dim1. In contrast, shoot-related traits such as shoot dry weight (SDW) and shoot height (SH) contributed more significantly to Dim2, suggesting a distinct axis of variation from root architecture. Genotypic differences were also evident within each condition. Under control conditions, MSD417 was closely associated with higher TRL, SPSRL, and CHA, whereas MSD034 was characterized by higher root-to-shoot ratios (RSR). Under high-temperature stress, all genotypes shifted toward negative values along Dim1; however, MSD417 and MSD034 remained closer to the origin than the other genotypes, indicating a relatively greater maintenance of root architectural traits compared with genotypes such as MSD296 and MSD392.
The stress-index-based PCA (Figure 5B) provided another integrated representation of genotypic responses by combining multiple stress-related indices. The first two principal components explained a substantial proportion of the variation (Dim1 = 52.9%, Dim2 = 46.2%). In this biplot, performance- and tolerance-related indices, such as MRP and STI, were associated with the positive side of Dim1 and the negative side of Dim2, whereas stress-sensitivity metrics, such as PR and SSPI, were located on the positive side of both Dim1 and Dim2. Genotypes were clearly differentiated along these axes. MSD417 and MSD034 were closely associated with STI and MRP, indicating higher overall performance and tolerance under high-temperature stress. In contrast, MSD054 was positioned on the negative side of Dim1, reflecting lower overall performance. MSD392 was separated, along with a higher Dim2 value, corresponding to elevated PR and SSPI values, indicating greater stress susceptibility. N61 and MSD296 were situated at intermediate positions, suggesting moderate responses across indices.

3. Discussion

Root system architecture (RSA) is an important target for crop breeding because its variation and plasticity influence plant adaptation to environmental stresses [38,39,40,41,42,43]. Temperature is also a major environmental factor affecting plant growth and development, and can strongly influence wheat performance under stress conditions [44]. In the present study, dynamic RSA responses to high-air-temperature stress were evaluated using representative genotypes from the Multiple Synthetic Derivative (MSD) population, which incorporates genetic diversity from Ae. tauschii [30,45]. Using a time-resolved root phenotyping platform for juvenile-stage RSA analysis [28], we identified substantial genotypic variation in root and shoot trait responses under high temperature conditions. In particular, MSD417 and MSD034 maintained relatively higher root performance under stress, whereas MSD392 showed pronounced sensitivity. Although the MSD population has previously been reported to exhibit variation in several above-ground traits related to stress adaptation [30,46,47,48,49], the present study further demonstrates that substantial diversity also exists in RSA responses under high-air-temperature conditions.
The dominant effect of temperature treatment compared with the genotypic effects for most examined traits indicates that RSA in wheat is highly plastic and responsive to high-temperature stress (Table 1), consistent with previous reports [50,51]. At the same time, the significant genotypic effects and genotype × treatment interactions observed for several root traits demonstrate substantial diversity in the capacity of MSD genotypes to adjust RSA under stress conditions. Such variation is particularly important for breeding because it enables the identification of genotypes capable of maintaining favorable root traits under high-temperature stress. Notably, lateral root-related traits, including root system width and second-pair seminal root length, showed greater sensitivity to high-temperature stress and stronger genotype-dependent variation than vertical traits such as rooting depth and primary root length. This pattern suggests that primary root elongation may be developmentally more conserved, whereas lateral-root development is more plastic and responsive to stress conditions [52,53,54].
Under control conditions, MSD417 and MSD034 exhibited broader lateral root system development than the other tested genotypes, suggesting greater capacity for horizontal root expansion and resource acquisition [13]. A key observation of this study was that high-temperature stress had a stronger effect on lateral-root-related traits than on vertical-root traits, indicating that lateral-root development may represent a major component of RSA plasticity under stress conditions. The development and orientation of lateral roots are known to be regulated by gravitropic set-point angles and auxin-mediated signaling pathways [55,56,57,58,59,60,61,62,63]. In addition, auxin and cytokinin play important roles in regulating root meristem activity under temperature stress conditions [64,65,66,67,68,69,70]. Therefore, the enhanced lateral-root development and stress responsiveness observed in MSD417 and MSD034 may reflect genotype-specific differences in the regulation of root growth orientation and stress-responsive root plasticity. Because the MSD population incorporates genetic diversity derived from Ae. tauschii, these RSA characteristics may represent useful genetic resources for further investigation of root developmental responses under stress conditions.
Integrative analyses based on stress indices and multivariate approaches highlighted distinct genotype-specific response strategies under high-temperature stress [71,72]. In particular, MSD417 and MSD034 maintained relatively higher root performance under stress, whereas MSD392 exhibited greater sensitivity. By contrast, MSD054 showed weak associations with both tolerance and sensitivity-related indices, suggesting a distinct response pattern characterized by limited responsiveness rather than strong tolerance or susceptibility. Its apparent stability may not reflect active stress tolerance but rather a limited baseline root system that undergoes minimal change under stress. This observation highlights an important distinction between true tolerance, defined by the maintenance of high performance under stress, and passive stability, which results from an inherently low growth potential. Similar distinctions between tolerance and avoidance or low responsiveness have been discussed in stress physiology studies [73,74]. Such distinctions are crucial when selecting genotypes for breeding programs, as stable but low-performing genotypes may not contribute to yield improvement under stress conditions.
Taken together, the contrasting RSA responses observed among the evaluated genotypes suggest the presence of multiple adaptive response strategies under high-temperature stress. These patterns broadly align with conceptual frameworks describing plant stress responses as combinations of tolerance, sensitivity, and avoidance strategies [73,75]. The present results further demonstrate that the MSD population encompasses substantial diversity in stress-responsive RSA plasticity, which can be effectively resolved through integrated phenotypic and index-based analyses.
From a breeding perspective, these findings emphasize the importance of identifying genotypes with both high baseline performance and the capacity to maintain functional RSA under stress conditions. Traits associated with lateral-root expansion, such as SPSRL, RSW, and CHA, emerge as promising targets for selection. Previous studies have demonstrated that root architectural traits are closely linked to resource acquisition efficiency and yield stability under stress conditions [17,76,77]. Furthermore, integrating versatile, high-throughput root phenotyping platforms with genetically diverse populations such as the MSD population provides a powerful framework for identifying loci associated with stress-adaptive RSA traits [19,27,28]. Further studies should focus on validating these traits under field conditions and linking them to yield stability to fully exploit their potential in wheat improvement.

4. Materials and Methods

4.1. Plant Material

Seeds of bread wheat cultivar ‘Norin 61’ (hereafter referred to as N61) were kindly provided by Prof. Hiroyuki Tanaka (Faculty of Agriculture, Tottori University, Tottori, Japan). Seeds of MSD genotypes (MSD034, MSD054, MSD296, MSD392, and MSD417) were kindly provided by Dr. Yasir Serag Alnor Gorafi (Arid Land Research Center, Tottori University, Tottori, Japan). The seeds were multiplied in pots at a glasshouse facility in the Faculty of Agriculture, Tottori University, Tottori, Japan, and fully mature seeds were harvested in 2024 and used for the experiments.

4.2. Plant Growth

Wheat seedlings were grown using a calico-cloth-based growth panel system described elsewhere [28]. Briefly, the growth panel consisted of an acrylic board (31 cm height, 30 cm width, and 0.5 cm thickness) layered with two sheets of paper towel (Kimtowel, Nippon Paper Crecia, Tokyo, Japan) soaked with nutrient solution (2000-fold diluted HYPONeX solution, Hyponex Japan, Osaka, Japan), and a black calico cloth. Germinated seeds were secured on the cloth with rubber bands 2 cm below the edge of the panel top. The stack was further covered with a high-density polyethylene sheet (0.05 mm width), followed by an additional layer of black calico cloth, and the assembly was secured with clips. The assembled panels were placed vertically in a plastic tray filled with a 2000-fold-diluted HYPONeX nutrient solution (to a depth of 3 cm). The submerged paper towel and calico cloth ensured a steady supply of moisture and nutrients to seedlings via capillary action. A schematic illustration of the construction process for the calico-cloth-based growth panel system is provided in Supplementary Figure S1. The unit was placed in a growth chamber under the following conditions: 14/10 h light/dark regimes, 22 °C/18 °C day/night air temperatures, light intensity of approximately 350 µmol m−2 s−1, and relative humidity of 50/60%. The panels were incubated at normal air temperature conditions (22 °C/18 °C day/night), and after four days, half of the panels were transferred to a stress chamber for high-air-temperature treatment (42 °C/18 °C day/night) for another 4 days, while the control plants were maintained at normal temperatures (22 °C/18 °C).

4.3. Root Image Processing and Biomass Measurement

Root and shoot morphology was photographed daily using a bench-top photograph system (model ET16 Plus, CZUR Tech Co. Ltd., Oriental Science and Technology Building, No. 16, Keyuan Road, Nanashan District, Shenzhen, China), as described previously [28]. On the eighth day, the root and shoot were harvested separately, weighed on an electronic balance to record fresh weight, and then dried for 3 days in a drying oven at 80 °C to record their dry weight. Root images were processed using ImageJ (v1.54g) integrated with the SmartRoot (v4.21) plugin [78] to quantify total and individual root lengths, along with the convex hull area. Additional traits, including rooting depth, root system width, seminal root angle, and shoot height, were measured directly in ImageJ.

4.4. Stress Indices Calculation

Representative stress indices for plant growth, percent reduction (PR) [79], stress tolerance index (STI) [80], stress susceptibility percentage index (SSPI) [81], and mean relative performance (MRP) [82], were calculated in Microsoft Excel (Microsoft 365, Microsoft, Redmond, WA, USA) according to the following formulas:
PR = (Yc − Ys)/Yc × 100
STI = (Ys × Yc)/(Yc)2
SSPI = (Yc − Ys)/2 × (Xc) × 100
MRP = (Ys/Xs) + (Yc/Xc)
where Yc and Ys represent the mean values of a given trait for a genotype under control and high-air-temperature conditions, respectively, and Xc and Xs represent the corresponding mean values across all genotypes under control and high-air-temperature conditions, respectively.

4.5. Statistical Analysis

Preliminary data formatting was performed in Microsoft Excel (Microsoft 365). All subsequent statistical analyses were conducted using the R statistical environment (v4.5.1; R Core Team, 2025). Bar plots were prepared in Microsoft Excel (Microsoft 365), where the other visualizations were conducted using the R statistical environment. Tukey’s HSD method was conducted using the agricolae package (version 1.3.7), while Student’s t-test was performed using the R base package stats (version 4.5.1). Hierarchical clustering analysis (HCA), pairwise phenotypic distance analysis (Euclidean distances), and principal component analysis (PCA) were performed by pheatmap (version 1.0.13), R base package stats (version 4.5.1), and FactoMineR (version 2.12) packages, respectively. All custom R scripts developed for this study are available in Supplementary Document S1.

5. Conclusions

The substantial variation in root architectural patterns and plasticity to high-air-temperature stress observed among synthetically derived wheat MSD lines highlights the value of this population for studying root system architecture (RSA) under stress conditions. In particular, lateral-root-related traits, including second-pair seminal root length, root system width, and convex hull area, were more responsive than vertical-root traits. Integrated phenotypic and stress index analyses further revealed distinct genotype-specific response strategies, ranging from stress tolerance to sensitivity and limited responsiveness. These findings emphasize the importance of distinguishing true stress tolerance from passive stability and support the potential value of lateral root traits as targets for selection in breeding programs. Furthermore, integrating genetically diverse germplasm with high-throughput root phenotyping approaches provides a useful framework for investigating RSA-mediated stress adaptation. Future studies should validate these findings under field conditions and clarify the relationship between RSA traits and yield stability under stress environments.

Supplementary Materials

The following supporting information can be downloaded at: https://www.mdpi.com/article/10.3390/stresses6020033/s1. Supplementary Document S1 (Supplementary Figure S1): Schematic illustration of the construction steps of the calico-cloth-based root growth panel; Supplementary Document S2: R-scripts for the processing of data for root system architecture; Supplementary Table S1: Descriptive statistics of root and shoot traits of the tested genotypes at the contrasting temperatures; Supplementary Table S2: Percent reduction of different root and shoot traits under high-temperature conditions compared to control conditions in wheat genotype; Supplementary Table S3: Stress susceptibility percentage index of different root and shoot traits under high-temperature conditions compared to control conditions in wheat genotype; Supplementary Table S4: Mean relative performance of different root and shoot traits under high-temperature condition compared to control conditions in wheat genotype; Supplementary Table S5: Stress tolerance index of different root and shoot traits under high-temperature condition compared to control conditions in wheat genotype.

Author Contributions

Conceptualization, S.M.M.I. and K.A.; methodology, S.M.M.I. and K.A.; software, S.M.M.I.; validation, S.M.M.I., I.S.A.T. and K.A.; formal analysis, S.M.M.I.; investigation, S.M.M.I.; resources, S.M.M.I.; data curation, S.M.M.I.; writing—original draft preparation, S.M.M.I.; writing—review and editing, I.S.A.T. and K.A.; visualization, S.M.M.I. and K.A.; supervision, K.A.; project administration, K.A.; funding acquisition, K.A. All authors have read and agreed to the published version of the manuscript.

Funding

This research was funded by the Project Marginal Region Agriculture, the Arid Land Research Center, Tottori University, and the IPDRE Program, Tottori University.

Institutional Review Board Statement

Not applicable.

Informed Consent Statement

Not applicable.

Data Availability Statement

The root images of wheat N61, MSD034, MSD054, MSD296, MSD392, and MSD417 are deposited in the Zenodo data repository under https://doi.org/10.5281/zenodo.19708100, https://doi.org/10.5281/zenodo.19708508, https://doi.org/10.5281/zenodo.19708809, https://doi.org/10.5281/zenodo.19709019, https://doi.org/10.5281/zenodo.19709196, and https://doi.org/10.5281/zenodo.19709468, respectively. The other original contributions presented in the study are included in the article/Supplementary Materials.

Acknowledgments

We are grateful to Hiroyuki Tanaka (Faculty of Agriculture, Tottori University, Tottori, Japan) and Yasir Serag Alnor Gorafi (Graduate School of Agriculture, Kyoto University, Kyoto, Japan) for providing seeds of wheat cultivar Norin 61 and the MSD genotypes, respectively. We thank the staff members of the Laboratory of Molecular and Cellular Biology, Faculty of Agriculture, Tottori University, for their technical support in the laboratory.

Conflicts of Interest

The authors declare no conflicts of interest.

References

  1. Khan, M.I.; Kainat, Z.; Maqbool, S.; Mehwish, A.; Ahmad, S.; Suleman, H.M.; Mahmood, Z.; Ali, M.; Aziz, A.; Rasheed, A.; et al. Genome-Wide Association for Heat Tolerance at Seedling Stage in Historical Spring Wheat Cultivars. Front. Plant Sci. 2022, 13, 972481. [Google Scholar] [CrossRef]
  2. Jararweh, Y.; Fatima, S.; Jarrah, M.; AlZu’bi, S. Smart and Sustainable Agriculture: Fundamentals, Enabling Technologies, and Future Directions. Comput. Electr. Eng. 2023, 110, 108799. [Google Scholar] [CrossRef]
  3. Fu, C.; Zhou, Y.; Liu, A.; Chen, R.; Yin, L.; Li, C.; Mao, H. Genome-Wide Association Study for Seedling Heat Tolerance under Two Temperature Conditions in Bread Wheat (Triticum aestivum L.). BMC Plant Biol. 2024, 24, 430. [Google Scholar] [CrossRef]
  4. Liu, B.; Asseng, S.; Müller, C.; Ewert, F.; Elliott, J.; Lobell, D.B.; Martre, P.; Ruane, A.C.; Wallach, D.; Jones, J.W.; et al. Similar Estimates of Temperature Impacts on Global Wheat Yield by Three Independent Methods. Nat. Clim. Change 2016, 6, 1130–1136. [Google Scholar] [CrossRef]
  5. Zhao, C.; Liu, B.; Piao, S.; Wang, X.; Lobell, D.B.; Huang, Y.; Huang, M.; Yao, Y.; Bassu, S.; Ciais, P.; et al. Temperature Increase Reduces Global Yields of Major Crops in Four Independent Estimates. Proc. Natl. Acad. Sci. USA 2017, 114, 9326–9331. [Google Scholar] [CrossRef] [PubMed]
  6. Tahir, I.S.A.; Nakata, N.; Yamaguchi, T. Responses of Three Wheat Genotypes to High Soil Temperature during Grain Filling. Plant Prod. Sci. 2005, 8, 192–198. [Google Scholar] [CrossRef]
  7. Tahir, I.S.A.; Nakata, N.; Yamaguchi, T.; Nakano, J.; Ali, A.M. Influence of High Shoot and Root-Zone Temperatures on Growth of Three Wheat Genotypes during Early Vegetative Stages. J. Agron. Crop Sci. 2008, 194, 141–151. [Google Scholar] [CrossRef]
  8. Cope, J.E.; Berckx, F.; Galinski, A.; Lentz, J.; Nagel, K.A.; Fiorani, F.; Weih, M. Precrop-Treated Soil Influences Wheat (Triticum aestivum L.) Root System Architecture and Its Response to Drought. Front. Plant Sci. 2024, 15, 1389593. [Google Scholar] [CrossRef]
  9. Huang, Y.; Zhang, N. A Century of Winter Wheat Breeding Decreases Root Hydraulic Traits. Plant Physiol. 2025, 198, kiaf235. [Google Scholar] [CrossRef] [PubMed]
  10. Lynch, J.P. Roots of the Second Green Revolution. Aust. J. Bot. 2007, 55, 493–512. [Google Scholar] [CrossRef]
  11. Ober, E.S.; Alahmad, S.; Cockram, J.; Forestan, C.; Hickey, L.T.; Kant, J.; Maccaferri, M.; Marr, E.; Milner, M.; Pinto, F.; et al. Wheat Root Systems as a Breeding Target for Climate Resilience. Theor. Appl. Genet. 2021, 134, 1645–1662. [Google Scholar] [CrossRef]
  12. Lynch, J.P. Harnessing Root Architecture to Address Global Challenges. Plant J. 2022, 109, 415–431. [Google Scholar] [CrossRef]
  13. Kang, Y.; Rambla, C.; Haeften, S.V.; Fu, B.; Akinlade, O.; Potgieter, A.B.; Borrell, A.K.; Mace, E.; Jordan, D.R.; Alahmad, S.; et al. Seminal Root Angle is Associated with Root System Architecture in Durum Wheat. Food Energy Secur. 2024, 13, e570. [Google Scholar] [CrossRef]
  14. Johnson, M.G.; Tingey, D.T.; Phillips, D.L.; Storm, M.J. Advancing Fine Root Research with Minirhizotrons. Environ. Exp. Bot. 2001, 45, 263–289. [Google Scholar] [CrossRef] [PubMed]
  15. Trachsel, S.; Kaeppler, S.M.; Brown, K.M.; Lynch, J.P. Shovelomics: High Throughput Phenotyping of Maize (Zea mays L.) Root Architecture in the Field. Plant Soil 2011, 341, 75–87. [Google Scholar] [CrossRef]
  16. Wasson, A.P.; Rebetzke, G.J.; Kirkegaard, J.A.; Christopher, J.; Richards, R.A.; Watt, M. Soil Coring at Multiple Field Environments Can Directly Quantify Variation in Deep Root Traits to Select Wheat Genotypes for Breeding. J. Exp. Bot. 2014, 65, 6231–6249. [Google Scholar] [CrossRef] [PubMed]
  17. Maqbool, S.; Hassan, M.A.; Xia, X.; York, L.M.; Rasheed, A.; He, Z. Root System Architecture in Cereals: Progress, Challenges and Perspective. Plant J. 2022, 110, 23–42. [Google Scholar] [CrossRef] [PubMed]
  18. Böhm, W. Methods of Studying Root Systems; Ecological Studies; Springer: Berlin/Heidelberg, Germany, 1979; Volume 33. [Google Scholar]
  19. Chen, Y.; Palta, J.; Prasad, P.V.V.; Siddique, K.H.M. Phenotypic Variability in Bread Wheat Root Systems at the Early Vegetative Stage. BMC Plant Biol. 2020, 20, 185. [Google Scholar] [CrossRef]
  20. Gioia, T.; Galinski, A.; Lenz, H.; Müller, C.; Lentz, J.; Heinz, K.; Briese, C.; Putz, A.; Fiorani, F.; Watt, M.; et al. GrowScreen-PaGe, a Non-Invasive, High-Throughput Phenotyping System Based on Germination Paper to Quantify Crop Phenotypic Diversity and Plasticity of Root Traits under Varying Nutrient Supply. Funct. Plant Biol. 2016, 44, 76–93. [Google Scholar] [CrossRef]
  21. Nagel, K.A.; Putz, A.; Gilmer, F.; Heinz, K.; Fischbach, A.; Pfeifer, J.; Faget, M.; Blossfeld, S.; Ernst, M.; Dimaki, C.; et al. GROWSCREEN-Rhizo is a Novel Phenotyping Robot Enabling Simultaneous Measurements of Root and Shoot Growth for Plants Grown in Soil-Filled Rhizotrons. Funct. Plant Biol. 2012, 39, 891–904. [Google Scholar] [CrossRef]
  22. Nagel, K.A.; Lenz, H.; Kastenholz, B.; Gilmer, F.; Averesch, A.; Putz, A.; Heinz, K.; Fischbach, A.; Scharr, H.; Fiorani, F.; et al. The Platform GrowScreen-Agar Enables Identification of Phenotypic Diversity in Root and Shoot Growth Traits of Agar Grown Plants. Plant Methods 2020, 16, 89. [Google Scholar] [CrossRef]
  23. Neumann, G.; George, T.S.; Plassard, C. Strategies and Methods for Studying the Rhizosphere—The Plant Science Toolbox. Plant Soil 2009, 321, 431–456. [Google Scholar] [CrossRef]
  24. Rellán-Álvarez, R.; Lobet, G.; Lindner, H.; Pradier, P.-L.; Sebastian, J.; Yee, M.-C.; Geng, Y.; Trontin, C.; LaRue, T.; Schrager-Lavelle, A.; et al. GLO-Roots: An Imaging Platform Enabling Multidimensional Characterization of Soil-Grown Root Systems. eLife 2015, 4, e07597. [Google Scholar] [CrossRef]
  25. Richard, C.A.; Hickey, L.T.; Fletcher, S.; Jennings, R.; Chenu, K.; Christopher, J.T. High-Throughput Phenotyping of Seminal Root Traits in Wheat. Plant Methods 2015, 11, 13. [Google Scholar] [CrossRef] [PubMed]
  26. Schuurman, J.J.; Goedewaagen, M.A.J. Methods for the Examination of Root Systems and Roots: Methods in Use at the Institute for Soil Fertility for Eco-Morphological Root Investigations, 2nd ed.; Centre for Agricultural Publishing and Documentation: Wageningen, The Netherlands, 1971. [Google Scholar]
  27. Shorinola, O.; Kaye, R.; Golan, G.; Peleg, Z.; Kepinski, S.; Uauy, C. Genetic Screening for Mutants with Altered Seminal Root Numbers in Hexaploid Wheat Using a High-Throughput Root Phenotyping Platform. G3 Genes Genomes Genet. 2019, 9, 2799–2809. [Google Scholar] [CrossRef] [PubMed]
  28. Islam, S.M.M.; Tahir, I.S.A.; Akashi, K. A Practical Phenotyping Framework for Root System Architecture Reveals Enhanced Root Vigor in an Aegilops tauschii-Derived Wheat Line. bioRxiv 2026. [Google Scholar] [CrossRef]
  29. Gorafi, Y.S.A.; Kim, J.-S.; Elbashir, A.A.E.; Tsujimoto, H. A Population of Wheat Multiple Synthetic Derivatives: An Effective Platform to Explore, Harness and Utilize Genetic Diversity of Aegilops tauschii for Wheat Improvement. Theor. Appl. Genet. 2018, 131, 1615–1626. [Google Scholar] [CrossRef]
  30. Gorafi, Y.S.A.; Tahir, I.S.A.; Tsujimoto, H. A Multiple Synthetic Derivatives Population for Mining Aegilops tauschii Traits and Genes in a Background of Common Wheat. J. Plant Regist. 2025, 19, e20424. [Google Scholar] [CrossRef]
  31. Gaurav, K.; Arora, S.; Silva, P.; Sánchez-Martín, J.; Horsnell, R.; Gao, L.; Brar, G.S.; Widrig, V.; John Raupp, W.; Singh, N.; et al. Population Genomic Analysis of Aegilops tauschii Identifies Targets for Bread Wheat Improvement. Nat. Biotechnol. 2022, 40, 422–431. [Google Scholar] [CrossRef]
  32. Awan, M.J.A.; Rasheed, A.; Saeed, N.A.; Mansoor, S. Aegilops tauschii Presents a Genetic Roadmap for Hexaploid Wheat Improvement. Trends Genet. 2022, 38, 307–309. [Google Scholar] [CrossRef]
  33. Wang, H.; Hu, Z.; Huang, K.; Han, Y.; Zhao, A.; Han, H.; Song, L.; Fan, C.; Li, R.; Xin, M.; et al. Three Genomes Differentially Contribute to the Seedling Lateral Root Number in Allohexaploid Wheat: Evidence from Phenotype Evolution and Gene Expression. Plant J. 2018, 95, 976–987. [Google Scholar] [CrossRef] [PubMed]
  34. Mohammedali, A.K.H.; Gorafi, Y.S.A.; Kamal, N.M.; Tahir, I.S.A.; Tsujimoto, H.; Taniguchi, T. Exploring Genetic Variation in Root Traits and Root–Fungal Associations in Aegilops tauschii. Agriculture 2025, 15, 1889. [Google Scholar] [CrossRef]
  35. Mohammedali, A.K.H.; Kamal, N.M.; Gorafi, Y.S.A.; Tahir, I.S.A.; Tsujimoto, H.; Taniguchi, T. Variation in Root Traits and Root-Endophyte Interactions in Primary Synthetic Wheat Derived from Aegilops tauschii Collected from Diverse Soil Types. Agronomy 2025, 15, 1443. [Google Scholar] [CrossRef]
  36. Elbashir, A.A.E.; Gorafi, Y.S.A.; Tahir, I.S.A.; Elhashimi, A.M.A.; Abdalla, M.G.A.; Tsujimoto, H. Genetic Variation in Heat Tolerance-Related Traits in a Population of Wheat Multiple Synthetic Derivatives. Breed. Sci. 2017, 67, 483–492. [Google Scholar] [CrossRef]
  37. Matsunaga, S. Multi-Omics Studies of Thermal Response Towards the Development of Heat-Tolerant Bread Wheat. Ph.D. Thesis, Tottori University, Tottori, Japan, 2022. [Google Scholar]
  38. Fradgley, N.; Evans, G.; Biernaskie, J.M.; Cockram, J.; Marr, E.C.; Oliver, A.G.; Ober, E.; Jones, H. Effects of Breeding History and Crop Management on the Root Architecture of Wheat. Plant Soil 2020, 452, 587–600. [Google Scholar] [CrossRef] [PubMed]
  39. Giehl, R.F.H.; Gruber, B.D.; von Wirén, N. It’s Time to Make Changes: Modulation of Root System Architecture by Nutrient Signals. J. Exp. Bot. 2014, 65, 769–778. [Google Scholar] [CrossRef]
  40. Hodge, A.; Berta, G.; Doussan, C.; Merchan, F.; Crespi, M. Plant Root Growth, Architecture and Function. Plant Soil 2009, 321, 153–187. [Google Scholar] [CrossRef]
  41. Liu, Z.; Qin, T.; Atienza, M.; Zhao, Y.; Nguyen, H.; Sheng, H.; Olukayode, T.; Song, H.; Panjvani, K.; Magalhaes, J.; et al. Constitutive Basis of Root System Architecture: Uncovering a Promising Trait for Breeding Nutrient- and Drought-Resilient Crops. aBIOTECH 2023, 4, 315–331. [Google Scholar] [CrossRef]
  42. Paez-Garcia, A.; Motes, C.M.; Scheible, W.-R.; Chen, R.; Blancaflor, E.B.; Monteros, M.J. Root Traits and Phenotyping Strategies for Plant Improvement. Plants 2015, 4, 334–355. [Google Scholar] [CrossRef]
  43. Tracy, S.R.; Nagel, K.A.; Postma, J.A.; Fassbender, H.; Wasson, A.; Watt, M. Crop Improvement from Phenotyping Roots: Highlights Reveal Expanding Opportunities. Trends Plant Sci. 2020, 25, 105–118. [Google Scholar] [CrossRef]
  44. Sharma, S.; Singh, V.; Tanwar, H.; Mor, V.S.; Kumar, M.; Punia, R.C.; Dalal, M.S.; Khan, M.; Sangwan, S.; Bhuker, A.; et al. Impact of High Temperature on Germination, Seedling Growth and Enzymatic Activity of Wheat. Agriculture 2022, 12, 1500. [Google Scholar] [CrossRef]
  45. Tsujimoto, H.; Sohail, Q.; Matsuoka, Y. Broadening the Genetic Diversity of Common and Durum Wheat for Abiotic Stress Tolerance Breeding. In Advances in Wheat Genetics: From Genome to Field; Ogihara, Y., Takumi, S., Handa, H., Eds.; Springer: Tokyo, Japan, 2015; pp. 233–238. [Google Scholar]
  46. Emam, A.I.I.; Kamal, N.M.; Gorafi, Y.S.A.; Tahir, I.S.A.; Balla, M.Y.; Tsujimoto, H.; Ishii, T. Enriched Grain Minerals in Aegilops tauschii-Derived Common Wheat Population under Heat-Stress Environments. Sci. Rep. 2025, 15, 5624. [Google Scholar] [CrossRef] [PubMed]
  47. Emam, A.I.I.; Tahir, I.S.A.; Kamal, N.M.; Gorafi, Y.S.A.; Tsujimoto, H.; Ishii, T. Genetic Variation and Genome-Wide Association Analysis of Nitrogen Use Efficiency-Related Traits Under Combined Heat and Nitrogen-Deficient Stress in an Aegilops tauschii-Derived Wheat Population. Front. Plant Sci. 2025, 16, 1621916. [Google Scholar] [CrossRef] [PubMed]
  48. Itam, M.O.; Gorafi, Y.S.A.; Tahir, I.S.A.; Tsujimoto, H. Genetic Variation in Drought Resilience-Related Traits Among Wheat Multiple Synthetic Derivative Lines: Insights for Climate Resilience Breeding. Breed. Sci. 2021, 71, 435–443. [Google Scholar] [CrossRef]
  49. Mohamed, I.E.S.; Oe, H.; Kamal, N.M.; Mustafa, H.M.; Gorafi, Y.S.A.; Tahir, I.S.A.; Tsujimoto, H.; Tanaka, H. Enhancing Wheat Flour Quality Through Introgression of High-Molecular-Weight Glutenin Subunits from Aegilops tauschii Accessions. Front. Sustain. Food Syst. 2022, 6, 887795. [Google Scholar] [CrossRef]
  50. Al-Ashkar, I.; Alotaibi, M.; Refay, Y.; Ghazy, A.; Zakri, A.; Al-Doss, A. Selection Criteria for High-Yielding and Early-Flowering Bread Wheat Hybrids Under Heat Stress. PLoS ONE 2020, 15, e0236351. [Google Scholar] [CrossRef]
  51. Farhad, M.; Kumar, U.; Tomar, V.; Bhati, P.K.; Krishnan, J.N.; Kishowar-E-Mustarin; Barek, V.; Brestic, M.; Hossain, A. Heat Stress in Wheat: A Global Challenge to Feed Billions in the Current Era of the Changing Climate. Front. Sustain. Food Syst. 2023, 7, 1203721. [Google Scholar] [CrossRef]
  52. Keerthi, G.M.; Mallikarjuna, M.G.; Jha, S.K.; Pandey, R.; Veeraya, P.; Lohithaswa, H.C.; Chinnusamy, V. Unravelling Root System Architecture Plasticity in Response to Abiotic Stresses in Maize. Sci. Rep. 2025, 15, 20433. [Google Scholar] [CrossRef]
  53. Karlova, R.; Boer, D.; Hayes, S.; Testerink, C. Root Plasticity Under Abiotic Stress. Plant Physiol. 2021, 187, 1057–1070. [Google Scholar] [CrossRef]
  54. Smith, S.; De Smet, I. Root System Architecture: Insights from Arabidopsis and Cereal Crops. Philos. Trans. R. Soc. B Biol. Sci. 2012, 367, 1441–1452. [Google Scholar] [CrossRef]
  55. Digby, J.; Firn, R.D. The Gravitropic Set-Point Angle (GSA): The Identification of an Important Developmentally Controlled Variable Governing Plant Architecture. Plant Cell Environ. 1995, 18, 1434–1440. [Google Scholar] [CrossRef]
  56. Kirschner, G.K.; Hochholdinger, F.; Salvi, S.; Bennett, M.J.; Huang, G.; Bhosale, R.A. Genetic Regulation of the Root Angle in Cereals. Trends Plant Sci. 2024, 29, 814–822. [Google Scholar] [CrossRef]
  57. Roychoudhry, S.; Kieffer, M.; Del Bianco, M.; Liao, C.-Y.; Weijers, D.; Kepinski, S. The Developmental and Environmental Regulation of Gravitropic Setpoint Angle in Arabidopsis and Bean. Sci. Rep. 2017, 7, 42664. [Google Scholar] [CrossRef] [PubMed]
  58. Roychoudhry, S.; Sageman-Furnas, K.; Wolverton, C.; Grones, P.; Tan, S.; Molnár, G.; De Angelis, M.; Goodman, H.L.; Capstaff, N.; Lloyd, J.P.B.; et al. Antigravitropic PIN Polarization Maintains Non-Vertical Growth in Lateral Roots. Nat. Plants 2023, 9, 1500–1513. [Google Scholar] [CrossRef] [PubMed]
  59. Roychoudhry, S.; Sageman-Furnas, K.; Taylor, H.J.; Showpnil, I.; Wolverton, C.; Friml, J.; Del Bianco, M.; Kepinski, S. Angle Dependence as a Unifying Feature of Root Graviresponse Modules. Proc. Natl. Acad. Sci. USA 2025, 122, e2506400122. [Google Scholar] [CrossRef]
  60. Watt, M.; Moosavi, S.; Cunningham, S.C.; Kirkegaard, J.A.; Rebetzke, G.J.; Richards, R.A. A Rapid, Controlled-Environment Seedling Root Screen for Wheat Correlates Well with Rooting Depths at Vegetative, but Not Reproductive, Stages at Two Field Sites. Ann. Bot. 2013, 112, 447–455. [Google Scholar] [CrossRef]
  61. Rosquete, M.R.; von Wangenheim, D.; Marhavý, P.; Barbez, E.; Stelzer, E.H.K.; Benková, E.; Maizel, A.; Kleine-Vehn, J. An Auxin Transport Mechanism Restricts Positive Orthogravitropism in Lateral Roots. Curr. Biol. 2013, 23, 817–822. [Google Scholar] [CrossRef]
  62. Kaye, R.; Stemp-Walsh, F.; Kitching, Z.; King, A.; Bianco, M.D.; Roychoudhry, S.; Kepinski, S. Roots of Wheat and Rice Maintain Gravitropic Setpoint Angles. bioRxiv 2026. [Google Scholar] [CrossRef]
  63. Chhun, T.; Taketa, S.; Tsurumi, S.; Ichii, M. The Effects of Auxin on Lateral Root Initiation and Root Gravitropism in a Lateral Rootless Mutant Lrt1 of Rice (Oryza sativa L.). Plant Growth Regul. 2003, 39, 161–170. [Google Scholar] [CrossRef]
  64. Vanneste, S.; Friml, J. Auxin: A Trigger for Change in Plant Development. Cell 2009, 136, 1005–1016. [Google Scholar] [CrossRef]
  65. Dharmasiri, N.; Dharmasiri, S.; Weijers, D.; Lechner, E.; Yamada, M.; Hobbie, L.; Ehrismann, J.S.; Jürgens, G.; Estelle, M. Plant Development is Regulated by a Family of Auxin Receptor F Box Proteins. Dev. Cell 2005, 9, 109–119. [Google Scholar] [CrossRef]
  66. Zhu, J.; Zhang, K.-X.; Wang, W.-S.; Gong, W.; Liu, W.-C.; Chen, H.-G.; Xu, H.-H.; Lu, Y.-T. Low Temperature Inhibits Root Growth by Reducing Auxin Accumulation via ARR1/12. Plant Cell Physiol. 2015, 56, 727–736. [Google Scholar] [CrossRef]
  67. Růžička, K.; Šimášková, M.; Duclercq, J.; Petrášek, J.; Zažímalová, E.; Simon, S.; Friml, J.; Van Montagu, M.C.E.; Benková, E. Cytokinin Regulates Root Meristem Activity via Modulation of the Polar Auxin Transport. Proc. Natl. Acad. Sci. USA 2009, 106, 4284–4289. [Google Scholar] [CrossRef]
  68. Nadella, V.; Shipp, M.J.; Muday, G.K.; Wyatt, S.E. Evidence for Altered Polar and Lateral Auxin Transport in the Gravity Persistent Signal (Gps) Mutants of Arabidopsis. Plant Cell Environ. 2006, 29, 682–690. [Google Scholar] [CrossRef] [PubMed]
  69. Grieneisen, V.A.; Xu, J.; Marée, A.F.M.; Hogeweg, P.; Scheres, B. Auxin Transport is Sufficient to Generate a Maximum and Gradient Guiding Root Growth. Nature 2007, 449, 1008–1013. [Google Scholar] [CrossRef]
  70. Dello Ioio, R.; Linhares, F.S.; Scacchi, E.; Casamitjana-Martinez, E.; Heidstra, R.; Costantino, P.; Sabatini, S. Cytokinins Determine Arabidopsis Root-Meristem Size by Controlling Cell Differentiation. Curr. Biol. 2007, 17, 678–682. [Google Scholar] [CrossRef]
  71. Lamba, K.; Kumar, M.; Singh, V.; Chaudhary, L.; Sharma, R.; Yashveer, S.; Dalal, M.S. Heat Stress Tolerance Indices for Identification of the Heat Tolerant Wheat Genotypes. Sci. Rep. 2023, 13, 10842. [Google Scholar] [CrossRef]
  72. Bhandari, R.; Paudel, H.; Alharbi, S.A.; Ansari, M.J.; Poudel, M.R.; Neupane, M.P.; Solanki, P.; Kushwaha, U.K.S. Evaluating Stress Tolerance Indices for Their Comparative Validity to Access Terminal Heat Stress and Heat Drought Tolerance of Winter Wheat (Triticum aestivum L.) Genotypes. J. Agric. Food Res. 2024, 18, 101506. [Google Scholar] [CrossRef]
  73. Blum, A. Plant Breeding for Water-Limited Environments; Springer: New York, NY, USA, 2011. [Google Scholar]
  74. Tardieu, F. Any Trait or Trait-Related Allele Can Confer Drought Tolerance: Just Design the Right Drought Scenario. J. Exp. Bot. 2012, 63, 25–31. [Google Scholar] [CrossRef] [PubMed]
  75. Bandurska, H. Drought Stress Responses: Coping Strategy and Resistance. Plants 2022, 11, 922. [Google Scholar] [CrossRef] [PubMed]
  76. Xu, F.; Chen, S.; Yang, X.; Zhou, S.; Chen, X.; Li, J.; Zhan, K.; He, D. Genome-Wide Association Study on Seminal and Nodal Roots of Wheat Under Different Growth Environments. Front. Plant Sci. 2021, 11, 602399. [Google Scholar] [CrossRef]
  77. Nirmalaruban, R.; Yadav, R.; Sugumar, S.; Alekya, M.; Mazumder, A.K.; Babu, P.; Kumar, M.; Gaikwad, K.B.; Bainsla, N.K.; Singh, S.K.; et al. Rooting for Resilience: Central Metaxylem Area as a Breeding Target for Yield Gain and Resilience in Wheat (Triticum aestivum L.). BMC Plant Biol. 2025, 25, 493. [Google Scholar] [CrossRef]
  78. Lobet, G.; Pagès, L.; Draye, X. A Novel Image-Analysis Toolbox Enabling Quantitative Analysis of Root System Architecture. Plant Physiol. 2011, 157, 29–39. [Google Scholar] [CrossRef]
  79. Farshadfar, E.; Javadinia, J. Evaluation of Chickpea (Cicer arietinum L.) Genotypes for Drought Tolerance. Seed Plant Improv. J. 2011, 27, 517–537. [Google Scholar]
  80. Fernandez, G.C.J. Effective Selection Criteria for Assessing Plant Stress Tolerance. In Proceedings of the International Symposium on Adaptation of Vegetables and Other Food Crops in Temperature and Water Stress, Tainan/Shanhua, Taiwan, 13–18 August 1992; Kuo, C.G., Ed.; AVRDC Publication: Tainan, Taiwan; Shanhua, Taiwan, 1992; Volume 25, pp. 259–270. [Google Scholar]
  81. Moosavi, S.S.; Samadi, B.; Naghavi, M.R.; Zali, A.; Dashti, H.; Pourshahbazi, A. Introduction of New Indices to Identify Relative Drought Tolerance and Resistance in Wheat Genotypes. Desert 2008, 12, 165–178. [Google Scholar]
  82. Ramirez-Vallejo, P.; Kelly, J.D. Traits Related to Drought Resistance in Common Bean. Euphytica 1998, 99, 127–136. [Google Scholar] [CrossRef]
Figure 1. Variation in root and shoot morphological traits in contrasting temperatures of different wheat genotypes at day eight after germination. (A) rooting depth; (B) shoot height; (C) root dry weight; (D) shoot dry weight; (E) root-to-shoot ratio; (F) total root length; (G) specific root length; (H) primary root length; (I) first pair seminal root length; (J) second pair seminal root length; (K) root system width; and (L) convex hull area. Genotype data were compared using Tukey’s HSD post hoc test, and different letters indicate significant differences among genotypes under contrasting temperature conditions. Data for the same genotypes grown under contrasting temperature conditions were compared using Student’s t-test, where *, **, and *** indicate significance at p < 0.05, p < 0.01, and p < 0.001, respectively. Error bars indicate the standard deviation (SD), n = 6. Abbreviations of the trait parameters are shown in Table 1.
Stresses 06 00033 g001
Figure 2. Variation in seminal roots angle development of different wheat genotypes at day eight after germination. (A) First pair seminal root angle (FPSRA), and (B) second pair seminal root angle (SPSRA). Genotype data were compared using Tukey’s HSD post hoc test, and different letters denote significant differences among genotypes. Error bars indicate the standard deviation (SD), n = 12.
Stresses 06 00033 g002
Figure 3. Hierarchical cluster analysis and phenotypic distance of wheat genotypes under control and high-air-temperature conditions. (A) Double dendrogram and heatmap visualizing the clustering of wheat genotypes based on measured root and shoot traits. Rows represent genotypes in contrasting temperatures, and columns represent the measured traits. The color scale indicates standardized values (Z-scores), with red representing values above the mean and blue representing values below the mean. The clustering was performed using Ward’s method based on Euclidean distances. (B) Distance matrix illustrating phenotypic dissimilarity among samples. The color gradient ranges from blue (low distance, high similarity) to red (high distance, low similarity). Genotype name with _C extension explains plants in the control conditions, and genotype name with _H extension explains plants in the high-air-temperature conditions, n= 6. Abbreviations of the trait parameters are shown in Table 1.
Stresses 06 00033 g003
Figure 4. The radar plots showing stress tolerance indices of different root and shoot traits of different genotypes due to high-air-temperature stress. (A) Percent reduction in different traits, (B) stress susceptibility percentage index, (C) mean relative performance, and (D) stress tolerance index. Abbreviations of the trait parameters are shown in Table 1.
Stresses 06 00033 g004
Figure 5. Principal Component Analysis (PCA) biplot of wheat genotypes under contrasting temperature conditions (A), and genotypic variation and clustering based on high-temperature stress indices (B). Vectors indicate the direction and magnitude of trait associations. Genotypes oriented along specific vectors exhibit higher trait values. Genotype name with _C extension explains plants in the control conditions, and genotype name with _H extension explains plants in the high-temperature conditions. Abbreviations of the trait parameters are shown in Table 1. PR = percent reduction, SSPI = stress susceptibility percentage index, MRP = mean relative performance, and STI = stress tolerance index.
Stresses 06 00033 g005
Table 1. Analysis of variance for different root and shoot traits under high-air-temperature conditions compared to control conditions in wheat genotypes.
TraitAbbreviationUnitMean Square (MS)
Genotype (G)Treatment (T)G × T InteractionResidual
Rooting depthRDcm9.9 ns615.32 ***0.97 ns7.18
Shoot heightSHcm21.11 ***38.38 ***1.99 ns1.31
Root dry weightRDWmg11.1 ***94.81 ***5.38 **1.16
Shoot dry weightSDWmg43.34 ***3.89 ns5.86 *2.35
Root-to-shoot ratioRSR 0.13 **0.14 **0.01 *<0.01
Total root lengthTRLcm1014.68 ***16,384.7 ***28.73 ns66.82
Specific root lengthSRLcm mg−12.64 ***26.18 ***0.69 ns0.40
Primary root lengthPRLcm65.79 ***796.5 ***5.99 ns13.56
First pair, seminal root lengthFPSRLcm26.25 ***672.15 ***10.81 *3.99
Second pair, seminal root lengthSPSRLcm102.02 ***161.15 ***7.32 ns6.72
Root system widthRSWcm177.22 ***529.24 ***47.2 *18.09
Convex hull areaCHAcm256,761.94 ***403,428.16 ***13,979.88 **3138.52
First pair, seminal root angleFPSRAdegree2197.34 ***n.a.n.a.217.51
Second pair, seminal root angleSPSRAdegree3326.07 ***n.a.n.a.285.51
df 51560
* p < 0.05, ** p < 0.01, *** p < 0.001, ns = not significant, n.a. = not applicable, as both pairs of seminal roots developed before imposing high-temperature stress and had no treatment effect on seminal root-angle development.
Disclaimer/Publisher’s Note: The statements, opinions and data contained in all publications are solely those of the individual author(s) and contributor(s) and not of MDPI and/or the editor(s). MDPI and/or the editor(s) disclaim responsibility for any injury to people or property resulting from any ideas, methods, instructions or products referred to in the content.