
Physiological Trade-Offs Under Thermal Variability in the Giant Lion’s Paw Scallop (Nodipecten subnodosus): Metabolic Compensation and Oxidative Stress

 , ,
, ,  , and
, and
Abstract
1. Introduction
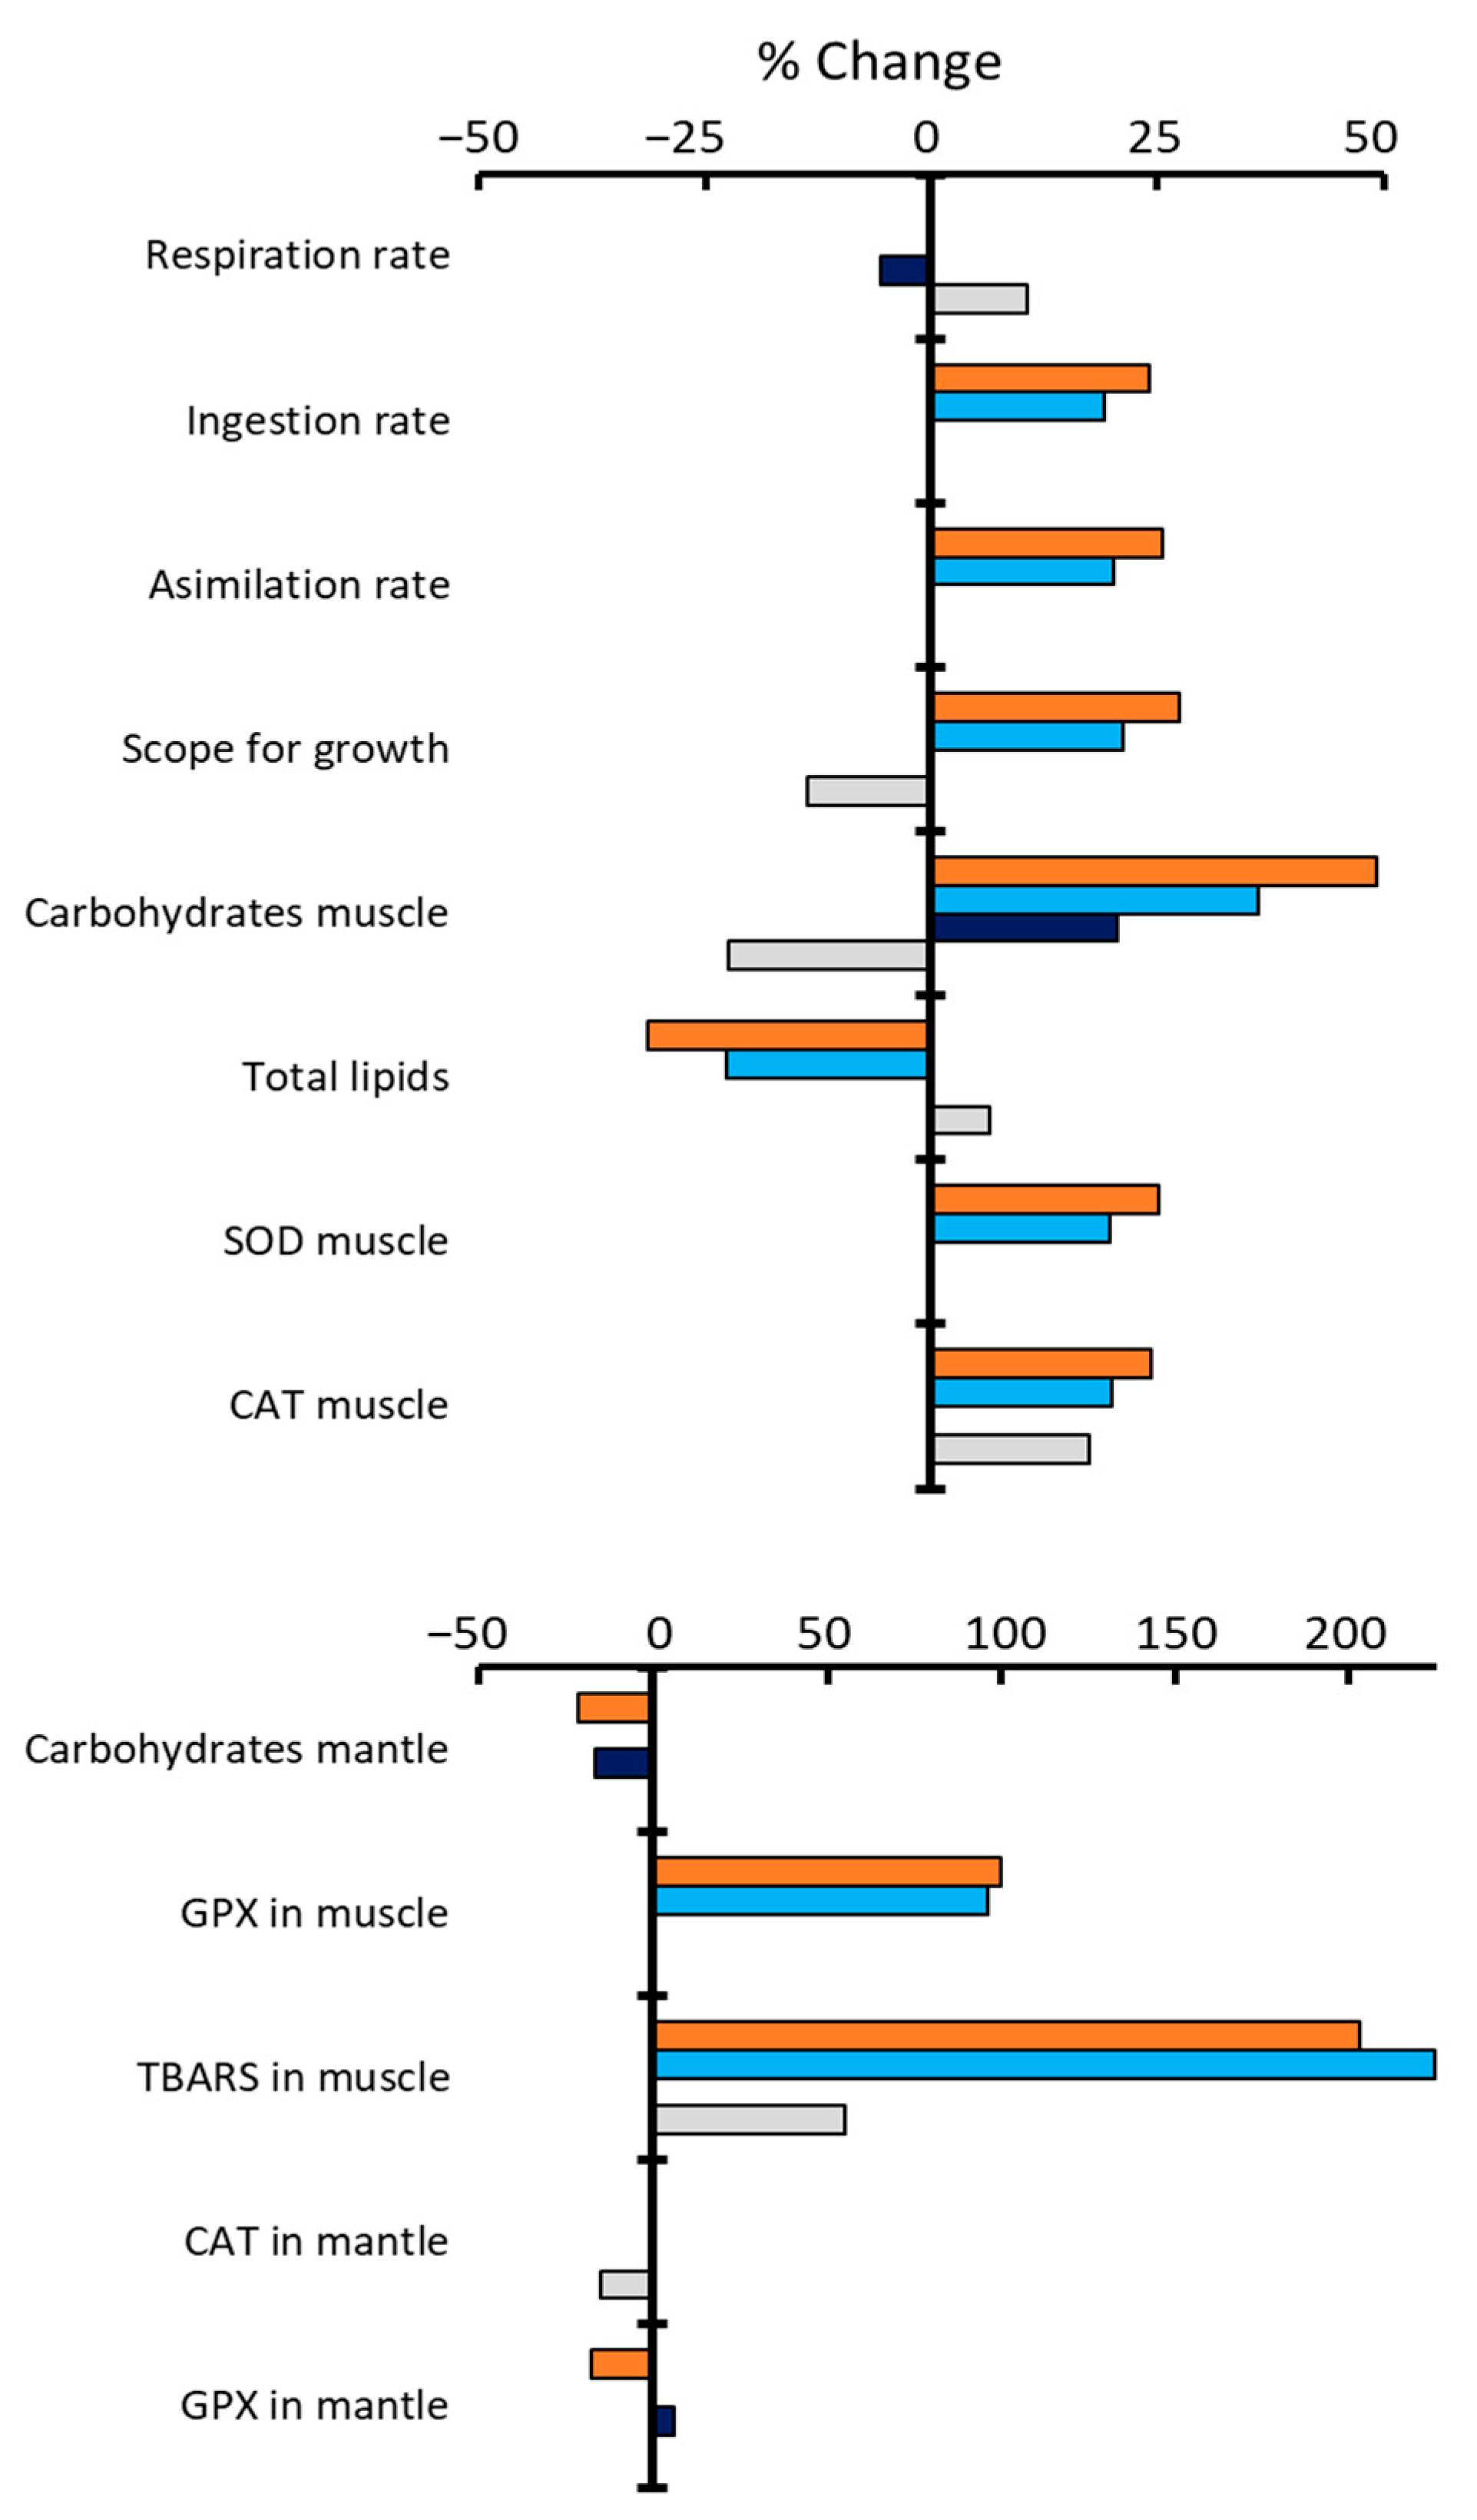
2. Results
3. Discussion
4. Materials and Methods
4.1. Source Organisms and Experimental Design
4.2. Energy Balance and Scope for Growth
4.3. Biochemical Analyses of Tissues
4.4. Oxidative Stress Indicators
4.5. Statistical Analyses
5. Conclusions
Supplementary Materials
Author Contributions
Funding
Data Availability Statement
Acknowledgments
Conflicts of Interest
Abbreviations
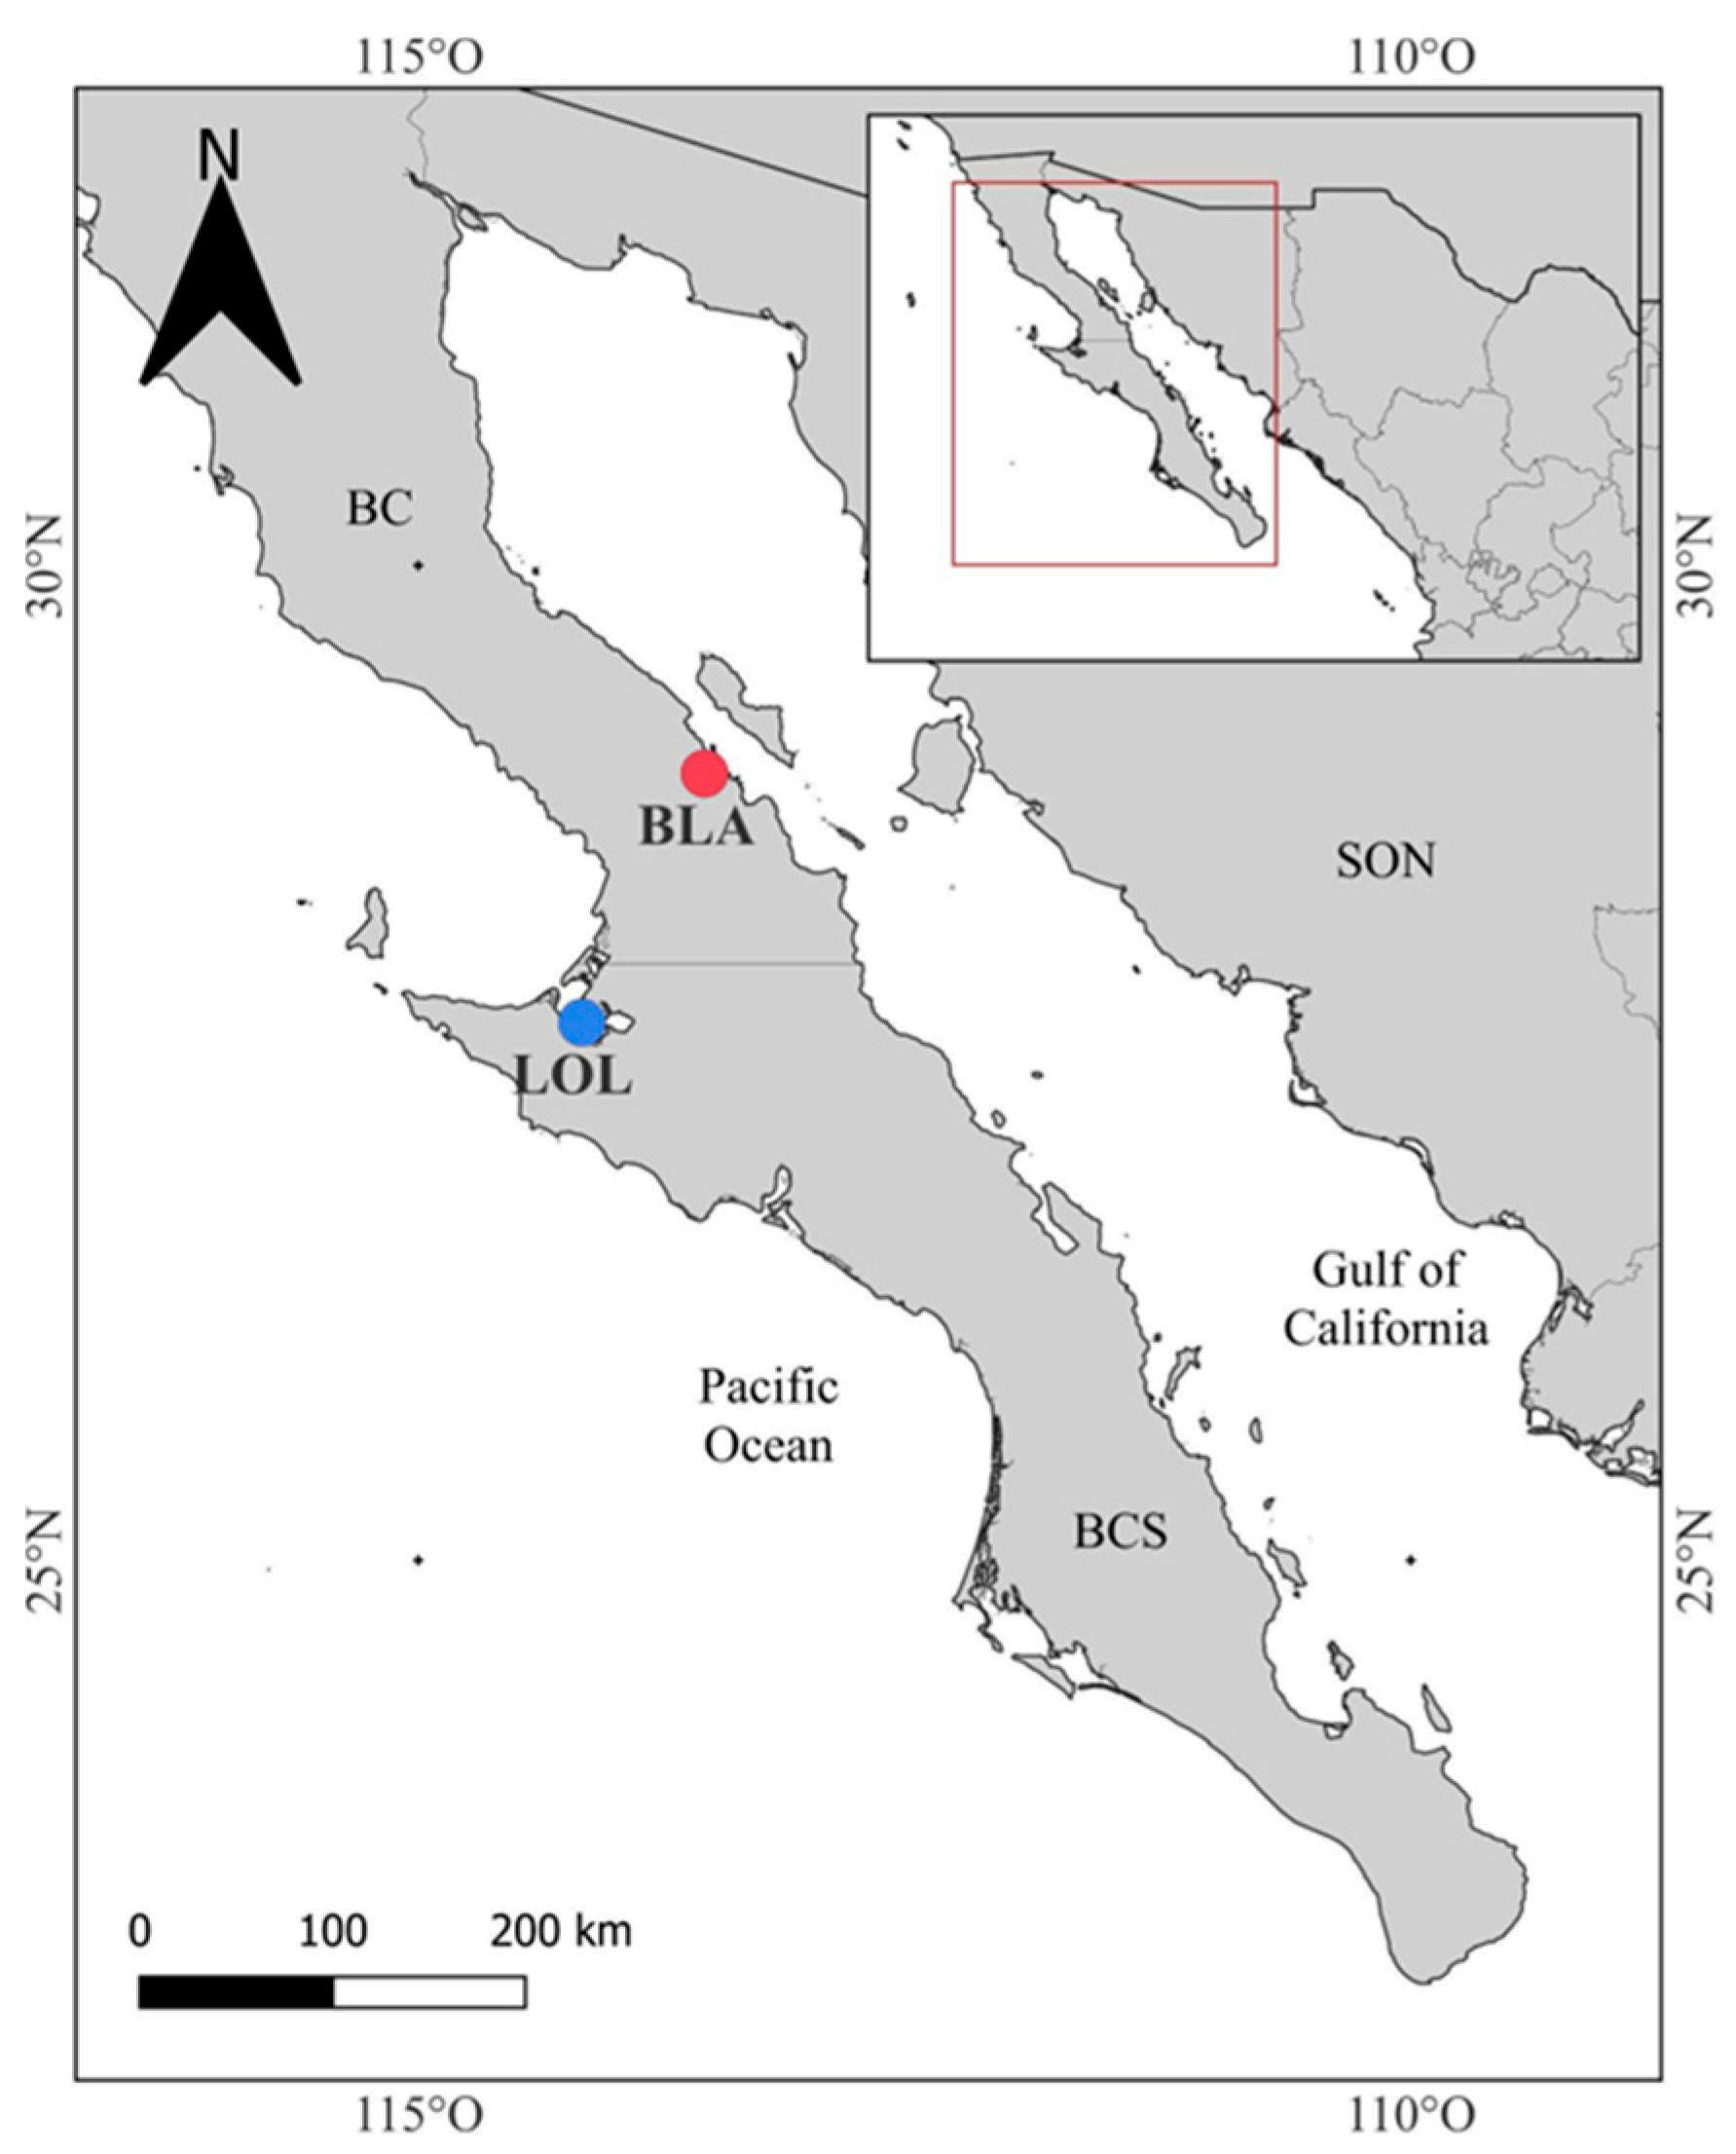
| BLA | Bahía de Los Ángeles |
| LOL | Laguna Ojo de liebre |
| SFG | Scope for growth |
| RR | Respiration rate |
| AR | Absorption rate |
| IR | Ingestion rate |
| SOD | Superoxide dismutase |
| CAT | Catalase |
| GPx | Glutathione peroxidase |
| TBARS | Thiobarbituric acid reactive substances |
References
- Jutfelt, F.; Roche, D.G.; Clark, T.D.; Norin, T.; Binning, S.A.; Speers-Roesch, B.; Sundin, J. Brain cooling marginally increases acute upper thermal tolerance in Atlantic cod. J. Exp. Biol. 2019, 222, jeb.208249. [Google Scholar] [CrossRef] [PubMed]
- Smith, K.E.; Burrows, M.T.; Hobday, A.J.; King, N.G.; Moore, P.J.; Gupta, A.S. Biological impacts of marine heatwaves. Annu. Rev. Mar. Sci. 2023, 15, 119–145. [Google Scholar] [CrossRef] [PubMed]
- Cooley, S.; Schoeman, D.; Bopp, L.; Boyd, P.; Donner, S.; Ghebrehiwet, D.Y.; Ito, S.-I.; Kiessling, W.; Martinetto, P.; Ojea, E.; et al. Oceans and Coastal Ecosystems and Their Services. In Climate Change 2022: Impacts, Adaptation and Vulnerability. Contribution of Working Group II to the Sixth Assessment Report of the Intergovernmental Panel on Climate Change; Pörtner, H.-O., Roberts, D.C., Tignor, M., Poloczanska, E.S., Mintenbeck, K., Alegría, A., Craig, M., Langsdorf, S., Löschke, S., Möller, V., et al., Eds.; Cambridge University Press: Cambridge, UK; New York, NY, USA, 2022; pp. 379–550. [Google Scholar] [CrossRef]
- Masanja, F.; Yang, K.; Xu, Y.; He, G.; Liu, X.; Xu, X.; Zhao, L. Impacts of marine heat extremes on bivalves. Front. Mar. Sci. 2023, 10, 1159261. [Google Scholar] [CrossRef]
- Pörtner, H.O.; Farrell, A.P. Physiology and Climate Change. Science 2008, 322, 690–692. [Google Scholar] [CrossRef]
- Peck, L.S.; Morley, S.A.; Richard, J.; Clark, M.S. Acclimation and thermal tolerance in Antarctic marine ectotherms. J. Exp. Biol. 2014, 217, 16–22. [Google Scholar] [CrossRef]
- Sasaki, M.; Dam, H.G. Global patterns in copepod thermal tolerance. J. Plankton Res. 2021, 43, 598–609. [Google Scholar] [CrossRef]
- Stillman, J.H.; Somero, G.N. A Comparative analysis of the upper thermal tolerance limits of eastern pacific porcelain crabs, genus Petrolisthes: Influences of latitude, vertical zonation, acclimation, and phylogeny. Physiol. Biochem. Zool. 2000, 73, 200–208. Available online: https://www.journals.uchicago.edu/doi/epdf/10.1086/316738 (accessed on 23 April 2025). [CrossRef]
- Marshall, D.J.; McQuaid, C.D. Warming reduces metabolic rate in marine snails: Adaptation to fluctuating high temperatures challenges the metabolic theory of ecology. Proc. R. Soc. B Biol. Sci. 2010, 278, 281–288. [Google Scholar] [CrossRef]
- Morash, A.J.; Neufeld, C.; MacCormack, T.J.; Currie, S. The importance of incorporating natural thermal variation when evaluating physiological performance in wild species. J. Exp. Biol. 2018, 221, jeb164673. [Google Scholar] [CrossRef]
- Niehaus, A.C.; Angilletta, M.J.; Sears, M.W.; Franklin, C.E.; Wilson, R.S. Predicting the physiological performance of ectotherms in fluctuating thermal environments. J. Exp. Biol. 2012, 215, 694–701. [Google Scholar] [CrossRef]
- Vajedsamiei, J.; Melzner, F.; Raatz, M.; Lugo, S.C.M.; Pansch, C. Cyclic thermal fluctuations can be burden or relief for an ectotherm depending on fluctuations’ average and amplitude. Funct. Ecol. 2021, 35, 2483–2496. [Google Scholar] [CrossRef]
- Manenti, T.; Sørensen, J.G.; Moghadam, N.N.; Loeschcke, V. Predictability rather than amplitude of temperature fluctuations determines stress resistance in a natural population of Drosophila simulans. J. Evol. Biol. 2014, 27, 2113–2122. [Google Scholar] [CrossRef] [PubMed]
- Nancollas, S.J.; Todgham, A.E. The influence of stochastic temperature fluctuations in shaping the physiological performance of the California mussel, Mytilus californianus. J. Exp. Biol. 2022, 225, jeb243729. [Google Scholar] [CrossRef]
- Ruiz-Verdugo, C.A.; Koch, V.; Félix-Pico, E.; Beltran-Lugo, A.I.; Cáceres-Martínez, C.; Mazn-Suastegui, J.M.; Robles-Mungaray, M.; Caceres-Martínez, J. Scallop fisheries and aquaculture in Mexico. In Developments in Aquaculture and Fisheries Science; Elsevier: Amsterdam, The Netherlands, 2016; Volume 40, pp. 1111–1125. [Google Scholar] [CrossRef]
- Rupp, G.S.; Valdéz-Ramírez, M.E.; Lemeda-Fonseca, M. Ecología y Biologí. In Biología y Cultivo de los Moluscos Pectínidos del Género Nodipecten; Maeda-Martínez, A.N., Lodeiros-Seijo, C., Eds.; Editorial Limusa: México City, Mexico, 2011; pp. 25–58. [Google Scholar]
- Petersen, J.L.; Ibarra, A.M.; May, B. Nuclear and mtDNA lineage diversity in wild and cultured Pacific lion-paw scallop, Nodipecten subnodosus (Baja California Peninsula, Mexico). Mar. Biol. 2010, 157, 2751–2767. [Google Scholar] [CrossRef] [PubMed]
- Koch, V.; Rengstorf, A.; Taylor, M.; Mazón-Suástegui, J.M.; Sinsel, F.; Wolff, M. Comparative growth and mortality of cultured Lion’s Paw scallops (Nodipecten subnodosus) from Gulf of California and Pacific populations and their reciprocal transplants. Aquac. Res. 2013, 46, 185–201. [Google Scholar] [CrossRef]
- Purce, D.N.; Donovan, D.A.; Maeda-Martínez, A.N.; Koch, V. Scope for growth of cultivated Pacific and Gulf of California populations of lion’s paw scallop Nodipecten subnodosus, and their reciprocal transplants. Lat. Am. J. Aquat. Res. 2020, 48, 538–551. [Google Scholar] [CrossRef]
- Merilä, J.; Hendry, A.P. Climate change, adaptation, and phenotypic plasticity: The problem and the evidence. Evol. Appl. 2014, 7, 1–14. [Google Scholar] [CrossRef] [PubMed]
- Racotta, I.; Joachin-Mejia, N.; Sicard, M.T.; Lluch-Cota, S.E. Aquaculture site selection for the lion’s paw scallop Nodipecten subnodosus, based on environmental temperature variability and organisms’ growth and ecophysiological performance. Aquac. Rep. 2024, submitted.
- Cruz, P.; Ramirez, J.L.; Garcia, A.G.; Ibarra, A.M. Genetic differences between two populations of catarina scallop (Argopecten ventricosus) for adaptations for growth and survival in a stressful environment. Aquaculture 1998, 166, 321–335. [Google Scholar] [CrossRef]
- Cruz, P.; Rodríguez-Jaramillo, C.; Ibarra, A.M. Environment and population origin effects on first sexual maturity of catarina scallop, Argopecten ventricosus (Sowerby II, 1842). Aquaculture 1999, 172, 105–115. [Google Scholar]
- Morón Lugo, S.; Baumeister, M.; Nour, O.M.; Wolf, F.; Stumpp, M.; Pansch, C. Experiment on performance of two invertebrate predators on warming and temperature variability [dataset publication series]. Sci. Rep. 2020, 10, 6780. [Google Scholar] [CrossRef] [PubMed]
- Colinet, H.; Sinclair, B.J.; Vernon, P.; Renault, D. Insects in fluctuating thermal environments. Annu. Rev. Entomol. 2015, 60, 123–140. Available online: https://ir.lib.uwo.ca/biologypub/67 (accessed on 23 April 2025). [CrossRef]
- Bozinovic, F.; Bastías, D.A.; Boher, F.; Clavijo-Baquet, S.; Estay, S.A.; Angilletta, M.J. The mean and variance of environmental temperature interact to determine physiological tolerance and fitness. Physiol. Biochem. Zool. 2011, 84, 543–552. Available online: http://www.jstor.org/stable/10.1086/662551 (accessed on 23 April 2025). [CrossRef]
- Sicard-González, M.T. Efecto de la Oscilación Térmica en la Fisiología de la Almeja Mano de león (Nodipecten subnodosus Sowerby, 1835). Doctoral Dissertation, Universidad Autónoma de Nuevo León, Monterrey, Mexico, 2006. [Google Scholar]
- Palacios, E.; Racotta, I.; Kraffe, E.; Marty, Y.; Moal, J.; Samain, J. Lipid composition of the giant lion’s-paw scallop (Nodipecten subnodosus) in relation to gametogenesis: I. Fatty acids. Aquaculture 2005, 250, 270–282. [Google Scholar] [CrossRef]
- Palacios, E.; Racotta, I.S.; Arjona, O.; Marty, Y.; Le Coz, J.R.; Moal, J.; Samain, J.F. Lipid composition of the pacific lion-paw scallop, Nodipecten subnodosus, in relation to gametogenesis: 2. Lipid classes and sterols. Aquaculture 2007, 266, 266–273. [Google Scholar] [CrossRef]
- Pernet, F.; Tremblay, R.; Comeau, L.; Guderley, H. Temperature adaptation in two bivalve species from different thermal habitats: Energetics and remodelling of membrane lipids. J. Exp. Biol. 2007, 210, 2999–3014. [Google Scholar] [CrossRef] [PubMed]
- Artigaud, S.; Richard, J.; Thorne, M.A.; Lavaud, R.; Flye-Sainte-Marie, J.; Jean, F.; Pichereau, V. Deciphering the molecular adaptation of the king scallop (Pecten maximus) to heat stress using transcriptomics and proteomics. BMC Genom. 2015, 16, 988. [Google Scholar] [CrossRef] [PubMed]
- Laudicella, V.A.; Whitfield, P.D.; Carboni, S.; Doherty, M.K.; Hughes, A.D. Application of lipidomics in bivalve aquaculture, a review. Rev. Aquac. 2019, 12, 678–702. [Google Scholar] [CrossRef]
- Abele, D.; Heise, K.; PorTner, H.O.; Puntarulo, S. Temperature-dependence of mitochondrial function and production of reactive oxygen species in the intertidal mud clam Mya arenaria. J. Exp. Biol. 2002, 205, 1831–1841. [Google Scholar] [CrossRef]
- Dong, X.; Yang, Z.; Liu, Z.; Wang, X.; Yu, H.; Peng, C.; Hou, X.; Lu, W.; Xing, Q.; Hu, J.; et al. Metabonomic Analysis Provides New Insights into the Response of Zhikong Scallop (Chlamys farreri) to Heat Stress by Improving Energy Metabolism and Antioxidant Capacity. Antioxidants 2022, 11, 1084. [Google Scholar] [CrossRef]
- Song, J.A.; Lee, E.; Choi, Y.-U.; Park, J.J.C.; Han, J. Influence of temperature changes on oxidative stress and antioxidant defense system in the bay scallop, Argopecten irradians. Comp. Biochem. Physiol. Part A Mol. Integr. Physiol. 2024, 299, 111775. [Google Scholar] [CrossRef] [PubMed]
- Rahman, M.; Henderson, S.; Miller-Ezzy, P.; Li, X.; Qin, J. Immune response to temperature stress in three bivalve species: Pacific oyster Crassostrea gigas, Mediterranean mussel Mytilus galloprovincialis and mud cockle Katelysia rhytiphora. Fish Shellfish Immunol. 2019, 86, 868–87474. [Google Scholar] [CrossRef]
- Arellano-Martínez, M.; Ceballos-Vázquez, B.P.; Lodeiros-Seijo, C.; Freites-Valbuena, L.F.; Palacios, E.; Racotta, I.; ValdézRamírez, M.E.; García, N.; García-Domínguez, F. Reproducción. In Biología y Cultivo de los Moluscos Pectínidos del Género Nodipecten; Maeda-Martínez, A.N., Lodeiros-Seijo, C., Eds.; Limusa: Mexico City, Mexico, 2011; Chapter 5; pp. 99–125. [Google Scholar]
- Salgado-García, R.L.; Kraffe, E.; Maytorena-Verdugo, C.I.; Rivera-Camacho, A.R.; Sicard, M.T.; Arellano-Martínez, M.; Racotta, I.S. Metabolic responses of adult lion’s paw scallops Nodipecten subnodosus exposed to acute hyperthermia in relation to seasonal reproductive effort. Sci. Rep. 2020, 10, 2449. [Google Scholar] [CrossRef]
- Bonesteve, A.; Lluch-Cota, S.E.; Sicard, M.T.; Racotta, I.S.; Tripp-Valdez, M.A.; Rojo-Arreola, L. HSP mRNA sequences and their expression under different thermal oscillation patterns and heat stress in two populations of Nodipecten subnodosus. Cell Stress Chaperon 2024, 30, 33–47. [Google Scholar] [CrossRef]
- Pörtner, H. Climate variations and the physiological basis of temperature dependent biogeography: Systemic to molecular hierarchy of thermal tolerance in animals. Comp. Biochem. Physiol. Part A Mol. Integr. Physiol. 2002, 132, 739–761. [Google Scholar] [CrossRef]
- Salgado-García, R.L.; Kraffe, E.; Tripp-Valdez, M.A.; Ramírez-Arce, J.L.; Artigaud, S.; Flye-Sainte-Marie, J.; Racotta, I.S. Energy metabolism of juvenile scallops Nodipecten subnodosus under acute increased temperature and low oxygen availability. Comp. Biochem. Physiol. Part A Mol. Integr. Physiol. 2023, 278, 111373. [Google Scholar] [CrossRef]
- Götze, S.; Bock, C.; Eymann, C.; Lannig, G.; Steffen, J.B.; Pörtner, H.-O. Single and combined effects of the “Deadly trio” hypoxia, hypercapnia and warming on the cellular metabolism of the great scallop Pecten maximus. Comp. Biochem. Physiol. Part B Biochem. Mol. Biol. 2020, 243–244, 110438. [Google Scholar] [CrossRef]
- Sokolova, I.M.; Frederich, M.; Bagwe, R.; Lannig, G.; Sukhotin, A.A. Energy homeostasis as an integrative tool for assessing limits of environmental stress tolerance in aquatic invertebrates. Mar. Environ. Res. 2012, 79, 1–15. [Google Scholar]
- Bresollier, L.; Salgado-García, R.L.; Racotta, I.; Kraffe, E.; Sicard, M.T.; Lluch-Cota, S.E.; Tripp-Valdez, M.T. Contrasting cellular energy responses to regular and chaotic daily thermal oscillations in two populations of Nodipecten subnodosus scallops. J. Thermal Biol. 2025. submitted. [Google Scholar]
- Yoon, D.-S.; Byeon, E.; Kim, D.-H.; Lee, M.-C.; Shin, K.-H.; Hagiwara, A.; Lee, J.-S. Effects of temperature and combinational exposures on lipid metabolism in aquatic invertebrates. Comp. Biochem. Physiol. Part C Toxicol. Pharmacol. 2022, 262, 109449. [Google Scholar] [CrossRef]
- Rőszer, T. The invertebrate midintestinal gland (“hepatopancreas”) is an evolutionary forerunner in the integration of immunity and metabolism. Cell Tissue Res. 2014, 358, 685–695. [Google Scholar] [CrossRef] [PubMed]
- Song, J.A.; Choi, C.Y. Temporal changes in physiological responses of Bay Scallop: Performance of antioxidant mechanism in Argopecten irradians in response to sudden changes in habitat salinity. Antioxidants 2021, 10, 1673. [Google Scholar] [CrossRef]
- Seebacher, F.; White, C.R.; Franklin, C.E. Physiological plasticity increases resilience of ectothermic animals to climate change. Nat. Clim. Change 2014, 5, 61–66. [Google Scholar] [CrossRef]
- Vargas-Abúndez, J.A.; Plata-Díaz, A.; Mascaró, M.; Caamal-Monsreal, C.; Rodríguez-Fuentes, G.; Jiménez-Be, A.; Rosas, C. Maternal temperature stress modulates acclimation and thermal biology in Octopus maya (Cephalopoda: Octopodidae) juvenile progeny. Mar. Biol. 2023, 170, 56. [Google Scholar] [CrossRef]
- Ramos-Rodríguez, S.; Ortega-Ramírez, K.; Méndez-Can, L.; Galindo-Sánchez, C.; Galindo-Torres, P.; Ventura-López, C.; Mascaro, M.; Caamal-Monsreal, C.; Rodríguez, G.; Díaz, F.; et al. The hard life of an octopus embryo is seen through gene expression, energy metabolism, and its ability to neutralize radical oxygen species. Sci. Rep. 2024, 14, 16510. [Google Scholar] [CrossRef]
- Domínguez-Castanedo, O.; Palomino-Cruz, D.; Mascaró, M.; Rodríguez-Fuentes, G.; Juárez, O.E.; Galindo-Sánchez, C.E.; Caamal-Monsreal, C.; Torres, P.G.; Díaz, F.; Rosas, C. Trans-generational physiological condition of embryos is conditioned by maternal thermal stress in Octopus maya. Mar. Biol. 2023, 170, 41. [Google Scholar] [CrossRef]
- Boyd, P.; Collins, S.; Dupont, S.; Fabricius, K.; Gattuso, J.-P.; Havenhand, J.; Hutchins, D.A.; McGraw, C.M.; Riebesell, U.; Vichi, M.; et al. SCOR WG149 Handbook to support the SCOR Best Practice Guide for Multiple Drivers Marine Research; University of Tasmania: Hobart, Australia, 2019. [Google Scholar] [CrossRef]
- Joachin-Mejia, N.G. Caracterización del Hábitat Térmico de la Almeja mano de león (Nodipecten subnodosus) en el Noroeste Mexicano. Bachelor’s Dissertation, Universidad Nacional Autónoma de México, Mexico City, Mexico, 2002. [Google Scholar]
- Ramírez-Arce, J.L. Evaluación de la Ventaja Productiva y Grado de Esterilidad en Triploides de Almeja Mano de león Nodipecten subnodosus (Sowerby 1835) como una Alternativa para el Cultivo en el Parque Nacional Bahía de Loreto, Golfo de California. Bachelor’s Dissertation, Centro Interdisciplinario de Ciencias Marinas, La Paz, Mexico, 2009. [Google Scholar]
- Marzari, A.; Racotta, I.; Escobedo-Fregoso, C.; Artigaud, S.; Kraffe, E.; Salgado-García, R. Reproductive effort affects cellular response in the mantle of Nodipecten subnodosus scallops exposed to acute hyperthermia. Comp. Biochem. Physiol. Part A Mol. Integr. Physiol. 2024, 299, 111766. [Google Scholar] [CrossRef]
- Bressolier, L. Energy Metabolism and Mitochondrial Function in Two Populations of Lion’s Paw Scallops Nodipecten subnodosus Acclimated to Different Thermal Regimes. Master’s Thesis, Centro de Investigaciones Biológicas del Noroeste, S.C., La Paz, Mexico, 2023. [Google Scholar]
- Elliott, J.M.; Davison, W. Energy equivalents of oxygen consumption in animal energetics. Oecologia 1975, 19, 195–201. [Google Scholar] [CrossRef]
- Lora-Vilchis, M.C.; Robles-Mungaray, M.; Doktor, N.; Voltolina, D. Food value of four microalgae for juveniles of the lion’s paw scallop Lyropecten subnodosus (Sowerby, 1833). J. World Aquac. Soc. 2004, 35, 232–236. [Google Scholar] [CrossRef]
- Conover, R.J. Assimilation of organic matter by zooplankton1. Limnol. Oceanogr. 1966, 11, 338–345. [Google Scholar] [CrossRef]
- Sorokin, C. Dry weight, packed cell volume and optical density: In Handbook of Phycological Methods. Culture Methods and Growth Measurement; Stein, J., Ed.; Cambridge University Press: Cambridge, UK; New York, NY, USA, 1973; pp. 321–343. [Google Scholar]
- Solorzano, L. Determination of ammonia in natural waters by the phenolhypochlorite method. Limnol. Oceanogr. 1969, 14, 799–800. [Google Scholar]
- Bayne, B.L.; Widdows, J.; Thompson, R.J. Physiological integrations. In Marine Mussels: Their Ecology and Physiology; Bayne, B.L., Ed.; Cambridge University Press: Cambridge, UK; New York, NY, USA, 1976; pp. 261–291. [Google Scholar]
- Barnes, H.; Blackstock, J. Estimation of lipids in marine animals and tissues: Detailed investigation of the sulphophosphovanilun method for ‘total’ lipids. J. Exp. Mar. Biol. Ecol. 1973, 12, 103–118. [Google Scholar] [CrossRef]
- Bradford, M.M. A rapid and sensitive method for the quantification of microgram quantities of protein utilizing the principle of protein-dye binding. Anal. Bioch. 1976, 72, 256–284. [Google Scholar] [CrossRef] [PubMed]
- Suzuki, K. Measurement of Mn-SOD and Cu, Zn-SOD. In Experimental Protocols for Reactive Oxygen and Nitrogen Species; Taniguchi, N., Gutteridge, J., Eds.; Oxford University Press: Oxford, UK, 2000; pp. 91–95. [Google Scholar]
- Aebi, H. Catalase in vitro. In Methods in Enzymology, Oxygen Radicals in Biological Systems; Elsevier: New York, NY, USA, 1984; pp. 121–126. [Google Scholar] [CrossRef]
- Hermes-Lima, M.; Storey, J.M.; Storey, K.B. Antioxidant defenses and animal adaptation to oxygen availability during environmental stress. In Cell and Molecular Responses to Stress; Storey, K.B., Storey, J.M., Eds.; Elsevier: Amsterdam, The Netherlands, 2001; Volume 2, pp. 263–287. [Google Scholar] [CrossRef]
- Flohé, L.; Günzler, W.A. Assays of glutathione peroxidase. Methods Enzymol. 1984, 105, 114–120. [Google Scholar] [CrossRef]
- Buege, J.A.; Aust, S.D. Microsomal lipid peroxidation. Methods Enzymol. 1978, 52, 302–310. [Google Scholar] [CrossRef]
- Persky, A.M.; Green, P.S.; Stubley, L.; Howell, C.O.; Zaulyanov, L.; Brzaeau, G.A.; Simpkins, J.W. Protective effect of estrogens against oxidative damage to heart and skeletal muscle. Proc. Soc. Exp. Biol. Med. 2000, 223, 59–66. [Google Scholar] [CrossRef]
- R Core Team. R: A Language and Environment for Statistical Computing; R Foundation for Statistical Computing: Vienna, Austria, 2021; Available online: https://www.R-project.org/ (accessed on 24 February 2025).

| Variable | p Value (Raw) | Transformation | p Value (Transformed) |
|---|---|---|---|
| Respiration rate | 0.000 | Log | 0.907 |
| Ingestion rate | 0.035 | Square Root | 0.107 |
| Assimilation rate | 0.036 | Square Root | 0.266 |
| Scope for growth | 0.005 | Square Root | 0.158 |
| Carbohydrates in muscle | 0.054 | None | 0.054 |
| Total proteins in muscle | 0.247 | None | 0.247 |
| Total lipids in muscle | 0.000 | Log | 0.060 |
| Carbohydrates in mantle | 0.000 | None | 0.000 |
| Total proteins in mantle | 0.000 | Log | 0.148 |
| Total lipids in mantle | 0.000 | Log | 0.534 |
| SOD in muscle | 0.003 | Log | 0.170 |
| CAT in muscle | 0.000 | Log | 0.309 |
| GPx in muscle | 0.000 | None | 0.000 |
| TBARS in muscle | 0.000 | None | 0.000 |
| SOD in mantle | 0.006 | Square Root | 0.358 |
| CAT in mantle | 0.000 | None | 0.000 |
| GPx in mantle | 0.000 | None | 0.000 |
| TBARS in mantle | 0.000 | None | 0.000 |
| ANOVA | Population | T Regime | HT | Population T Regime | Population HT | T Regime HT | Population T Regime HT |
|---|---|---|---|---|---|---|---|
| Respiration rate | 0.383 | 0.018 | 0.000 | 0.470 | 0.614 | 0.633 | 0.572 |
| Ingestion rate | 0.420 | 0.000 | 0.266 | 0.089 | 0.326 | 0.443 | 0.124 |
| Assimilation rate | 0.345 | 0.000 | 0.214 | 0.119 | 0.630 | 0.859 | 0.050 |
| Scope for growth | 0.272 | 0.000 | 0.040 | 0.143 | 0.538 | 0.830 | 0.070 |
| Carbohydrates in muscle | 0.541 | 0.000 | 0.000 | 0.826 | 0.634 | 0.004 | 0.164 |
| Total proteins in muscle | 0.664 | 0.329 | 0.417 | 0.454 | 0.911 | 0.898 | 0.864 |
| Total lipids in muscle | 0.402 | 0.000 | 0.008 | 0.537 | 0.905 | 0.058 | 0.571 |
| Total proteins in mantle | 0.920 | 0.347 | 0.253 | 0.678 | 0.830 | 0.995 | 0.330 |
| Total lipids in mantle | 0.072 | 0.341 | 0.311 | 0.326 | 0.326 | 0.990 | 0.161 |
| SOD in muscle | 0.567 | 0.000 | 0.161 | 0.038 | 0.739 | 0.372 | 0.958 |
| CAT in muscle | 0.918 | 0.009 | 0.003 | 0.400 | 0.884 | 0.000 | 0.768 |
| SOD in mantle | 0.425 | 0.103 | 0.068 | 0.698 | 0.452 | 0.162 | 0.299 |
| Kruskal-Wallis | |||||||
| Carbohydrates in mantle | 0.003 | 0.003 | 0.854 | ||||
| GPx in muscle | 0.832 | 0.000 | 0.967 | ||||
| TBARS in muscle | 0.657 | 0.000 | 0.003 | ||||
| CAT in mantle | 0.613 | 0.784 | 0.025 | ||||
| GPx in mantle | 0.935 | 0.000 | 0.607 | ||||
| TBARS in mantle | 0.852 | 0.684 | 0.556 |
| Tukey’s HSD Test | OR-Control | SR-Control | RO-ST | HT-T Regime |
|---|---|---|---|---|
| Respiration rate | 0.806 | 0.109 | 0.020 | 0.000 |
| Ingestion rate | 0.000 | 0.005 | 0.437 | 0.270 |
| Assimilation rate | 0.000 | 0.004 | 0.373 | 0.217 |
| Scope for growth | 0.000 | 0.007 | 0.286 | 0.042 |
| Carbohydrates in muscle | 0.000 | 0.000 | 0.001 | 0.000 |
| Total lipids in muscle | 0.000 | 0.000 | 0.168 | 0.008 |
| SOD in muscle | 0.000 | 0.000 | 0.310 | 0.352 |
| CAT in muscle | 0.019 | 0.045 | 0.881 | 0.004 |
| Dunn’s tests | ||||
| Carbohydrates in mantle | 0.004 | 1.000 | 0.004 | 0.427 |
| GPx in muscle | 0.000 | 0.003 | 0.363 | 0.483 |
| TBARS in muscle | 0.000 | 0.000 | 0.488 | 0.002 |
| CAT in mantle | 0.975 | 0.736 | 1.000 | 0.013 |
| GPx in mantle | 0.000 | 0.501 | 0.004 | 0.304 |
| TBARS in mantle | 0.750 | 1.000 | 0.617 | 0.278 |
Disclaimer/Publisher’s Note: The statements, opinions and data contained in all publications are solely those of the individual author(s) and contributor(s) and not of MDPI and/or the editor(s). MDPI and/or the editor(s) disclaim responsibility for any injury to people or property resulting from any ideas, methods, instructions or products referred to in the content. |
© 2025 by the authors. Licensee MDPI, Basel, Switzerland. This article is an open access article distributed under the terms and conditions of the Creative Commons Attribution (CC BY) license (https://creativecommons.org/licenses/by/4.0/).
Share and Cite
Joachin-Mejia, N.G.; Racotta, I.S.; Carreño-León, D.P.; Ulaje, S.A.; Lluch-Cota, S.E. Physiological Trade-Offs Under Thermal Variability in the Giant Lion’s Paw Scallop (Nodipecten subnodosus): Metabolic Compensation and Oxidative Stress. Stresses 2025, 5, 42. https://doi.org/10.3390/stresses5030042
Joachin-Mejia NG, Racotta IS, Carreño-León DP, Ulaje SA, Lluch-Cota SE. Physiological Trade-Offs Under Thermal Variability in the Giant Lion’s Paw Scallop (Nodipecten subnodosus): Metabolic Compensation and Oxidative Stress. Stresses. 2025; 5(3):42. https://doi.org/10.3390/stresses5030042
Chicago/Turabian StyleJoachin-Mejia, Natalia G., Ilie S. Racotta, Diana P. Carreño-León, Sergio A. Ulaje, and Salvador E. Lluch-Cota. 2025. "Physiological Trade-Offs Under Thermal Variability in the Giant Lion’s Paw Scallop (Nodipecten subnodosus): Metabolic Compensation and Oxidative Stress" Stresses 5, no. 3: 42. https://doi.org/10.3390/stresses5030042
APA StyleJoachin-Mejia, N. G., Racotta, I. S., Carreño-León, D. P., Ulaje, S. A., & Lluch-Cota, S. E. (2025). Physiological Trade-Offs Under Thermal Variability in the Giant Lion’s Paw Scallop (Nodipecten subnodosus): Metabolic Compensation and Oxidative Stress. Stresses, 5(3), 42. https://doi.org/10.3390/stresses5030042