Abstract
Climate change, particularly extreme rainfall, imposes stress on plants, which can be assessed using fluctuating asymmetry (FA) in leaves and key leaf traits. FA, which is defined as random deviations in symmetrical structures, is a known bioindicator of environmental stress. Additionally, leaf area (LA) and specific leaf area (SLA) provide insights into plant responses to stressors. Mangrove plants have several mechanisms to cope with constant flooding and rainy periods. However, under extreme rainfall conditions, their adaptive capacity may be overwhelmed and plants may experience developmental stress. Nonetheless, it has not yet been verified whether plants subjected to drastic increases in rainfall exhibit more asymmetric leaves. We investigated seasonal differences in FA in Laguncularia racemosa after an extreme rainfall event and found a significant increase in FA after the rainfall event (t = 1.759, df = 149, p = 0.08) compared with the dry season. Concurrently, LA increased by 28% (p < 0.01) and SLA increased by 33% (p < 0.01) after the rainfall event. During the dry season, the plants exhibited antisymmetry rather than FA, highlighting their distinct responses to seasonal stressors. These findings demonstrate the differential effects of rainfall extremes on leaf traits and asymmetry, positioning FA, LA, and SLA as mangrove stress indicators.
1. Introduction
Plants are complex organisms whose development is influenced by a diverse range of factors [1]. Abiotic elements play crucial roles in shaping plant ecology by altering biomass allocation and soil nutrient availability [2]. Among these, extreme weather events became increasingly prevalent during the Anthropocene [3]. Extreme weather events, such as high rainfalls, are consequences of global climate change [4], and can impose stresses on plants [5]. In this way, variations in rainfall intensity modulate several aspects of coastal ecosystems, particularly in mangroves [6], which are especially sensitive to these changes [7].
Under normal rainfall, the release of toxic substances (e.g., salt and metals) into water and soil increases mangrove plant growth [8]. Additionally, physiological adaptations (e.g., pneumatophores) allow them to survive rising water levels. However, excessive increase in water level can generate higher sedimentation and exposure to sulfate [9], which can lead to forest loss and tree mortality in mangroves. Furthermore, extreme rainfall can overwhelm the adaptive capacity of plants, inducing stress [5]. In mangroves, intense rains can extend flooding periods and release higher amounts of porewater sulfide, a phytotoxin which contributes to a higher mortality of mangrove species [10] and increases the disruption of fine roots and soil substrates [11]. During non-seasonal flooding, prolonged high water levels can decrease the net photosynthetic rate, stomatal conductance, and growth of mangrove plants [12]. This process could trigger strong phenotypic changes due to direct and indirect stresses from high rainfall intensity, such as variations in leaf symmetry.
One of the main types of leaf symmetry deviation is Fluctuating Asymmetry (FA) [13,14], which is characterized by small random deviations in bilaterally symmetric structures. These small deviations in individuals or organs do not affect the individual genotype with any adaptive potential and originate in the early stages of ontogeny [15]. Therefore, FA has been used as an indicator of growth stress in several organisms with bilaterally symmetrical bodies or organs. Two other types of asymmetry can also be observed in plant organs: antisymmetry and directional asymmetry [16,17]. If, on one hand, FA represents a specific type of plastic deviation independent of genetic factors, on the other, both directional asymmetry and antisymmetry are closely linked to the individual’s genetic pool. Consequently, the latter cannot be used reliably as an indicator of stress because the observed deviations may be caused by genetic factors rather than reflecting the environmental conditions to which the organism is subjected [15]. However, antisymmetry may be an indicator of developmental instability and may represent a transitional stage of symmetry breaking in organisms under significant stress, generating nonlinear developmental processes [18]. For example, it was proposed that the antisymmetry found on the leaves of Bauhinia brevipes plants in shaded areas was a sign of stress, since this species is commonly found in open habitats [16].
Leaf FA is used as a bioindicator of environmental stress during plant development, as it reflects variations caused by biotic and abiotic conditions [19,20,21,22]. For example, plants under water limitation or droughts can exhibit more leaf FA than plants under adequate water availability [23], reflecting developmental instabilities due to water restriction. However, increased rainfall has been reported to have neutral effects on leaf FA [24], even though rainfall, especially in extreme situations, is considered a strong abiotic stressor for plants [5]. Since most studies use experimental approaches or subtle variations in water availability, such as gradients [24], they may not adequately capture the effects of extreme conditions that exceed the adaptive capacity of organisms, potentially resulting in low or absent levels of FA. Consequently, understanding the impacts of extreme environmental conditions on growth stability, as indicated by FA, remains challenging, particularly for plants in coastal ecosystems, such as mangroves.
In addition to FA, other plant traits such as leaf area (LA) and specific leaf area (SLA) can be good indicators of stress. LA and SLA are leaf traits that coordinate with high plant growth potential and productivity [25,26]. For example, plants with high SLA and LA show higher growth rates, greater capacity for light acquisition, and higher photosynthetic performance [27,28]. SLA reflects the trade-off between resource acquisition and increased leaf physical structure, which is mainly based on carbon investment [25]. Therefore, leaves with high SLA levels are generally larger, thinner, and have lower carbon concentrations [25,29], reflecting a prioritization of growth and resource acquisition. However, stressful conditions can induce more accentuated growth than expected, thus favoring plant developmental instability. For example, high rainfall can increase the retention of nutrients such as nitrogen, which is important for growth [30]. An excess of this nutrient can favor instability in plant development and consequently increase the levels of leaf asymmetry [31] by inducing accelerated growth. It is important to assess whether extreme weather conditions alter plant traits related to growth and resource acquisition, as abrupt abiotic changes can have complex effects on plant physiology.
Understanding whether abnormal climatic variations, such as extreme rainfall, can induce plastic responses indicative of stress in mangrove plants can provide insight into their potential effects on plant development in these ecosystems. Thus, we sought to verify whether plants present FA in their leaves after drastic rainfall events, as well as undergo variations in LA and SLA. To this end, we used the occurrence of an extreme rainfall event in a tropical mangrove as a natural experiment to evaluate the effect of unexpected and extreme weather changes on the occurrence of FA in a globally distributed mangrove species, Laguncularia racemosa (L.) C.F. Gaertn. (Combretaceae). Thus, the main goal of this study was to verify whether L. racemosa exhibits higher levels of stress after the extreme rainy season. We hypothesized that Laguncularia racemosa will exhibit higher levels of fluctuating asymmetry (FA) after the rainy season compared to the dry season, as environmental stress may lead to increased developmental instability. We also hypothesized that L. racemosa would show higher leaf area (LA) and specific leaf area (SLA) after the rainy season, as rapid growth following abundant water availability is often associated with greater developmental instability.
2. Results
We recorded a measurement error of 0.19%, which is the reliability measure of the FA estimates. Our data showed that fluctuating asymmetry occurred only after the extreme rainfall event (ERE), as evidenced by the normal distribution of leaf measurements (D = 0.047, p = 0.564; Figure 1), with a mean that was not statistically different from zero (t = 1.759, df = 149, p = 0.080). In contrast, dry season leaves showed signs of anti-asymmetry due to a bimodal distribution (D = 0.202, p < 0.005), which was not statistically different from zero (t = −0.391, df = 49, p = 0.697; Figure 1).
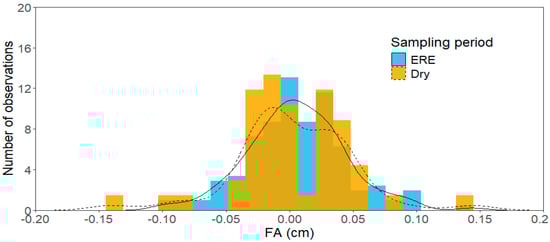
Figure 1.
Frequency distribution of FA ((RS − LS)/(RS + LS/2)) measurements per sampling event. The orange distribution refers to the dry season (Dry), and the blue distribution refers to the period after the extreme rainfall event (ERE). The solid and dashed lines indicate the frequency distributions of leaves deviation during the ERE and Dry periods, respectively.
During the dry season, the mean SLA was 59.1 ± 57.8 cm2/g, while after the extreme rainfall, we found values of 89.1 ± 61.1 cm2/g, representing an increase of ~34%. Additionally, during the dry season, LA reached values of 18.4 ± 9.81 cm2, while we found values of 25.7 ± 12.4 cm2 after the extreme rainfall, representing an increase of ~28%. Our data showed significant differences in the leaf traits of L. racemosa (Table 1), with the extreme rainfall event presenting higher LA and SLA values compared to the dry season (Figure 2). For LA, the variance of the random effect for individual plants within sampling points was 0.053, whereas the variance attributed to sampling points alone was 4.89 × 10⁻10. This suggests that the sampling points had a negligible influence on LA values, whereas individual plants exhibited a moderate effect. In contrast, for SLA, the variance for individual plants within the sampling points was 0.005, and the variance for sampling points alone was 0.0003. This indicates that individual plants contribute only minimally to SLA variation, and that differences between sampling points play an even smaller role, suggesting that site-level effects are not related to this trait.

Table 1.
Results of mixed models (GLMM) comparing the leaf area (LA) and specific leaf area (SLA) of L. racemosa between the dry season and after extreme rainfall event sampling periods. In addition, the table presents the values of the respective marginal (R2m) and conditional (R2c) coefficients of determination for each trait between the sampling periods. Statistically significant p-values are shown in bold.
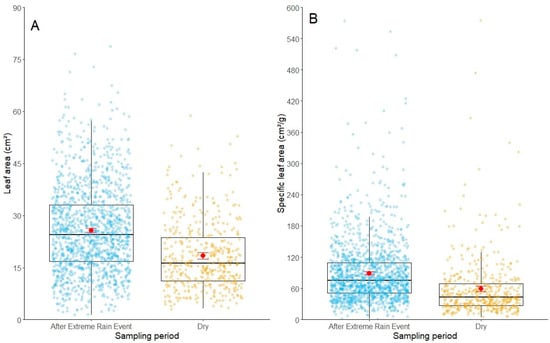
Figure 2.
Box plot showing (A) LA and (B) SLA values of L. racemosa in the dry and after the extreme rainfall event periods. The red dot indicates the mean and the dark line indicates the median of each trait per sampled period. The red error bars represent 95% confidence intervals around the mean for each sampling period. The boxes indicate 50% of the data between the first and third quartiles for each trait measured in each sampling period. The whiskers indicate the minimum and maximum values of each characteristic as well as their respective sampling periods.
3. Discussion
Confirming our hypotheses, our results showed that FA in the leaves of L. racemosa occurred only during the rainy season, indicating that after an extreme rainfall event, the white mangrove can undergo drastic variations in leaf symmetry. During the rainy season, high-intensity events exceeded the region’s historical annual average by 1.96 times [32], mainly in June 2022, corresponding to the second sampling event. These rains had several consequences for the northeastern region of Brazil, causing floods, landslides, and road closures, leading the state to declare a state of emergency [33]. In plants, intense rainfall and associated weather variations can become abiotic stressors [5]. Other studies have also shown evidence of stress related to high water levels in mangroves [12,34], mainly related to extreme weather events [10].
Mangroves tolerate flooding and low root oxygen levels [35]. During conventional rainy periods, mangroves are exposed to frequent stress conditions, such as high water levels and soil salinity [36], which favor the reproduction of most mangrove species and trigger higher reproductive rates. However, extreme weather can overwhelm the adaptive capacity of mangroves and generate stress signals [5]. For example, excessive sedimentation creates toxic conditions for mangrove plants, damaging root tissues [10] and ultimately impairing fundamental physiological processes, leading to instability in leaf development. Furthermore, high water levels can cause increased and prolonged flooding that damages the roots, significantly affecting photosynthetic rates and growth [12]. Moreover, high levels of rainfall increase freshwater pulses, particularly in riverine mangroves [37,38], such as that in this study. This higher freshwater input increases the import of nutrients by plants, especially nitrogen, which in turn can favor the growth of mangrove species [39]. Among the nutrients plants retain the most in situations of intense rainfall, nitrogen stands out [30], which is closely related to leaf growth [40]. Excess nitrogen can cause high growth rates, and we suggest that it can cause instability in plant development due to an inability to control development under conditions of excess of this nutrient. This accelerated growth with increased levels of FA may also indicate a low structural investment in carbon-based secondary compounds, which in turn makes plants more susceptible to pathogens and herbivores [31]. Our LA and SLA data corroborated this prediction. One limitation of this study was the lack of control over potential confounding factors, such as soil salinity [41,42] and tidal variations [43,44], which can significantly influence plant traits in L. racemosa. These factors may have contributed to the observed variation in leaf area and specific leaf area and should be considered when interpreting our findings. Future studies could benefit from explicitly measuring and controlling for these variables to better isolate the effects of seasonal and climatic factors on plant traits. However, higher LA and SLA values after the extreme rainfall period may indicate a considerable growth increase in L. racemosa. At the same time, the effects of an extreme rain event, such as the one we investigated in this study, on soil nutrients, such as increased nitrogen, may have led to greater investment in LA and SLA, as other studies have indicated positive correlations of these traits with this particular nutrient [40]. In addition, abrupt changes caused by weather extremes promote variations in the wind speed and stronger mechanical stress. Excessive wind affects plants in several ways, such as increasing the premature fall of leaves and woody parts and favoring shorter and thinner vascular elements [45]. The effect of wind on leaves may be more pronounced than that of excessive flooding, because leaves are more intolerant and sensitive to wind [46]. Furthermore, leaves can be stressed by the indirect effect of increased photosynthetic rates caused by wind due to increases in CO2 in the boundary layer [47], favoring accelerated growth which consequently generates higher levels of FA. Thus, extreme rainfall may have affected the growth stability of L. racemosa due to the combined effects of prolonged flooding and wind speed, potentially causing mechanical stress and disrupting the gas exchange of L. racemosa.
In contrast, our results did not show leaf FA during the dry season. The dry season in mangroves is marked by high water and soil salinity [48], among other soil and climatic characteristics. The relationship between mangrove species survival and soil salt concentration is age-dependent, with most species capable of tolerating moderate levels of soil salinity [49]. However, salinity levels exceeding this tolerance threshold can become toxic and induce growth stress [50]. Several mangrove plant species, including L. racemosa, which are considered true halophytes, present many specific physiological mechanisms that increase their tolerance to hypersaline conditions [51]. For example, L. racemosa has a high capacity to secrete excess salt through its leaves, and salt secretion tends to increase with increasing salinity [52]. Additionally, L. racemosa exhibits high osmotic and hydraulic adjustments which allow greater tolerance to saline stress [53]. Together, these mechanisms may decrease the sensitivity of L. racemosa to hypersaline conditions in mangrove environments, thereby reducing developmental stress. We also recommend that future studies investigate the physiological mechanisms underlying tolerance of L. racemosa to saline environments, particularly the potential role of γ-aminobutyric acid (GABA) in mitigating salinity stress by regulating metabolic pathways, enhancing osmotic adjustment, protecting cellular structures, and boosting antioxidant defenses to sustain plant productivity [54].
Our data showed that L. racemosa exhibits antisymmetry during the dry season. In general, this type of asymmetry is genetically determined and does not indicate developmental stress caused by environmental factors [15]. Nonetheless, the interpretation of this type of asymmetry in plants is more complex than in animals. For instance, previous studies have described antisymmetry as a subtle indicator of developmental stress [18]. At the same time, although rare, the same species and plant population may exhibit both FA and antisymmetry in leaves that are submitted to different stressful conditions [16]. This may support predictions that antisymmetry is a transitional phenotypic state in response to a specific stress factor [18]. However, confirming these pathways requires careful investigation because of the underlying genetic factors. Therefore, we suggest that future studies investigate this type of asymmetry in isolation, focusing on its response to potentially stressful mangrove conditions, while also examining the mechanisms of phenotypic variation under extreme climatic conditions.
In conclusion, our study is the first to report leaf FA in mangroves in response to extreme rainfall, providing insights into the effects of abnormal climatic variations on L. racemosa, and the use of FA as a tool to measure stress in plants under these adverse conditions. Future studies should expand sampling to different mangrove species, climatic conditions, and specific seasons to improve generalizations regarding extreme climatic events in mangroves. Furthermore, we suggest that future research incorporates the potential stressful effects of variation in abiotic conditions, such as nutrients, as well as include other plant-specific physiological measures to fully assess the effects of increased rainfall variability on mangrove plants. Additionally, our study established one of the few findings showing antisymmetry and fluctuating asymmetry in the same plant species. We also suggest that future studies include genetic and temporal factors to verify whether antisymmetry in L. racemosa establishes a developmental stress indicator for specific dry season situations in mangroves.
4. Materials and Methods
4.1. Study Area
Porto de Pedras (9°9′29″ S; 35°17′46″ W), located in northern region of the state of Alagoas, coastal region of Northeastern Brazil [55], covers about 257.7 km2 and is situated at an altitude of 15 m, with extensive mangrove covered estuaries (Figure 3). Some of these mangroves are protected by the Costa dos Corais Environmental Protection Area (APACC) [56], where we established our sampling points. The area has a tropical monsoon climate with a total annual rainfall of 1.600–1.900 mm and well-defined dry and rainy seasons [57,58] (Figure 4). The average annual temperature is approximately 24 °C (Figure 4) [58,59]. The most common species are typical mangrove trees (e.g., Laguncularia racemosa (L) C.F.Gaertn.—Combretaceae, Rhizophora mangle L.—Rhizophoraceae, and Avicennia schaueriana Stapf & Leechm. ex Moldenke—Acanthaceae), which occur along herbaceous species (e.g., Achrostichum aureum L.—Pteridaceae).
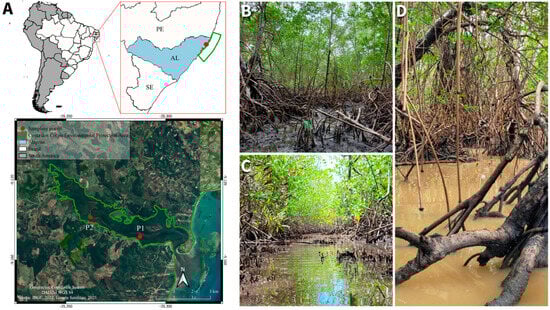
Figure 3.
Location of the study area within South America and Brazil, highlighting the state of Alagoas (AL) and the Costa dos Corais Environmental Protection Area (APACC) in Northeastern Brazil. The red dots indicate sampling points (P1 and P2) within the protected area. The inset map provides a detailed view of the sampling sites along the water body in the APACC. The geographic coordinate system was as follows: WGS 84. Data sources: IBGE (2022) and Google Satellites (2025) (A). Environmental conditions of the sampled mangroves during the dry season (B,C) and the rainy season (D) after an extreme rainfall event. Figure 3B,C show the normal tidal variation in our sampling area; photographs were taken on the same day (16 May 2022). (A) Sampling area during low tide, which reached 0.2 m above sea level (B). Sampling area during high tide, which peaked at 2.2 m above sea level (C). Sampling area during low tide, which reached 0.2 m above sea level (Photograph taken on 16 June 2022) (B). Note the difference between the water height compared to Figure 3B and the color of the water, which turned brownish due to the great sediment movement caused by the extreme rainfall event.
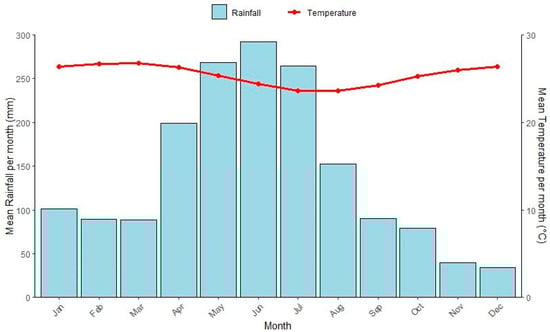
Figure 4.
Mean monthly rainfall (bars) and temperature (line) were recorded at the nearest weather station (Maceió, ~120 km from the study site). Climate data were obtained from the Brazilian Institute of Meteorology (INMET) and corresponded to the period 2010–2021.
4.2. Study Species
Laguncularia racemosa is common in mangroves and popularly known as “white mangrove”. It typically occupies a narrow ecological niche in elevated soils where tidal flooding is moderate to infrequent [51]. In northeastern Brazilian mangroves, it generally occurs in areas under higher influence of freshwater but can present a wider distribution over the estuarine gradients in these areas [60]. This species was our study model because of its worldwide distribution [61,62] and abundance in the sampled area. It produces leaves constantly throughout the year, peaking between February and May [63]. It is considered shade-intolerant [64], growing in flooded areas with high salinity and acidity due to pneumatophores that facilitate gas exchange, and to leaf blades bearing structures analogous to excretory glands, allowing salt excretion [65]. Salt excretion may also occur through leaf loss, as mangrove plants, especially L. racemosa [66], show evidence of a short leaf lifespan. Mangroves have a higher leaf turnover than shade-tolerant species from other ecosystems because their leaves cannot expand infinitely to accumulate salt [65,66].
4.3. Study Design
We selected two mangrove fringes 2.95 km apart along the Manguaba River (9°08′54″ S; 35°18′46″ W and 9°08′25″ S; 35°19′58″ W; Figure 3A). Sampling occurred in December 2021 (dry season), when rainfall was 39.6 mm/month [32], falling within the historical rainfall range (~36.7 mm/month). During the rainy season, we took advantage of an extreme rainfall event resulting from the passage of an Easterly Wave Disturbance [67] that occurred in May 2022, severely affecting Northeastern Brazil [68]. Extreme events are often characterized by their intensity, frequency, duration, magnitude, and impact [69]. Studies that rely on magnitude to identify these events use statistical thresholds, such as rainfall exceeding the 90th percentile of the historical means. Our event surpassed this standard, as the climatological standard for Alagoas indicated an average rainfall of 294.7 mm during May [59], with high accumulated rainfall (~160 mm) for several cities over 24 h. In May 2022, the rainfall reached 579 mm, which is approximately twice the historical average for the study area and the highest value since 2010. Specifically, the extreme rainfall that we observed exceeded ~97% of the historical mean, indicating an event well beyond the typical variability for the region. Additionally, this event caused substantial environmental impacts, including severe flooding and sediment displacement in the mangrove ecosystem, aligning with criteria commonly used to define extreme climatic events. Extreme events are becoming increasingly frequent in the East Coast of Northeast Brazil and this atypical rainfall during this period has caused intense flooding [68,69] (Figure 3), which also emphasizes the social and economic impacts of this event [69,70]. We performed the sampling to analyze the negative impacts of the climate event as soon as the roads were safe, between 15 and 17 June 2022.
For the two mangrove fringes, we selected five mature individuals that were at least 50 m apart during the dry (Ntotal = 10) and rainy (Ntotal = 30) seasons. The initial sampling design, which was applied during the dry season, focused on herbivory, consisting of sampling five individuals per point based on a standardized global protocol for herbivory estimation [71]. However, following an extreme climatic event, we expanded the sample size to 30 individuals (N = 15 per point) after the extreme rain event to better capture the possible variability induced by this drastic change in environmental conditions. Although stress measurement was not the primary aim of sampling, we leveraged this unexpected weather event to investigate how drastic climatic changes could affect stress indicators in mangrove plants. In addition to the flowering process concentration in June [36], we selected individuals that did not show signs of reproductive structures.
For each individual, we collected 10 leaves from 5 branches distributed around the plant, totalling 50 leaves per sampled individual. Immediately after sampling, the leaves were stored in plastic bags labeled according to the sampling site, leaf, and individual identities. We scanned the leaves and measured their area (LA) (Figure 5) using ImageJ (version 1.53k) software. Subsequently, we placed the leaves in an oven at 60 °C for 72 h. After drying in the oven, we weighed the leaves using an analytical balance to obtain their dry weight (g). We calculated the specific leaf area (SLA) through the ratio between the LA and the dry weight of the leaf (g) (Figure 5) [72].
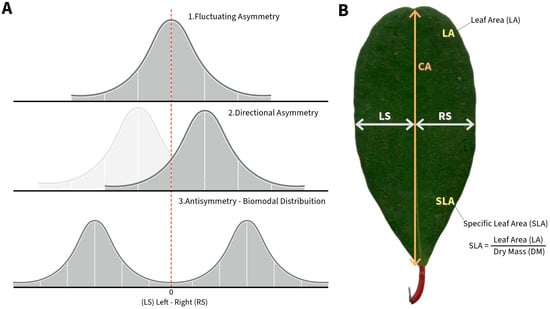
Figure 5.
Theoretical examples of three types of asymmetry: fluctuating, directional, and antisymmetry (A). Schematic example of Laguncularia racemosa leaf measurements. RS—right side, LS—left side, and CA—central axis (CA). In addition, examples of Leaf Area (LA) and Specific Leaf Area (SLA) (B).
Subsequently, in the laboratory, we selected 50 and 150 leaves for the dry and rainy seasons, respectively (Ntotal = 200), for measuring fluctuating asymmetry (FA). We measured the right (RS) and left (LS) widths in the central region of the leaf midrib using ImageJ (Figure 5) [63,64]. We calculated FA as the absolute difference between the right and left widths of the leaf (RS-LS) divided by the average distance of the right and left widths (RS + LS/2) to correct for size-dependent deviations [13,73,74,75,76,77] and identified the presence of FA when leaf deviations did not significantly deviate from zero [13,15,75]. We measured each leaf three times to estimate the measurement error (ME), which is considered as the proportion of within-individual variation to total variation, and calculated using the formula where is the mean squared value of the intra-individual variance, and is the added variance component [78]. was calculated as , where is the mean-squared error of the variance between individuals, and is the mean-squared error intra individuals. and values were obtained from an analysis of variance considering the leaf identity as a predictor, and each repeated measurement of the leaf as response variable [13]. If the ME was <1%, the measurements were considered highly precise [79]. However, it is noteworthy that this type of measurement error is more important for plants with small leaves [80], which is not the case for L. racemosa.
4.4. Data Analysis
Before considering FA, we discarded directional and antisymmetry (Figure 4). Fluctuating asymmetry is characterized by a normal distribution around a mean that does not significantly deviate from zero [13], suggesting the absence of directional asymmetry (normal distribution with a mean difference of zero) or antisymmetry (platykurtic or bimodal distribution around a mean near zero) [15]. We performed Lilliefors normality tests using the ‘lillie.test’ function from the nortest package [81] and one-way t-tests using the ‘t.test’ function from the base package [82].
To verify whether leaf area and specific leaf area varied between the dry season and after extreme rainfall (ERE), we constructed two linear mixed models (GLMM) using a Gaussian distribution. In these models, the season was used as a fixed predictor variable, plant individuals nested within the sampling point as a random variable, and traits as response variables. This procedure allowed us to account for interindividual and site-specific variations. The marginal and conditional R values of the models were calculated using the “r.squaredGLMM” function in the MuMin package [83]. The graphs were generated using ggplot2 [84]. All analyses were performed in R (version 4.3.1) [83].
Author Contributions
Conceptualization, G.R.D.; methodology, D.S., L.S., J.V.S. and G.R.D.; validation, K.R.B., J.C.S. and G.R.D.; formal analysis, D.S., J.V.S., K.R.B. and G.R.D.; investigation, D.S., L.S., J.V.S., K.R.B., J.C.S. and G.R.D.; resources, G.R.D.; data curation, D.S., J.V.S., K.R.B. and G.R.D.; writing—original draft preparation, D.S., L.S. and G.R.D.; writing—review and editing, D.S., L.S., J.V.S., K.R.B., J.C.S. and G.R.D.; visualization, D.S.; supervision, K.R.B. and G.R.D.; funding acquisition, G.R.D. All authors have read and agreed to the published version of the manuscript.
Funding
This study is part of the Long-Term Ecological Research—Brazil site PELD-CCAL (Projeto Ecológico de Longa Duração—Costa dos Corais, Alagoas), funded by the Brazilian National Council for Scientific and Technological Development—CNPq (#441657/2016-8, #442237/2020-0, #316489/2021-2), the Research Support Foundation of the State of Alagoas, FAPEAL—(#60030.1564/2016, #PLD2021010000001), and the Coordination for the Improvement of Higher Education Personnel CAPES Brazil (#23038.000452/2017-16). We are grateful to FAPEAL for providing scholarship grants to DS and JVS.
Data Availability Statement
The raw data supporting the conclusions of this article will be made available by the authors upon request.
Acknowledgments
We thank Instituto Chico Mendes de Conservação da Biodiversidade, Claudjane Amorim, and Clemente Coelho for their fieldwork support.
Conflicts of Interest
The authors declare no conflicts of interest.
References
- Balestrini, R.; Chitarra, W.; Ghirardo, A.; Nardini, A.; Nerva, L. A stressful life: How plants cope with multiple biotic and abiotic adverse factors. Plant Stress 2022, 5, 100095. [Google Scholar] [CrossRef]
- Meisner, A.; De Deyn, G.B.; de Boer, W.; van der Putten, W.H. Soil biotic legacy effects of extreme weather events influence plant invasiveness. Proc. Natl. Acad. Sci. USA 2013, 110, 9835–9838. [Google Scholar] [CrossRef] [PubMed]
- Ripple, W.J.; Wolf, C.; Gregg, J.W.; Rockström, J.; Newsome, T.M.; Law, B.E.; Marques, L.; Lenton, T.M.; Xu, C.; Huq, S.; et al. 2023 Special Report The 2023 state of the climate report: Entering uncharted territory. BioScience 2023, 12, 841–850. [Google Scholar] [CrossRef]
- Orlowsky, B.; Seneviratne, S.I. Global changes in extreme events: Regional and seasonal dimension. Clim. Change 2012, 110, 669–696. [Google Scholar] [CrossRef]
- Lichtenthaler, H.K. Vegetation stress: An introduction to the stress concept in plants. J. Plant Physiol. 1996, 148, 4–14. [Google Scholar] [CrossRef]
- Lovelock, C.E.; Ellison, J.C. Vulnerability of mangroves and tidal wetlands of the Great Barrier Reef to climate change. In Climate Change and the Great Barrier Reef: A Vulnerability Assessment; Johnson, J.E., Marshall, P.A., Eds.; Great Barrier Reef Marine Park Authority and Australian Greenhouse Office: Townsville, Australia, 2007; pp. 237–269. [Google Scholar]
- Osland, M.J.; Feher, L.C.; Griffith, K.T.; Cavanaugh, K.C.; Enwright, N.M.; Day, R.H.; Stagg, C.L.; Krauss, K.W.; Howard, R.J.; Grace, J.B.; et al. Climatic controls on the global distribution, abundance, and species richness of mangrove forests. Ecol. Monogr. 2017, 87, 341–359. [Google Scholar] [CrossRef]
- Knight, J.M.; Dale, P.E.R.; Dunn, R.J.K.; Broadbent, G.J.; Lemckert, C.J. Patterns of tidal flooding within a mangrove forest: Coombabah Lake, Southeast Queensland, Australia. Estuar. Coast. Shelf. Sci. 2008, 76, 580–593. [Google Scholar] [CrossRef]
- Ellison, J.C. Impacts of sediment burial on mangroves. Mar. Pollut. Bull. 1999, 37, 420–426. [Google Scholar] [CrossRef]
- Lagomasino, D.; Fatoyinbo, T.; Castañeda-Moya, E.; Cook, B.D.; Montesano, P.M.; Neigh, C.S.; Morton, D.C. Storm surge and ponding explain mangrove dieback in southwest Florida following Hurricane Irma. Nat. Commun. 2021, 12, 4003. [Google Scholar] [CrossRef]
- Pezeshki, S.R.; DeLaune, R.D. Soil oxidation-reduction in wetlands and its impact on plant functioning. Biology 2012, 1, 196–221. [Google Scholar] [CrossRef]
- Hogan, J.A.; Castañeda-Moya, E.; Lamb-Wotton, L.; Troxler, T.; Baraloto, C. Water levels primarily drive variation in photosynthesis and nutrient use of scrub Red Mangroves in the southeastern Florida Everglades. Tree Physiol. 2022, 42, 797–814. [Google Scholar] [CrossRef]
- Palmer, A.R.; Strobeck, C. Fluctuating asymmetry: Measurement, analysis, patterns. Annu. Rev. Ecol. Syst. 1986, 17, 391–421. [Google Scholar] [CrossRef]
- Cornelissen, T.; Stiling, P. Small variations over large scales: Fluctuating asymmetry over the range of two oak species. Int. J. Plant Sci. 2010, 171, 303–309. [Google Scholar] [CrossRef]
- Graham, J.H.; Raz, S.; Hel-Or, H.; Nevo, E. Fluctuating asymmetry: Methods, theory, and applications. Symmetry 2010, 2, 466–540. [Google Scholar] [CrossRef]
- Venâncio, H.; Alves-Silva, E.; Santos, J.C. Leaf phenotypic variation and developmental instability in relation to different light regimes. Acta Bot. Bras. 2016, 30, 296–303. [Google Scholar] [CrossRef]
- Telhado, C.; Silveira, F.A.; Fernandes, G.W.; Cornelissen, T. Fluctuating asymmetry in leaves and flowers of sympatric species in a tropical montane environment. Plant Species Biol. 2017, 32, 3–12. [Google Scholar] [CrossRef]
- Graham, J.H.; Freeman, D.C.; Emlen, J.M. Antisymmetry, directional asymmetry, and dynamic morphogenesis. Genetica 1993, 89, 121–137. [Google Scholar] [CrossRef]
- Møller, A.P.; Swaddle, J.P. Asymmetry, Developmental Stability and Evolution; Oxford University Press: Oxford, UK, 1997. [Google Scholar]
- Freeman, D.C.; Brown, M.L.; Duda, J.J.; Graraham, J.H.; Emlen, J.M.; Krzysik, A.J.; Zak, J.C. Leaf fluctuating asymmetry, soil disturbance and plant stress: A multiple year comparison using two herbs, Ipomoea pandurata and Cnidoscolus stimulosus. Ecol. Indic. 2005, 5, 85–95. [Google Scholar] [CrossRef]
- Cuevas-Reyes, P.; Fernandes, G.W.; González-Rodríguez, A.; Pimenta, M. Effects of generalist and specialist parasitic plants (Loranthaceae) on the fluctuating asymmetry patterns of rupestrian host plants. Basic. Appl. Ecol. 2011, 12, 449–455. [Google Scholar] [CrossRef]
- Euan-Quiñones, O.A.; Mena-Martín, H.; Herrera-Pérez, P.; Cetina-Pérez, R.A.; Bautista-Parra, S.G.; Ballina-Gomez, H.S. Beyond the Classical Janzen–Connell Hypothesis: The Role of the Area Under the Parent Tree Crown of Manilkara zapota. Stresses 2024, 4, 762–772. [Google Scholar] [CrossRef]
- Hódar, J.A. Leaf fluctuating asymmetry of Holm oak in response to drought under contrasting climatic conditions. J. Arid. Environ. 2002, 52, 233–243. [Google Scholar] [CrossRef]
- Valkama, J.; Kozlov, M.V. Impact of climatic factors on developmental stability of mountain birches growing in a contaminated area. J. Appl. Ecol. 2001, 38, 665–673. [Google Scholar] [CrossRef]
- Wright, I.J.; Reich, P.B.; Westoby, M.; Ackerly, D.D.; Baruch, Z.; Bongers, F.; Villar, R. The worldwide leaf economics spectrum. Nature 2004, 428, 821–827. [Google Scholar] [CrossRef] [PubMed]
- Díaz, S.; Kattge, J.; Cornelissen, J.H.; Wright, I.J.; Lavorel, S.; Dray, S.; Gorné, L.D. The global spectrum of plant form and function. Nature 2016, 529, 167–171. [Google Scholar] [CrossRef] [PubMed]
- Evans, J.; Poorter, H.J.P.C. Photosynthetic acclimation of plants to growth irradiance: The relative importance of specific leaf area and nitrogen partitioning in maximizing carbon gain. Plant. Cell. Environ. 2001, 24, 755–767. [Google Scholar] [CrossRef]
- Tribouillois, H.; Fort, F.; Cruz, P.; Charles, R.; Flores, O.; Garnier, E.; Justes, E. A functional characterisation of a wide range of cover crop species: Growth and nitrogen acquisition rates, leaf traits and ecological strategies. PLoS ONE 2015, 10, e0122156. [Google Scholar] [CrossRef]
- Reich, P.B.; Walters, M.B. Photosynthesis-nitrogen relations in Amazonian tree species: II. Variation in nitrogen vis-a-vis specific leaf area influences mass-and area-based expressions. Oecologia 1994, 97, 73–81. [Google Scholar] [CrossRef]
- Adame, M.F.; Virdis, B.; Lovelock, C.E. Effect of geomorphological setting and rainfall on nutrient exchange in mangroves during tidal inundation. Mar. Freshw. Res. 2010, 61, 1197–1206. [Google Scholar] [CrossRef]
- Lappalainen, J.H.; Martel, J.; Lempa, K.; Wilsey, B.; Ossipov, V. Effects of resource availability on carbon allocation and developmental instability in cloned birch seedlings. Int. J. Plant Sci. 2000, 161, 119–125. [Google Scholar] [CrossRef]
- Instituto Nacional de Meteorologia do Brasil. Extremes Events in June 2022 in BRAZIL. Available online: https://portal.inmet.gov.br/noticias/eventos-extremos-de-junho-de-2022-no-brasil#:~:text=Em%20junho%20de%202022%2C%20os,extremos%20nas%20regi%C3%B5es%20do%20Brasil (accessed on 12 August 2022).
- Flooding List. Brazil—Homes Destroyed, Hundreds Displaced by Floods in Pernambuco, Alagoas and Paraíba. Available online: https://floodlist.com/america/brazil-floods-pernambuco-alagoas-paraiba-may-2022 (accessed on 24 December 2024).
- Skelton, N.J.; Allaway, W.G. Oxygen and pressure changes measured in situ during flooding in roots of the Grey Mangrove Avicennia marina (Forssk.) Vierh. Aquat. Bot. 1996, 54, 165–175. [Google Scholar] [CrossRef]
- McKee, K.L. Growth and physiological responses of neotropical mangrove seedlings to root zone hypoxia. Tree Physiol. 1996, 16, 883–889. [Google Scholar] [CrossRef] [PubMed]
- Nadia, T.L.; Morellato, L.P.C.; Machado, I.C. Reproductive phenology of a northeast Brazilian mangrove community: Environmental and biotic constraints. Flora-Morphol. Distrib. Funct. Ecol. Plants 2012, 207, 682–692. [Google Scholar] [CrossRef]
- Eyre, B. Nutrient biogeochemistry in the tropical Moresby river estuary system North Queensland, Australia. Estuar. Coast. Shelf Sci. 1994, 39, 15–31. [Google Scholar] [CrossRef]
- Wösten, J.H.M.; De Willigen, P.; Tri, N.H.; Lien, T.V.; Smith, S.V. Nutrient dynamics in mangrove areas of the Red River Estuary in Vietnam. Estuar. Coast. Shelf Sci. 2003, 57, 65–72. [Google Scholar] [CrossRef]
- Naidoo, G. Effects of salinity and nitrogen on growth and water relations in the mangrove, Avicennia marina (Forsk.) Vierh. New Phytol. 1987, 107, 317–325. [Google Scholar] [CrossRef]
- Knops, J.M.; Reinhart, K. Specific leaf area along a nitrogen fertilization gradient. Am. Midl. Nat. 2000, 144, 265–272. [Google Scholar] [CrossRef]
- Bompy, F.; Lequeue, G.; Imbert, D.; Dulormne, M. Increasing fluctuations of soil salinity affect seedling growth performances and physiology in three Neotropical mangrove species. Plant Soil 2014, 380, 399–413. [Google Scholar] [CrossRef]
- Ahmed, S.; Sarker, S.K.; Friess, D.A.; Kamruzzaman, M.; Jacobs, M.; Islam, M.A.; Pretzsch, H. Salinity reduces site quality and mangrove forest functions. From monitoring to understanding. Sci. Total Environ. 2022, 853, 158662. [Google Scholar] [CrossRef]
- Yanez-Espinosa, L.; Terrazas, T.; Lopez-Mata, L.; Valdez-Hernandez, J.I. Wood variation in Laguncularia racemosa and its effect on fibre quality. Wood Sci. Technol. 2004, 38, 217–226. [Google Scholar] [CrossRef]
- Peterson, J.M.; Bell, S.S. Tidal events and salt-marsh structure influence black mangrove (Avicennia germinans) recruitment across an ecotone. Ecology 2012, 93, 1648–1658. [Google Scholar] [CrossRef]
- Ataíde, G.D.M.; Castro, R.V.; Correia, A.C.G.; dos Reis, G.G.; Reis, M.D.G.F.; Rosado, A.M. Interaction of trees and winds: Ecophysiological aspects and forestry. Ciênc Florest. 2015, 25, 523–536. [Google Scholar] [CrossRef]
- Huang, P.; Wan, X.; Lieffers, V.J. Daytime and nighttime wind differentially affects hydraulic properties and thigmomorphogenic response of poplar saplings. Physiol. Plant 2016, 157, 85–94. [Google Scholar] [CrossRef] [PubMed]
- Sun, S.; Liu, X.; He, Y.; Lv, P.; Zhang, L.; Wei, S. Responses of physiological characteristics of annual C4 herbs to precipitation and wind changes in semi-arid sandy grassland, Northern China. Pol. J. Ecol. 2020, 68, 121–131. [Google Scholar] [CrossRef]
- Villavicencio, C.B.; Ferreira, A.C.; Costa, R.C.D.; Machado, J.V.; Freitas, C.V.C.; Moro, M.F.; Bezerra, L.E.A. Facilitation in mangrove ecosystem: The role of herbaceous species in seedling recruitment and growth patterns of Avicennia germinans in a recovering mangrove in Northeastern Brazil. Acta Bot. Bras. 2024, 38, e20220283. [Google Scholar] [CrossRef]
- Kodikara, K.A.S.; Jayatissa, L.P.; Huxham, M.; Dahdouh-Guebas, F.; Koedam, N. The effects of salinity on growth and survival of mangrove seedlings changes with age. Acta Bot. Bras. 2017, 32, 37–46. [Google Scholar] [CrossRef]
- Ball, M.C. Interactive effects of salinity and irradiance on growth: Implications for mangrove forest structure along salinity gradients. Trees 2002, 16, 126–139. [Google Scholar] [CrossRef]
- Lonard, R.I.; Judd, F.W.; DeYoe, H.R.; Stalter, R. Biology and Ecology of the Halophyte Laguncularia racemosa (L.) Gaertn. f.: A Review. In Handbook of Halophytes; Grigore, M.N., Ed.; Springer: Cham, Germany, 2021. [Google Scholar] [CrossRef]
- Sobrado, M.A. Influence of external salinity on the osmolality of xylem sap, leaf tissue and leaf gland secretion of the mangrove Laguncularia racemosa (L.) Gaertn. Trees 2004, 18, 422–427. [Google Scholar] [CrossRef]
- Méndez-Alonzo, R.; López-Portillo, J.; Moctezuma, C.; Bartlett, M.K.; Sack, L. Osmotic and hydraulic adjustment of mangrove saplings to extreme salinity. Tree Physio 2016, 36, 1562–1572. [Google Scholar] [CrossRef]
- Al-Khayri, J.M.; Abdel-Haleem, M.; Khedr, E.H. Harnessing GABA Pathways to Improve Plant Resilience Against Salt Stress. Horticulturae 2024, 10, 1296. [Google Scholar] [CrossRef]
- Instituto Brasileiro de Geografia e Estatística. Cidades e Estados. Available online: https://www.ibge.gov.br/cidades-e-estados/al/porto-de-pedras.html (accessed on 22 July 2023).
- Instituto Chico Mendes da Conservação da Biodiversidade. Plano de Manejo da Área de Proteção Ambiental Costa dos Corais 2020. Available online: https://www.icmbio.gov.br/apacostadoscorais/planos-de-manejo/zoneamento.html (accessed on 3 February 2022).
- Alvares, C.A.; Stape, J.L.; Sentelhas, P.C.; Gonçalves, J.L.M.; Sparovek, G. Köppen’s climate classification map for Brazil. Meteorol. Z. 2014, 22, 711–728. [Google Scholar] [CrossRef]
- Instituto Nacional de Meteorologia do Brasil. Banco de Dados Meteorológicos—BDMET, Brasília. 2022. Available online: https://bdmep.inmet.gov.br/ (accessed on 20 February 2025).
- Instituto Nacional de Meteorologia do Brasil. Rainfall Balance of Maceió in May 2023. Available online: https://portal.inmet.gov.br/uploads/notastecnicas/Macei%C3%B3-Balan%C3%A7o_Maio_2023.pdf (accessed on 7 July 2023).
- Costa, P.; Dórea, A.; Mariano-Neto, E.; Barros, F. Are there general spatial patterns of mangrove structure and composition along estuarine salinity gradients in Todos os Santos Bay? Estuar. Coast. Shelf Sci. 2015, 166, 83–91. [Google Scholar] [CrossRef]
- Basha, S.K. An overview on global mangroves distribution. Indian. J. Geo-Mar. Sci. 2018, 43, 766–772. [Google Scholar]
- Sereneski-Lima, C.; Baggio, R.A.; Pil, M.W.; Boeger, M.R.T.; Boeger, W.A. Historical and contemporary factors affect the genetic diversity and structure of Laguncularia racemosa (L.) Gaertn, along the western Atlantic coast. Estuar. Coast. Shelf Sci. 2021, 249, 107055. [Google Scholar] [CrossRef]
- De Alvarenga AM, S.B.; Botosso, P.C.; Soffiatti, P. Stem growth and phenology of three subtropical mangrove tree species. Braz. J. Bot. 2017, 40, 907–914. [Google Scholar] [CrossRef]
- Ball, M.C. Patterns of secondary succession in a mangrove forest of southern Florida. Oecologia 1980, 44, 226–235. [Google Scholar] [CrossRef]
- Saenger, P.; West, P.W. Determinants of some leaf characteristics of Australian mangroves. Bot. J. Linn. Soc. 2016, 180, 530–541. [Google Scholar] [CrossRef]
- Choong, M.F.; Lucas, P.W.; Ong, J.S.Y.; Pereira, B.; Tan, H.T.W.; Turner, I.M. Leaf fracture toughness and sclerophylly: Their correlations and ecological implications. New Phytol. 1992, 121, 597–610. [Google Scholar] [CrossRef]
- Gomes, H.B.; Ambrizzi, T.; Pontes da Silva, B.F.; Hodghes, K.; Dias, P.L.S.; Herdies, D.L.; Silva, M.C.L.; Gomes, H.B. Climatology of easterly wave disturbances over the tropical South Atlantic. Clim. Dyn. 2019, 53, 1393–1411. [Google Scholar] [CrossRef]
- Junior, F.D.C.V.; Zachariah, M.; do Vale Silva, T.L.; dos Santos, E.P.; Coelho, C.A.; Alves, L.M.; Otto, F.E. An attribution study of very intense rainfall events in Eastern Northeast Brazil. Weather. Clim. Extrem. 2024, 100699. [Google Scholar] [CrossRef]
- McPhillips, L.E.; Chang, H.; Chester, M.V.; Depietri, Y.; Friedman, E.; Grimm, N.B.; Kominoski, J.S.; McPhearson, T.; Méndez-Lázaro, P.; Rosi, E.J.; et al. Defining Extreme Events: A Cross-Disciplinary Review. Earth’s Future 2018, 6, 441–455. [Google Scholar] [CrossRef]
- Marengo, J.A.; Alcantara, E.; Cunha, A.P.; Seluchi, M.; Nobre, C.A.; Dolif, G.; Moraes, O.L. Flash floods and landslides in the city of Recife, Northeast Brazil after heavy rain on May 25–28, 2022: Causes, impacts, and disaster preparedness. Weather. Clim. Extrem. 2023, 39, 100545. [Google Scholar] [CrossRef]
- Mendes, G.M.; Silveira, F.A.O.; Oliveira, C.; Dáttilo, W.; Guevara, R.; Ruiz-Guerra, B.; Boaventura, M.G.; Sershen, R.S.; Phartyal, S.S.; Ribeiro, S.P.; et al. How much leaf area do insects eat? A data set of insect herbivory sampled globally with a standardized protocol. Ecology 2021, 102, e03301. [Google Scholar] [CrossRef] [PubMed]
- Pérez-Harguindeguy, N.; Díaz, S.; Garnier, E.; Lavorel, S.; Poorter, H.; Jaureguiberry, P.; Bret-Harte, M.S.; Cornwell, W.K.; Craine, J.M.; Gurvich, D.E.; et al. New handbook for standardised measurement of plant functional traits worldwide. Aust. Bot. 2013, 61, 167–234. [Google Scholar] [CrossRef]
- Alves-Silva, E.; Santos, J.C.; Cornelissen, T.G. How many leaves are enough? The influence of sample size on estimates of plant developmental instability and leaf asymmetry. Ecol. Indic. 2018, 89, 912–924. [Google Scholar] [CrossRef]
- Mendes, G.; Boaventura, M.G.; Cornelissen, T. Fluctuating asymmetry as a bioindicator of environmental stress caused by pollution in a pioneer plant species. Environ. Entomol. 2018, 47, 1479–1484. [Google Scholar] [CrossRef]
- Cornelissen, T.; Stiling, P. Perfect is best: Low leaf fluctuating asymmetry reduces herbivory by leaf miners. Oecologia 2005, 142, 46–56. [Google Scholar] [CrossRef]
- Maldonado-López, Y.; Vaca-Sánchez, M.S.; Canché-Delgado, A.; García-Jaín, S.E.; González-Rodríguez, A.; Cornelissen, T.; Cuevas-Reyes, P. Leaf herbivory and fluctuating asymmetry as indicators of mangrove stress. Wetlands Ecol. Manag. 2019, 27, 571–580. [Google Scholar] [CrossRef]
- Alves-Silva, E.; Del-Claro, K. Herbivory causes increases in leaf spinescence and fluctuating asymmetry as a mechanism of delayed induced resistance in a tropical savanna tree. Plant Ecol. Evol. 2016, 149, 73–80. [Google Scholar] [CrossRef]
- Merila, J.; Biorklund, M. Fluctuating asymmetry and measurement error. Syst. Biol. 1995, 44, 97–101. [Google Scholar] [CrossRef]
- Májeková, M.; Springer, B.; Ferenc, V.; Gruntman, M.; Tielbörger, K. Leaf fluctuating asymmetry is not a reliable indicator of stress. Funct. Ecol. 2024, 38, 1447–1457. [Google Scholar] [CrossRef]
- Graham, J.H.; Whitesell, M.J.; Flemming, M., II; Hel-Or, H.; Nevo, E.; Raz, S. Fluctuating Asymmetry of Plant Leaves: Batch Processing with LAMINA and Continuous Symmetry Measures. Symmetry 2015, 7, 255–268. [Google Scholar] [CrossRef]
- Gross, J.; Ligges, U. Nortest: Tests for Normality. R Package Version 1.0-4. 2015. Available online: https://cran.r-project.org/web/packages/nortest/index.html (accessed on 20 November 2024).
- R Core Team. R: A Language and Environment for Statistical Computing; R Foundation for Statistical Computing: Vienna, Austria, 2023; Available online: https://www.R-project.org/ (accessed on 20 November 2024).
- Bartoń, K. MuMIn: Multi-Model Inference. R Package Version 1.48.4. Available online: https://CRAN.R-project.org/package=MuMIn (accessed on 20 November 2024).
- Wickham, H. ggplot2: Elegant Graphics for Data Analysis; Springer: New York, NY, USA, 2016; Available online: https://ggplot2.tidyverse.org (accessed on 20 November 2024).
Disclaimer/Publisher’s Note: The statements, opinions and data contained in all publications are solely those of the individual author(s) and contributor(s) and not of MDPI and/or the editor(s). MDPI and/or the editor(s) disclaim responsibility for any injury to people or property resulting from any ideas, methods, instructions or products referred to in the content. |
© 2025 by the authors. Licensee MDPI, Basel, Switzerland. This article is an open access article distributed under the terms and conditions of the Creative Commons Attribution (CC BY) license (https://creativecommons.org/licenses/by/4.0/).