Article

Comparative Physiology of Indica and Japonica Rice under Salinity and Drought Stress: An Intrinsic Study on Osmotic Adjustment, Oxidative Stress, Antioxidant Defense and Methylglyoxal Detoxification

by
Md. Shahadat Hossen
1,2,
Md. Fazlul Karim
1,
Masayuki Fujita
2,*,
M. H. M. Borhannuddin Bhuyan
2,3,
Kamrun Nahar
4,
Abdul Awal Chowdhury Masud
1,2,
Jubayer Al Mahmud
5 and
Mirza Hasanuzzaman
1,*
1
Department of Agronomy, Sher-e-Bangla Agricultural University, Dhaka 1207, Bangladesh
2
Laboratory of Plant Stress Responses, Department of Applied Biological Sciences, Kagawa University, Takamatsu 761-0795, Japan
3
Citrus Research Center, Bangladesh Agricultural Research Institute, Jaintapur, Sylhet 3156, Bangladesh
4
Department of Agricultural Botany, Sher-e-Bangla Agricultural University, Dhaka 1207, Bangladesh
5
Department of Agroforestry and Environmental Science, Sher-e-Bangla Agricultural University, Dhaka 1207, Bangladesh
*
Authors to whom correspondence should be addressed.
Stresses 2022, 2(2), 156-178; https://doi.org/10.3390/stresses2020012
Submission received: 20 February 2022 / Revised: 21 March 2022 / Accepted: 23 March 2022 / Published: 25 March 2022
(This article belongs to the Special Issue Stress Responses in Crops)

Abstract

:
Salinity and drought stress are significant environmental threats, alone or in combination. The current study was conducted to investigate the morpho-physiology, osmotic adjustment, oxidative stress, antioxidant defense and methylglyoxal detoxification of three rice genotypes from the indica (cv. BRRI dhan29 and BRRI dhan48) and japonica (cv. Koshihikari) groups. Eighteen-day-old seedlings of these genotypes were exposed to either in alone salinity (150 mM NaCl) and drought (15% PEG 6000) or in the combination of salinity and drought (150 mM NaCl + 15% PEG 6000) stress in vitro for 72 h. Compared with the control, the water status, biomass and photosynthetic pigments were decreased, where a significant increase was seen in the mortality rate, hydrogen peroxide content, electrolyte leakage, lipoxygenase activity, level of malondialdehyde and methylglyoxal, indicating increased lipid peroxidation in rice genotypes in stress conditions. The non-enzymatic and enzymatic components of the ascorbate-glutathione (AsA-GSH) pool in rice genotypes were disrupted under all stress treatments, resulting imbalance in the redox equilibrium. In contrast, compared to other rice genotypes, BRRI dhan48 revealed a lower Na+/K+ ratio, greater proline (Pro) levels, higher activity of AsA, dehydroascorbate (DHA) and GSH, lower glutathione disulfide (GSSG) and a higher ratio of AsA/DHA and GSH/GSSG, whereas enzymatic components increased monodehydroascorbate reductase, dehydroascorbate reductase, glutathione peroxidase and glyoxalase enzymes. The results showed that a stronger tolerate ability for BRRI dhan48 against stress has been connected to a lower Na+/K+ ratio, an increase in Pro content and an improved performance of the glyoxalase system and antioxidant protection for scavenging of reactive oxygen species. These data can give insight into probable responses to single or combination salinity and drought stress in rice genotypes.

1. Introduction

Crop productions are currently at serious risk worldwide owing to the climatic changes along with extreme environmental events. Climatic changes are responsible for the abiotic constraints, including drought and salinity. Drought and salinity are causing significant decreases in global agricultural productivity, among all environmental stresses. Moreover, the co-occurrence of numerous stresses on crop productivity is usually the worst. Both drought and salinity can co-occur in the field, because of the drought the residual soil solution concentrates by salinity [1,2]. Whether the combined effect of drought and salinity in rice [3], barley [2], potato [4] and wheat [5] has been noted as more detrimental in comparison with single stresses remains to be investigated further. The single stress effect on plants has nonetheless been addressed in the majority of current studies [6]. In order to find out stress-resistant crop varieties for higher productivity, there must therefore be increased numbers of research on the combined stress (drought and salinity) effects on crops, in particular on agronomic crops.
Plants have a similar response under drought and salinity stress, both of which lead to a decrease in plant growth and development. Salinity increases sodium (Na+) and chloride (Cl) ions into the soil solution, thereby the water relationship with plants may be disrupted through the reduction of soil water supply, subsequently reducing the osmotic potential. So, it is reasonable to think that the lower soil moisture in saline soil restricts the root growth. Plant roots may thus not absorb water from the subsoil; hence, consequently, plant growth could be severely arrested to withstanding the drought stress [7]. Higher Na+ ions also limit the absorption of K+ through plant roots from the soil solution, leading to a decrease in the ratio of K+/Na+ [8]. This decrease in the K+/Na+ ratio disrupts the cytoplasmic homeostasis in plant cells [9]. If, however, the plants get stressed with drought, the stomata closure causes the starvation of CO2 to the leaves and hence prevents CO2 fixation [8]. This inadequate CO2 leads to the production of reactive oxygen species (ROS) and damages photosynthetic apparatus that might impair photosynthetic activity permanently.
Equilibrium ROS even acts as a signaling molecule in plant cells that maintains various physiological processes. However, the higher salinity and drought cause the generation of superoxide (O2•−), singlet oxygen (1O2), hydroxyl (OH) and hydrogen peroxide (H2O2) in plant cells [10,11,12]. These products can result in oxidative damage in the plant cells through interference with the physiological and biochemical processes [13]. Moreover, plants have enzymatic and non-enzymatic antioxidant defense systems to minimize ROS production and cellular damage. In stress, plants’ enzyme activity (SOD; superoxide dismutase, CAT; catalase, APX; ascorbate peroxidase, MDHAR; monodehydroascorbate reductase, DHAR; dehydroascorbate reductase, GR; glutathione reductase, GPX; glutathione peroxidase, GST; glutathione-S-transferase) may be increased/decreased and the non-enzyme antioxidants’ activity (AsA; GSH; alkaloids; phenolic compounds; non-protein amino acids; α-tocopherol) may also be upregulated/downregulated [12,14]. A further highly reactive cytotoxic methylglyoxal (MG) molecule accumulates during salinity and drought stress, which may damage lipids, proteins and DNA [15]. Plants have another defense mechanism for the detoxification of this MG, called the glyoxalase system, which includes glyoxalase I (Gly I) and glyoxalase II (Gly II) enzymes [14,16]. In this regard, to establish abiotic stress tolerances for plants, it is necessary to understand the antioxidant defense and glyoxalase system under the single or combined stress of drought and salinity.
Among all cereal crops rice (Oryza spp.) is the most important one and depending on agronomic, morphological and physiological features it is divided into two groups, viz., indica and japonica, whereas the first one is abiotic stress tolerance compared to the second one [17]. Over 50% of the world’s people consume rice as a basic meal, which provides 20% of dietary energy worldwide, and in Asia, it is about 70% [18]. Moreover, worldwide rice production annually is about 754.6 million metric tons [19], which is why it is ranked second after maize production. Compared to other cropping systems, the rice production system largely depends on water supply [20]. Therefore, if agricultural land is exposed to drought, then the ground saltwater passes through the capillary pore into the upper soil and disrupts a crop production system; in that way, recent drought and salinity co-occurrence in the arid and semi-arid regions can disrupt crop production. As a consequence, worldwide rice production is hampered either single or combination of drought and salinity stress.
In accordance with stress tolerance, several investigations have revealed the differences between genotypes or sub-species [21,22,23]. Therefore, the resistant genetic resources from various geography and tolerance mechanisms underpinning drought and salinity stress must be detected. While numerous studies have been carried out to explore rice crop tolerance for salinity and drought stress, only a few are concentrated on combined stress or on contrasting genotypes/groups. To understand the mechanisms of oxidative stress, protection system of antioxidants and glyoxalase in three commercially cultivated rice genotypes such as BRRI dhan29, BRRI dhan48 (indica: stress-tolerance) and Koshihikari (japonica: stress-sensitive) under single or combined stress of salinity and drought, this experiment attempted to find out the responses and underlying mechanisms of salinity or drought stress.

2. Results

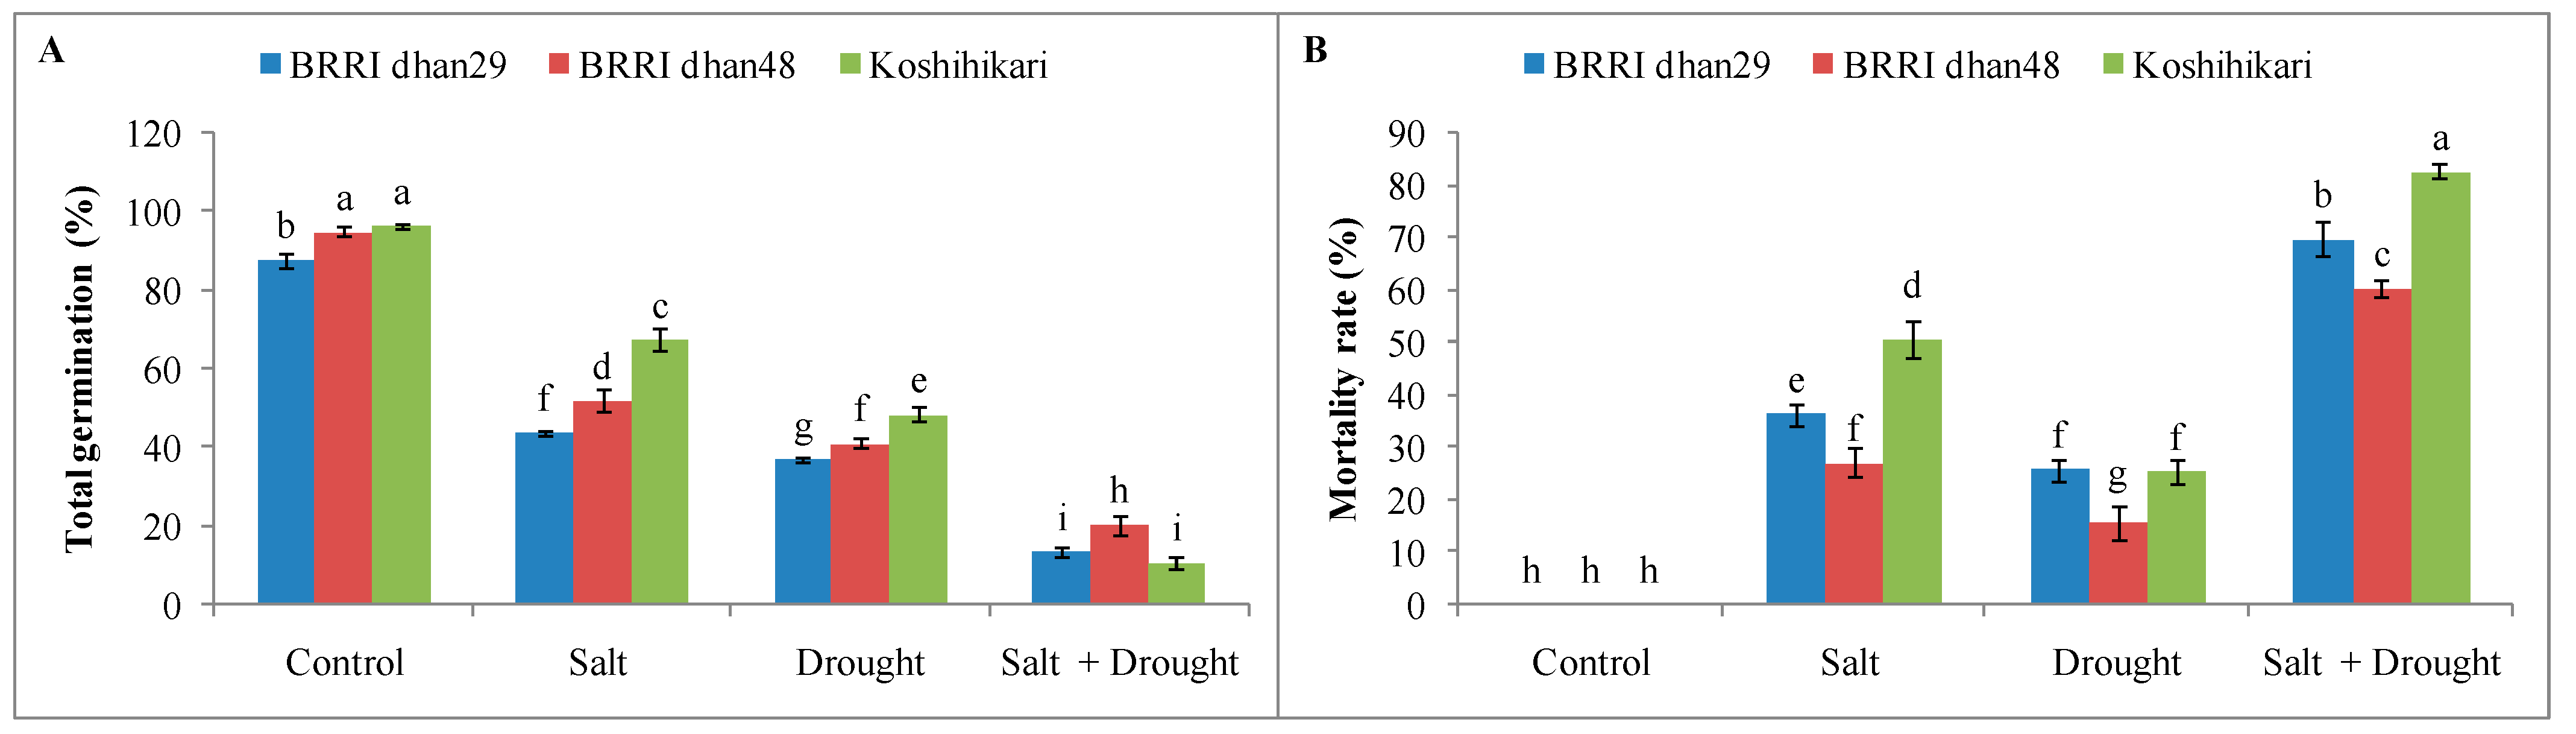
2.1. Germination and Mortality Rate of Rice Seedlings under Stress Conditions

In two independent experiments, seeds and seedlings of three rice genotypes were subjected to salinity, drought and combined salinity and drought resulting in significantly reduced TG of rice seeds, and the mortality rate of seedlings increased. Among all rice genotypes, compared with control, TG was found higher in the salinity- and drought-affected seedlings of Koshihikari by 30% and 50%, respectively. Whereas at the early vegetative stage, in terms of the mortality rate of seedlings compared to others, BRRI dhan48 performed well in the three stress treatments (salinity, drought and combined salinity and drought) by 27%, 16% and 61%, respectively (Figure 1A,B).

2.2. Growth and Development of Rice Seedlings under Stress Conditions

In BRRI dhan29 and Koshihikari, the shoot height, root length and FW of the shoot and root were decreased markedly by 8%, 10%, 26% and 24% and 42%, 41%, 54% and 52%, respectively, compared with the control under combined stress (Figure 2A–C,E). Whereas, in comparison with others genotypes, the DW of the shoot and root under salt, drought and combined stresses were higher in BRRI dhan48 by 87%, 88% and 82% and 91%, 123% and 82%, respectively (Figure 2D,F).

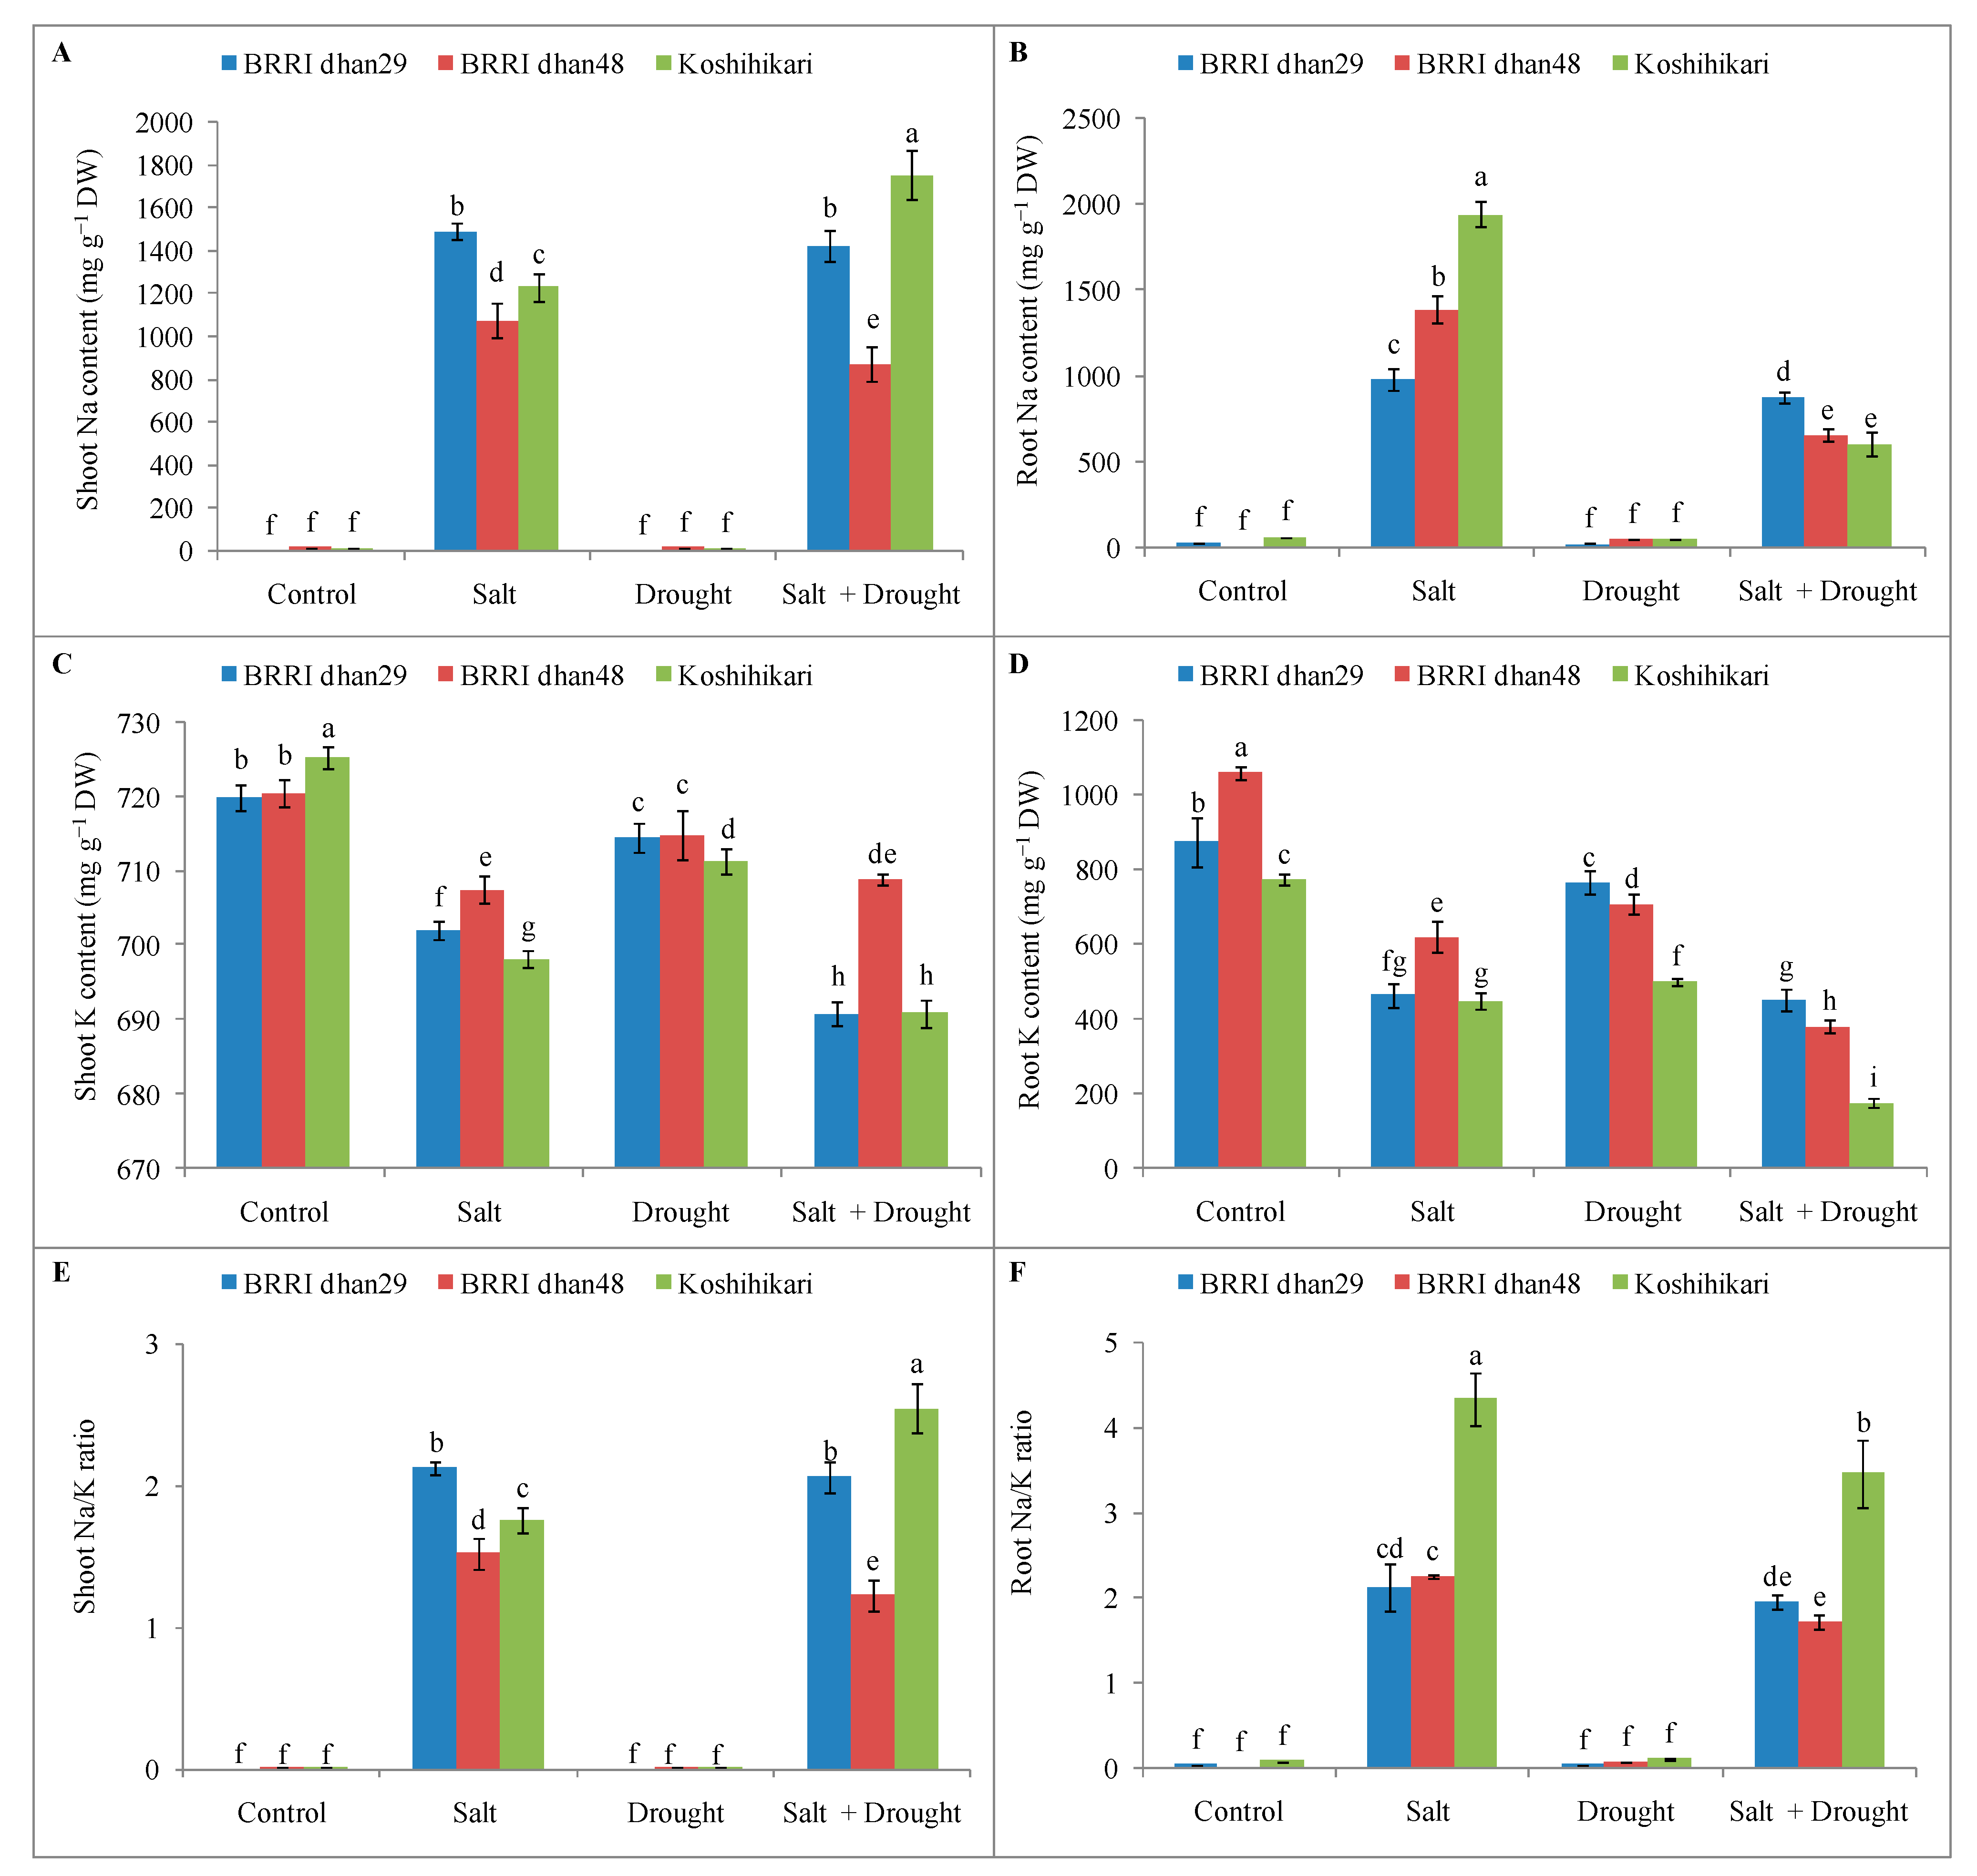
2.3. Ionic Homeostasis of Rice Seedlings under Stress Conditions

A marked increase in Na+ uptake in salinity and combined stress was seen independently, whereas K+ content in shoot and root of all genotypes of rice seedlings was decreased under all stress treatments compared with their control seedlings (Figure 3A–D). As a consequence, the Na+/K+ ratio was seen increased by a higher level of Na+ both in the shoot and root of all rice genotypes under salinity and combined stress (Figure 3E,F). Compared with control, a higher level of K+ in the shoot and lower production of Na+/K+ in both the shoot and root were observed in the salinity- and combined-affected seedlings of BRRI dhan48 than the other genotypes (Figure 3C–F).

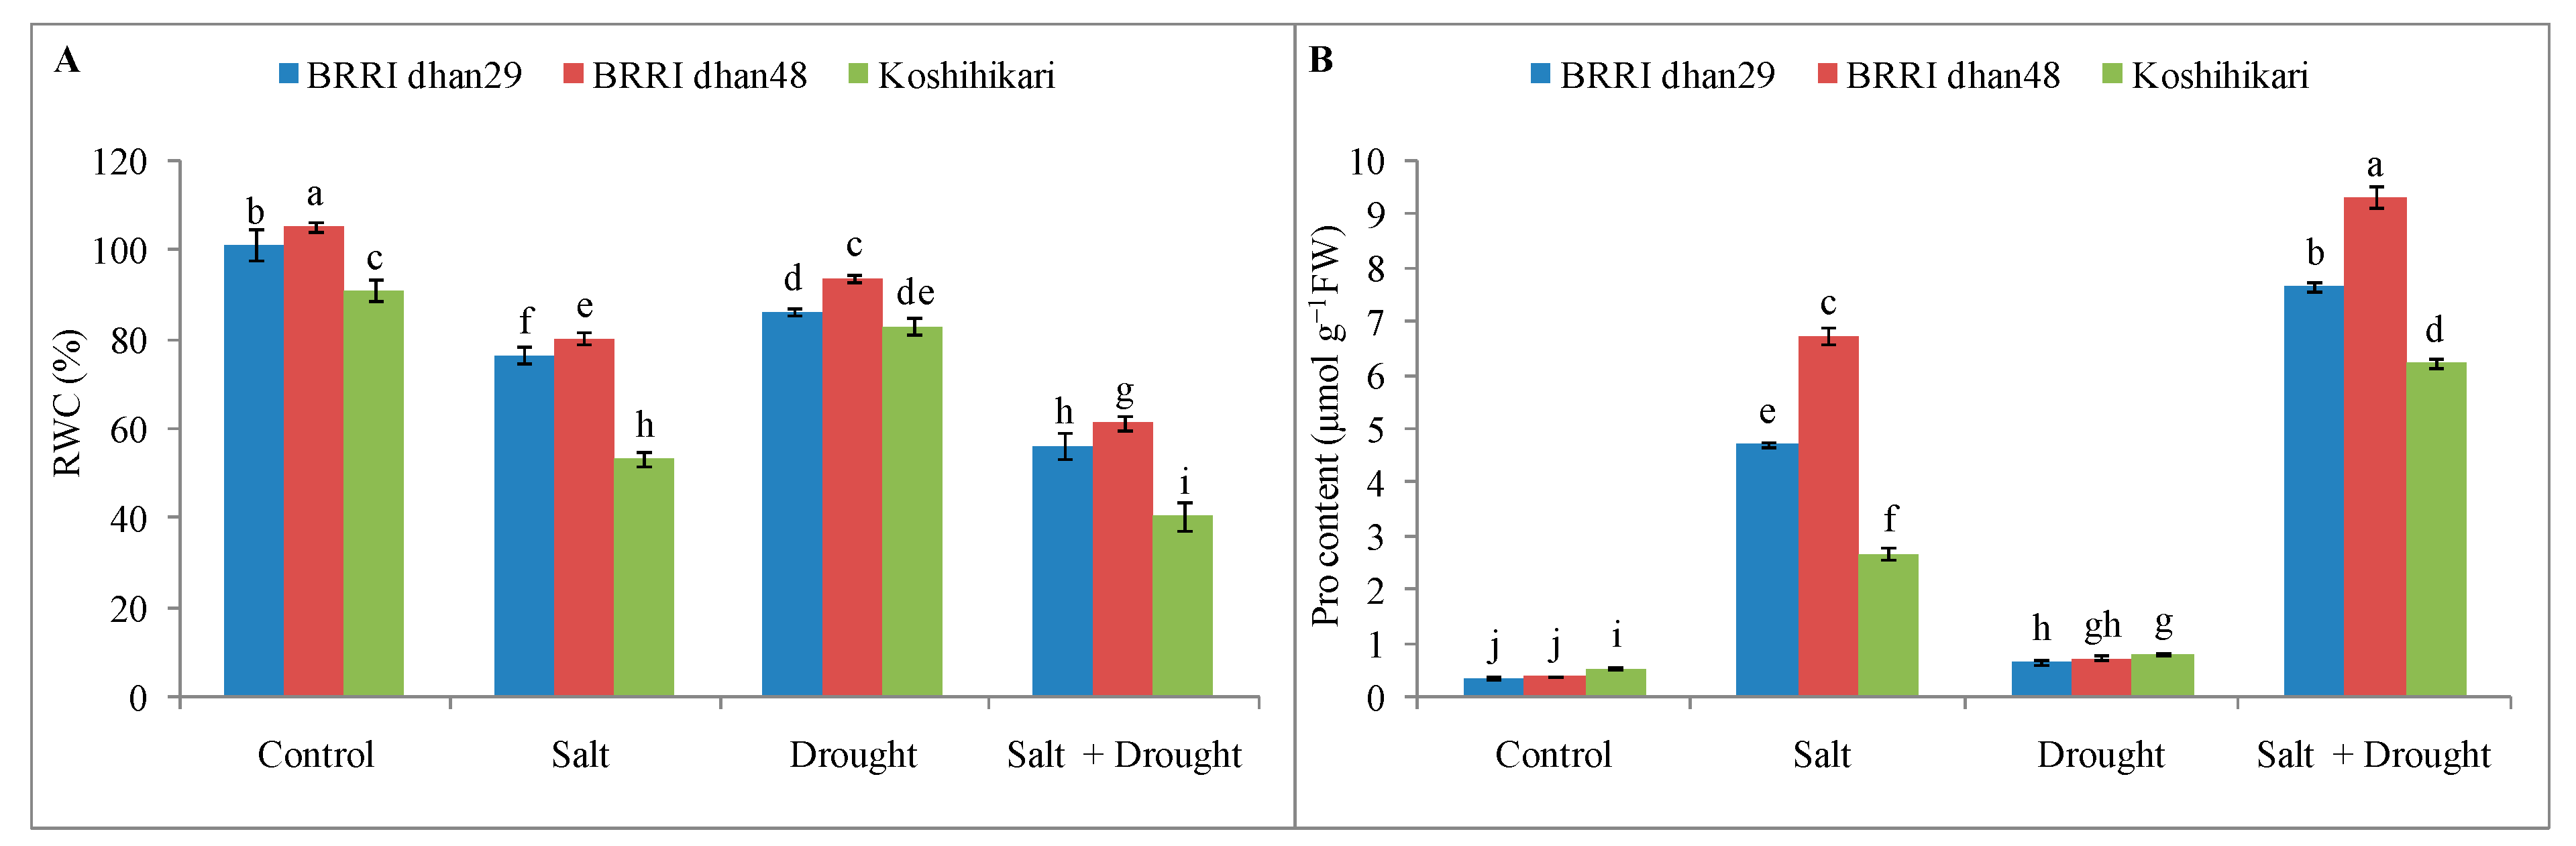
2.4. Relative Water Content and Proline Content of Rice Seedlings under Stress Conditions

Under salinity, drought and their interaction stress, the RWC of rice seedlings leaves was decreased by 41%, 9% and 55% in Koshihikari; 24%, 15% and 44% in BRRI dhan29; and 24%, 11% and 42% in BRRI dhan48, respectively, compared with control (Figure 4A). In contrast, compared to the control under stress conditions, the Pro content was found to be higher in the indica group genotypes than the japonica group genotype (Figure 4B). However, within the genotypes of indica group, the BRRI dhan48 maintained a higher level of Pro content in salinity- and combined-affected seedlings compared with the control (Figure 4B).

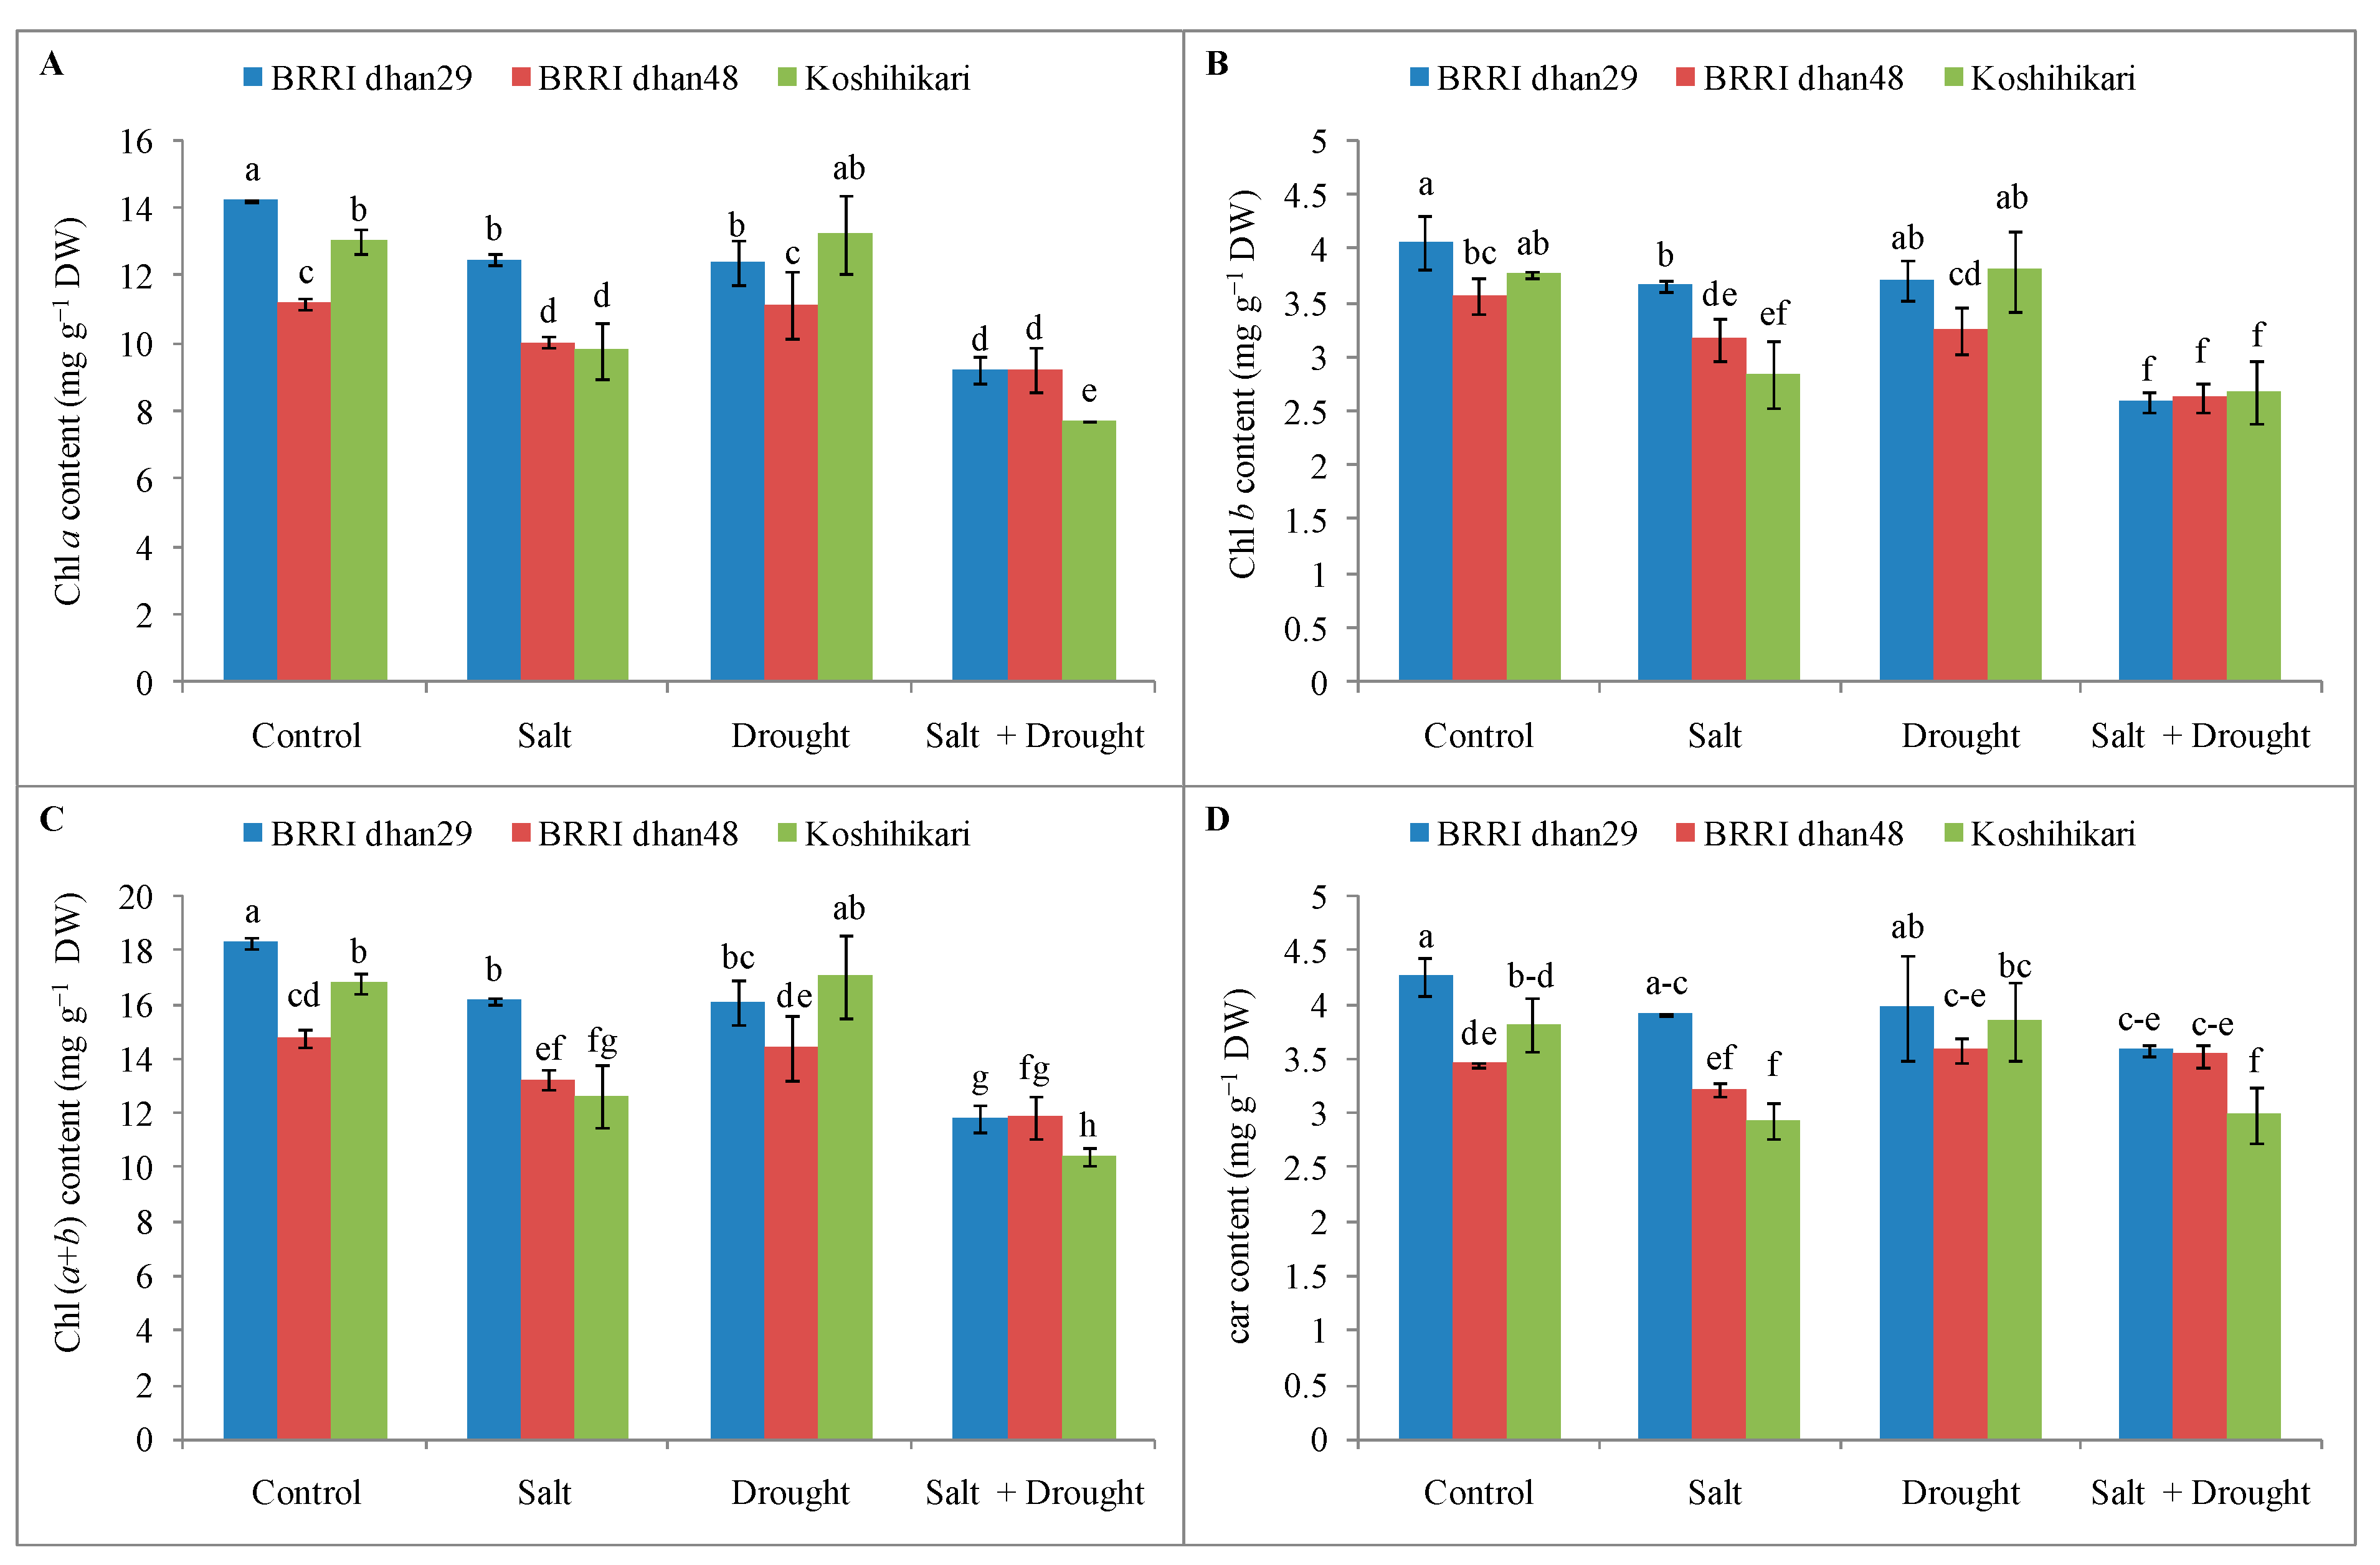
2.5. Photosynthetic Pigment Contents of Rice Seedlings under Stress Conditions

Photosynthetic pigment contents were decreased both in salinity- and combined-affected seedlings compared to their control for each genotype of seedlings of the rice group (Figure 5A–D). Whereas the chl a, chl b and total chl (a + b) contents did not change significantly in Koshihikari under drought stress treatment compared to the control seedlings (Figure 5A–C). The result also revealed that, compared to other genotypes of rice, only the car content of BRRI dhan48 seedlings was significantly increased in drought and combined treatments by 96% and 102%, respectively (Figure 5D).

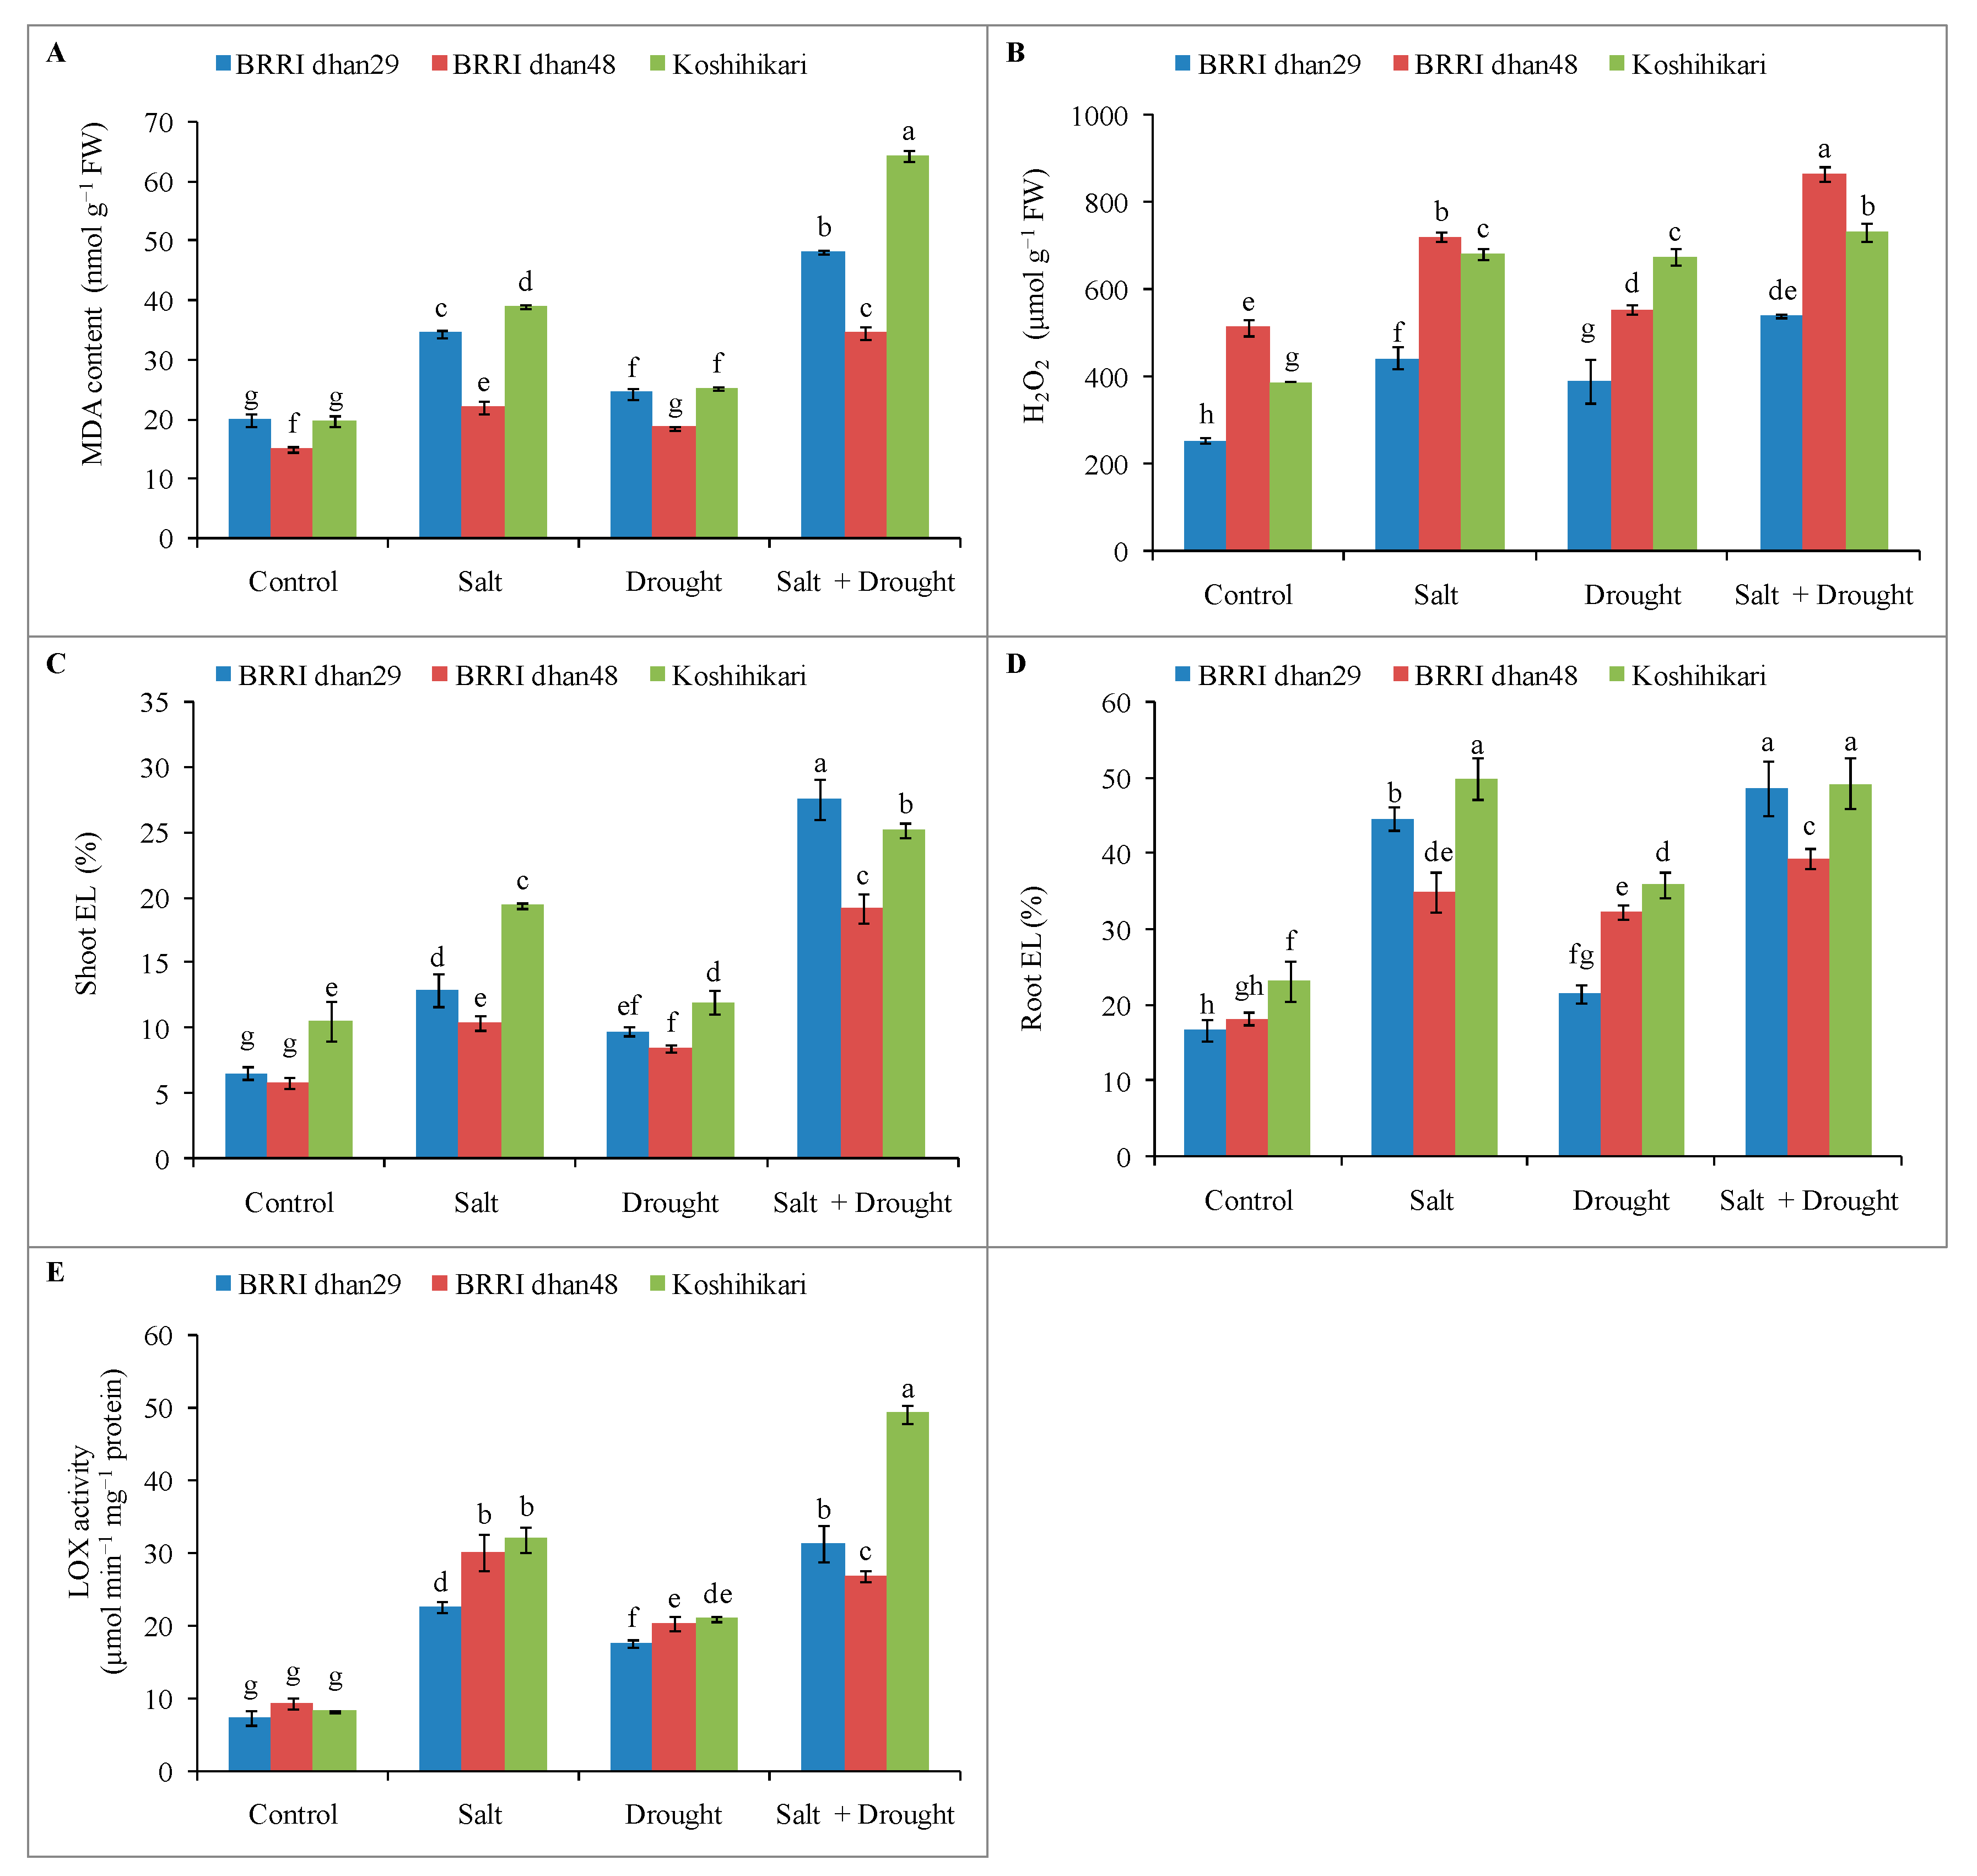
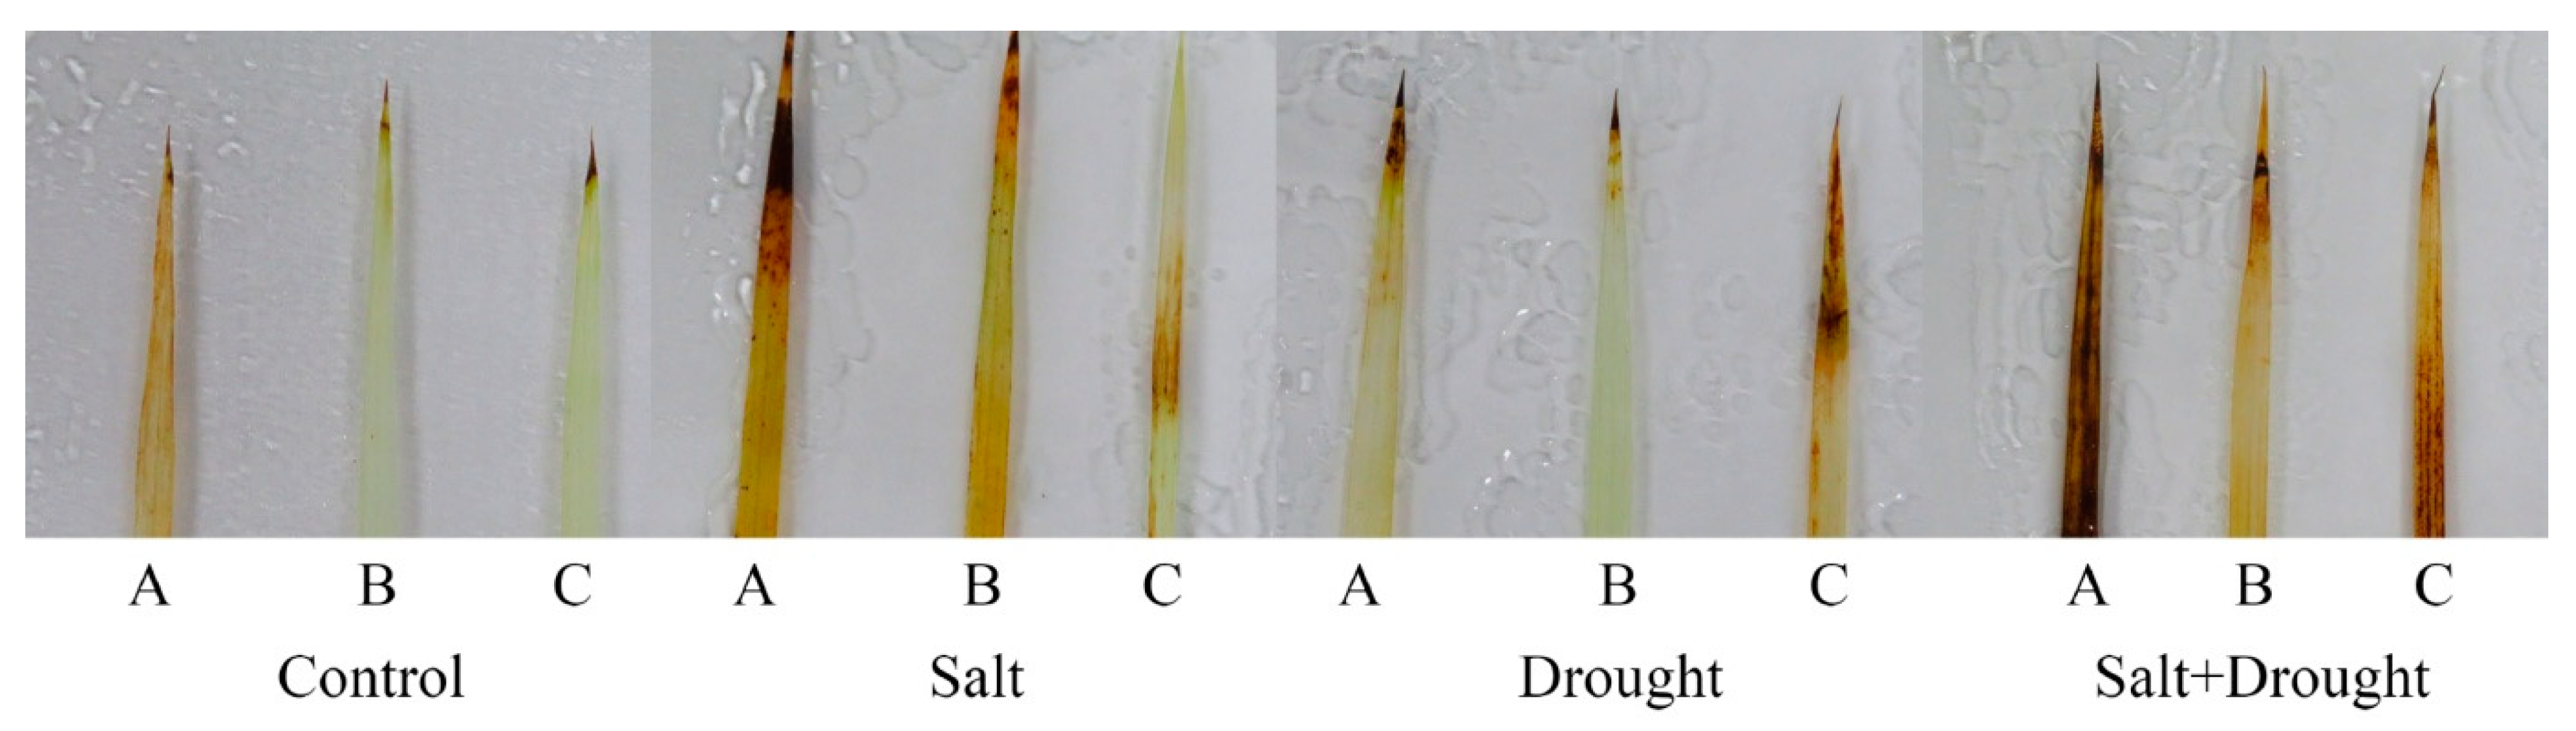
2.6. Oxidative Stress Markers of Rice Seedlings under Stress Conditions

The oxidative damage of the cell membrane was measured by lipid peroxidation in terms of MDA content. It has been observed that, compared with control seedlings under all three stress treatments, the MDA content rose higher by 98%, 28% and 228% in Koshihikari, and the lowest was recorded in BRRI dhan48 by 47%, 24% and 131%, respectively (Figure 6A). On the contrary, combined stress-affected seedlings of BRRI dhan29 and Koshihikari showed a higher level of H2O2 content by 111% and 89%, respectively, compared with their respective control (Figure 6B). While compared to other rice genotypes, the lowest H2O2 was measured in BRRI dhan48 by 40%, 8% and 68%, respectively, under all stress-affected seedlings (Figure 6B). Moreover, the visual localization of H2O2 was detected as brown spots by histochemical staining of rice leaves. As an H2O2 content result, compared to BRRI dhan29 and Koshihikari, the lowest brown spots were observed in BRRI dhan48 seedlings leaves (Figure 7).
It was also found that EL was increased under three stress treatments in all rice genotype seedlings (shoot and root). The higher EL was observed in the combined stress-treated BRRI dhan29, BRRI dhan48 and Koshihikari by 147%, 91% and 96% in the shoot, and 127%, 21% and 32% in the root, respectively, compared with the respective control seedlings (Figure 6C,D). Whether compared with the control or among all rice genotype seedlings, LOX activity was increased significantly in all stress-treated seedlings of BRRI dhan29 and Koshihikari by 206%, 138% and 325% and 285%, 153% and 494%, respectively (Figure 6E).

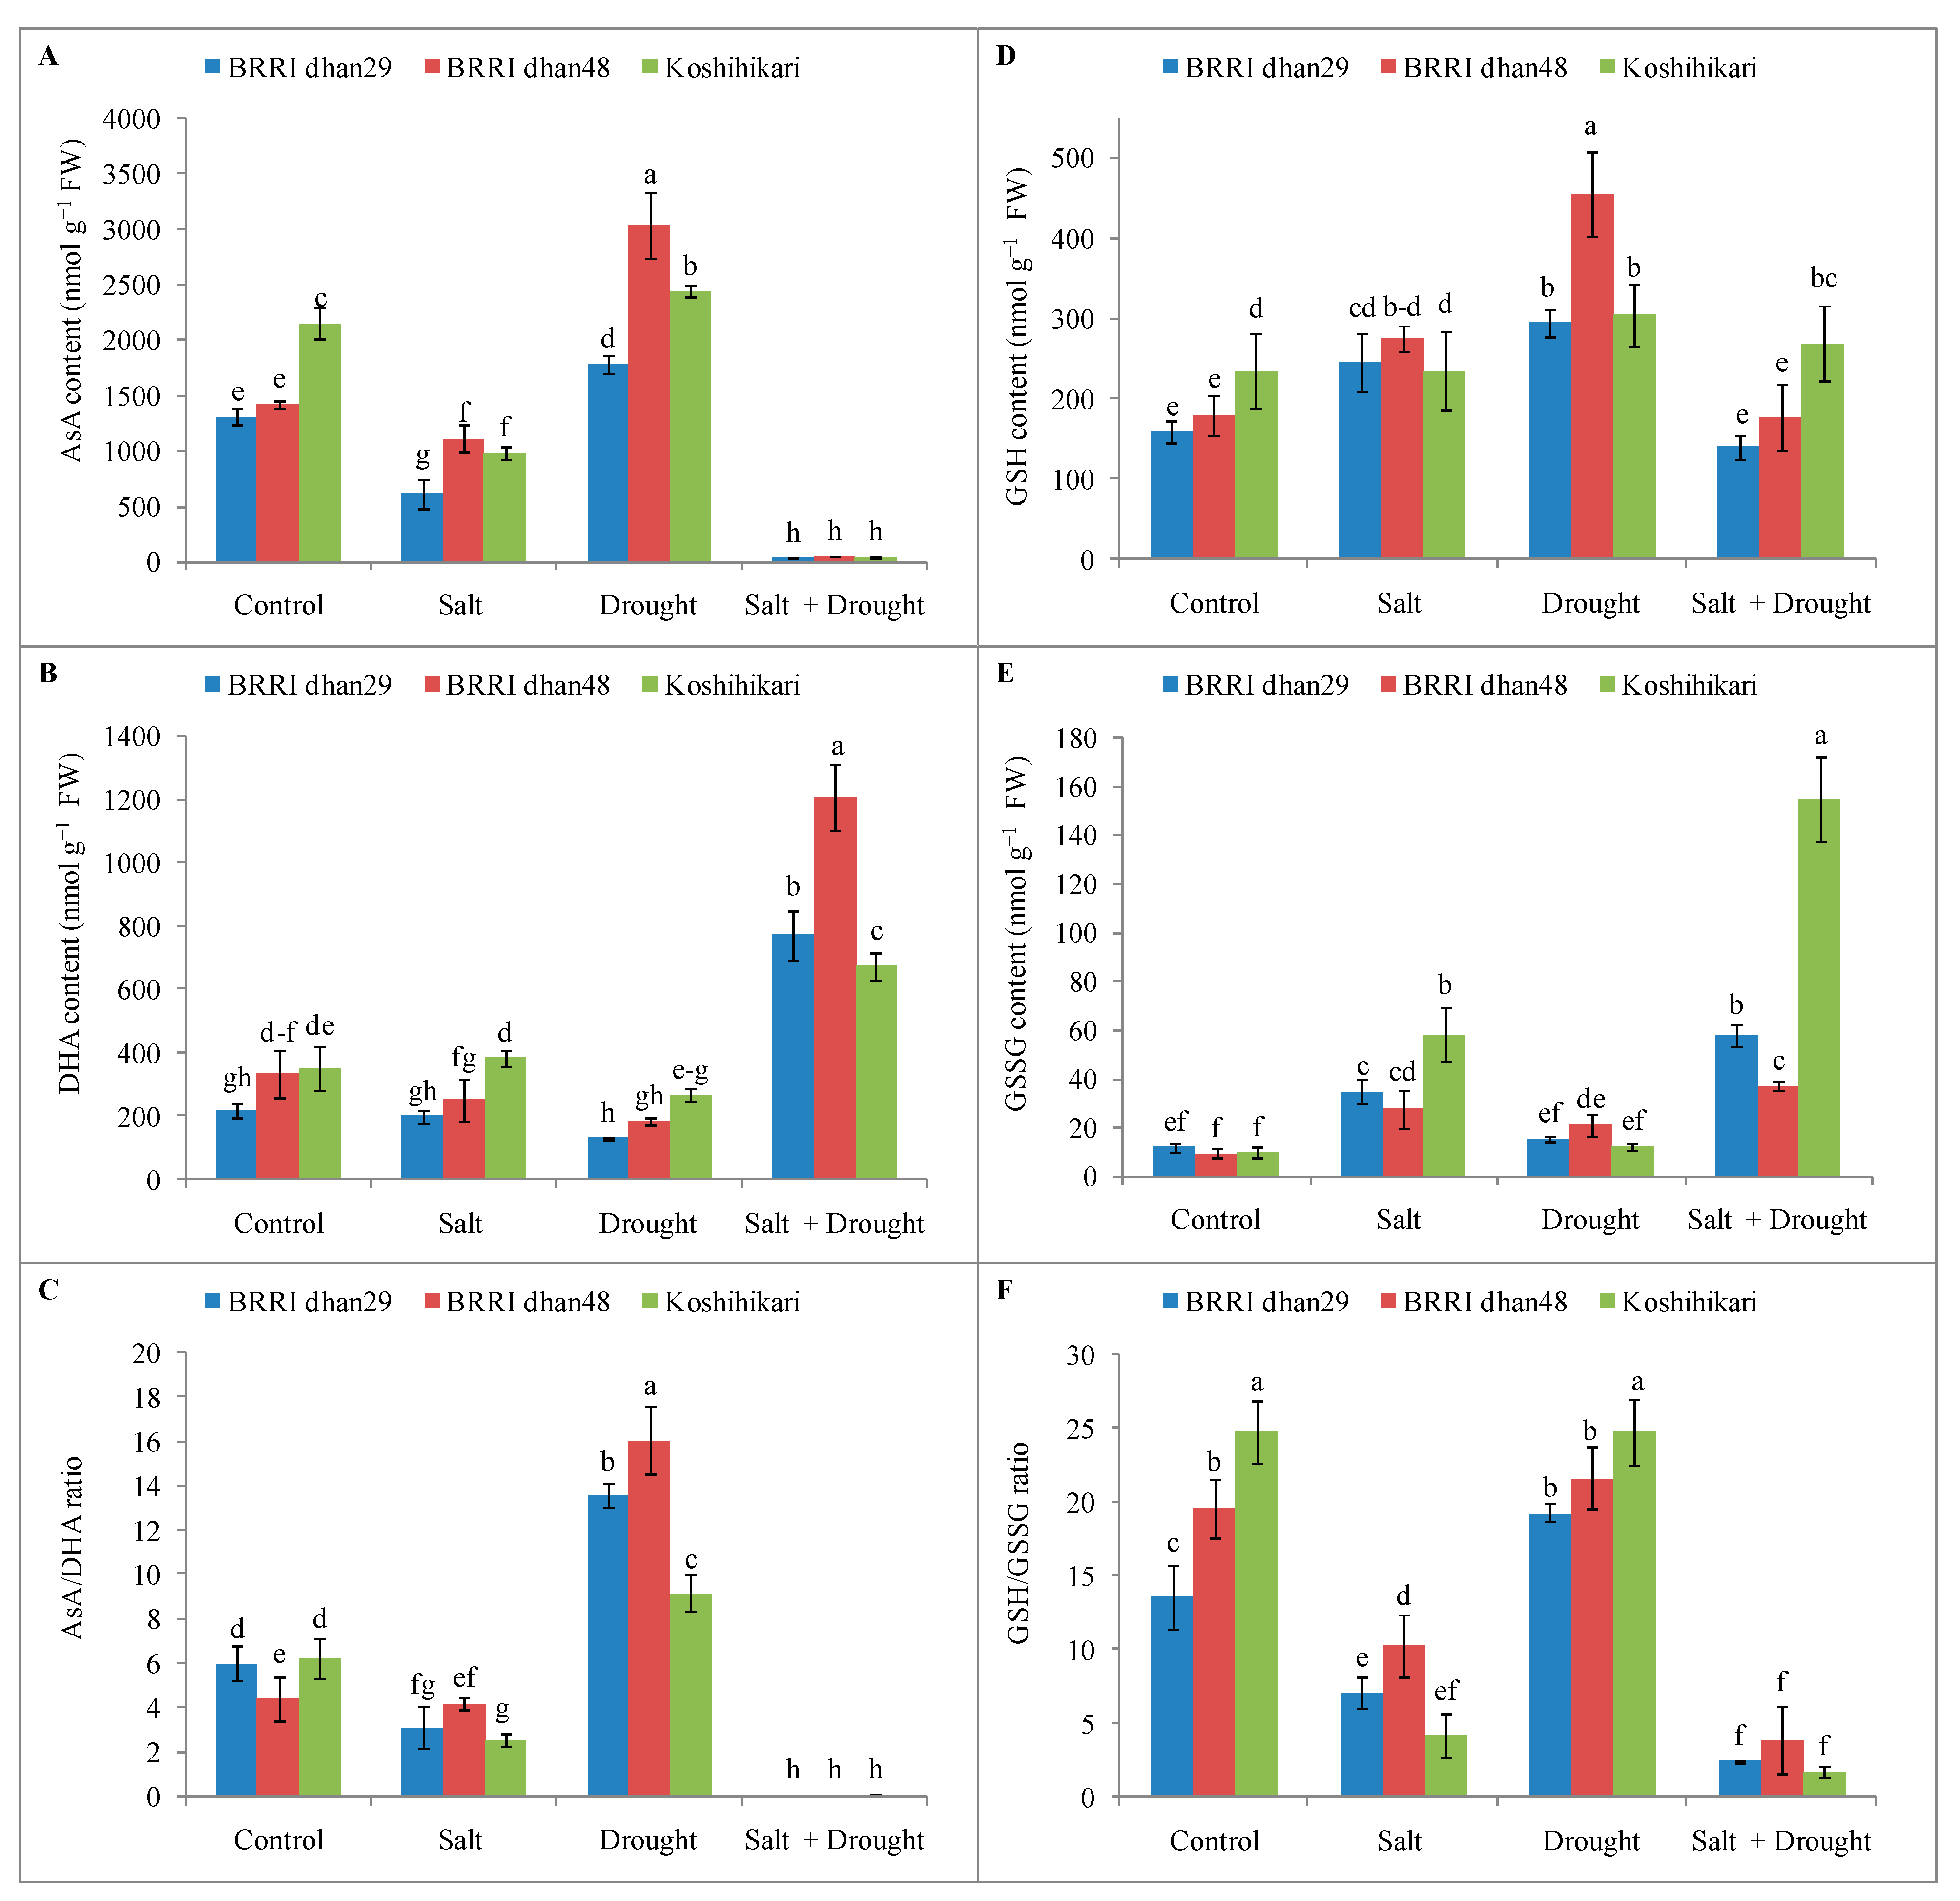
2.7. Non-Enzymatic Antioxidants Activities of Rice Seedlings under Stress Conditions

The non-enzymatic antioxidant content activities varied with the different magnitudes of stress in the three genotypes of rice seedlings. For all rice genotypes, a marked decline of AsA and AsA/DHA ratio was observed in salinity and combined stress and for DHA in salinity and drought stress, except in Koshihikari, salinity stress increased by 9% (Figure 8A–C). On the other hand, the AsA content and AsA/DHA ratio increased only in the drought-treated seedlings of BRRI dhan29, BRRI dhan48 and Koshihikari by 37%, 114% and 13% and 127%, 263% and 47%, respectively, compared to the control (Figure 8A,C). Moreover, compared to the control, the DHA content increased in combined stress-affected seedlings of BRRI dhan29, BRRI dhan48 and Koshihikari by 251%, 262% and 91%, respectively (Figure 8B).
As another important non-enzymatic antioxidant, GSH content was increased in the salinity-treated seedlings of indica group genotypes (BRRI dhan29 and BRRI dhan48) by 54% and 53%, respectively, compared with the control; on the other hand, it decreased in combined stress seedlings except for Koshihikari (where it increased by 14%) (Figure 8D). For drought stress, GSH increased in all rice genotypes, although the highest GSH was recorded in BRRI dhan48 by 154% compared to the control (Figure 8D). However, differences in GSSG content were also observed in all stress-treated seedlings. In salinity and combined treatment, the GSSG content was increased significantly in all rice genotypes, but among the tested genotypes, the lowest GSSG content was observed in BRRI dhan48 by 199% and 298%, respectively (Figure 8E). Therefore, the ratio of GSH/GSSG decreased by 48% and 82% in BRRI dhan29, 47% and 80% in BRRI dhan48 and 83% and 93% in Koshihikari under salinity and combined treatments, respectively; whereas the drought-affected seedlings of BRRI dhan29 showed the highest GSH/GSSG ratio (42%) compared with the control and other genotypes (Figure 8F).

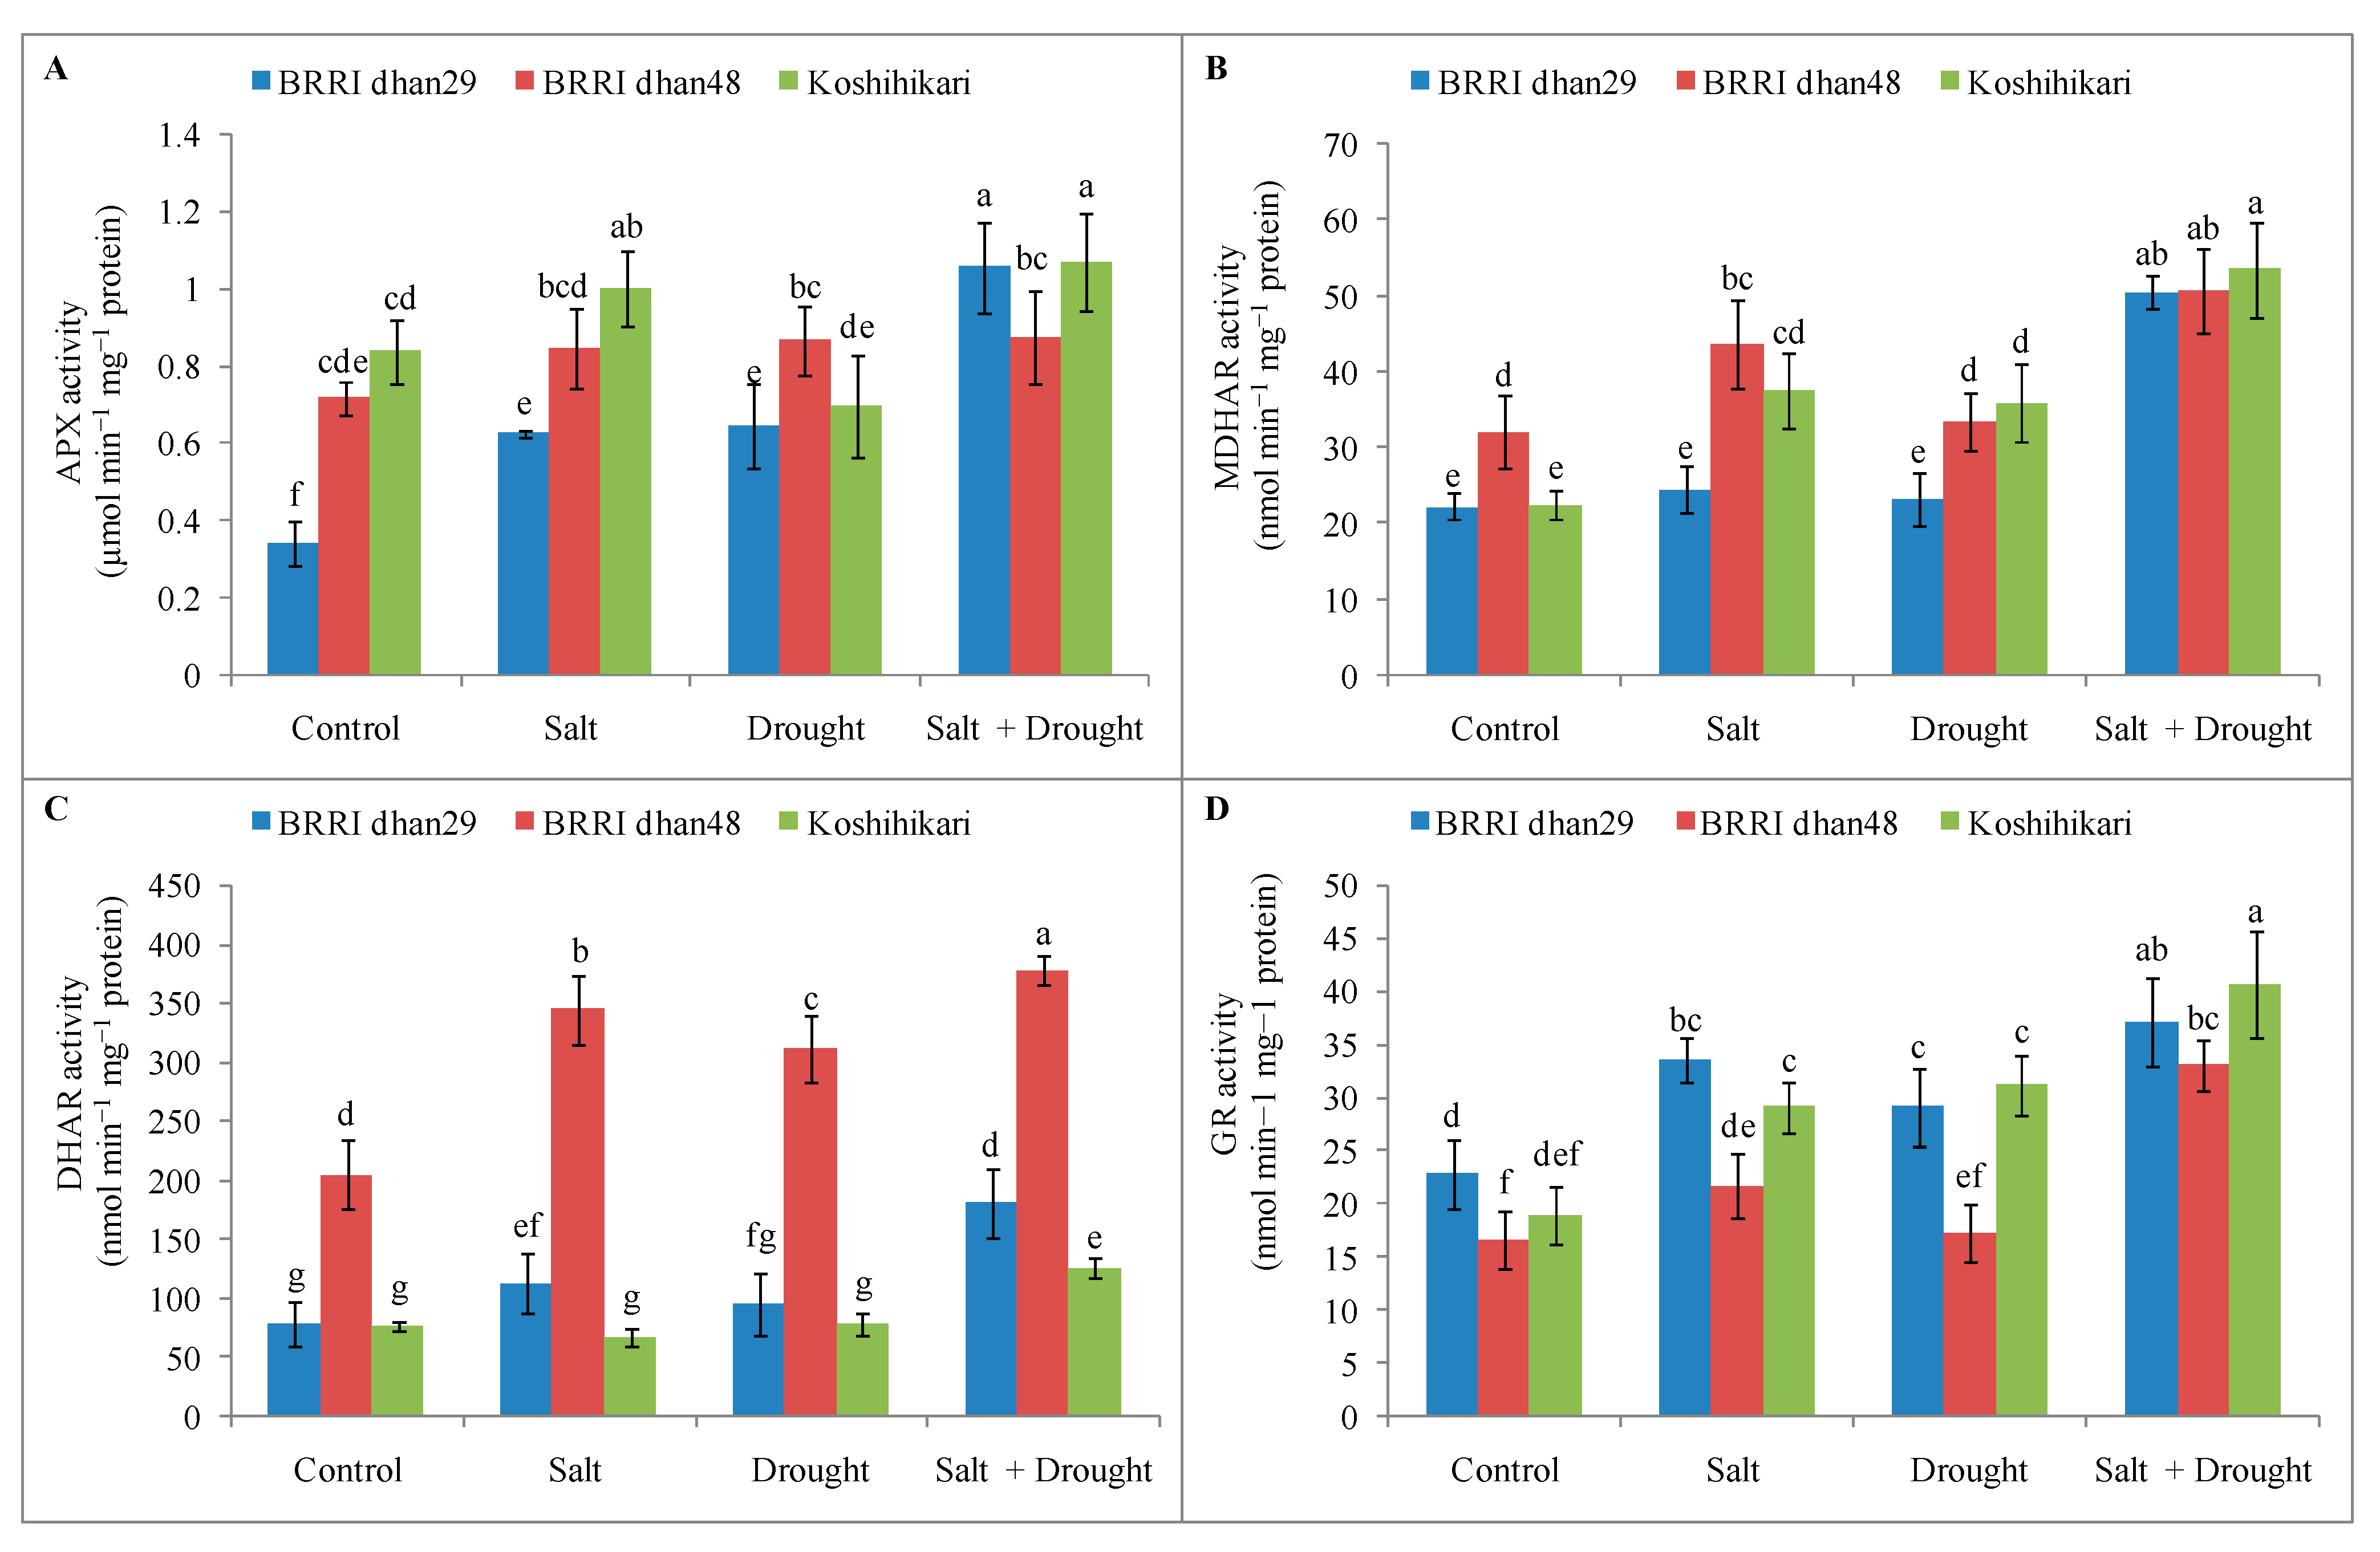
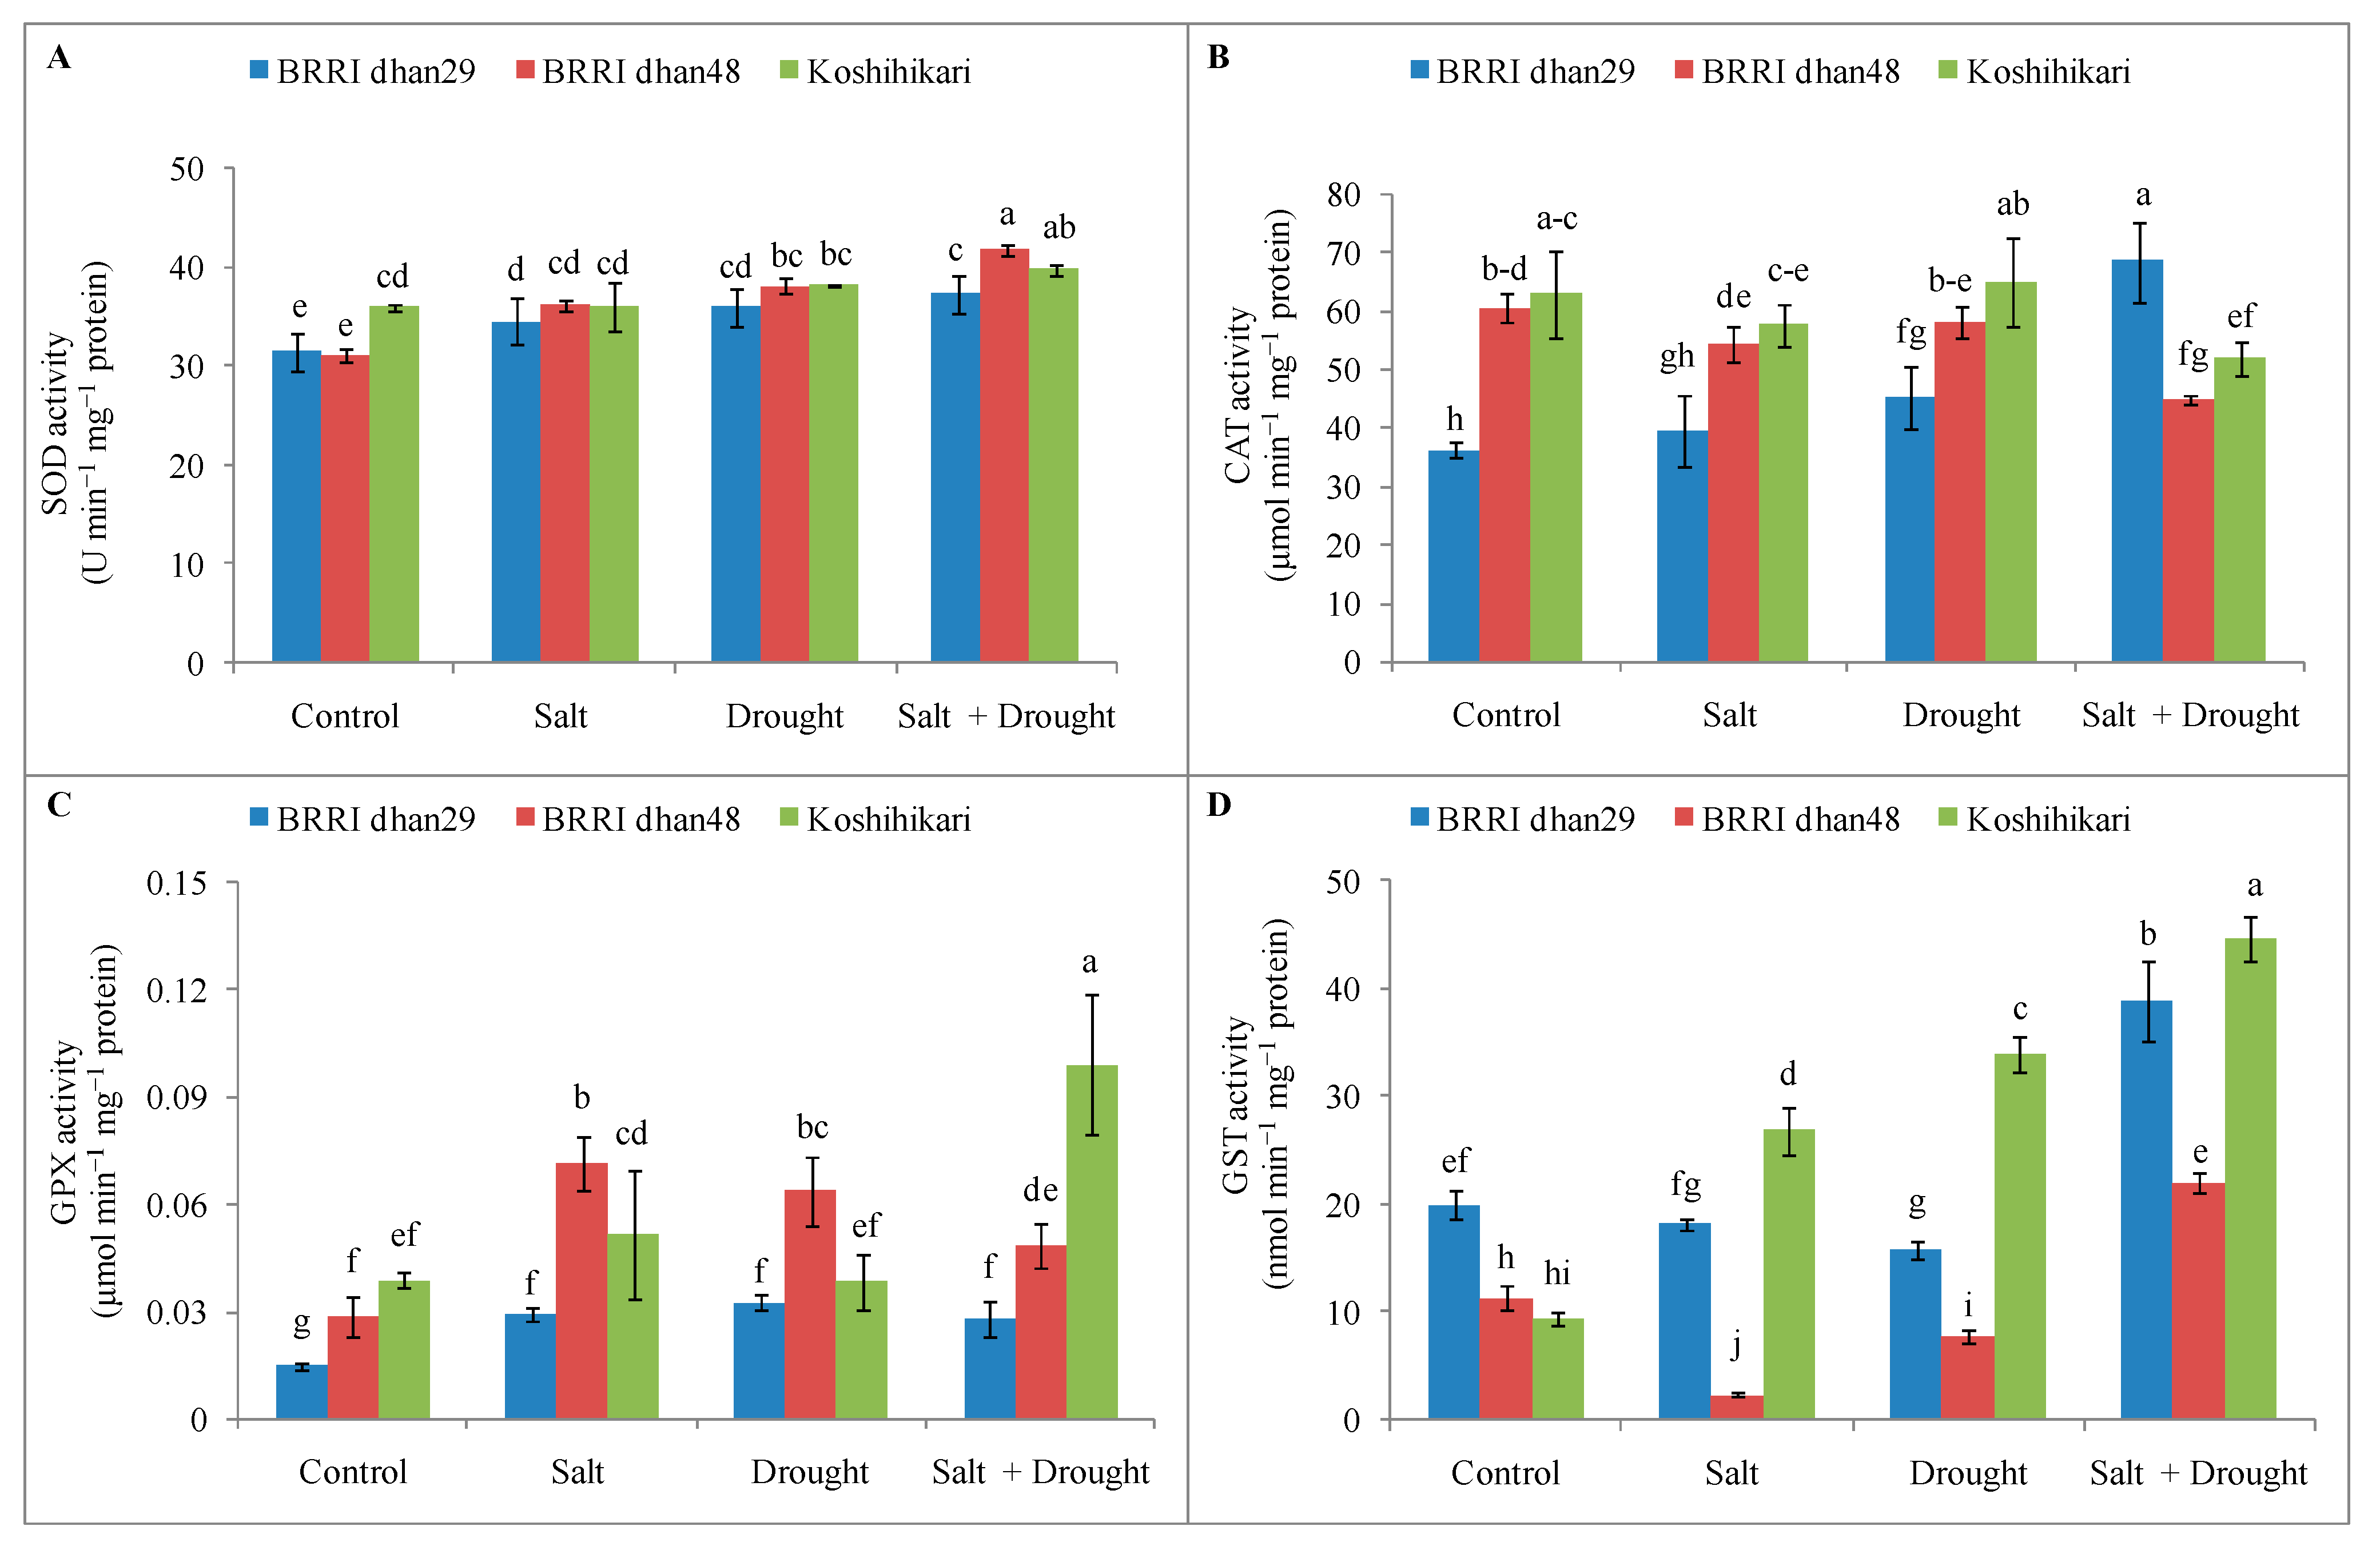
2.8. Enzymatic Antioxidants Activities of Rice Seedlings under Stress Conditions

With exposure to all three stress treatments, the activity of APX in rice seedlings increased compared to their respective control except for Koshihikari in drought. Among all rice genotypes, the highest amount of APX was measured as 83%, 89% and 211% in BRRI dhan29 under all stress treatments, respectively, compared to the control (Figure 9A). The MDHAR activity under combined stress was increased by 127% in BRRI dhan29, 58% in BRRI dhan48 and 137% in Koshihikari compared to the control (Figure 9B). Moreover, in salinity- and drought-treated seedlings, the highest MDHAR activity was observed in the japonica group genotype by 67% and 59%, respectively, compared to the indica group genotypes (Figure 9B). Conversely, the DHAR activity was increased in indica group genotypes under all stress treatments, and for the japonica group genotype, it was in combined stress compared to the control (Figure 9C). The highest increases in DHAR activity were observed in BRRI dhan48 by 68%, 52% and 84%, respectively, under the three stress treatments (Figure 9C). The GR activity of all rice genotypes increased in the three stress treatments compared with their respective control seedlings. It was found that the highest activity of GR was in Koshihikari by 53%, 64% and 114%, respectively, under all stress treatments (Figure 9D).
The activity of SOD was increased in all rice genotypes over three treatments. Among them, higher activity was found in BRRI dhan48 by 16%, 23% and 34%, respectively (compare with control), in all treatments (Figure 10A). On the other hand, a marked increased activity of CAT was observed in all stress treatments seedlings of BRRI dhan29 compared with the control (9%, 25% and 89%, respectively), whereas it was decreased both in BRRI dhan48 and Koshihikari except for in drought (Figure 10B). GPX activity increased in the sole and combined treatment rice genotypes compared with the control seedlings, but the higher activity was recorded by 149% and 122% in salinity- and drought-treated BRRI dhan48 seedlings, respectively, and by 157% in combined treatment Koshihikari seedlings (Figure 10C). For GST, the highest activity was found in the japonica group genotype by 187%, 262% and 376% under the three treatments, respectively. In contrast, GST activity decreased in the salinity- and drought-treated seedlings of indica group genotypes (Figure 10D).

2.9. Glyoxalase System and Methylglyoxal Detoxification of Rice Seedlings under Stress Conditions

In all rice genotypes, the MG content in comparison to the control under the three stress treatments was seen to considerably increase (Figure 11C). The higher content of MG in BRRI dhan29 was recorded by 128% and 238% under salinity and combined stress, respectively, and 38% at drought stress for Koshihikari, whereas compared with the control, in BRRI dhan48, the lowest increased level was found by 20%, 7% and 50% under salinity, drought and combined stress, respectively (Figure 11C). Gly I and Gly II, by contrast, revealed different modes of activity in rice genotype seedlings under all stress treatments. In BRRI dhan48, it was observed that the activity of both Gly I and Gly II increased compared with control under all stress treatments (Figure 11A,B).

3. Discussion

When plants are subjected to salinity and drought stress, increased Na+ and osmotic pressure result in less germination of seeds, accelerate the mortality rate of seedlings and inhibit plant growth and development [8,14,24,25,26,27]. Seeds and seedlings of two rice groups were exposed to three stress treatments that reduced TG remarkably, and the mortality rate of seedlings increased. Compared to genotypes of the two groups, BRRI dhan48 showed a lower mortality rate of seedlings in stress conditions. The salinity, drought and combined stress of the seedlings significantly influenced both the plant growth and development, which is a sign of reduction of the shoot height and root length including FW and DW of all rice genotypes, but among them, BRRI dhan48 performed well. In some cases, the root biomass of rice seedlings might be enhanced in comparison with the well-water controls as a result of short-term water-deficit conditions [28]. Ullah and Datta [29] reported that the increased numbers of the root, fine root diameter and lateral root density in mild drought stress conditions may be the reason for increasing the root DW of rice seedlings. For these reasons, the DW of roots in each rice genotype might be increased during drought stress (Figure 2F). Hence, there is a need for further inquiry into the adaptation mechanism of rice roots under drought conditions including the phenotypic plasticity of roots.
The ion homeostasis of plants is disrupted by salinity and drought stress. The soil’s water shortage reduces mobility for K+; therefore, K+ cannot be absorbed by the root, and thus, plants are starved by intracellular K+ [30]. In addition, the condition of water deprivation enhanced the cellular lipid peroxidation through K+ leakage from cells [25]. In this study, the K+ content in the root and shoot of all rice seedlings genotypes was found to be reduced during drought compared to the corresponding controls (Figure 3C,D). Zain et al. [31] also observed that K+ levels decreased as drought stress increased in rice plants. In contrast, salinity-induced Na+ influx into the root, resulting in K+ efflux through non-selective plasma membrane channels (NSCCs) [32]. Thus, the Na+/K+ ratio and ion homeostasis in plants were disturbed by increased levels of Na+. In this study, compared with control seedlings salinity and combined stress increased the Na+ in shoot and root of all rice genotype seedlings, and for the K+ it was opposite to Na+ (Figure 3A–D). The Na+/K+ ratio, furthermore, was raised due to the higher level of Na+ in both the root and shoot of all rice genotype seedlings under salinity and combined stress, whereas compared to other genotype seedlings, the BRRI dhan48 shoot had a greater K+ content and lower Na+/K+ ratio under salinity and combined stress (Figure 3C,E). Thereby, relative levels of tolerance may be indicated as higher in BRRI dhan48 than BRRI dhan29 and Koshihikari under stress conditions. A similar result was observed by Ahmed et al. [2], Chunthaburee et al. [33], Rahman et al. [34] and Kibria et al. [9] in barley and rice plants under salinity, drought alone or in combined stress. EL reflects also the level of the cell membrane damage produced by K+ efflux in plants. This EL occurs in plants by the activation of K-permeable channels and cell membrane oxidation in stress conditions [35]. In our experiment, a higher level of EL was observed in the combined stress-treated seedlings (root and shoot) of BRRI dhan29, BRRI dhan48 and Koshihikari compared with their respective controls (Figure 6C,D). Among rice genotypes, the increased level of EL both shoot and root were lowest in BRRI dhan48 seedlings in all stress treatments except for root EL in drought stress (Figure 6C,D).
Since stress produces ion toxicity and osmotic stress, however, plants are accumulated some solutes (glycine betaine (GB), Pro and glucose, etc.) to sustain osmotic adaptation, cell membrane integrity and enzyme/proteins stability [34,36]. Proline is a key biochemical solute among all the compatible solutes, which functions as an osmoprotective molecule, improving the RWC and water status of leaves under stressful conditions [14,37]. It was found in this study that the RWC was lower and Pro content was higher in all rice genotype seedlings under all stress conditions (Figure 4A,B). In comparison with control seedlings, BRRI dhan48 from the indica group showed a higher level of Pro content in salinity and combined stress (Figure 4B). Conversely, under drought stress, Pro content did not change considerably like salinity and combined stress in rice genotypes (Figure 4B). Filippou et al. [38] and Swapna and Shylaraj [39] also noticed in their study that in the Medicago truncatula and rice plants, the content of Pro solute was not considerably altered, respectively.
During salinity and drought stress, the photosynthetic pigment contents (chl a, chl b, total chl (a + b) and car) are quickly broken down, instead of its gradual synthesis. Moreover, during salinity stress, plants in the oldest leaf build up a greater level of Na+, causing toxicity and starting chlorosis and senescence [24,40]. In our study, the decreased trends of photosynthetic pigment contents were observed in BRRI dhan29 under all stress treatments (Figure 5A–D). This study also revealed that only the car photosynthetic pigment content was increased in the drought- and combined-affected seedlings of BRRI dhan48 (Figure 5D). These results are supported by Swapna and Shylaraj [39], Islam et al. [41] and Zhang et al. [42], who found a similar trend in the drought-affected rice genotypes, mung bean (Vigna radiata L.) and Cynanchum thesioides spices, respectively.
The accumulation of ROS in plants speeds up lipid peroxidation and impairs cellular homeostasis, which is caused by salinity and drought stress [43]. The lipid peroxidation is an indicator of ROS (1O2, O2•−, H2O2, and OH), which causes cell membrane damage under stress conditions. The MDA content is one of the cytotoxic chemicals that determine the oxidative damage of cell membrane and the ultimate lipid peroxidation product [44]. In this investigation, the MDA content in Koshihikari was raised, and the lower MDA content in BRRI dhan48 was reported in all three stress treatments compared with their control seedlings (Figure 6A). Similar to the salinity- and drought-treated rice seedlings of this study, Mishra et al. [45] and Zu et al. [46] also identified the increased amount of MDA content in rice seedlings. Moreover, the H2O2 content was raised substantially in all rice genotype seedlings in all stress treatments (Figure 6B). Compared with non-stressed seedlings, the higher level of H2O2 content was observed in BRRI dhan29 and Koshihikari in the treatment of combined stress, and the lowest H2O2 content was measured in BRRI dhan48 under all stress treatments (Figure 6B). Nxele et al. [47] and Vighi et al. [48] showed a substantial increase of H2O2 content in sorghum and rice plants, respectively, under salinity and drought stress. Moreover, the brown spots of rice seedlings leaf identified through histochemical staining showed a similar trend in salt and combined stress as H2O2 content (Figure 7). In contrast, a brown spot in the leaf was not visible, similar to the higher content of H2O2 under drought stress, except for in Koshihikari (Figure 7). Hassanuzzaman et al. [10] stated the H2O2 as an ROS product also plays a key signaling role in plant abiotic stress tolerance and it may be, therefore, that the higher H2O2 content could not form a visible brown spot in the rice leaf under drought treatment in this experiment. However, for this result, further investigations are required at the molecular level.
Increased LOX activity is, like MDA, a signal event for oxidative burst in the leaf tissues. We observed that, because of salinity, drought and combined stress the LOX activity increased in all rice genotypes compared with control (Figure 6E). Despite this fact, compared to control, the lowest LOX activity was observed in BRRI dhan48 in all stress conditions compared to BRRI dhan29 and Koshihikari except for salinity stress, as the most moderate LOX activity in BRRI dhan29 was seen in this stress (Figure 6E). Similarly, the relationship between salt and drought stress-induced LOX generation and lipid peroxidation in the cell membrane of rice plants and Brassica species has also been identified by Mostofa et al. [49] and Alam et al. [50].
Among all antioxidant pathways, one of the most significant is the AsA–GSH cycle which consists of two non-enzymatic (AsA and GSH) and four essential enzymatic antioxidants (APX, MDHAR, DHAR and GR) [12]. In this cycle, H2O2 is the long-standing ROS. APX converts the longest living ROS to H2O, coupled with MDHA production, which utilizes AsA as an electron donor [11,51,52]. After that, MDHA is then transformed directly to AsA or disproportionately into AsA and DHA, the GSH-dependent DHAR and nicotinamide adenine dinucleotide phosphate (NADPH)-dependent MDHAR enzymes, respectively [10]. Rahman et al. [53] showed in their earlier research that AsA content and the AsA/DHA ratio are important to maintaining the redox homeostasis of rice seedlings under stressful conditions. Therefore, the AsA, DHA and ratio of AsA/DHA in rice genotypes under salinity, drought and combined stress were studied in this experiment. It was observed that, in drought treatment, the AsA content and AsA/DHA ratio increased in all rice genotype seedlings (Figure 8A,C), and among the tested genotypes, the highest AsA content and AsA/DHA ratio were observed in BRRI dhan48, and these might be resultant from the higher relative tolerance of BRRI dhan48 in stress conditions. This higher AsA in drought stress might happen due to the higher activity of MDHAR and DHAR in drought stress (Figure 9B,C). Higher DHAR also increased AsA by reducing the DHA using a higher level of GSH in drought stress (Figure 8D); therefore, the AsA/DHA ratio in drought stress might increase in all rice genotypes. Conversely, compared with control seedlings, the AsA content decreased in all rice genotypes under salinity and combined stress, and especially was the lowest in combined stress (Figure 8A). Hossain et al. [54] reported that AsA decreased in stress conditions due to the lower synthesis rate of AsA or being utilized by the higher APX as a reductant. In our study under combined stress, it is possible that the higher DHAR was not able to restore the AsA in rice seedlings by reducing the DHA content using a lower level of GSH, alongside the fact that the higher MDHAR activity in this stress generated AsA along with DHA (Figure 8A,B,D and Figure 9B,C), and this AsA might be utilized by the higher APX, as mentioned by Hossain et al. [54], although the DHA content increased. Therefore, the collective role of the APX, MDHAR and DHAR might lead to the lowest AsA and the highest DHA in rice seedlings under combined stress. However, the results of salinity and drought stress are similar to the earlier work carried out by Bhattacharjee and Dey [55], which indicates that, in rice genotypes, the AsA content and AsA/DHA ratio rose in a water-deficit condition and were reduced in salinity stress, as seen by Rahman et al. [53].
Like AsA, GSH is important in the AsA–GSH cycle for H2O2 scavenging. In stress conditions, the GSH is oxidized to GSSG, and then GSSG is also recycled into GSH by using NADPH-dependent GR [10,12]. The fluctuating relation of GSH and the GSH/GSSG ratio is, therefore, a significant phenomenon for redox signals in this ROS scavenging process [56]. The GSH content in our study was found to increase in all rice genotype seedlings under drought stress (Figure 8D). Conversely, compared to the salinity and combined stress, the lowest GSSG content was recorded in all rice genotypes under drought stress, and surprisingly, the higher GSH/GSSG ratio was observed in indica rice genotypes under this stress, except for Koshihikari, which did not alter significantly compared to the control (Figure 8E,F). In this study, higher GR activity in rice seedlings exposed to drought stress, which converted oxidized GSSG into reduced GSH, might lead to the increased GSH/GSSG ratio in rice genotypes (Figure 8D–F and Figure 9D). Sharma et al. [57] reviewed that a little oxidation of GSH occurred in plants during the short-term drought stress, followed by the increased GSH content. In a previous study, Loggini et al. [58] observed the GSH/GSSG ratio was recovered in the wheat cultivars within 3 d of drought stress, and after that it increased with 30 d of drought stress. Thus, it is required to further investigations on GSH pools in these rice genotypes in different growing (greenhouse or field) conditions under prolonged drought stress. However, the GSH/GSSG ratio decreased in all rice genotype seedlings because of higher GSSG content compared to the control under salinity and combined stress conditions, while compared to the other genotypes, BRRI dhan48 showed the higher ratio of GSH/GSSG due to the higher GSH and lower GSSG content in these stresses (Figure 8D–F). In comparison with the control, the higher GSH and GSH/GSSG ratio in stress conditions may reflect the reduction of MDA and H2O2 content more in BRRI dhan48 than other genotypes (Figure 6A,B and Figure 8D,F). As investigated by Hasanuzzaman et al. [59], the higher GSH content and GSH/GSSG ratio, along with the activities of the enzymes, were correlated to the reduction of MDA and H2O2 content in plants.
APX is one of the most important enzymatic antioxidants in the AsA–GSH cycle that detoxifies the ROS in stress conditions and it (APX) has more affinity to H2O2 for scavenging than CAT [10,11]. In this study, APX activity was enhanced under salinity, drought and combined stress in all rice genotype seedlings, except for Koshihikari during drought, when compared to the control (Figure 9A). Like our study, higher APX activity was found in the salt-tolerant (BRRI dhan47) and drought-tolerant (N22) rice seedlings under salinity and drought sole stresses, and an opposite pattern was observed in drought-sensitive (IR64) rice seedlings [34,60]. However, among all rice genotypes, the highest amount of APX was measured in BRRI dhan29 under all stress treatments compared to their controls; despite this, the H2O2 content increased in BRRI dhan29, which might be related to the lower AsA content under stress conditions (Figure 6A, Figure 8A and Figure 9A,B). The regulatory role of MDHAR and DHAR on various crops in stress conditions during oxidative stress tolerance and acclimation was also revealed [16,53,61,62]. Under this investigation, MDHAR behavior was not equally significant for all rice genotype seedlings in the three stress treatments (Figure 9B). Even if no preceding studies have been established regarding the activities of MDHAR under combined salinity and drought stress in rice seedlings so far, in all the rice genotype seedlings we observed greater activity of MDHAR than in their control seedlings under combined stress (Figure 9B). However, the lower AsA level in rice seedlings under combined stress could be related to this higher level of MDHAR activity (Figure 8A). This study also revealed that the DHAR activity level in the indica group rice seedlings increased considerably in three stress treatments, while japonica only experienced combined stress in comparison with the respective controls (Figure 9C). Both the MDHAR and DHAR play a vital role in our experiment on the AsA pools at different stress conditions, which are discussed in the previous paragraph. Rice seedlings exposed to all three stresses increased GR activity significantly compared to the control, which maintained the higher GSH ratio in seedlings under different stress conditions (Figure 8D and Figure 9D). Rahman et al. [34] and Vighi et al. [48] observed such an elevated level of GR activity in rice genotypes under salinity and drought stress, respectively. However, with respect to the higher activity of GR under combined stress, the GSH content did not change markedly in the japonica and indica groups, respectively, compared to the control in this study, which might be due to the higher level of GSSG in rice seedlings (Figure 8D,E and Figure 9D).
In plants, SOD acts as a frontline defense against ROS by removing O2•− into H2O2, and this H2O2 converts into H2O and O2 through the activation of CAT [63,64]. In this experiment, the activity of CAT and SOD was found to vary in stress conditions for all rice genotype seedlings compared with the control (Figure 10A,B). The highest CAT activity was observed in BRRI dhan29. These results are consistent with several earlier findings [3,34,39]. In contrast, BRRI dhan48 and Koshihikari revealed a significant reduction of CAT activity in stress conditions in spite of higher SOD activity. This increased activity of SOD might be related to the overproduction of O2•− and H2O2 content, while CAT activity decreased due to the higher formation of H2O2 in stress conditions, which was also reported by Hasanuzzaman et al. [14] However, the increased level of H2O2 content was found to be lower in BRRI dhan48 under the three stress conditions than in the other genotypes due to the higher production of AsA, GSH, AsA/DHA and the GSH/GSSG ratio in stress conditions (Figure 6B and Figure 8A,C,D,F). Moreover, GPX and GST can also work together to protect the plants from overproduction of H2O2 by using GSH [10]. The upregulated and downregulated GPX and GST activities under abiotic stress conditions in rice plants have been found in some previous research [34,49,60]. The study showed an increasing GPX activity in all seedlings of rice genotypes under the three stress treatments compared to the control except for Koshihikari in the drought stress (Figure 10C). Despite the decreased activity of GST, the higher GPX activity was shown in BRRI dhan48 and then in BRRI dhan29 in salinity and drought stress, respectively, along with the increased activity of GSH, which maintained their lower H2O2 content than in Koshihikari. Whereas, in combined stress, despite the higher GPX and GST activities, the content of H2O2 was significantly enhanced by the highest GSSG, the lowest GSH content and the GSH/GSSG ratio, compared with single stress of salinity and drought amongst all rice genotype seedlings (Figure 8D–F and Figure 10C,D).
Methylglyoxal is a highly reactive cytotoxic chemical; plant cells have a reduced MG content in normal growth circumstances but have a progressive rise in MG synthesis with greater stress severity [14,16], and it is possibly due to the metabolism of acetone and aminoacetone by MG synthase [65]. During stress, however, this cytotoxic chemical may be detoxified by overexpression of the glyoxalase system (consisting of Gly I and Gly II enzymes) along with GSH [66]. The enhanced activity of Gly I or Gly II and the reduction of the endogenous MG levels during salt and drought stress have been revealed by numerous studies [34,37]. In this study, the MG content was found to increase in three stress treatments compared to control in all rice genotype seedlings (Figure 11C). For BRRI dhan48, it was found that both Gly I and Gly II activity increased in all stress conditions compared to the control; thus, the MG content was lowest in BRRI dhan48 compared to the other genotypes (Figure 11A–C).

4. Materials and Methods

4.1. Plant Materials and Treatments

Rice genotypes, namely BRRI dhan29, BRRI dhan48 (indica group) and Koshihikari (japonica group), were collected from Bangladesh Rice Research Institute, Gazipur, Bangladesh, and by Dr. Masahiro Morokuma, Kagawa University, Japan, respectively. For the sterilization, healthy and uniform seeds from the three rice genotypes were immersed in 70% ethanol for 10 min and properly rinsed with distilled water and soaked for 2 d in the dark incubator. The soaked seeds were seeded with 200 mL of distilled water into a 250 mL plastic pot and retained for 2 d in the dark incubator. Each pot was moved to a growth chamber (light: 350 µmol photons m−1 s−2; temperature: 25 ± 2 °C; relative humidity: 65–70%) after the second incubation with 75 morphologically identical germinated rice seedlings, with the dilute nutritional solution (Hyponex, Japan; 2500 times). This commercial nutrient solution had 8% N, 6.43% P, 3.08% Mg, 0.07% B, 0.24% Fe, 0.03% Mn, 0.0014% Mo, 0.008% Zn and 0.003% Cu. Twice a week, the nutrition solution was changed. The 18-day-old rice seedlings (18 d) from three genotypes were treated with separate and combined salt and drought (salt, 150 mM NaCl; drought, 15% PEG 6000; and salt + drought, 150 mM NaCl + 15% PEG 6000) and grown for 72 h, after which we measured the data. The experiment was repeated three times in identical conditions independently to determine different morpho-physiological and biochemical parameters and was arranged in a completely randomized design (CRD).

4.2. Determination of Germination Percentage

Ninety seeds for each genotype were placed in a plastic pot with distilled water, which then was maintained for 48 h by 25 ± 1 °C in a dark incubator. Germination of seeds was regarded if the radical length was of a minimum of 2 mm [67]. With the following formula, the total germination (TG) was calculated:
TG   ( % ) = ( No .   of   germinated   seeds ) / ( total   No .   of   seeds ) ×   100

4.3. Determination of Mortality Rate

Seventy-five seedlings were uniformly sprouted before being treated and were named Ni, and the number of seedlings was counted again after the completion of treatment, and the seedlings were referred to as Np. To determine the mortality rate, the following formula was used:
Mortality   Rate   ( % ) = ( Ni Np ) / Ni   ×   100

4.4. Determination of Plant Growth and Biomass

After the treatment period, the shoot height was measured from the junction point of the stem and root to the leaf tip and from the junction point of the root and stem to the root tip for root length. For these measurements, 10 seedlings were collected randomly then measured the shoot height and root length for each treatment and average them.
From each treatment, 10 seedlings were randomly selected. After we removed the surface water, fresh weight (FW) was measured, and then to determine the dry weight (DW), samples were dried at 80 °C for 48 h, and both are expressed in g.

4.5. Determination of Ionic Components

Shoot and root samples were dried at 80 °C until the weight was constant, according to Rahman et al. [34]. A spectrophotometer of atomic absorption was used to evaluate the Na+ and K+ content from the 0.1 g shoot and root samples, which were individually grounded and digested with HNO3 and HClO4 acid mixture (5:1) at 70 °C for 48 h.

4.6. Determination of Relative Water Content and Proline Content

By following the Barrs and Weatherly [68] method, the relative water content (RWC) of leaves was measured. For each treatment, 10 flag leaves of rice seedlings were randomly collected and measured FW, turgid weight (TW) and DW. The following formula was used to measure RWC:
RWC   ( % ) = ( FW DW ) / ( TW DW ) × 100
Pro content of the leaf was determined following the Bates et al. [69] methods. Leaves (0.25 g) were homogenized with 3% sulfo-salicylic acid (5 mL) and centrifuged at 11,500× g. Then, 1 mL of supernatant was mixed with acid ninhydrin (1 mL) and glacial acetic acid (1 mL) and then incubated for 1 h at 100 °C. After cooling, we isolated the chromophore-containing toluene by adding 2 mL of toluene. By using toluene as a blank, the absorbance was measured at 520 nm.

4.7. Determination of Photosynthetic Pigment Contents

According to Arnon [70], leaves were homogenized with 10 mL acetone (80% v/v) and centrifuged at 10,000× g. The absorbance of the supernatants (after diluting) was measured at 663, 645 and 480 nm for chlorophyll (chl) a and b and carotenoid (car) contents, respectively. Total chlorophyll (chl (a + b)) is the summation value of chl a, and chl b.

4.8. Determination of Lipid Peroxidation

By using thiobarbituric acid (TBA), the malondialdehyde (MDA) content was measured as a product of lipid peroxidation. For this, the Heath and Packer [71] technique was followed with slightly modifications by Hasanuzzaman et al. [72].

4.9. Measurement of Hydrogen PeroxideContent

According to Yang et al. [73], leaves (0.5 g) were homogenized with 3 mL of 5% TCA. The homogenate was centrifuged at 11,500× g. Then, 500 µL of supernatant was mixed with 500 µL of 10 mM K-P buffer (pH 7) and 1 mL of 1 M KI reagent. The absorbance was read at 390 nm, expressed as µmol g−1 FW.

4.10. Histochemical Detection of Hydrogen Peroxide

In situ localization of H2O2 was detected in leaves as described Thordal-Christensen et al. [74] with a slight modification. Leaf samples were incubated at 25 °C in 0.1% 3-diaminobenzidine (DAB). The incubated leaves were boiled in 90% of ethanol to reveal the reddish-brown spots produced by the reaction of H2O2 and DAB.

4.11. Determination of Electrolyte Leakage

Samples of root and shoot were cut into small pieces and then placed into the test tube containing 20 mL of deionized water; these samples were incubated twice at 40 °C for 1 h and 121 °C for 20 min (autoclave) to determine the initial electrolyte conductivity (EC1) and final EC2, respectively, as described by Dionisio-Sese and Tobita [75]. The following formula was used to calculate the electrolyte leakage (EL):
EL   ( % ) = EC 1 EC 2 × 100

4.12. Measurement of Methylglyoxal Content

According to Wild et al. [76], leaves were extracted with 5% HClO4 acid and centrifuged at 11,500× g. The supernatant was decolorized with the addition of charcoal to neutralize by adding a saturated Na2CO3 solution. NaH2PO4 and N-acetyl-L-cysteine were then used in the neutralize supernatant to measure the MG content to a final volume of 1 mL. Following 10 min, the formation of the product N-α-acetyl-S-(1-hydroxy-2-oxoprop-1-yl) cysteine absorbance was recorded at 288 nm. A standard curve of known concentration was used to calculate the MG content, expressed as µmol g−1 FW.

4.13. Measurement of Non-Enzymatic Antioxidant Activity

Leaf samples (0.5 g) were homogenized with 3 mL of 5% meta-phosphoric acid, which contained 1 mM ethylenediaminetetraacetic acid (EDTA) and was centrifuged at 11,500× g. The supernatant was collected to measure AsA and GSH content. With the modification of Huang et al.’s [77] proposed method by Hasanuzzaman et al. [59], the AsA content was determined. Yu et al.’s [78] method followed to determine the GSH content with modification as described by Paradiso et al. [79]. A standard curve with the known concentration of AsA, GSH and GSSG was used to determine the content. The GSH content was calculated by subtracting GSSG from the total GSH.

4.14. Determination of Protein and Enzyme Activity Assays

Leaves (0.5 g) were crushed with ice-cooled mortar and pestle in 1 mL of 50 mM K-P buffer (pH 7.0), which contains 100 mM KCl, 1 mM AsA, 5 mM β-mercaptoethanol and 10% (w/v) glycerol. The supernatants were then centrifuged at 4 °C for 15 min at 11,500× g. The supernatants were used for enzyme assays. The protein concentration of each sample of the leaves was determined using standard Bovin Serum Albumin (BSA) according to the Bradford [80] technique.
Lipoxygenase (LOX; EC: 1.13.11.12) activity was measured by using linoleic acid as a substrate, according to the Dodereret al. [81] method. Where we used an extinction coefficient of 25 mM−1 cm−1 to read the increased absorbance at 234 nm for 1 min.
SOD (EC: 1.15.1.1) activity was determined by using a xanthine–xanthine oxidase system, as proposed by El-Shabrawi et al. [82]. To avoid the H2O2-mediated inactivation of CuZn-SOD, catalase was used. The activity was observed from a change in absorbance at 560 nm.
CAT (EC: 1.11.1.6) activity was assayed following the procedure of Hasanuzzaman et al. [72]. The reduced absorbance was read (by H2O2 decomposition) at 240 nm for 1 min, and activity was calculated by using an extinction coefficient of 39.4 mM−1 cm−1.
APX (EC: 1.11.1.11) activity was determined as described by the Nakano and Asada [83] method. By the addition of H2O2, the reaction was started, and the activity of APX was measured by observing decrease absorbance at 290 nm for 1 min using an extinction coefficient of 2.8 mM−1 cm−1.
In accordance with Hossain et al. [84], the activity of MDHAR (EC: 1.6.5.4) was estimated by monitoring the decrease absorbance at 340 nm for 1 min by using an extinction coefficient of 6.2 mM−1 cm−1.
According to Nakano and Asada [83], by using an extinction coefficient of 14 mM−1 cm−1, the activity of DHAR (EC: 1.8.5.1) was assayed from the change in absorbance at 265 nm for 1 min.
GR (EC: 1.6.4.2) activity was measured following the method of Hasanuzzaman et al. [72]. The activity of GR was initiated with GSSG, the decrease in absorbance was observed at 340 nm for 1 min and the activity was computed by using an extinction coefficient of 6.2 mM−1 cm−1.
GPX (EC: 1.11.1.9) activity was determined by using an extinction coefficient of 6.62 mM−1 cm−1 at 340 nm for 1 min, as described by Elia et al. [85].
GST (EC: 2.5.1.18) activity was assayed as stated in the Hossain et al. [86] method. 1-chloro-2,4-dinitrobenzene (CDNB) was used to begin the reaction. The increase in absorbance was measured at 340 nm using an extinction coefficient of 9.6 mM−1 cm−1 for 1 min.
Gly I (EC: 4.4.1.5) and Gly II (EC: 3.1.2.6) activities were measured by following the Hasanuzzaman and Fujita [13] procedure. The increase in absorbance of Gly I and Gly II was recorded with an extinction coefficient of 3.37 and 13.6 mM−1 cm−1 at 240 and 412 nm for 1 min, respectively.

4.15. Statistical Analysis

The data obtained for different parameters were subjected to analysis of variance (ANOVA) and mean separation was compared by Fisher’s Least Significant Difference (LSD) using XLSTAT 2018 software [87]. Differences at p ≤ 0.05 were considered significant.

5. Conclusions

Three rice genotypes from the indica (BRRI dhan29 and BRRI dhan48) and japonica (Koshihikari) groups were studied for comparative physiological and biochemical responses under salinity, drought and the combination of salinity and drought stress. BRRI dhan48 was identified among all rice genotypes to have a positive correlation of better root and shoot performance under all stress treatments. Moreover, the higher K+, lower Na+/K+ ratio and lower electrolyte leakage in the genotype of BRRI dhan48 revealed lower damage of the cell membrane compared with the BRRI dhan29 and Koshihikari genotypes. In comparison to the BRRI dhan29 and Koshihikari, the level of relative water content, accumulation of osmolyte (Pro), non-enzymatic and enzymatic antioxidant activity and glyoxalase protection system against oxidative stress in BRRI dhan48 indicated towards a degree of tolerance in stress conditions, even in the combined stress of salinity and drought. According to this comparative study of the three rice genotypes in salinity, drought and the interaction of these stresses, it is clear that BRRI dhan48 can be recommended as a stress-tolerant genotype. Many research publications have reported on the physiological and biochemical responses of rice genotypes under the single stress of salinity or drought, but only a few have studied the combined stress of salinity and drought with different rice genotypes. Therefore, studies on the genetic level of these rice genotypes under the combined stress of salinity and drought with different doses, durations and growing mediums are possible areas of study for further research.

Author Contributions

Conceptualization, M.F.K., M.F. and M.H.; methodology, M.F., K.N. and M.H.; software, M.H.; validation, M.H.M.B.B. and J.A.M.; formal analysis, M.H.; investigation, M.S.H., M.H.M.B.B., K.N., A.A.C.M. and J.A.M.; resources, M.F.; data curation, M.S.H.; writing—original draft preparation, M.S.H., M.H.M.B.B. and M.H.; writing—review and editing, M.H.; visualization, M.S.H. and M.H.; supervision, M.F.K., M.F. and M.H. All authors have read and agreed to the published version of the manuscript.

Funding

This research received no external funding.

Institutional Review Board Statement

Not applicable.

Informed Consent Statement

Not applicable.

Data Availability Statement

All data are available in this manuscript.

Acknowledgments

The author M.S.H. acknowledges Md. Shahadat Hossain, Mahmodul Hasan Sohag and Moumita for their help during the whole research period. M.S.H. and A.A.C.M. acknowledge the Ministry of Science and Technology (MoST), Bangladesh and the Japan Student Services Organization (JASSO) to providing fellowship during the study period. The authors Bangladesh Rice Research Institute (BRRI) and Masahiro Morokuma, Kagawa University, Japan, for providing high-quality seed.

Conflicts of Interest

The authors declare no conflict of interest.

References

  1. Munns, R. Comparative physiology of salt and water stress. Plant Cell Environ. 2002, 25, 239–250. [Google Scholar] [CrossRef]
  2. Ahmed, I.M.; Cao, F.; Zhang, M.; Chen, X.; Zhang, G.; Wu, F. Difference in yield and physiological features in response to drought and salinity combined stress during anthesis in Tibetan wild and cultivated barleys. PLoS ONE 2013, 8, e77869. [Google Scholar] [CrossRef]
  3. Ma, L.J.; Wang, L.L.; Mei, Y.X.; Zhang, S.W.; Wei, W.; Wang, J.Y.; Zhang, Y.L. Cross adaptation tolerance in rice seedlings exposed to PEG induced salinity and drought stress. Int. J. Agric. Biol. 2016, 18, 535–541. [Google Scholar] [CrossRef]
  4. Levy, D.; Coleman, W.K.; Veilleux, R.E. Adaptation of potato to water shortage: Irrigation management and enhancement of tolerance to drought and salinity. Am. J. Potato Res. 2013, 90, 186–206. [Google Scholar] [CrossRef]
  5. Yousfi, S.; Serret, M.D.; Márquez, A.J.; Voltas, J.; Araus, J.L. Combined use of δ13C, δ18O and δ15N tracks nitrogen metabolism and genotypic adaptation of durum wheat to salinity and water deficit. New Phytol. 2012, 194, 230–244. [Google Scholar] [CrossRef]
  6. Wu, D.; Cai, S.; Chen, M.; Ye, L.; Chen, Z.; Zhang, H.; Dai, F.; Wu, F.B.; Zhang, G.P. Tissue metabolic responses to salt stress in wild and cultivated barley. PLoS ONE 2013, 8, e55431. [Google Scholar] [CrossRef]
  7. Grewal, H. Response of wheat to subsoil salinity and temporary water stress at different stages of the reproductive phase. Plant Soil 2010, 330, 103–113. [Google Scholar] [CrossRef]
  8. Ueda, A.; Yahagi, H.; Fujikawa, Y.; Nagaoka, T.; Esaka, M.; Calcaño, M.; González, M.M.; Martich, J.D.H.; Saneoka, H. Comparative physiological analysis of salinity tolerance in rice. Soil Sci. Plant Nutri. 2013, 59, 896–903. [Google Scholar] [CrossRef]
  9. Kibria, M.G.; Hossain, M.; Murata, Y.; Hoque, M.A. Antioxidant defense mechanisms of salinity tolerance in rice genotypes. Rice Sci. 2017, 24, 155–162. [Google Scholar] [CrossRef]
  10. Hasanuzzaman, M.; Bhuyan, M.H.M.B.; Zulfiqar, F.; Raza, A.; Mohsin, S.M.; Mahmud, J.A.; Fujita, M.; Fotopoulos, V. Reactive oxygen species and antioxidant defense in plants under abiotic stress: Revisiting the crucial role of a universal defense regulator. Antioxidants 2020, 9, 681. [Google Scholar] [CrossRef]
  11. Rajput, V.D.; Singh, R.K.H.; Verma, K.K.; Sharma, L.; Quiroz-Figueroa, F.R.; Meena, M.; Gour, V.S.; Minkina, T.; Sushkova, S.; Mandzhieva, S. Recent developments in enzymatic antioxidant defence mechanism in plants with special reference to abiotic stress. Biology 2021, 10, 267. [Google Scholar] [CrossRef]
  12. Mellidou, I.; Koukounaras, A.; Kostas, S.; Patelou, E.; Kanellis, A.K. Regulation of vitamin C accumulation for improved tomato fruit quality and alleviation of abiotic stress. Genes 2021, 12, 694. [Google Scholar] [CrossRef]
  13. Hasanuzzaman, M.; Fujita, M. Selenium pretreatment upregulates the antioxidant defense and methylglyoxal detoxification system and confers enhanced tolerance to drought stress in rapeseed seedlings. Biol. Trace Elem. Res. 2011, 143, 1758–1776. [Google Scholar] [CrossRef]
  14. Hasanuzzaman, M.; Alam, M.M.; Rahman, A.; Hasanuzzaman, M.; Nahar, K.; Fujita, M. Exogenous proline and glycine betaine mediated upregulation of antioxidant defense and glyoxalase systems provides better protection against salt-induced oxidative stress in two rice (Oryza sativa L.) varieties. Biomed. Res. Int. 2014, 2014, 757219. [Google Scholar]
  15. Yadav, S.K.; Singla-Pareek, S.L.; Ray, M.; Reddy, M.K.; Sopory, S.K. Methylglyoxal levels in plants under salinity stress are dependent on glyoxalase I and glutathione. Biochem. Biophys. Res. Commun. 2005, 337, 61–67. [Google Scholar] [CrossRef]
  16. Hasanuzzaman, M.; Nahar, K.; Hossain, M.S.; Mahmud, J.A.; Rahman, A.; Inafuku, M.; Oku, H.; Fujita, M. Coordinated actions of glyoxalase and antioxidant defense systems in conferring abiotic stress tolerance in plants. Int. J. Mol. Sci. 2017, 18, 200. [Google Scholar] [CrossRef] [Green Version]
  17. Khush, G.S. Origin, dispersal, cultivation and variation of rice. Plant Mol. Biol. 1997, 35, 25–34. [Google Scholar]
  18. FAO (Food and Agriculture Organization of the United Nations). 2015. Available online: www.fao.org/docrep/003/x6905e/x6905e04.htm (accessed on 4 December 2017).
  19. FAOStat (Food and Agricultural Organization of the United Nations). 2017. Available online: http://www.fao.org/economic/est/publications/rice-publications/rice-market-monitor-rmm (accessed on 20 October 2017).
  20. O’Toole, T.C. Rice and Water: The Final Frontier. In Proceedings of the 1st International Conference on Rice for Future, Bangko, Thailand, 31 August–3 September 2004. [Google Scholar]
  21. Kavitha, P.G.; Miller, A.J.; Mathew, M.K.; Maathuis, F.J.M. Rice cultivars with differing salt tolerance contain similar cation channels in their root cells. J. Exp. Bot. 2012, 63, 3289–3296. [Google Scholar]
  22. Borah, P.; Sharma, E.; Kaur, A.; Chandel, G.; Mohapatra, T.; Kapoor, S.; Khurana, J. Analysis of drought-responsive signalling network in two contrasting rice cultivars using transcriptome-based approach. Sci. Rep. 2017, 7, 42131. [Google Scholar] [CrossRef]
  23. Frouin, J.; Languillaume, A.; Mas, J.; Mieulet, D.; Boisnard, A.; Labeyrie, A.; Bettembourg, M.; Burea, C.; Lorenzini, E.; Portefaix, M.; et al. Tolerance to mild salinity stress in japonica rice: A genome-wide association mapping study highlights calcium signaling and metabolism genes. PLoS ONE 2018, 13, e0190964. [Google Scholar] [CrossRef] [Green Version]
  24. Yang, J.Y.; Zheng, W.; Tian, Y.; Wu, Y.; Zhou, D.W. Effects of various mixed salt-alkaline stresses on growth, photosynthesis, and photosynthetic pigment concentrations of Medicago ruthenica seedlings. Photosynthetica 2011, 49, 275–284. [Google Scholar]
  25. Wei, J.; Li, C.; Li, Y.; Jiang, G.; Cheng, G. Effects of external potassium (K) supply on drought tolerances of two contrasting winter wheat cultivars. PLoS ONE 2013, 8, e69737. [Google Scholar] [CrossRef] [PubMed]
  26. Panuccio, M.R.; Jacobsen, S.E.; Akhtar, S.S.; Muscolo, A. Effect of saline water on seed germination and early seedling growth of the halophyte quinoa. AoB Plants 2014, 6, plu047. [Google Scholar] [CrossRef] [PubMed]
  27. Al Hassan, M.; Chaura, J.; Donat-Torres, M.P.; Boscaiu, M.; Vicente, O. Antioxidant responses under salinity and drought in three closely related wild monocots with different ecological optima. AoB Plants 2017, 9, plx009. [Google Scholar]
  28. Li, X.; Guo, Z.; Lv, Y.; Cen, X.; Ding, X.; Wu, H.; Li, X.; Huang, J.; Xiong, L. Genetic control of the root system in rice under normal and drought stress conditions by genome-wide association study. PLoS Genet. 2017, 13, e1006889. [Google Scholar] [CrossRef] [Green Version]
  29. Ullah, H.; Datta, A. Root system response of selected lowland Thai rice varieties as affected by cultivation method and potassium rate under alternate wetting and drying irrigation. Arch. Agron. Soil. Sci. 2018, 64, 2045–2059. [Google Scholar] [CrossRef]
  30. Hu, Y.; Schmidhalter, U. Drought and salinity: A comparison of their effects on mineral nutrition of plants: An review. J. Plant Nutr. Soil Sci. 2005, 168, 541–549. [Google Scholar]
  31. Zain, N.A.M.; Ismail, M.R.; Puteh, A.; Mahmood, M.; Islam, M.R. Drought tolerance and ion accumulation of rice following application of additional potassium fertilizer. Commun. Soil Sci. Plant Anal. 2014, 45, 2502–2514. [Google Scholar] [CrossRef]
  32. Shabala, S.; Cuin, T.A.; Pottosin, I. Polyamines prevent NaCl-induced K+ efflux from pea mesophyll by blocking non-selective cation channels. FEBS Lett. 2007, 581, 1993–1999. [Google Scholar]
  33. Chunthaburee, S.; Dongsansuk, A.; Sanitchon, J.; Pattanagul, W.; Theerakulpisut, P. Physiological and biochemical parameters for evaluation and clustering of rice cultivars differing in salt tolerance at seedling stage. Saudi J. Biol. Sci. 2016, 23, 467–477. [Google Scholar] [CrossRef] [Green Version]
  34. Rahman, A.; Nahar, K.; Hasanuzzaman, M.; Fujita, M. Calcium supplementation improves Na+/K+ ratio, antioxidant defense and glyoxalase systems in salt-stressed rice seedlings. Front. Plant Sci. 2016, 7, 609. [Google Scholar] [CrossRef] [PubMed] [Green Version]
  35. Demidchik, V.; Straltsova, D.; Medvedev, S.S.; Pozhvanov, G.A.; Sokolik, A.; Yurin, V. Stress-induced electrolyte leakage: The role of K+-permeable channels and involvement in programmed cell death and metabolic adjustment. J. Exp. Bot. 2014, 65, 1259–1270. [Google Scholar] [CrossRef] [PubMed]
  36. Ashraf, M.; Foolad, M.R. Roles of glycine betaine and proline in improving plant abiotic stress resistance. Environ. Exp. Bot. 2007, 59, 206–216. [Google Scholar] [CrossRef]
  37. Nahar, K.; Hasanuzzaman, M.; Rahman, A.; Alam, M.M.; Mahmud, J.A.; Suzuki, T.; Fujita, M. Polyamines confer salt tolerance in mung bean (Vigna radiata L.) by reducing sodium uptake, improving nutrient homeostasis, antioxidant defense and methylglyoxal detoxification systems. Front. Plant Sci. 2016, 7, 1104. [Google Scholar] [CrossRef] [PubMed]
  38. Filippou, P.; Antoniou, C.; Fotopoulos, V. Effect of drought and rewatering on the cellular status and antioxidant response of Medicago truncatula plants. Plant Signal. Behav. 2011, 6, 2270–2277. [Google Scholar] [CrossRef] [Green Version]
  39. Swapna, S.; Shylaraj, K.S. Screening for osmotic stress responses in rice varieties under drought condition. Rice Sci. 2017, 24, 253–263. [Google Scholar] [CrossRef]
  40. Li, T.; Zhang, Y.; Liu, H.; Wu, Y.; Li, W.; Zhang, H. Stable expression of Arabidopsis vacuolar Na+/H+ antiporter gene AtNHX1 and salt tolerance in transgenic soybean for over six generations. Chin. Sci. Bull. 2010, 55, 1127–1134. [Google Scholar] [CrossRef]
  41. Islam, M.S.; Hasan, M.K.; Islam, B.; Renu, N.K.; Hakim, M.A.; Islam, M.R.; Chowdhury, M.K.; Ueda, A.; Saneoka, H.; Raza, M.A.; et al. Responses of water and pigments status, dry matter partitioning, seed production, and traits of yield and quality to foliar application of GA3 in Mungbean (Vigna radiata L.). Front. Agron. 2020, 2, 596850. [Google Scholar] [CrossRef]
  42. Zhang, X.; Yang, Z.; Li, Z.; Zhang, F.; Hao, L. Effects of drought stress on physiology and antioxidative activity in two varieties of Cynanchum thesioides. Braz. J. Bot. 2020, 43, 1–10. [Google Scholar] [CrossRef]
  43. Miller, G.; Suzuki, N.; Ciftci-Yilmaz, S.; Mittler, R. Reactive oxygen species homeostasis and signalling during drought and salinity stresses. Plant Cell Environ. 2010, 33, 453–467. [Google Scholar] [CrossRef]
  44. Gill, S.S.; Tuteja, N. Reactive oxygen species and antioxidant machinery in abiotic stress tolerance in crop plants. Plant Physiol. Biochem. 2010, 48, 909–930. [Google Scholar] [CrossRef] [PubMed]
  45. Mishra, P.; Bhoomika, K.; Dubey, R.S. Differential responses of antioxidative defense system to prolonged salinity stress in salt-tolerant and salt-sensitive indica rice (Oryza sativa L.) seedlings. Protoplasma 2013, 250, 3–19. [Google Scholar] [CrossRef] [PubMed]
  46. Zu, X.; Lu, Y.; Wang, Q.; Chu, P.; Miao, W.; Wang, H.; La, H. A new method for evaluating the drought tolerance of upland rice cultivars. Crop J. 2017, 5, 488–498. [Google Scholar] [CrossRef]
  47. Nxele, X.; Klein, A.; Ndimba, B.K. Drought and salinity stress alters ROS accumulation, water retention, and osmolyte content in sorghum plants. S. Afr. J. Bot. 2017, 108, 261–266. [Google Scholar] [CrossRef]
  48. Vighi, I.L.; Benitez, L.C.; Amaral, M.N.; Moraes, G.P.; Auler, P.A.; Rodrigues, G.S.; Deuner, S.; Maia, L.C.; Braga, E.J.B. Functional characterization of the antioxidant enzymes in rice plants exposed to salinity stress. Biol. Plant. 2017, 61, 540–550. [Google Scholar] [CrossRef]
  49. Mostofa, M.G.; Hossain, M.A.; Fujita, M. Trehalose pretreatment induces salt tolerance in rice seedlings: Oxidative damage and co-induction of antioxidant defense and glyoxalase systems. Protoplsasma 2015, 252, 461–475. [Google Scholar] [CrossRef]
  50. Alam, M.M.; Nahar, K.; Hasanuzzaman, M.; Fujita, M. Trehalose-induced drought stress tolerance: A comparative study among different Brassica species. Plant Omics 2014, 7, 271–283. [Google Scholar]
  51. Xu, W.F.; Shi, W.M.; Ueda, A.; Takabe, T. Mechanisms of salt tolerance in transgenic Arabidopsis thaliana carrying a peroxisomal ascorbate peroxidase gene from barley. Pedosphere 2008, 18, 486–495. [Google Scholar] [CrossRef]
  52. Apostolova, P.; Szalai, G.; Kocsy, G.; Janda, T.; Popova, L.P. Environmental factors affecting components of ascorbate-glutathione pathway in crop plants. In Oxidative Stress in Plants: Causes, Consequences and Tolerance; Anjum, N.A., Umar, S., Ahmad, A., Eds.; I.K. International: New Delhi, India, 2011; pp. 52–70. [Google Scholar]
  53. Rahman, A.; Hossain, M.S.; Mahmud, J.A.; Nahar, K.; Hasanuzzaman, M.; Fujita, M. Manganese-induced salt stress tolerance in rice seedlings: Regulation of ion homeostasis, antioxidant defense and glyoxalase systems. Physiol. Mol. Biol. Plants 2016, 22, 291–306. [Google Scholar] [CrossRef]
  54. Hossain, M.A.; Mostofa, M.G.; Burritt, D.J.; Fujita, M. Modulation of reactive oxygen species and methylglyoxal detoxification systems by exogenous glycine betaine and proline improves drought tolerance in mustard (Brassica juncea L.). Int. J. Plant Biol. Res. 2014, 2, 1014. [Google Scholar]
  55. Bhattacharjee, S.; Dey, N. Redox metabolic and molecular parameters for screening drought tolerant indigenous aromatic rice cultivars. Physiol. Mol. Biol. Plants 2018, 24, 7–23. [Google Scholar] [CrossRef] [PubMed]
  56. Li, J.M.; Jin, H. Regulation of brassinosteroid signaling. Trends Plant Sci. 2007, 12, 37–41. [Google Scholar] [CrossRef] [PubMed]
  57. Sharma, P.; Jha, A.B.; Dubey, R.S.; Pessarakli, M. Reactive oxygen species, oxidative damage, and antioxidative defense mechanism in plants under stressful conditions. J. Bot. 2012, 2012, 26. [Google Scholar] [CrossRef] [Green Version]
  58. Loggini, B.; Scartazza, A.; Brugnoli, E.; Navari-Izzo, F. Antioxidative defense system, pigment composition, and photosynthetic efficiency in two wheat cultivars subjected to drought. Plant Physiol. 1999, 119, 1091–1099. [Google Scholar] [CrossRef] [PubMed] [Green Version]
  59. Hasanuzzaman, M.; Hossain, M.A.; Fujita, M. Nitric oxide modulates antioxidant defense and the methylglyoxal detoxification system and reduces salinity-induced damage of wheat seedlings. Plant Biotechnol. Rep. 2011, 5, 353–365. [Google Scholar] [CrossRef]
  60. Mishra, S.S.; Panda, D. Leaf traits and antioxidant defense for drought tolerance during early growth stage in some popular traditional rice landraces from Koraput, India. Rice Sci. 2017, 24, 207–217. [Google Scholar] [CrossRef]
  61. Hossain, M.A.; Hasanuzzaman, M.; Fujita, M. Coordinate induction of antioxidant defense and glyoxalase system by exogenous proline and glycine betaine is correlated with salt tolerance in mung bean. Front. Agric. China 2011, 5, 1–14. [Google Scholar] [CrossRef]
  62. Sun, C.; Liu, L.; Yu, Y.; Liu, W.; Lu, L.; Jin, C.; Lin, X. Nitric oxide alleviates aluminum-induced oxidative damage through regulating the ascorbate-glutathione cycle in roots of wheat. J. Integr. Plant. Biol. 2015, 57, 550–561. [Google Scholar] [CrossRef]
  63. Gill, S.S.; Anjum, N.A.; Gill, R.; Yadav, S.; Hasanuzzaman, M.; Fujita, M.; Mishra, P.; Sabat, S.C.; Tuteja, N. Superoxide dismutase-mentor of abiotic stress tolerance in crop plants. Environ. Sci. Pollut. Res. 2015, 22, 10375–10394. [Google Scholar] [CrossRef]
  64. Sanchez-Casas, P.; Klesseg, D.F. A salicyclic acid-binding activity and a salicyclic acid-inhibitable catalase activity are present in a variety of plant species. Plant Physiol. 1994, 106, 1675–1679. [Google Scholar] [CrossRef] [Green Version]
  65. Kaur, C.; Singla-Pareek, S.L.; Sopory, S.K. Glyoxalase and methylglyoxal as biomarkers for plant stress tolerance. Crit. Rev. Plant Sci. 2014, 33, 429–456. [Google Scholar] [CrossRef]
  66. Yadav, S.K.; Singla-Pareek, S.L.; Sopory, S.K. An overview on the role of methylglyoxal and glyoxalases in plants. Drug Metabol. Drug Interact. 2008, 23, 51–68. [Google Scholar] [CrossRef] [PubMed]
  67. Gholami, M.; Mokhtarian, F.; Baninasab, B. Seed halopriming improves the germination performance of black seed (Nigella sativa) under salinity stress conditions. J. Crop Sci. Biotechnol. 2015, 18, 21–26. [Google Scholar] [CrossRef]
  68. Barrs, H.D.; Weatherley, P.E. A re-examination of the relative turgidity technique for estimating water deficits in leaves. Aust. J. Biol. Sci. 1962, 15, 413–428. [Google Scholar] [CrossRef] [Green Version]
  69. Bates, L.S.; Waldren, R.P.; Teare, I.D. Rapid determination of free proline for water-stress studies. Plant Soil 1973, 39, 205–207. [Google Scholar] [CrossRef]
  70. Arnon, D.I. Copper enzymes in isolated chloroplasts. Polyphenoloxidase in Beta vulgaris. Plant Physiol. 1949, 24, 1–15. [Google Scholar] [CrossRef] [Green Version]
  71. Heath, R.L.; Packer, L. Photoperoxidation in isolated chloroplasts: I. Kinetics and stoichiometry of fatty acid peroxidation. Arch. Biochem. Biophys. 1968, 125, 189–198. [Google Scholar] [CrossRef]
  72. Hasanuzzaman, M.; Nahar, K.; Alam, M.M.; Fujita, M. Exogenous nitric oxide alleviates high temperature induced oxidative stress in wheat (Triticum aestivum L.) seedlings by modulating the antioxidant defense and glyoxalase system. Aust. J. Crop Sci. 2012, 6, 1314–1323. [Google Scholar]
  73. Yang, S.; Wang, L.; Li, S. Ultraviolet-B irradiation-induced freezing tolerance in relation to antioxidant system in winter wheat (Triticum aestivum L.) leaves. Environ. Exp. Bot. 2007, 60, 300–307. [Google Scholar] [CrossRef]
  74. Thordal-Christensen, H.; Zhang, Z.; Wei, Y.; Collinge, D.B. Subcellular localization of H2O2 in plants, H2O2 accumulation in papillae and hypersensitive response during barley powdery mildew interaction. Plant J. 1997, 11, 1187–1194. [Google Scholar] [CrossRef]
  75. Dionisio-Sese, M.L.; Tobita, S. Antioxidant responses of rice seedlings to salinity stress. Plant Sci. 1998, 135, 1–9. [Google Scholar] [CrossRef]
  76. Wild, R.; Ooi, L.; Srikanth, V.; Münch, G. A quick, convenient and economical method for the reliable determination of methylglyoxal in millimolar concentrations: The N-acetyl-L-cysteine assay. Anal. Bioanal. Chem. 2012, 403, 2577–2581. [Google Scholar] [CrossRef] [PubMed]
  77. Huang, C.; He, W.; Guo, J.; Chang, X.; Su, P.; Zhang, L. Increased sensitivity to salt stress in an ascorbate-deficient Arabidopsis mutant. J. Exp. Bot. 2005, 56, 3041–3049. [Google Scholar] [CrossRef] [PubMed] [Green Version]
  78. Yu, C.W.; Murphy, T.M.; Lin, C.H. Hydrogen peroxide induced chilling tolerance in mung beans mediated through ABA independent glutathione accumulation. Funct. Plant Biol. 2003, 30, 955–963. [Google Scholar] [CrossRef] [PubMed]
  79. Paradiso, A.; Berardino, R.; de Pinto, M.; di Toppi, L.; Storelli, S.; de Gara, F.T. Increase in ascorbate-glutathione metabolism as local and precocious systemic responses induced by cadmium in durum wheat plants. Plant Cell Physiol. 2008, 49, 362–374. [Google Scholar] [CrossRef]
  80. Bradford, M.M. A rapid and sensitive method for the quantitation of microgram quantities of protein utilizing the principle of protein-dye binding. Anal. Biochem. 1976, 72, 248–254. [Google Scholar] [CrossRef]
  81. Doderer, A.; Kokkelink, I.; van der Veen, S.; Valk, B.E.; Schram, A.W.; Douma, A.C. Purification and characterization of two lipoxygenase isoenzymes from germinating barley. Biochim. Biophys. Acta. 1992, 1120, 97–104. [Google Scholar] [CrossRef]
  82. El-Shabrawi, H.; Kumar, B.; Kaul, T.; Reddy, M.K.; Singla-Pareek, S.L.; Sopory, S.K. Redox homeostasis, antioxidant defense, and methylglyoxal detoxification as markers for salt tolerance in Pokkali rice. Protoplasma 2010, 245, 85–96. [Google Scholar] [CrossRef]
  83. Nakano, Y.; Asada, K. Hydrogen peroxide is scavenged by ascorbatespecific peroxidase in spinach chloroplasts. Plant Cell Physiol. 1981, 22, 867–880. [Google Scholar]
  84. Hossain, M.A.; Nakano, Y.; Asada, K. Monodehydroascorbate reductase in spinach chloroplasts and its participation in the regeneration of ascorbate for scavenging hydrogen peroxide. Plant Cell Physiol. 1984, 25, 385–395. [Google Scholar]
  85. Elia, A.C.; Galarini, R.; Taticchi, M.I.; Dorr, A.J.M.; Mantilacci, L. Antioxidant responses and bioaccumulation in Ictalurus melas under mercury exposure. Ecotoxicol. Environ. Saf. 2003, 55, 162–167. [Google Scholar] [CrossRef]
  86. Hossain, M.Z.; Hossain, M.D.; Fujita, M. Induction of pumpkin glutathione S-transferases by different stresses and its possible mechanisms. Biol. Plant. 2006, 50, 210–218. [Google Scholar] [CrossRef]
  87. Addinsoft. XLSTAT v. 2015: Data Analysis and Statistics Software for Microsoft Excel; Addinsoft: Paris, France, 2018; Available online: https://www.xlstat.com/en/ (accessed on 10 January 2022).
Figure 1. (A) Total germination and (B) mortality rate of rice seeds and seedlings affected by sole and combined salinity and drought stress at the early vegetative stage. Mean (±SD) was calculated from three replications for each treatment. Values in a column with different letters are significantly different at p ≤ 0.05 applying the Fisher’s LSD test (control, no stress; salt, 150 mM NaCl; drought, 15% PEG 6000; and salt + drought, 150 mM NaCl + 15% PEG 6000).
Stresses 02 00012 g001
Figure 2. (A) Shoot height, (B) root length, (C) shoot FW, (D) shoot DW, (E) root FW and (F) root DW of rice seedlings affected by sole and combined salinity and drought stress at the early vegetative stage. Mean (±SD) was calculated from three replications for each treatment. Values in a column with different letters are significantly different at p ≤ 0.05 applying the Fisher’s LSD test (control, no stress; salt, 150 mM NaCl; drought, 15% PEG 6000; and salt + drought, 150 mM NaCl + 15% PEG 6000).
Stresses 02 00012 g002
Figure 3. (A) Shoot Na content, (B) root Na content, (C) shoot K content, (D) root K content, (E) shoot Na/K ratio and (F) root Na/K ratio of rice seedlings affected by sole and combined salinity and drought stress at the early vegetative stage. Mean (±SD) was calculated from three replications for each treatment. Values in a column with different letters are significantly different at p ≤ 0.05 applying the Fisher’s LSD test (control, no stress; salt, 150 mM NaCl; drought, 15% PEG 6000; and salt + drought, 150 mM NaCl + 15% PEG 6000).
Stresses 02 00012 g003
Figure 4. (A) Relative water content of leaf, (B) proline content of rice leaves affected by sole and combined salinity and drought stress at the early vegetative stage. Mean (±SD) was calculated from three replications for each treatment. Values in a column with different letters are significantly different at p ≤ 0.05 applying the Fisher’s LSD test (control, no stress; salt, 150 mM NaCl; drought, 15% PEG 6000; and salt + drought, 150 mM NaCl + 15% PEG 6000).
Stresses 02 00012 g004
Figure 5. Photosynthetic pigment (A) chl a, (B) chl b, (C) chl (a + b) and (D) carotenoids (car) contents of rice leaves affected by sole and combined salinity and drought stress at the early vegetative stage. Mean (±SD) was calculated from three replications for each treatment. Values in a column with different letters are significantly different at p ≤ 0.05 applying the Fisher’s LSD test (control, no stress; salt, 150 mM NaCl; drought, 15% PEG 6000; and salt + drought, 150 mM NaCl + 15% PEG 6000).
Stresses 02 00012 g005
Figure 6. Oxidative stress markers (A) MDA content, (B) H2O2 content, (C) shoot EL, (D) root EL and (E) LOX activity of rice leaves affected by sole and combined salinity and drought stress at the early vegetative stage. Mean (±SD) was calculated from three replications for each treatment. Values in a column with different letters are significantly different at p ≤ 0.05 applying the Fisher’s LSD test (control, no stress; salt, 150 mM NaCl; drought, 15% PEG 6000; and salt + drought, 150 mM NaCl + 15% PEG 6000).
Stresses 02 00012 g006
Figure 7. Histochemical confirmation of overgenerated H2O2 in rice leaves affected by sole and combined salinity and drought stress at the early vegetative stage ((A) BRRI dhan29, (B) BRRI dhan48 and (C) Koshihikari) (control, no stress; salt, 150 mM NaCl; drought, 15% PEG 6000; and salt + drought, 150 mM NaCl + 15% PEG 6000).
Stresses 02 00012 g007
Figure 8. (A) AsA content, (B) DHA content, (C) AsA/DHA ratio, (D) GSH content, (E) GSSG content and (F) GSH/GSSG ratio of rice leaves affected by sole and combined salinity and drought stress at the early vegetative stage. Mean (±SD) was calculated from three replications for each treatment. Values in a column with different letters are significantly different at p ≤ 0.05 applying the Fisher’s LSD test (control, no stress; salt, 150 mM NaCl; drought, 15% PEG 6000; and salt + drought, 150 mM NaCl + 15% PEG 6000).
Stresses 02 00012 g008
Figure 9. (A) APX, (B) MDHAR, (C) DHAR, and (D) GR activity of rice leaves affected by sole and combined salinity and drought stress at the early vegetative stage. Mean (±SD) was calculated from three replications for each treatment. Values in a column with different letters are significantly different at p ≤ 0.05 applying the Fisher’s LSD test (control, no stress; salt, 150 mM NaCl; drought, 15% PEG 6000; and salt + drought, 150 mM NaCl + 15% PEG 6000).
Stresses 02 00012 g009
Figure 10. (A) SOD, (B) CAT, (C) GPX and (D) GST activity of rice leaves affected by sole and combined salinity and drought stress at the early vegetative stage. Mean (±SD) was calculated from three replications for each treatment. Values in a column with different letters are significantly different at p ≤ 0.05 applying the Fisher’s LSD test (control, no stress; salt, 150 mM NaCl; drought, 15% PEG 6000; and salt + drought, 150 mM NaCl + 15% PEG 6000).
Stresses 02 00012 g010
Figure 11. (A) Gly I and (B) Gly II activity and (C) MG content of rice leaves affected by sole and combined salinity and drought stress at the early vegetative stage. Mean (±SD) was calculated from three replications for each treatment. Values in a column with different letters are significantly different at p ≤ 0.05 applying the Fisher’s LSD test (control, no stress; salt, 150 mM NaCl; drought, 15% PEG 6000; and salt + drought, 150 mM NaCl + 15% PEG 6000).
Stresses 02 00012 g011
Publisher’s Note: MDPI stays neutral with regard to jurisdictional claims in published maps and institutional affiliations.

