Abstract
The success of superhero movies creates the superhero characters as the brand itself, which generates interest for other brands to collaborate by licensing businesses. However, the licensing business faces the challenge of convincing potential partners to use this character to grow the local brand. On another side, local brands keep looking for the advantage to leverage their business. This research aims to analyze the link the consumption value of the superhero characters to the memorable experience of superhero characters used on products and analyze how the conjunction of this experience with the host brand attitude could shape the brand alliance attitude in consumer perspectives. Furthermore, how this brand alliance could drive the willingness to pay more (WTPM) and the positive electronic word of mouth (eWOM) is assessed. This research was conducted using the Partial Least Square-Structural Equation Modelling (PLS-SEM). The findings show that the brand alliance shaped from superhero characters with local brands as host brands has a significant impact on consumer willingness to pay more (WTPM) and eWOM. This study provides managerial implications for both business licensor management and local brand owners, and suggestions for future studies as well.
1. Introduction
Nowadays, superhero movies have become part of global consumer consumption and profitable businesses have emerged from American popular culture [1]. The newer generation recognizes superhero characters such as Batman, Superman, Wonder Woman, Ironman, Captain America, etc., from movies and popular media instead of comics [2]. Superhero characters appear in the products used by consumers, which is associated with emotional bonding [3,4]. Moreover, superhero characters are associated as a symbol which is not only a trend but it also enhances the social status of users [5]. In that sense, brand owners look for the possibility of their brand enhancement strategy using superhero characters from the formal licensor. The licensing business model is an opportunity for local brand owners to develop their brand awareness and create differentiation.
Licensing is a form of brand alliance that involves a contractual agreement between two brands [6], whereas licensing refers to the process of creating and managing a contract between two parties, namely the owner of the brand or intellectual asset (the licensor) that grants the right to another company (the licensee) to produce and sell products using the brand and its assets [7]. The report from Licensing Industry Merchandisers’ Association (LIMA) stated that since 2014–2019, the licensing business has continued to grow rapidly. In 2019, revenue from the sales of licensed goods and services reached USD 292.8 billion globally [8]. In that report, they pointed out three categories as the biggest contributors, namely the entertainment/character, corporate brands, and fashion. This growth is contributed to by the Southeast Asia region by 6.3% of growth, with the character as the main category. The most popular character is superheroes, which have been raised in the entertainment industry. Therefore, the setting of this study in Indonesia, as an emerging country in the region, is relevant. In addition, the biggest merchandise licensor worldwide in 2020 is Walt Disney Company who creates Marvel, while Warner Media creates the justice league on the fourth rank [9].
Several previous studies have concluded that compatibility has a very important role in determining the success of brand alliances [10,11,12,13]. Furthermore, the fitness between two brands has been found to influence consumer attitudes towards the brand alliance [14,15,16]. The right brand alliances have a positive impact on brand performance [17]. With brand alliances, companies can increase their profitability if they partner with brands that have similarities or are close in terms of quality [11]. Previous research on brand alliances has greatly improved the understanding of how consumers respond to brand alliances and identified several variables that influence customer brand evaluations [18,19,20], specifically on superhero characters [21]. However, those studies focused more on brand fit and did not explore the kind of predictor, such as memorable experience.
Studies that have shown the important role of perceived value in influencing memorable experiences are mainly found in the service industry [22,23]. Nonetheless, the memorable experience of brand alliance rarely has taken the interest of researchers. Customer experience itself has been understood as associated with hedonic consumption as theorized by Holbrook and Hirschman [24]. In addition, Pine and Gilmore [25] explained the memorable part of the experience that remains in the consumer’s mind as a result of the perception of entertainment, aesthetics, education, and escapism. Accordingly, the concept of a memorable experience is not limited only to the service industry. The brand experience itself was conceptualized by Brakus et al. [26] and constitutes an affective dimension; therefore, a memorable experience can be related to brand alliance formation. Moreover, studies have proven that brand alliance attitudes can predict future behavioral intentions, such as consumer willingness to pay more (WTPM) [27] and consumer willingness to share positive electronic news by word of mouth (eWOM) [28].
It is pivotal to understand how customers perceive and memorize superhero characters to the formation of brand alliances; however, studies on this issue are somehow still limited. This study addresses the issue by proposing a new conceptual framework to investigate the link between how memorable experiences from a superhero character could lead to brand alliance attitudes in conjunction with the host brand attitude from local brands and how this brand alliance could lead to positive WTPM as well as eWOM.
So far, this is the first study to link brand antecedents of memorable experiences, namely symbolic value, emotional value, familiarity, self-congruity, entertainment, their influence on brand alliance attitudes, and their impact on WTPM and positive eWOM. Therefore, this study raised three research questions: (1) How do superhero characters link to the brand alliance formation and benefit the local brand? (2) To what extent does the memorable experience of superhero characters shape the success of the brand alliance with the local brand? (3) What are the important elements to form a memorable experience of a superhero character usage in a brand?
To answer the research questions above, conceptual frameworks were developed from previous studies on brand alliance by Hegner and Peixoto [21]; familiarity by Acharya, Fang and Brady, and Paasovaara et al. [29,30,31]; self-congruity by Aw et al., Fang and Brady; and M. Kim and Thapa [30,32,33]; entertainment by Chen and Lin, as well as Elmashhara and Soares [34,35]; consumer perceived value by Beaty, Becko, Huang et al., Hwang and Lee, and Van Tongeren et al. [3,4,22,36,37]; memorable experience by Dolbec and Chebat, and Hwang et al. [38,39]; host brand attitude by Cao and Yan, and Ma et al. [17,40]; WTPM by Popovic et al., Rodrigue and Biswas, and Yodpram and Intalar [27,41,42]; and positive eWOM by S. Chu and Chen, and Ismagilova et al. [43,44]. This framework will be tested empirically based on the population in Indonesia for several reasons.
First, Indonesia is the fourth most populous country in the world with a population of 271 million people as of December 2020 [45]. Indonesia is a member of the G-20, is among the top 10 countries with the highest buying power in the world, and has recently achieved the status of an upper-middle-income country [46] Second, Indonesia was listed as the fourth largest country in Southeast Asia in terms of the sales of licensed goods and services [8]. Third, a report mentioned Indonesia as a country where superhero characters (Avengers) are in the third rank for the high-interest purchased items [47].
2. Literature Review
Drawing from the Theory of Reasoned Action (TRA) that explains the concept of the relationship between attitude and behavior [48], the conceptual framework of this study was developed. The intention, as a result of consumer evaluations according to that theory, could predict future behavior. Intentions in marketing can be related to consumer intentions to evaluate a brand [49]. The more the consumers evaluate the performance of the brand positively, the more consumers want to show the behavior of the brand [50]. Consumer patronization for the brand can be shown through the desire to use a product and choose a product among other product choices, as well as through other intentions that benefit the brand [51], which is through the process. Ultimately, consumers are willing to pay more for the product of their choice and then wish to express their support to people around them. This study focuses on the intention of WTPM and positive eWOM. Brand alliance is a strategy of combining two brands to increase the value of the consumer evaluations of one brand or both partner brands [20]. The attitude of brand alliances can be predicted by using the theory of Consumer-based Brand Equity (CBBE), coined by Keller [50]. This study derived the concept of measuring brand strength from consumer attitudes and emotional reactions toward the brand. The consumer relationship with the brand reflects a high level of customer preference and a memorable feeling as well as harmony with the brand [50]. The process and psychological bonds with brands will generate the experience when customers have specific and positive thoughts and feelings about the brand.
Customer Experience Marketing (CEM), coined by Schmitt [52], successfully developed a concept that manages the entire customer experience. This concept introduces five different types of experience, namely the sensory experience (senses); affective experience (feelings); creative cognitive experience (thoughts); physical experience, behavior, and lifestyle (actions); and social identity experience (relating). This study uses affective experiences in the context of superhero characters that contain affective components [4]. Experience can be formed from the perceived value of consumers [53]. The experiential concept first emerged when Holbrook and Hirschman [24] raised the perspective of experience which includes the symbolic, hedonic, and aesthetic aspects as part of the consumption process. Dimensions of perceived value according to Holbrook and Cofman [54] could be seen in two aspects, namely hedonic and utilitarian aspects. Sheth et al. [55] stated that the consumer perceived value is seen as a multidimensional consumption value received by consumers and this value can be in the form of functional, social, emotional, epistemic, and conditional values. Furthermore, Sweeney and Soutar [56] argued that the consumption value consists of four dimensions: quality, price, emotional, and social values. In accordance with the superhero characters derived from the entertainment industry, this study uses emotional value and symbolic value in the research framework. The emotional value is used to represent how consumers perceive values about superhero characters based on their emotions and experiences with brand alliance attitudes while symbolic value is used to represent how consumers perceive values about superhero characters based on their assessment of self-concept and experience of brand alliance attitudes.
3. Hypothesis Development
3.1. Emotional Value and Symbolic Value
Emotional reactions that occur due to the stimulus that a consumer receives are not just like or dislike but they also include hate, happiness, and fear, and are considered with unlimited complexity [24]. In addition, emotional value is also defined as the perceived utility that is perceived or received by a person from alternative capacities to evoke feelings of affection [55]. Sweeney and Soutar [56] explained that emotional value is the perceived value derived from the customer’s emotions and is generated by the product or service. In this study, emotional value is the customer’s feelings or emotions when using a superhero-licensed product that can affect a memorable experience. Symbolic value reflects the overall assessment of the product as a symbol and is used to fulfill customer desires and expectations; in other words, symbolic value is the intention to project status and feelings of belonging through the consumption of goods and services [57]. According to Holbrook and Hirschman [24], people buy products not only for their utility value but also because of what they mean; consumers buy goods not only considering the function of the product but they also pay attention to the meaning of the product. For consumers, goods are symbols, wherein possessing and using them is an attempt to reflect, express, and reorganize the system of social relations and the place they feel they are in [58]. Holbrook and Moore [59] underlined that symbolic consumption will refer to hedonic consumption and its relationship to hedonic experience [59]. People tend to judge others by what they wear as part of their self-image and expression [58]. This study attempts to investigate the role of symbolic value for consumers when using superhero-licensed products that can affect consumer memorable experiences.
In marketing terms, familiarity is known as brand familiarity, which is defined as the amount of time consumers spend processing information about the preferred brand [60]. Brand familiarity is a dynamic state and is related to the frequency of contact [60]. The more often consumers search for information, the more it will increase consumer relations as well as make consumers unite with objects and gain experience [61,62]. Therefore, the more individuals have information about an object, the stronger the relationship that leads to a sense of belonging will be and the object becomes part of the individual [63,64]. Several new studies have shown indications of familiarity influencing consumer emotions [29,30,65,66] and symbolic value [31]. Familiarity in this study refers to the familiarity of superhero characters, which comes from the number of experiences consumers have with superhero characters [61] and the information about superhero characters that consumers already know or are in the process of searching for. Recent research has found that the familiarity of superhero characters can affect consumers’ values [4]. Thus, the following hypotheses could be proposed.
Hypothesis 1 (H1).
Familiarity has a positive influence on emotional value.
Hypothesis 2 (H2).
Familiarity has a positive influence on symbolic value.
Self-congruity is consumer consumption behavior that is influenced by the suitability between the consumer’s self-concept and brand personality [67]. Consuming brands that have similarities with the consumer’s self, either actually or ideally, will make consumers achieve self-congruity [68]. Intrinsic motivation and the need for self-congruity will lead consumers to buy and use products/brands to understand themselves and to create the image they want to show off [69]. Self-concept is the consumer’s self-perception of their image or personality [67]. This concept relates to the desire to be a part of himself as an external self-concept accentuating how other people perceive him. This may also relate to the ideal social self-concept regarding how individuals want to be seen and judged by others [67]. There is significant empirical evidence that self-congruity is directly related to consumer perceived value [30,33,70] and emotional value [32]. In addition, Sweeney and Soutar [56] described social value as the benefits derived from the product’s ability to enhance social self-concept. A study by Van Tongeren et al. [37] proved that superhero characters affect pro-sociality and the meaning of life. Beaty [3] identified how the association between superhero characters and consumer self-congruity can affect consumer perceived value when using superhero-licensed products. For example, a girl asserts herself as a brave young woman and then she buys the product with a female superhero character who has an image of courage and beauty; on the other side, she will feel that people accept her as a hype-person who follows the popular trend. In reference to that consideration, the following hypotheses could be proposed.
Hypothesis 3 (H3).
Self-congruity has a positive influence on emotional value.
Hypothesis 4 (H4).
Self-congruity has a positive influence on symbolic value.
Entertainment can be described as an enjoyable feeling, interesting, pleasing, cheerful, amusing, and other positive emotional aspects [71,72]. Entertainment is known as the environmental stimulation of a product or service on the aspect of consumption and hedonic experience [24]. Entertainment has an important role in building brand images and enhancing experiences, therefore entertainment is an important aspect of marketing [73]. It has been long-proven that entertainment increases consumers’ positive feelings, as demonstrated by previous studies conducted by Hyun et al., and Wolf [74,75] stated the pleasant moments for shoppers that make them excited and happy [76]. Entertainment can induce feelings of pleasure and enjoyment of oneself, in addition to providing a sense of social acceptance in the community, which strengthens one’s sense of identity while enhancing one’s self-concept [73,75]. This study focuses on superhero characters from the entertainment world in the film industry, which are become a phenomenon because of their entertainment value [2]. Previous research has found that entertainment is associated with positive emotions such as joy, pleasure, and enjoyment [71,72,77,78]. There is significant empirical evidence that entertainment can affect consumer perceived value [34,79] and consumer emotion [35]. Therefore, the following hypotheses are proposed.
Hypothesis 5 (H5).
Entertainment has a positive influence on emotional value.
Hypothesis 6 (H6).
Entertainment has a positive influence on symbolic value.
3.2. Memorable Experience
Pine and Gilmore [25] stated that memorable experiences can occur when a good and quality experience is successfully delivered to customers. The importance of experience for consumers makes consumers more selective in choosing brands that are unique, attractive, and easy to remember [80]. Brand experience is the subjective perception and response of consumers based on sensations, feelings, and cognitions of a brand, as well as on responses to brand stimuli [26]. Brand experience is shaped by functional and emotional elements, therefore various stimuli or interactions can drive customer experience [81]. Previous research has proven the role of perceived value in influencing brand experience in various industries [82,83,84]. Moreover, the memorable experience scale was developed by J.-H. Kim [23] in the context of tourism. A memorable experience, built from the perceived value of consumers in various industries, is mainly determined by the attributes of those products and services, for example, such as memorable experiences in golf tournaments [36], in food festivals [22], and due to robot baristas in coffee shops [39]. This study attempts to investigate the consumer perceived value, derived as emotional and symbolic values of superhero characters, that could affect memorable experiences in the context of brand alliance. Therefore, the following hypotheses are proposed.
Hypothesis 7 (H7).
Emotional value has a positive influence on a memorable experience.
Hypothesis 8 (H8).
Symbolic value has a positive influence on a memorable experience.
3.3. Brand Alliance Attitude
Brand attitude is a form of a comprehensive evaluation by consumers of a brand [85]. Brand alliance generally can be seen as the cooperation between two brands that are in agreement to merge their brands and develop new products, services, or marketing programs [20,86]. Specifically, Simonin and Ruth [87] defined brand alliance as the cooperation between two or more brands, products, or other assets within a certain period that is mutually agreed upon. The form of brand alliance can be classified into three types, namely co-brand, brand license, and joint promotion. Brand licenses are contractual agreements in which one company allows another company to use its brand, name, logo, or other assets on another product in exchange for a license fee [88]. In this study, a brand alliance is classified as brand licenses that are used in marketing strategy when local brands use superhero character licenses to be marketed.
In the concept of the brand alliance, consumers’ experience of a brand will affect their perception and assessment of the brand (spillover effect), and create new perceptions of the two related brands either directly or indirectly [89,90]. Previous research has been conducted and proved that brand experience can have an impact on brand attitude and loyalty [38,80,91,92]. In other studies, authors proved that memorable brand experiences have a positive influence on brand attitudes [38,39]. In this study, memorable experiences are memories created from consumer experiences when using superhero-licensed products that can affect attitudes and judgments towards licensed local brands and products with superhero characters. To that extend, the below hypotheses are proposed.
Hypothesis 9 (H9).
A memorable experience has a positive influence on brand alliance attitude.
There have been many studies that discuss the benefits of brand alliance collaboration, such as partnering with well-known brands that can help host brands increase brand assessment and increase perceived quality [19]; therefore, partnering with brands that are more familiar to people and more preferred will provide a positive influence on attitudes towards the host brand, thereby increasing brand image [13,93]. A host brand is defined as a brand that has the ability to create products. In a brand alliance, the host brand is the partner that will create a co-brand product and launch it into the market [94]. The quality of the co-brand product can influence consumer perceptions of the value and image of the host brand [20,90]. Brand alliance attitude refers to how consumers’ attitudes toward the two brands after the alliance [13,90,93,95,96] have positive attitudes, as they tend to like and buy co-brand products [15,97,98]. The benefits of brand alliances are the ability to build the perception of the quality, image, and cognition of brand associations in consumers, thereby increasing competitive advantage in the market and among other competitors [86]. The factor that needs to be considered in order to form a successful brand alliance is a product fit, namely the suitability and complementarity between product categories [99], and brand fit refers to abstract attributes such as brand image, brand personality, and brand value to assess the level of similarity and compatibility for both brands [13,90,100,101]. Moreover, C. W. Park et al. [86] also stated that brands and products that have high similarity and consistency between the two partners will have a positive influence on consumer attitudes that can encourages purchase intentions. Previous research proved that high brand fit for both brands in the alliance will affect consumers’ positive perceptions and attitudes in evaluating brand alliances [17,95,102]. Therefore, the host brand attitude plays an important role in the formation of the brand alliance. In that sense, the following hypothesis is proposed.
Hypothesis 10 (H10).
Host brand attitude has a positive influence on brand alliance attitude.
Furthermore, Aaker [103] stated that the more positive attitudes and values consumers have towards a brand, the more they are willing to pay a premium price. WTP is the willingness of consumers to spend money to pay for products or services at the maximum nominal [104,105]. Willingness to pay more (WTPM) focuses on the word “more” which means an additional price above the fair price that consumers are willing to pay [106]; this is often associated with the premium price that consumers are willing to pay to get a product or service [107,108]. WTPM can be a better indicator of the success of brand alliance attitudes [42] than of the actual purchase intention or purchase behavior. Previous studies have proven that consumers perform WTPM according to the specific and unique value they perceive [109,110,111]. For companies, WTPM is seen as a contributor to profit and increases the market share [112,113]. Positive brand attitude is known to have an impact on consumers’ willingness to pay more and this is shown from the results of the latest research by Yodpram and Intalar [27]. Popovic et al. [41] also revealed that consumers’ positive attitudes towards a brand can have an impact on consumers’ willingness to pay higher prices. In this study, WTPM is the willingness of consumers to pay extra or premium prices for licensed products with superhero characters, thus the following hypothesis is proposed.
Hypothesis 11 (H11).
Brand alliance attitude has a positive influence on the willingness to pay more.
The presence of electronic word of mouth (eWOM) is a revolution from digital developments that replaces traditional word of mouth (WOM) [114]. The eWOM communication process is carried out online and it can be viewed as a form of consumer communication to convey statements (positive or negative) related to brands, products, or services on the internet [115]. Ismagilova et al. [44] defined eWOM as a dynamic and continuous communication process in providing information, opinions, or experiences via the internet by various types of consumers, namely potential, existing, or former consumers to discuss products, services, brands, or companies. In addition, internet forums are an influential source for the customer to get information about a product or service [116,117]. With online communication, consumers can utilize and use various platforms such as websites, blogs, social media, etc. [118]. Previous research has proven that the best platform for eWOM is social media [119,120,121,122]. Several studies have shown that positive brand attitudes encourage consumers’ willingness to do eWOM [28]. Positive eWOM is the willingness of consumers to share their positive experiences with the use of brands, products, or services through posting comments and sharing videos or images, and through their recommendations on social media or company websites [123]. Previous studies have shown that the willingness to spread eWOM is affected by the consumer’s evaluation of brand performance [124,125], thus the following hypothesis is proposed.
Hypothesis 12 (H12).
Brand alliance attitude has a positive influence on positive electronic Word of Mouth (eWOM).
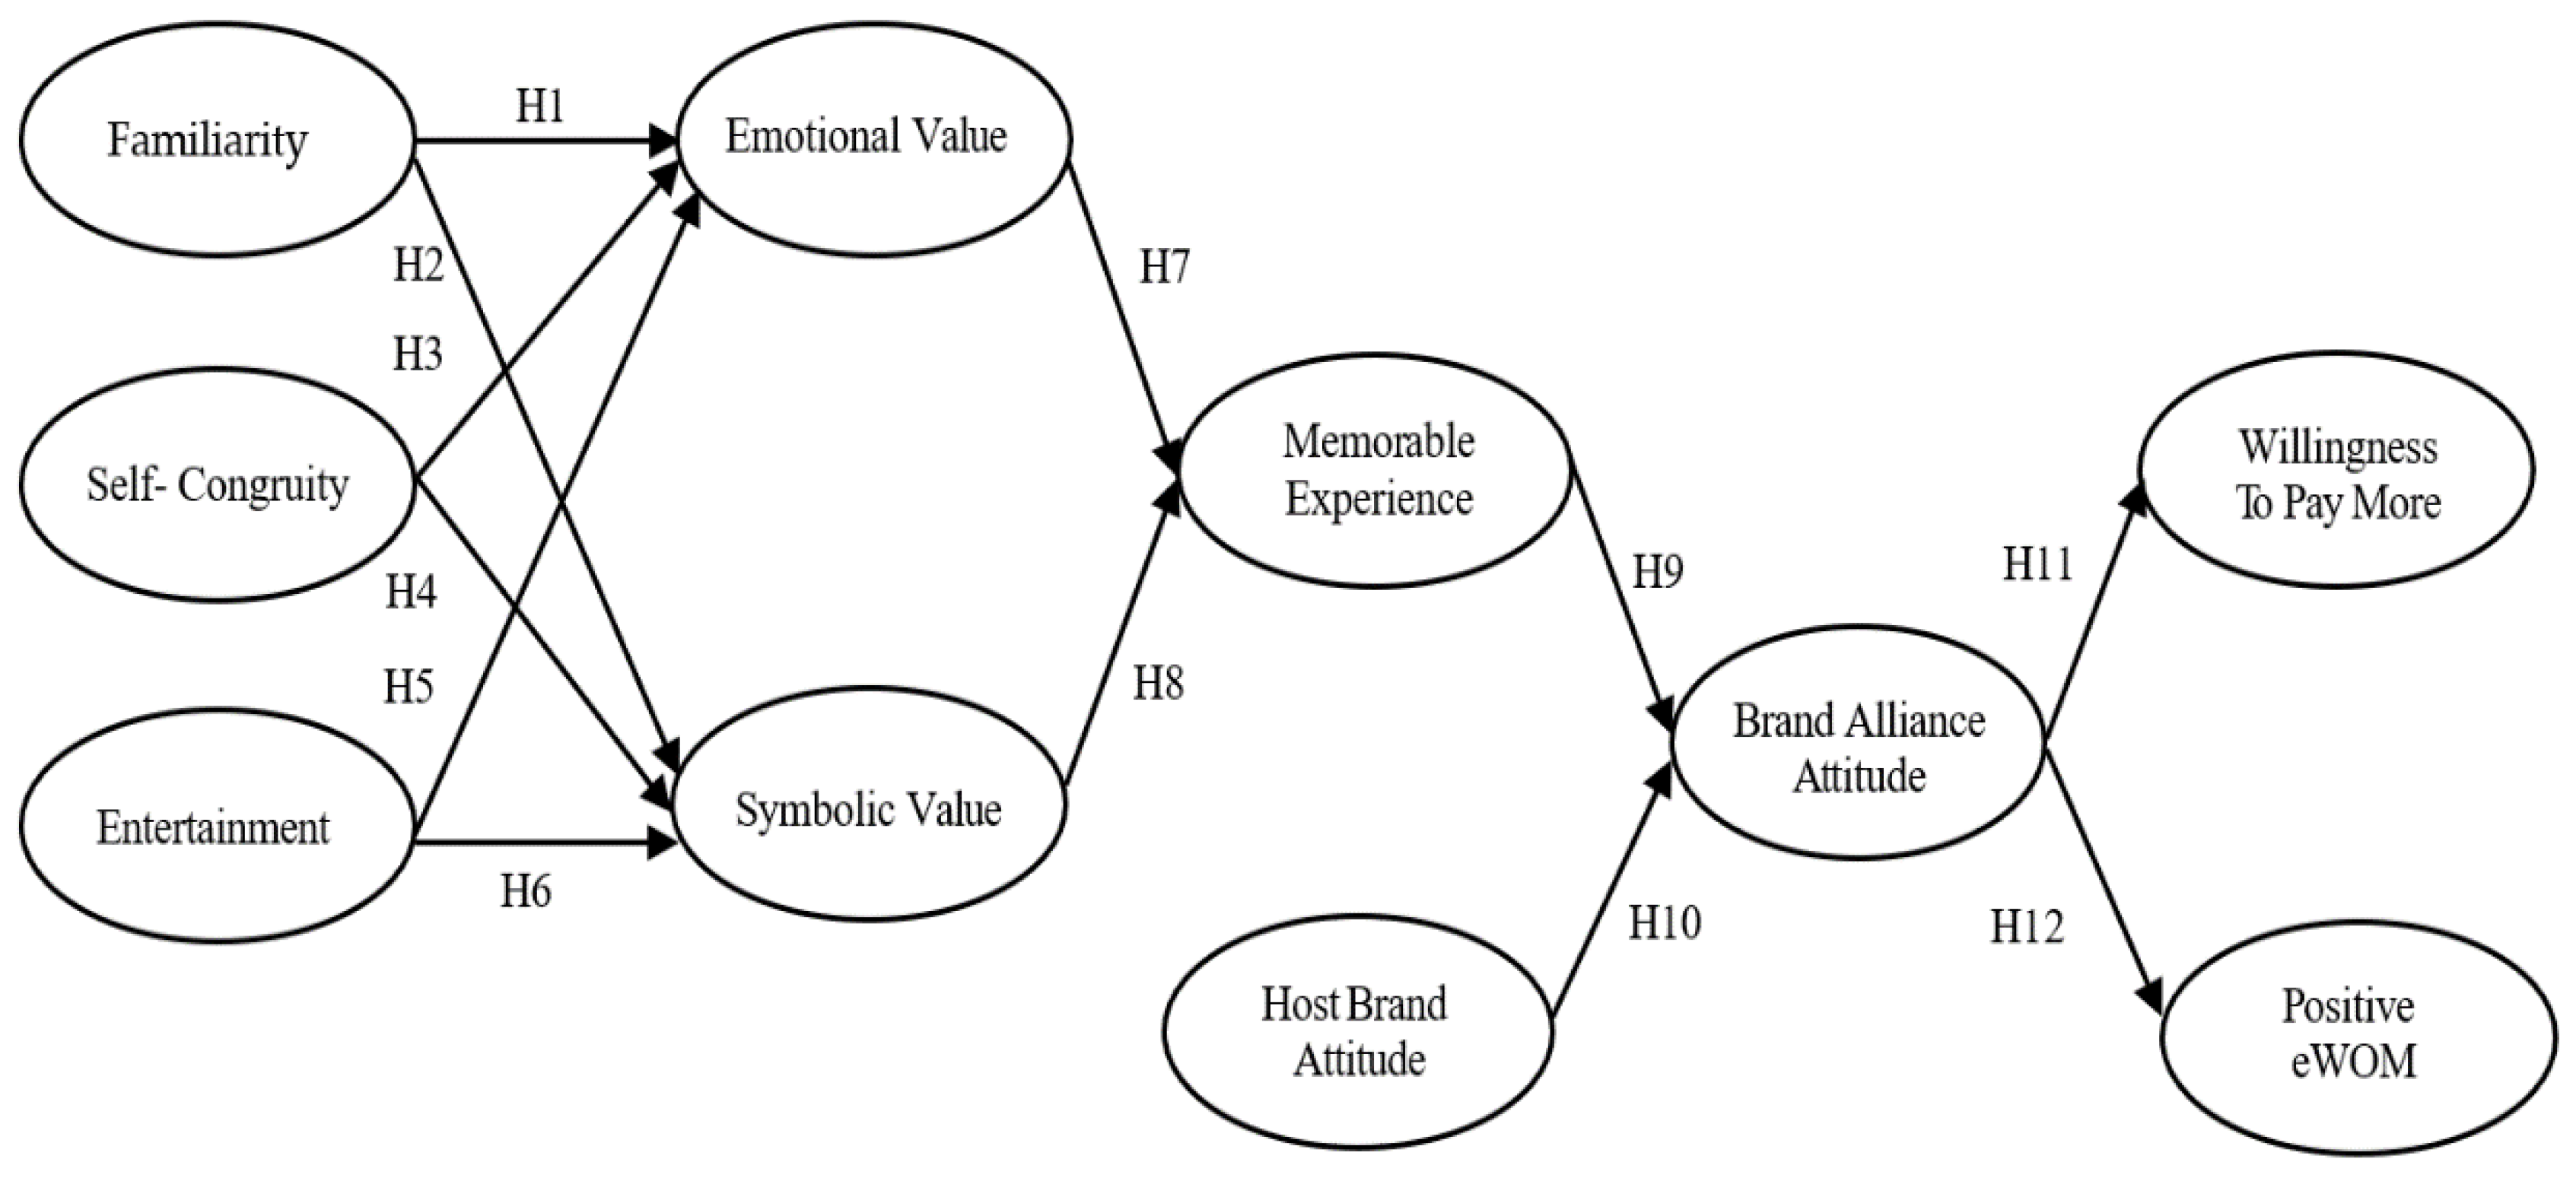
The conceptual frameworks are developed from previous studies, specifically H1 and H2 by Acharya, Fang & Brady [29,30]; H3 and H4 by Aw et al., Frías-Jamilena et al., M. Kim & Thapa, Paasovaara et al. [31,32,33,70]; H5 and H6 by Chen & Lin, Elmashhara & Soares, H. Kim & Niehm [34,35,79]; H7 and H8 by Huang et al., Hwang et al., Hwang & Lee [22,36,39]; H9 by Dolbec & Chebat, Hwang et al. [38,39]; H10 by Ma et al., Riley et al., Rodrigue & Biswas [16,17,42]; H11 by Popovic et al., Rodrigue & Biswas, Yodpram & Intalar [27,41,42]; H12 by S. Chu & Chen, Ismagilova et al. [43,44]. The hypotheses and relation of variables in the framework can be depicted as follows (Figure 1).

Figure 1.
Conceptual framework.
4. Methods
4.1. Participants
This study used quantitative methods with a cross-sectional data approach. The conceptual framework of this study was tested empirically based on the data from the population. The population in this study was consumers in the country who passed certain criteria. The samples in this study were taken purposively. Samples were individuals who purchased a superhero character-licensed product in the past year in Indonesia. They should be active on social media platforms and up-to-date with superhero movies, including generation Z and millennials in the big cities. Indonesia, as an emerging country located in Southeast Asia, is considered relevant as the setting for the study. In addition, Indonesia is the fourth most populous country in the world with a population of 271 million people [45]. Respondents were obtained mainly through announcements on the fan-based Marvel Indonesia Instagram Fan-page and DC Comics Universe Indonesia page. In total, 1258 respondents filled out the online structured questionnaires, which were distributed in August 2021; however, 159 answers were considered invalid. A total of 1099 samples were eligible and met the criteria of the minimum sample requirements based on the proportional formulation.
4.2. Measurement
The constructs in this study were measured by a set of indicators arranged in a structured questionnaire. The questionnaire used in this study was adapted from relevant previous research, modified to the study context, and translated by local translators to ensure all questions were easily understood. Finally, this questionnaire was reviewed by experts in the field of brand marketing. The questionnaire used a Likert scale from 1 to 5, wherein respondents were asked to state their level of agreement with the statements on a scale of 1 (strongly disagree) to 5 (strongly agree).
The questionnaire of familiarity was adopted from Ha and Perks [126]; self-congruity was adopted from Wassler et al. [127] and Sirgy et al. [128]; entertainment was adopted from Mathwick et al. [129] and Van-Tien Dao et al. [130]; emotional value was adopted from Sweeney and Soutar [56]; symbolic value was adopted from Zhang and Zhao [131]; memorable experience was adopted from Sthapit et al. [132] based on scales developed by J.-H. Kim [23]; the host brand attitude measurement was adopted from Wassler et al. [127] and modified from Helgeson and Supphellen [133]; and the brand alliance attitude was adopted from Simonin and Ruth [13]. The WTPM construct was adopted from Saha et al. [134] and positive eWOM was adopted from Serra-Cantallops et al. [135]. Participants were asked to state their level of agreement with the statements on a scale of 1 (strongly disagree) to 5 (strongly agree).
4.3. Analysis
This study deployed tens constructs and is considered a complex research model, therefore the PLS-SEM method was chosen because it could analyze complex models in theory development, especially in exploratory research. Moreover, PLS-SEM can calculate the estimate of each latent variable simultaneously [136]. PLS-SEM is preferred when the orientation of the study is to test the explanatory and predictive abilities of the model [137]. The PLS-SEM analysis was applied through SmartPLS™ version 3.3, which is preferred since it provides a bootstrapping menu to test significance [138]. The calculations process with PLS-SEM produces two types of models, namely inner and outer models. The outer model is meant to measure the reliability and validity between indicators and their respective constructs while the inner model tests the relationship between each construct in the research model.
5. Results
This research study has been conducted on a total of 1099 respondents that meet the criteria in this study. The profiles of the respondents who participated in this study are presented in Table 1. Respondents’ genders are almost the same between men and women, and are dominated by younger generations below 40 years old. Most of the respondents were millennials who work as employees and belong to the upper-middle class who have purchasing power.

Table 1.
Respondents’ demographic profiles.
The first step of the model analysis in PLS-SEM is analyzing the outer model [136]. Based on the outer loading results in Table 2, we removed a few indicators that could not match the threshold value of 0.708, as required [137]. The model found that all indicators have an outer loading value of greater than 0.708, meaning that all indicators are reliable to measure their respective construct. The first step, which was to establish the internal consistency reliability, Cronbach’s alpha, and the composite reliability, was assessed, and the result shows a greater value than 0.7, hence the construct reliability is accepted. The third step to ensure convergence validity in this reflective model was carried out by evaluating the average variance extracted (AVE), as shown in Table 2. The result shows that all indicators have an AVE value above 5, thus it can be concluded that all construct validity is acceptable. However, several indicators, namely familiarity (FAM3 and FAM4), self-congruity (SC4 and SC5), entertainment (ENT1), emotional value (EV2), and memorable experience (ME2), had to be removed because the outer loading value was below 0.708.
Table 2.
Discriminant and construct validity.
To establish a discriminant validity test, a Heterotrait/Monotrait (HT/MT) ratio was used and this HT/MT ratio is known to more accurately detect discriminant issues [139]. The result of the test, as presented in Table 3 below, shows that all the constructs are below 0.9, as required [139], hence all indicators in the model are well-discriminated to measure its construct specifically.
Table 3.
Discriminant validity.
This measurement model has passed all four parameters to ensure reliability and validity, that is, the outer loading, Cronbach’s alpha, the composite reliability, and the average variance extracted (AVE) and HT/MT ratio, as required [137]. Therefore, it can be concluded that all indicators in the model are reliable and valid to measure each construct specifically and can be used for testing the inner model.
The second part of the PLS-SEM analysis is to evaluate the inner model; in this part, the quality of the model was assessed. Instead of using the goodness of fit values, the PLS-SEM, which is based on the variance, accentuated the prediction value through R2 and Q2 [137]. The result found a Standardized Root Mean Square Residual (SRMR) value below 0.08, as recommended, thus indicating a good fit [140]. The inner Variance Inflation Factor (VIF) of all the constructs is below, as recommended [136], hence it could be said that there is no multicollinearity issue in the model. The R2 for WTPM and eWOM are 0.500 and 0.426, categorized as moderate predictability. However, there is only a single path to each construct, whereas the f2 value is 1.002 for WTPM and 0.741 for eWOM, indicating that there are large effect sizes from brand alliance attitude. The cross-validated redundancy Q2 value from the blindfolding method shows that the Q2 value for WTPM and eWOM are 0.330 and 0.271, which indicate medium predictive relevance. In this regard, it could be said that the proposed model has adequate prediction capability to predict the behavior intention impact, although it could be improved in future studies.
In the structural model, the significance and coefficients of the variables were assessed to decide whether the hypothesis could be supported or not. Based on the test results in Table 4, as shown below, all hypotheses have a T-statistic value greater than the threshold of 1.645 (one-tailed with alpha 0.05) and the p-value, as shown below, is equal to or less than 0.05. All standardized coefficients have a positive value, in accordance with the directional hypothesis. Thus, we conclude that all the twelve hypotheses developed in this study are supported by the analyzed empirical data analysis.
Table 4.
Hypotheses test result.
From Table 4 above, it could be found that entertainment has a stronger effect on emotional value (0.393), followed by self-congruity (0.278) and familiarity (0.183). On the other side, familiarity has a stronger effect on symbolic value (0.314), followed by entertainment. Furthermore, emotional value shows a slightly stronger value than symbolic value (0.444 vs. 0.420), indicating that both play an important role towards a memorable experience. Host brand attitude (0.392) and memorable experience were found to be equally influential in shaping the brand alliance.
To further analyze the structural model, a mediation analysis was carried out as suggested by Nitzl et al. [141]. The purpose of this analysis was to show the specific indirect effect in the model, mainly concerning the path from the independent variables to the WTPM and eWOM. The result indicates that the stronger coefficient was from entertainment to emotional value; then, the emotional value to a memorable experience; and followed by memorable experience to brand alliance attitude, which ultimately affects the willingness to pay more.
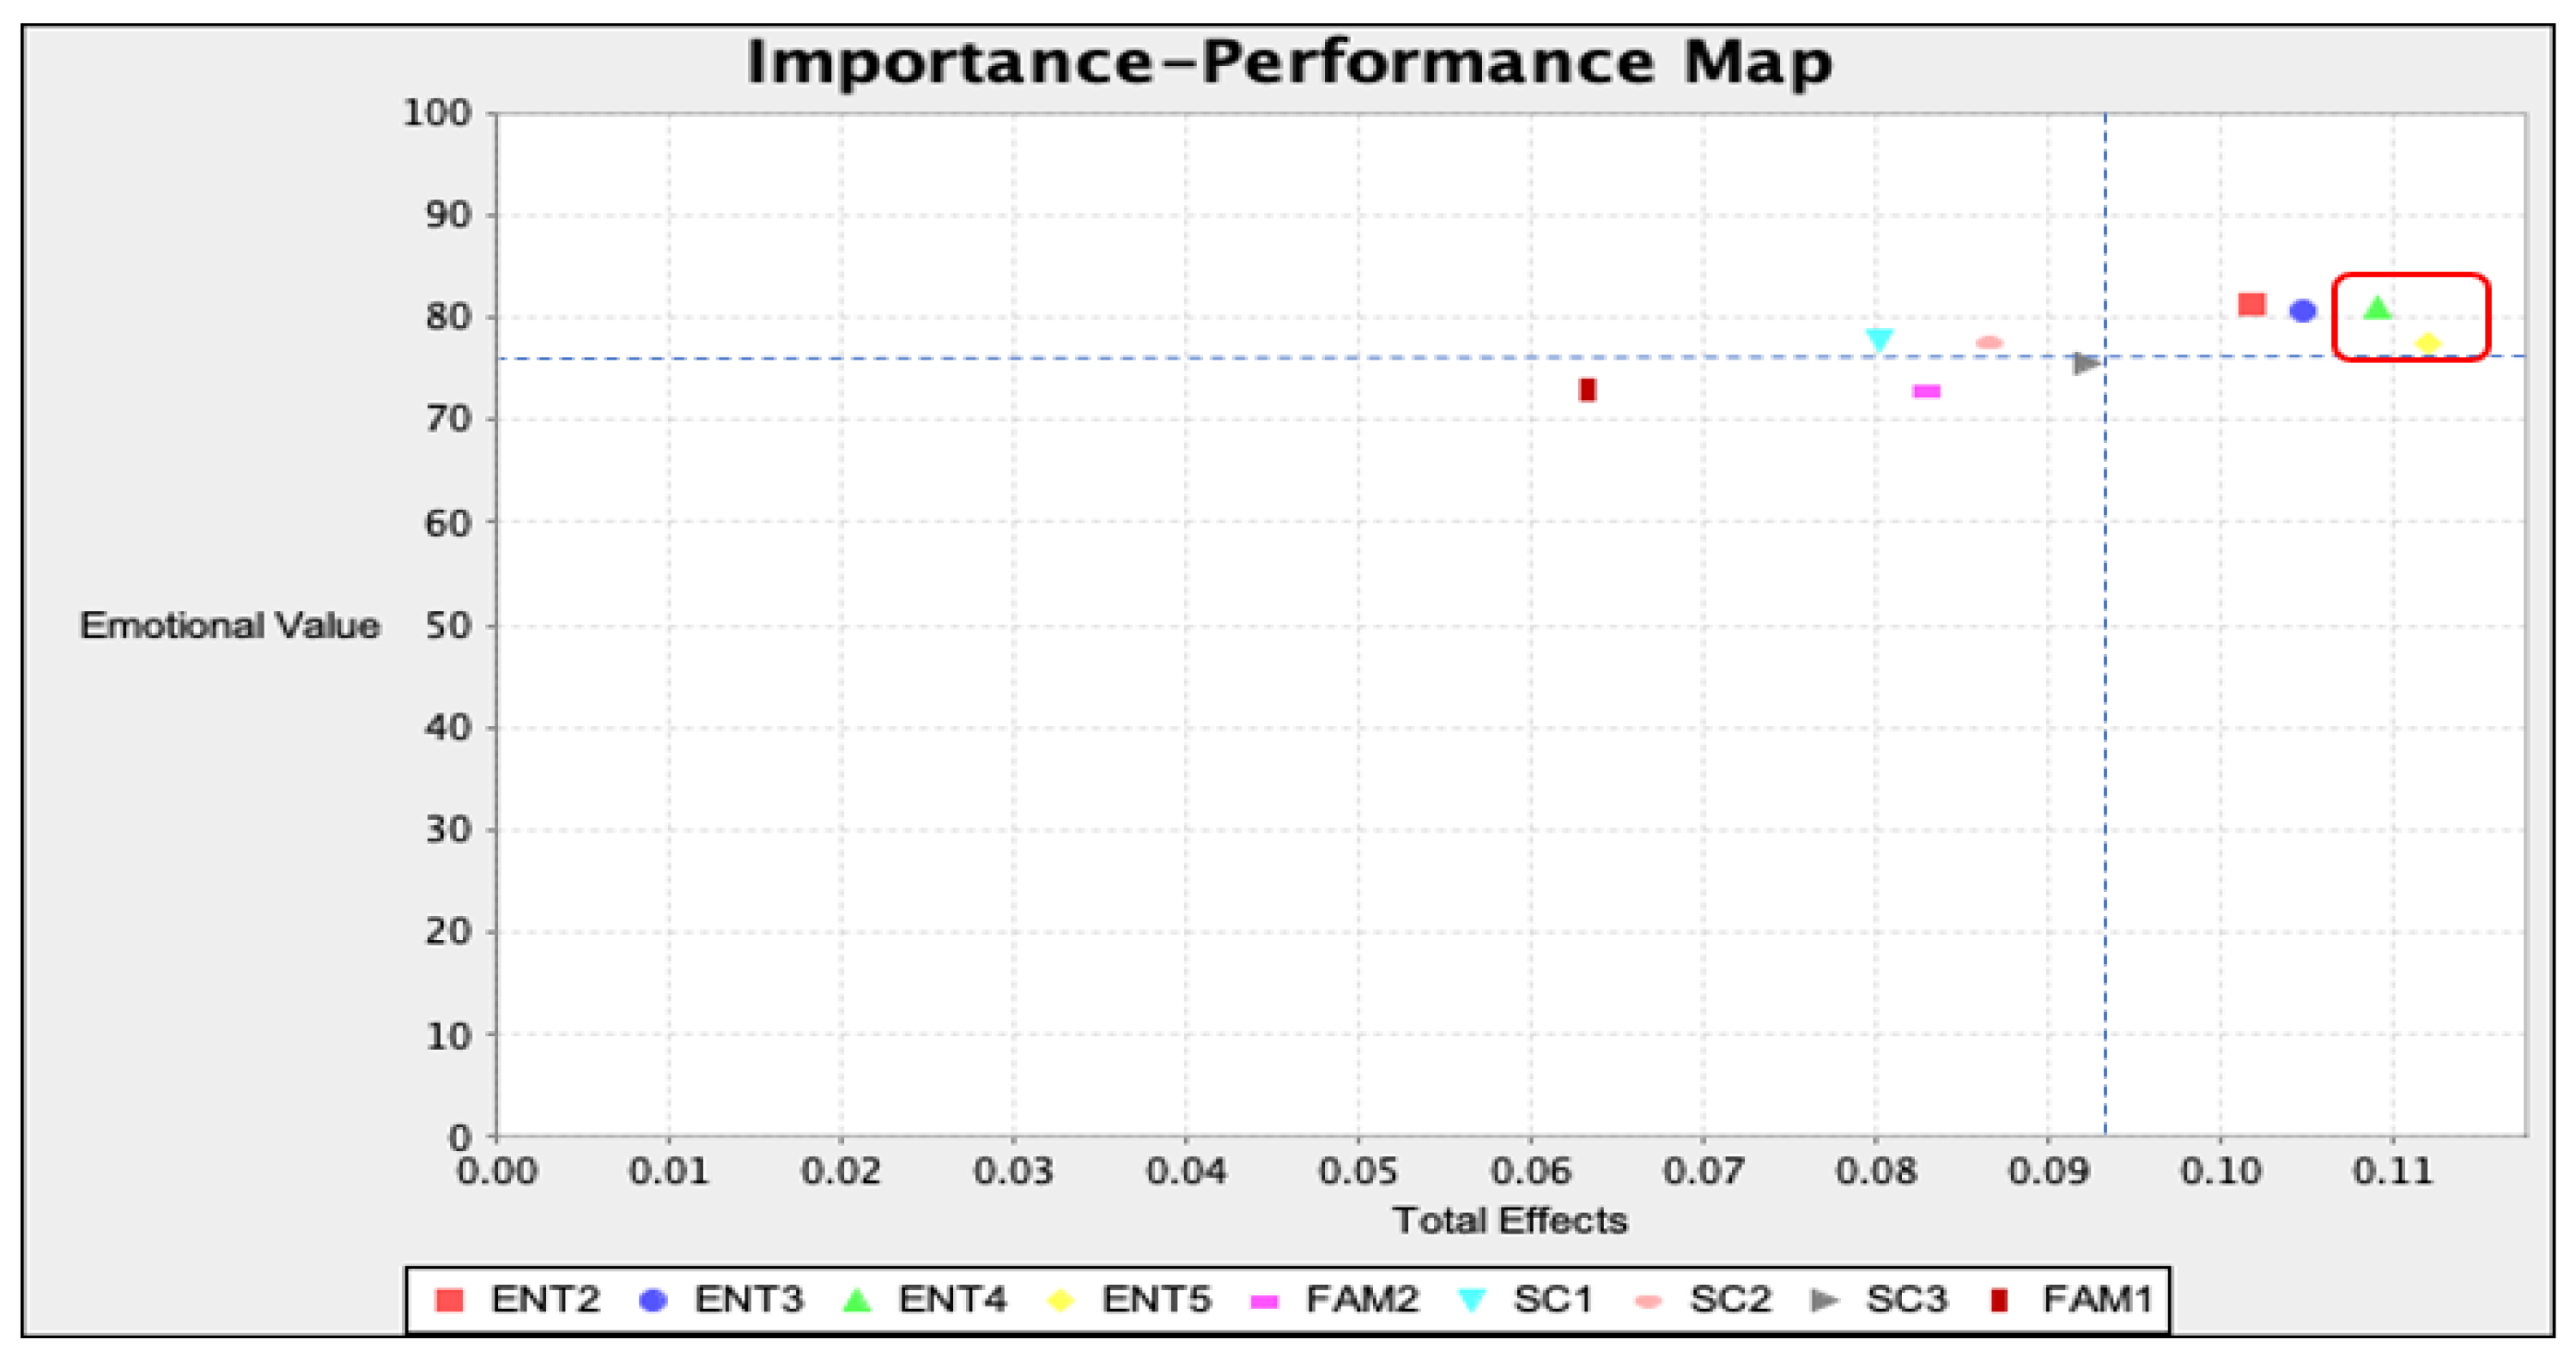
For practical implication purposes, an Importance Performance Map Analysis (IPMA) was carried out through SmartPLSTM calculation as suggested by Hair et al. [137]. According to the findings, the emotional value played a role in the consumption value and the IPMA was used to analyze this construct. IPMA analysis could be drawn by the indicator based on the total effect value to indicate the importance. The result is shown in Figure 2 below. It can be identified that the indicators that are important in influencing emotional value is entertainment (ENT), namely ENT5 and ENT4 (see Table 2). Thus, managers need to pay more attention to this kind of value.
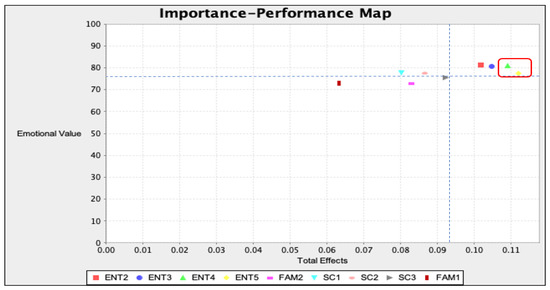
Figure 2.
IPMA of emotional value.
The results of the data analysis with PLS-SEM could be drawn as an empirical model (Figure 3). From the below figure, it can be seen that all the paths are proven significant and have a positive direction. Considering the f2 value that is greater than 0.35, it could be said that brand alliance has a large effect size both on WTPM and eWOM.
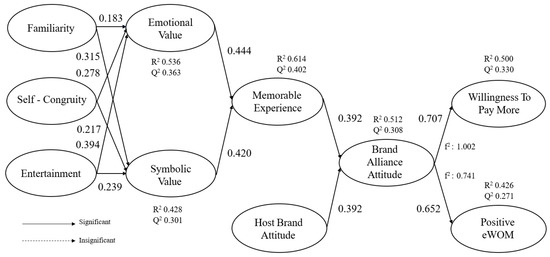
Figure 3.
Result model.
6. Discussion
This study aimed to analyze elements that influence emotional value and symbolic value that affect the memorable experience, which shapes brand alliance attitude in conjunction with brand host attitude. Furthermore, this study aimed to analyze the brand alliance attitude impact on the willingness to pay more and eWOM. The findings of this research show the significance of the relationship in the structural model and the positive valence, thus supporting all the hypotheses.
The results of this study demonstrate that the brand alliance shaped from superhero characters with local brands as host brands has a significant impact on consumers’ willingness to pay more (WTPM) and eWOM. This result is consistent with the previous research which stated that positive brand attitude can drive WTPM [27,41,42]. When consumers recognize the superhero logo on the local brand, it will generate a positive attitude and then the consumer who shows a positive attitude to the brand alliance is willing to pay more for the brand that they purchased. WTPM could maximize profits for the host brand, which will later make the host brand tend to use more superhero licensing in the future and create a mutually beneficial business. This leverage effect is in line with research conducted by Y.-C. Lin et al., Cardinali et al., and Mas et al. [102,142,143] which showed that a spill-over effect of the brand alliance can generate revenue for firms.
The brand alliance with superhero characters and the local brand has proven to drive consumers to spread positive eWOM by recommending, posting, or sharing positive content on social media as the platform for eWOM. This result is aligned with the previous study by Erkan and Evans [120] that provided benefits for the host brand in improving its brand image. Specifically, this study confirms the academic work by Hegner and Peixoto [21] which stated that the host brand can have an advantage by using the superhero logo on their products. In extending that study, this study found that the brand alliance with superhero characters could lead to patronized behavioral intentions, such in WTPM and eWOM. Hence, positive eWOM could be an effective tool to attract new consumers. This is in line with research that proved that a positive brand attitude encourages consumers’ willingness to spread positive eWOM [43,44]. This study aligns with a study by Zinko et al. [144] that stated eWOM could be one of the effective marketing tools, especially for hedonic products.
This study revealed that brand alliance attitude is formed by the superhero memorable experience in conjunction with the host brand attitude and it was found that these two variables contribute equally. In this study, a memorable experience could be understood as a memory created from consumer experience when using superhero-licensed products and this is distinct from their memory of the superhero character alone. This particular experience can influence attitudes towards licensed local brands with superhero characters. This result is in line with a study conducted by Hwang et al. [39] which proved that memorable experiences can influence consumer attitudes. In the concept of the brand alliance, consumers’ experience of a brand will affect their perception and assessment of the brand, which is known as the spill-over effect, thus creating new perceptions of the two related brands either directly or indirectly [90]. On the other hand, to optimize the brand alliance, a local brand with a positive attitude must be selected. The process of brand fit in the brand alliance is in accordance with previous research [21] which explains that the level of brand fit between two partnering brands can affect consumer attitudes. This finding is in line with previous research which discusses that brand and product fit between both brands should be equal to shape successful brand alliance [17,102] and that host brands must have good product quality to ensure brand alliance success [11]. Therefore, local brands should not only rely on the popularity of superhero characters but also must increase their brand equity. Local brands need to assess at what level the brand alliance strategy could proceed.
The results of this study showed the link to possess the memorable experience. Memorable experiences of the superhero characters’ usage of the particular brand are formed equally by emotional value and symbolic value. The emotional value itself is strongly affected by entertainment, followed by self-congruity, while symbolic value is affected by familiarity, followed also by self-congruity. This result indicates that consumers who consume superhero-licensed products are strongly influenced by their feeling of superhero characters who are perceived as entertaining, bringing a sense of joy and enjoyment when using these products, and this argument is in line with previous studies [2,35] that stated superhero characters are in great demand globally because of their entertainment value. Moreover, the role of self-congruity should be a match between the personality of the superhero character and the individual’s personality. The existence of the personality of the superhero character that is desired to be copied, as well as the motivation of the individual to imagine themselves as others and how the individual wants to be seen and judged by others, was observed. This finding is in line with a study conducted by Fang and Brady [30], specifically for the consumption of licensed merchandise, and Van Tongeren et al. [37] that studied the effect of superhero images. This finding confirms the consumption of fun, fantasy, and feeling-pioneering by Holbrook and Hirschman [24]. Hence, both the emotional and symbolic value are important aspects when assessing the use of characters from movies for brand alliance formation.
Several managerial implications could be suggested based on this finding. For instance, to grow the business, the licensor must acquire new partners. The licensor can use these results to assure local brands regarding the potential benefits that superhero characters can have on a brand when forming a business with an official licensor. By partnering up with a superhero character, local brands can increase their sales and revenue by selling their products with an appropriate price strategy. Consumers who have a positive evaluation of that particular brand will share positive content and opinions, and give recommendations by posting on their social media. These actions, in turn, will give a positive image to local brands and be useful to reach new potential consumers. However, the brand alliance arrangement between a superhero character and host brand ought to be firstly justified by both parties regarding whether there is a fit between superhero characters, product categories, and consumer segmentation. The product categories may be more suitable with the hedonic product categories.
This study contributes to the brand-kind of literature, especially regarding how a brand alliance with a superhero character could be developed. To the extent of the authors’ knowledge, this is the first study that links the elements of perceived consumption value with memorable experience and brand alliance attitudes. This model can predict future consumer behavior intentions concerning the brand alliance, namely WTPM and positive eWOM. Thus, the contribution to marketing literature is achieved by providing the insight that the consumption of superhero-licensed products can promote unforgettable experiences when consumers use the brand with superhero characters. Thus, this kind of experience is an important factor to predict consumer attitude towards the brand alliance. Moreover, this proposed model demonstrated a large effect size (f2 > 0.35) for both WTPM and eWOM, therefore this model could be replicated in future studies across product categories with different populations which have different cultures or in more specific demographics, such as regarding generation Z.
7. Conclusions
This study concludes that brand alliance attitude has been proven to have an impact on consumers’ willingness to pay more (WTPM) and positive eWOM. Both memorable experience and host brand attitude play an equally important role in forming a successful brand alliance. This indicates that the attitude towards local brands should be taken into account in consumers’ overall evaluations of brand alliances. This research revealed that memorable experiences with superhero characters are influenced by both emotional value and symbolic value. Entertainment is proven as a significant element that creates emotional value, followed by self-congruity and familiarity, whereas, familiarity shows a stronger influence on symbolic value. These findings contribute to the marketing literature by pointing to the link of superhero characters’ consumption value that could shape the brand alliance attitude through a memorable experience.
This study provides managerial implications for both licensors and local brands. The brand alliance is mutual for both party’s businesses. Licensors should pay more attention to managing how the superhero character could be more entertaining. They should allocate resources to deliver the superhero character’s ability to entertain and communicate superhero impressions that could entertain, be interesting, and be pleasing. The licensor management should also choose the right local brand to ensure the success of the brand alliance. Local brands could benefit from the superhero character to leverage the business. However, they should not rely on just a superhero logo printed on their product; they need to develop their own brand before they look for the brand alliance strategy to ensure a successful brand alliance.
There are several limitations of this research that can be improved for future research. First, this study does not specifically explore the unique character of superheroes. Therefore, in future research, the consumer attitude and consumer perceived value need to be explored based on each superhero character; for instance, they could focus on Batman, Ironman, Wonder Woman, etc., which may have fans. Secondly, even with more than one-thousand respondents, this study does not include gender and age. Thus, in future studies, it is recommended to test the effect of gender and age as moderators that may influence future behavior intentions. Thirdly, this study encompasses all categories of products, mainly the hedonic one. Therefore, in terms of product categories, particular categories also need to be investigated, such as the fashion, kids toys, sport, or hobby category. Lastly, this study was done in one country with respondents obtained only from five big cities in Indonesia, excluding other cities. This may associate to different cultures in various regions. Thus, further studies across different cultures may be needed to address this issue.
Author Contributions
Conceptualization, M.M. and F.A.; data curation, M.M. and F.A.; formal analysis, M.M. and F.A.; investigation, M.M. and F.A.; methodology, M.M. and F.A.; project administration, M.M.; software, M.M. and F.A.; validation, F.A.; writing—original draft preparation, M.M.; writing—review and editing, F.A. All authors have read and agreed to the published version of the manuscript.
Funding
This research study received no external funding.
Institutional Review Board Statement
Not applicable.
Informed Consent Statement
Not applicable.
Data Availability Statement
Not applicable.
Conflicts of Interest
The authors declare no conflict of interest.
References
- Eury, M.; Misiroglu, G.; Sanderson, P. Superhero. Definition, Names, Movies, History, and Facts. Available online: https://www.britannica.com/art/superhero (accessed on 6 November 2021).
- Hammonds, K. The Globalization of Superheroes: Diffusion, Genre, and Cultural Adaptations. In Oxford Research Encyclopedia of Communication; Oxford University Press: Oxford, UK, 2021; ISBN 9780190228613. [Google Scholar]
- Beaty, B. Superhero Fan Service: Audience Strategies in the Contemporary Interlinked Hollywood Blockbuster. Inf. Soc. 2016, 32, 318–325. [Google Scholar] [CrossRef]
- Becko, L. Consumption of Superheroes: The Performances of Fans as Strategies of Involvement. Panic Discourse Interdiscip. J. 2019, 1, 17–27. [Google Scholar]
- Venkatesh, V. The Superhero Symbol: Media, Culture and Politics. New Rev. Film. Telev. Stud. 2021, 19, 112–114. [Google Scholar] [CrossRef]
- Keller, K.; College, D. Strategic Brand Management, 4th ed.; Pearson: London, UK, 2013. [Google Scholar]
- Atuahene-Gima, K.; Patterson, P.G. The Impact of Managerial Attitudes on Technology Licensing Performance. Eur. J. Mark. 1992, 26, 52–63. [Google Scholar] [CrossRef]
- Licensing International. The 2020 Global Licensing Industry Study; Licensing International Commissioned Brandar Consulting, LLC: New York, NY, USA, 2020; pp. 1–65. [Google Scholar]
- Statista Leading Merchandise Licensors Worldwide 2020. Available online: https://www.statista.com/statistics/294111/leading-organizations-in-licensed-merchandise-worldwide/ (accessed on 8 November 2021).
- Bluemelhuber, C.; Carter, L.L.; Lambe, C.J. Extending the View of Brand Alliance Effects: An Integrative Examination of the Role of Country of Origin. Int. Mark. Rev. 2007, 24, 427–443. [Google Scholar] [CrossRef]
- Cao, Z.; Yan, R. Does Brand Partnership Create a Happy Marriage? The Role of Brand Value on Brand Alliance Outcomes of Partners. Ind. Mark. Manag. 2017, 67, 148–157. [Google Scholar] [CrossRef]
- Johan Lanseng, E.; Erling Olsen, L. Brand Alliances: The Role of Brand Concept Consistency. Eur. J. Mark. 2012, 46, 1108–1126. [Google Scholar] [CrossRef]
- Simonin, B.L.; Ruth, J.A. Is a Company Known by the Company It Keeps? Assessing the Spillover Effects of Brand Alliances on Consumer Brand Attitudes. J. Mark. Res. 1998, 35, 30. [Google Scholar] [CrossRef]
- Baumgarth, C. Evaluations of Co-brands and Spill-over Effects: Further Empirical Results. J. Mark. Commun. 2004, 10, 115–131. [Google Scholar] [CrossRef]
- Helmig, B.; Huber, J.-A.; Leeflang, P. Explaining Behavioural Intentions toward Co-Branded Products. J. Mark. Manag. 2007, 23, 285–304. [Google Scholar] [CrossRef] [Green Version]
- Riley, D.; Charlton, N.; Wason, H. The Impact of Brand Image Fit on Attitude towards a Brand Alliance. Manag. Mark. 2015, 10, 270–283. [Google Scholar] [CrossRef] [Green Version]
- Ma, B.; Cheng, F.; Bu, J.; Jiang, J. Effects of Brand Alliance on Brand Equity. J. Contemp. Mark. Sci. 2018, 1, 22–33. [Google Scholar] [CrossRef]
- Desai, K.K.; Keller, K.L. The Effects of Ingredient Branding Strategies on Host Brand Extendibility. J. Mark. 2002, 66, 73–93. [Google Scholar] [CrossRef]
- Gammoh, B.S.; Voss, K.E.; Chakraborty, G. Consumer Evaluation of Brand Alliance Signals. Psychol. Mark. 2006, 23, 465–486. [Google Scholar] [CrossRef]
- Ruekert, R.W.; Ashkay, R.R. Brand Alliances as Signals of Product Quality. Available online: https://sloanreview.mit.edu/article/brand-alliances-as-signals-of-product-quality/ (accessed on 9 November 2021).
- Hegner, N.; Peixoto, G. NHH Brage: Can Brands Have Superheroes? A Study Investigating the Effects of Brand Alliances with Superhero Characters on the Evaluation of the Host Brand; Norwegian School of Economics: Bergen, Norway, 2017. [Google Scholar]
- Huang, Y.; Zhang, Y.; Quan, H. The Relationship among Food Perceived Value, Memorable Tourism Experiences and Behaviour Intention: The Case of the Macao Food Festival. Int. J. Tour. Sci. 2019, 19, 258–268. [Google Scholar] [CrossRef]
- Kim, J.-H. The Antecedents of Memorable Tourism Experiences: The Development of a Scale to Measure the Destination Attributes Associated with Memorable Experiences. Tour. Manag. 2014, 44, 34–45. [Google Scholar] [CrossRef]
- Holbrook, M.B.; Hirschman, E.C. The Experiential Aspects of Consumption: Consumer Fantasies, Feelings, and Fun. J. Consum. Res. 1982, 9, 132–140. [Google Scholar] [CrossRef] [Green Version]
- Pine, B.J.; Gilmore, J.H. Welcome to the Experience Economy. Available online: https://hbr.org/1998/07/welcome-to-the-experience-economy (accessed on 7 November 2021).
- Brakus, J.J.; Schmitt, B.H.; Zarantonello, L. Brand Experience: What Is It? How Is It Measured? Does It Affect Loyalty? J. Mark. 2009, 73, 52–68. [Google Scholar] [CrossRef]
- Yodpram, S.; Intalar, N. Conceptualizing EWOM, Brand Image, and Brand Attitude on Consumer’s Willingness to Pay in the Low-Cost Airline Industry in Thailand. Proceedings 2020, 39, 27. [Google Scholar] [CrossRef]
- Ismagilova, E.; Rana, N.P.; Slade, E.L.; Dwivedi, Y.K. A Meta-Analysis of the Factors Affecting EWOM Providing Behaviour. Eur. J. Mark. 2021, 55, 1067–1102. [Google Scholar] [CrossRef]
- Acharya, A. The Impact of Brand Familiarity, Customer Brand Engagement and Self-Identification on Word-of-Mouth. South Asian J. Bus. Stud. 2020, 10, 29–48. [Google Scholar] [CrossRef]
- Fang, H.; Brady, J.T. Consumers Willingness to Pay More for Character Licensed Merchandise. Master’s Thesis, Graduate School of Seoul National University, Seoul, Korea, 2019. [Google Scholar]
- Paasovaara, R.; Luomala, H.; Sandell, M. The Effects of Brand Familiarity and Consumer Value—Brand Symbolism (In) Congruity on Taste Perception. In The Customer is NOT Always Right? Marketing Orientationsin a Dynamic Business World; Springer: Berlin, Germany, 2017; pp. 754–757. [Google Scholar] [CrossRef]
- Aw, E.C.-X.; Flynn, L.R.; Chong, H.X. Antecedents and Consequences of Self-Congruity: Replication and Extension. J. Consum. Mark. 2019, 36, 102–112. [Google Scholar] [CrossRef] [Green Version]
- Kim, M.; Thapa, B. The Influence of Self-Congruity, Perceived Value, and Satisfaction on Destination Loyalty: A Case Study of the Korean DMZ. J. Herit. Tour. 2018, 13, 224–236. [Google Scholar] [CrossRef]
- Chen, C.-C.; Lin, Y.-C. What Drives Live-Stream Usage Intention? The Perspectives of Flow, Entertainment, Social Interaction, and Endorsement. Telemat. Inform. 2018, 35, 293–303. [Google Scholar] [CrossRef]
- Elmashhara, M.G.; Soares, A.M. Entertain Me, I’ll Stay Longer! The Influence of Types of Entertainment on Mall Shoppers’ Emotions and Behavior. J. Consum. Mark. 2019, 37, 87–98. [Google Scholar] [CrossRef]
- Hwang, J.; Lee, K.-W. The Antecedents and Consequences of Golf Tournament Spectators’ Memorable Brand Experiences. J. Destin. Mark. Manag. 2018, 9, 1–11. [Google Scholar] [CrossRef]
- Van Tongeren, D.R.; Hibbard, R.; Edwards, M.; Johnson, E.; Diepholz, K.; Newbound, H.; Shay, A.; Houpt, R.; Cairo, A.; Green, J.D. Heroic Helping: The Effects of Priming Superhero Images on Prosociality. Front. Psychol. 2018, 9, 2243. [Google Scholar] [CrossRef]
- Dolbec, P.-Y.; Chebat, J.-C. The Impact of a Flagship vs. a Brand Store on Brand Attitude, Brand Attachment and Brand Equity. J. Retail. 2013, 89, 460–466. [Google Scholar] [CrossRef]
- Hwang, J.; Choe, J.Y.; Kim, H.M.; Kim, J.J. The Antecedents and Consequences of Memorable Brand Experience: Human Baristas versus Robot Baristas. J. Hosp. Tour. Manag. 2021, 48, 561–571. [Google Scholar] [CrossRef]
- Yan, R.; Cao, Z. Is Brand Alliance Always Beneficial to Firms? J. Retail. Consum. Serv. 2017, 34, 193–200. [Google Scholar] [CrossRef]
- Popovic, I.; Bossink, B.A.G.; van der Sijde, P.C.; Fong, C.Y.M. Why Are Consumers Willing to Pay More for Liquid Foods in Environmentally Friendly Packaging? A Dual Attitudes Perspective. Sustainability 2020, 12, 2812. [Google Scholar] [CrossRef] [Green Version]
- Rodrigue, C.S.; Biswas, A. Brand Alliance Dependency and Exclusivity: An Empirical Investigation. J. Prod. Brand Manag. 2004, 13, 477–487. [Google Scholar] [CrossRef]
- Chu, S.; Chen, H. Impact of Consumers’ Corporate Social Responsibility-related Activities in Social Media on Brand Attitude, Electronic Word-of-mouth Intention, and Purchase Intention: A Study of Chinese Consumer Behavior. J. Consumer Behav. 2019, 18, 453–462. [Google Scholar] [CrossRef]
- Ismagilova, E.; Slade, E.; Rana, N.P.; Dwivedi, Y.K. The Effect of Characteristics of Source Credibility on Consumer Behaviour: A Meta-Analysis. J. Retail. Consum. Serv. 2020, 53, 101736. [Google Scholar] [CrossRef] [Green Version]
- BPS Badan Pusat Statistik. Available online: https://www.bps.go.id/pressrelease/2021/01/21/1854/hasil-sensus-penduduk-2020.html (accessed on 7 November 2021).
- World Bank. World Bank Indonesia Overview: Development News, Research, Data. Available online: https://www.worldbank.org/en/country/indonesia/overview#1 (accessed on 7 November 2021).
- Global Research, Insights & Analytics INSEAK Brand Health Check Indonesia; Warner Bros. Entertainment: Burbank, CA, USA, 2021; pp. 1–54.
- Fishbein, M. A Behavior Theory Approach to the Relations between Beliefs about an Object and the Attitude toward the Object; John Wiley and Sons: New York, NY, USA, 1967. [Google Scholar]
- Longwell, G.J. Managing Brand Equity: Capitalizing on the Value of a Brand Name: David A. Aaker, The Free Press, New York (1991). J. Bus. Res. 1994, 29, 247–248. [Google Scholar] [CrossRef]
- Keller, K.L. Conceptualizing, Measuring, and Managing Customer-Based Brand Equity. J. Mark. 1993, 57, 1–22. [Google Scholar] [CrossRef]
- Kotler, P. Kotler On…. Manag. Decis. 1991, 29, 4961. [Google Scholar] [CrossRef]
- Schmitt, B. Experiential Marketing. J. Mark. Manag. 1999, 15, 53–67. [Google Scholar] [CrossRef]
- Zeithaml, V.A. Consumer Perceptions of Price, Quality, and Value: A Means-End Model and Synthesis of Evidence. J. Mark. 1988, 52, 2. [Google Scholar] [CrossRef]
- Holbrook, M.B.; Cofman, K.P. Perceived Quality: How Consumers View Stores and Merchandise. In Quality and Value in the Consumption Experience: Phaedrus Rides Again; Jacoby, J., Olson., J.C., Eds.; D.C. Heath and Company: Lexington, MA, USA, 1985. [Google Scholar]
- Sheth, J.N.; Newman, B.I.; Gross, B.L. Why We Buy What We Buy: A Theory of Consumption Values. J. Bus. Res. 1991, 22, 159–170. [Google Scholar] [CrossRef]
- Sweeney, J.C.; Soutar, G.N. Consumer Perceived Value: The Development of a Multiple Item Scale. J. Retail. 2001, 77, 203–220. [Google Scholar] [CrossRef]
- Park, C.W.; Macinnis, D.J.; Priester, J.; Eisingerich, A.B.; Iacobucci, D. Brand Attachment and Brand Attitude Strength: Conceptual and Empirical Differentiation of Two Critical Brand Equity Drivers. J. Mark. 2010, 74, 1–17. [Google Scholar] [CrossRef] [Green Version]
- Hunt, S.A.; Miller, K.A. The Discourse of Dress and Appearance: Identity Talk and a Rhetoric of Review. Symb. Interact. 1997, 20, 69–82. [Google Scholar] [CrossRef]
- Holbrook, M.B.; Moore, W.L. Feature Interactions in Consumer Judgments of Verbal versus Pictorial Presentations. J. Consum. Res. 1981, 8, 103. [Google Scholar] [CrossRef]
- Baker, W.; Hutchinson, J.W.; Moore, D.; Nedungadi, P. Brand Familiarity and Advertising: Effects on the Evoked Set and Brand Preference. ACR N. Am. Adv. 1986, 13, 637–642. [Google Scholar]
- Alba, J.W.; Hutchinson, J.W. Dimensions of Consumer Expertise. J. Consum. Res. 1987, 13, 411–454. [Google Scholar] [CrossRef]
- Kent, R.J.; Allen, C.T. Competitive Interference Effects in Consumer Memory for Advertising: The Role of Brand Familiarity. J. Mark. 1994, 58, 97. [Google Scholar] [CrossRef]
- Beggan, J.K.; Brown, E.M. Association as a Psychological Justification for Ownership. J. Psychol. 1994, 128, 365–380. [Google Scholar] [CrossRef]
- Pierce, J.L.; Kostova, T.; Dirks, K.T. The State of Psychological Ownership: Integrating and Extending a Century of Research. Rev. Gen. Psychol. 2003, 7, 84–107. [Google Scholar] [CrossRef]
- Kim, J.Y.; Choi, J.K.; Han, W.H.; Kim, J.H. The Influence of Users’ Spatial Familiarity on Their Emotional Perception of Space and Wayfinding Movement Patterns. Sensors 2021, 21, 2583. [Google Scholar] [CrossRef]
- Park, K.S.; Hass, C.J.; Fawver, B.; Lee, H.; Janelle, C.M. Emotional States Influence Forward Gait during Music Listening Based on Familiarity with Music Selections. Hum. Mov. Sci. 2019, 66, 53–62. [Google Scholar] [CrossRef] [PubMed]
- Sirgy, M.J. Self-Concept in Consumer Behavior: A Critical Review. J. Consum. Res. 1982, 9, 287–300. [Google Scholar] [CrossRef]
- Fennis, B.M.; Pruyn, A.T.H. You Are What You Wear: Brand Personality Influences on Consumer Impression Formation. J. Bus. Res. 2007, 60, 634–639. [Google Scholar] [CrossRef] [Green Version]
- Kressmann, F.; Sirgy, M.J.; Herrmann, A.; Huber, F.; Huber, S.; Lee, D.-J. Direct and Indirect Effects of Self-Image Congruence on Brand Loyalty. J. Bus. Res. 2006, 59, 955–964. [Google Scholar] [CrossRef]
- Frías-Jamilena, D.M.; Castañeda-García, J.A.; Del Barrio-García, S. Self-Congruity and Motivations as Antecedents of Destination Perceived Value: The Moderating Effect of Previous Experience. Int. J. Tour. Res. 2019, 21, 23–36. [Google Scholar] [CrossRef] [Green Version]
- Bosshart, L.; Macconi, I. Media Entertainment; Centre for the Study of Communication and Culture: Santa Clara, CA, USA, 1998. [Google Scholar]
- McKee, A.; Collis, C.; Nitins, T.; Ryan, M.; Harrington, S.; Duncan, B.; Carter, J.; Luck, E.; Neale, L.; Butler, D.; et al. Defining Entertainment: An Approach. Creat. Ind. J. 2014, 7, 108–120. [Google Scholar] [CrossRef]
- Holbrook, M.B. The Millennial Consumer in the Texts of Our Times: Experience and Entertainment. J. Macromark. 2000, 20, 178–192. [Google Scholar] [CrossRef]
- Hyun, S.S.; Kim, W.; Lee, M.J. The Impact of Advertising on Patrons’ Emotional Responses, Perceived Value, and Behavioral Intentions in the Chain Restaurant Industry: The Moderating Role of Advertising-Induced Arousal. Int. J. Hosp. Manag. 2011, 30, 689–700. [Google Scholar] [CrossRef]
- Wolf, M.J. The Entertainment Economy: How Mega-Media Forces Are Transforming Our Lives; Penguin: London, UK, 1999; ISBN 9780140281750. [Google Scholar]
- Sit, J.; Merrilees, B.; Birch, D. Entertainment-seeking Shopping Centre Patrons: The Missing Segments. Int. J. Retail. Distrib. Manag. 2003, 31, 80–94. [Google Scholar] [CrossRef] [Green Version]
- Cupchik, G. The Role of Feeling in the Entertainment=Emotion Formula. J. Media Psychol. Theor. Methods Appl. 2011. [Google Scholar] [CrossRef]
- Oliver, M.B.; Raney, A.A. Entertainment as Pleasurable and Meaningful: Identifying Hedonic and Eudaimonic Motivations for Entertainment Consumption. J. Commun. 2011, 61, 984–1004. [Google Scholar] [CrossRef]
- Kim, H.; Niehm, L.S. The Impact of Website Quality on Information Quality, Value, and Loyalty Intentions in Apparel Retailing. J. Interact. Mark. 2009, 23, 221–233. [Google Scholar] [CrossRef]
- Zarantonello, L.; Schmitt, B.H. Using the Brand Experience Scale to Profile Consumers and Predict Consumer Behaviour. J. Brand Manag. 2010, 17, 532–540. [Google Scholar] [CrossRef]
- Klaus, P.; Maklan, S. Towards a Better Measure of Customer Experience. Int. J. Mark. Res. 2013, 55, 227–246. [Google Scholar] [CrossRef] [Green Version]
- Coelho, F.J.F.; Bairrada, C.M.; de Matos Coelho, A.F. Functional Brand Qualities and Perceived Value: The Mediating Role of Brand Experience and Brand Personality. Psychol. Mark. 2020, 37, 41–55. [Google Scholar] [CrossRef]
- Kim, M.-S.; Shin, D.-J.; Koo, D.-W. The Influence of Perceived Service Fairness on Brand Trust, Brand Experience and Brand Citizenship Behavior. Int. J. Contemp. Hosp. Manag. 2018, 30, 2603–2621. [Google Scholar] [CrossRef]
- Wiedmann, K.-P.; Labenz, F.; Haase, J.; Hennigs, N. The Power of Experiential Marketing: Exploring the Causal Relationships among Multisensory Marketing, Brand Experience, Customer Perceived Value and Brand Strength. J. Brand Manag. 2018, 25, 101–118. [Google Scholar] [CrossRef]
- Kotler, P.; Wong, V.; Saunders, J.; Armstrong, G. Principles of Marketing, Fourth Europian Edition; Pearson: London, UK, 2005; ISBN 9780273684565. [Google Scholar]
- Park, C.W.; Jun, S.Y.; Shocker, A.D. Composite Branding Alliances: An Investigation of Extension and Feedback Effects. J. Mark. Res. 1996, 33, 453–466. [Google Scholar] [CrossRef]
- Simonin, B.L.; Ruth, J.A. Bundling as a Strategy for New Product Introduction: Effects on Consumers’ Reservation Prices for the Bundle, the New Product, and Its Tie-In. J. Bus. Res. 1995, 33, 219–230. [Google Scholar] [CrossRef]
- Ferrell, O.C.; Hartline, M.D. Marketing Strategy: Text and Cases; South-Western Cengage Learning: Boston, MA, USA, 2014; ISBN 9781285170435. [Google Scholar]
- Stach, J. How Memorable Experiences Influence Brand Preference. Qual. Mark. Res. Int. J. 2017, 20, 394–415. [Google Scholar] [CrossRef]
- Su, Y.; Kunkel, T. Beyond Brand Fit: The Influence of Brand Contribution on the Relationship between Service Brand Alliances and Their Parent Brands. J. Serv. Manag. 2019, 30, 252–275. [Google Scholar] [CrossRef]
- Baloglu, S.; Busser, J.; Cain, L. Impact of Experience on Emotional Well-Being and Loyalty. J. Hosp. Mark. Manag. 2019, 28, 427–445. [Google Scholar] [CrossRef]
- Zarantonello, L.; Schmitt, B.H. The Impact of Event Marketing on Brand Equity. Int. J. Advert. 2013, 32, 255–280. [Google Scholar] [CrossRef] [Green Version]
- Lafferty, B.A.; Goldsmith, R.E.; Hult, G.T.M. The Impact of the Alliance on the Partners: A Look at Cause-Brand Alliances. Psychol. Mark. 2004, 21, 509–531. [Google Scholar] [CrossRef]
- Cegarra, J.-J.; Michel, G. Co-Branding: Clarification Du Concept. Rech. Appl. Mark. 2001, 16, 57–69. [Google Scholar] [CrossRef]
- Lee, J.K.; Lee, B.-K.; Lee, W.-N. The Effects of Country-of-Origin Fit on Cross-Border Brand Alliances. Asia Pac. J. Mark. Logist. 2018, 30, 1259–1276. [Google Scholar] [CrossRef]
- Newmeyer, C.E.; Ruth, J.A. Good Times and Bad: Responsibility in Brand Alliances. Eur. J. Mark. 2020, 54, 448–471. [Google Scholar] [CrossRef]
- Arnett, D.B.; Laverie, D.A.; Wilcox, J.B. A Longitudinal Examination of the Effects of Retailer–Manufacturer Brand Alliances: The Role of Perceived Fit. J. Mark. Manag. 2010, 26, 5–27. [Google Scholar] [CrossRef]
- Naidoo, V.; Hollebeek, L.D. Higher Education Brand Alliances: Investigating Consumers’ Dual-Degree Purchase Intentions. J. Bus. Res. 2016, 69, 3113–3121. [Google Scholar] [CrossRef]
- Samu, S.; Krishnan, H.S.; Smith, R.E. Using Advertising Alliances for New Product Introduction: Interactions between Product Complementarity and Promotional Strategies. J. Mark. 1999, 63, 57–74. [Google Scholar] [CrossRef]
- Delgado-Ballester, E.; Hernández-Espallardo, M. Building Online Brands through Brand Alliances in Internet. Eur. J. Mark. 2008, 42, 954–976. [Google Scholar] [CrossRef]
- Lin, Y. Evaluation of Co-branded Hotels in the Taiwanese Market: The Role of Brand Familiarity and Brand Fit. Int. J. Contemp. Hosp. Manag. 2013, 25, 346–364. [Google Scholar] [CrossRef]
- Lin, Y.-C.; Tsai, H.-N.; Lee, Y.-C. The Effects of Product Categories, Brand Alliance Fitness and Personality Traits on Customer’s Brand Attitude and Purchase Intentions: A Case of Spotify. J. Stat. Manag. Syst. 2020, 23, 677–693. [Google Scholar] [CrossRef]
- Aaker, D.A. Managing Brand Equity; Free Press: New York, NY, USA, 1991; ISBN 9780029001011. [Google Scholar]
- Cameron, T.A.; James, M.D. Estimating Willingness to Pay from Survey Data: An Alternative Pre-Test-Market Evaluation Procedure. J. Mark. Res. 1987, 24, 389–395. [Google Scholar] [CrossRef]
- Krishna, A. Effect of Dealing Patterns on Consumer Perceptions of Deal Frequency and Willingness to Pay. J. Mark. Res. 1991, 28, 441–451. [Google Scholar] [CrossRef] [Green Version]
- Rao, A.R.; Bergen, M.E. Price Premium Variations as a Consequence of Buyers’ Lack of Information. J. Consum. Res. 1992, 19, 412–423. [Google Scholar] [CrossRef]
- De Pelsmacker, P.; Driesen, L.; Rayp, G. Do Consumers Care about Ethics? Willingness to Pay for Fair-Trade Coffee. J. Consum. Aff. 2005, 39, 363–385. [Google Scholar] [CrossRef]
- Homburg, C.; Koschate, N.; Hoyer, W.D. Do Satisfied Customers Really Pay More? A Study of the Relationship between Customer Satisfaction and Willingness to Pay. J. Mark. 2005, 69, 84–96. [Google Scholar] [CrossRef]
- Priem, R.L. A Consumer Perspective on Value Creation. Acad. Manag. Rev. 2007, 32, 219–235. [Google Scholar] [CrossRef]
- Wei, S.; Ang, T.; Jancenelle, V.E. Willingness to Pay More for Green Products: The Interplay of Consumer Characteristics and Customer Participation. J. Retail. Consum. Serv. 2018, 45, 230–238. [Google Scholar] [CrossRef]
- Wu, L.; Fan, A.; He, Z.; Her, E. To Partner with Human or Robot? Designing Service Coproduction Processes for Willingness to Pay More. J. Hosp. Tour. Res. 2021. [Google Scholar] [CrossRef]
- Haumann, T.; Quaiser, B.; Wieseke, J.; Rese, M. Footprints in the Sands of Time: A Comparative Analysis of the Effectiveness of Customer Satisfaction and Customer-Company Identification over Time. J. Mark. 2014, 78, 78–102. [Google Scholar] [CrossRef]
- Tang, C.M.F.; Lam, D. The Role of Extraversion and Agreeableness Traits on Gen Y’s Attitudes and Willingness to Pay for Green Hotels. Int. J. Contemp. Hosp. Manag. 2017, 29, 607–623. [Google Scholar] [CrossRef]
- Prasad, S.; Gupta, I.C.; Totala, N.K. Social Media Usage, Electronic Word of Mouth and Purchase-Decision Involvement. Asia Pac. J. Bus. Adm. 2017, 9, 134–145. [Google Scholar] [CrossRef]
- Hennig-Thurau, T.; Gwinner, K.P.; Walsh, G.; Gremler, D.D. Electronic Word-of-Mouth via Consumer-Opinion Platforms: What Motivates Consumers to Articulate Themselves on the Internet? J. Interact. Mark. 2004, 18, 38–52. [Google Scholar] [CrossRef]
- Bickart, B.; Schindler, R.M. Internet Forums as Influential Sources of Consumer Information. J. Interact. Mark. 2001, 15, 31–40. [Google Scholar] [CrossRef]
- Verma, D.; Dewani, P.P. EWOM Credibility: A Comprehensive Framework and Literature Review. Online Inf. Rev. 2020, 45, 481–500. [Google Scholar] [CrossRef]
- Wu, T.-Y.; Lin, C.A. Predicting the Effects of EWOM and Online Brand Messaging: Source Trust, Bandwagon Effect and Innovation Adoption Factors. Telemat. Inform. 2017, 34, 470–480. [Google Scholar] [CrossRef]
- Delafrooz, N.; Rahmati, Y.; Abdi, M. The Influence of Electronic Word of Mouth on Instagram Users: An Emphasis on Consumer Socialization Framework. Cogent Bus. Manag. 2019, 6, 1606973. [Google Scholar] [CrossRef]
- Erkan, I.; Evans, C. The Influence of EWOM in Social Media on Consumers’ Purchase Intentions: An Extended Approach to Information Adoption. Comput. Hum. Behav. 2016, 61, 47–55. [Google Scholar] [CrossRef]
- Godey, B.; Manthiou, A.; Pederzoli, D.; Rokka, J.; Aiello, G.; Donvito, R.; Singh, R. Social Media Marketing Efforts of Luxury Brands: Influence on Brand Equity and Consumer Behavior. J. Bus. Res. 2016, 69, 5833–5841. [Google Scholar] [CrossRef]
- Kim, E.; Sung, Y.; Kang, H. Brand Followers’ Retweeting Behavior on Twitter: How Brand Relationships Influence Brand Electronic Word-of-Mouth. Comput. Hum. Behav. 2014, 37, 18–25. [Google Scholar] [CrossRef]
- Alhidari, A.; Iyer, P.; Paswan, A. Personal Level Antecedents of EWOM and Purchase Intention, on Social Networking Sites. J. Cust. Behav. 2015, 14, 107–125. [Google Scholar] [CrossRef]
- Chu, S.-C.; Sung, Y. Using a Consumer Socialization Framework to Understand Electronic Word-of-Mouth (EWOM) Group Membership among Brand Followers on Twitter. Electron. Commer. Res. Appl. 2015, 14, 251–260. [Google Scholar] [CrossRef]
- Kim, J.; Gupta, P. Emotional Expressions in Online User Reviews: How They Influence Consumers’ Product Evaluations. J. Bus. Res. 2012, 65, 985–992. [Google Scholar] [CrossRef]
- Ha, H.-Y.; Perks, H. Effects of Consumer Perceptions of Brand Experience on the Web: Brand Familiarity, Satisfaction and Brand Trust. J. Consum. Behav. 2005, 4, 438–452. [Google Scholar] [CrossRef]
- Wassler, P.; Wang, L.; Hung, K. Identity and Destination Branding among Residents: How Does Brand Self-congruity Influence Brand Attitude and Ambassadorial Behavior? Int. J. Tour. Res. 2019, 21, 437–446. [Google Scholar] [CrossRef]
- Sirgy, M.J.; Grewal, D.; Mangleburg, T.F.; Park, J.-O.; Chon, K.-S.; Claiborne, C.B.; Johar, J.S.; Berkman, H. Assessing the Predictive Validity of Two Methods of Measuring Self-Image Congruence. J. Acad. Mark. Sci. 1997, 25, 229–241. [Google Scholar] [CrossRef]
- Mathwick, C.; Malhotra, N.; Rigdon, E. Experiential Value: Conceptualization, Measurement and Application in the Catalog and Internet Shopping Environment. J. Retail. 2001, 77, 39–56. [Google Scholar] [CrossRef]
- Van-Tien Dao, W.; Nhat Hanh Le, A.; Ming-Sung Cheng, J.; Chao Chen, D. Social Media Advertising Value: The Case of Transitional Economies in Southeast Asia. Int. J. Advert. 2014, 33, 271–294. [Google Scholar] [CrossRef]
- Zhang, L.; Zhao, H. Personal Value vs. Luxury Value: What Are Chinese Luxury Consumers Shopping for When Buying Luxury Fashion Goods? J. Retail. Consum. Serv. 2019, 51, 62–71. [Google Scholar] [CrossRef]
- Sthapit, E.; Coudounaris, D.N.; Björk, P. Extending the Memorable Tourism Experience Construct: An Investigation of Memories of Local Food Experiences. Scand. J. Hosp. Tour. 2019, 19, 333–353. [Google Scholar] [CrossRef]
- Helgeson, J.G.; Supphellen, M. A Conceptual and Measurement Comparison of Self-Congruity and Brand Personality: The Impact of Socially Desirable Responding. Int. J. Mark. Res. 2004, 46, 205–233. [Google Scholar] [CrossRef]
- Saha, S.K.; Zhuang, G.; Li, S. Will Consumers Pay More for Efficient Delivery? An Empirical Study of What Affects E-Customers’ Satisfaction and Willingness to Pay on Online Shopping in Bangladesh. Sustainability 2020, 12, 1121. [Google Scholar] [CrossRef] [Green Version]
- Serra-Cantallops, A.; Ramón Cardona, J.; Salvi, F. Antecedents of Positive EWOM in Hotels. Exploring the Relative Role of Satisfaction, Quality and Positive Emotional Experiences. Int. J. Contemp. Hosp. Manag. 2020, 32, 3457–3477. [Google Scholar] [CrossRef]
- Sarstedt, M.; Ringle, C.M.; Hair, J.F. Partial Least Squares Structural Equation Modeling. In Handbook of Market Research; Homburg, C., Klarmann, M., Vomberg, A., Eds.; Springer International Publishing: Cham, Switzerland, 2017; pp. 1–40. ISBN 9783319055428. [Google Scholar]
- Hair, J.F.; Risher, J.J.; Sarstedt, M.; Ringle, C.M. When to Use and How to Report the Results of PLS-SEM. Eur. Bus. Rev. 2019, 31, 2–24. [Google Scholar] [CrossRef]
- Memon, M.A.; Ramayah, T.; Cheah, J.-H.; Ting, H.; Chuah, F.; Cham, T.H. Pls-Sem Statistical Programs: A Review. J. Appl. Struct. Equ. Modeling 2021, 5, i–xiv. [Google Scholar] [CrossRef]
- Henseler, J.; Ringle, C.M.; Sarstedt, M. A New Criterion for Assessing Discriminant Validity in Variance-Based Structural Equation Modeling. J. Acad. Mark. Sci. 2015, 43, 115–135. [Google Scholar] [CrossRef] [Green Version]
- Hu, L.; Bentler, P.M. Cutoff Criteria for Fit Indexes in Covariance Structure Analysis: Conventional Criteria versus New Alternatives. Struct. Equ. Modeling Multidiscip. J. 1999, 6, 1–55. [Google Scholar] [CrossRef]
- Nitzl, C.; Roldan, J.L.; Cepeda, G. Mediation Analysis in Partial Least Squares Path Modeling: Helping Researchers Discuss More Sophisticated Models. Ind. Manag. Data Syst. 2016, 116, 1849–1864. [Google Scholar] [CrossRef]
- Cardinali, S.; Travaglini, M.; Giovannetti, M. Increasing Brand Orientation and Brand Capabilities Using Licensing: An Opportunity for SMEs in International Markets. J. Knowl. Econ. 2019, 10, 1808–1830. [Google Scholar] [CrossRef]
- Mas, F.J.; Nicolau, J.L.; Calderón, A. Brand Alliances and Stock Reactions. J. Bus. Bus. Mark. 2021, 28, 3–13. [Google Scholar] [CrossRef]
- Zinko, R.; de Burgh-Woodman, H.; Furner, Z.Z.; Kim, S.J. Seeing Is Believing: The Effects of Images on Trust and Purchase Intent in EWOM for Hedonic and Utilitarian Products. J. Organ. End User Comput. 2021, 33, 85–104. [Google Scholar] [CrossRef]

Publisher’s Note: MDPI stays neutral with regard to jurisdictional claims in published maps and institutional affiliations. |
© 2022 by the authors. Licensee MDPI, Basel, Switzerland. This article is an open access article distributed under the terms and conditions of the Creative Commons Attribution (CC BY) license (https://creativecommons.org/licenses/by/4.0/).