Article

Effect of Electrochemically Activated Mixing Water on Strength and Pore Structure of Fly-Ash Autoclaved Aerated Concrete

1
Department of Civil Engineering and Building Materials, Satbayev University, Almaty 050000, Kazakhstan
2
Department of Civil Engineering and Building Materials, University North, 42000 Varazdin, Croatia
3
School of Earth Sciences, D. Serikbayev East-Kazakhstan Technical University, Ust-Kamenogorsk 070000, Kazakhstan
4
Department of Architecture and Construction, Korkyt Ata Kyzylorda University, Kyzylorda 120000, Kazakhstan
*
Authors to whom correspondence should be addressed.
Constr. Mater. 2026, 6(1), 14; https://doi.org/10.3390/constrmater6010014
Submission received: 8 January 2026 / Revised: 9 February 2026 / Accepted: 14 February 2026 / Published: 22 February 2026

Abstract

This study assessed whether electrochemical activation of mixing water can enhance autoclaved aerated concrete (AAC), in which fly ash replaces sand as the siliceous component. Mixing water was electrolyzed in a diaphragm-type “Melesta” unit to obtain the catholyte and anolyte, and fly ash was pre-exposed to the catholyte for up to 15 min. The material’s behavior was evaluated using slurry flow tests, scanning electron microscopy, Fourier-transform infrared spectroscopy, macropore-uniformity analysis, mercury intrusion porosimetry, and shrinkage and short-term durability indicators. At an approximately constant density class near 600 kg/m3, the catholyte-pretreated fly-ash AAC mixes showed a near-monotonic increase in compressive strength with increasing fly-ash replacement (relative to the sand-based reference), while fresh-mixture fluidity decreased. The pore structure became more uniform, as indicated by a decrease in the standard deviation of pore diameters from 0.175 to 0.133 mm, and porosimetry indicated a higher micro-porosity fraction in fly-ash AAC than in sand-based AAC. Capillary shrinkage remained essentially unchanged, and short-term durability indicators (durability coefficients after 25 cycles) showed a small improvement. Overall, electrochemically activated water promoted a more regular pore system and stronger interpore walls under autoclave curing, supporting higher fly-ash utilization without loss of dimensional stability. The results are limited to one fly-ash source (Ekibastuz TPP); transferability should be verified using ashes with different glass content, fineness, and carbon/LOI.

1. Introduction

Fly ash is produced in large quantities as a residue of coal combustion at thermal power plants, including coal-fired power stations and combined heat and power plants, and managing this waste remains one of today’s most serious environmental issues. Global generation is estimated at up to 800 million tons per year [1]. However, longer-term projections are uncertain because they depend on regional coal demand, which recent outlooks indicate has plateaued and may decline slightly by 2030; therefore, the value of 2100 million tons by 2030 [2] should be regarded as an upper-bound scenario rather than a single definitive forecast. The challenge is especially severe in coal-dependent economies such as China and India, which together account for more than 200 million tons of ash annually [3]. In Kazakhstan, only about 1.4% of fly ash is recycled, underscoring the need for practical and effective disposal and utilization solutions [4]. Beyond the immediate environmental burden, the steady accumulation of ash also increases long-term liabilities for power producers and municipalities, since storage facilities must be monitored and maintained for decades while the volume of deposited material continues to grow.
At present, the dominant practice is stockpiling fly ash in ash dumps or landfills, a route that can harm ecosystems through contamination of soils, surface waters, groundwater, and air [5]. Wind-driven dusting, leaching of soluble compounds, and the occupation of large tracts of land make ash disposal sites a persistent source of risk for surrounding areas. Such storage also demands substantial land resources and continuous financial inputs for operation, monitoring, and rehabilitation, yet it does not create economic value. Consequently, many countries are prioritizing the development of new approaches for processing and reusing this industrial by-product, shifting attention from simple disposal toward circular-use strategies in which ash is treated as a secondary raw material [6,7,8]. In this context, the construction sector is often highlighted, because it can consume large volumes of mineral-based materials and because cementitious systems can incorporate fine aluminosilicate powders in different roles.
One of the most viable directions is the use of fly ash in construction, particularly as a raw component in aerated concrete and other cellular concretes [9]. Fly ash is attractive for cementitious systems because it often combines a high specific surface area, a porous microstructure, and an amorphous silica-rich phase that provides notable pozzolanic activity [10,11]. Owing to these features, it can serve not only as a partial replacement for natural sand but also as a performance-enhancing ingredient in porous concrete, improving properties such as strength development, resistance to aggressive exposure, and thermal insulation behavior [12,13]. These benefits are typically observed when the ash has sufficient amorphous (glassy) content and fineness and when curing/activation conditions promote pozzolanic reaction; otherwise, fly ash may behave largely as a low-reactivity filler at early aging-process stages. In addition, replacing part of the natural aggregate fraction with an industrial by-product can reduce extraction pressure on natural resources, which is an increasingly important consideration for sustainable construction.
Practical experience in several European countries, including the Czech Republic and Hungary, shows that fly ash can be successfully incorporated into aerated concrete production, lowering material costs while maintaining or improving performance. In Hungary, for instance, aerated concrete made with fly ash has been reported with densities in the range of 500–900 kg/m3 and compressive strength reaching 7.5 MPa, supporting the view that fly ash can participate actively in hydration-related processes rather than acting solely as an inert filler [14,15]. These observations reinforce the idea that, when properly integrated into mixture design and curing regimes, fly ash can contribute to the formation of a refined microstructure, which is particularly relevant for cellular materials in which the integrity of inter-pore partitions strongly controls mechanical performance.
Despite these advantages, fly ash may exhibit limited intrinsic reactivity under conventional mixing and curing conditions, which can restrict its effectiveness within conventional concrete technologies. Variability in mineralogical composition, particle size distribution, and the proportion of amorphous phase may further complicate its consistent use in industrial production. For this reason, various activation strategies are applied to enhance its reactivity and strengthen its interaction with cement hydrates [16,17]. Such approaches are intended to accelerate dissolution of the reactive phases and to promote the formation of additional binding products that densify the matrix and improve early and long-term properties.
Among the options discussed in the literature, electrochemical activation of mixing water, particularly slurry water, is considered a promising route [18]. Electrolysis yields two products, anolyte and catholyte, each characterized by distinct physicochemical properties, including modified pH and electrical conductivity and elevated reactivity compared with untreated water [19,20]. Because these electrolyzed solutions exist in a metastable condition, they can intensify dissolution, hydration, and recrystallization phenomena in cement-based systems, which is especially relevant when the aim is to stimulate the participation of fly ash in early-age reactions. In contrast with conventional chemical activation using acidic or alkaline reagents, electrochemical activation is reported to provide a more efficient (i.e., achieving comparable activation/dispersion effects at lower chemical input and with more uniform action throughout the slurry) and more uniform influence on fly ash, increasing its activity and improving the quality of the resulting material [21]. The metastable nature of these solutions is again emphasized as a key factor accelerating dissolution, hydration, and recrystallization processes within cement matrices [21]. In concrete applications, electrochemically activated solutions have been associated with higher strength, faster early hardening, and the formation of stronger inter-pore partitions, which is particularly relevant for cellular materials in which microstructural continuity governs both load-bearing capacity and durability [22]. From an applied perspective, this line of research is appealing because it aims to improve material properties while avoiding the handling and disposal issues associated with strong chemical activators. Overall, prior studies attribute these improvements to changes in early hydration kinetics and microstructural densification under altered solution chemistry (pH/conductivity), as well as the metastability of catholyte/anolyte [19,20,21,22]. However, the evidence remains limited for AAC systems under autoclave curing, especially when fly ash fully replaces sand and when ash is pre-exposed to catholyte prior to mixing. Therefore, additional work is needed to connect electrochemical activation with pore-structure descriptors (macropore uniformity and MIP-derived pore fractions) and the resulting mechanical/durability indicators in fly-ash AAC [18,19,20,21,22].
Against this background, the present study examines how electrochemical activation of mixing water affects the physical and technical properties of autoclaved aerated concrete (AAC) in which fly ash is used as an active siliceous component, and it compares these results with those obtained for conventional aerated concrete produced using sand. The experimental program evaluates changes in strength and density and examines pore-structure features relevant to thermal insulation (thermal conductivity was not measured in this study), and it also investigates, at the structural level, the mechanisms governing interactions between electrochemically activated solutions and fly-ash constituents. Particular attention is paid to whether the use of the anolyte and catholyte can improve the efficiency of fly-ash involvement in hydration and autoclave-related reactions, thereby supporting both performance gains and higher waste-utilization rates. The outcomes are expected to inform the advancement of fly-ash processing and utilization technologies, supporting the development of more efficient and environmentally responsible building-material production methods. In a broader sense, this contributes to more sustainable construction practices, reduced environmental impact, and improved solutions for industrial waste management, a field which remains economically and ecologically significant at the global level.

2. Materials and Methods

The experimental program was implemented in seven consecutive stages: (1) selection and standard-based testing of raw materials; (2) assessment of fly-ash morphology and rheological behavior; (3) activation of fly ash through electrochemical treatment of mixing water, followed by infrared spectroscopy; (4) mix optimization for cellular concrete with a target density of 600 kg/m3 via the water-to-solids ratio and rheology monitoring; (5) evaluation of microporosity, for mixtures with sand or fly ash; (6) analysis of the influence of microporous structure on material performance; and (7) estimation of capillary shrinkage in the produced specimens.

2.1. Raw Materials and Compliance with Standards

Portland cement CEM I 42.5 N (Heidelberg Cement, LLP, Shymkent, Kazakhstan), construction gypsum grade G-7 (Gipsum, JSC, Taraz, Kazakhstan), air lime (Sastobe plant, Turkistan region, Kazakhstan), dune sand from the Shardara deposit (Shardara, Kazakhstan), fly ash from the Ekibastuz TPP (Ekibastuz, Kazakhstan), aluminum powder (gas-forming agent) PAG-1 (Temirtau Metallurgical Plant, Temirtau, Kazakhstan), and technical water were used. The binder complied with the standards described in [23]. Its main characteristics are summarized in Table 1. All mixtures in this study were prepared using cement from the same production batch. Table 2 reports the oxide composition of this batch (chemical analysis is per the methods described in [24]). Additionally, fineness, normal consistency, and setting times were verified using procedures from [25,26].
Gypsum conformed to the standards in [27] and the declared properties met the requirements described in [28] (Table 3). Lime was used as an additional binder in accordance with [29] (slaking temperature 65 °C, slaking time 20 min, activity 75%); its chemical composition is shown in Table 4.
Aluminum powder PAG-1, the gas-forming agent, complied with the standards described in [30], had a silver-grey appearance, contained no visible foreign inclusions, had a bulk density of about 0.15–0.30 g/cm3, and contained 85–93% active aluminum.
The dune sand differed from conventional sands in mineralogy and grading. Its mineralogical and petrographic composition was determined per the methodology described in [31], with quartz and feldspar (orthoclase-dominant) prevailing, alongside limestone and minor clay fragments. Bulk density was 1420–1440 kg/m3, and true density was 2.61–2.63 g/cm3. The grading per the approach described in [32] is provided in Table 5.
Fly ash was used as a full replacement of the siliceous component (sand) and was selected in accordance with [33,34]. Its chemical composition is shown in Table 6. Per the standard described in [34], coal ash content was up to 40%, the specific surface area was 2800–3000 cm2/g, the residue on the 0.045 mm sieve was 21% by mass, and the bulk density was 750 kg/m3. Additional limits were also met (SiO2 + Al2O3 + Fe2O3 ≥ 70%, free CaO ≤ 5%, MgO ≤ 5%, loss on ignition ≤ 5%, etc.). While EN 450 provides conformity criteria for fly ash used in conventional concrete, AAC performance under aeration and autoclaving can also depend on AAC-specific factors such as ash fineness/glassy-phase reactivity, LOI/unburned carbon (water demand), and compatibility with aluminum gas formation. Therefore, in this study these aspects were controlled operationally by using a single, industrially supplied fly-ash source (Ekibastuz TPP) and keeping the aeration agent and W/S constant across all compositions.
Technical water complied with the standards described in [35].

2.2. Fly-Ash Morphology and Mixture Rheology

Fly-ash morphology was examined according to the methods described in [36], using a scanning electron microscope (SEM) JSM-7000 (JEOL Ltd., Tokyo, Japan) equipped with INCA Energy (EDS) and INCA Wave (WDS). The microanalysis system enabled quantitative elemental analysis over 0.001–100 wt.% with ~10 μm lateral locality.
The workability of the fresh cellular mixture was determined, following [27], by using a Suttard viscometer. The mixture was poured into the cone with the outlet closed, and then the gate was opened, and the mixture spread freely on a glass plate marked with concentric circles. Two orthogonal spread diameters were measured and averaged; mobility was judged from the spread, and homogeneity from the spot shape. This spread-based test was selected as a rapid, reproducible QC-type workability indicator for cellular mixtures, in which entrained/generating gas and fast structuration can complicate rotational rheometry. We aimed to compare relative mixture mobility across compositions under identical processing conditions, rather than to fully characterize the flow curve; spread tests are widely used for aerated/foam cementitious systems and can be related to yield-stress-dominated flow behavior [37].

2.3. Electrochemical Activation of Mixing Water and FTIR Analysis

Electrochemical treatment of the mixing water was performed using a “Melesta” electrolysis device (Ufa, Russia) [38]. The device includes a main vessel, an internal vessel separated by a diaphragm, and metallic electrodes (a stainless-steel cathode and a ruthenium-oxide-coated titanium anode). Technical water (0.8 L) was electrolyzed as in [39] until the water temperature reached 35 °C. The electrolysis endpoint of 35 °C was selected as a practical, reproducible operating condition (used as the electrolysis endpoint) to standardize the treatment intensity while keeping the treated water close to typical mixing temperatures and minimizing unintended thermal effects during mixing. After electrolysis, the solution in the main vessel became alkaline (catholyte, pH = 10.2), while the solution in the internal vessel became acidic (anolyte, pH = 2.6). The pH values were measured using a calibrated pH meter immediately after electrolysis (at laboratory temperature) and the treated water was used for mixing without storage; therefore, the reported pH corresponds to freshly prepared catholyte/anolyte and any pH drift over time was not relevant within the preparation-to-mixing interval.
Fly ash was used in the as-received (air-dry) condition; no additional drying was performed before catholyte exposure. To activate fly ash, it was pre-exposed to the catholyte for up to 15 min, then introduced into the mix together with the mixing water. The structure of the activated fly-ash compounds was examined by Fourier-transform infrared spectroscopy using a Varian 640-IR spectrometer (Varian, Inc., Palo Alto, CA, USA), following the guidance in [40].

2.4. Mix Design for Cellular Concrete with Target Density 600 kg/m3

Mixtures were proportioned according to the method described in [41]. The empirical coefficients used in this algorithm are not universal and are applicable to the specific raw materials employed in this study; they should be re-verified if materials are changed.
The fly-ash-to-cement mass ratio ( F A / C ) for 1 m3 of mixture was set within the range of 0.5–1.0, and the water-to-solids ratio ( W / S ) was selected from values within the range of 0.40–0.65 depending on the required strength, with lower W / S corresponding to higher design strength.
The mold cavity volume ( V f , m3) was calculated as:
V f = a   ×   b   ×   h ,
where: a —inner width, m; b —inner length, m; h —inner height.
The dry density of the hardened material ( ρ c , kg/m3), the mass of fresh mix ( m c m , kg), and the binder ( C , kg) and water ( W , kg) contents were calculated using the algorithm in [41]. For brevity, only the final working expressions used in the calculations are given below (Equations (2)–(7)):
ρ c = m c m   W   +   C     ×   k c b V f ,
C = ρ c × V f   ( 1.15 + ( F A / C ) ) ,
S = C + F A ,
W = S × ( W / S ) ,
W s u s = 15 × G ,
W m = W W s u s ,
where: k c b —empirical coefficient characterizing the relative content of chemically bound water in cement, taken in our case to be equal to 0.15; G —the consumption of aluminum powder PAG-1, noting that factor 15 in Equation (6) reflects the experimentally chosen water amount ( W s u s , kg) used in preparing the aluminum suspension (smaller water contents led to visibly non-uniform dispersion); W m —mixing water consumption. A brief sensitivity check showed that varying k c b within 0.10–0.20 changes the calculated chemically bound water by ±10 kg/m3 for the cement dosage used here (200 kg/m3), i.e., about ±3% of the total mixing water at W/S = 0.6; therefore, this assumption does not affect the comparative trends discussed in Section 3.
The aluminum powder content and the pre-expansion volume of the poured mix were determined as
G =   V f   V a c . m 0.25 × k e x p ,
V a c . m = F A ρ F A . t + C ρ C . t + W ρ W ,
where: k e x p —the expansion coefficient determined according to [41]; V a c . m —the poured mixture volume before gas formation; ρ F A . t , ρ C . t , and ρ W —the true densities of fly ash (2670 kg/m3), cement (3100 kg/m3), and water (1000 kg/m3), respectively.
Gas generation in cement-based cellular concrete proceeds due to the reaction of PAG-1 with Ca(OH)2 in the highly alkaline pore solution. In the fresh mix (pre-expansion stage), Ca(OH)2 is provided predominantly by rapid hydration of free CaO from cement and/or added quicklime; therefore, expressing the gas-generation capacity in terms of “free CaO equivalent” is a practical approximation (although aluminum can also react with Ca(OH)2 formed from early cement hydration). When F A / C is high (reduced binder content), or the cement has a low free-CaO level, additional quicklime is introduced as recommended in [41]. The gas-generation reaction was considered as
3 C a ( O H ) 2 + 2 A l + 6 H 2 O = 3 H 2 + 3 C a O · A l 2 O 3 · 6 H 2 O ,
where: 3 C a O · A l 2 O 3 · 6 H 2 O denotes calcium aluminate hydrate (C3AH6, hydrogarnet).
From molar-mass relations, the CaO-to-Al mass requirement and the practical lime dosage were calculated using
m C a O = m A l 54 × 168.3 ,
L = G × A G 54 × A L × 168.3
If the cement contained its own active CaO, only a part of quicklime was added:
L = L C × ω C a O A L
Hydration of CaO was represented by
C a O + H 2 O = C a ( O H ) 2 ,
and the required additional water for lime hydration was calculated as
m H 2 O = m C a O 56.1 × 18 ,
W G . L = L × A L 56.1 × 18
When the mixture was corrected for added lime, the fly-ash amount was reduced by the added-lime mass, and mixing water was increased by the amount of water required for lime hydration.

2.5. Macroporosity Evaluation of Cellular Concrete

Macroporous structure quality was assessed using a method proposed in [42] (one developed at the V. Shukhov Belgorod State Technological University, Belgorod, Russia). The approach fills surface-cut pores with milled amorphous carbon, captures the surface image using a digital camera, and then processes the image for quantitative porosity analysis. The use of amorphous carbon was motivated by its high dispersion, enabling a more complete pore filling than in water-based pigment mixtures, where water surface tension hinders pigment entry into fine pores. In [42], the proposed method was quantitatively benchmarked against conventional image-based techniques (e.g., ImageJ v1.46r/CellProfiler v4.0.7, as used in [43]) and showed high agreement. In the present study, the method is applied primarily for comparative assessment of pore-structure uniformity between mixtures under identical imaging and processing conditions.
For calibration, cellular concrete specimens with a density of 600 kg/m3 and a constant siliceous-component-to-binder ratio of 2:1 were used. The autoclave treatment was 2 + 8 + 2 h at 0.8 MPa and at 174.5 °C. The macroporous structure was then evaluated for different fly-ash-to-sand proportions within the siliceous component.

2.6. Microporous Structure and Pore-Size Distribution

To quantify water-retention capacity within the capillary-porous system, pore-size distribution was evaluated by mercury intrusion porosimetry (MIP) focused on pore sizes in the 1.5–300 μm range, which is typical for aerated and foamed concretes. Pore-space measurements were performed based on the mercury intrusion porosimeter concept:
R = 2 γ · cos θ P ,
where: γ —mercury surface tension, N/m; R —pore radius, mm; θ —contact angle, rad; P —intrusion pressure, Pa.
PASCAL 140 W Ultra Macro (3.8–900 μm) and PASCAL 240 (0.0074–15 μm) mercury porosimeters (Thermo Fisher Scientific, Waltham, MA, USA) were used to measure porosity in the 1.5–300 μm range with automated vacuum application, mercury filling, controlled pressure increase up to 200 MPa, data capture, and subsequent transfer of the data to a computer.
The benefits of this method include a standardized measurement framework [44], reduced analysis time compared with gas adsorption [45], and broad applicability; mercury porosimetry is widely considered suitable for macropores and large mesopores [46,47].
Capillary diameter ( d , mm) was estimated by Equation (18):
d = 4   ×   σ   × cos θ H   ×   ρ   ×   q ,
where: σ —surface tension of the liquid, N/m; ρ —density of the liquid, kg/m3; θ —wetting angle, rad (for aerated concrete, it is equal to 1, i.e., complete wetting); H —water retention capacity of concave menisci, in centimeters of water column (equal to the capillary tension), Pa; q —acceleration due to gravity, m/s2.

2.7. Capillary Shrinkage Assessment

Given that the porous structure of cellular concrete can promote cracking under humidity fluctuations, shrinkage driven by capillary forces was estimated (calculated) using A.E. Sheikin’s theory [48]. The shrinkage value ( ε c y ) was calculated as
ε c y = 2 σ 12 r × ω × 1 E 0 × W ,
where: σ 12 —surface tension, N/m; ω —wetted-pore-area fraction; r —capillary radius at a given relative humidity, mm; E 0 —elastic modulus under all-round compression, MPa; W —moisture-content gradient between internal and near-surface layers, %. Because ε c y is a calculated estimate based on Equation (19) and input parameters, small differences on the order of 0.01–0.02 mm/m should be treated as being within expected uncertainty (parameter scatter/rounding) and interpreted primarily in a comparative sense.

3. Results and Discussion

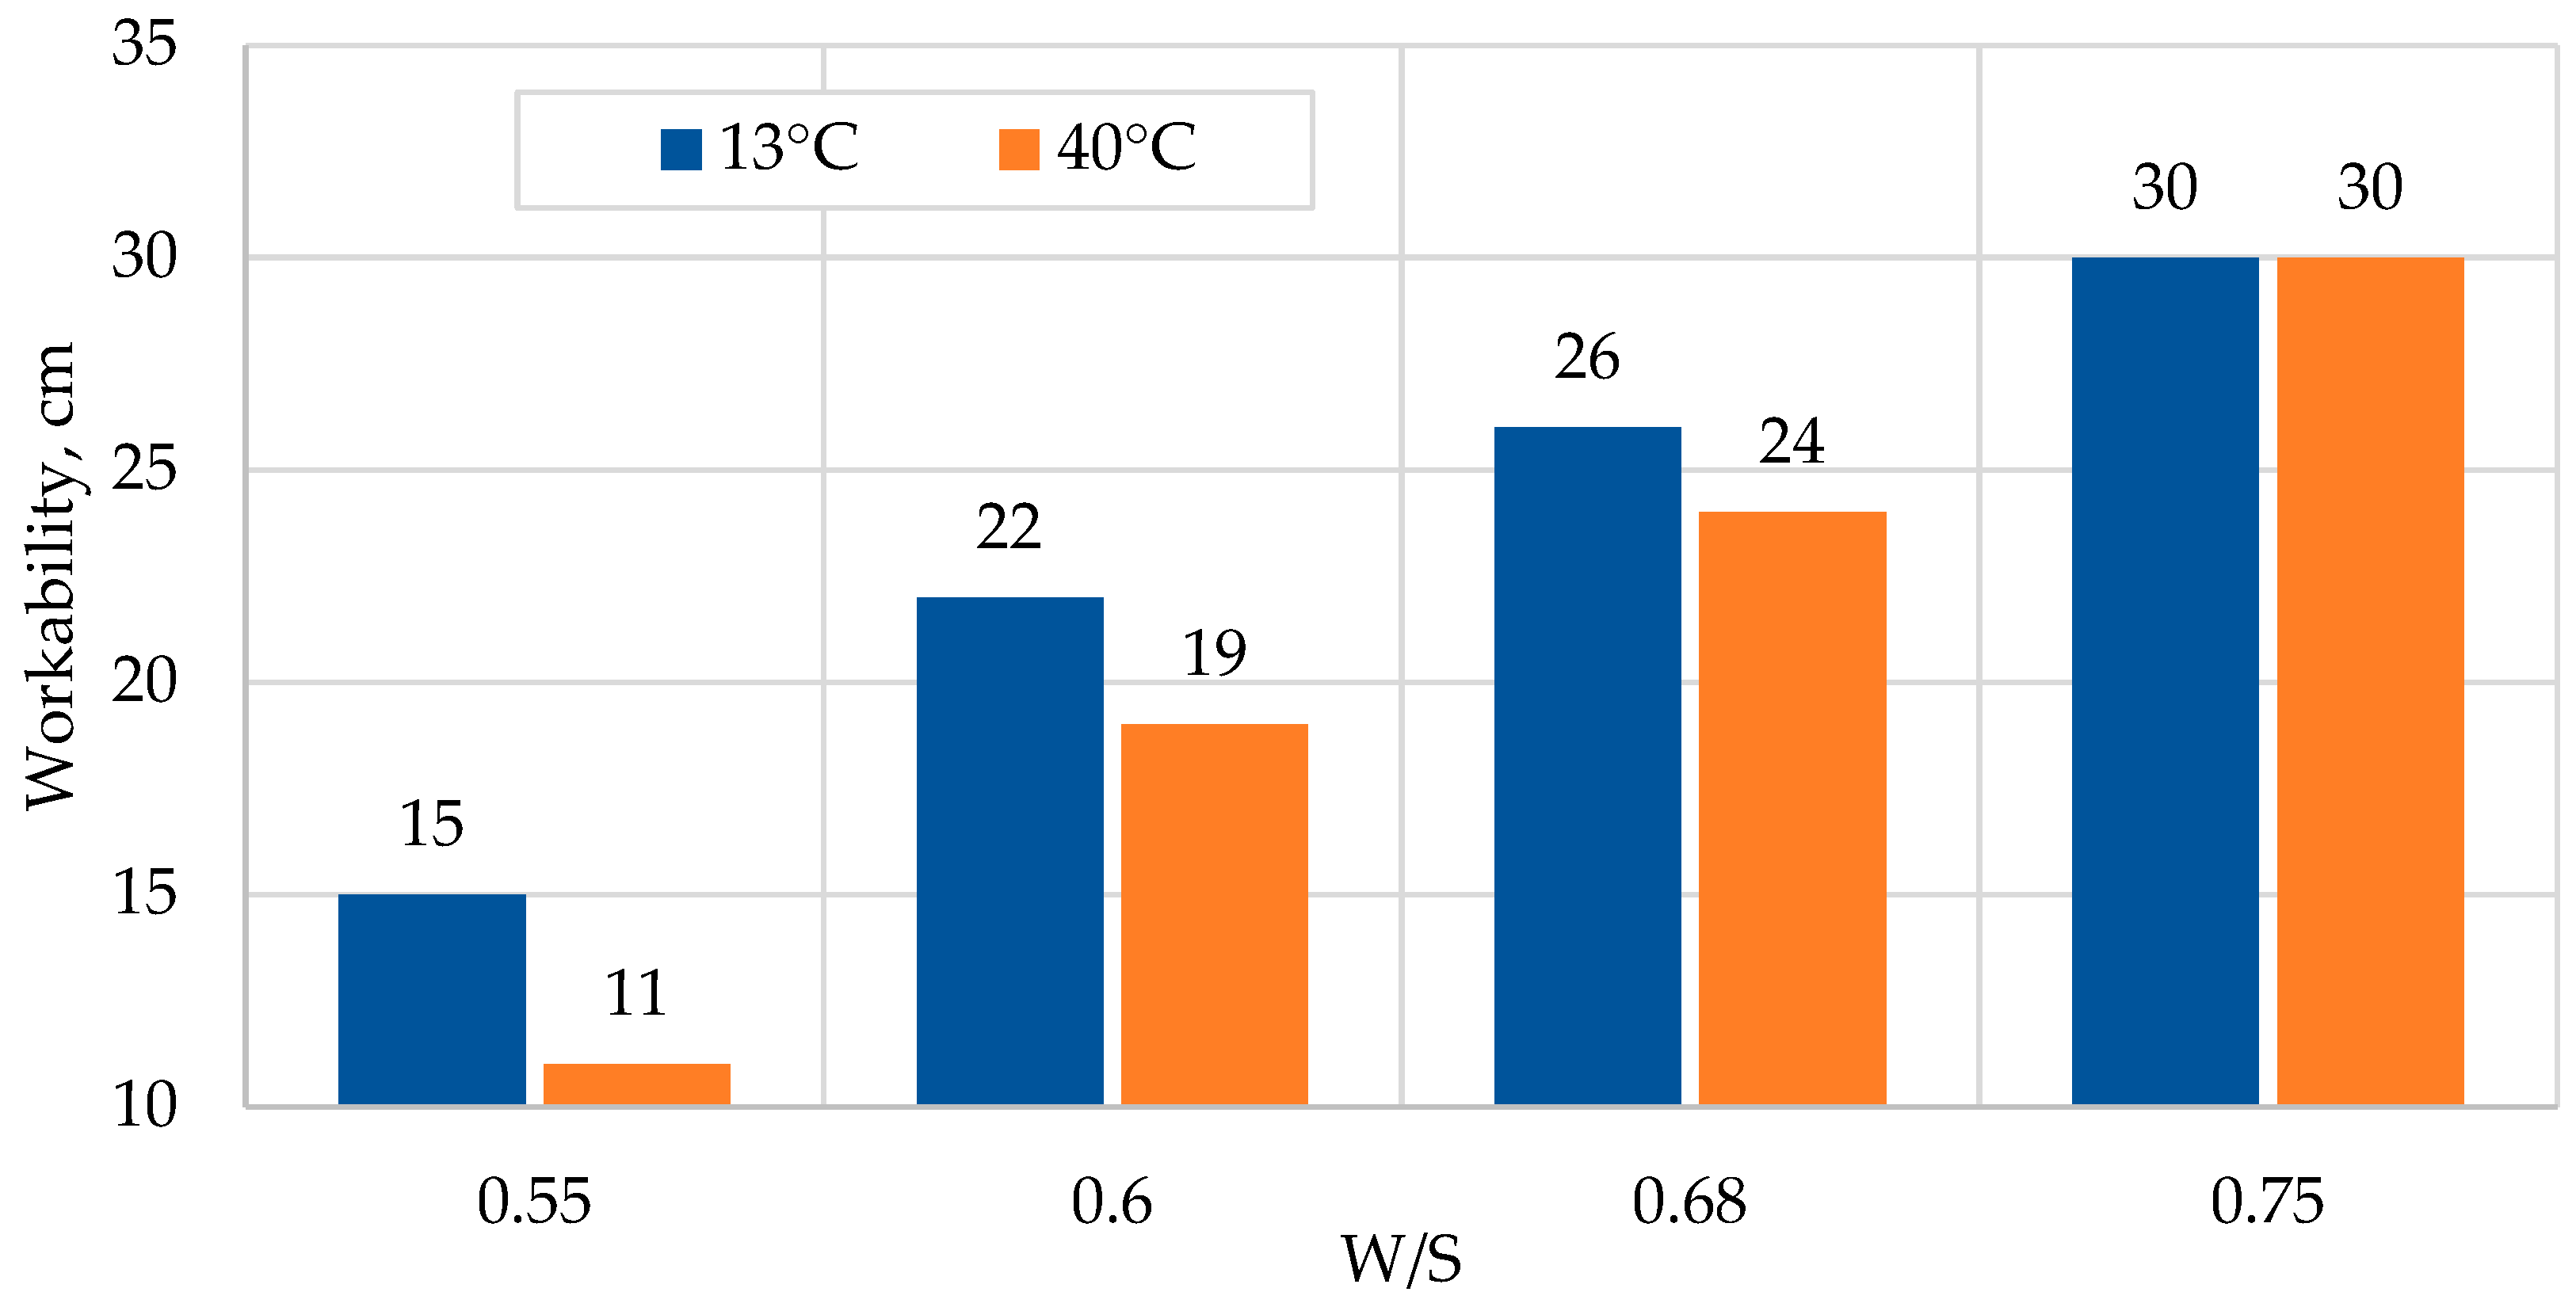
Fresh-mixture workability was first tuned by jointly varying the W/S and the mix temperature, because both parameters directly govern slurry viscosity and the kinetics of the early reactions that occur before pore stabilization. Figure 1 shows that, at relatively low W/S, raising the temperature tends to reduce the spread diameter (i.e., workability), which is consistent with faster early hydration and a quicker viscosity build-up in the system. At higher W/S ratios (around 0.75), the spread becomes less sensitive to temperature because the excess free water compensates for the accelerated structure formation, keeping the mixture mobile over the same time window.
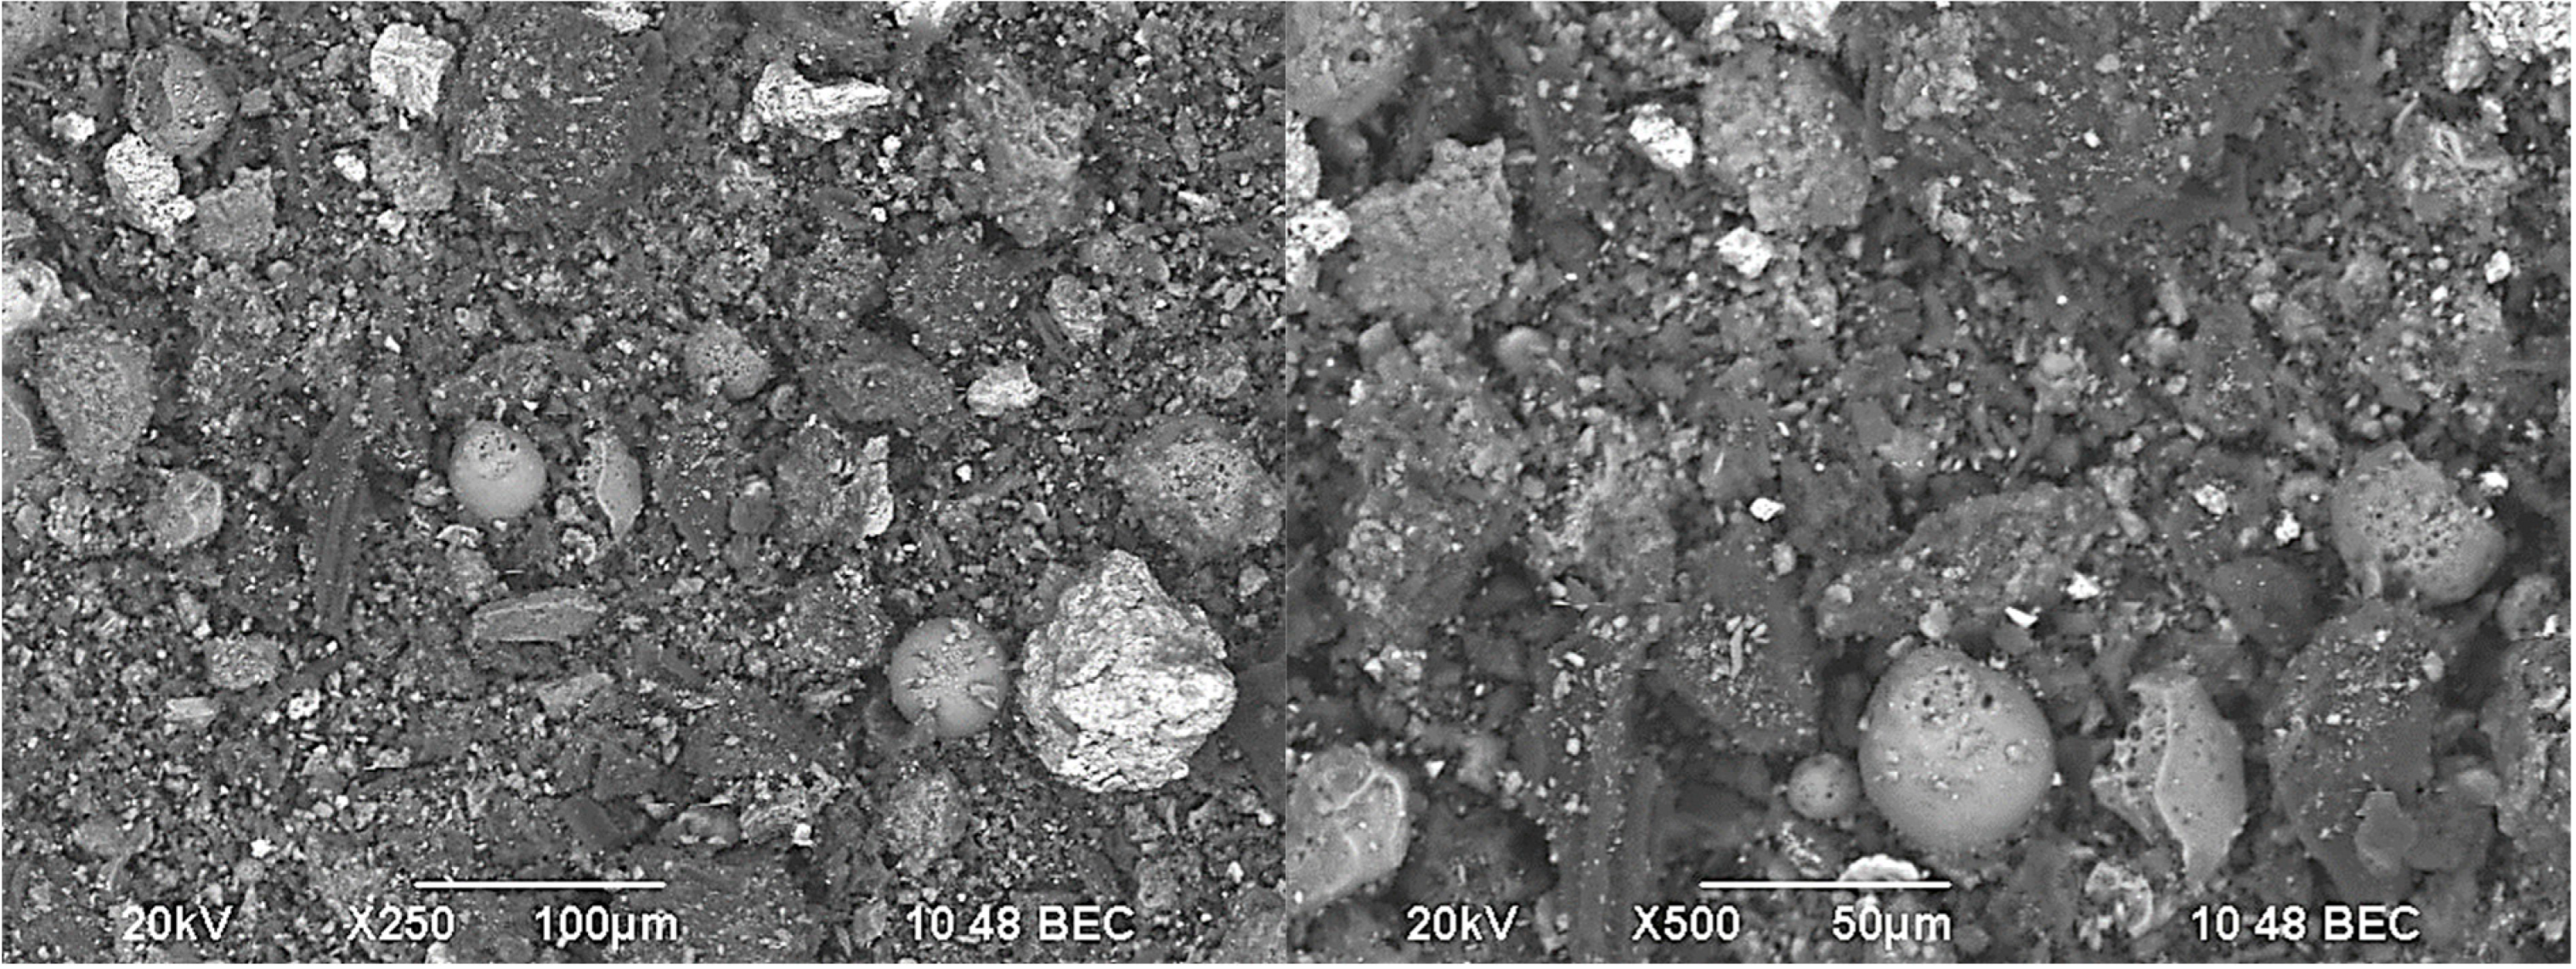
The microstructure of Ekibastuz fly ash helps explain why the mixture rheology changes once the sand is replaced. SEM observations (Figure 2) indicate a mixed particle population: (i) spherical microspheres (roughly 10–60 μm) formed by melting and rapid cooling during combustion, and (ii) irregular, silica-containing fragments and porous, partially amorphous particles with a developed surface. Such morphology is typical for coal fly ash, as reported in broader reviews, and it implies a dual rheological effect: microspheres can reduce internal friction (a “ball-bearing” contribution), while porous and highly developed surfaces can increase water demand and accelerate flocculation if the free water levels become insufficient. In practice, the experimental spread values decreased with increasing fly-ash replacement under otherwise comparable conditions (Table 7 and Table 8), meaning that the water-demand and structuration effects dominated over any lubrication benefit in the studied binder system.
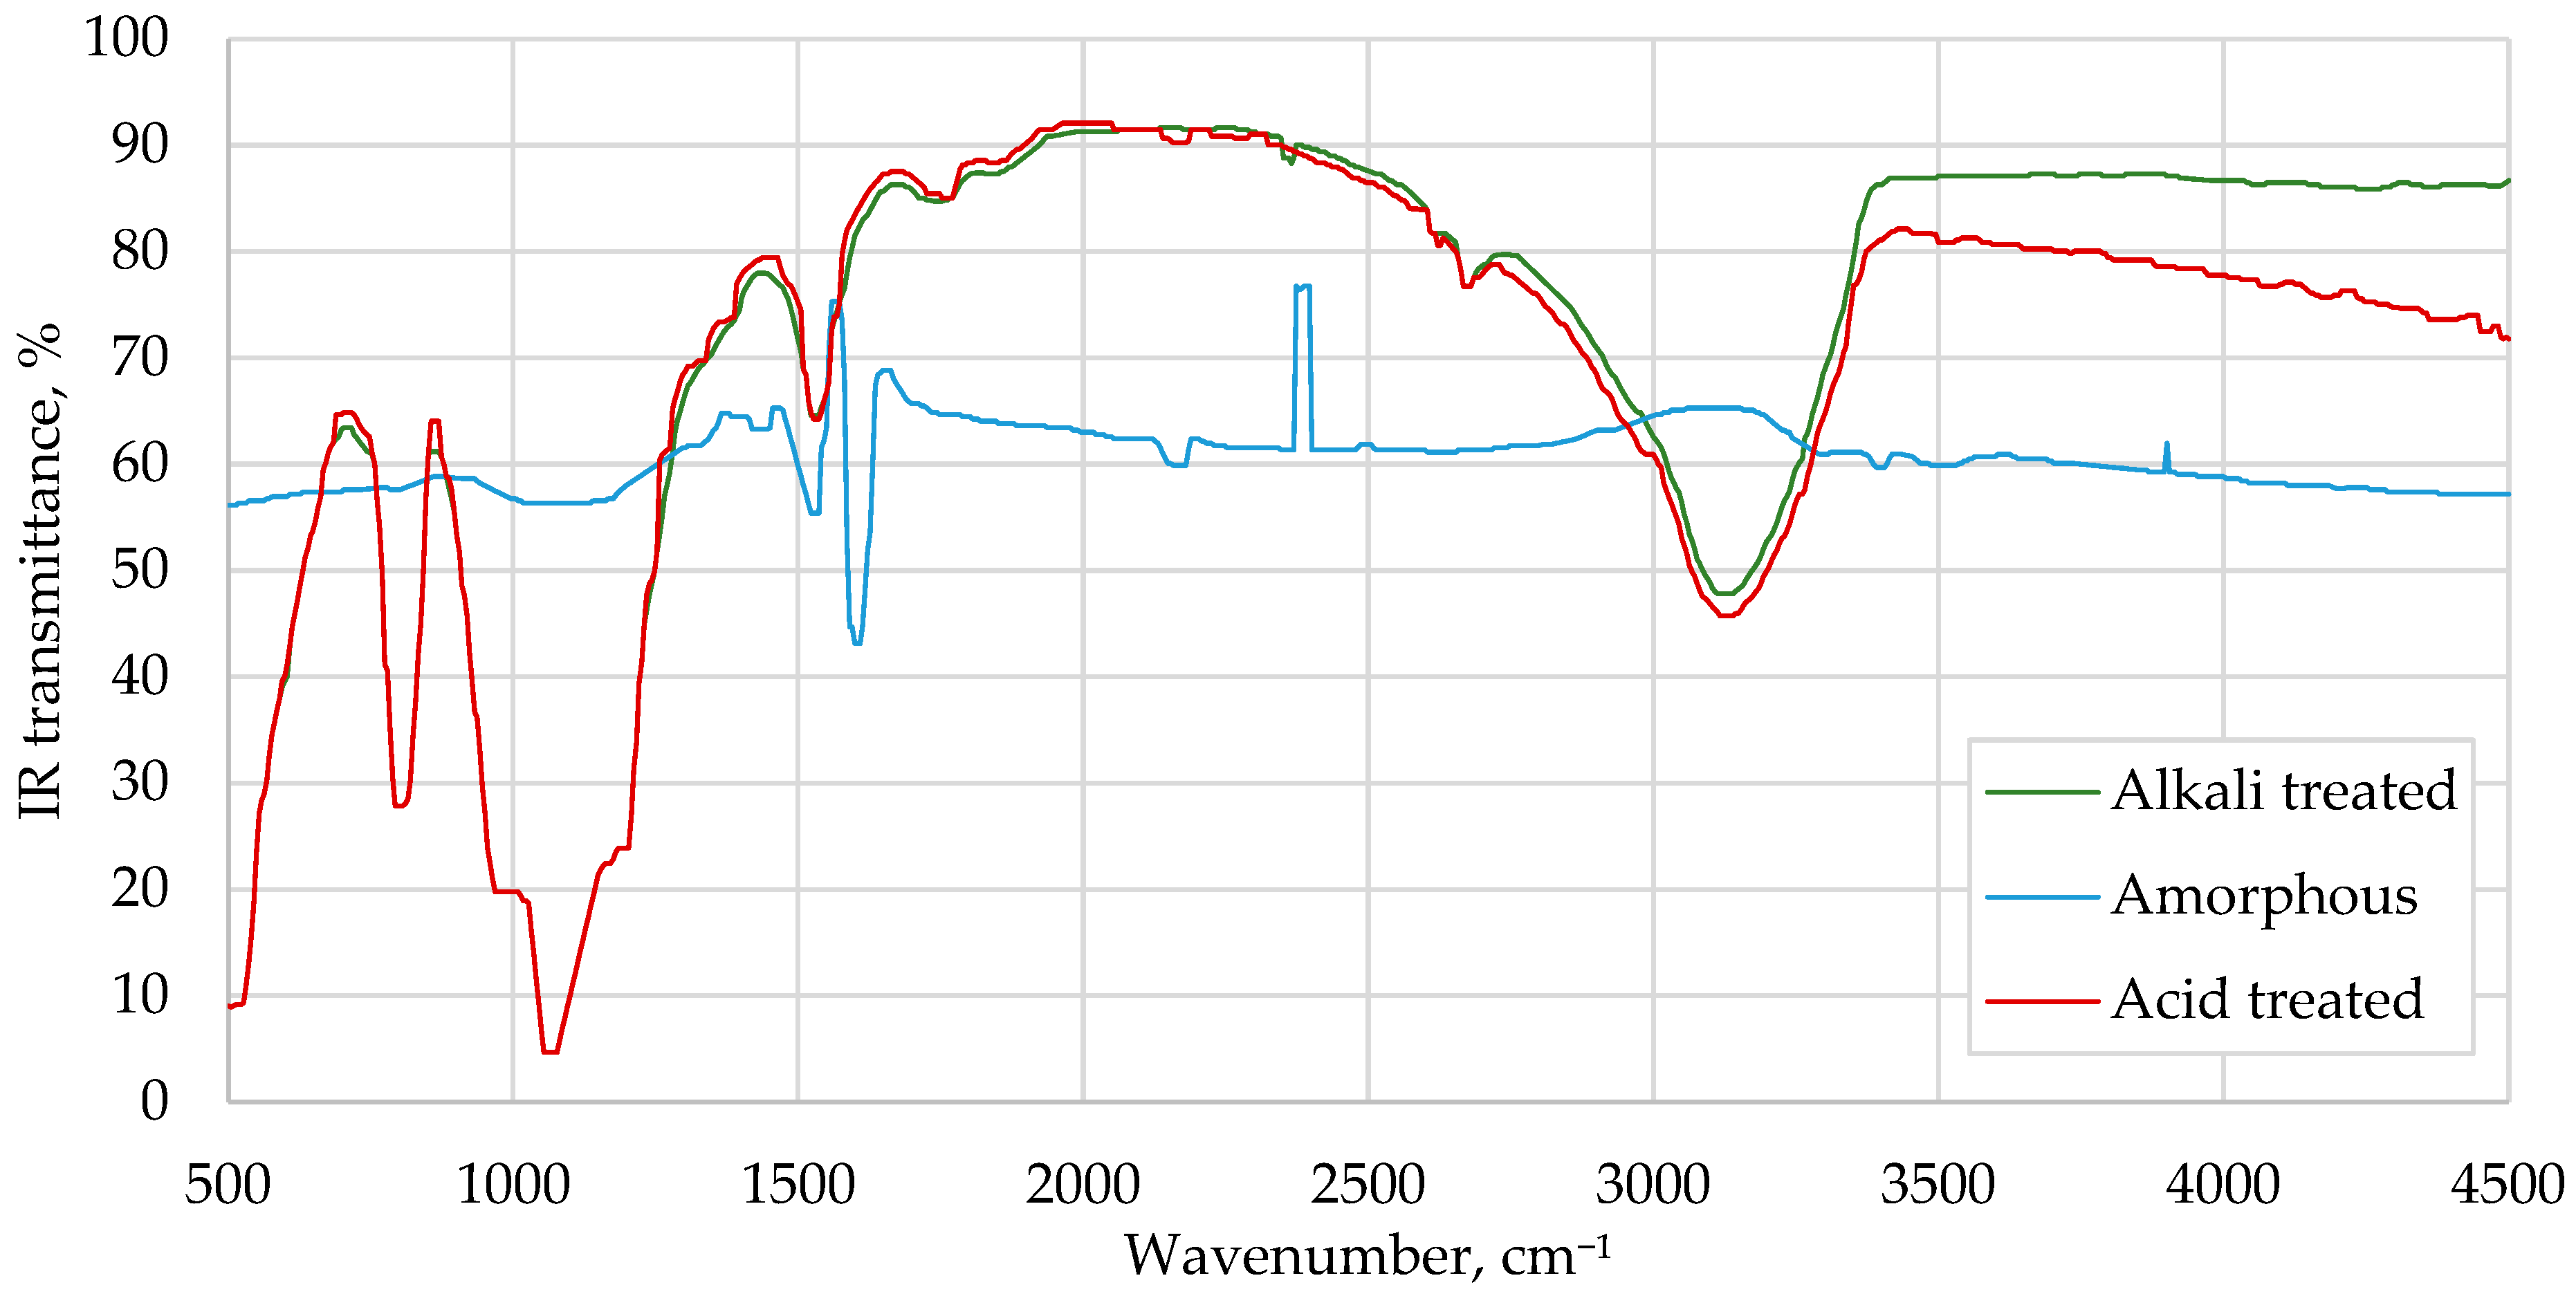
A key aim of the work was to intensify the chemical participation of fly ash in autoclaved aerated concrete. The FTIR spectra (Figure 3) confirm that electrochemical activation of the treatment water changes the spectral response of fly ash, compared with the initial amorphous ash.
As shown in Figure 3, in the 500–4500 cm−1 range, activated samples exhibit absorption features consistent with a more reactive silica state. In particular, the spectrum includes bands attributed to internal deformations in silicate groupings (around 500–600 cm−1); symmetric vibrations of Si–O–Si linkages (approximately 700–900 cm−1); and a strong absorption in the 1000–1290 cm−1 region, with a transmission minimum near 1080 cm−1. This minimum aligns with the frequency region reported by [49] for silica-related products, and it supports the interpretation that activation promotes depolymerization and dispersion of the ash silica network toward a more reactive, silanol-rich silica state (i.e., more weakly polymerized silica species), rather than allowing direct identification of a specific molecular species. Because acidic media may raise corrosion risks for metallic components, the subsequent experimental program selected alkaline electrolyzed water (catholyte) with pH = 10.2 as the preferred treatment route. The anolyte spectrum is shown only for comparison at the material level; mechanical testing was restricted to catholyte because the acidic route raises corrosion/compatibility risks and may affect the aluminum gas-forming process and pore-formation stability. This choice is also coherent with works in the broader electrochemical-activation literature, in which catholyte is commonly associated with higher dissolution rates of siliceous phases and faster early-stage cement reactions [18,19,20,21].
Once the mix design and activation approach were fixed, the influence of the replacement of sand with fly ash on autoclaved cellular concrete properties was quantified for a target density class near 600 kg/m3 (Table 7). The formulation series used constant cement (200 kg/m3) and lime (45 kg/m3), with the siliceous fraction redistributed between sand and fly ash at a constant W/S of 0.6 and constant aluminum powder dosage (PAG-1 = 0.416%). Under these conditions, increasing the fly-ash share caused a systematic decline in mix fluidity (from 25.5 cm at 0% fly ash to 18.5 cm at 100% fly ash). This approximately 27% reduction in spread is important because aerated concrete relies on synchronized gas evolution and slurry stiffening. For the present binder system and processing conditions, a practical working window was a Suttard spread of about 19–23 cm (Table 7): at spreads ≥24 cm, the slurry is sufficiently mobile that bubble migration and coalescence become more likely, whereas at spreads ≤19 cm, the viscosity can restrain bubble growth and promote less uniform pore development. The measured density did not change monotonically across all eleven compositions (604–643 kg/m3), indicating that pore stabilization is sensitive to the combined effects of slurry rheology and gas-release dynamics rather than to siliceous chemistry alone. Although W/S and PAG-1 dosage were kept constant, replacing sand with fly ash changed the effective rheology and gas retention because fly ash differs in particle size/shape and water adsorption. At higher spreads (more fluid mixes), bubble coalescence and upward escape can occur, which reduces bulk density, whereas at lower spreads (more viscous mixes), gas is retained more efficiently and drainage is reduced, giving a higher density. Therefore, the observed density scatter is governed by the competing effects of mixture mobility and gas-release/stabilization kinetics rather than by aluminum dosage alone.
The mean compressive strength trend, in contrast to density, was distinctly monotonic: strength increased from 3.42 MPa (sand-only siliceous component) to 3.96 MPa (100% fly ash), which corresponds to a gain of 0.54 MPa, or about 15.8%. A correlation analysis of Table 7 data (Pearson correlation between fly-ash share and mean compressive strength across 11 compositions) shows an almost linear positive relationship (r ≈ 0.99; two-tailed p < 0.001). Each strength value in Table 7 is reported as mean ± SD based on three specimens per composition. Mechanistically, several factors can contribute simultaneously to this determination. First, the activated ash provides a more reactive siliceous component, one which can more readily participate in lime consumption and calcium silicate hydrate formation under hydrothermal conditions. This aligns with the activation concept described in the electrochemical activation literature, where metastable catholyte environments can accelerate dissolution and subsequent hydration and recrystallization processes [18,19,20,21]. Second, the ash morphology itself can modify nucleation density: highly developed surfaces and fine reactive fractions create more nucleation sites, which can densify the inter-pore walls during autoclaving. Third, partial refinement of pore structure (discussed below) can increase load-bearing cross-sections between pores, raising compressive strength even when bulk density remains similar. Based on the present dataset, the most direct evidence supports the third mechanism, because strength increases while density remains in the same class, and this improvement occurs together with reduced macropore-size scatter (Table 8) and an increased micro-porosity share by MIP (Table 9). The enhanced chemical reactivity of activated fly ash is therefore interpreted as being the underlying driver that enables this wall densification, but the dominant observable contributor to strength is the pore-structure/wall refinement.
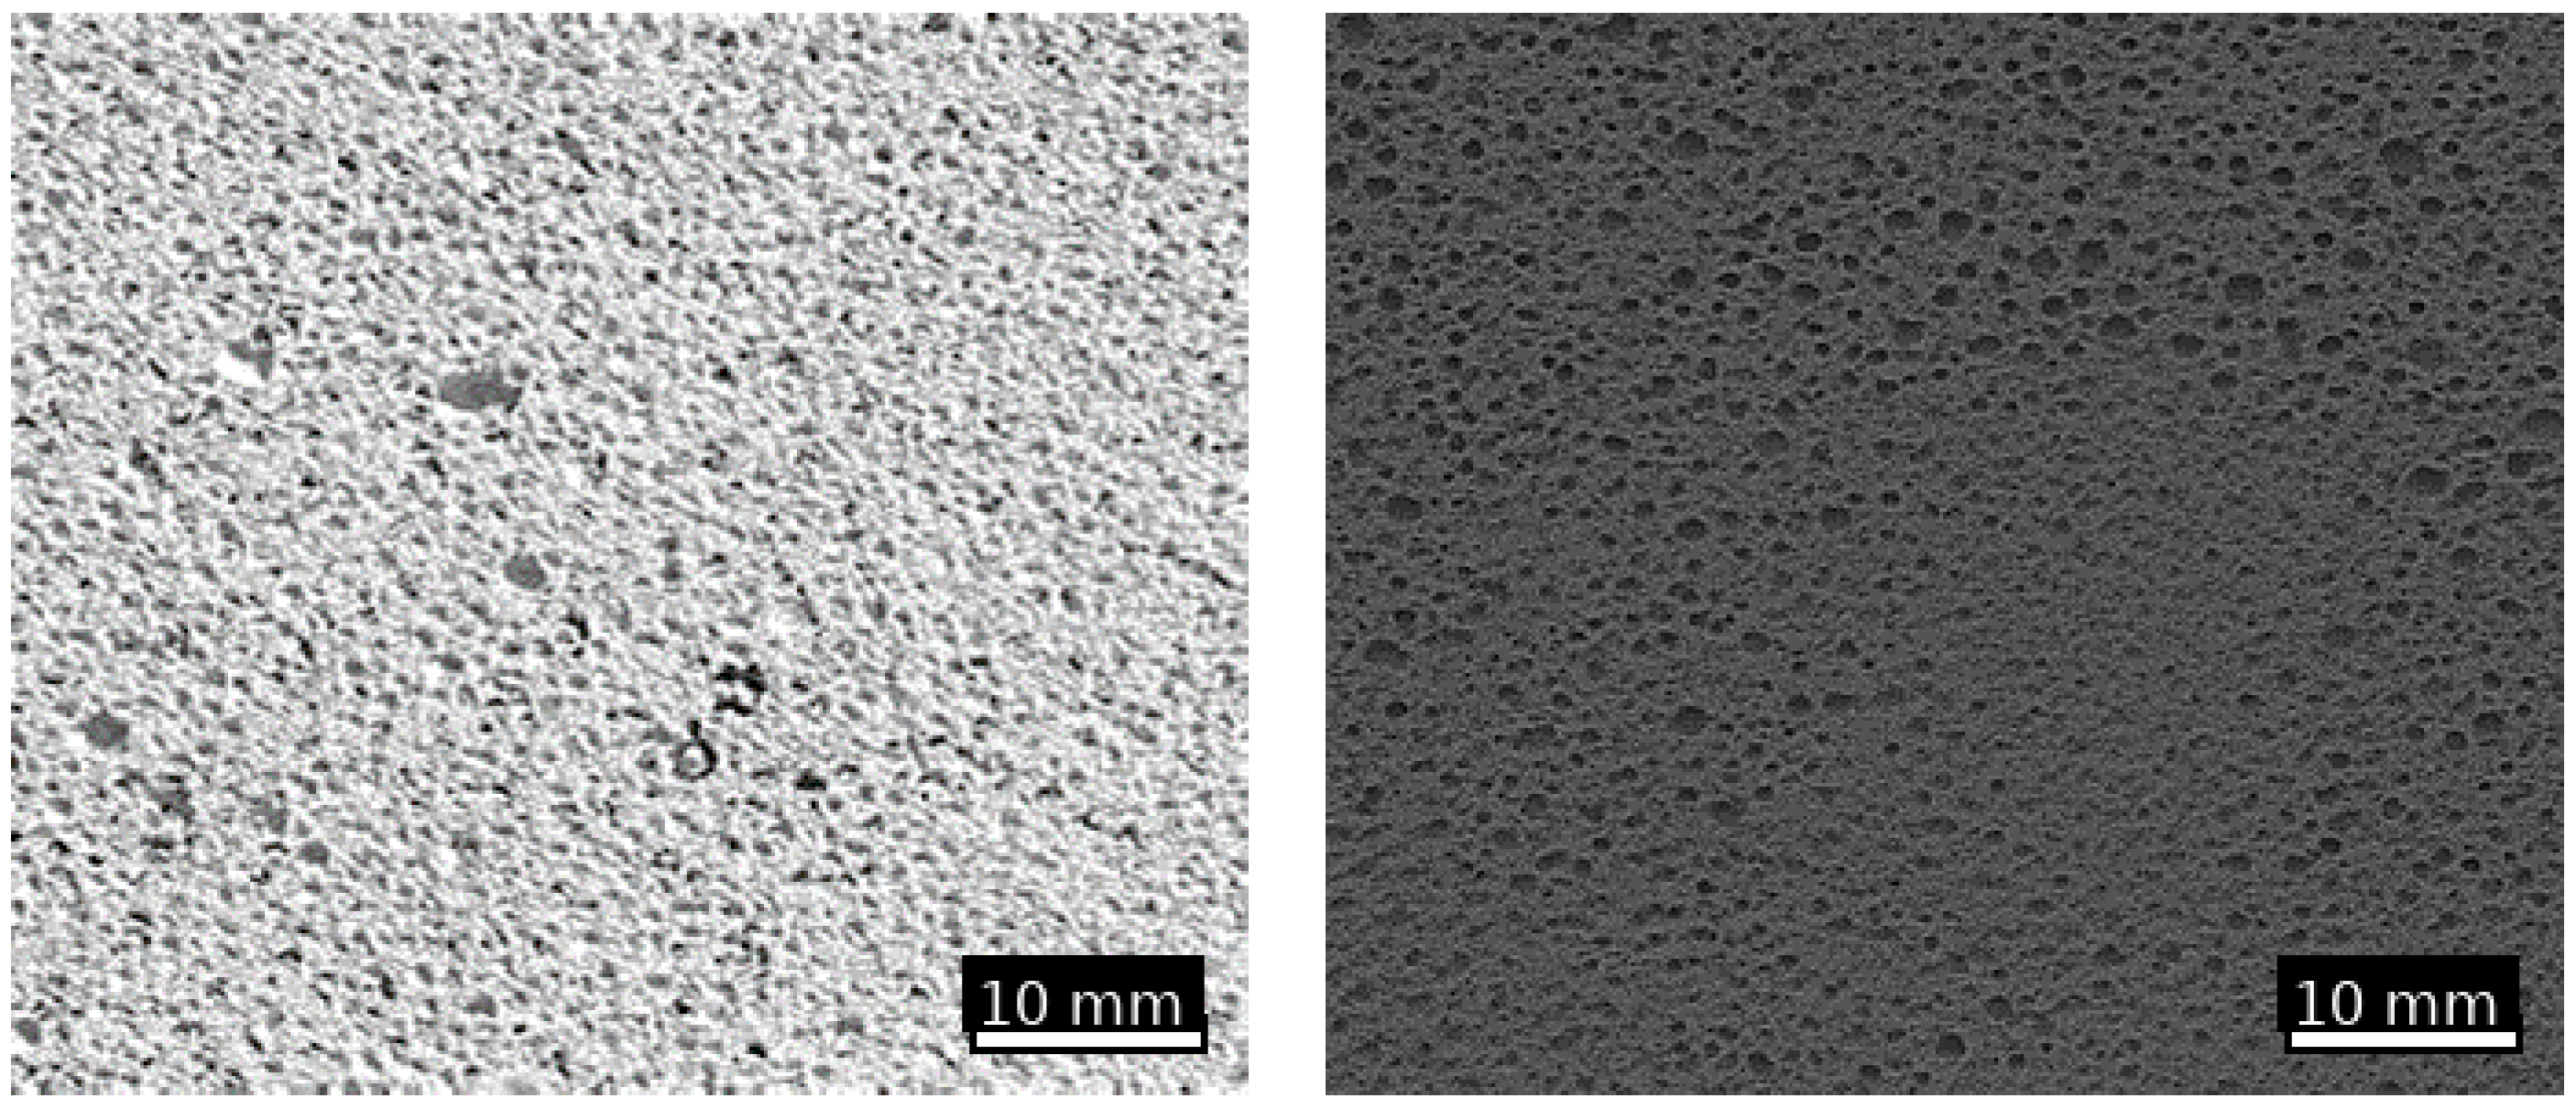
To further probe how pore structure quality changes with siliceous replacement, the macrostructure was evaluated using the amorphous carbon replication approach (Table 8 and Figure 4).
As can be seen from Table 8, when the fly-ash fraction increased from 0% to 100% at constant W/S = 0.6 and temperature 40 °C, density decreased modestly, from 618 to 600 kg/m3 (about 2.9%), while compressive strength increased from 3.42 to 3.96 MPa. Importantly, the standard deviation describing macropore size distribution decreased from 0.175 to 0.133 mm, which is a reduction of roughly 24%. Based on the same image-analysis protocol and an SD estimated from 9 images per composition, this reduction indicates that the pore system became more uniform as fly-ash replacement increased. In aerated concrete, such homogenization is often as important as average pore size, because localized clusters of oversized or merged pores can act as preferential failure zones, lowering strength excessively.
A practical way to summarize the combined efficiency of these changes is to consider strength normalized by density. Using the Table 8 data, the specific strength (MPa per 1000 kg/m3 of density) increases from approximately 5.53 to 6.60 (~19% improvement). In other words, the fly-ash system achieved higher load-bearing capacity without paying a density penalty, which is precisely the direction desired for structural–thermal insulating aerated concretes. This behavior is consistent with the broader understanding that fly ash, when properly activated and integrated, can act not only as an inert replacement but as a chemically active contributor to hydrothermal reaction products [14,15,18,19,20,21].
Visual comparison (Figure 4) supports the quantitative uniformity trend. The sand-based material shows a larger scatter in pore size and more irregular pore shapes, while the fly-ash material exhibits a more even distribution of pores with fewer obvious coalescence features. This can be rationalized through rheology and kinetics: as fly ash reduces spread (Table 7 and Table 8), the slurry becomes better able to “hold” the evolving gas bubbles in place, reducing upward migration and bubble merging. At the same time, the activated siliceous phase likely accelerates early formation of binding hydrates and hydrothermal products, stiffening pore walls earlier in the curing process, which further stabilizes the pore network [18,19,20,21].
Because macropore uniformity is only one part of the pore hierarchy, the mercury intrusion porosimeter was then used to quantify total porosity and the partition between micro- and macro-sized pores (Table 9). The most consistent structural shift is an increase in the micro-porosity fraction (pores < 0.1 μm). For example, at D600, micro-porosity rises from 0.310 to 0.342 cm3/g (about +10%), while macro-porosity (>0.1 μm) slightly decreases from 0.322 to 0.317 cm3/g. Averaged across the three density classes, the micro-porosity share increases from roughly 49% in the sand-based material to about 53% in the fly-ash material. Note that Table 9 reports the mercury-intrusion-accessible pore volume normalized by specimen mass (cm3/g), not bulk porosity per specimen volume. Therefore, this value may increase while bulk density remains within the same class if the connected micro- and capillary-pore network becomes more accessible, whereas the macropore system governing density changes little. Closed pores are not captured by MIP, so Table 9 should be interpreted primarily as a comparative accessibility trend under identical test conditions.
This micro-porosity increase is significant for two reasons. First, a larger micro-porous fraction is expected to reduce thermal conductivity by increasing the volume of confined air in smaller pores; however, thermal conductivity was not measured in this study, so this point is discussed as a potential implication of the observed pore-structure changes rather than a verified performance outcome. Second, micro-porosity is often linked to a denser, more continuous solid skeleton in the inter-pore walls. If hydrothermal products form more extensively on activated ash surfaces, they can refine gel and microcapillary pores, while still allowing the intentionally created macropore system to deliver low density. The net effect can therefore be a favorable combination: stable macropores for lightness, plus a refined microstructure that improves strength, and, potentially, thermal resistance. It should be noted that mercury intrusion porosimetry has known limitations (e.g., ink-bottle effects and possible pore-wall damage/collapse under pressure), which can shift the apparent partition between “<0.1 μm” and “>0.1 μm” and therefore affect absolute values. However, because both materials were tested using the same procedure and thresholds, the observed increase in the micro-porosity fraction is treated here primarily as a comparative trend rather than a definitive quantification of true pore sizes.
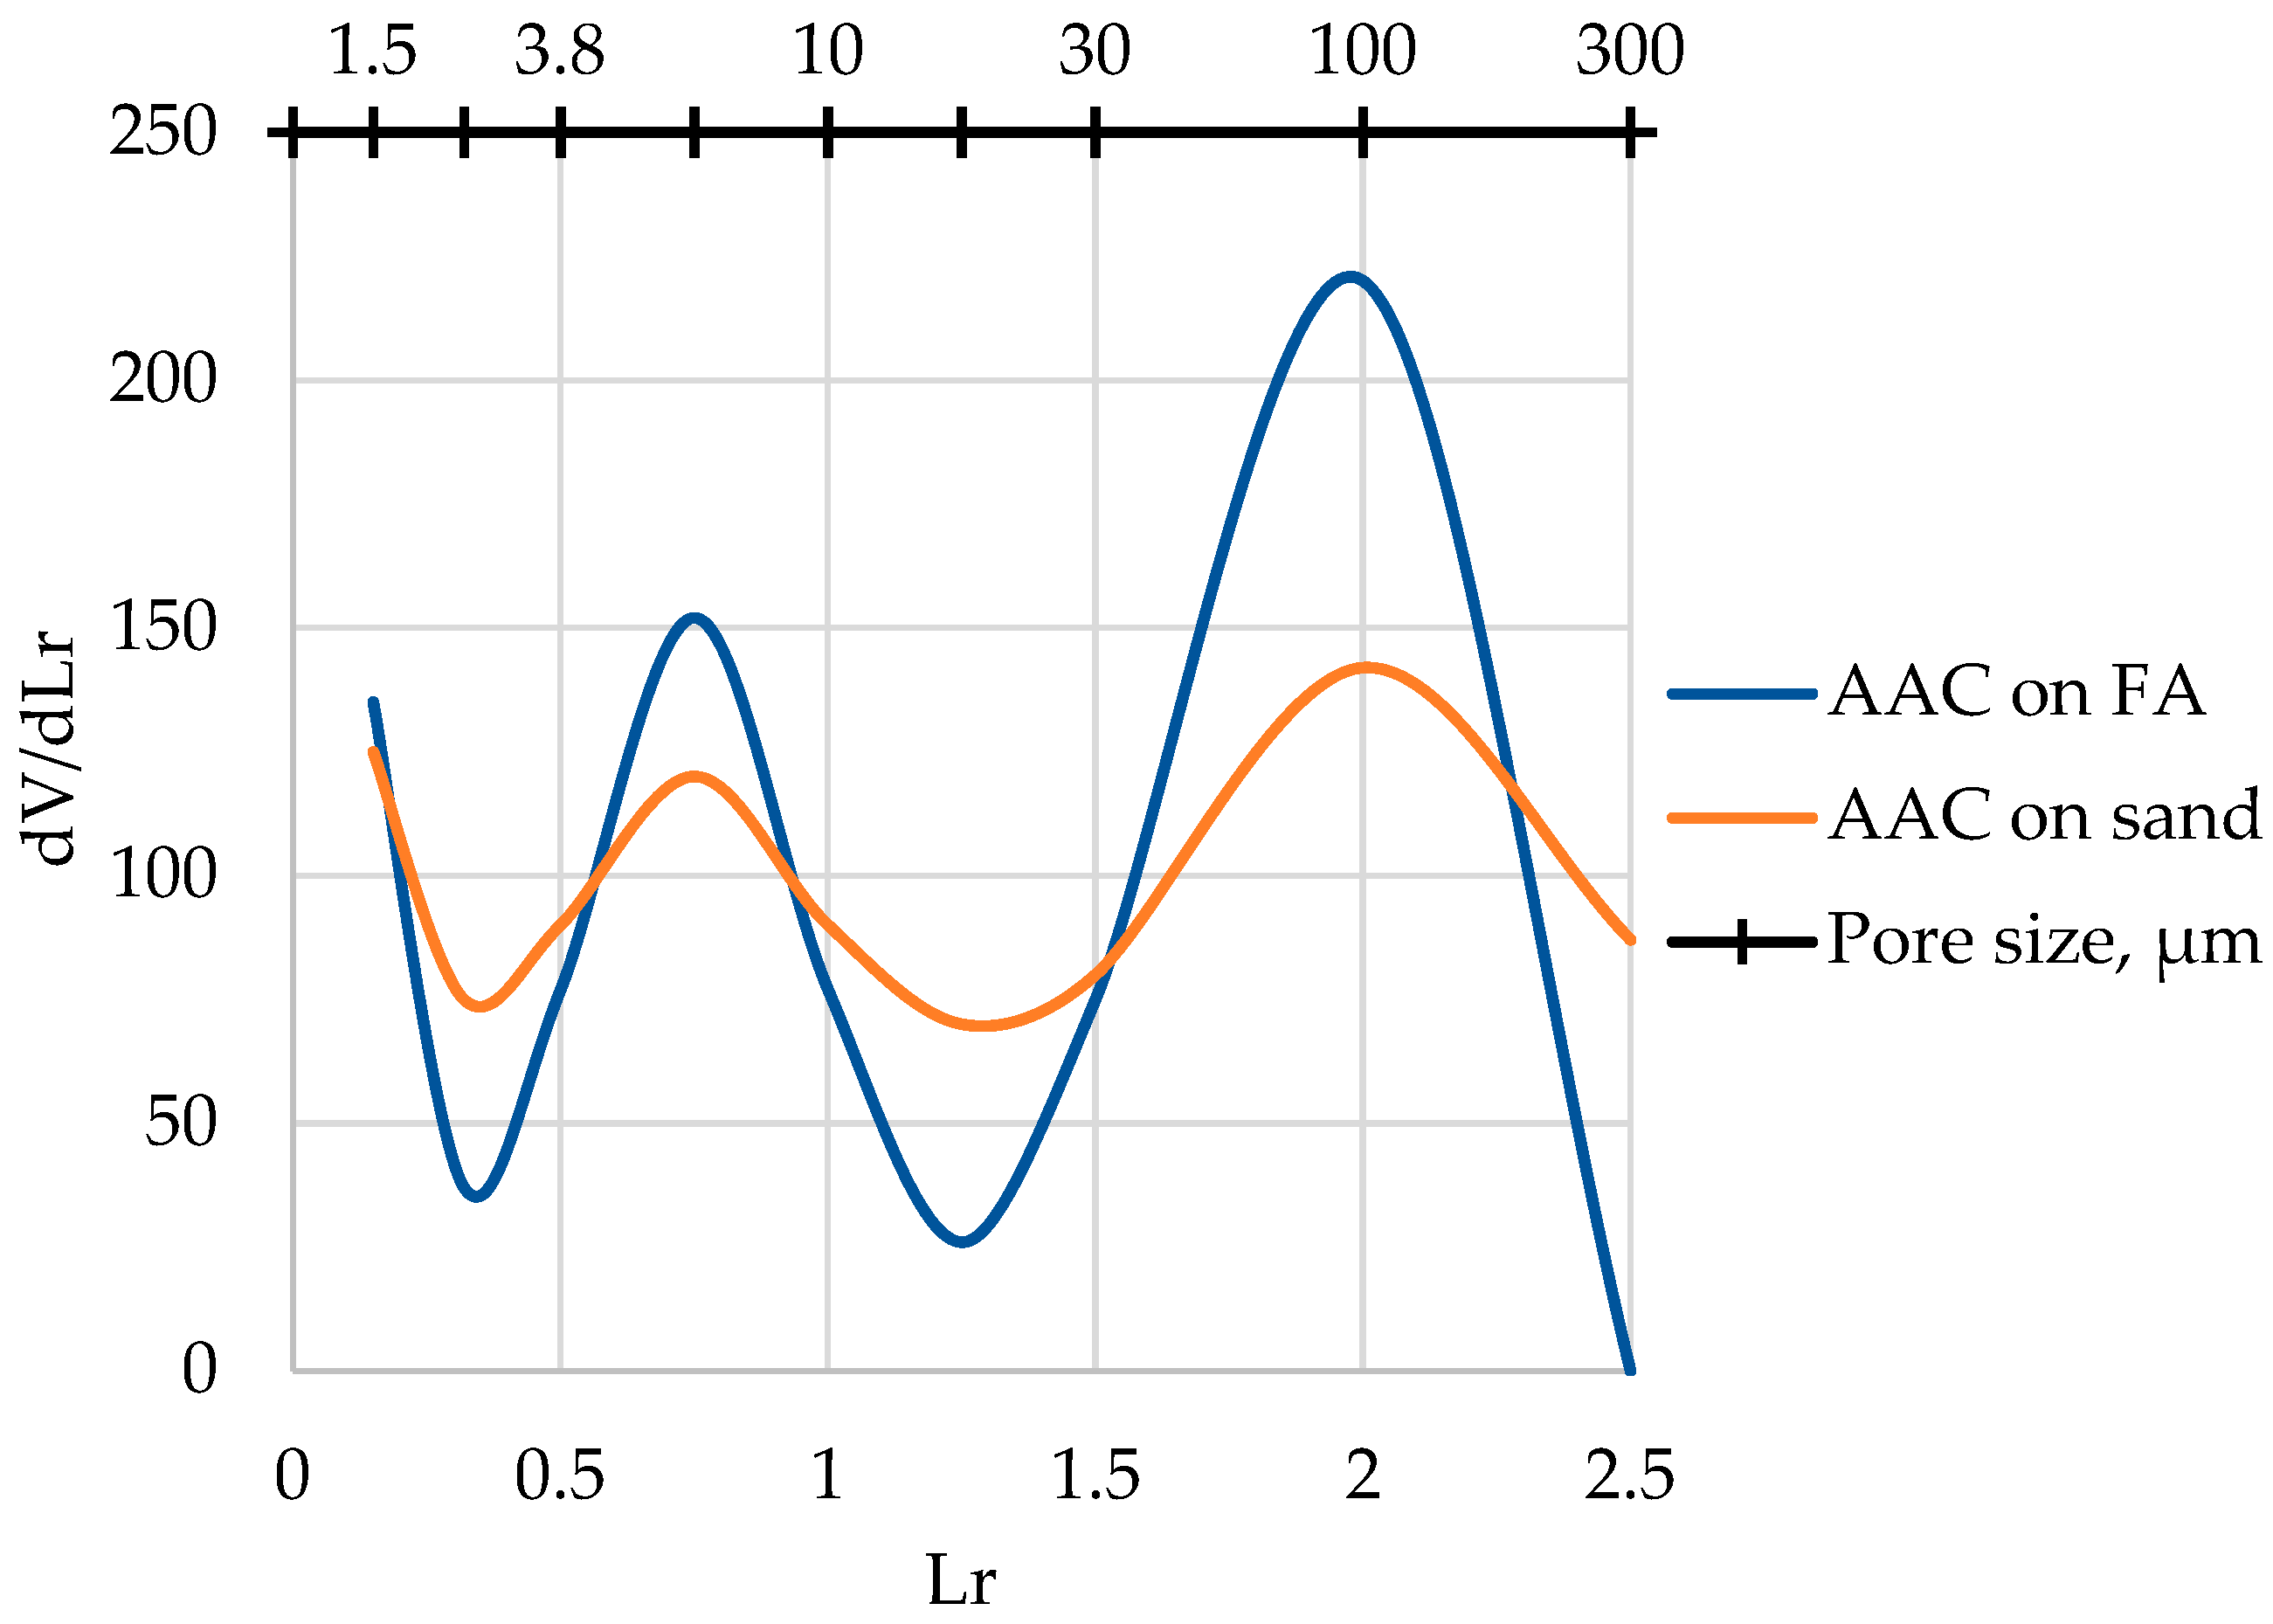
The pore-size distribution curves for D600 (Figure 5) provide a complementary picture: the differential curves for fly-ash aerated concrete show more pronounced peaks at approximately 1.5 μm, 5.0 μm, and 100 μm, compared with the sand-based concrete (micro-range obtained from PASCAL 240; macro-range from PASCAL 140 W Ultra Macro).
As can be seen from Figure 5, the fly-ash concrete exhibits higher intrusion volume concentrated in several pore-size bands over roughly 1.5–300 μm (the discussed interval within the merged MIP distribution), and the stronger peaks indicate higher pore volume in those ranges. At the same time, the improved pore uniformity discussed here is based on the macropore metric from the image analysis (reduced pore-diameter scatter in Table 8), whereas Figure 5 describes the connected micro- and capillary-pore distribution from MIP; therefore, more prominent peaks in specific MIP bands can coexist with a more uniform macropore system. A practical reconciliation of these observed effects is that “more pronounced peaks” reflect a more structured, modal distribution (distinct dominant pore families), whereas the sand-based concrete may have a flatter, less organized distribution with less clearly expressed modes. In aerated concrete, a modal pore structure that avoids excessive tailing toward very large and merged pores is typically beneficial for strength at a given density, and this is consistent with the strength improvements observed here (Table 7 and Table 8).
Finally, the deformation and durability-related indicators (Table 10) show that the fly-ash system preserves dimensional stability and slightly improves resistance markers. Capillary shrinkage is 0.59 mm/m for sand-based aerated concrete and 0.61 mm/m for fly-ash aerated concrete, indicating only a marginal difference that remains practically comparable for this material class and is within the expected uncertainty of the capillary-shrinkage estimate. After 25 freeze–thaw cycles, the reported frost-resistance coefficient increases slightly from 0.95 to 0.96 for the fly-ash system, and the wetting–drying coefficient increases from 0.83 to 0.85. These 25-cycle coefficients are used here as short-term accelerated comparative indicators under the same regime for both materials and do not constitute long-term durability classifications. Because the coefficient differences are only 0.01–0.02, they may fall within experimental scatter, so they are interpreted cautiously as directional, rather than definitive, improvements. These differences are not large, but they align with the structural evidence that inter-pore walls become more uniform and potentially denser when activated fly ash is used. Since freeze–thaw damage sensitivity in aerated concrete often depends on connectivity of the capillary pores and the integrity of pore walls, even small increases may reflect meaningful microstructural refinement.
The results indicate that replacing sand with electrochemically activated fly ash systematically increases compressive strength while also improving pore-system regularity, as evidenced by the lower macropore-size scatter and the higher, more structured micro-porosity fraction (Table 7, Table 8 and Table 9). From a process standpoint, the FTIR evidence supports the determination that activation shifts the ash toward a more reactive siliceous state (the more weakly polymerized/silanol-rich silica species suggested by FTIR), and this provides a consistent mechanistic explanation for stronger, more stable inter-pore walls after hydrothermal curing. The observed performance pattern is directionally consistent with the broader literature describing both the pozzolanic potential of fly ash and the benefits of electrochemical activation for accelerating dissolution, hydration, and recrystallization phenomena in cementitious systems [14,15,16,17,18,19,20,21]. At the same time, the present conclusions should be treated as conditional, because the experimental scope was intentionally narrow: the study used a single fly-ash source (Ekibastuz TPP), whereas fly-ash properties (glassy phase content, fineness, and LOI/unburned carbon) may vary between sources and batches, and a single electrolysis setup and endpoint (0.8 L treated until 35 °C; catholyte pH = 10.2, anolyte pH = 2.6), with fly ash pre-exposed to catholyte for up to 15 min, while the acidic anolyte route was not pursued due to corrosion concerns. Robust findings (supported directly by the measured data) include the following: (i) the near-monotonic increase in compressive strength with increasing fly-ash replacement under the investigated catholyte treatment, and (ii) improved macropore uniformity (reduced pore-diameter scatter) together with a higher apparent micro-porosity share by MIP. Tentative interpretations include the proposed causal link between electrochemical activation, silica depolymerization, and interpore-wall densification, which is inferred from indirect indicators (FTIR/MIP) and therefore requires targeted validation (e.g., additional microstructural/phase analyses and broader durability testing). In addition, durability indicators were only checked over 25 cycles (freeze–thaw and wetting–drying), so longer-term resistance trends remain uncertain, even though the coefficients improved slightly. Future work should therefore (i) expand the design space by varying electrolysis conditions and exposure time, (ii) test multiple ashes with different glass contents and finenesses to validate transferability, (iii) compare the catholyte and anolyte under corrosion-mitigated processing, and (iv) strengthen structure–property links by extending durability regimes and complementing the current pore-assessment methods (surface replication and mercury intrusion) with additional microstructural and transport measurements, including high-temperature/fire exposure testing to assess residual strength and microstructural stability after heating [50].

4. Conclusions

Electrochemical activation of mixing water (catholyte) enabled fly ash to act as a more reactive siliceous component in aerated concrete under autoclaved curing, leading to a near-monotonic increase in compressive strength at a similar density class (~600 kg/m3). The strength gain is most consistently explained by refinement/densification of the load-bearing interpore walls, as supported by improved macropore uniformity (lower pore-diameter scatter) and a higher micro-porosity volume fraction measured by MIP (pores < 0.1 μm). Short-term indicators (25 cycles) showed no deterioration of dimensional stability and only slight changes in resistance coefficients.
The conclusions are limited by the use of a single fly-ash source, a narrow activation window, and durability assessment restricted to short cycling; therefore, longer-term durability and broader material variability should be evaluated. Thermal conductivity was not measured in this study and should be determined directly in future work, together with extended transport testing and high-temperature/fire exposure tests (e.g., residual strength and microstructural stability).

Author Contributions

Conceptualization, D.A.; methodology, A.A. and B.A.; software, B.A.; validation, A.A.; formal analysis, A.B.; investigation, D.A.; resources, A.A.; data curation, A.B.; writing—original draft preparation, D.A.; writing—review and editing, B.A. and A.B.; visualization, B.A.; supervision, D.A.; project administration, A.A.; funding acquisition, A.A. All authors have read and agreed to the published version of the manuscript.

Funding

This study was funded by University North, Croatia, Scientific support project: ‘Use of Recycled Aggregates for Sustainable Development of Upper Layer of Rigid Pavement, Scientific support’, CroRIS ID: 15306.

Data Availability Statement

The original contributions presented in this study are included in the article. Further inquiries can be directed to the corresponding authors.

Conflicts of Interest

The authors declare no conflicts of interest.

Correction Statement

This article has been republished with a minor correction to the Funding statement. This change does not affect the scientific content of the article.

References

  1. Belviso, C. State-of-the-Art Applications of Fly Ash from Coal and Biomass: A Focus on Zeolite Synthesis Processes and Issues. Prog. Energy Combust. Sci. 2018, 65, 109–135. [Google Scholar] [CrossRef]
  2. Hemalatha, T.; Ramaswamy, A. A Review on Fly Ash Characteristics—Towards Promoting High Volume Utilization in Developing Sustainable Concrete. J. Clean. Prod. 2017, 147, 546–559. [Google Scholar] [CrossRef]
  3. Kelechi, S.E.; Adamu, M.; Uche, O.A.U.; Okokpujie, I.P.; Ibrahim, Y.E.; Obianyo, I.I. A Comprehensive Review on Coal Fly Ash and Its Application in the Construction Industry. Cogent Eng. 2022, 9, 2114201. [Google Scholar] [CrossRef]
  4. Kopzhassarov, B.; Mominova, S.; Kim, K.D.; Kopzhassarov, A.; Kolesnikov, A.; Dyussembayev, I.; Baisarova, G.; Zhaiylkhan, N. The Challenges of Reusing Thermal Power Plant Wastes to Produce Cellular Concrete Modified with Wollastonite. Constr. Mater. Prod. 2025, 8, 10. [Google Scholar] [CrossRef]
  5. Mandal, J.K.; Mukherjee, S.; Saha, N.; Halder, N.; Biswas, T.; Chakraborty, S.; Hassan, S.; Hassan, M.M.; Abo-Shosha, A.A.; Hossain, A. Assessing the Capability of Chemical Ameliorants to Reduce the Bioavailability of Heavy Metals in Bulk Fly Ash Contaminated Soil. Molecules 2021, 26, 7019. [Google Scholar] [CrossRef]
  6. Zheng, Y.; Wu, Y.; Zhang, Z.; Chen, F.; Ma, Q.; Kong, Z.; Ma, Y. Distribution Characteristics of Low-Molecular-Weight Organic Acids in Reclaimed Soil Filled with Fly Ash: A Study. Toxics 2024, 12, 312. [Google Scholar] [CrossRef] [PubMed]
  7. Mashau, A.S.; Gitari, M.W.; Akinyemi, S.A. Evaluation of the Bioavailability and Translocation of Selected Heavy Metals by Brassica Juncea and Spinacea Oleracea L for a South African Power Utility Coal Fly Ash. Int. J. Environ. Res. Public Health 2018, 15, 2841. [Google Scholar] [CrossRef]
  8. Jiang, P.; Chen, J.; Li, Y.; Li, X.; Qi, X.; Wang, J.; Chen, P.; Liu, W.; Wang, R. Partitioning and Migration of Trace Elements during Coal Combustion in Two Coal-Fired Power Plants in Hefei City, Anhui Province, Eastern China. Minerals 2023, 13, 152. [Google Scholar] [CrossRef]
  9. Bernard, V.A.R.; Renuka, S.M.; Avudaiappan, S.; Umarani, C.; Amran, M.; Guindos, P.; Fediuk, R.; Ivanovich Vatin, N. Performance Investigation of the Incorporation of Ground Granulated Blast Furnace Slag with Fly Ash in Autoclaved Aerated Concrete. Crystals 2022, 12, 1024. [Google Scholar] [CrossRef]
  10. Bu, J.; Liu, Q.; Zhang, L.; Li, S.; Zhang, L. Dynamic Compressive Behavior and Fracture Mechanisms of Binary Mineral Admixture-Modified Concrete. Materials 2025, 18, 2883. [Google Scholar] [CrossRef]
  11. Kuldeyev, E.; Zhumadilova, Z.; Zhagifarov, A.; Tolegenova, A.; Kuttybay, M.; Alikhan, A. Physicochemical Properties of Silica Fume and Fly Ash from Tau-Ken Temir LLP and Pavlodar CHP for Potential Use in Self-Compacting Concrete. Technobius 2025, 5, 0076. [Google Scholar] [CrossRef]
  12. Zhang, M.; Gao, S.; Xu, J.; Wang, L.; Xu, M.; Ying, H. Sustainable Strategy to Reduce Winter Energy Consumption: Incorporating PCM Aggregates and Rice Husk Ash–Fly Ash Matrix into Concrete. Buildings 2025, 15, 2086. [Google Scholar] [CrossRef]
  13. Urkinbayeva, Z.; Jexembayeva, A.; Konkanov, M.; Akimbekova, S.; Zhaksylykova, L.; Umar, T. Investigation of the Properties of Fly Ash and Slag-Based Geopolymer Concrete Containing Waste Glass Aggregates. Technobius 2025, 5, 0081. [Google Scholar] [CrossRef]
  14. Drochytka, R.; Černý, V.; Kulísek, K. The Use of Anthracite Fly Ash for the Production of Autoclaved Aerated Concrete. Adv. Mater. Res. 2012, 512–515, 3003–3006. [Google Scholar] [CrossRef]
  15. Abed, M.; Nemes, R. Mechanical Properties of Recycled Aggregate Self-Compacting High Strength Concrete Utilizing Waste Fly Ash, Cellular Concrete and Perlite Powders. Period. Polytech. Civ. Eng. 2019, 63, 266–277. [Google Scholar] [CrossRef]
  16. Yang, J.; Meng, T.; Han, J.; Qiao, Y.; Chen, X.; Wang, Q.; Zhang, T. Mechanical Properties and Microstructure of Circulating Fluidized Bed Fly Ash-Based Hybrid Alkali-Activated Cement. Constr. Build. Mater. 2025, 486, 142006. [Google Scholar] [CrossRef]
  17. Xiang-peng, F.; Li-ping, G.; Jia-tao, L.; Hao-ran, S.; Hai-tao, C.; Zi-qing, R. Modeling and Analysis of Hydration in Cementitious Composites with Ultra-High Dosage of Fly Ash: Hydrates and Microstructure Evolutions. Constr. Build. Mater. 2025, 489, 140557. [Google Scholar] [CrossRef]
  18. Saraswathy, V.; Song, H.-W. Electrochemical Studies on the Corrosion Performance of Steel Embedded in Activated Fly Ash Blended Concrete. Electrochim. Acta 2006, 51, 4601–4611. [Google Scholar] [CrossRef]
  19. Cherif, R.; Andrade, C.; Aït-Mokhtar, A. Experimental Investigation of the Impact of Additives in Low Clinker Cementitious Materials on Multi-Ion Transference Numbers and Diffusion Coefficients. Cem. Concr. Res. 2024, 186, 107687. [Google Scholar] [CrossRef]
  20. Gomes, H.I.; Funari, V.; Dinelli, E.; Soavi, F. Enhanced Electrodialytic Bioleaching of Fly Ashes of Municipal Solid Waste Incineration for Metal Recovery. Electrochim. Acta 2020, 345, 136188. [Google Scholar] [CrossRef]
  21. Yang, Z.; Huang, Y.; Zhu, L.; Xu, H.; Yu, D.; Hou, Z. Analysis on Electrochemical Impedance Spectroscopy of the Hydration Process of Cement-Based Materials with a Large Amount of Mineral Admixture. IOP Conf. Ser. Earth Environ. Sci. 2020, 558, 022033. [Google Scholar] [CrossRef]
  22. Navyatha, C.; Packialakshmi, S.; Sabitha, D.; Rajamane, N.P.; Iyer, N.R. Evaluation of Strength and Durability Parameters of Geopolymer Concrete. In Advances in Materials, Manufacturing and Design; Springer: Berlin/Heidelberg, Germany, 2025; pp. 119–130. [Google Scholar]
  23. EN 197-1:2011; Cement—Part 1: Composition, Specifications and Conformity Criteria for Common Cements. CEN: Brussels, Belgium, 2011.
  24. EN 196-2:2025; Methods of Testing Cement—Part 2: Chemical Analysis of Cement. CEN: Brussels, Belgium, 2013.
  25. EN 196-6:2018; Methods of Testing Cement—Part 6: Determination of Fineness. CEN: Brussels, Belgium, 2018.
  26. EN 196-3:2016; Methods of Testing Cement—Part 3: Determination of Setting Times and Soundness. CEN: Brussels, Belgium, 2016.
  27. EN 13279-2:2014; Gypsum Binders and Gypsum Plasters—Part 2: Test Methods. CEN: Brussels, Belgium, 2014.
  28. EN 13279-1:2008; Gypsum Binders and Gypsum Plasters—Part 1: Definitions and Requirements. CEN: Brussels, Belgium, 2008.
  29. EN 459-1:2015; Building Lime—Part 1: Definitions, Specifications and Conformity Criteria. CEN: Brussels, Belgium, 2015.
  30. GOST 5494-95; Pigmentary Aluminium. Specifications. EASC: Minsk, Belarus, 1995.
  31. EN 932-3:1996; Tests for General Properties of Aggregates—Part 3: Procedure and Terminology for Simplified Petrographic Description. CEN: Brussels, Belgium, 1996.
  32. EN 12620:2013; Aggregates for Concrete. CEN: Brussels, Belgium, 2013.
  33. EN 450-1:2012; Fly Ash for Concrete—Part 1: Definition, Specifications and Conformity Criteria. CEN: Brussels, Belgium, 2012.
  34. EN 450-2:2005; Fly Ash for Concrete—Part 2: Conformity Evaluation. CEN: Brussels, Belgium, 2005.
  35. EN 1008:2002; Mixing Water for Concrete—Specification for Sampling, Testing and Assessing the Suitability of Water, Including Water Recovered from Processes in the Concrete Industry, as Mixing Water for Concrete. CEN: Brussels, Belgium, 2002.
  36. ISO/TS 21383:2021; Microbeam Analysis—Scanning Electron Microscopy—Qualification of the Scanning Electron Microscope for Quantitative Measurements. ISO: Geneva, Switzerland, 2021.
  37. Flatt, R.J.; Larosa, D.; Roussel, N. Linking Yield Stress Measurements: Spread Test versus Viskomat. Cem. Concr. Res. 2006, 36, 99–109. [Google Scholar] [CrossRef]
  38. TS 5156-002-32064511-07; Melesta. Melesta, LLC: Ufa, Russia.
  39. Tkach, Y.V.; Temirkanov, R.I.; Tkach, S.A. Comprehensive Study of Modified Concrete Based on Activated Microsilicon Together with Micro-Reinforcing Fiber to Improve Performance. Bull. Tomsk. Polytech. Univ. Geo Assets Eng. 2021, 332, 215–226. [Google Scholar] [CrossRef]
  40. Cesar, J.; Quintero, K. Organic Geochemistry of Kerogen from La Luna Formation, Western Venezuelan Basin, Using Diffuse Reflectance—Fourier Transform Infrared Spectroscopy (DRFTIR). Fuel 2020, 282, 118805. [Google Scholar] [CrossRef]
  41. Samuilov, Y. The Method of Determining the Composition of the Concrete Mixture to the Required Density of Non-Autoclaved Aerated Concrete on Micro Filler of Dispersed Granite Dropout. Contemp. Issues Concr. Reinf. Concr. 2018, 214–232. [Google Scholar] [CrossRef]
  42. Suleymanov, K.; Lesovik, V.; Pogorelova, I.; Ryabchevskiy, I. Study of the Macroporous Structure of Cellular Concrete. Bull. Belgorod State Technol. Univ. Named After V. G. Shukhov 2024, 9, 8–16. [Google Scholar] [CrossRef]
  43. Wang, Z.; Guo, Y.; Zhang, P. A Rapid Quantitation of Cell Attachment and Spreading Based on Digital Image Analysis: Application for Cell Affinity and Compatibility Assessment of Synthetic Polymers. Mater. Sci. Eng. C 2021, 128, 112267. [Google Scholar] [CrossRef]
  44. ISO 15901-1:2016; Evaluation of Pore Size Distribution and Porosity of Solid Materials by Mercury Porosimetry and Gas Adsorption. Part 1: Mercury Porosimetry. ISO: Geneva, Switzerland, 2016.
  45. Giesche, H. Mercury Porosimetry: A General (Practical) Overview. Part. Part. Syst. Charact. 2006, 23, 9–19. [Google Scholar] [CrossRef]
  46. Rouquerol, J.; Baron, G.; Denoyel, R.; Giesche, H.; Groen, J.; Klobes, P.; Levitz, P.; Neimark, A.V.; Rigby, S.; Skudas, R.; et al. Liquid Intrusion and Alternative Methods for the Characterization of Macroporous Materials (IUPAC Technical Report). Pure Appl. Chem. 2011, 84, 107–136. [Google Scholar] [CrossRef]
  47. Rouquerol, J.; Baron, G.V.; Denoyel, R.; Giesche, H.; Groen, J.; Klobes, P.; Levitz, P.; Neimark, A.V.; Rigby, S.; Skudas, R.; et al. The Characterization of Macroporous Solids: An Overview of the Methodology. Microporous Mesoporous Mater. 2012, 154, 2–6. [Google Scholar] [CrossRef]
  48. Sheikin, A.E.; Chekhovsky, Y.V.; Brousser, M.I. Structure and Properties of Cement Concretes; Stroyizdat Publ.: Moscow, Russia, 1979. [Google Scholar]
  49. Eitel, W. The Physical Chemistry of the Silicates; University of Chicago Press: Chicago, IL, USA, 1954. [Google Scholar]
  50. Fernandes, B.; Gil, A.M.; Bolina, F.L.; Tutikian, B.F. Thermal Damage Evaluation of Full Scale Concrete Columns Exposed to High Temperatures Using Scanning Electron Microscopy and X-Ray Diffraction. Dyna 2018, 85, 123–128. [Google Scholar] [CrossRef]
Figure 1. Dependence of workability on W/S at different mix temperatures.
Constrmater 06 00014 g001
Figure 2. Morphology of fly-ash particles.
Constrmater 06 00014 g002
Figure 3. FTIR spectra of fly-ash samples.
Constrmater 06 00014 g003
Figure 4. Pore structure images of AAC on sand and on fly ash (scale bar: 10 mm; all images acquired at the same magnification and processed using the same segmentation settings).
Constrmater 06 00014 g004
Figure 5. Pore-size distribution in D600 cellular concrete.
Constrmater 06 00014 g005
Table 1. Cement properties [23].
Cement GradeManufacturerCompressive Strength at 28 Days, At Least, MPaStart of Setting, Not Earlier Than, minSpecific Surface Area, cm2/g
CEM I 42.5 N *Heidelberg Cement, LLP (Shymkent, Kazakhstan)46.81403110
* According to [23], “I” denotes the cement with high (~95%) clinker content, “42.5” is the compressive strength class, and “N” indicates normal early strength.
Table 2. Oxide composition of CEM I 42.5 N, mass % [24].
SiO2Al2O3Fe2O3CaOMgONa2OK2OSO3Other Impurities
22.73.94.1263.883.110.730.60.440.52
Table 3. Gypsum properties [27].
GypsumNormal Consistency, %Setting Start, minSetting End, minCompressive Strength After 2 h, MPaCompressive Strength After Drying, MPaFlexural Strength After 2 h, MPaFlexural Strength After Drying, MPaResidue On Sieve No. 002, %
Construction gypsum G-7597167.610.63.74.515.4
Table 4. Lime oxide composition, % [29].
CaOSiO2MgOAl2O3SO3Other Impurities
80.12.61.31.10.0214.88
Table 5. Particle-size distribution of dune sand [32].
Sieve Opening, mmPartial Residue, %Cumulative Residue, %Fineness Modulus
2.5
1.25
0.630.230.23
0.3156.76.93
0.1447.954.83
Passing 0.1445.17100.000.61
Table 6. Fly-ash chemical composition [33].
SiO2Al2O3Fe2O3CaOMgOOther Impurities
56–6225–274.9–7.53.4–4.01.1–1.31–3
Table 7. Influence of siliceous component type on autoclaved cellular concrete properties.
CompositionConsumption, kg/m3W/SMix Fluidity, cmDensity, kg/m3Compressive Strength * (Mean ± SD), MPa
CEM I 42.5 NLimeSandFly AshPAG-1
120045295.00.00.4160.625.56043.42 ± 0.04
220045265.529.50.4160.626.06183.48 ± 0.16
320045236.059.00.4160.624.56243.52 ± 0.16
420045206.588.50.4160.623.55863.57 ±0.15
520045177.0118.00.4160.623.05903.64 ± 0.14
620045147.5147.50.4160.621.56063.69 ± 0.12
720045118.0177.00.4160.621.06173.72 ± 0.27
82004588.5206.50.4160.620.56433.77 ± 0.12
92004559.0236.00.4160.620.06223.82 ± 0.15
102004529.5265.50.4160.619.06053.83 ± 0.2
11200450.0295.00.4160.618.56003.96 ± 0.10
* Strength values are reported as mean ± standard deviation (SD) from 3 specimens per composition.
Table 8. Influence of siliceous component type on density and macropore-distribution uniformity.
CompositionFA/S, %W/SWorkability, cmTemperature, °CDensity, kg/m3Strength, MPaSD *, mm
10/1000.625.5406183.420.175
225/750.623.0406133.570.163
350/500.621.5406103.690.152
475/250.619.5406063.770.144
5100/00.618.5406003.960.133
* SD of pore diameters was estimated from 3 specimens per composition, with 3 images per specimen (9 images per composition).
Table 9. Physical and technical pore-structure indicators for cellular concrete.
Density ClassMaterialTotal Porosity, cm3/gParticular Values of Porosity, cm3/g
Porosity < 0.1 μmPorosity > 0.1 μm
D500AAC on sand0.6600.2960.364
D500AAC on fly ash0.7010.3360.365
D600AAC on sand0.6320.3100.322
D600AAC on fly ash0.6590.3420.317
D700AAC on sand0.6080.3170.291
D700AAC on fly ash0.6290.3650.264
Table 10. Shrinkage deformation and durability coefficients of AAC on sand and on fly ash.
MaterialCapillary Shrinkage, mm/mFrost Resistance, 25 CyclesWetting–Drying, 25 Cycles
AAC on sand0.590.950.83
AAC on fly ash0.610.960.85
Disclaimer/Publisher’s Note: The statements, opinions and data contained in all publications are solely those of the individual author(s) and contributor(s) and not of MDPI and/or the editor(s). MDPI and/or the editor(s) disclaim responsibility for any injury to people or property resulting from any ideas, methods, instructions or products referred to in the content.