Abstract
Hydrogen is emerging as a crucial energy carrier, yet effective insulation for liquid hydrogen (LH2) storage remains a significant challenge. This study focuses on evaluating the thermal properties of mineral fiber insulation at cryogenic temperatures, utilizing the guarded hot plate method to determine thermal conductivity values between 223 K (−150 °C) and 573 K (300 °C). The measured effective thermal conductivities ranged from 0.0147 to 0.2113 W/mK, varying with temperature. Notably, while high-density materials can be accurately modeled using linear approximations, low-density materials exhibit significant nonlinearity, with discrepancies in thermal conductivity estimates reaching up to 30%. The implications of this research highlight the necessity for precise thermal property assessments in the design of cryogenic systems, emphasizing their potential impact on energy efficiency and reduced carbon emissions. Ultimately, these findings provide essential insights for advancing cryogenic insulation technologies, supporting the broader transition to sustainable hydrogen energy solutions.
1. Introduction
Hydrogen is a key energy carrier of the future due to its unique characteristics, and liquid hydrogen (LH2) has the potential to be a fuel that does not produce carbon dioxide emissions [1]. However, significant challenges arise in the development of large-scale commercial technologies for the storage and transportation of LH2. One of the primary tasks is to assess the thermal properties of insulation systems in the cryogenic temperature range (up to 20 K). Accurate evaluation of the effective thermal conductivity of insulating materials is essential for determining heat losses, testing various insulating components, estimating evaporation rates, designing storage tanks, scaling up LH2 storage systems, and for other cryogenic reservoirs. Insulating materials possess a complex structure, comprising a porous solid matrix and interfacial gas. The effective thermal conductivity of such a structure can vary depending on the material composition, structural characteristics, temperature, pressure, and gas composition at the interface [2,3,4,5,6,7].
Despite the extensive range of materials that can be utilized in cryogenic conditions, mineral fibers remain among the most widely used. This is primarily due to their non-combustible properties and high availability, which stem from their widespread ap-plication in construction. For instance, in the United States, fiberglass is the most commonly used insulation material in residential houses. Considering all areas (walls, floors, and attics) in new single-family homes, fiberglass accounted for 71% of all installations according to the 2019 Home Innovation Research Lab annual survey on building practices. Furthermore, in 2022, the operation of residential and commercial buildings contributed to 30% of the global final energy consumption and 26% of energy-related emissions, with 8% attributed to direct emissions and 18% to indirect emissions from the production of electricity and heat used in buildings. In absolute terms, the energy consumed in building operations in 2022 totaled 132 exajoules, while direct and indirect CO2 emissions from buildings amounted to approximately 3 billion and 6.8 billion tons, respectively [1].
In most of the research presented in the literature, thermal conductivity measurements are conducted within a temperature range close to ambient temperature (typically 298 K ± 50 K). However, it is crucial for the design of liquid hydrogen storage facilities to determine the insulation properties in the temperature range between the normal boiling point of liquid hydrogen (20 K) and room temperature (298 K) [7]. While the theoretical foundations of thermal resistance are relatively straightforward, their practical application in cryogenic conditions is associated with numerous technical and non-technical challenges. Furthermore, the accuracy of reported values is sometimes questioned due to insufficient information about the materials and equipment used.
Several experimental methods exist for measuring thermal insulation properties. A detailed discussion of various experimental methods is beyond the scope of this study. However, some key aspects of thermal conductivity measurement will be presented, focusing on low cryogenic temperatures. In general, two main types of thermal conductivity measurement methods are identified: steady-state methods and transient methods. Typical steady-state methods include the guarded hot plate method, comparative method, ra-dial heat flow method, and others. An example of a transient measurement is the hot disk method [8,9]. Additionally, researchers in cryogenic insulation technology also utilize boiling rate as a means to assess the effective thermal conductivity of insulation systems. This method is analogous to the steady-state calorimeter method described in source [8].
In the present study, the guarded hot plate method was utilized to refine the thermal conductivity of insulating materials based on mineral fibers, as it is regarded as the most accurate method. It should be noted that this experimental approach is quite labor-intensive. Based on the obtained experimental data, potential errors associated with the application of approximation methods for assessing thermal conductivity at cryogenic temperatures were analyzed from both technical and environmental perspectives.
2. Materials and Methods
For the study of thermal conductivity of mineral fiber samples, samples of mineral wool with the characteristics presented in Table 1 were used. The samples were placed in a chamber that was cooled with liquid nitrogen. Spacers were used to fix the thickness of the samples (Figure 1). The load on the samples was 500 Pa.

Table 1.
Key characteristics of the studied samples.
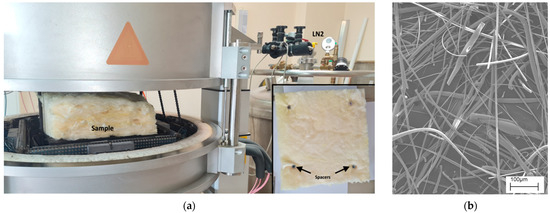
Figure 1.
(a) Image of the installation and sample for testing. (b) Mineral fiber SEM image.
The measurements were carried out in accordance with ASTM C177-19 “Standard Thermal Transmission Properties by Means of the Guarded-Hot-Plate Apparatus” [10]. Calibration was performed using NIST 1450D standards [11] in the range from 270 K to 340 K.
Samples were pre-dried at 105 °C until constant mass was achieved to eliminate residual moisture. Prior to testing, the chamber containing the samples was evacuated to 0.2–0.3 atm to remove trapped air and moisture, after which it was purged and filled with high-purity nitrogen (99.9%) to prevent moisture reabsorption during measurements. The measurements were performed in triplicate for each temperature point and sample, and the presented values are averaged results. The experimental uncertainty, determined through calibration against standard reference materials and repeatability tests, is within ±2%. Steady-state heat flux, defined as a heat flux change of less than 0.5% per hour, was achieved within 5–6 h for each temperature point. All thermal conductivity measurements were performed in the through-thickness direction (Z-direction).
A JEOL JSM-6390LA (Japanese Electron Optics Laboratory, Tokyo, Japan) microscope was used for the scanning electron microscope (SEM) analysis. The accelerating voltage was set to 20 kV. Energy-dispersive X-ray (EDX) analysis was carried out on a JEOL EX-54175 JMH system (JEOL, Ltd., Tokyo, Japan). Before the examinations, all the fibers were coated with a conducting carbon layer.
In this study, the guarded hot plate method was employed to determine the properties of the samples. While it generally requires a longer experimental duration, the thermal conductivity values obtained are more accurate compared to those derived from transient methods. Our setup includes two cold plates alongside a hot plate to create the necessary temperature gradient. The samples are placed between the plates. Figure 2 presents a schematic diagram of the guarded hot plate apparatus, designed for measurements under cryogenic conditions. The thermal power is supplied by an electric heater, and the thermal source is measured by the voltage across the plate and the current flowing through it. Power measurement is usually performed by integrating over a specified time period to enhance accuracy, particularly when the material’s thermal conductivity is low. Measurements using the hot plate method are based on the assumption of heat transfer within the geometry of an infinite layer.
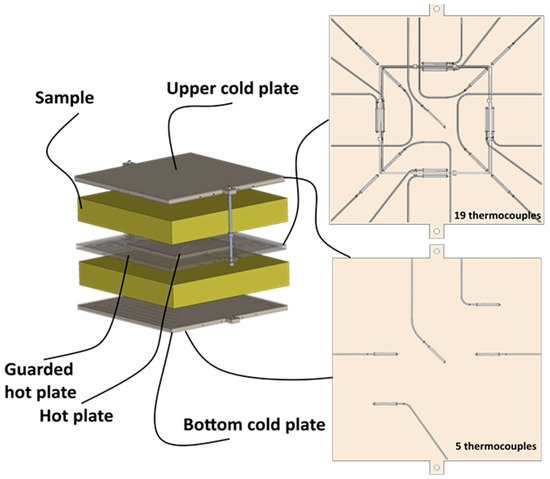
Figure 2.
Scheme of the laboratory plant for determining thermal conductivity by guarded hot plate method.
The guard plate is maintained at the same temperature as the central plate to mini-mize temperature imbalance. A temperature difference between the central plate and the guard ring leads to a heat flow between these components, resulting in an error in estimating the heat flow within the material and in the gap between the central and guard plates. Errors may also arise from thermal losses at the edges. Generally, there may be a discrepancy between the theoretically derived accuracy (±2 to 5%) [10] and the accuracy actually achieved (±10 to +20%) [8]. Steady-state conditions are considered achieved when the guard and central plates reach the same temperature at constant output power. The time required to attain this steady state depends on various factors such as power, sample thickness, and the specified temperature. Once steady state is achieved, the effective thermal conductivity of the insulation sample can be easily calculated using the following unidirectional heat transfer equation:
where T2 and T1 are the temperatures of the hot and cold plates, respectively, and d2 − d1 is the thickness of the sample.
3. Results
The study obtained experimental data on the effective thermal conductivity of three mineral wool samples with varying densities (13.1, 68.6, and 104.3 kg/m3) across a broad temperature range, from −150 °C to 300 °C. Comprehensive analysis revealed distinct temperature-dependent thermal conductivity patterns for all tested materials. The minimum conductivity values were recorded at cryogenic temperatures: 0.0147 W/(m·K) for the high-density sample (MW3) and 0.0201 W/(m·K) for the low-density specimen (MW1) at −150 °C. As temperature increased, thermal conductivity demonstrated nonlinear growth, peaking at 0.2113 W/(m·K) for MW1 and 0.0804 W/(m·K) for MW3 at 300 °C. The sample selection was specifically designed to investigate the widest possible range of material densities, enabling comprehensive evaluation of density-dependent thermal performance.
Table 2 presents the results obtained for mineral wool samples at temperatures ranging from 123.5 to 573.4 K.

Table 2.
Effective thermal conductivity of the studied samples in the temperature ranges from 123.5 to 573.4 K.
Four approximation methods were employed to describe the temperature dependence of thermal conductivity: linear, polynomial (second and third degree), and exponential. Comparative analysis of determination coefficients (r2) revealed that the linear model demonstrated satisfactory accuracy only for high-density materials (r2 = 0.97691 for MW2 and r2 = 0.95181 for MW3), while showing insufficient precision for the low-density MW1 sample (r2 = 0.87426). In contrast, third-degree polynomial approximation achieved superior accuracy for all specimens (r2 ≥ 0.99987 for MW1, r2 = 0.99841 for MW2, r2 = 0.9999 for MW3), indicating significant nonlinearity in temperature dependence, particularly pronounced in low-density materials.
The behavior of the low-density sample (MW1) proved particularly noteworthy, exhibiting discrepancies up to 30% between linear and polynomial models at temperatures below −100 °C. This phenomenon may be attributed to the increasing contribution of radiative heat transfer, which follows a cubic temperature dependence. For high-density materials (MW2 and MW3), the nonlinear effects were less pronounced, making linear approximation suitable for preliminary estimations. The results demonstrate that material density critically influences the appropriate choice of thermal conductivity modeling approach. Based on the obtained data, their fitting was performed using different types of equations: linear, power (third degree), power (fourth degree), and exponential. The calculated coefficients are presented in Table 3.

Table 3.
Regression coefficients and r-squared values for different equation types.
Particularly noteworthy were the findings in the cryogenic region (below −100 °C), where maximum discrepancies between models were observed. For MW1, the difference between linear and polynomial approximations reached 30% at −150 °C, while for MW3 it did not exceed 5%. These results strongly support the hypothesis about different dominant heat transfer mechanisms in materials of varying densities—with low-density samples showing significant contribution from radiative heat transfer, which exhibits nonlinear temperature dependence (Figure 3, Figure 4 and Figure 5).
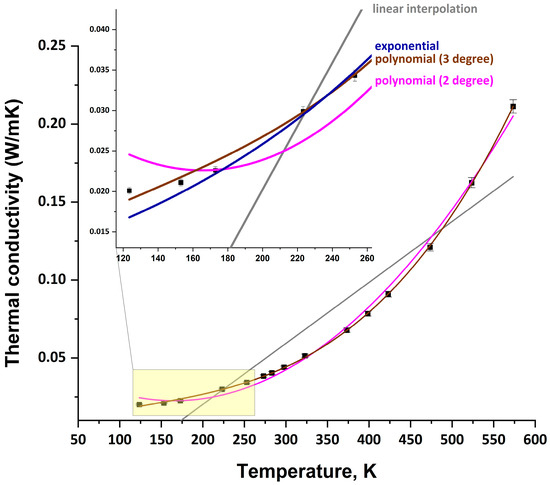
Figure 3.
MW1 thermal conductivity data approximation using various methods (linear, polynomial (third degree), polynomial (fourth degree), and exponential).
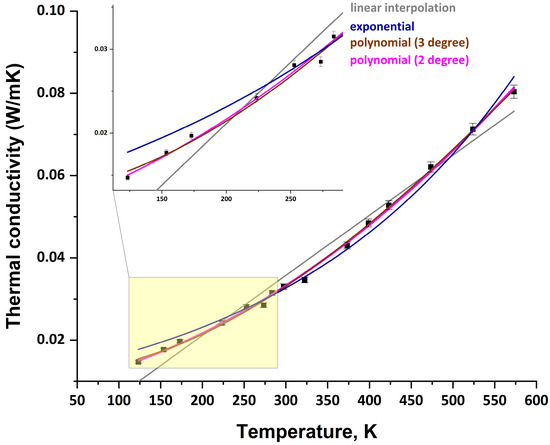
Figure 4.
MW2 thermal conductivity data approximation using various methods (linear, polynomial (third degree), polynomial (fourth degree), and exponential).
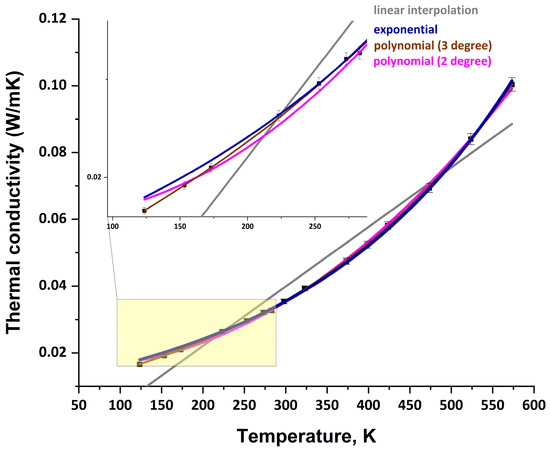
Figure 5.
MW3 thermal conductivity data approximation using various methods (linear, polynomial (third degree), polynomial (fourth degree), and exponential).
4. Discussion
In fibrous insulation, it is customary to consider three types of heat flow: solid conduction (ks), gas conduction (kg), and thermal radiation (kr). These components allow for a detailed analysis of heat transfer through materials, providing more accurate assessments of their thermal insulation properties.
Thermal conductivity of the fiber in the fiberglass insulation (ks) is about 1–1.05 W/(m K), and that of air at room temperature (kg) is 0.026 W/(m K). The thermal conductivity of the major gases found in the insulation at low temperatures is shown in Figure 6 [12].
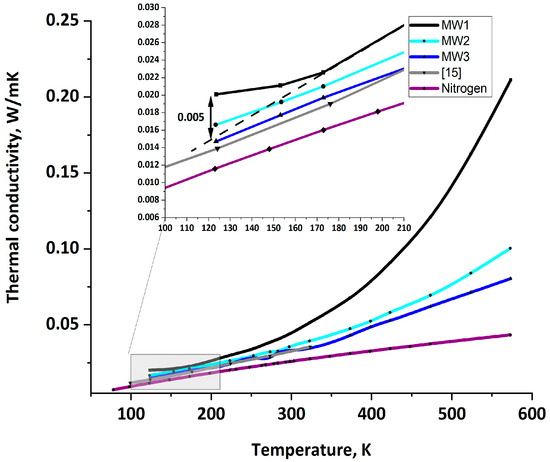
Figure 6.
Mineral wool thermal conductivity at cryogenic temperature range. At low temperatures, low-density samples exhibit strong nonlinearity.
According to [13], solid conduction exhibits a very weak dependence on temperature, which is confirmed by experimental studies [14]. The thermal conductivity of aluminosilicate glasses with the composition 33Na2O·67SiO2 ranges from 0.88 to 1 W/(mK) in the temperature range from 150 to 300 K.
Gas conductivity over a broad temperature range has been extensively studied. The data are presented in Figure 5 [2,15].
Radiation conductivity is typically determined by most researchers using the following formula:
where n is the effective refraction index, σ is the Stefan–Boltzmann constant, and βR is the Rosseland mean extinction coefficient.
The effective thermal conductivity of fibrous insulation materials at cryogenic temperatures is governed by the combined contributions of solid conduction, gaseous conduction, and radiative heat transfer [13]. Conventional models, particularly linear approximations widely used in engineering practice, typically assume that conduction dominates. They often neglect the nonlinear behavior of radiative heat transfer—especially at low temperatures, where the T4 dependence described by the Stefan–Boltzmann law becomes increasingly significant. It is necessary to account for radiative effects in fibrous media through physically based formulations [2,4]. For low-density materials such as MW1 in our study, the application of a linear model results in substantial deviations—up to 30%—in the temperature range from –150 °C to –100 °C. This discrepancy arises from the underestimation of the radiative component, which, despite the low absolute levels of radiation at cryogenic temperatures, exhibits pronounced nonlinearity and becomes comparable to the conductive contribution due to the exponential decrease in gaseous thermal conductivity under vacuum conditions. In contrast, physics-based models, such as the generalized formulation proposed, explicitly incorporate a radiative term proportional to T3 or T4, enabling a more accurate representation of thermal conductivity behavior [13]. However, these models require detailed knowledge of microstructural parameters, including fiber diameter distribution, porosity, optical properties (e.g., extinction coefficient and scattering albedo), and Rosseland mean free path, which are often difficult to obtain without extensive experimental characterization. While the models offer high physical fidelity, their practical implementation is limited by the availability of input data and computational complexity [13]. In contrast, the present study proposes a high-order polynomial empirical approach—specifically third- and fourth-degree polynomials—that, without requiring prior knowledge of microstructural or optical properties, achieves a coefficient of determination (r2) exceeding 0.999 for all tested materials (MW1, MW2, and MW3). For MW1, the linear model yields r2 = 0.971, whereas the fourth-degree polynomial increases it to 0.9996, demonstrating a dramatic reduction in prediction error. This level of accuracy is particularly critical for cryogenic hydrogen storage systems, where even small errors in thermal conductivity estimation can lead to significant miscalculations of boil-off rates and insulation performance over long-duration missions. Therefore, while classical linear models remain convenient for high-density materials (e.g., MW2 and MW3, where r2 > 0.95), they are demonstrably inadequate for low-density fibrous insulations under cryogenic conditions.
The results obtained in our study are consistent with the experimental data reported in the literature for samples with high density [16].
Many researchers use a linear model to approximate data for inaccessible temperature intervals [5]. At the same time, our results revealed an interesting feature: for low-density samples, this approach does not work. While for cases with densities above 30 kg/m3, linear approximation can be applied with sufficient accuracy, for lightweight materials (which are often used in practice), this approach involves considerable inaccuracies. As seen in Figure 6, within the temperature range below 180 K and above 450 K, the thermal conductivity of such materials exhibits strong nonlinearity. We believe that such changes in material properties are likely determined by the radiative component, which has a cubic dependence on temperature (Equation (2)).
At the same time, it is known, for example, that thermal conductivity for expanded polymer materials at cryogenic temperatures is linear [12].
The nonlinear behavior of effective thermal conductivity in low-density materials is often attributed to radiative heat transfer; however, as evidenced by the available literature, this is not the sole factor capable of explaining such behavior, especially under cryogenic conditions. At low densities (e.g., <30 kg/m3), the porosity of the material increases significantly, leading to larger pore sizes and a reduced volume fraction of fibers. This diminishes the contribution of solid-phase conduction while simultaneously amplifying the influence of other heat transfer mechanisms. Although radiative transfer becomes more prominent at elevated temperatures, additional effects emerge at low densities, particularly relevant in cryogenic applications. For instance low-density insulation structures may exhibit spatial inhomogeneities in density, where regions of lower density possess significantly higher effective thermal conductivity compared to denser zones [17]. This non-uniform density distribution results in measured keff values exceeding theoretical predictions, contributing to the observed nonlinearity. Furthermore, at low densities, the role of gas-phase conduction in pores becomes increasingly significant—particularly when a deep vacuum is not fully achieved, as is often the case in cryogenic storage systems [4]. Even at moderate pressures, gas thermal conductivity can exhibit a nonlinear dependence on both density and temperature, especially when the molecular mean free path becomes comparable to the pore dimensions, necessitating the consideration of Knudsen effects [13]. The thermal conductivity of residual gas in the interstitial space at cryogenic temperatures (20–300 K) can reach values in the order of 10 mW/(m·K), which is comparable to or even exceeds the solid-phase conductivity of the fibrous matrix, making gas conduction a dominant mechanism in non-perfectly evacuated systems. Structural heterogeneity, fiber orientation, diameter distribution, and inter-fiber contact resistance significantly affect effective thermal conductivity—especially at low densities where the number of contact points between fibers drastically decreases, weakening the percolation pathways for solid conduction [18]. This reduction in solid conduction pathways enhances the relative importance of gas and radiative contributions. Importantly, under cryogenic conditions, the radiative component, while still present, is substantially reduced due to the T3 dependence of radiative conductivity [19]. However, in low-density, optically thin media, even a small radiative flux can contribute disproportionately due to limited absorption, particularly in layered or sparse fibrous structures. Moreover, phenomena such as condensation of residual gases or adsorbed moisture within pores at cryogenic temperatures can drastically increase thermal conductivity [3]. Therefore, the observed nonlinearity in effective thermal conductivity at low densities under cryogenic conditions arises from a confluence of factors, such as the following: spatial density fluctuations, increased gas-phase conduction (especially under non-ideal vacuum), Knudsen diffusion effects, inter-fiber contact resistance, and, to a lesser extent at low temperatures, radiative transfer and gas conductivity [1,20]. Consequently, while radiative heat transfer plays a role, it is not the sole explanation for the nonlinear behavior—particularly in real-world cryogenic systems where pressure, gas composition, structural imperfections, and secondary phase changes critically influence thermal performance.
The discrepancy in estimating thermal conductivity at −150 °C can reach up to 30% compared to a linear model. For a sample thickness of 100 mm, this leads to a heat flux difference of approximately 10 W/m2. Over continuous operation, this results in an annual energy loss of 87.6 kWh/m2. At an electricity cost of $0.15 per kWh, the additional financial impact amounts to $13.14 per m2 per year. Thus, accounting for accurate values of thermal conductivity can lead to significant savings both in terms of energy efficiency and environmental impact.
5. Conclusions
The results of this study underscore the importance of a thorough evaluation of the thermal properties of insulation materials used in cryogenic liquid hydrogen (LH2) storage systems. Given that hydrogen is regarded as a key energy carrier for the future, the development of effective storage and transportation technologies for LH2 is a pressing task in achieving carbon neutrality and enhancing energy efficiency. Utilizing the guarded hot plate method, we obtained effective thermal conductivity values for mineral fiber samples across a broad temperature range from −150 °C to 300 °C, providing significant insights into cryogenic insulation research.
The measured thermal conductivity values ranged from 0.0147 to 0.2113 W/(m·K), indicating a substantial temperature dependency of these materials’ thermal characteristics. The analysis of the obtained data revealed that while linear models can be used for preliminary estimates of insulation materials with high density, this approach may yield significant inaccuracies for lightweight materials. Specifically, discrepancies in estimating thermal conductivity might reach up to 30% at low temperatures, posing serious practical implications for the design and operation of LH2 storage systems.
These discrepancies highlight the need for the development of more complex models that account for the nonlinear relationships between thermal conductivity and temperature. Such advancements would enhance the accuracy of calculations related to heat loss in cryogenic systems and, consequently, improve overall energy efficiency. Importantly, inaccuracies in thermal conductivity estimations can lead to substantial financial losses for energy consumers, further emphasizing the necessity for precise thermal property analyses.
Author Contributions
S.G.: conceptualization, methodology, formal analysis, investigation, and writing—original draft preparation; P.P.: conceptualization, methodology, validation, writing, review, and editing. All authors have read and agreed to the published version of the manuscript.
Funding
This work has been supported by the grants from the Russian Science Foundation, RSF 24-29-00279.
Data Availability Statement
The data presented in this study are available on request from the corresponding author.
Conflicts of Interest
The authors declare no conflicts of interest.
References
- Yousefi, S.H.; Groenenberg, R.; Koornneef, J.; Juez-Larré, J.; Shahi, M. Techno-Economic Analysis of Developing an Underground Hydrogen Storage Facility in Depleted Gas Field: A Dutch Case Study. Int. J. Hydrogen Energy 2023, 48, 28824–28842. [Google Scholar] [CrossRef]
- Hofmann, A. The Thermal Conductivity of Cryogenic Insulation Materials and Its Temperature Dependence. Cryogenics 2006, 46, 815–824. [Google Scholar] [CrossRef]
- Lu, F.; Kaviany, M.; Williams, J.; Addison-Smith, T. Heat, Mass and Momentum Transport in Wet Mineral-Wool Insulation: Experiment and Simulation. Int. J. Heat. Mass. Transf. 2024, 228, 125644. [Google Scholar] [CrossRef]
- Choudhary, M.K.; Eastes, W. Effective Thermal Conductivity of Fiberglass Insulation. Int. J. Appl. Glass Sci. 2024, 15, 307–316. [Google Scholar] [CrossRef]
- Yousefi, Y.; Tariku, F. Thermal Conductivity and Specific Heat Capacity of Insulation Materials at Different Mean Temperatures. J. Phys. Conf. Ser. 2021, 2069, 012090. [Google Scholar] [CrossRef]
- Khoukhi, M.; Hassan, A.; Al Saadi, S.; Abdelbaqi, S. A Dynamic Thermal Response on Thermal Conductivity at Different Temperature and Moisture Levels of EPS Insulation. Case Stud. Therm. Eng. 2019, 14, 100481. [Google Scholar] [CrossRef]
- Vrána, T.; Björk, F. Frost Formation and Condensation in Stone–Wool Insulations. Constr. Build. Mater. 2009, 23, 1775–1787. [Google Scholar] [CrossRef]
- Presley, M.A.; Christensen, P.R. Thermal Conductivity Measurements of Particulate Materials 1. A Review. J. Geophys. Res. 1997, 102, 6535–6549. [Google Scholar] [CrossRef]
- Yüksel, N. The Review of Some Commonly Used Methods and Techniques to Measure the Thermal Conductivity of Insulation Materials. In Insulation Materials in Context of Sustainability; Almusaed, A., Almssad, A., Eds.; InTech: London, UK, 2016; ISBN 978-953-51-2624-9. [Google Scholar]
- ASTM C177-19; Test Method for Steady-State Heat Flux Measurements and Thermal Transmission Properties by Means of the Guarded-Hot-Plate Apparatus. ASTM: West Conshohocken, PA, USA, 2019.
- Zarr, R.R.; Leigh, S.D. Standard reference material 1450d, fibrous glass board, for thermal insulation measurements. In Next-Generation Thermal Insulation Challenges and Opportunities; Stovall, T.K., Whitaker, T., Eds.; ASTM International: West Conshohocken, PA, USA, 2014. [Google Scholar]
- Tseng, C.; Yamaguchi, M.; Ohmori, T. Thermal Conductivity of Polyurethane Foams from Room Temperature to 20 K. Cryogenics 1997, 37, 305–312. [Google Scholar] [CrossRef]
- Ratnakar, R.R.; Sun, Z.; Balakotaiah, V. Effective Thermal Conductivity of Insulation Materials for Cryogenic LH2 Storage Tanks: A Review. Int. J. Hydrogen Energy 2023, 48, 7770–7793. [Google Scholar] [CrossRef]
- Hiroshima, Y.; Hamamoto, Y.; Yoshida, S.; Matsuoka, J. Thermal Conductivity of Mixed Alkali Silicate Glasses at Low Temperature. J. Non-Cryst. Solids 2008, 354, 341–344. [Google Scholar] [CrossRef]
- Hemminger, W.; Jugel, R. A Guarded Hot-Plate Apparatus for Thermal Conductivity Measurements over the Temperature Range 75 to 200 C. Int. J. Thermophys. 1985, 6, 483–498. [Google Scholar] [CrossRef]
- Koenen, A.; Stacey, C.; Rasmussen, E.; Schreiner, R.; Swołek, G. International Comparison of Guarded Hot Plate Facilities at Low Temperature on Mineral Wool Insulation Material. In Proceedings of the 32nd International Thermal Conductivity Conference 20th International Thermal Expansion Symposium, West Lafayette, IN, USA, 27 May 2014; pp. 123–128. [Google Scholar]
- Houston, R.L.; Korpela, S.A. Heat Transfer Through Fiberglass Insulation. In Proceedings of the International Heat Transfer Conference 7, Munich, Germany, 6–10 September 1982; Begellhouse: Munich, Germany, 1982; pp. 499–504. [Google Scholar]
- Bankvall, C. Guarded Hot Plate Apparatus for the Investigation of Thermal Insulations. Mat. Constr. 1973, 6, 39–47. [Google Scholar] [CrossRef]
- Daryabeigi, K.; Cunnington, G.; Miller, S.; Knutson, J. Combined Heat Transfer in High-Porosity High-Temperature Fibrous Insulations: Theory and Experimental Validation. In Proceedings of the 10th AIAA/ASME Joint Thermophysics and Heat Transfer Conference, Chicago, IL, USA, 28 June 2010; American Institute of Aeronautics and Astronautics: Chicago, IL, USA, 2010. [Google Scholar]
- Walayat, K.; Duesmann, J.; Derks, T.; Houshang Mahmoudi, A.; Cuypers, R.; Shahi, M. Experimental and Numerical Investigations for Effective Thermal Conductivity in Packed Beds of Thermochemical Energy Storage Materials. Appl. Therm. Eng. 2021, 193, 117006. [Google Scholar] [CrossRef]
Disclaimer/Publisher’s Note: The statements, opinions and data contained in all publications are solely those of the individual author(s) and contributor(s) and not of MDPI and/or the editor(s). MDPI and/or the editor(s) disclaim responsibility for any injury to people or property resulting from any ideas, methods, instructions or products referred to in the content. |
© 2025 by the authors. Licensee MDPI, Basel, Switzerland. This article is an open access article distributed under the terms and conditions of the Creative Commons Attribution (CC BY) license (https://creativecommons.org/licenses/by/4.0/).