Article

Comprehensive Analysis of Microstructure and Mechanical, Operational, and Technological Properties of AISI 321 Austenitic Stainless Steel at Electron Beam Freeform Fabrication

1
Laboratory of Mechanics of Polymer Composite Materials, Institute of Strength Physics and Materials Science of Siberian Branch of Russian Academy of Sciences, 634055 Tomsk, Russia
2
Department of Advanced Technologies, Tomsk Polytechnic University, 634050 Tomsk, Russia
3
Laboratory of Physics of Structural Transformation, Institute of Strength Physics and Materials Science of Siberian Branch of Russian Academy of Sciences, 634055 Tomsk, Russia
4
Laboratory of Local Metallurgy in Additive Manufacturing, Institute of Strength Physics and Materials Science of Siberian Branch of Russian Academy of Sciences, 634055 Tomsk, Russia
5
Laboratory of Materials Science of Shape Memory Alloys, Institute of Strength Physics and Materials Science of Siberian Branch of Russian Academy of Sciences, 634055 Tomsk, Russia
*
Author to whom correspondence should be addressed.
Constr. Mater. 2025, 5(3), 62; https://doi.org/10.3390/constrmater5030062 (registering DOI)
Submission received: 18 July 2025 / Revised: 22 August 2025 / Accepted: 28 August 2025 / Published: 30 August 2025
(This article belongs to the Special Issue Mineral and Metal Materials in Civil Engineering)

Abstract

The aim of this study was to investigate microstructure and the mechanical and operational characteristics of thick and thin walls 3D-built by electron beam additive manufacturing (EBAM). In addition, the milling parameters (rotation speed, feed, and cutting width) were optimized based on simultaneous assessments of Ra roughness on the machined surfaces and material removing rate values. The wall dimensions did not exert a noticeable effect on their chemical compositions, as compared with the original wires used for 3D printing. In comparison, the strength characteristics of the wrought steel (cold-rolled plate) were higher due to finer grains, with both ferrite content and dislocation density being greater as well. In the 3D building process, multiple thermal cycles gave rise to the formation of elongated columnar grains, reducing the strength characteristics. The corrosion rate of the wrought steel was almost twice those of the 3D-printed blanks because of the higher content of both ferrite and twins. By assessing the machinability of the EBAM-built blanks using the stationary milling machine, the cutting forces were comparable due to similar mechanical properties (including microhardness). To improve the removing rate values and reduce the cutting forces, it is recommended to enhance the cutting speeds while not increasing the feeds. For the semi-industrial milling machine, both linear multiple regression and nonlinear neural network models were applied. An integrated approach was proposed that rationally determined both additive manufacturing and post-processing parameters based on a combination of express assessment and analysis of the mechanical, operational, and technological characteristics of built products within a single laboratory complex.

1. Introduction

Typically, stainless steels are classified over five categories: (i) austenitic, (ii) ferritic, (iii) martensitic, (iv) duplex, and (v) precipitation-hardened. Among them, the austenitic one is the largest in terms of fabricated metal products [1]. It includes the AISI 321 grade, developed on the basis of the Fe-18Cr-8Ni alloy, which is widely used for manufacturing critical structures. The alloying with a small amount of titanium (exceeding the carbon content by five times) is intended to promote the formation of finely dispersed TiC carbides (instead of M23C6 ones) for stabilization of the austenitic phase [2]. As a result, the AISI 321 steel possesses excellent resistance to intercrystalline corrosion and has stable functional properties at elevated temperatures. Therefore, it is often operated under severe conditions, such as high pressures, exposure to radiation, and corrosive environments [3].
Unlike conventional production routes, additive manufacturing (AM) is capable of improving efficiency while being environmentally friendly. When applied to metallic materials, it includes various methods: Selective Laser Melting (SLM), Electron Beam Selective Melting (EBSM), Wire Laser AM (WLAM), Wire Arc AM (WAAM), and Electron Beam AM (EBAM) [3,4,5,6,7,8,9,10,11,12,13,14], etc.
Compared with both WLAM and WAAM, EBAM is characterized by a higher production rate (up to 12 kg/h [7]), as well as reduced atmospheric pollution [8] and spattering of molten feedstocks [9,10]. On the other hand, it is carried out in a vacuum at high power densities (up to ~104 kW/cm2) [11]. The latter can cause burnout of alloying elements [12] that directly affect the functional characteristics of AM products. Therefore, this phenomenon should be carefully controlled.
Adjusting the AM parameters (energy characteristics of heat sources; building trajectory, strategy, and rate; product dimensions, etc.) affects the formation of microstructure and performance properties of the 3D-printed parts. For example, the AISI 321 steel SLM blanks exhibited great strength at relatively low elongation due to both grain refinement and high residual stresses [4,5]. According to [6,13], the 321 steel WAAM samples exhibited uniform bulk hardness distributions, in contrast to the AISI 420 ones (belonging to the martensitic class).
In a previous study by the authors [14], the AISI 420 steel EBAM samples built in the horizontal and vertical directions were characterized by different microstructure and hardness values. In addition, the mechanical properties were changed (mostly decreased) by varying their dimensions [15], which somehow limits the range of possible EBAM applications. Furthermore, Antunes, P.D. et al. [16] showed that variations in heat input during the welding process of AISI 317L steel significantly influence its microstructure and mechanical properties. In addition, mechanical properties were revealed to improve following the prolonged aging (at T = 700 °C for t = 100 h). Silva C. C. et al. [17] revealed that the heat input can also affect the corrosion resistance and hardness by affecting the ferrite content when welding 316L/AWS E309MoL.
Another challenge is caused by both the low quality and high roughness of the surfaces on built EBAM products [14], compared to those inherent to the powder-based AM methods (in particular, SLM). However, these characteristics can be significantly improved by fine turning and/or milling [18]. On the other hand, EBAM has a higher production rate and is better suited for the fabrication of large-scale components [6,7,8,9,10]. Thus, mechanical post-processing should be carried out in these cases (which is currently receiving much attention [18]).
AM techniques have advantages in customization, prototyping, and building of complex structures. Nevertheless, they are typically not suitable for mass production that requires, among other things, the use of expensive stationary equipment for multi-axis mechanical post-processing. At the same time, semi-industrial (laboratory) machines are cheaper and more flexible in reconfiguration than the industrial facilities. They are typically deployed for small-scale production according to individual designs or are easily optimized over the mechanical post-processing parameters.
Taking into account the demand for wire-based AM procedures, implementation of semi-industrial CNC milling machines for mechanical post-processing seems to be promising. This allows optimizing their parameters, improving accuracy, and reducing surface roughness, as well as determining the relationships between them and the machinability of AM products, minimizing the need for microstructural examinations.
Regardless of there being a lot of publications on microstructure and mechanical properties of the AISI 321 steel AM samples, very few were devoted to the machinability of the EBAM ones, including optimization of cutting forces, material removal rate (MRRs), and roughness on the machined surfaces. Since changes in the microstructures of metallic materials (and the mechanical properties as a result) affect their machinability, it is relevant to fill this knowledge gap. In this way, various optimization techniques can be applied [19,20]. For instance, the Taguchi method was utilized for considering the influence of the cutter rotation frequency, feed rate, and milling depth on the surface roughness, as well as tool wear and MRR values [21]. Some tools of various shapes and sizes were tested at different feed rates, and the ratios between the cutting depth and width were tested to compare both their wear and cutting forces [22]. It was shown that selection of the milling parameters is a complex, multi-criteria problem associated with a necessity to conduct a large number of full-scale experiments.
Based on the above, one can conclude that there are very few publications available on a comprehensive complex evaluation of the microstructure, mechanical properties, corrosion resistance, and machinability of 3D-printed samples. The aim of this study was to investigate microstructures, as well as mechanical and operational (corrosion resistance) properties, of the AISI 321 steel EBAM samples 3D-built according to different strategies. In addition, the milling parameters (rotation speed, feed, and cutting width) were optimized based on simultaneous assessments of both Ra roughness on the machined surfaces, as well as MRR values.

2. Materials and Methods

2.1. Materials

The AISI 321 steel wires with diameters of 1.2 mm and 1.6 mm [‘Normin’ Ltd., Tomsk, Russia] were used as feedstocks. In addition, a wrought steel of the same grade (TISCO, Taiyuan, China) was tested for comparison.

2.2. Building EBAM Samples

Samples of two types (thin and thick walls) were 3D-built using an EBAM facility with a vacuum chamber of 8 m3, developed by the Institute of Strength Physics and Materials Science SB RAS [23]. In all cases, the AISI 321 steel plates, 5 mm thick, were used as substrates, which were initially ground and cleaned with acetone.
The thick wall with dimensions of 85 mm × 20 mm × 25 mm (Figure 1a) was 3D-built from the ∅1.2 mm wire at an accelerating voltage of 30 kV, a pressure of 5 × 10⁻³ Pa, a 3D-printing speed of 400 mm/min, and a wire feed rate of 1768 mm/min. A ring scanning algorithm was applied for an electron beam with a diameter of 4 mm at a frequency of 1 kHz. The beam current was 75 mA for the first layer and 50 mA for all subsequent ones, with a thickness of 1 mm.
For building the thin walls with dimensions of 120 mm × 10 mm × 8 mm (Figure 1b), ∅1.6 mm wire was used at an accelerating voltage of 30 kV, a pressure of 3 × 10⁻³ Pa, a 3D-printing speed of 280 mm/min, and a wire feed rate of 1768 mm/min. The ring scanning algorithm was also applied for an electron beam with a diameter of 5 mm and a frequency of 1 kHz. The beam current was 75 mA for the first and second layers and 73 and 72 mA for the third and fourth ones, respectively, while it was 70 mA for all subsequent layers 1 mm thick. The above differences in the EBAM parameters were determined by variations in both the wall sizes and the wire diameters. On one substrate, two thin walls were simultaneously built parallel to each other at a distance of 20 mm, alternately depositing layers onto each of them.

2.3. Microstructural Examinations and Tensile Tests

For uniaxial tensile tests, dog-bone specimens were cut from the walls by electrical discharge machining (EDM). The tests were performed with a ‘UTS-110M-100’ electromechanical testing machine (ZwickRoell Group, Ulm, Germany) at a cross-head speed of 2 mm/min.
For microstructural examinations, the sample surfaces were successively ground with SiC sandpapers P600, P800, and P1000 and then polished using diamond pastes with dispersions of 6, 3, and 1 μm. After that, the surfaces were etched with Kroll reagent, consisting of a mixture of concentrated nitric HNO3 (67 wt.%) and hydrochloric HCl (33 wt.%) acids taken in a ratio of 1:3 by volume.
The microstructures were investigated using an ‘Axio Observer’ optical microscope (OM; Zeiss, Oberkochen, Germany), a ‘Gemini 500 Zeiss’ scanning electron microscope (SEM; Zeiss, Oberkochen, Germany), and a ‘JEM-2100’ transmission electron microscope (TEM) equipped with an ‘Oxford INCA X-Act’ energy-dispersive X-ray spectroscopy (EDX) detector (JEOL Ltd., Tokyo, Japan). Both grain structure and phase compositions were examined using a ‘Gemini 500’ SEM with an ‘Oxford Instruments’ backscattered diffraction electron recording add-on.
Vickers microhardness tests were performed using an automatic complex based on an ‘EMCO-TEST DuraScan-10’ setup (EMCO-TEST PrufmaSchinen GmbH, Graz, Austria) at a load of 1 kgf and a holding time of 10 s. The microhardness values were estimated as averages over ten different points.

2.4. Evaluation of Chemical Compositions

The chemical compositions of the AISI 321 steel wires, as well as both thick and thin walls, were evaluated using a ‘Shimadzu XRF-1800’ scanning X-ray fluorescence spectrometer (thin-end-window Rh anode X-ray tube; Shimadzu Corporation, Kyoto, Japan).

2.5. Corrosion Tests

Corrosion resistance was assessed in the accelerated pitting corrosion resistance tests according to the Russian state standard GOST 9.912-89 [24], using a ‘PalmSens4’ setup (PalmSens BV, Houten, The Netherlands) for studying electrochemical impedance spectroscopy (EIS).

2.6. Study of Cutting Forces upon Milling with an Industrial Machine

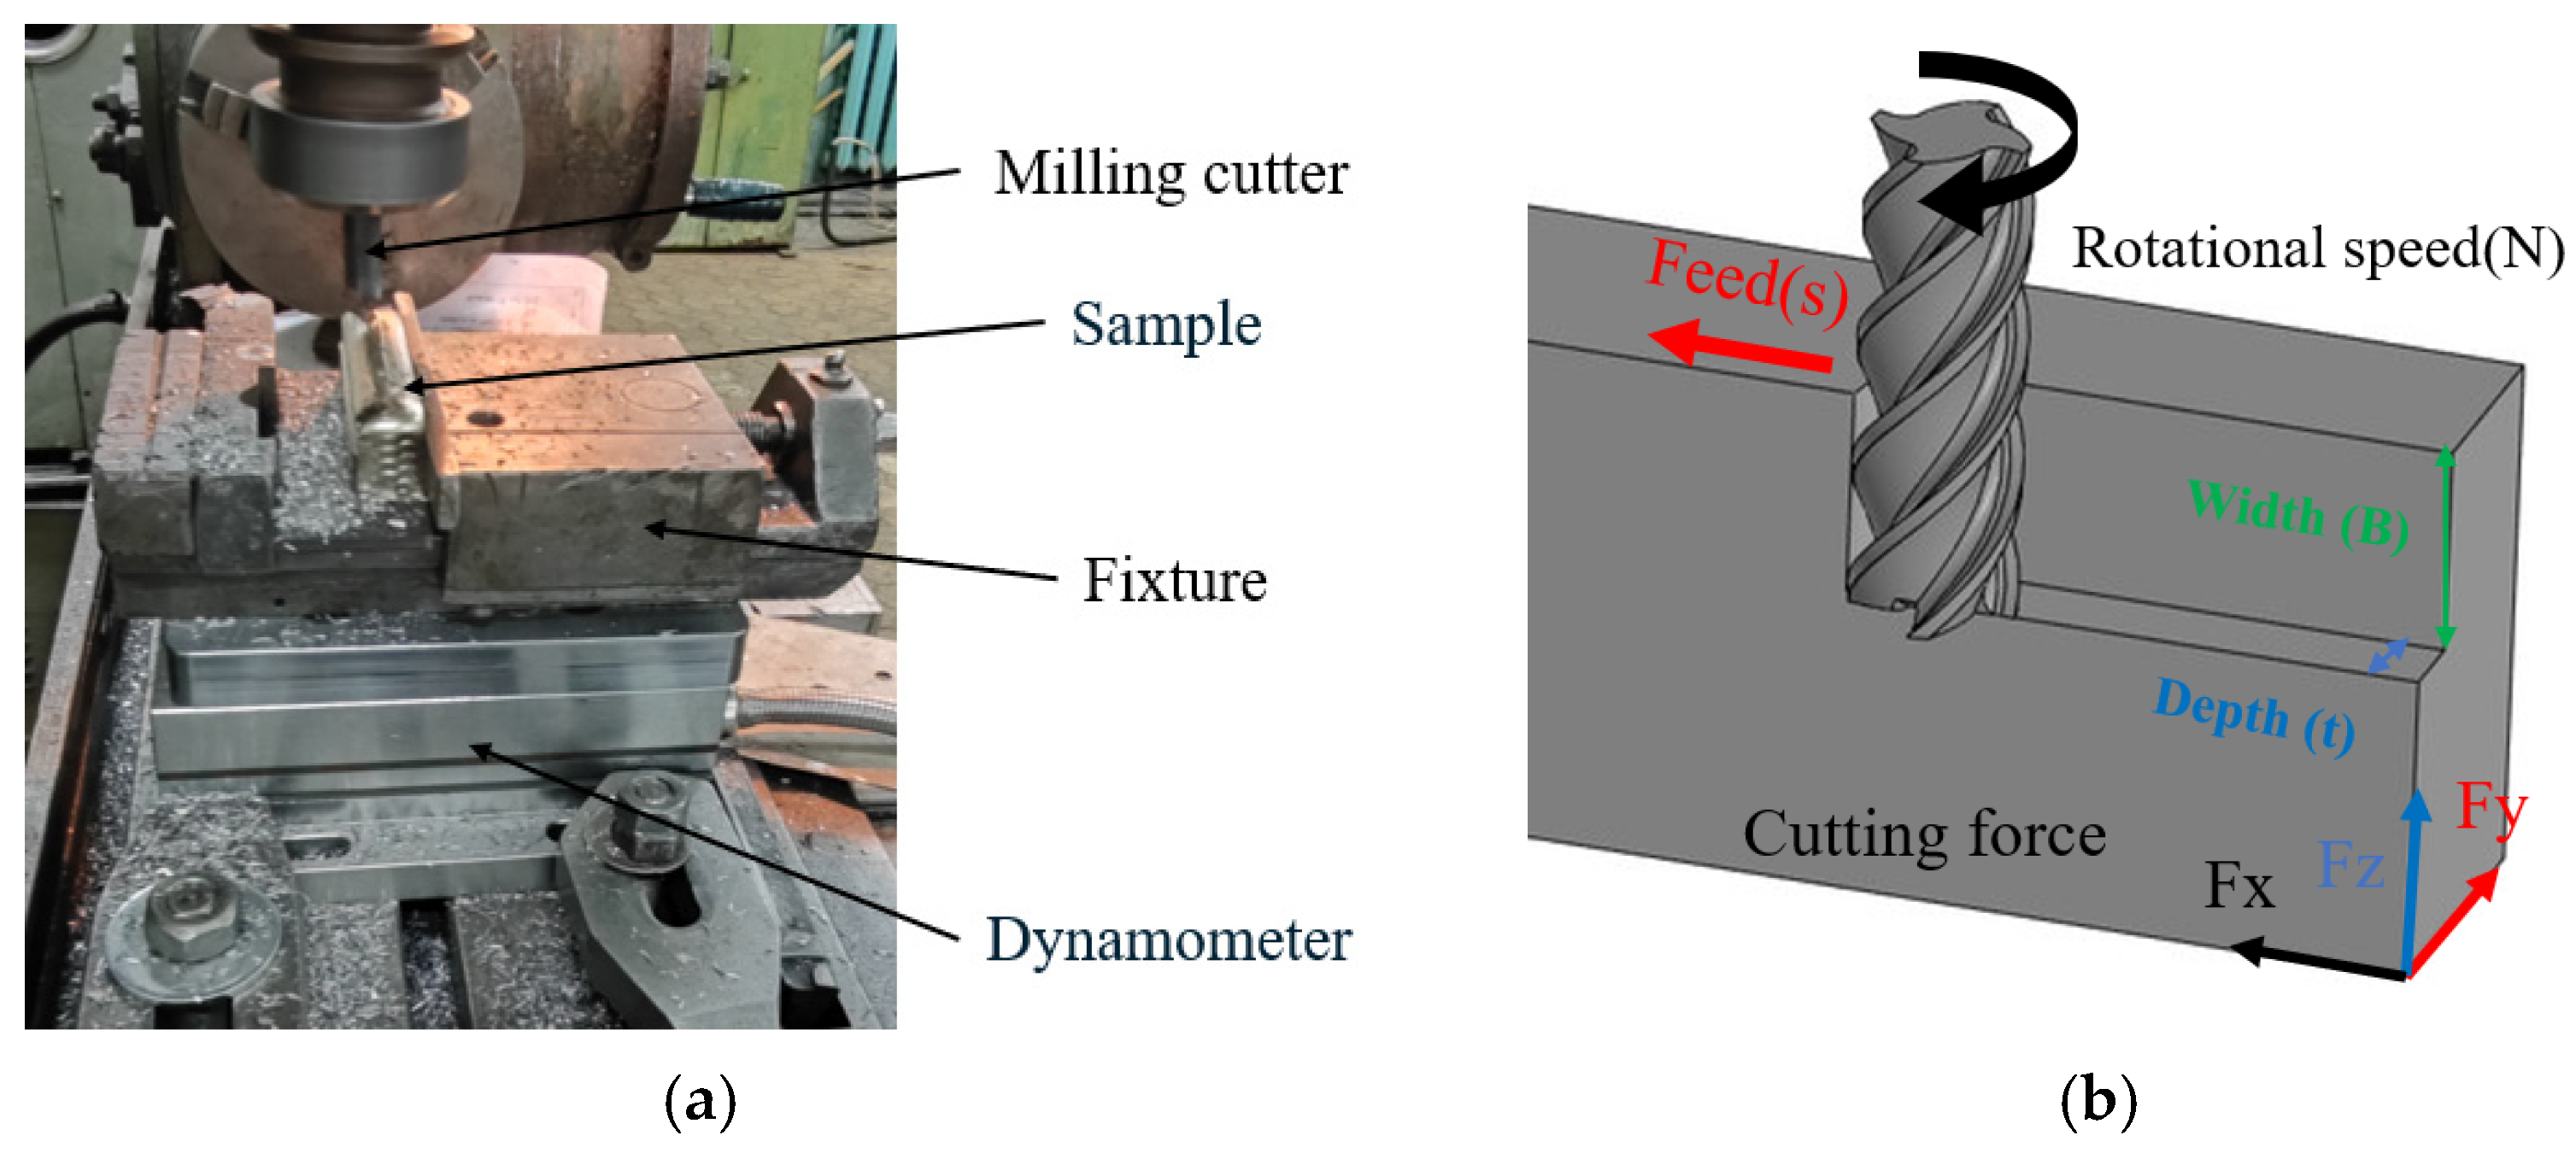
At the first stage, a ‘FU 251’ industrial milling machine (‘Krasny Proletary’ Inc., Moscow, Russia) was utilized. Since this industrial machine is not designed for the use of cutting fluids, the dry milling mode was utilized. Cutting forces were determined with a ‘Kistler 9257B’ dynamometer (Kistler Group, Winterthur, Switzerland; Figure 2a) by analyzing the obtained data with the ‘DynoWare 5697A1’ software package.
Figure 2b shows the milling parameters, including (i) feed, (ii) cutting speed, (iii) depth, (iv) width, and (v) cutting force direction. The ‘UP210-S4-12030’ tungsten carbide end mills (GESAC, Xiamen, China) were used with a diameter of 12 mm, a ω helix angle of 35°, a working length of 30 mm, a total length of 75 mm, a rake angle of 7°, and a clearance angle of 5°.
To determine the cutting forces for both thick and thin walls, nine milling modes were applied (Table 1), which included the following combinations of the parameters: low speed and high feed and high speed and low feed, as well as medium speed and medium feed, etc. The milling parameters were selected based on recommendations of the manufacturer. It should be noted that the high-performance milling mode (great width/depth ratio according to Table 1) made it possible to slow down wear of the end mills.

2.7. Optimization of the Cutting Parameters for a Semi-Industrial CNC Machine

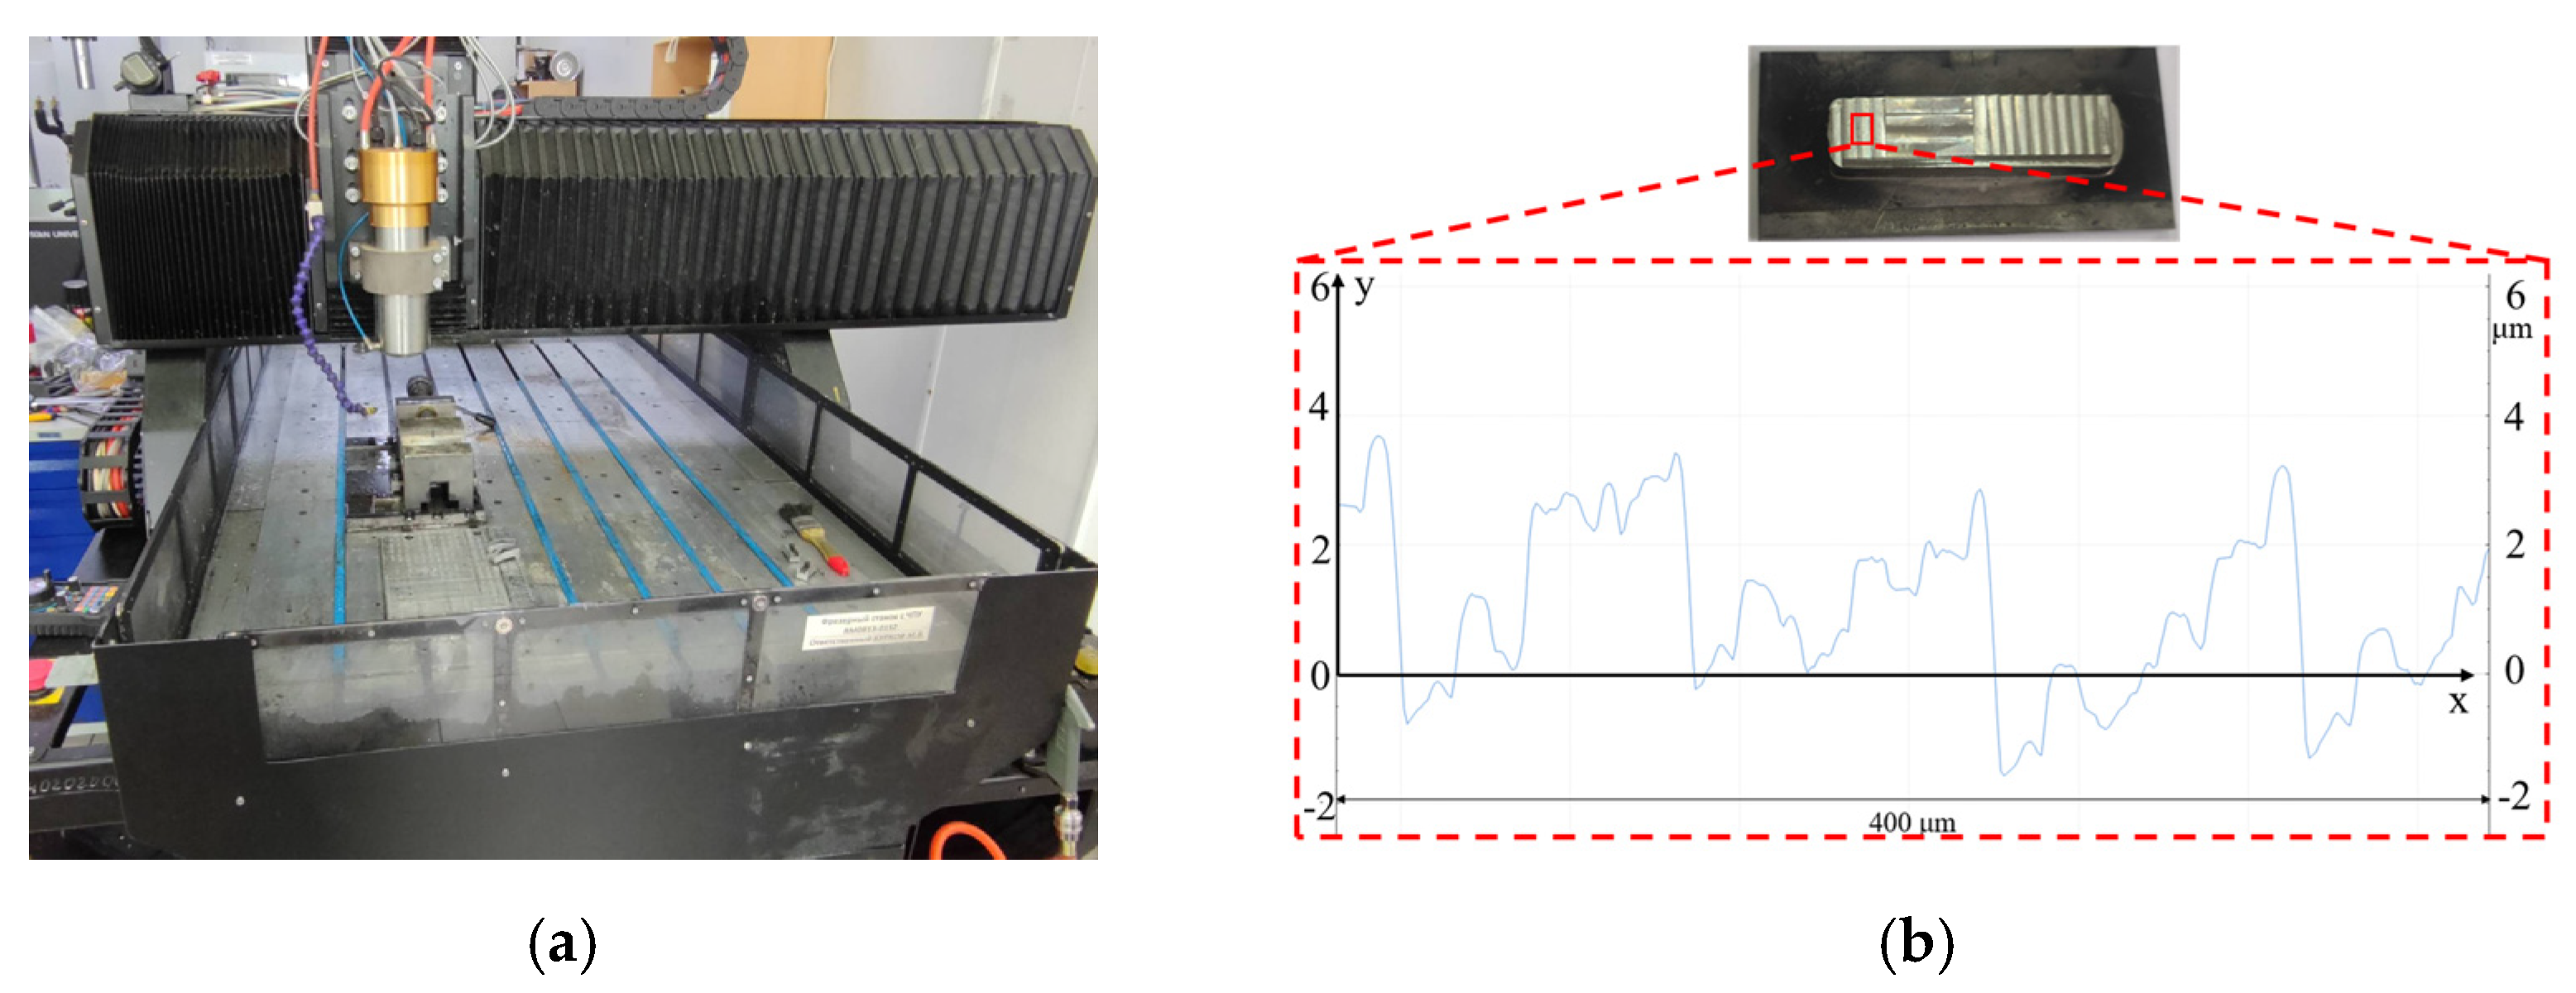
The walls were also milled with an ‘RM0813-01S2’ semi-industrial CNC machine (Purelogic R&D LLC, Moscow, Russia, Figure 3a) using ‘VSM-4E-D8.0’ tungsten carbide end mills (ZC-CCT, Zhuzhou, China) with a diameter of 8 mm, variable ω helix angles of 38/41°, a working length of 20 mm, a total length of 60 mm, a rake angle of 7°, and a clearance angle of 10°. Due to the lower stiffness of the semi-industrial CNC machine, cutting fluid was utilized during the milling process to improve the efficiency of the machining.
After milling, the Ra roughness values were measured on the flank surfaces (Figure 3b) with a ‘TR200’ contact (stylus) profilometer (China). Nine milling modes according to the Taguchi method (Table 2) were applied to assess both Ra roughness and MRR values. Higher cutting speeds and feed rates were used to improve the production rate and reduce cutting forces.

3. Chemical Compositions, Microstructures, and Mechanical Properties

3.1. Chemical Composition

The results of the evaluation of the chemical compositions of the AISI 321 steel wires and the 3D-built walls are presented in Table 3.
As mentioned above, both vacuum and high temperatures in the EBAM processes could contribute to the burnout of the alloying elements [11]. However, their contents remained virtually unchanged in this study, according to Table 3. Thus, reductions in the mechanical properties of the walls, reported below in Section 3.2, were more likely caused by the formed micro- and macrostructures.

3.2. Microstructures and Mechanical Properties

Figure 4 shows OM images of the microstructures of both types of built walls and the wrought steel. In the walls, no discontinuities or cracks were found. In all cases, ferrite (dark areas) and austenite (light regions) were clearly visible as the main phases. It should be noted that it was difficult to determine the grain sizes of austenite from the OM images. In contrast to the wrought steel, the microstructures of the walls consisted of acicular ferrite and austenite (similar to that reported previously for the AISI 321 WAAM sample [6]). Since, as will be shown below, both walls possessed similar microstructures, the thin wall was examined in more detail, due to its greater length.
According to the SEM-EDS mapping patterns presented in Figure 5, ferrite was characterized by a greater chromium content, while austenite included more nickel, with a uniform distribution of iron. In the walls, the observed carbides could be classified as TiC (shown by arrows in Figure 5a) but not M23C6, since almost no iron and chromium were detected in such areas. As reported previously [2], the presence of TiC particles exerted virtually no effect on the corrosion resistance of the AISI 321 steel (in contrast to M23C6, the presence of which resulted in its deterioration).
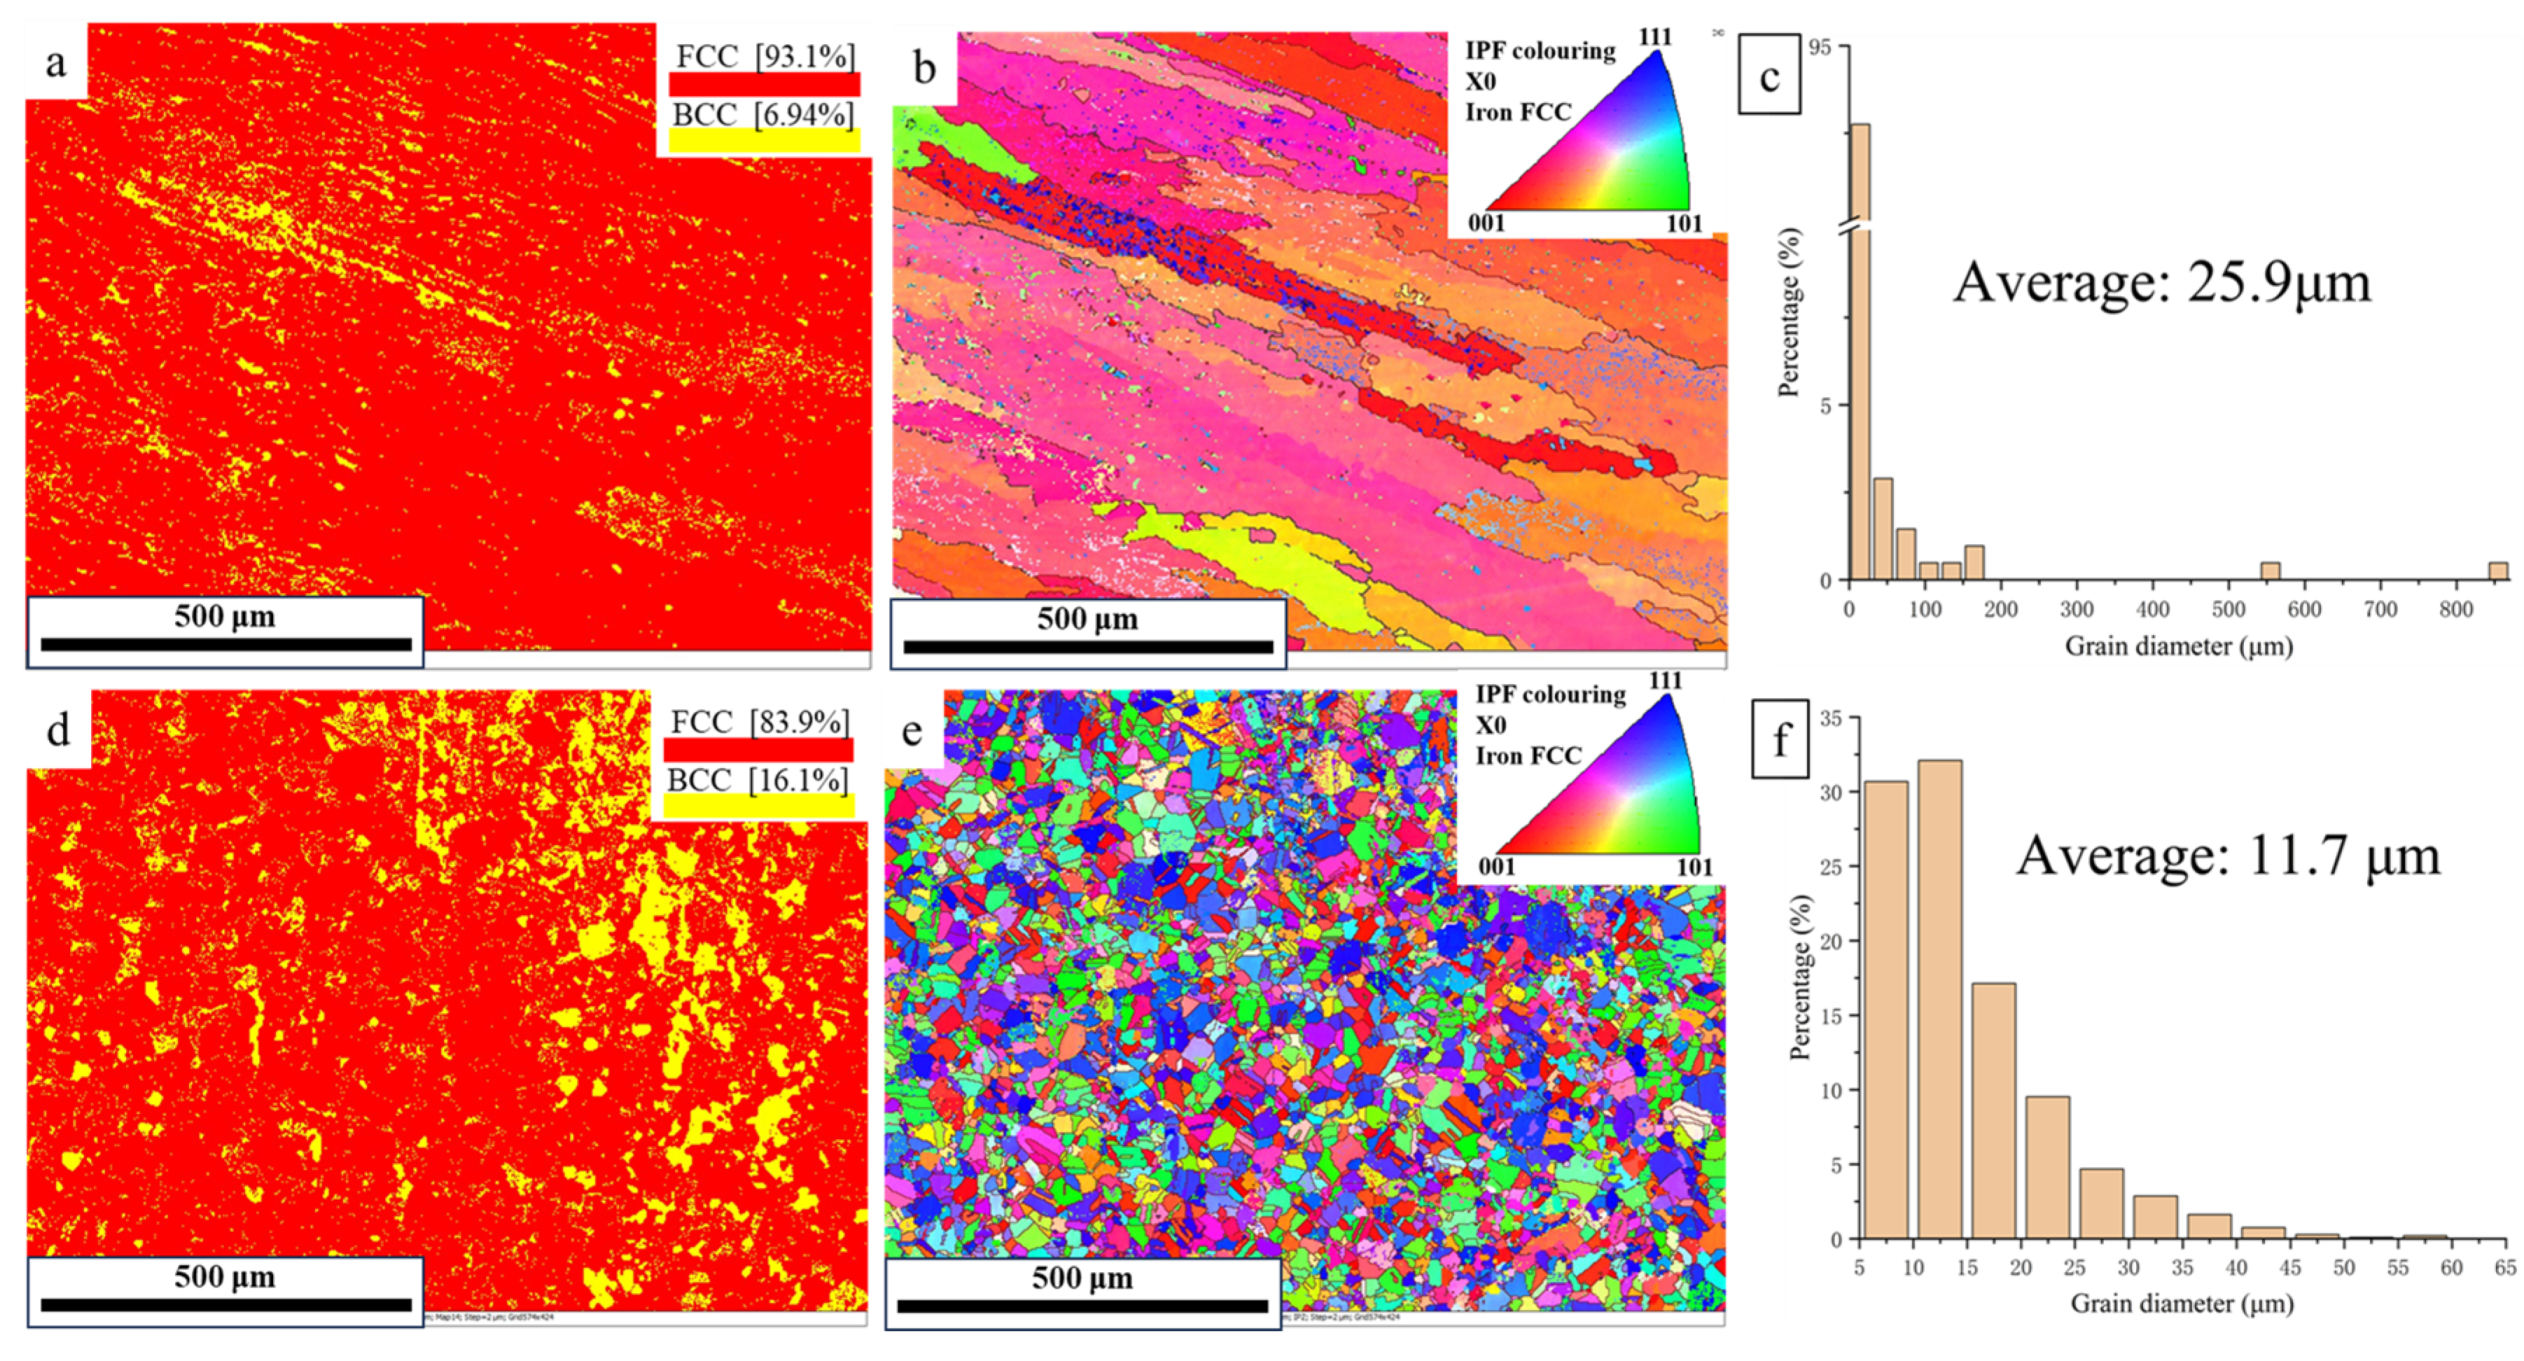
The microstructure of the thin wall consisted of 6.9% ferrite and 93.1% austenite (Figure 6a), while their contents differed significantly (16.1% and 83.9%, respectively) in the wrought steel (Figure 6d). According to the authors, the reason was the high cooling rate during the EBAM process, reducing the formation of ferrite [25].
In the wrought steel, the microstructure comprised uniaxial fine grains with average sizes of ~11.7 μm (Figure 6e), while large columnar ones were observed in the thin wall (Figure 6b). This phenomenon might be due to the repeated thermal cycles being characteristic of the EBAM method, promoting the growth of austenite grains in contrast to conventional production routes. Along the major axis, the columnar grain sizes reached ~850 μm, while their average dimensions were ~25.9 μm (Figure 6c). The formation of columnar grains were inevitably accompanied by a decrease in the 3D-built wall strength [26]. On the other hand, as shown below, the increase in their sizes exerted virtually no effect on corrosion resistance, especially in the pitting corrosion tests [27].
It should also be noted that the observed decrease in the ferrite content affected the corrosion resistance of the thin wall, since it contained more chromium (above the average level) [2]. As a result, chromium-depleted regions could be formed around ferrite inclusions, reducing corrosion resistance there. On the other hand, ferrite possessed higher strength than that of austenite, contributing to the wall hardening.
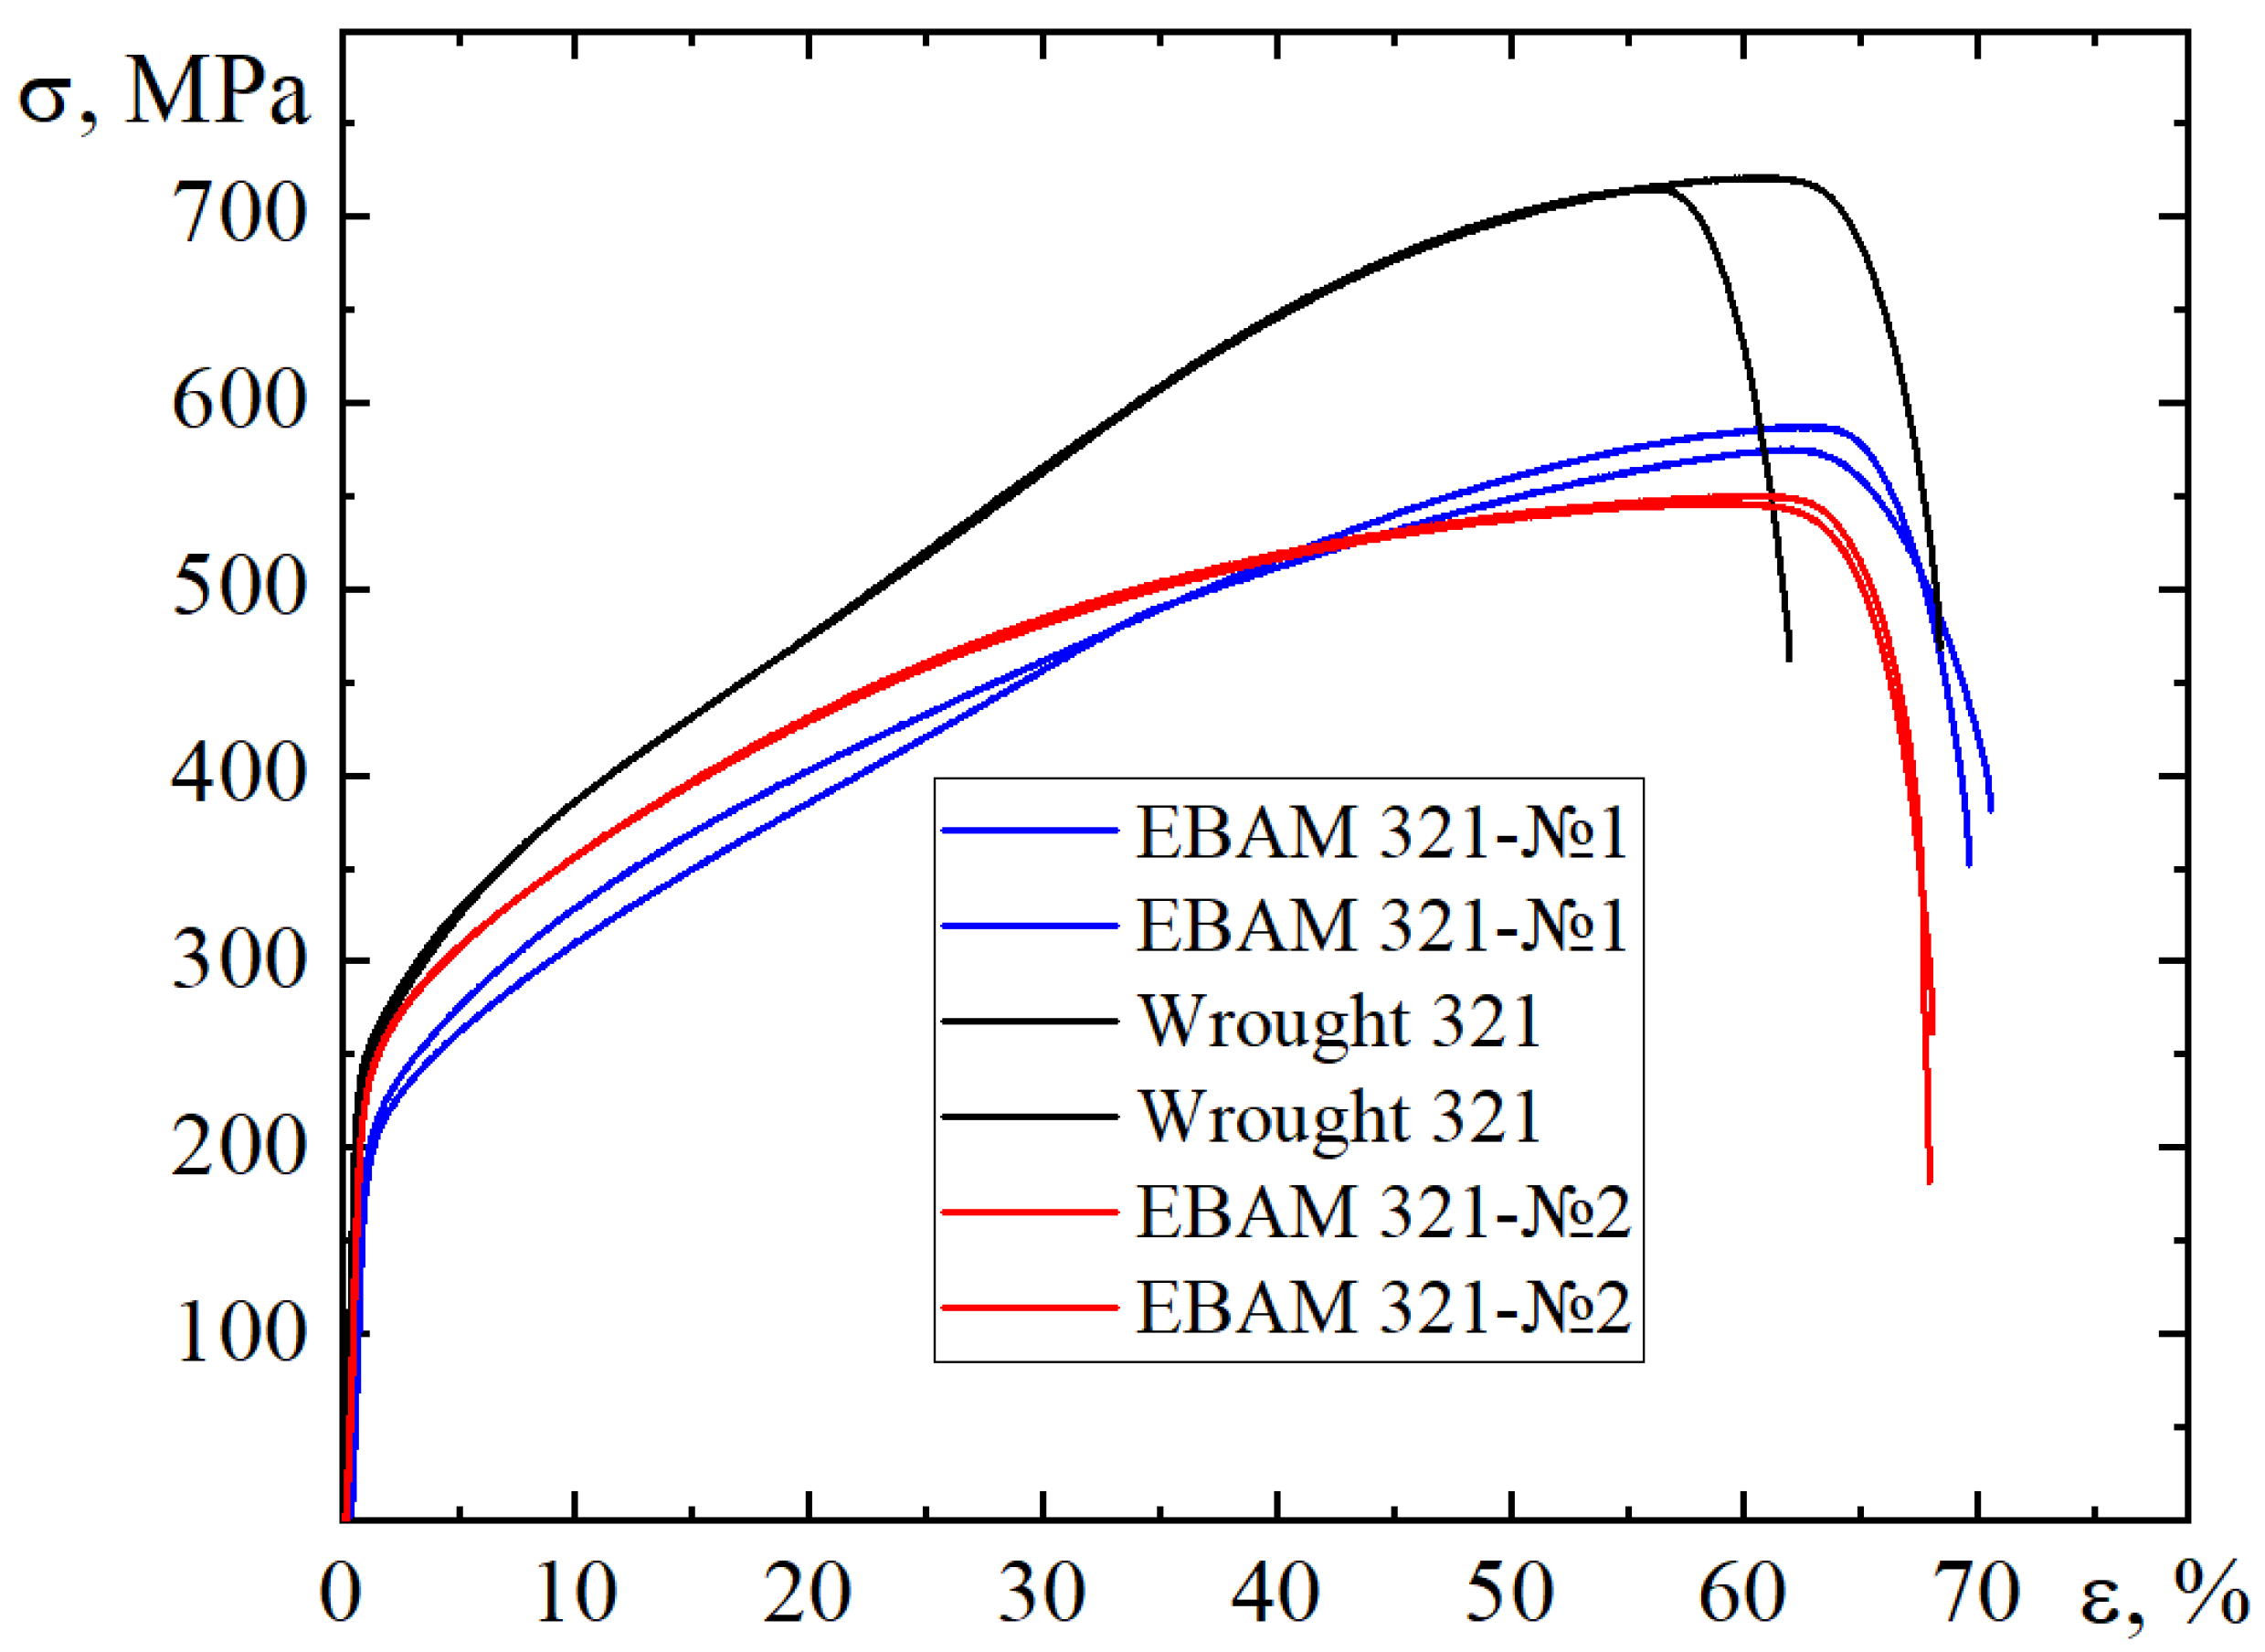
Figure 7 shows engineering stress–strain curves of the 3D-built walls and the wrought steel, mechanical properties of which are given in Table 4. Both walls were characterized by similar values of elongation at a break of 68–70%, ultimate tensile strengths of 550–570 MPa, and microhardness of 185–191 HV. On the other hand, the wrought steel exhibited higher ultimate tensile strength (700 MPa) and microhardness (230 HV) due to the greater ferrite content and the fine-grained microstructure.

3.3. TEM Examinations

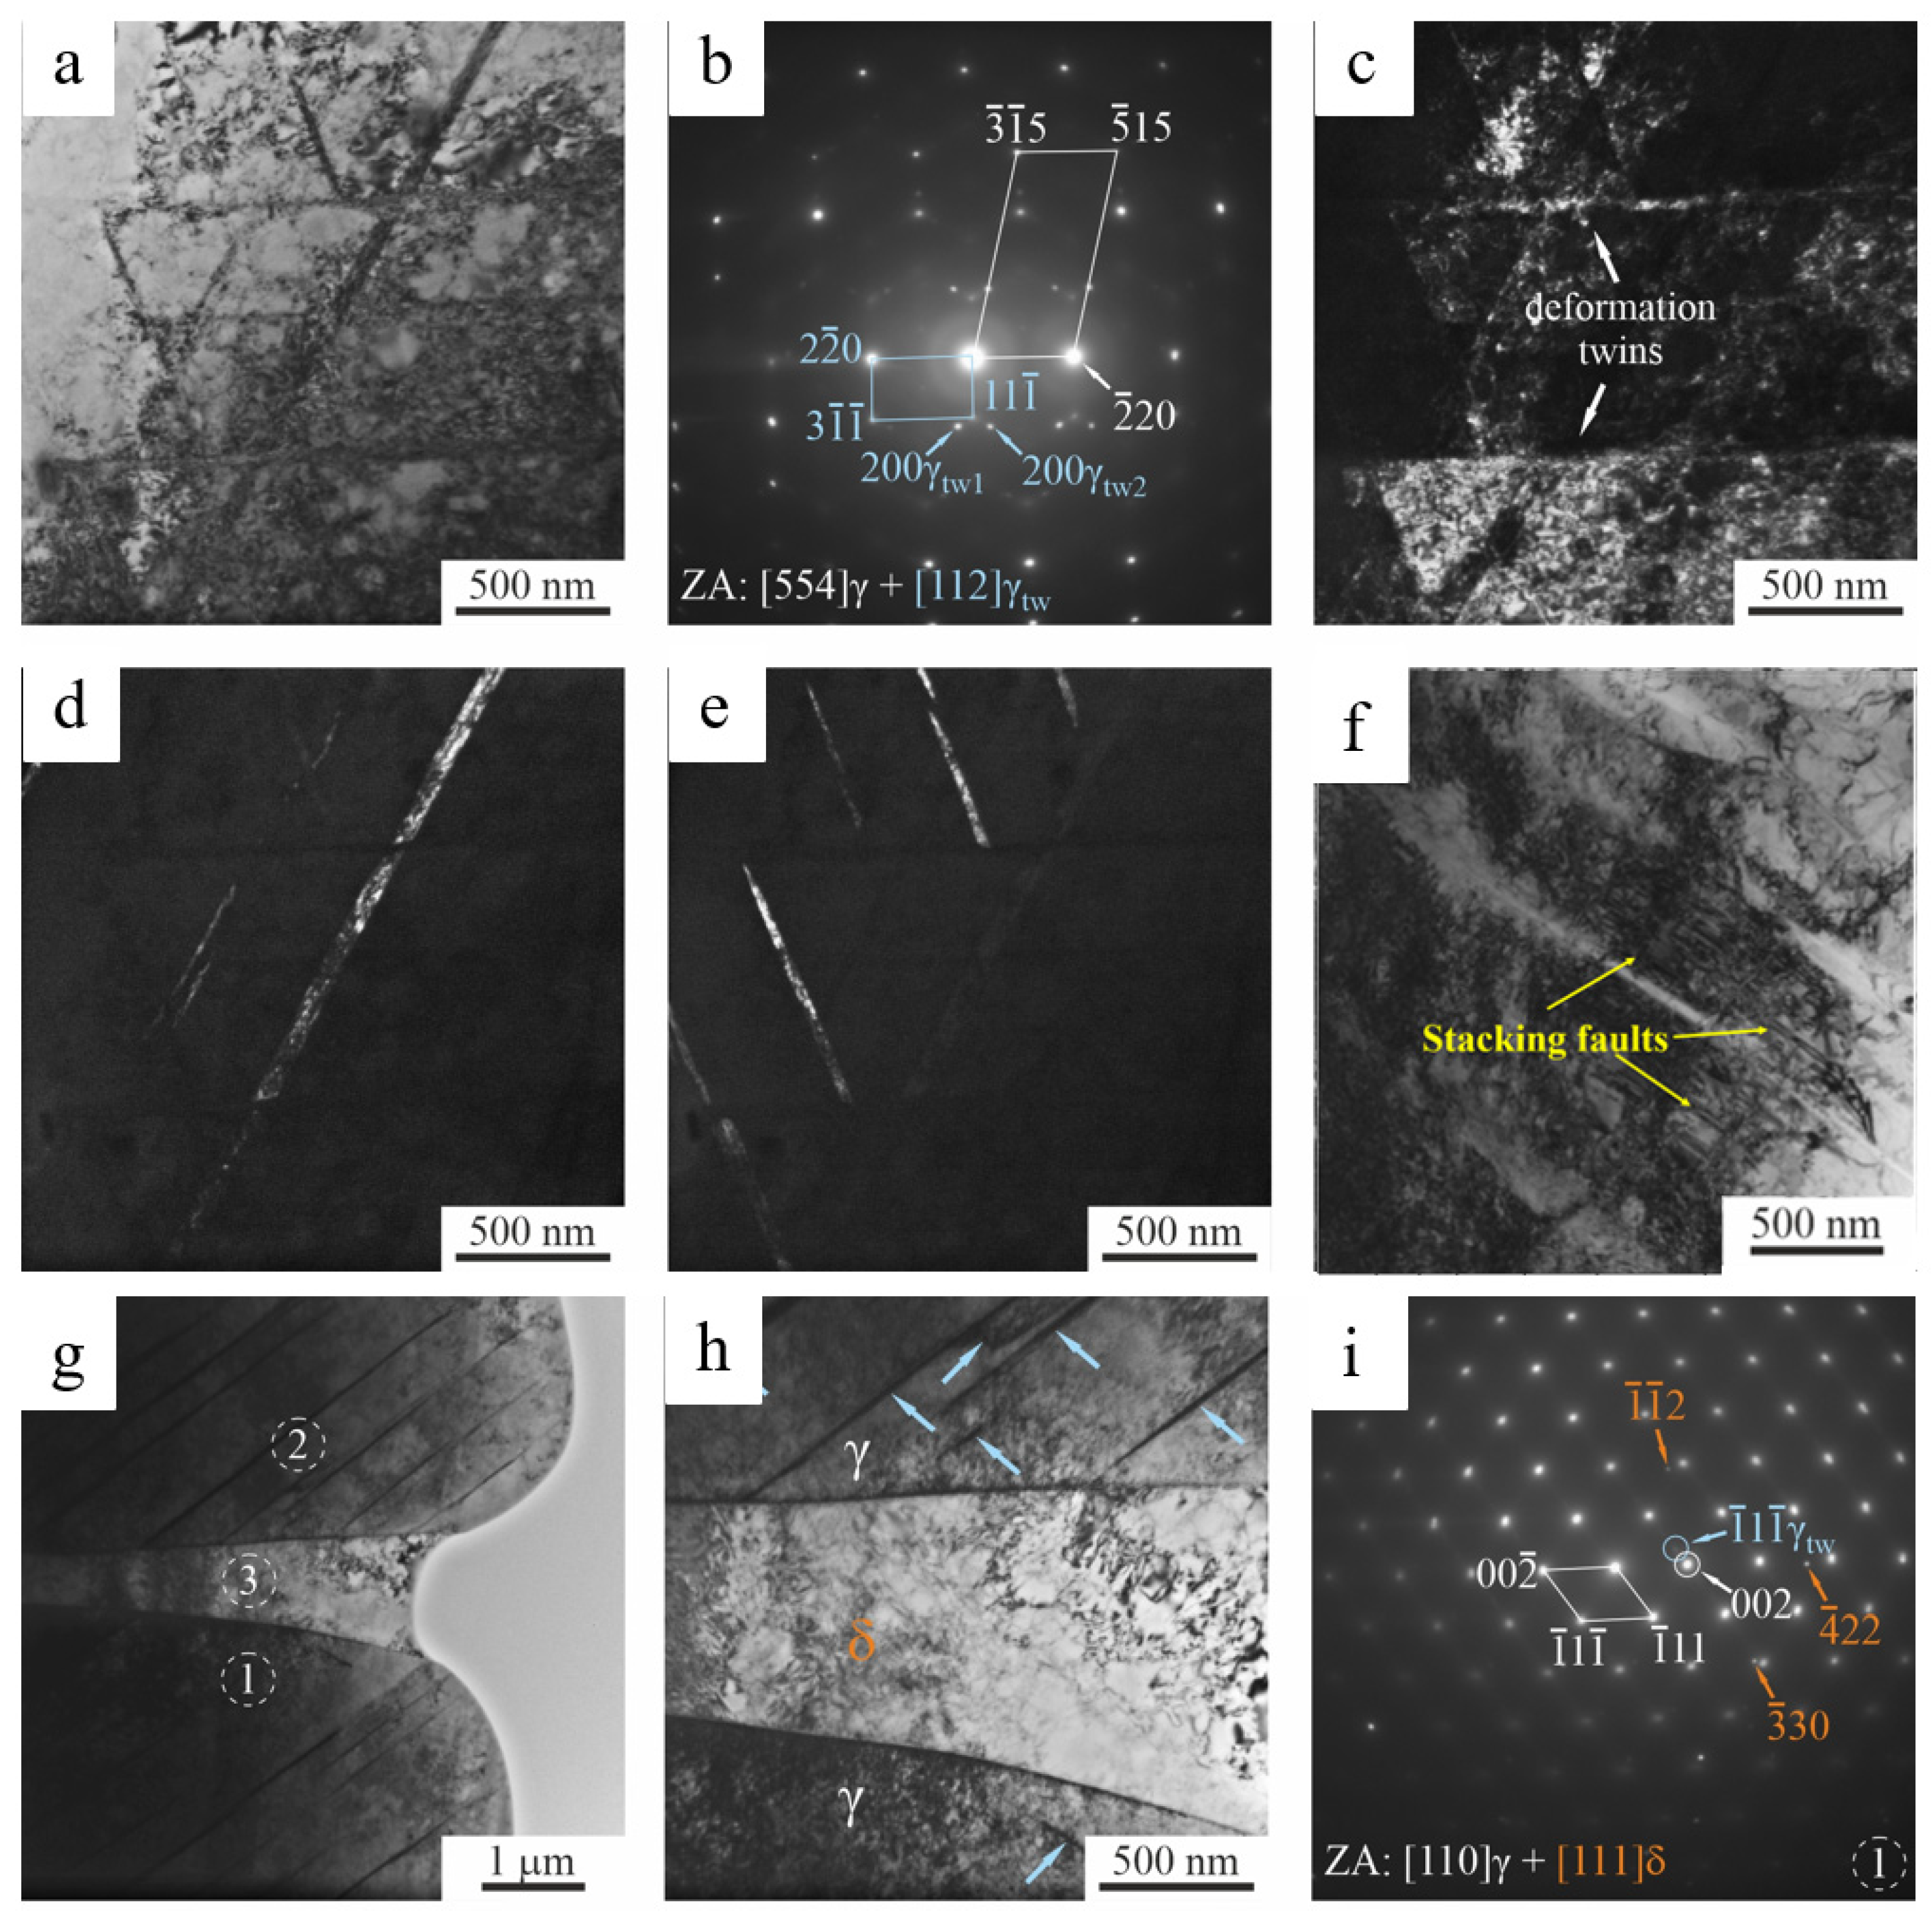
The fine structures of the thin wall and the wrought steel were studied by TEM. As expected, they were characterized by the typical metastable austenitic structure with multiple micro- and nanotwins (Figure 8a–f). The wrought steel possessed a rather high dislocation density of ~1011 cm−2. From the analysis of both diffraction patterns and dark-field micrographs presented in Figure 8g–i, it followed that the main phases of the thin wall were austenite and δ-ferrite. A dislocation substructure was observed within δ-ferrite grains (Figure 8h). Compared with the wrought steel (Figure 8a,f), the thin wall had a lower (approximately an order of magnitude) dislocation density of ~1010 cm−2. It should be noted that δ-ferrite grains were not found in the wrought steel, while this phase was quite common in the thin walls.
According to the local EDS analysis results, the presence of chromium was higher in δ-ferrite grains, while both iron and nickel contents, on the contrary, were lower, compared to those in the matrix austenite grains (Table 5).
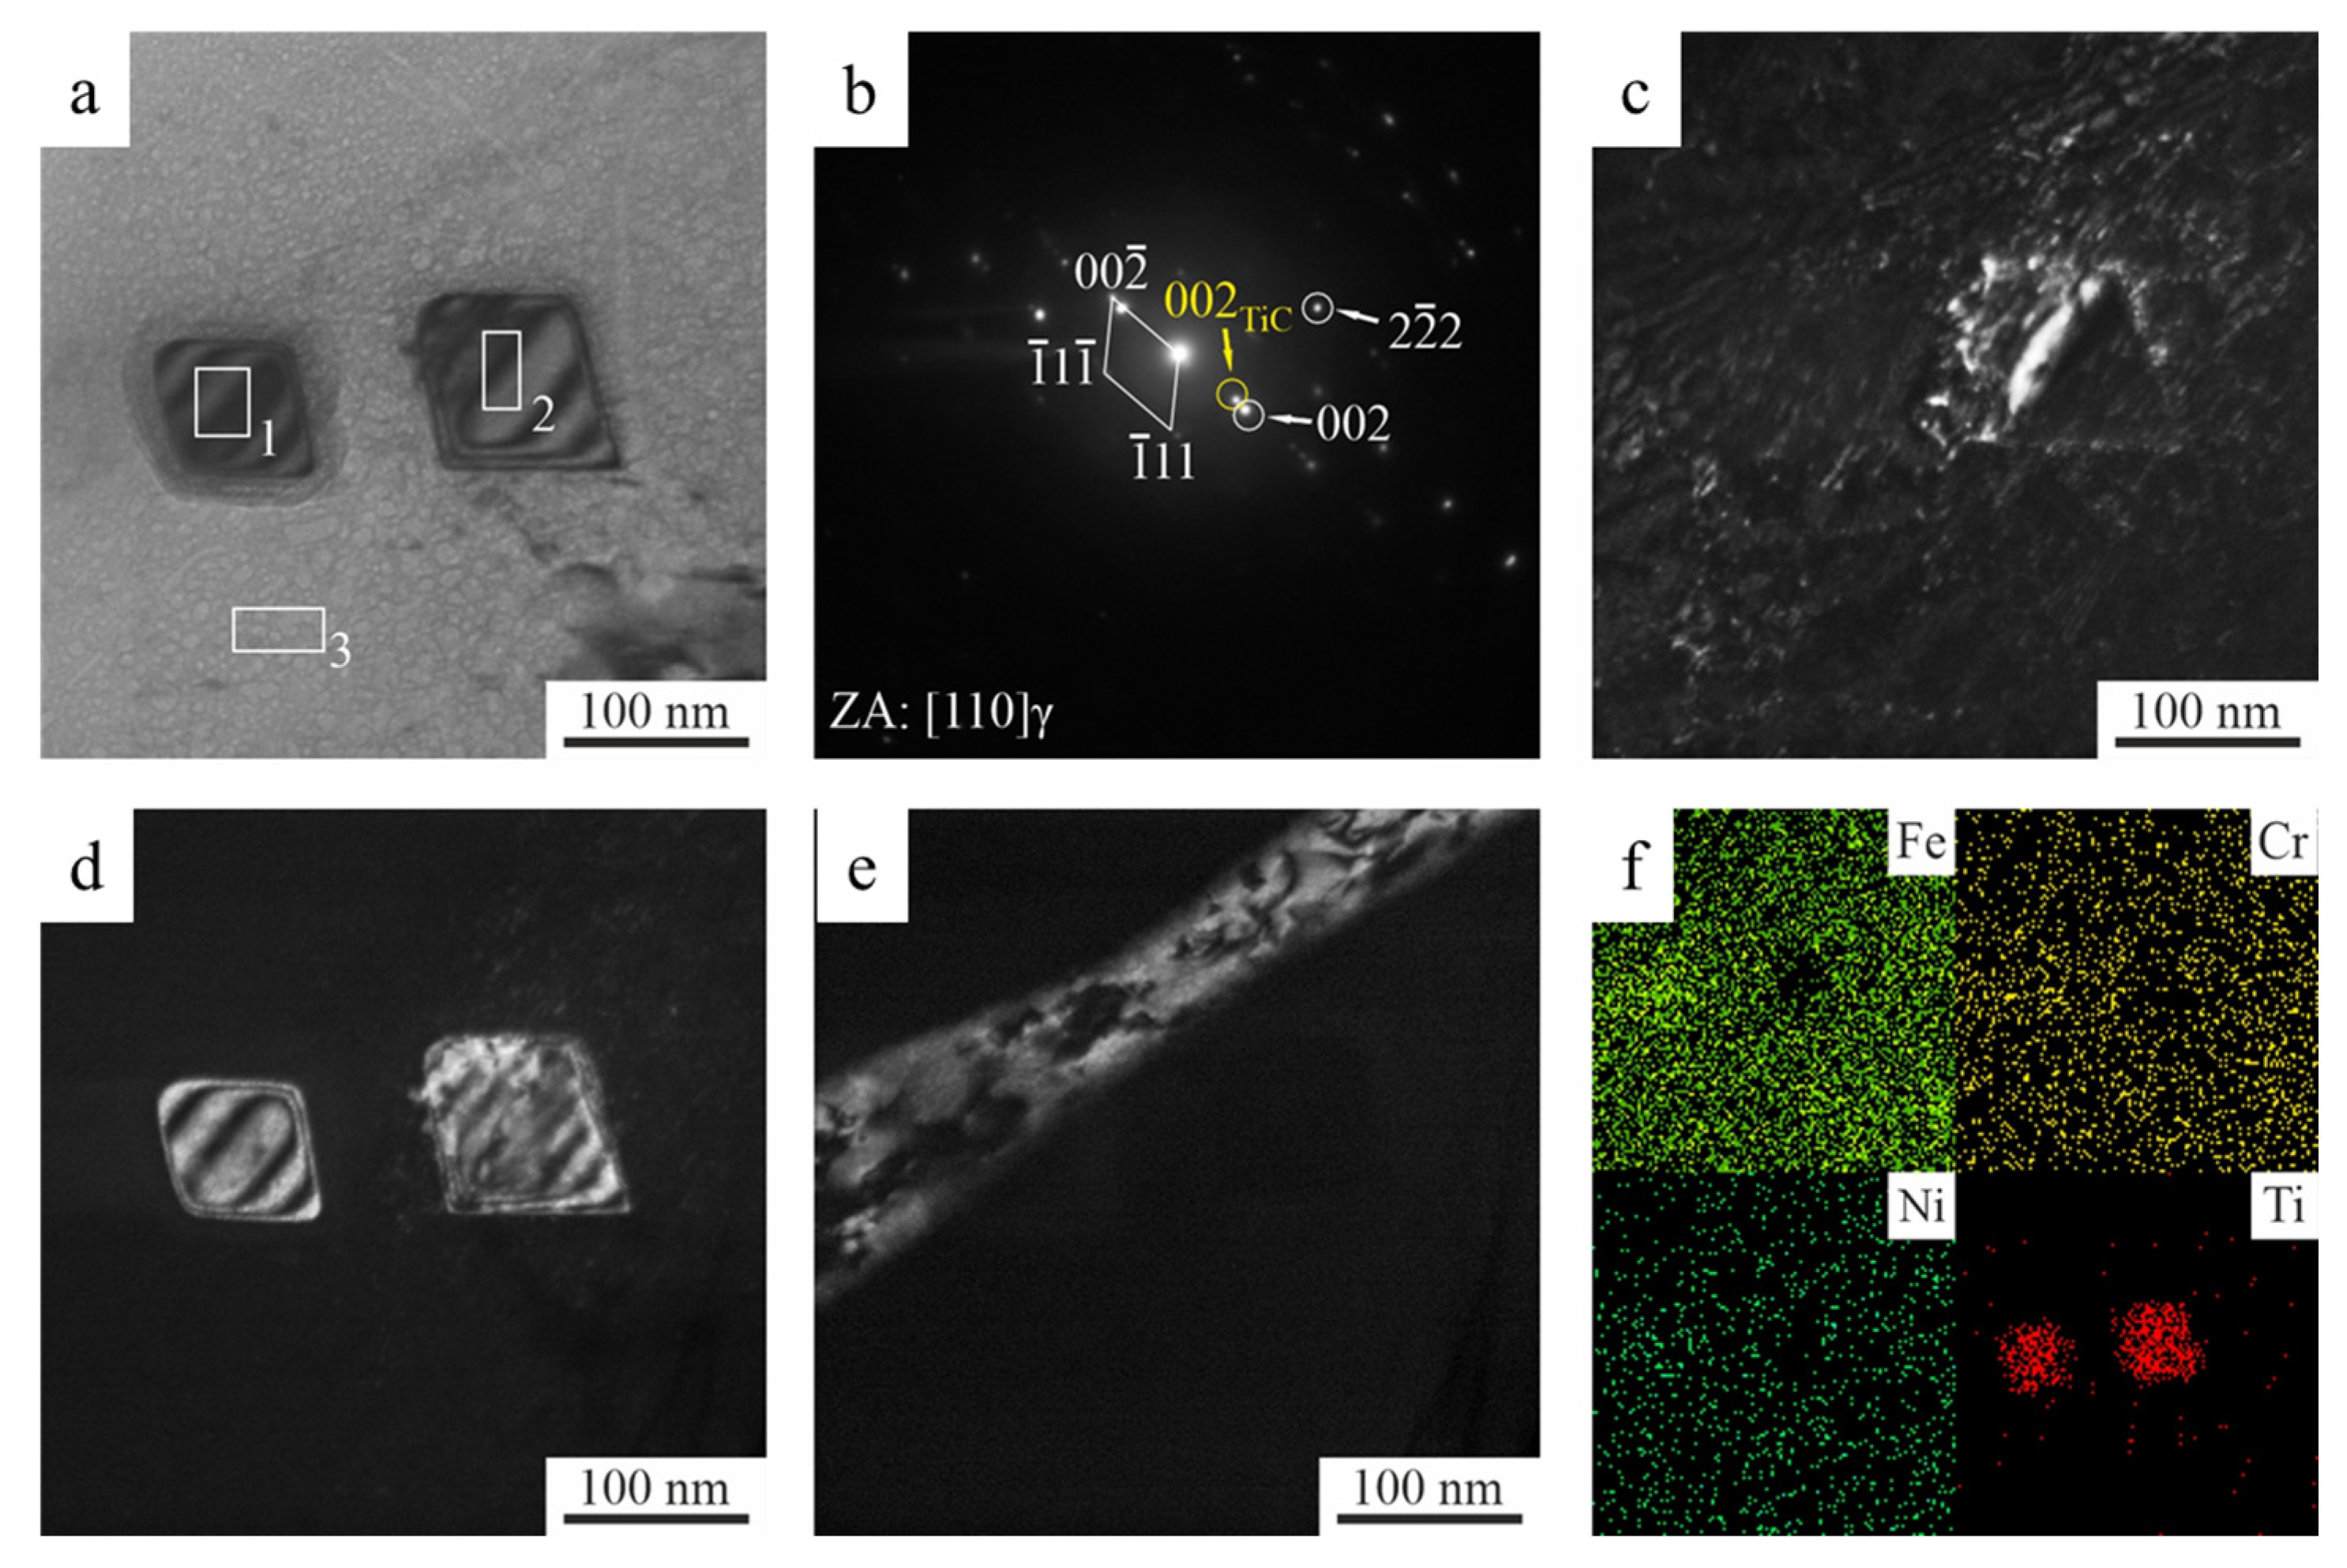
For the AISI 321 steel, this fact may be caused by redistributions of the alloying elements (increase in contents of the ferrite stabilizers and decrease in the austenite ones) during the formation of δ-ferrite, similar to the processes reported for WAAM [6]. The detailed TEM examinations of carbides were performed in the thin walls (Figure 9). As a result, individual fine particles of MC carbides with the FCC lattice were found. Such particles with transverses sizes of ~100 nm had predominantly spherical and rhombohedral shapes. An analysis of the microdiffraction patterns presented in Figure 9b confirmed that they were TiC inclusions (most likely).
Figure 9c shows a dark-field image in the austenite reflection, in which one carbide particle with a characteristic crystalline facet that partially glows was found. Apparently, the dark-field image was formed by the matrix reflection, partially ‘illuminated’ by the nearby TiC carbide one. The local EDS analysis results also indicated that these particles were enriched in titanium (Table 6; Figure 9f).

3.4. Corrosion Resistance

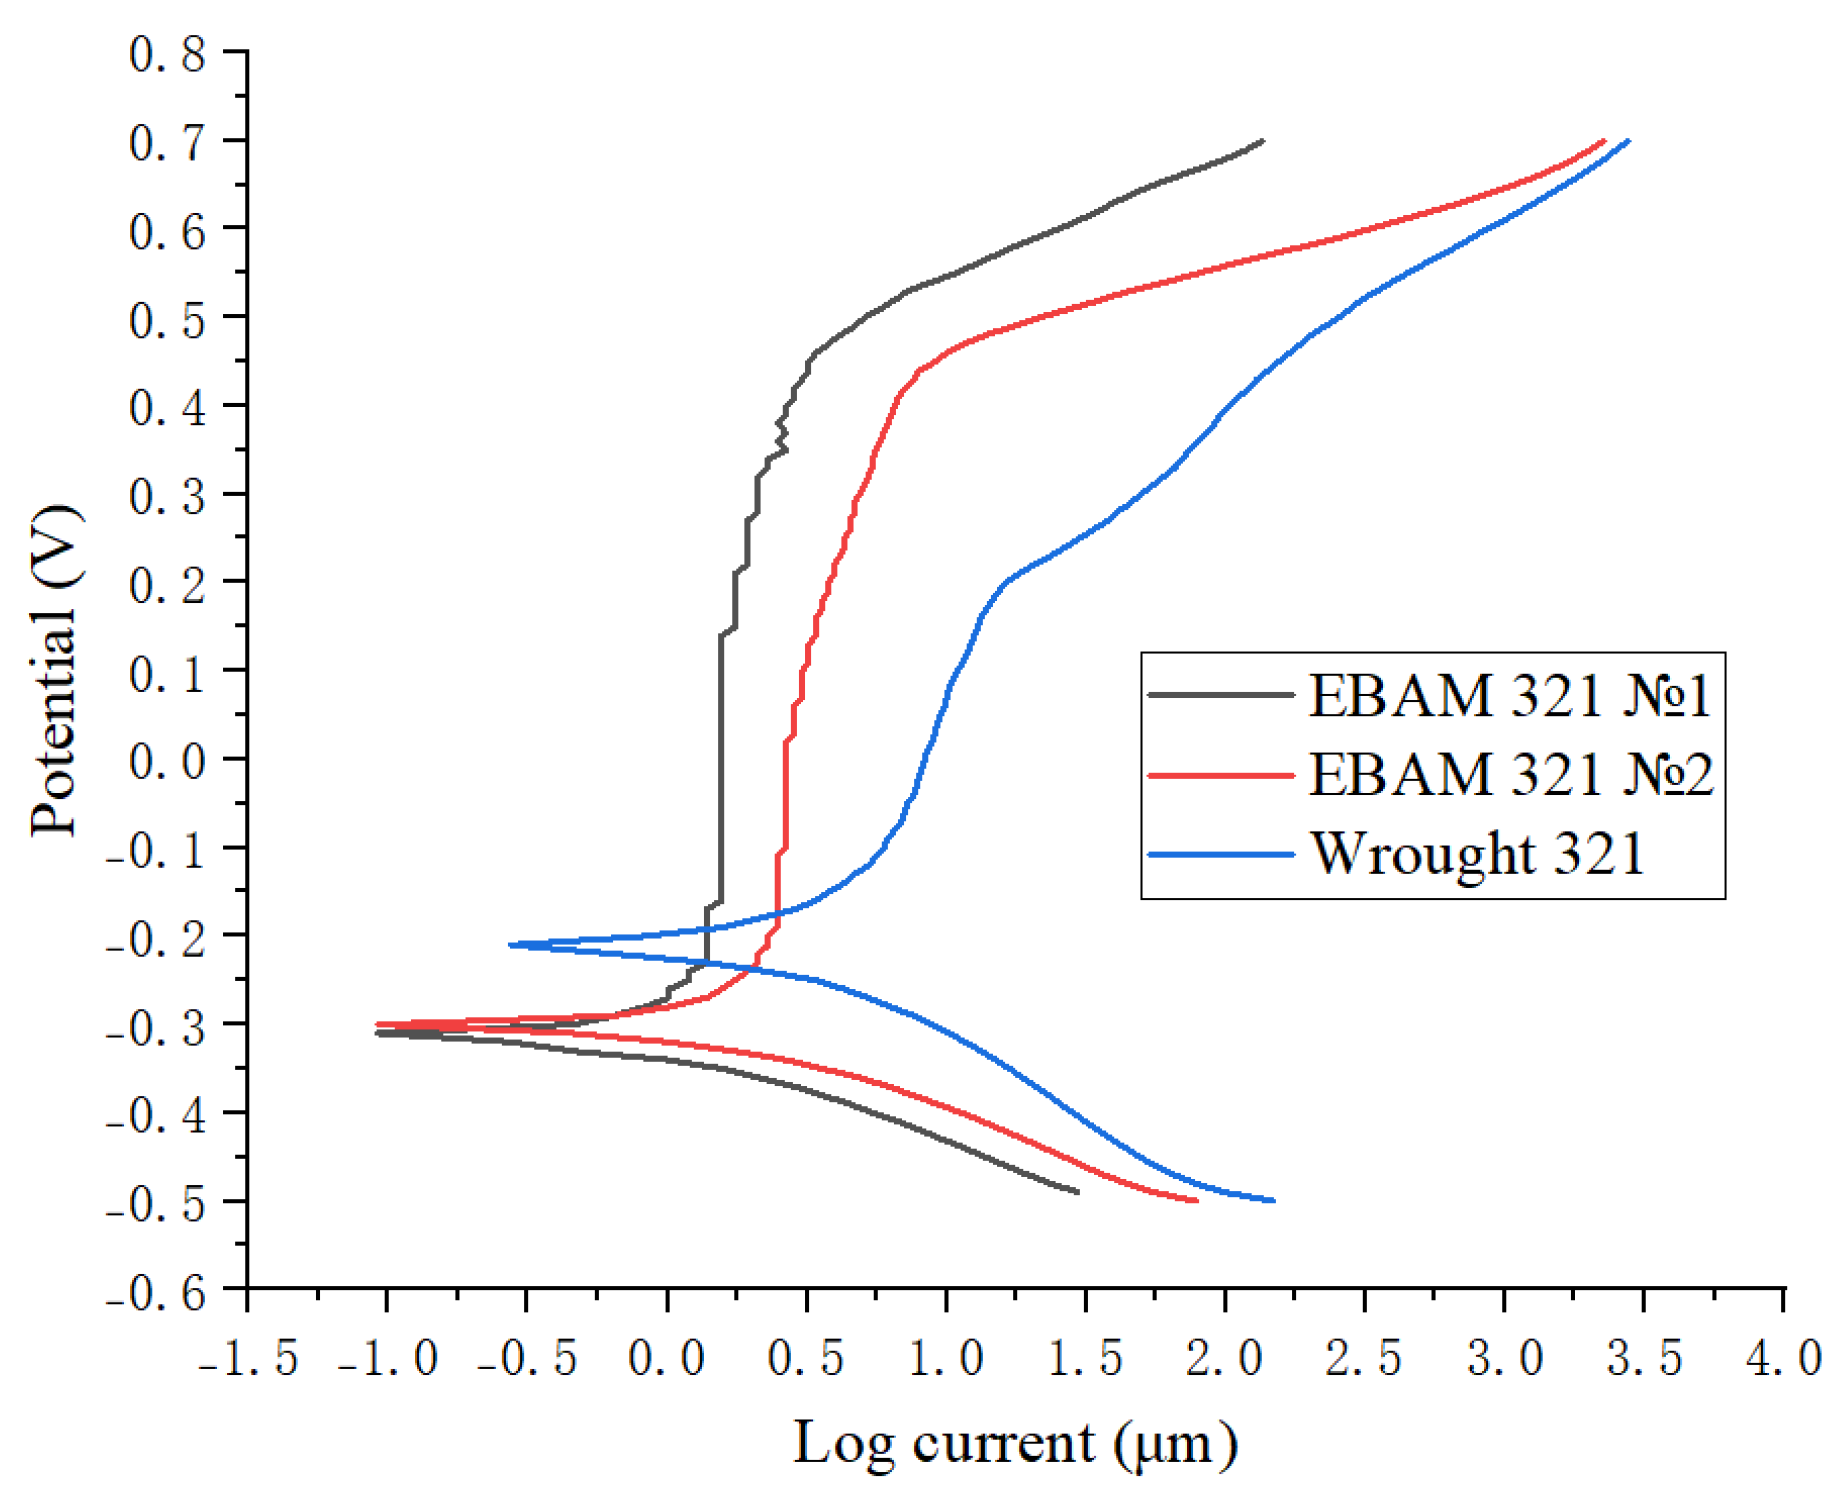
As reported previously [2,27,28,29,30], (i) the ferrite content, (ii) the presence of twins, and (iii) the type of carbides affected corrosion resistance of the AISI 321 steel. Polarization curves of the 3D-built walls and the wrought steel are shown in Figure 10, while the quantitative indicators are shown in Table 7.
As followed from Table 7, all samples were characterized by both acceptable passivation capacity and breakdown potential levels. The corrosion parameters of the 3D-built walls differed to a lesser extent, but they were worse than those of the wrought steel, including the current and rate enhancement, as well as the voltage and breakdown potential reduction. As noted above, the wrought steel had the higher density of twins and ferrite content, compared to the thin wall. According to the authors, this fact determined that the corrosion rates of the built walls were two times lower.
Note that optical micrographs of the samples after the corrosion tests are not presented in the paper. The reason is as follows. The pitting corrosion tests used in the study are of express nature. They take just one minute for a sample. In doing so, the surface of the samples can hardly exhibit any changes during this time. The optical photographs of the surfaces of the pitting corrosion tested samples were examined. However, the difference could not be identified. This is the reason why the following parameters are analyzed during this kind of testing: corrosion current, corrosion potential, polarization resistance, breakdown potential, and corrosion rate.
As an intermediate conclusion, the authors summarized all the characteristic qualitative and quantitative indicators of the micro-, meso-, and macrostructures, as well as the mechanical properties and corrosion resistance of the studied samples, in Table 8. Both sizes and shapes of grains, the dislocation density, and the phase composition exerted a decisive influence on the mechanical properties, while the phase composition, the twin substructure, and the carbide type determined corrosion resistance. The primary reason is the variation of passivation capacity induced by the changing of the microstructure.

4. Machinability of the 3D-Built Walls

4.1. Cutting Forces upon Milling with the Industrial Machine

Figure 11 shows the effect of the EBAM sample type (thick or thin wall) on the cutting forces under different milling conditions. To estimate them, the total forces upon milling of the 3D-built walls were used, according to the following expression:
F xyz = ( F X max ) 2 + F Y max 2 + ( F Z max ) 2 ,
where F X ,   Y . Z max were the maximum forces on the analysis interval along the corresponding axes, respectively.
The obtained results enabled the authors to conclude that there was virtually no difference in the cutting forces for the 3D-built walls. Therefore, their dimensions exerted little effect on machinability, which was consistent with the mechanical properties (Table 4).
Figure 11b presents the influence of both cutting speed and feed on the cutting force for the thick wall. It was found that both strength and microhardness of the walls affected the cutting force upon milling. When these parameters did not differ much, their machinability was the same. Low cutting speed and fast feed increased the cutting force, while high cutting speed and low feed decreased it.
In general, two trends were observed: (i) when the cutting speed was increased, the cutting force decreased, and (ii) when the feed rate was enhanced, the opposite dependence proceeded. When both depth and width remained unchanged, a higher feed rate meant a greater production rate. For this reason, high cutting speeds should be applied (but not low feed rates) when milling such EBAM samples to improve production rate and reduce cutting forces.

4.2. Optimization of the Milling Parameters for the Semi-Industrial CNC Machine

As noted above, milling with semi-industrial machines could be carried out using parameters that differed from recommendations of the manufacturer of end mills. Therefore it was important to develop approaches that optimized the milling parameters with minimal time and resource costs. The optimality criterion had to be a comprehensive assessment of both the milling process and the product quality. Among the process characteristics, the authors selected the MRR parameter, while the product quality was best characterized by Ra roughness on the processed surfaces. Another important factor, i.e., wear resistance of the end mills, was beyond the scope of these experiments, since the applied milling modes were ‘mild’, and the process durations were too short. As a result, the optimality criterion could be written as a system of the limiting expressions, as follows:
R a S , B , N m i n , MRR S , B m a x .
Based on expression (2), a more formal criterion of suboptimality could be derived in the form of a system of inequalities, shown as follows:
R a S , B , N R a ¯ , MRR S , B MRR ¯ ,
where R a ¯ and MRR ¯ are the limiting minimum and maximum values of the characteristics. The range of the (S, B, N) parameters satisfying the system of inequalities (3) was called the region of suboptimal parameters (SOP) [31].
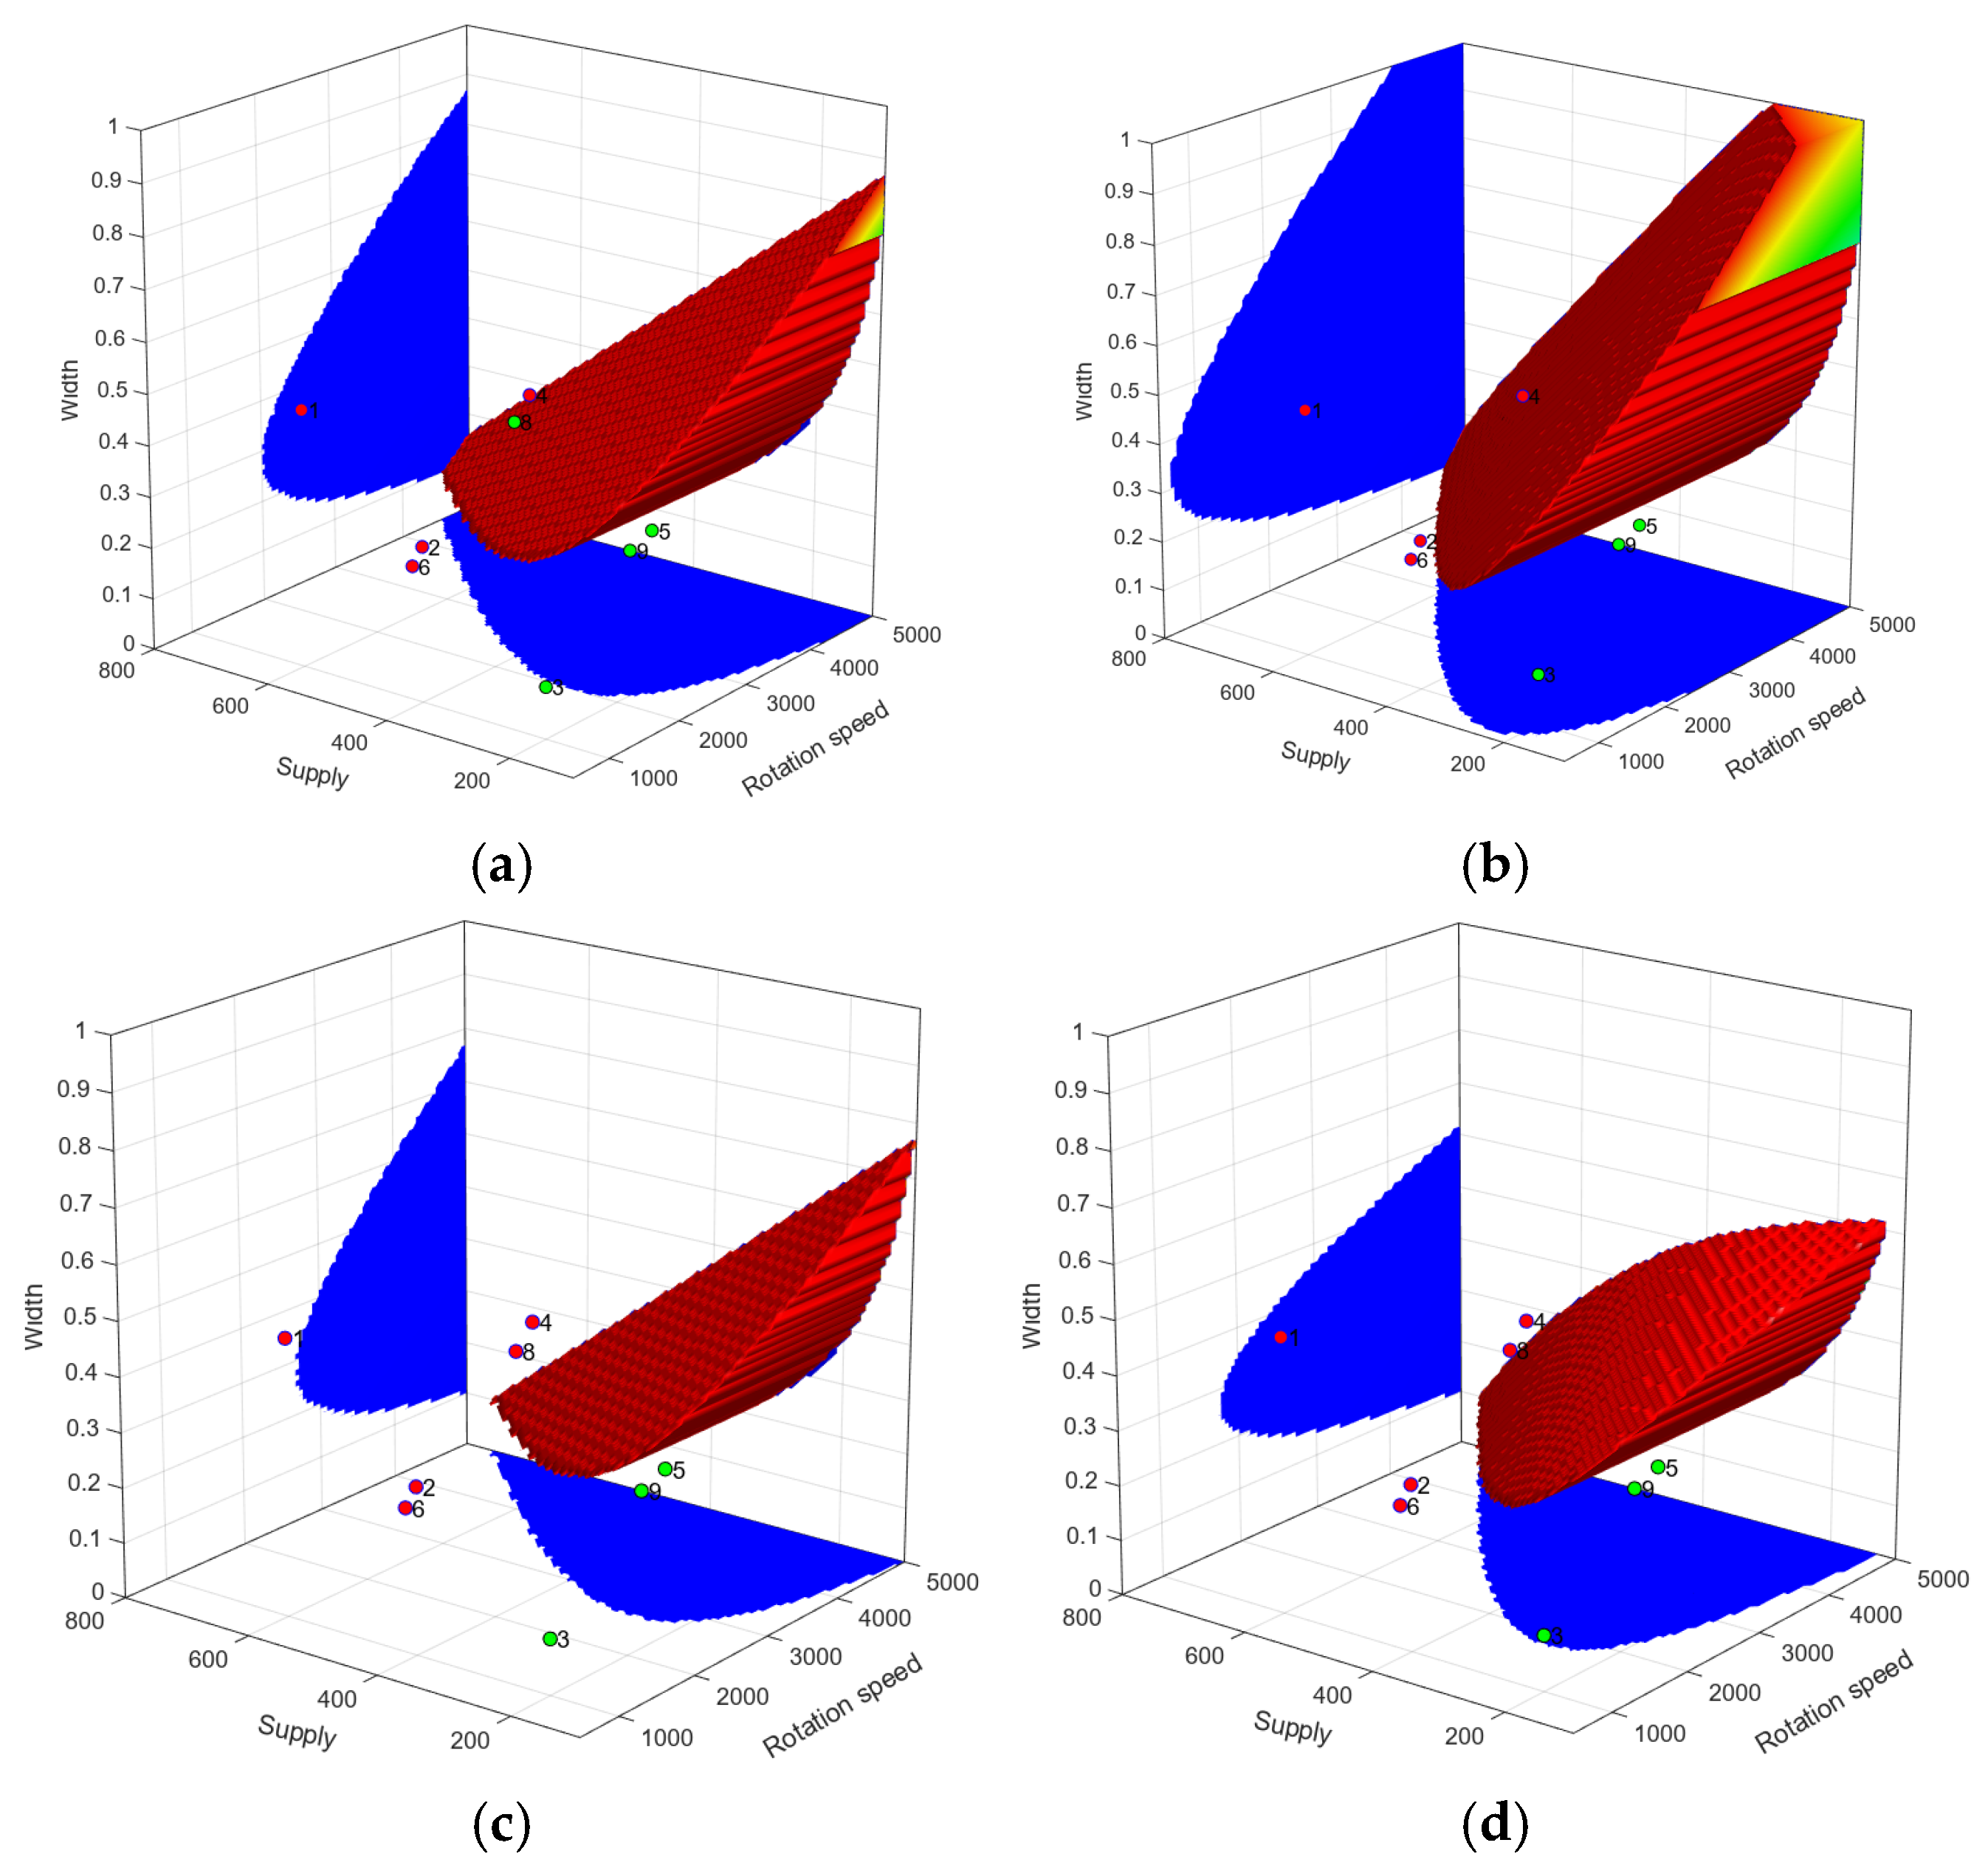
The results of the analysis of the acceptable milling parameters are presented in Table 9. This ‘Regress’ model had the following statistics: the coefficient of determination R2 = 0.884, the normalized root mean square error NMSE = 0.214, and the significance level p = 0.0089. By applying the model, the Ra roughness values were calculated, and the SOP regions were identified (satisfying condition (2)), plotted in Figure 12a,c. Despite the obtained high-quality indicators of the regression model, the hypothesis of a nonlinear relationship between the Ra roughness values and the milling parameters was further tested.
Using the results of nine experiments according to the Taguchi plan (Table 2), the least squares method was utilized to calculate the linear multiple regression coefficients [32,33,34], and the Ra roughness equation was obtained as follows:
R a = 0.2014 0.00028 f + 0.0021 S + 2.059 B .
In addition, a feedforward neural network (FFNN) was used to generalize the experimental results [35,36]. Its architecture was selected based on the simple-to-complex principle. A training sample was formed from Table 2 with the input and output data normalized to the acceptable limiting ranges, according to Table 9. The greatest convergence rate of its training was achieved when choosing the logarithmic tangent as activation functions and the Levenberg–Marquardt optimization method. The numbers of layers and neurons per layer were preset according to the SOP regions, as shown in Figure 12a,c.
Among all the considered options, a network with one hidden layer and three neurons was selected, which showed the simplest and most plausible SOP regions (Figure 12b,d). This model had better (compared to the regression one) characteristics of the correspondence of the forecast and the training sample: MSE = 0.00049061, and R2 = 0.99504.
By comparing the obtained results, it was concluded that the FFNN model constrained the SOP region from above with a surface that was close to linear but differed from the linear regression by a larger slope angle for great Ra roughness values ( R a ¯ > 0.65   μm). In other words, the FFNN model included the milling parameters with higher width and MRR values in the low-feed SOP region. For low Ra roughness values ( R a ¯ < 0.65   μm), the above nonlinear surface had the opposite effect: the milling parameters with high width and rotation speed values were excluded from the SOP region.
To clarify the identified discrepancies, the developed models were verified by conducting additional experiments and comparing the predicted and actual Ra roughness values. The milling parameters were selected from the following conditions: values outside the predicted SOP region, at its boundary, and a point inside it (No. 10–12, respectively, in Table 10, which also contains the predicted Ra roughness values and the experimental results).
It was found that both models provided errors with acceptable deviations, but the linear regression one showed greater accuracy in terms of the mean deviations. Its prediction of the optimal milling parameters (N = 4500 rpm, S = 404 mm/min, and B = 0.43 mm) corresponded to an Ra roughness of 0.648 μm and an MRR of 695 mm3/min.
In general, the comparison of the machinability evaluation data recorded upon milling of the built walls with the industrial and semi-industrial machines enabled the authors to conclude that cutting speeds should be increased but feeds should not be reduced to improve MRR values. Ra roughness and cutting forces should both be reduced as well. On the other hand, the developed Regress and FFNN models for the semi-industrial machine allowed the optimizing of such parameters for AM products.

5. Discussion

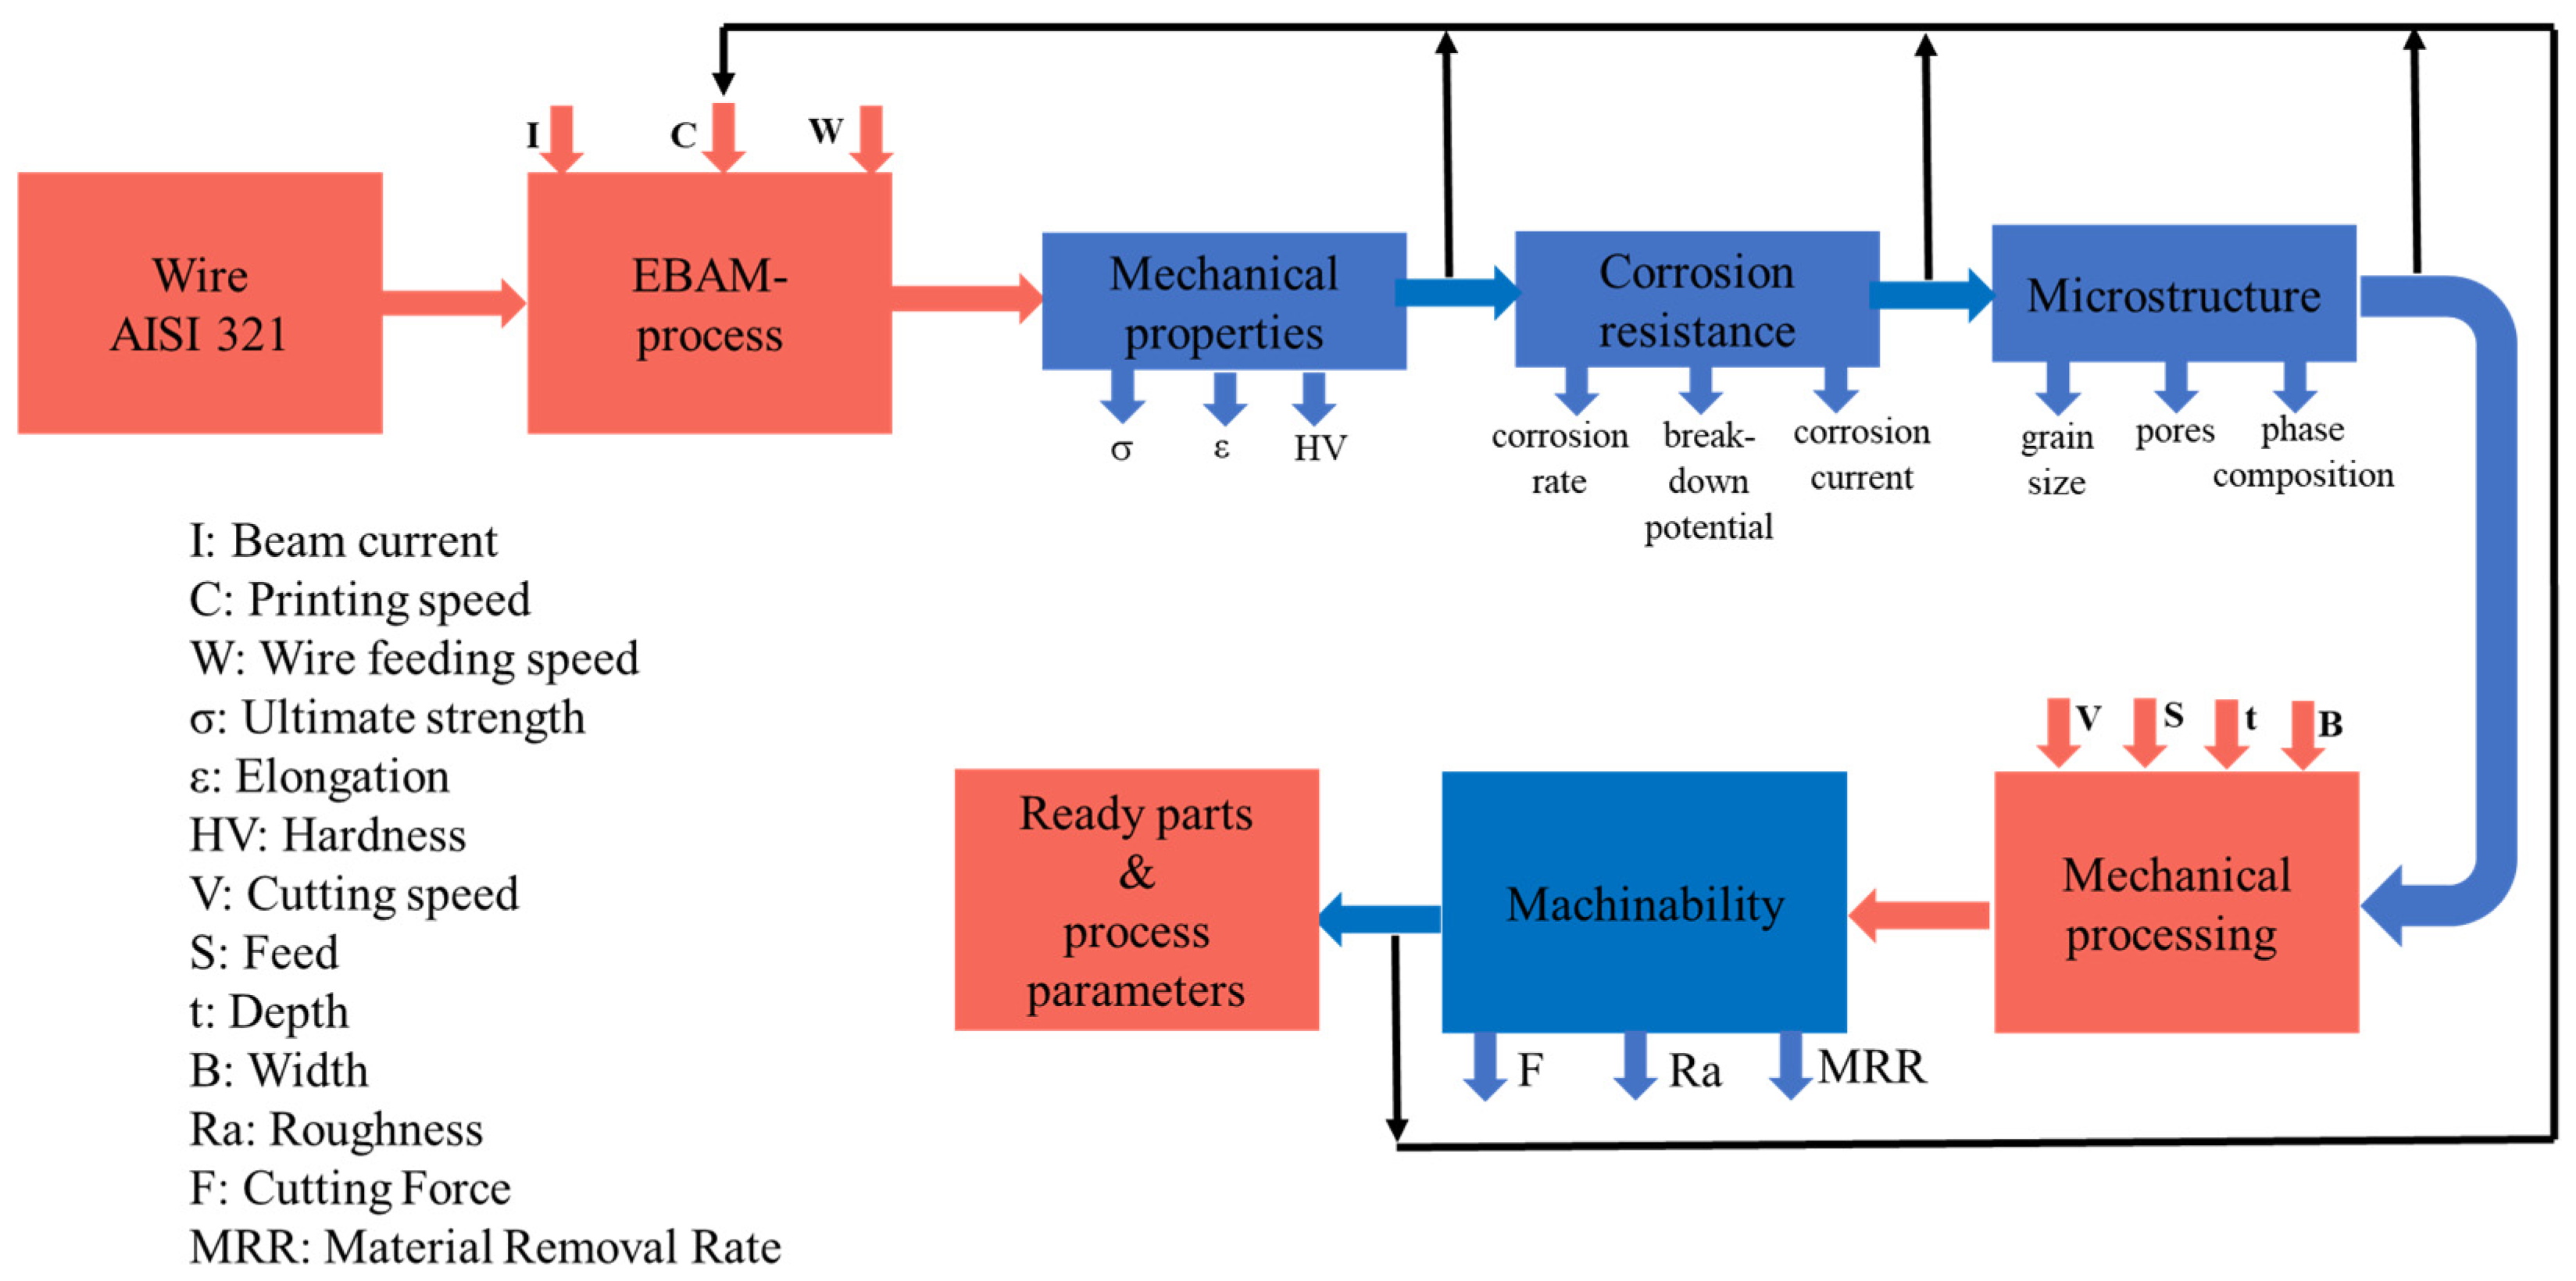
As noted above, AM techniques are intended for fabricating small batches of products. Nevertheless, optimizing their parameters is a multi-factor problem, depending on feedstocks, sizes and shapes of building parts, layer-by-layer deposition strategies, etc. For EBAM, when its high production rate can be one of the decisive factors, multiple studies of microstructures and functional characteristics are also required, leading to an increase in the cost of such products. Therefore, production routes can be optimized based on the combined evaluation of the mechanical, operational (corrosion resistance), and technological (processability) characteristics, including by the application of regression or neural network modeling data (Figure 13). In these cases, the input is a feedstock, while the output is a reference AM product that possesses the required set of functional characteristics and manufacturing parameters, including the post-processing modes.
Corrosion resistance tests can be a criterion for assessing the formed microstructures of stainless steels, as shown in this study. They are carried out quite quickly and are very sensitive to changes in the microstructures, which are difficult to distinguish based on the assessment of both physical and mechanical properties. In the context of fabricating EBAM products from stainless steels, corrosion resistance inspection becomes relevant, since possible burnout of alloying elements can significantly reduce it. Embedding this stage into additive–subtractive production routes can promptly assess and, if necessary, adjust the implemented parameters without conducting both expensive SEM and TEM examinations of microstructures.
Figure 13 can be supplemented with a block of heat treatment of AM products. It is relevant both for the releasing of residual stresses, as well as the formation of required microstructures and phase compositions of additive steels and alloys (for example, the AISI 420, 17-4 PH, and Ti-6Al-4V grades [10,14,17,22]). However, heat treatment has virtually no effect on the mechanical properties of the AISI 321 steel [1], including the one 3D-built by the SLM method [5]. For this reason, it is not shown in Figure 13.
For post-processing of individual AM products, up-to-date multi-axis stationary machines are not financially feasible in all cases. At the same time, the milling parameters recommended by the manufacturers of tools may not be suitable for less expensive semi-industrial ones. The selection of different milling parameters is governed not only by the disparity in machine capabilities (industrial vs. semi-industrial) but also by the application of cutting fluid. In addition, the machinability parameter can be used as one of the criteria for assessing the AM product quality.
After achieving the required levels of both mechanical properties and corrosion resistance, post-processing of EBAM products is to be carried out. The criteria for its quality are dimensional accuracy and surface roughness. As far as the results of this study show, the mechanical properties dependent on the EBAM parameters have a significant impact on the machinability of the 3D-built products. However, optimization of the milling modes allows its improvement, reducing the cutting forces and the surface roughness but increasing the MRR values. Accordingly, these aspects may also need to be added to the scheme presented in Figure 13.

6. Conclusions

Based on the obtained results, the following conclusions were drawn.
  • The dimensions of the AISI 321 steel EBAM samples (thick or thin walls) did not exert a noticeable effect on their chemical compositions, including in comparison with the original wires (feedstocks) used for their 3D building. The contents of the alloying elements varied within the error limits of the method applied for determining the chemical compositions.
  • The microstructures and the mechanical properties of the 3D-built walls were found to be similar. In comparison, the strength characteristics of the wrought steel were higher due to finer grains, as well as the greater ferrite content and dislocation density. During the EBAM process, multiple thermal cycles gave rise to the formation of elongated columnar grains, reducing the strength characteristics.
  • The corrosion rate of the wrought steel was almost twice those of the 3D-built walls because of the high contents of both ferrite and twins. This datum is of relevance when express estimation of microstructure is to be carried out without running long and expansive TEM studies. The established “process-structure-property” relationship for EBAM-fabricated 321 stainless steel opens up a theoretical foundation for its future industrial applications.
  • By assessing machinability of the 3D-built walls using the stationary dry milling machine (with high stiffness), it was shown that the cutting forces were comparable due to similar mechanical properties (including microhardness). To improve the MRR values and reduce the cutting forces, it is recommended to enhance the cutting speeds but not to increase the feeds.
  • For the semi-industrial machine (with lower stiffness of the portal frame and application of the cutting fluid), both linear multiple regression and nonlinear FFNN models were applied. The obtained results enabled the authors to conclude that it was sufficient to use the first one to predict the optimal milling parameters. However, these studies were carried out within the narrow framework of the ‘mild’ modes in short durations, avoiding substantial wear of the end mills. Under these conditions, the predicted optimal milling parameters (N = 4500 rpm, S = 404 mm/min, and B = 0.43 mm) corresponded to both an Ra roughness of 0.648 μm and MRR value of 695 mm3/min.
  • An integrated approach was proposed to rationally determine both AM and post-processing parameters based on a combination of express assessment and analysis of the mechanical, operational, and technological characteristics of 3D-built products within a single laboratory complex. This research provides a systematic methodology for the fabrication of large-scale 321 stainless steel components, encompassing the enhancement of material utilization efficiency, reduction of production cycles, and improvement of workpiece surface quality.

Author Contributions

Conceptualization, M.Q. and S.V.P.; methodology, M.Q., D.Y.S. and S.V.P.; software, D.Y.S.; validation, M.Q., D.Y.S. and S.V.P.; formal analysis, M.Q. and D.Y.S.; investigation, M.Q., V.E.R., Y.V.K. and I.Y.L.; resources, S.V.P.; data curation, M.Q., M.V.B. and D.Y.S.; writing—original draft preparation, M.Q., S.V.P., I.Y.L. and D.Y.S.; writing—review and editing, M.Q., D.Y.S. and S.V.P.; visualization, D.Y.S. and M.Q.; supervision, S.V.P. and M.V.B.; project administration, S.V.P.; funding acquisition, S.V.P. All authors have read and agreed to the published version of the manuscript.

Funding

The study was financially supported by the Russian Federation via the Ministry of Science and Higher Education of the Russian Federation (Agreement No. 075-15-2023-456).

Data Availability Statement

The data presented in this study are available from the corresponding authors upon reasonable request.

Acknowledgments

Structural studies were partly conducted at core facility “Structure, mechanical and physical properties of materials” NSTU.

Conflicts of Interest

The authors declare no conflicts of interest.

Nomenclature

CNCComputer Numerical Control
EBAMElectron Beam Additive Manufacturing
EBSMElectron Beam Selective Melting
FFNNFeedforward Neural Network
HVMicrohardness
LSVLinear Sweep Voltammetry
MRRMaterial Remove Rate
MSEMean Square Error
SEM-EDSScanning Electron Microscopy and Energy Dispersive X-ray Spectroscopy
SLMSelective Laser Melting
SOPSuboptimal Parameters
TEMTransmission Electron Microscope
WAAMWire Arc Additive Manufacturing
WLAMWire Laser Additive Manufacturing
BCutting Width
CDeposition Speed/Building Rate, (mm/min)
F m a x Maximum Cutting Force
IBeam Current
NTool Rotation Speed
pSignificance Level
R a Surface Roughness
SFeed
tCutting Depth
VCutting Speed
WWire Feeding Rate

References

  1. Lippold, J.C.; Kotecki, D.J. Welding Metallurgy and Weldability of Stainless Steel; Willer Inder Science Publication: New York, NY, USA, 2005. [Google Scholar]
  2. Huang, Z.; Zhang, J.; Ma, Z.; Yuan, S.; Yang, H. Research Progress on the Relationship Between Microstructure and Properties of AISI 321 Stainless Steel. Appl. Sci. 2024, 14, 10196. [Google Scholar] [CrossRef]
  3. Yin, Q.; Chen, G.; Cao, H.; Zhang, G.; Zhang, B.; Wei, S. Transformation law of microstructure evolution and mechanical properties of electron beam freeform fabricated 321 austenitic stainless steel. Vacuum 2021, 194, 110594. [Google Scholar] [CrossRef]
  4. Ma, M.; Wang, Z.; Gao, M.; Zeng, X. Layer thickness dependence of performance in high-power selective laser melting of 1Cr18Ni9Ti stainless steel. J. Mech. Work. Technol. 2015, 215, 142–150. [Google Scholar] [CrossRef]
  5. Kameneva, A.L.; A Minkova, A.; Cherkashneva, N.N.; Karmanov, V.V. Correlation between heat treatment process parameters, phase composition, texture, and mechanical properties of 12H18N10T stainless steel processed by selective laser melting. In IOP Conference Series: Materials Science and Engineering; IOP Publishing: Bristol, UK, 2018; Volume 447. [Google Scholar]
  6. Wang, X.; Hu, Q.; Liu, W.; Yuan, W.; Shen, X.; Gao, F.; Tang, D.; Hu, Z. Microstructure and corrosion properties of wire arc additively manufactured multi-trace and multilayer stainless steel 321. Metals 2022, 12, 1039. [Google Scholar] [CrossRef]
  7. Zhong, C.; Gasser, A.; Backes, G.; Fu, J.; Schleifenbaum, J.H. Laser additive manufacturing of Inconel 718 at increased deposition rates. Mater. Sci. Eng. A 2022, 844, 143196. [Google Scholar] [CrossRef]
  8. Sciaky, Inc. Benefits of Wire vs. Powder Metal 3D Printing. Comparing Sciaky’s Wirefeed 3D Printing Process, A.K.A. Electron Beam Additive Manufacturing, to Powder-Based Feedstock 3D Printing Processes. Available online: https://www.sciaky.com/additive-manufacturing/wire-vs-powder (accessed on 25 January 2024).
  9. Chen, Y.; Chen, X.; Jiang, M.; Lei, Z.; Wang, Z.; Liang, J.; Wu, S.; Ma, S.; Jiang, N.; Chen, Y. Coaxial laser metal wire deposition of Ti6Al4V alloy: Process, microstructure and mechanical properties. J. Mater. Res. Technol. 2022, 20, 2578–2590. [Google Scholar] [CrossRef]
  10. Caballero, A.; Ding, J.; Ganguly, S.; Williams, S. Wire+ Arc Additive Manufacture of 17-4 PH stainless steel: Effect of different processing conditions on microstructure, hardness, and tensile strength. J. Mater. Process. Technol. 2019, 268, 54–62. [Google Scholar] [CrossRef]
  11. Węglowski, M.S.; Błacha, S.; Phillips, A. Electron beam welding–Techniques and trends–Review. Vacuum 2016, 130, 72–92. [Google Scholar] [CrossRef]
  12. Wang, D.; Liu, Z.; Liu, W. Experimental measurement of vacuum evaporation of aluminum in Ti-Al, V-Al, Ti6Al4V alloys by electron beam. Metals 2021, 11, 1688. [Google Scholar] [CrossRef]
  13. Lyu, Z.; Sato, Y.S.; Tokita, S.; Zhao, Y.; Jia, J.; Wu, A. Microstructural evolution in a thin wall of 2Cr13 martensitic stainless steel during wire arc additive manufacturing. Mater. Charact. 2021, 182, 111520. [Google Scholar] [CrossRef]
  14. Martyushev, N.V.; Kozlov, V.N.; Qi, M.; Tynchenko, V.S.; Kononenko, R.V.; Konyukhov, V.Y.; Valuev, D.V. Production of workpieces from martensitic stainless steel using electron-beam surfacing and investigation of cutting forces when milling workpieces. Materials 2023, 16, 4529. [Google Scholar] [CrossRef]
  15. Ravi, G.A.; Hao, X.; Wain, N.; Wu, X.; Attallah, M. Direct laser fabrication of three dimensional components using SC420 stainless steel. Mater. Des. 2013, 47, 731–736. [Google Scholar] [CrossRef]
  16. Antunes, P.D.; Silva, C.C.; Correa, E.O.; Tavares, S.S.M. Influence of the heat input and aging treatment on microstructure and mechanical properties of AISI 317 L steel weldments using 0020 robotic–pulsed GMAW. Int. J. Adv. Manuf. Technol. 2019, 105, 5151–5163. [Google Scholar] [CrossRef]
  17. Silva, C.C.; de Miranda, H.C.; de Sant’Ana, H.B.; Farias, J.P. Microstructure, hardness and petroleum corrosion evaluation of 316L/AWS E309MoL-16 weld metal. Mater. Charact. 2009, 60, 346–352. [Google Scholar] [CrossRef]
  18. Grzesik, W. Hybrid additive and subtractive manufacturing processes and systems: A review. J. Mach. Eng. 2018, 18, 5–24. [Google Scholar] [CrossRef]
  19. Kolubaev, E.A.; Rubtsov, V.E.; Chumaevsky, A.V.; Astafurova, E.G. Micro-, Meso- and Macrostructural Design of Bulk Metallic and Polymetallic Materials by Wire-Feed Electron-Beam Additive Manufacturing. Phys. Mesomech. 2022, 25, 479–491. [Google Scholar] [CrossRef]
  20. Osipovich, K.; Kalashnikov, K.; Chumaevskii, A.; Gurianov, D.; Kalashnikova, T.; Vorontsov, A.; Zykova, A.; Utyaganova, V.; Panfilov, A.; Nikolaeva, A.; et al. Wire-Feed Electron Beam Additive Manufacturing: A Review. Metals 2023, 13, 279. [Google Scholar] [CrossRef]
  21. Holkar, H.; Sadaiah, M. Optimization of end milling machining parameters of AISI 321stainless steel using Taguchi method. Int. J. Recent Innov. Trends Comput. Commun. 2016, 4, 20–23. [Google Scholar]
  22. Arlyapov, A.; Volkov, S.; Promakhov, V.; Matveev, A.; Babaev, A.; Vorozhtsov, A.; Zhukov, A. Study of the machinability of an Inconel 625 composite with added NiTi-TiB2 fabricated by direct laser deposition. Metals 2022, 12, 1956. [Google Scholar] [CrossRef]
  23. Klimenov, V.A.; Kolubaev, E.A.; Han, Z.; Chumaevskii, A.V.; Klopotov, A.A.; Ustinov, A.M.; Kovalevskaya, Z.G.; Moskvichev, E.; Pan, M. Influence of anisotropy properties and structural inhomogeneity on elasticity and fracture of titanium alloys produced by electron-beam melting. Int. J. Adv. Manuf. Technol. 2024, 135, 5575–5594. [Google Scholar] [CrossRef]
  24. GOST 9.912-89 (ST SEV 6446-88); Unified System of Corrosion and Ageing Protection. Corrosion-Resistant Steels and Alloys. Method of Accelerated Test for Resistance to Pitting Corrosion. Publishing House of Standards: Moscow, Russia, 1989.
  25. Elmer, J.W.; Allen, S.M.; Eagar, T.W. Microstructural development during solidification of stainless steel alloys. Metall. Trans. A 1989, 20, 2117–2131. [Google Scholar] [CrossRef]
  26. Pixner, F.; Warchomicka, F.; Peter, P.; Steuwer, A.; Colliander, M.H.; Pederson, R.; Enzinger, N. Wire-based additive manufacturing of Ti-6Al-4V using electron beam technique. Materials 2020, 13, 3310. [Google Scholar] [CrossRef]
  27. Aghuy, A.A.; Zakeri, M.; Moayed, M.H.; Mazinani, M. Effect of grain size on pitting corrosion of 304L austenitic stainless steel. Corros. Sci. 2015, 94, 368–376. [Google Scholar] [CrossRef]
  28. Tiamiyu, A.A.; Eduok, U.; Odeshi, A.G.; Szpunar, J.A. Effect of prior plastic deformation and deformation rate on the corrosion resistance of AISI 321 austenitic stainless steel. Mater. Sci. Eng. A 2019, 745, 1–9. [Google Scholar] [CrossRef]
  29. Tiamiyu, A.A.; Eduok, U.; Szpunar, J.A.; Odeshi, A.G. Corrosion behavior of metastable AISI 321 austenitic stainless steel: Investigating the effect of grain size and prior plastic deformation on its degradation pattern in saline media. Sci. Rep. 2019, 9, 12116. [Google Scholar] [CrossRef]
  30. Gupta, R.K.; Birbilis, N. The influence of nanocrystalline structure and processing route on corrosion of stainless steel: A review. Corros. Sci. 2015, 92, 1–15. [Google Scholar] [CrossRef]
  31. Stepanov, D.Y.; Tian, D.; Alexenko, V.O.; Panin, S.V.; Buslovich, D.G. Application of Neural Network Models with Ultra-Small Samples to Optimize the Ultrasonic Consolidation Parameters for ‘PEI Adherend/Prepreg (CF-PEI Fabric)/PEI Adherend’ Lap Joints. Polymers 2024, 16, 451. [Google Scholar] [CrossRef] [PubMed]
  32. Draper, N.R.; Smith, H. Applied Regression Analysis. In Wiley Series in Probability and Statistics; John Wiley and Sons: Hoboken, NJ, USA, 2014; p. 736. [Google Scholar]
  33. Kuprienko, N.V.; Ponomareva, O.A.; Tikhonov, D.V. Statistical Methods for Studying Relationships. In Correlation-Regression Analysis; Publishing House of the Polytechnic University: St. Petersburg, Russia, 2008; p. 118. (In Russian) [Google Scholar]
  34. Yan, X.; Su, X. Linear Regression Analysis: Theory and Computing; World Scientific Publishing: Singapore, 2009. [Google Scholar]
  35. Haykin, S.S. Neural Networks and Learning Machines, 3rd ed.; Pearson Education: Upper Saddle River, NJ, USA, 2009. [Google Scholar]
  36. Swingler, K. Applying Neural Networks: A Practical Guide; Morgan Kaufman Publishers, Inc.: San Francisco, CA, USA, 1996. [Google Scholar]
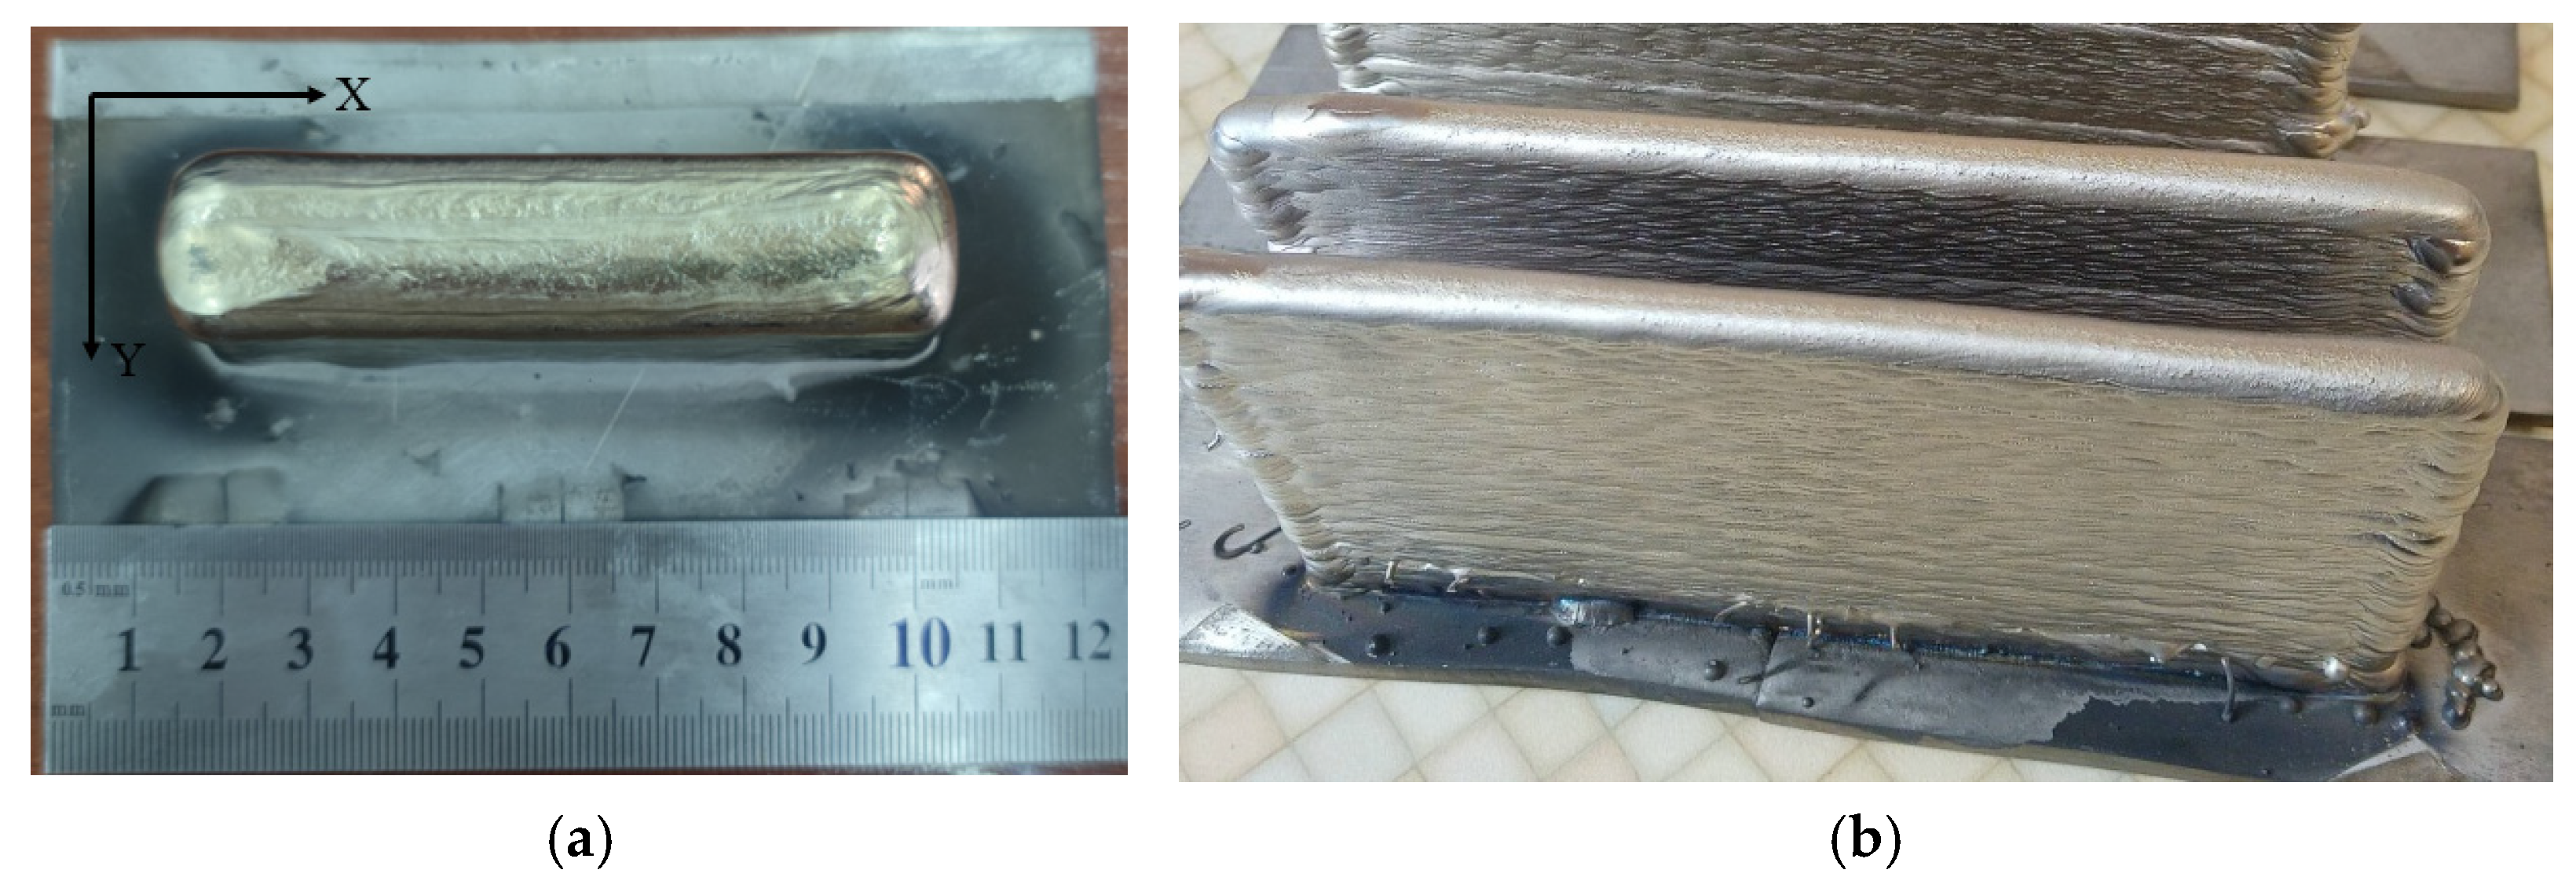
Figure 1. Photographs of the 3D-built thick (a) and thin (b) blanks (walls).
Constrmater 05 00062 g001
Figure 2. A general view of a horizontal sample fixed in the stationary machine (a) and the milling scheme (b).
Constrmater 05 00062 g002
Figure 3. The ‘RM0813-01S2’ CNC machine (a) and an example of the surface profile after milling in mode 1 (b).
Constrmater 05 00062 g003
Figure 4. The OM images of the microstructures of the thick (a) and thin (b) walls, as well as the wrought steel (c).
Constrmater 05 00062 g004
Figure 5. The SEM-EDS mapping patterns of the thin wall (a) and the wrought steel (b).
Constrmater 05 00062 g005
Figure 6. The results of the EBSD phase analysis (a,d), IPF maps (b,e), and grain size distributions (c,f). The thin wall (ac) and the wrought steel (df).
Constrmater 05 00062 g006
Figure 7. Engineering stress–strain curves of the 3D-built walls and the wrought steel.
Constrmater 05 00062 g007
Figure 8. The TEM micrographs of the wrought steel (аf) and the thin wall (gi): (a) bright-field image of microtwins of three systems; (b) diffraction pattern for Figure 8a, with marked axes of the ZA [554] γ and [112] γtw zones; (c) dark-field image in the reflections of the g = [−220] γ matrix and g = [−220] γtw twin; (d) dark-field image of microtwins in the [200] γtw1 reflection; (e) dark-field image of microtwins in the [200] γtw2 reflection; (f) bright-field image of the dislocation substructure and stacking faults; (g) overview bright-field image of a δ-ferrite grain between austenite ones; (h) enlarged part of the bright-field image presented in Figure 8g, with both grain types and microtwins marked (light blue arrows); (i) diffraction pattern corresponding to region 1 in Figure 8h (bottom austenite grain), with marked axes of the [110] γ and [111] δ zones.
Constrmater 05 00062 g008
Figure 9. The TEM micrographs of carbides in the microstructure of the thin wall: (a) bright-field image of finely dispersed TiC particles in an austenite grain; (b) diffraction pattern for Figure 9a, with the axis of the [110] γ zone marked; (c) dark-field image in the g = [002] γ matrix reflection; (d) dark-field image of carbide particles in the g = [002] TiC reflection; (e) dark-field image in the g = [2–22] γ matrix reflection; (f) local EDS analysis maps.
Constrmater 05 00062 g009
Figure 10. The linear sweep voltammetry (LSV) curves of the 3D-built walls and the wrought steel in an aerated aqueous solution containing 3.5 wt% of NaCl; operating conditions: reference electrode—Ag/AgCl; cathode—Pt wire; pH = 6.0; scan rate = 0.01.
Constrmater 05 00062 g010
Figure 11. The cutting forces recorded upon milling of the built walls under different conditions (a); the influence of both cutting speed and feed on the cutting force for the thick wall (b).
Constrmater 05 00062 g011
Figure 12. The milling parameters and the SOP regions plotted using the linear regression model (a,c) and the FFNN one (b,d) at p ¯ = 300 mm3/min, R a ¯ = 0.8 μm (a,b), and R a ¯ = 0.6 μm (c,d).
Constrmater 05 00062 g012
Figure 13. The scheme of the hybrid additive–subtractive production rout for laboratory-scale EBAM.
Constrmater 05 00062 g013
Table 1. The parameters applied for studying the cutting forces upon milling with the industrial machine.
No.Cutting Speed (m/min)Feed (mm/min)Width (mm)Depth (mm)
1255080.5
225160
325250
45050
550160
650250
77550
875160
975250
Table 2. The milling parameters for the semi-industrial machine (with lower stiffness of the portal frame) according to the Taguchi method and the machinability assessment results.
No.Rotation Speed, N (rpm)Feed, S (mm/min)Width, B (mm)Depth t, (mm)Roughness Ra (μm)MRR (mm3/min)
110002000.140.46 ± 0.0280
210004000.31.29 ± 0.04480
310006000.52.57 ± 0.231200
425002000.30.59 ± 0.03240
525004000.51.01 ± 0.04800
625006000.10.88 ± 0.04240
740002000.50.63 ± 0.03400
840004000.10.40 ± 0.01160
940006000.30.75 ± 0.03720
Table 3. The chemical compositions of the AISI 321 steel wires and the built walls.
SampleFeCrNiMnSiTiCuMoCoAlPCV
wt.%
Wire65.319.611.50.80.70.70.50.30.60.040.060.02
Thick wall64.619.512.10.80.70.60.50.30.60.050.020.04
Thin wall65.719.311.50.80.70.70.50.30.50.03
Table 4. The mechanical properties of the built walls and the wrought steel.
SampleUltimate Tensile Strength, MPaYield Strength, MPaElongation, %Microhardness, HV
Thick wall570 ± 10208 ± 1070 ± 2%191 ± 5
Thin wall550 ± 5198 ± 1068 ± 1%185 ± 5
Wrought steel700 ± 10250 ± 1063 ± 3%230 ± 5
Table 5. The local EDS analysis results in regions 1–3 of the thin wall shown in Figure 8g.
No.Element Content, wt.%
SiCrMnFeNiMo
10.524.92.068.93.40.3
20.518.21.572.77.10.0
30.118.02.072.07.50.4
Table 6. The local EDS analysis results in regions 1–3 of the thin wall shown in Figure 9a.
No.Composition of Elements, wt.%
SiTiCrMnFeNi
10.333.412.00.246.37.8
20.881.85.10.210.80.7
30.60.017.62.067.312.4
Table 7. The quantitative corrosion indicators of the 3D-built walls and the wrought steel.
SampleCorrosion Current,
Icorr (μA)
Corrosion
Potential,
Ecorr (V)
Breakdown Potential,
Eb (V)
Polarization Resistance,
(kΩ/cm2)
Corrosion Rate,
(μm/year)
Thick wall3.4 ± 0.1−0.33 ± 0.020.46 ± 0.0114.6 ± 0.430 ± 2
Thin wall3.8 ± 0.1−0.32 ± 0.020.43 ± 0.0112.5 ± 0.335 ± 2
Wrought steel6.4 ± 0.1−0.20 ± 0.020.20 ± 0.017.3 ± 0.256 ± 2
Table 8. The parameters of the micro-, meso-, and macrostructures, the mechanical properties, and corrosion resistance of the built walls and the wrought steel.
Thick WallThin WallWrought Steel
Microhardness (НV)191 ± 5185 ± 5230 ± 5
Ultimate tensile strength (MPa)570 ± 10550 ± 10700 ± 10
Elongation (%)70 ± 2%68 ± 1%63 ± 3%
Average grain size (μm)-25.911.7
Grain structure type-columnarequiaxed fine
Conditional dislocation density (cm−2)-~10101011
Ferrite content (%)-6.916.1
Austenite content (%)-93.183.9
Presence of twins--+
Carbide type-TiCTiC
Corrosion rate (μm/year)30 ± 235 ± 256 ± 2
Table 9. The limiting ranges and the suboptimality boundaries for the milling parameters and the analyzed characteristics.
Limiting RangesSuboptimality Boundaries
MinMaxMinMax
Parameters
Rotation speed, N (rpm)5005000
Feed, S (mm/min)100800
Width, B (mm)0.11
Characteristics
Ra roughness (µm)04-0.8
MRR (mm3/min)02000300-
Table 10. The milling parameters for the model verification, as well as the experimental and predicted results.
No.Milling ParametersCharacteristics
Rotation Speed, N (rpm)Feed, S (mm/min)Width, B (mm)MRR, mm3/minRa Roughness (µm)
ExperimentRegressFFNN
1040001000.52000.3330.31170.6115
1140006000.512001.1931.36171.0429
1245004000.34800.4250.38890.5224
Mean deviation0.07530.1753
Disclaimer/Publisher’s Note: The statements, opinions and data contained in all publications are solely those of the individual author(s) and contributor(s) and not of MDPI and/or the editor(s). MDPI and/or the editor(s) disclaim responsibility for any injury to people or property resulting from any ideas, methods, instructions or products referred to in the content.