Article

Segregation Sensitivity of Concrete—Quantification by Concrete Density

1
Institute of Building Materials and Concrete Structures (IMB), Karlsruhe Institute of Technology (KIT), 76131 Karlsruhe, Germany
2
Federal Waterways Engineering and Research Institute (BAW), 76187 Karlsruhe, Germany
3
Department of Civil Engineering, Aalto University, 02150 Espoo, Finland
*
Author to whom correspondence should be addressed.
Constr. Mater. 2025, 5(2), 22; https://doi.org/10.3390/constrmater5020022
Submission received: 4 March 2025 / Revised: 31 March 2025 / Accepted: 2 April 2025 / Published: 8 April 2025

Abstract

:
Concrete segregation can lead to variations in hardened concrete’s properties, such as strength and Young’s modulus, or permeability, resulting in changing volume ratios between aggregates and paste within a concrete element. One approach to mitigate this potential risk is to conduct a performance test to assess vibrated concrete’s segregation sensitivity. This paper outlines various methods to evaluate the segregation sensitivity of vibrated concrete, aiming to support adequate concrete casting. The focus is on practical feasibility while maintaining test accuracy. For hydraulic engineering in Germany, test procedures to evaluate segregation sensitivity on fresh and hardened concrete based on aggregate distribution are described in the “BAW-Code of practice MESB”. However, this method is very complex and, therefore, difficult to implement in practice. Another procedure for hardened concrete is based on concrete density. In this paper, both methods are compared to investigate if evaluating fresh concrete using a simple density criterion leads to a comparably significant differentiation of vibrated concrete with different segregation sensitivities. The primary emphasis lies in accurately classifying examined concretes in terms of their segregation sensitivity, evaluating the scatter of results, and assessing the practical applicability of these methods. The investigations demonstrate that a density-based method can yield reliable and comparable results to those obtained through the wash-out test according to “BAW-Code of practice MESB”. Additionally, a simpler and faster procedure is achievable with the density approach. Hence, density evaluation offers a practical alternative to the wash-out test.

1. Introduction

Concrete is the most common construction material worldwide, primarily composed of five essential components: aggregates, cementitious binder, water, and admixtures. Achieving optimal performance requires the homogeneous distribution of these components to ensure a uniform development of the material properties [1,2]. Segregation of a material occurs when certain components predominantly accumulate in specific areas [3]. The stability of concrete composition is highly dependent on the environmental and boundary conditions, including factors such as temperature, time, frequency, and amplitude of vibration. However, concrete composition also significantly influences concrete stability [3,4]. When additional requirements are placed on special fresh concrete properties, such as the ability to fill complex component geometries, concrete is designed to exhibit greater flowability [5]. With increasing flowability, the durability and strength of concrete increasingly rely on precise composition and adequate processing [3]. Additionally, introducing new and diverse binders, along with a broader range of admixtures, contributes to a more intricate manufacturing process, rendering it more susceptible to potential interferences [4]. For this reason, the development of a practical and effective test method for segregation sensitivity is essential. It is important to have a quick test method that can be applied on site and detect potential segregation problems of vibrated concrete at an early stage.
This paper, therefore, presents investigations for the development of a rapid test procedure for the evaluation of the segregation sensitivity of vibrated concrete on site and is intended to close this research gap. The objective is to combine aspects of two existing methods to achieve a low operating expense of the test itself and test results that are intelligible to all involved persons on site.

2. Literature Review

In 2015, there was extensive damage to a newly built freeze–thaw exposed lock chamber wall in Germany due to segregation events [6]. The segregation of aggregates led to alterations in the concrete’s composition within the structure, thereby affecting its properties. In general, it is known that segregation can reduce concrete strength [7], increase the proportion of pores in the concrete surface [1], and adversely affect durability properties [6]. As a consequence of the damage caused by segregation and the general demand for practically relevant test procedures [8], research activities started to develop [7,9,10], and a practical test method was introduced [11]. The test method originally developed to evaluate the segregation sensitivity of self-compacting concrete [12] was adapted to vibrated concrete. A comprehensive analysis was then carried out to investigate the factors influencing concrete segregation depending on its various components [13]. These research results led to the development of a test method for fresh concrete and one for hardened concrete. The details of these tests are described in the “BAW Code of practice MESB”, in particular Appendices A (fresh concrete: wash-out test) and B (hardened concrete) [11]. This paper will concentrate on fresh concrete. At present, the wash-out test according to [11] is not a mandatory part of assessing fresh concrete’s properties for hydraulic structures in Germany due to the time and labour required, data evaluation, and the variability in the test results. This is currently used on site to gather practical experience and collect data on typical mix designs used for hydraulic structures in Germany.
In the literature, there are various methods for assessing the segregation sensitivity of concrete. An alternative approach is to measure the moisture content over the height of a test specimen [14]. This method takes advantage of the phenomenon that, when segregation occurs, more mortar and, therefore, water are observed in the upper part of the concrete than in the lower part. However, this method requires a calibrated measuring probe and staff training to obtain accurate results [14]. Another way to determine moisture is the kilning or the microwave method [15]. These methods have a level of complexity that is comparable to the method in ref. [11]. An additional approach to determine the tendency to segregate is based on the rheological test of the Couette method described in DIN EN ISO 3219-2 [16]. It measures the resistance force associated with the viscosity of the material, a parameter influenced by density changes during segregation [17]. However, this approach is not a simplification of the measurement method either. Another idea is to investigate the segregation tendency of concrete using alternating-current (AC) impedance spectroscopy [18]. In this method, segregation is inferred from differences in electrical resistance between aggregates and paste. However, this approach is not further explored in this context due to its increased complexity compared to the method in ref. [11].
In addition to the various test methods described, a new and promising approach is to examine the distribution of the density of hardened concrete over the height of the test specimen [19]. This method is simpler and less complicated and offers a more straightforward alternative for assessing concrete segregation.
It is important to mention that, at the beginning of compaction, not only does aggregate segregation affect the degree of segregation or density difference but also the expulsion of unwanted air pockets and the filling of the formwork [1]. While density is a reliable metric for assessing aggregate segregation in concrete, it is important to note its limitations. In particular, the presence of compaction pores can distort density measurements. If compaction is inadequate, these compaction pores will remain in the concrete, reducing the density even in the lower part of the specimen. This can lead to a misleading range of densities, giving the false impression of no or minimal segregation when, in fact, aggregates may have segregated significantly. This effect diminishes with increasing compaction time, and the influence disappears almost completely, so that the extent of segregation or the density difference depends solely on the actual segregation of the aggregates. It is therefore necessary to consider and evaluate the entire evolution of the density difference over the compaction time. During development, it becomes clear which times represent insufficient compaction or over-compaction.

3. Investigation

3.1. Investigation Concept

In this section, the concept of the investigations, the experimental procedures, and the concrete mix designs used are presented. The target of the investigations was to develop a test procedure that enabled the evaluation of the segregation sensitivity of vibrated concrete on site in a fast way with a low operating expense, with test results intelligible to all involved persons on site, by combining aspects of two existing test procedures. Both existing procedures are presented in this section, as well as the new one, developed in this paper.
To investigate whether the test methods could differentiate between different segregation sensitivities, five concrete mix designs with a preferably wide range of segregation sensitivity (Figure 1) were developed and tested. To gather information on test scatter, repeated tests were conducted with the same mix design. Based on the test results, an evaluation method is discussed below.

3.2. Test Procedures

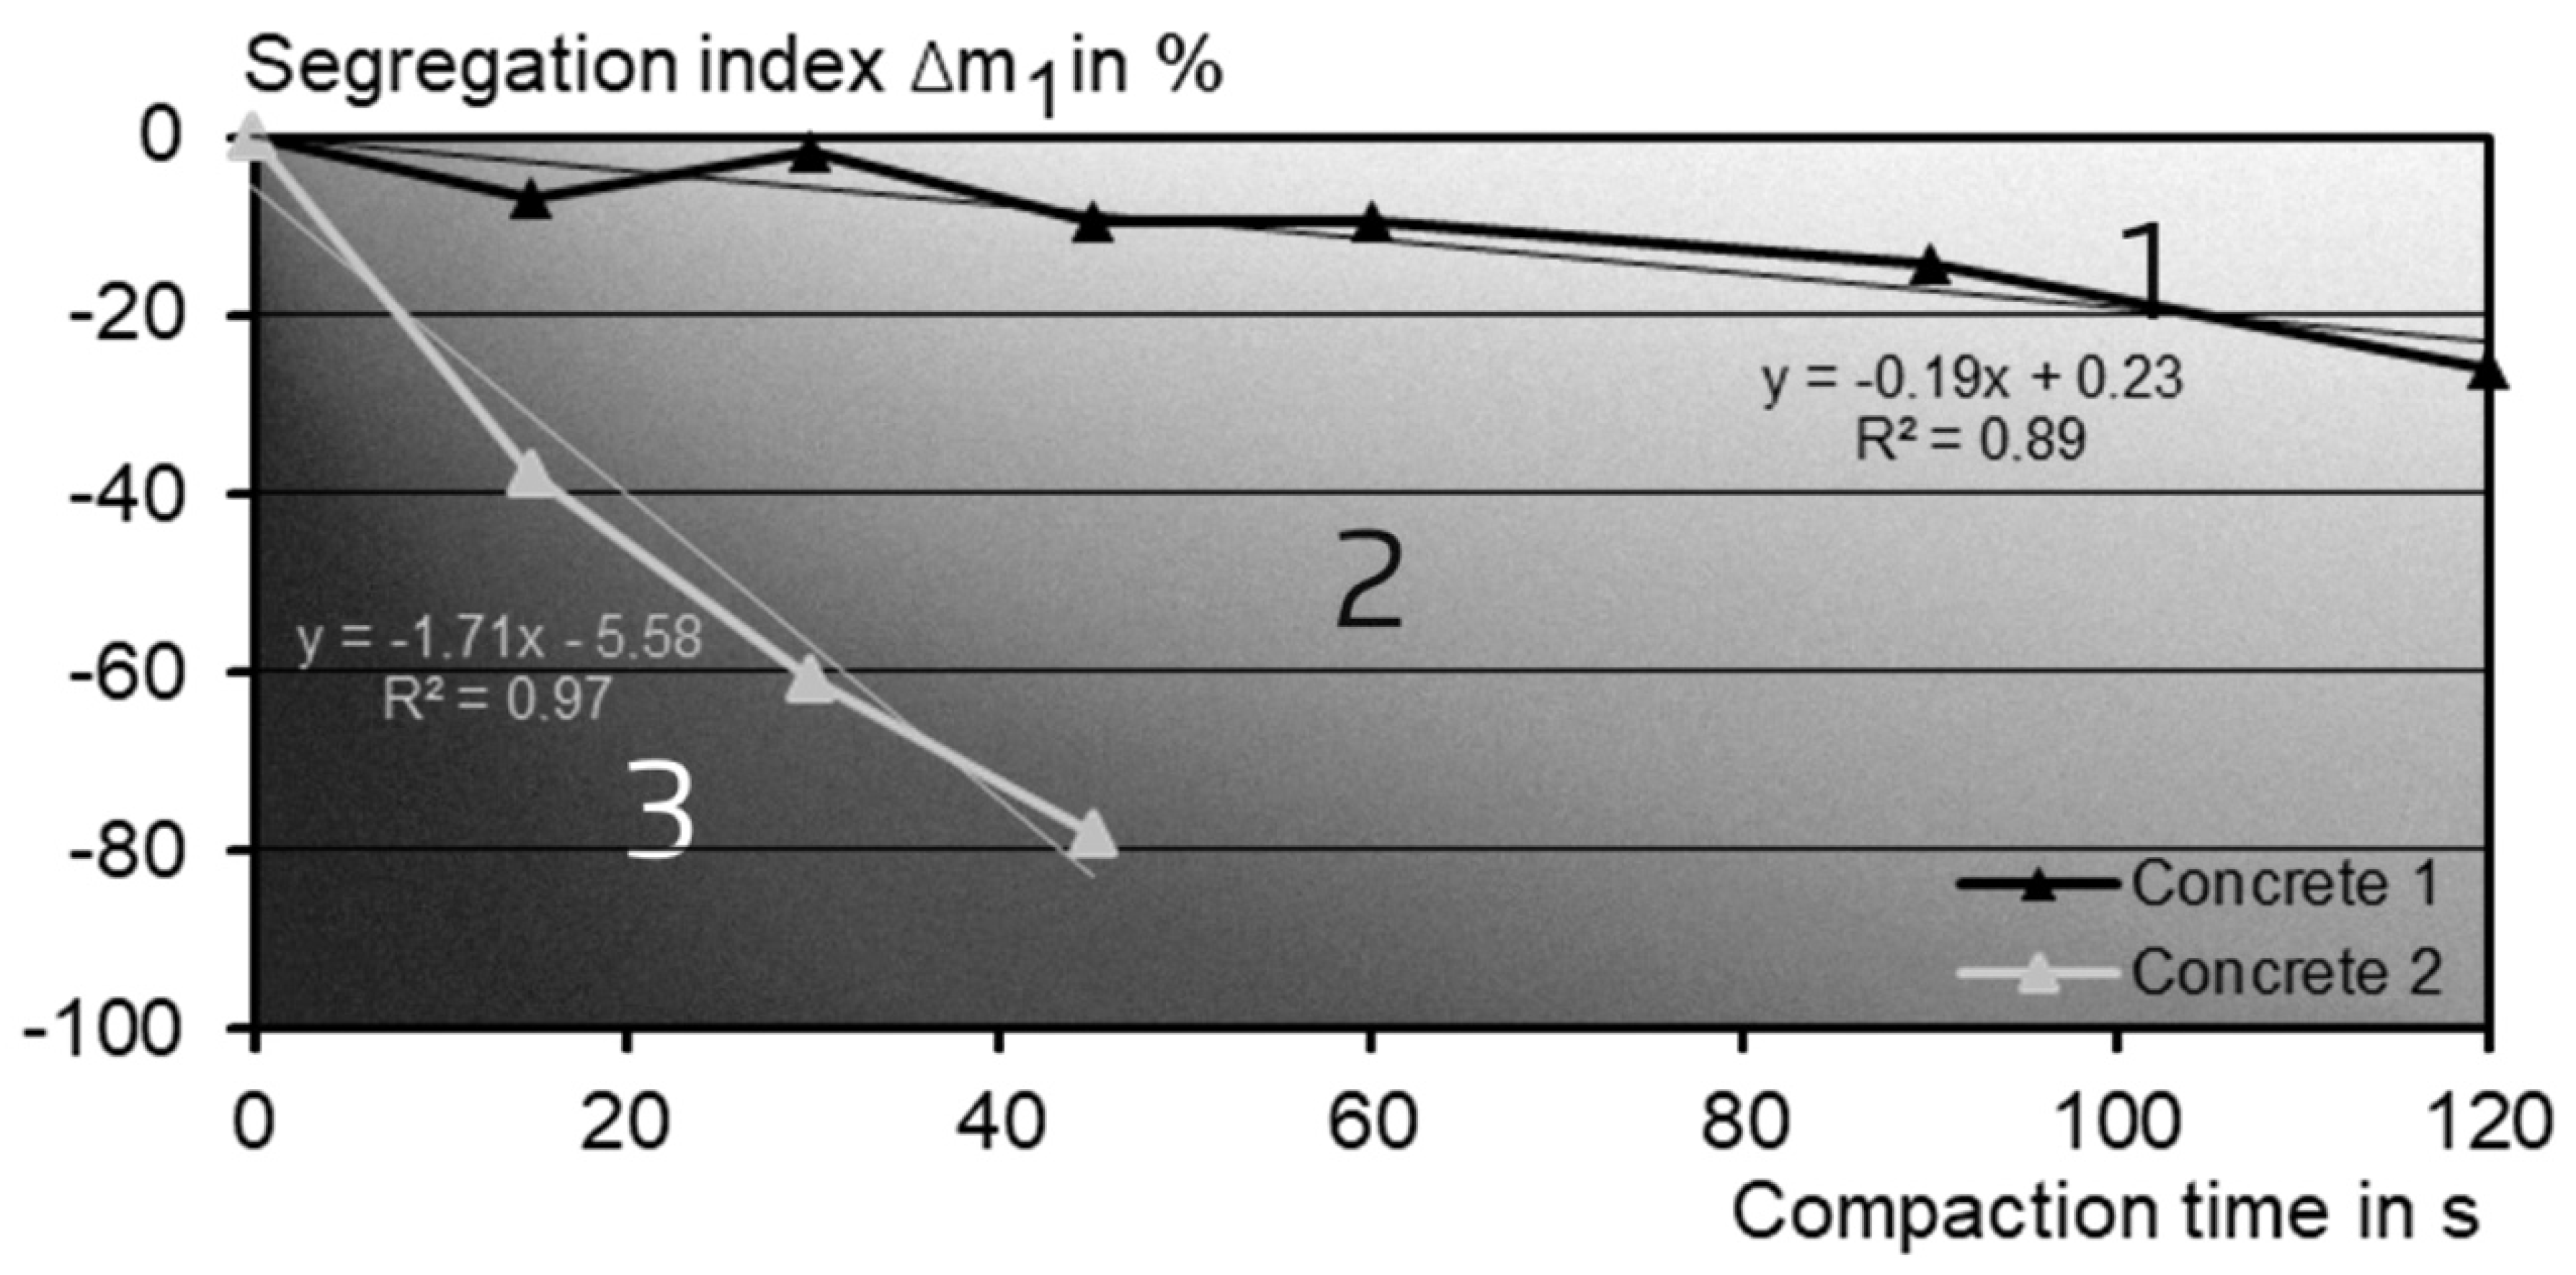
3.2.1. Wash-Out Test According to “BAW-Code of Practice MESB” [11]

The wash-out test performed in this paper is described in Appendix A of ref. [11]. In this method, a cylindrical mould, measuring 450 mm in height and 150 mm in diameter, was filled with fresh concrete, vibrated for a specific time, and uniformly segmented into three segments (each segment with a height of 150 mm) using a separating slide. For concrete with a maximum aggregate size of 22 mm or 32 mm, subsequently, all aggregates with a size of ≥11.2 mm were separated by washing out the fresh concrete of each segment and sieving through a square 11.2 mm sieve. When tested at a minimum of four different compaction times, this method established a correlation between the vibrating time and segregation. To minimise the influence of changing fresh concrete properties with time during the segregation tests, the moulds needed to be filled with concrete and vibrated at different vibration times (15 s, 30 s, 60 s, and 90 s) successively before commencing with aggregate wash-out. The compaction of the specimens was carried out using a table vibrator (frequency = 75 Hz and amplitude = 0.25 mm) clamped at 12 Nm [11]. The weight of the sieved aggregates was measured with precision to the nearest 1 g. Additionally, the weight of the first segment was adjusted to account for the concrete slumping that occurred due to compaction [11,13]. The so-called settling dimension “a” related the weight of the sieved aggregates of the upper segment to the measured height of the upper segment (Equation (1)):
m 1 , c o r r = m 1 1 a 150 ,
where m 1 is the weight of the sieved aggregates in the upper segment [g], and a is the settlement dimension after compaction [mm].
The average weight m′ of the segments is then calculated according to Equation (2):
m = 1 3 × ( m 1 , c o r r + m 2 + m 3 ) ,
where m 1 , c o r r is the corrected weight of the sieved aggregates in the upper segment [g], m 2 is the weight of the sieved aggregates in the middle segment [g], m 3 is weight of the sieved aggregates in the lowest segment [g], and m is the average weight of the sieved aggregates [g].
Next, the segregation index as a percentage deviation of the mass of each segment based on the average mass of the aggregates is calculated to the nearest 1 w.-% according to Equation (3):
Δ m i = m i m 1 × 100 ,
where Δ m i is the segregation index as a percentage deviation of the weight of the sieved aggregates in the i-th segment from the average weight [w.-%], m i is the weight of the sieved aggregates in the i-th segment [g], and m is the average weight of the sieved aggregates [g].
Subsequently, a linear regression function for the percentage deviation of the upper segment and the compaction time is calculated considering the measurement data and the zero point. The zero point is derived from the assumption that, without compaction, no segregation due to the compaction of the concrete is anticipated. The slope of the regression function serves as a benchmark for evaluating the segregation sensitivity of the concrete, as it describes the segregation speed of the coarse aggregate during vibration. A steep slope of the regression function indicates that the concrete is deemed sensitive to segregation. In Figure 1, three ranges for a rough classification of the segregation sensitivity are indicated. Concrete 1 could be assigned to range 1 and concrete 2 to range 2 or 3.
The slope of the regression function determines the segregation index in the wash-out test. For this reason, it is important to determine the deviation of the data values of the segregation index to the regression function. This is called the coefficient of determination R2 and is calculated using Equation (4) [11]:
R 2 = ( y x i y ) 2 ( y i y ) 2 ,
where R 2 is the coefficient of determination [-], y x i is the regression function [-], y is the average value [-], and y i is the measure value [-].

3.2.2. Density Method

For testing hardened concrete specimens, the test specimens were cut into 10 uniform slices [1,19]. In this investigation, the specimens were cut according to the wash-out test into three slices. Afterwards, the density of the concrete slices was determined at room temperature (20 ± 2 °C) according to DIN EN 12390-7:2021-07 [20]. Firstly, each slice was weighed in air (ma). Afterwards, each slice was weighed under water, and the volumes were calculated by subtracting the “underwater weight” from the “in-air weight”. The volume and density of the slices were calculated according to Equations (5) and (6):
V = m a m w ρ w ,
ρ c = m a V ,
where m a is the weight of the concrete slice in air [kg],   m w is the weight of the concrete slice under water [kg] ,   ρ w is the density of water [1000 kg/m3],   V is the volume of the concrete slice [m3], and ρ w is the density of the concrete slice [kg/m3].
Afterwards, the standard deviation S2 (Equations (7) and (8)) of the density of the concrete slices was calculated and used as an indication of the classification of the segregation tendency of the concrete [1]:
S 2 = ( ρ c ,   i ρ ) 2 n 1 ,
ρ = c = 1 n ρ c ,   i n ,
where S 2 is the standard deviation of the concrete slice [kg/m3], ρ c is the density of the i-th concrete slice [kg/m3], ρ is the average density of all concrete slices [kg/m3], and n is the amount of all concrete slices [-].
The adaptation of the density assessment according to [1,19] to the assessment of fresh concrete is called the “standard deviation method” (SDM). It can also be used for fresh concrete. For fresh concrete, the experimental setup followed the structure of the wash-out test according to Section 3.2.1. Instead of the labour-intensive procedure of washing out each segment of the concrete cylinder, just the concrete weight in air of each segment was determined. The concrete volume corresponded to the volume of the formwork. Solely for the volume of the upper slice, the settlement, as described in Section 3.2.1, Equation (1), was taken into account. The density and standard deviation were determined in the same way as for hardened concrete according to Equations (5)–(8).
The density difference method (DDM) assessed the segregation tendency by considering the absolute values of the difference in density between the upper and lower segments. Density determination was carried out in the same way as for the SDM. The density difference between the lower and upper segments was calculated according to Equation (9):
ρ = | ρ u ρ l | ,
w h e r e   ρ is the density difference [kg/m3], ρ u is the density of the upper segment [kg/m3], and ρ l is the density of the lower segment [kg/m3].
The German standard DIN 1045-2 [21] specifies a maximum variation of ±100 kg/m3 from the mean dry density of hardened concrete for a dry density between 2000 kg/m3 and 2600 kg/m3 in cases where a target value for the density is agreed. This generally seems to be appropriate to link the segregation sensitivity evaluated by DDM to an established standard. However, the maximum limit for the allowable deviation in concrete density is intricately tied to ensuring an adequate compaction time [21]. Since this adequate compaction time varies depending on the concrete’s properties, it is also necessary to determine the density difference in the segregation sensitivity test depending on the compaction time, similar to the wash-out test according to Section 3.2.1.

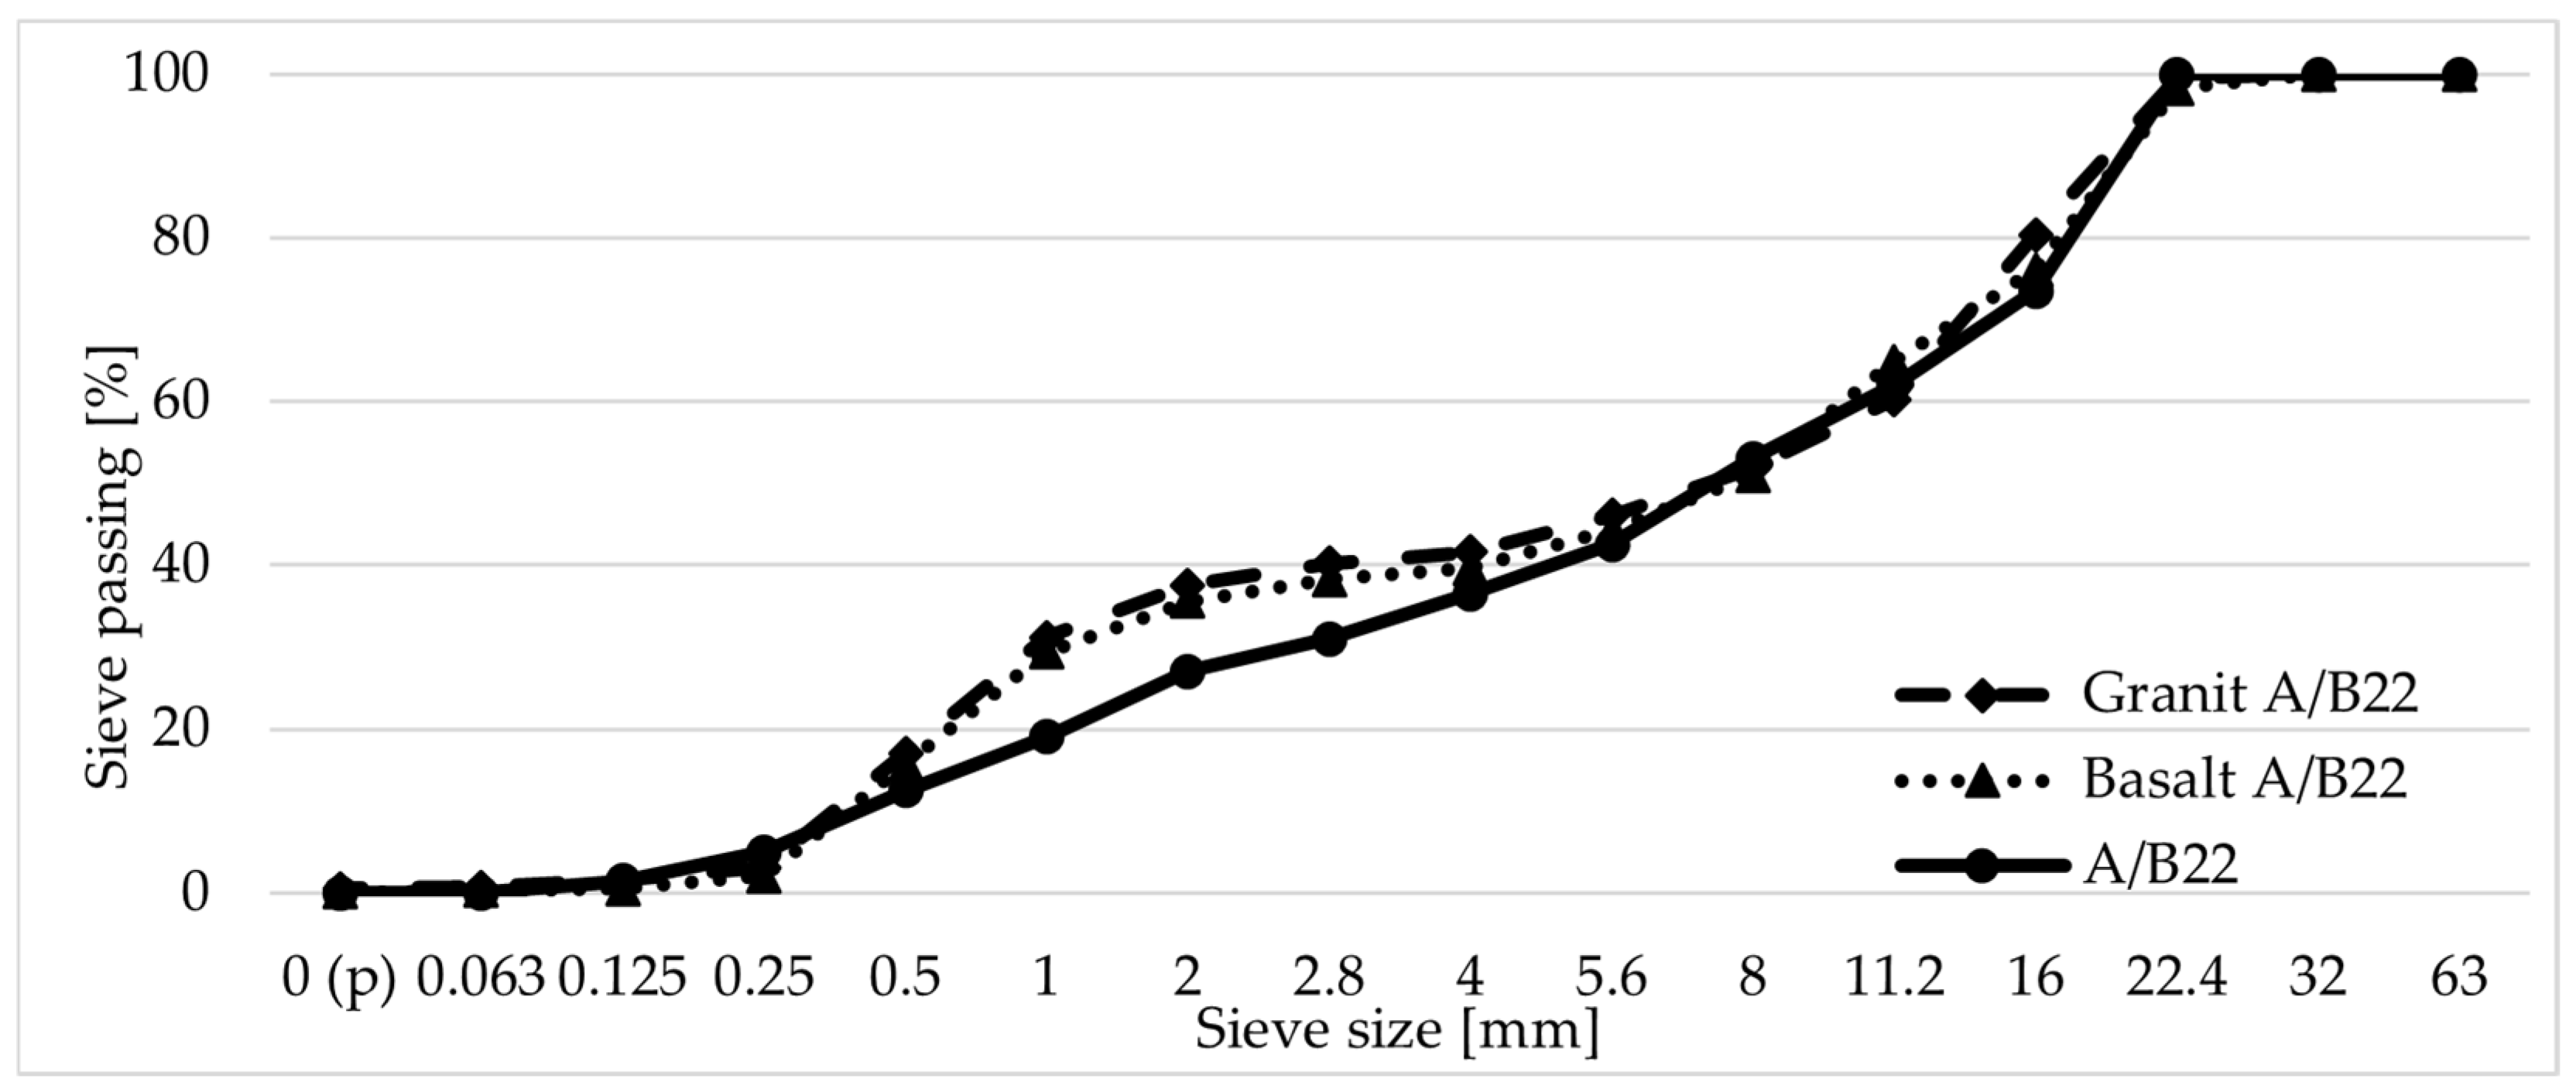
3.3. Concrete Mix Design

All concretes were produced with a cement CEM III/A 42.5 N according to DIN EN 197-1 [22] with an assumed density of 3000 kg/m3. Furthermore, fly ash with an assumed density of 2300 kg/m3 was used. The fly ash content was considered for the (w/c)eq-value with k = 0.4. The (w/c)eq-value of the concretes varied between 0.52 and 0.55. The paste volume and the target air content were varied to obtain a wide range of segregation sensitivity. The grading curves used in all concretes were defined as an A/B grading curve according to DIN 1045-2 [21] and are shown in Figure 2.
To evaluate the effect of the different densities of the aggregates on the segregation sensitivity, two different crushed aggregates were used: basalt, with a density ρssd of 3020 kg/m3, and granite, with a density ρssd of 2630 kg/m3, each with a maximum aggregate size diameter of 22 mm. The exact concrete mix designs are listed in Table 1.
In order to achieve the target consistency at the limit range between F3 and F4 according to DIN EN 12350-5 [23], a super-plasticiser based on polycarboxylate ether (PCE) was used when necessary. The paste volume was determined using Equations (10) and (11):
p c = m c ρ c + m f a ρ f a + m w ρ w × 1000   ,
p c ,   a i r = p c + V a i r   ,
where m c ,   f a ,   w is the content of cement (c), fly ash (fa), and water (w) [kg/m3], p c is the paste content [L/m3], ρ c ,   f a ,   w is the density of cement (c), fly ash (fa), and water (w) (the density of water (w) is taken as 1000 kg/m3) [kg/m3], and V a i r is the air content [L/m3].

3.4. Experimental Procedure

After the concrete was mixed, the air content was determined according to DIN EN 12350-7 [24] and the flow table test spread according to DIN EN 12350-5 [23]. In addition, the density was measured according to DIN EN 12350-6 [25]. Five batches were produced (named chronologically Batch 1 to 5) to obtain information on the test scatter for each mix design. All segregation tests were conducted with four different compaction times of 15 s, 30 s, 60 s, and 90 s. Certain compaction times were selected as they reflected the variation in compaction duration observed in practice. Additionally, these are specified in the “BAW-Code of practice MESB” [11].

4. Test Results

4.1. Fresh Concrete Properties
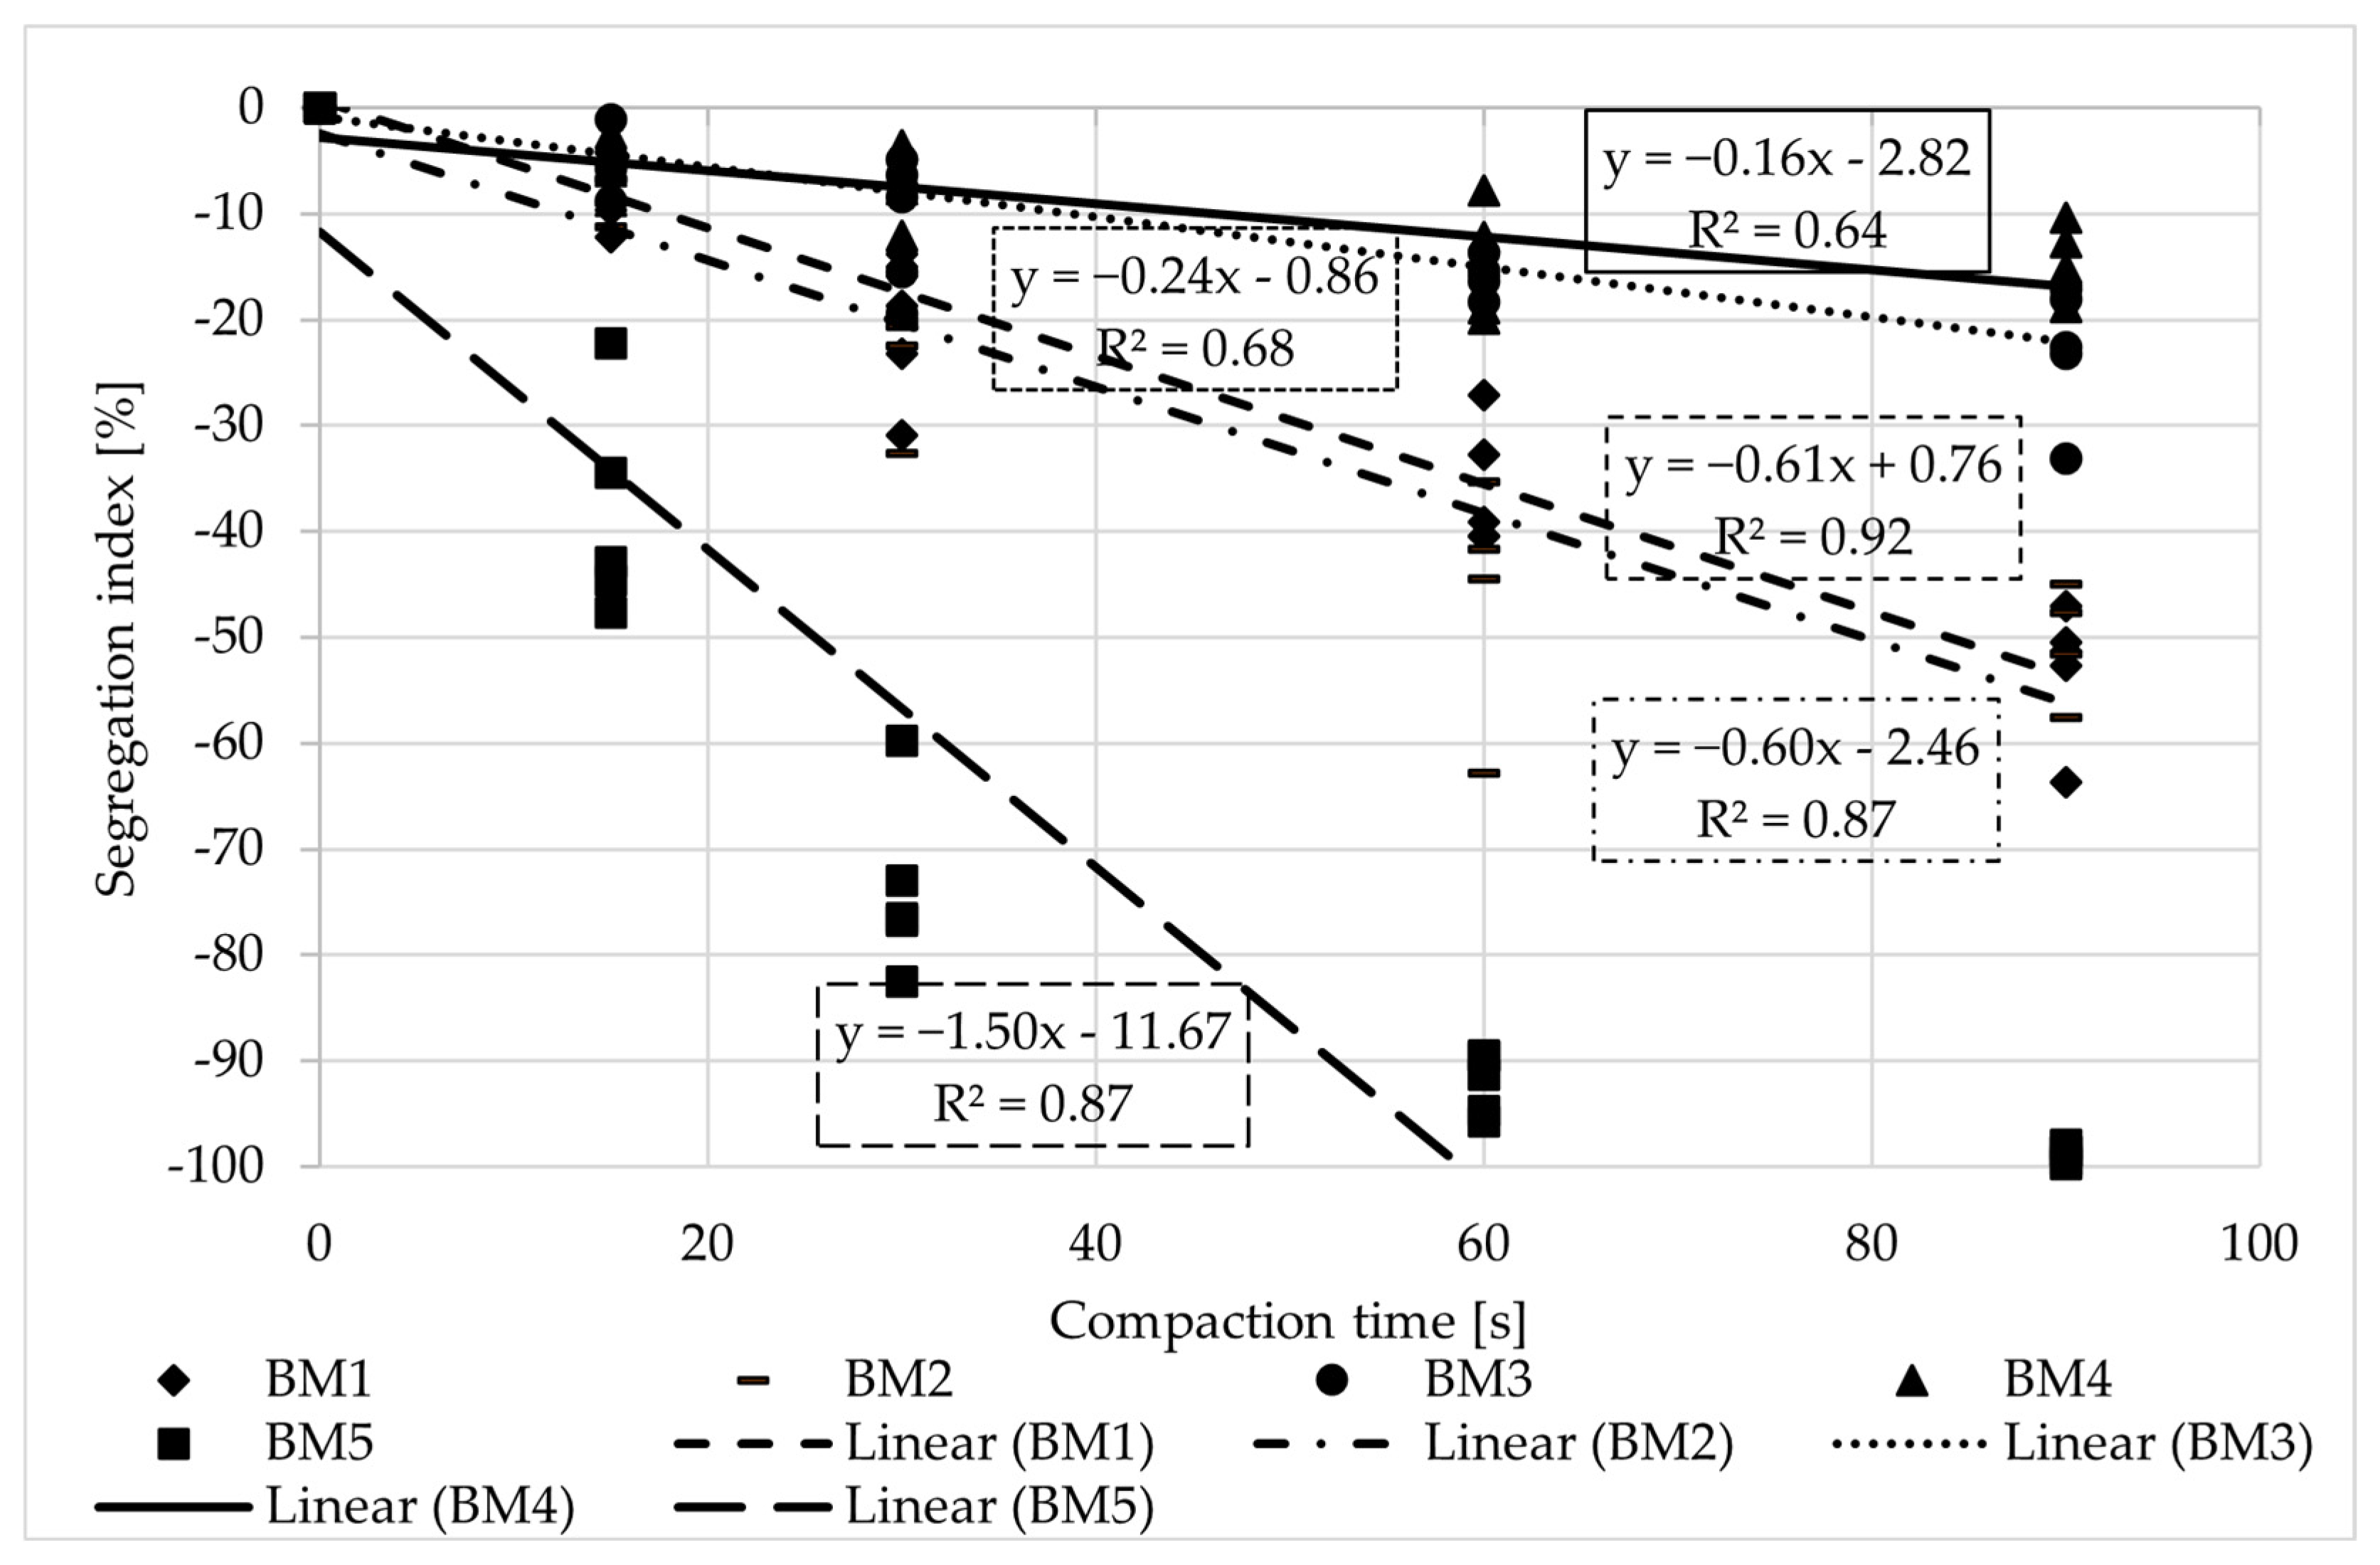
The mean fresh concrete properties are shown in Table 2.
For BM5, a lower air content than intended was determined, but it was considered acceptable for the investigations to produce a segregation-sensitive concrete.

4.2. Wash-Out Test

The test results and the linear regression functions of the wash-out test for BM1 to BM5 are shown in Figure 3. As intended, they represent a wide range of concrete segregation sensitivity.
The results indicated that the non-air-entrained concretes BM3 and BM4 showed a comparable and low segregation sensitivity. With regard to the mix design, the main difference was the aggregate density. It did not result in a remarkably different segregation sensitivity.
The segregation sensitivity of the air-entrained concretes BM1 and BM2 was stronger than that of the non-air-entrained concretes. Compared to BM3 and BM4, the mix designs mainly differed in the air content and, for BM2, additionally in an increased paste volume. As for the non-air-entrained concretes, the different aggregate types did not result in a different segregation sensitivity, which might, to a certain degree, have been interfered with by the different paste content.
The highest segregation sensitivity results were for BM5. Compared to concrete BM3 and BM1 with the same aggregate type, it could be observed that air-entrainment led to a more sensitive behaviour, and an additionally increased paste volume further increased the sensitivity. This was in line with the results from the literature [2,13].
The potential of the segregation index depended on the amount of paste (i.e., mortar), which was not necessary to fill the space between the coarse aggregate: the more mortar and paste, the higher the potential segregation index. Using the example of BM5, it could be observed that, after 60 s of vibrating, almost no coarse aggregates were present in the upper segment. Thus, the segregation index was ≥90% and could not increase any further, causing the index to stagnate and thus decreasing the slope of the regression line at maximum segregation. Consequently, a linear correlation between the vibration time and the segregation index was no longer possible. Therefore, in the case of complete segregation, as in BM5, as soon as almost 100% was reached, the remaining points were not considered for the determination of the regression function.
Generally, a linear correlation is assumed to be representative of the speed of coarse aggregate segregation of vibrated concrete. A deviation from a linear correlation might indicate that a settlement of the coarse aggregates has taken place, or, as for BM5, due to very strong segregation, no evaluation with this test method was possible for high compaction times. Further research is required to address this open question and, among other things, explore the non-linear model approach.

4.3. Density Method

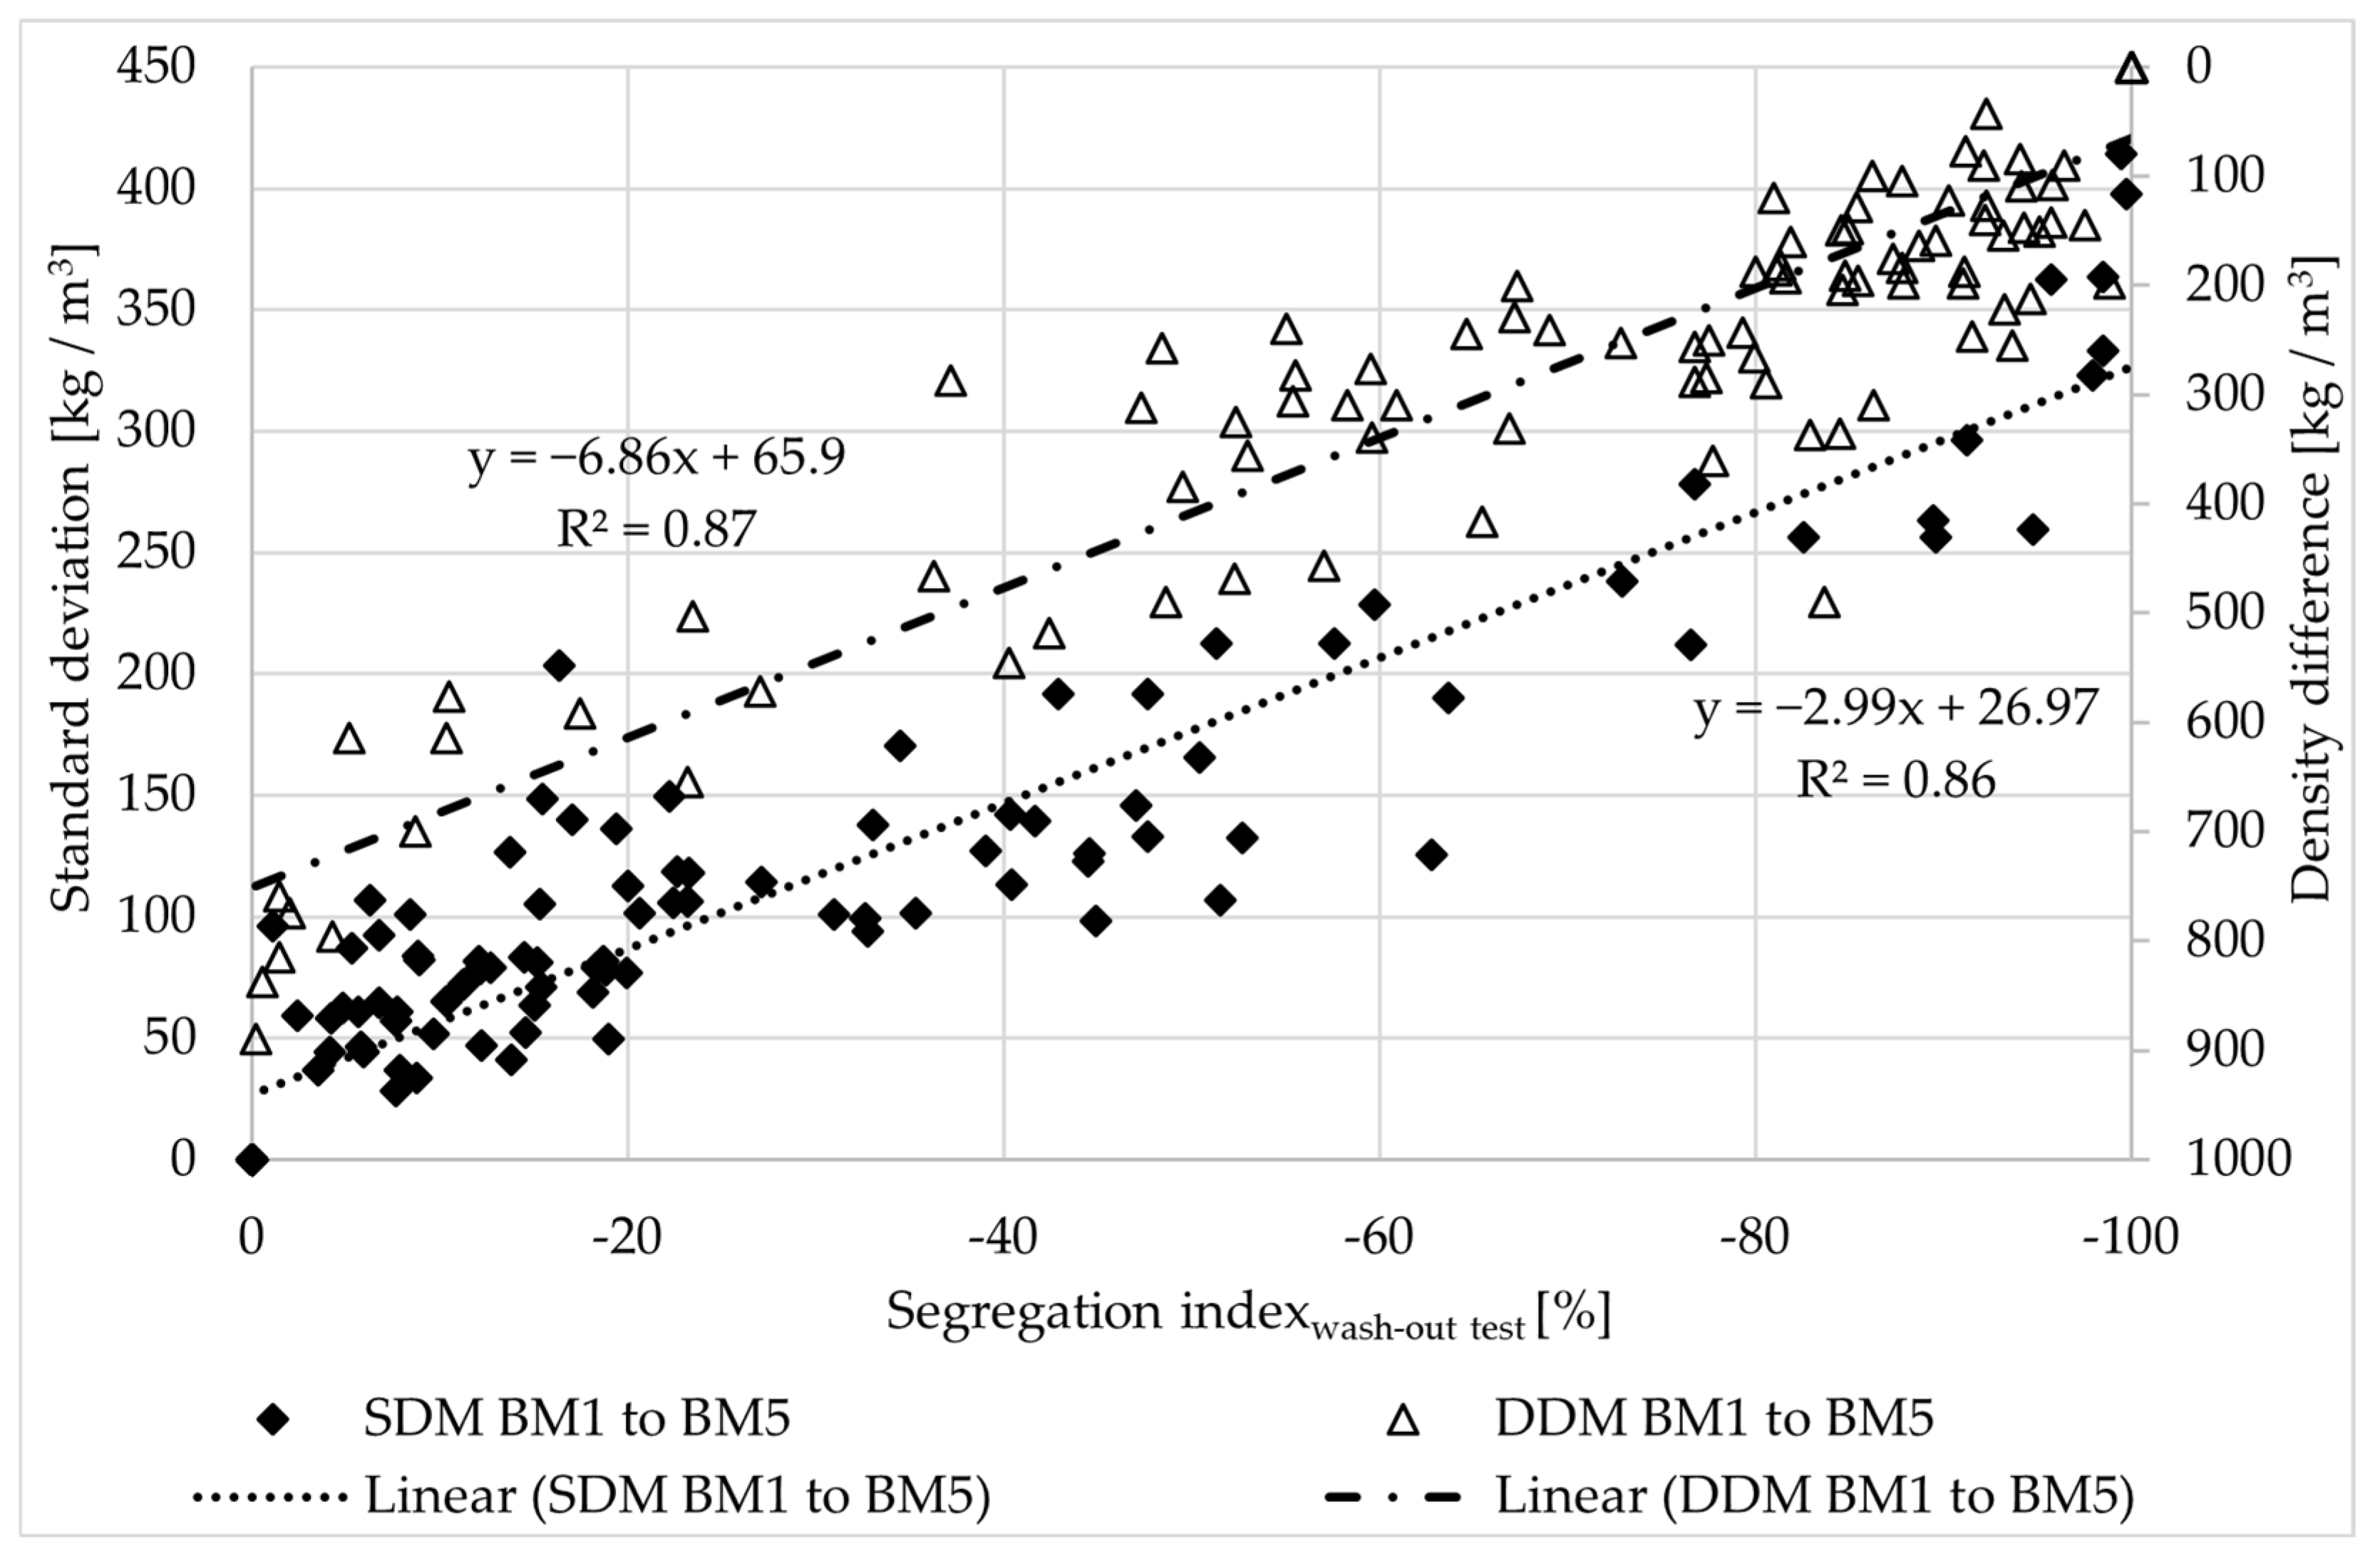
4.3.1. Standard Deviation Method (SDM)

BM5 was categorised as the most segregation-sensitive, while BM4 was identified as the least segregation-sensitive concrete (Figure 4).
The slopes of the regression functions of BM1, BM2, and BM3 were in a comparable range. The observed ranges of standard deviation were much higher than those observed in ref. [19]. Due to the little availability of data on typical ranges, the causes of these differences remain unclear. Different vibrating regimes, mix designs, and fresh concrete properties might have an influence, alongside differences in the density determination of fresh and hardened concrete. Further investigations can help explain the above observation.

4.3.2. Density Difference Method (DDM)

The DDM (Figure 5) reached the same observations as the SDM. This is comprehensible as this method just represents a simpler parameter with a higher practical relevance to practical application on site.
A closer look at the values of the SDM and DDM indicated that, with continuing compaction time, an asymptotic trend of segregation occurred. The cause for this observation could be assumed to be a settlement of the aggregate skeleton. The spaces between the coarse aggregates were filled with paste. During vibration, dense packing of the coarse aggregates led to the increase in the paste, whereas the coarse aggregates relocated to the bottom.
The coefficient of determination R2 seemed to serve as an indicator for undisturbed segregation of the coarse aggregate (R2 close to 1.0). After a specific concrete compaction time, the segregation index seemed to asymptotically converge to a concrete specific threshold value. The correlation was no longer linear, indicating that segregation might have been hindered due to blocking as dense packing was about to be reached. As indicated in Section 4.2, these effects require further investigations, as this might result in a more precise test evaluation.

4.4. Correlation of All Methods

To investigate correlations between the experimental results presented in Chapters 4.2 and 4.3, Figure 6 illustrates the results of the wash-out test and the standard deviation (SDM), as well as the density difference (DDM).
A discernible linear relationship was evident in both SDM and DDM measurement results (Figure 6), as well as in the slope of the linear regression functions (Figure 7), with the associated segregation index of the wash-out test. Therefore, it could be assumed that the values of the density methods correlated and were comparable with those of the wash-out test.
Figure 6 and Figure 7 illustrate the density methods, providing comparable and practically useful values due to the linear relationship between the results of the different methods. However, further studies are required to validate these findings.

4.5. Test Result Scatter

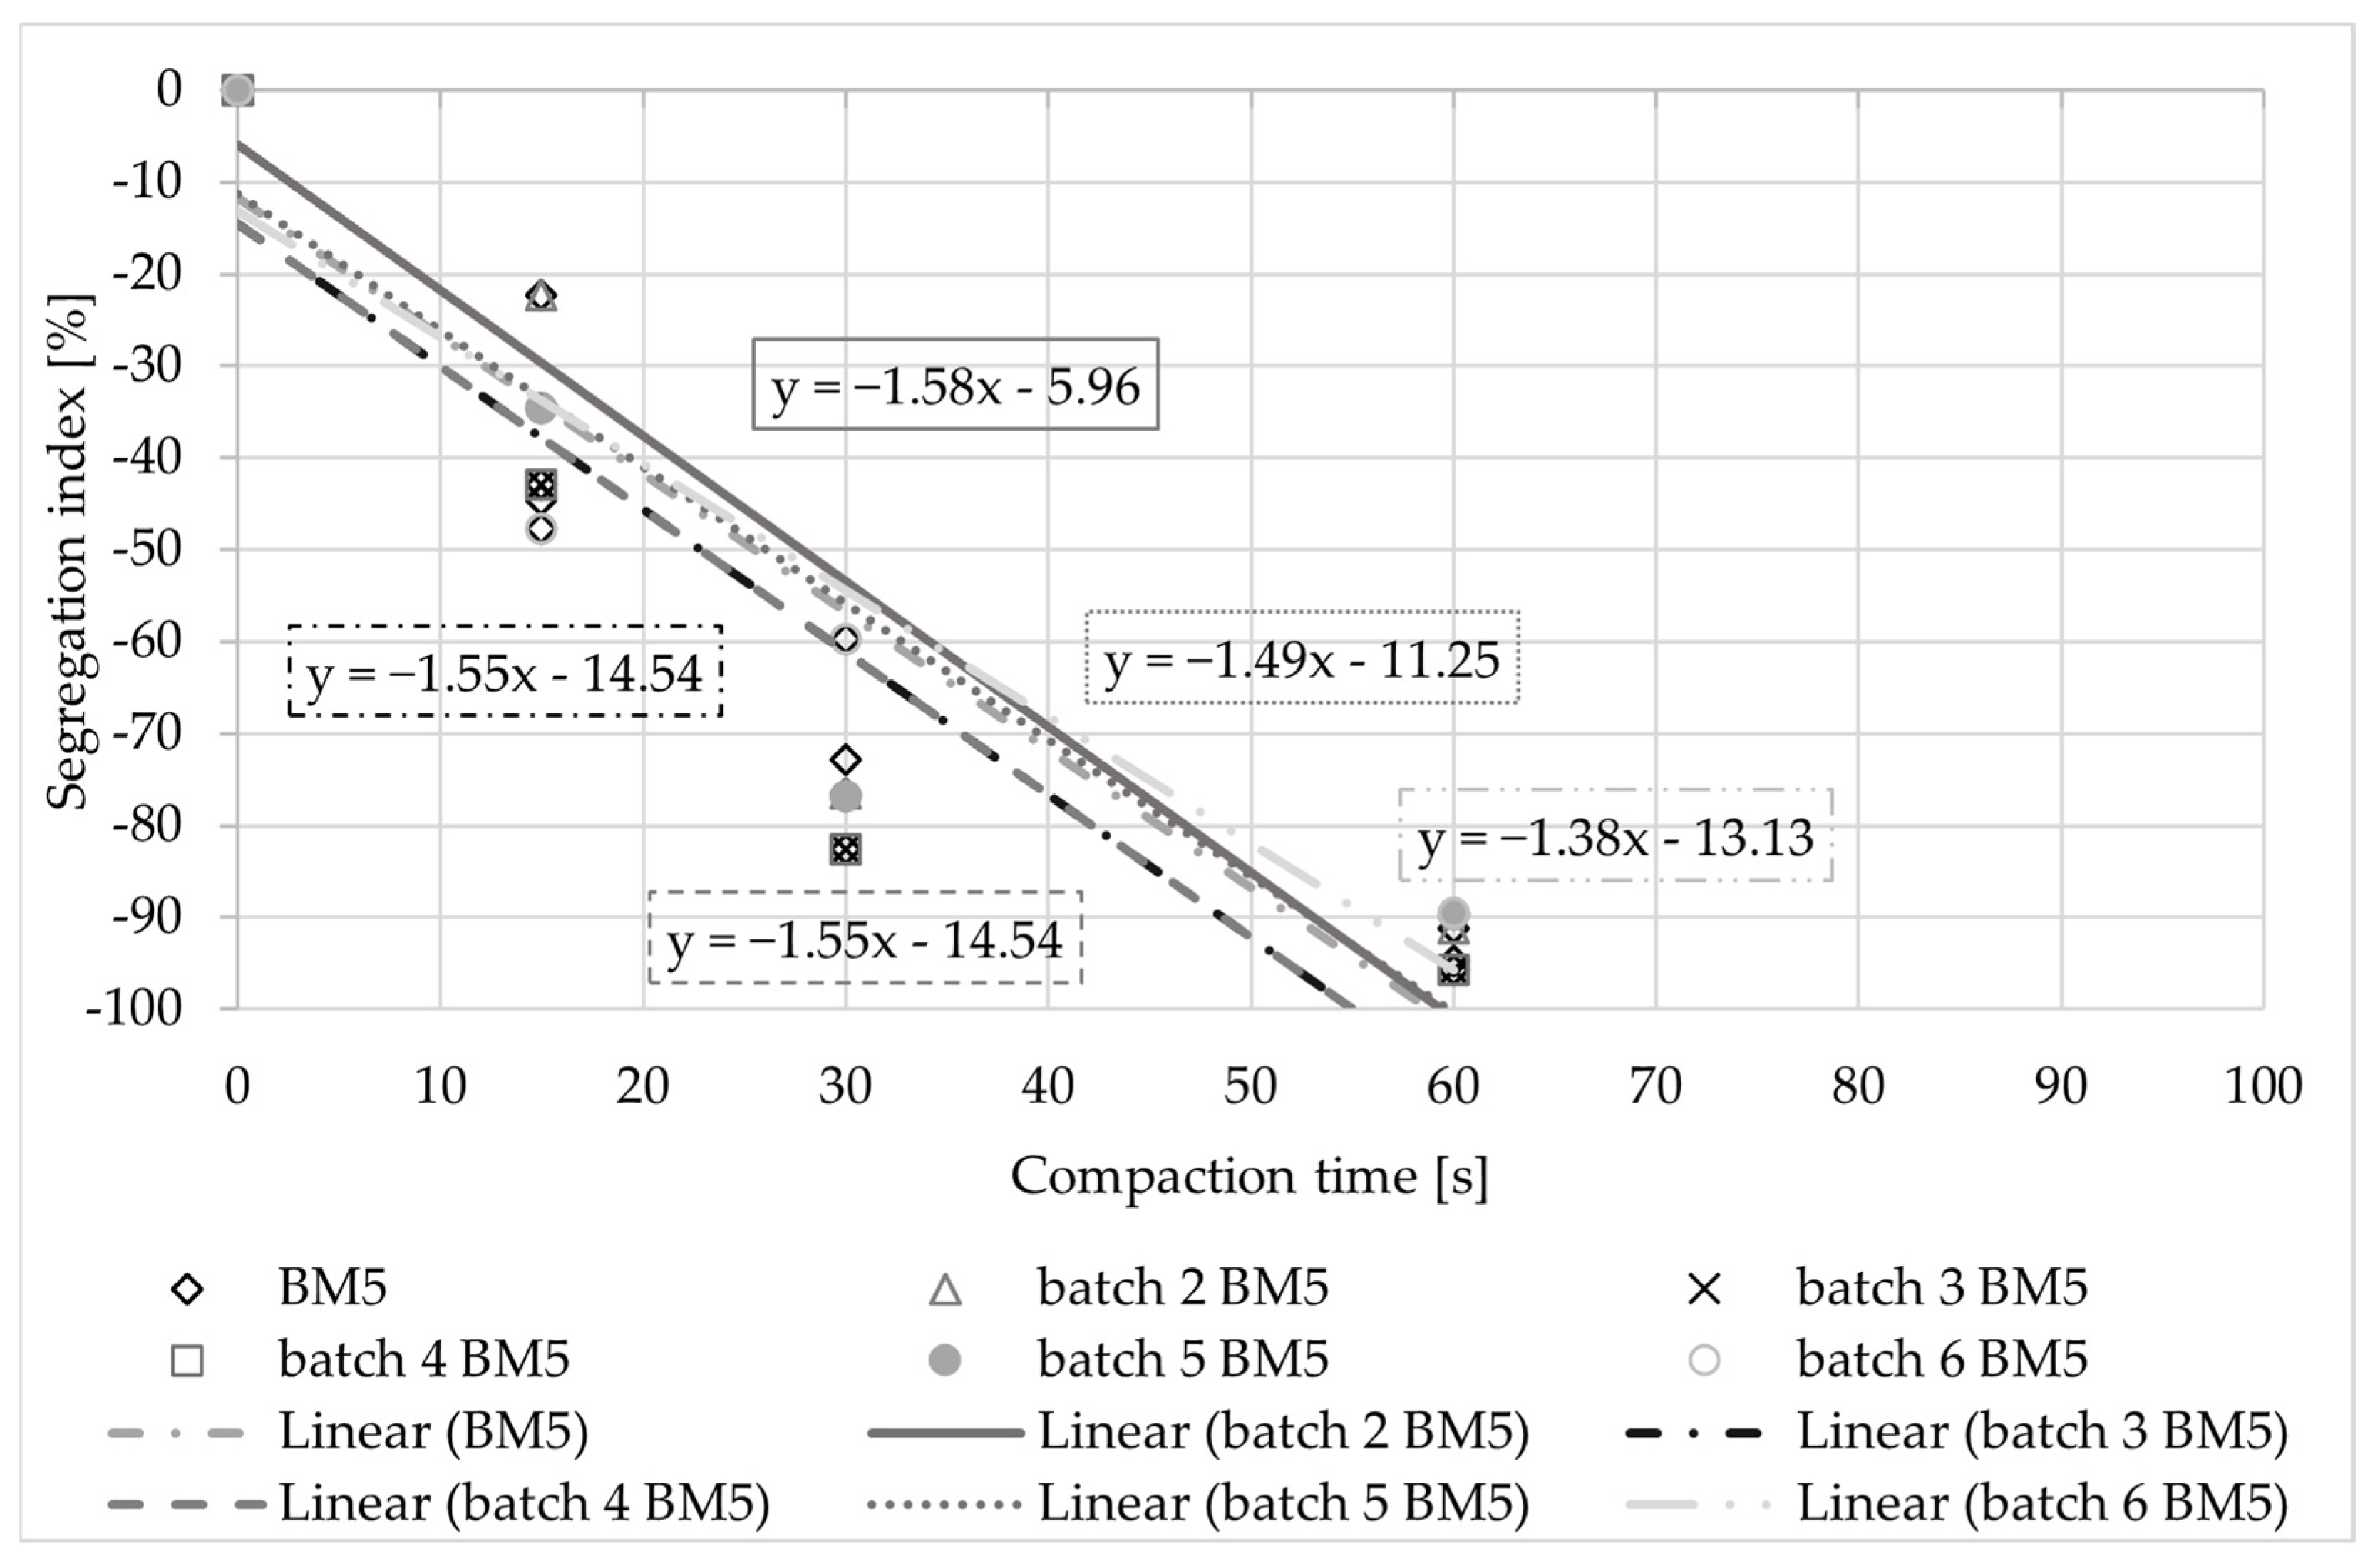
4.5.1. Regression Function

The coefficient of determination R2 is a measure of the deviation of the measurement results from the regression function. For the wash-out test (Figure 3), R2 varied between about 0.65 and 0.90. Lower values of about 0.65 were observed for both concretes with low segregation over time (BM3, BM4), whereas for concrete with a clear segregation tendency over time, high values of about 0.9 were observed. The results of the SDM (Figure 4) and the DDM (Figure 5) also showed the lowest coefficients of determination for concrete BM3 and BM4, especially for BM3, at an even lower level of about 0.4. Both concretes also revealed low segregation tendencies if evaluated by density. While concrete BM1 and BM5 revealed comparable coefficients of determination, as in the wash-out test, the coefficient of BM2 declined. The results indicated that both the absolute level of segregation and a possible settlement of the coarse aggregates during segregation have an influence that needs to be investigated further.

4.5.2. Segregation Index at a Certain Compaction Time

A different way of evaluating the test results is the segregation index at a certain compaction time. The results of the coefficient of variation (CoV) are presented in Figure 8.
The range of the CoV was high, indicating that evaluation at a single compaction time required a very close look. The alleged decrease in the wash-out test only resulted from two data points at 15 s; thus, no clear dependency on the compaction time could be observed.
Whilst the test result scatter from the wash-out test correlated to the compaction time, the SDM and DMM results scattered similarly, independently of the compaction time. During compaction, the aggregates were substituted by cement paste, which itself also exhibited variability. The density, in turn, impacted the composition of the cement paste. It is essential to acknowledge that the composition of the cement pastes underwent variation and was not entirely homogeneous. Consequently, the anticipated increase in scatter was expected.

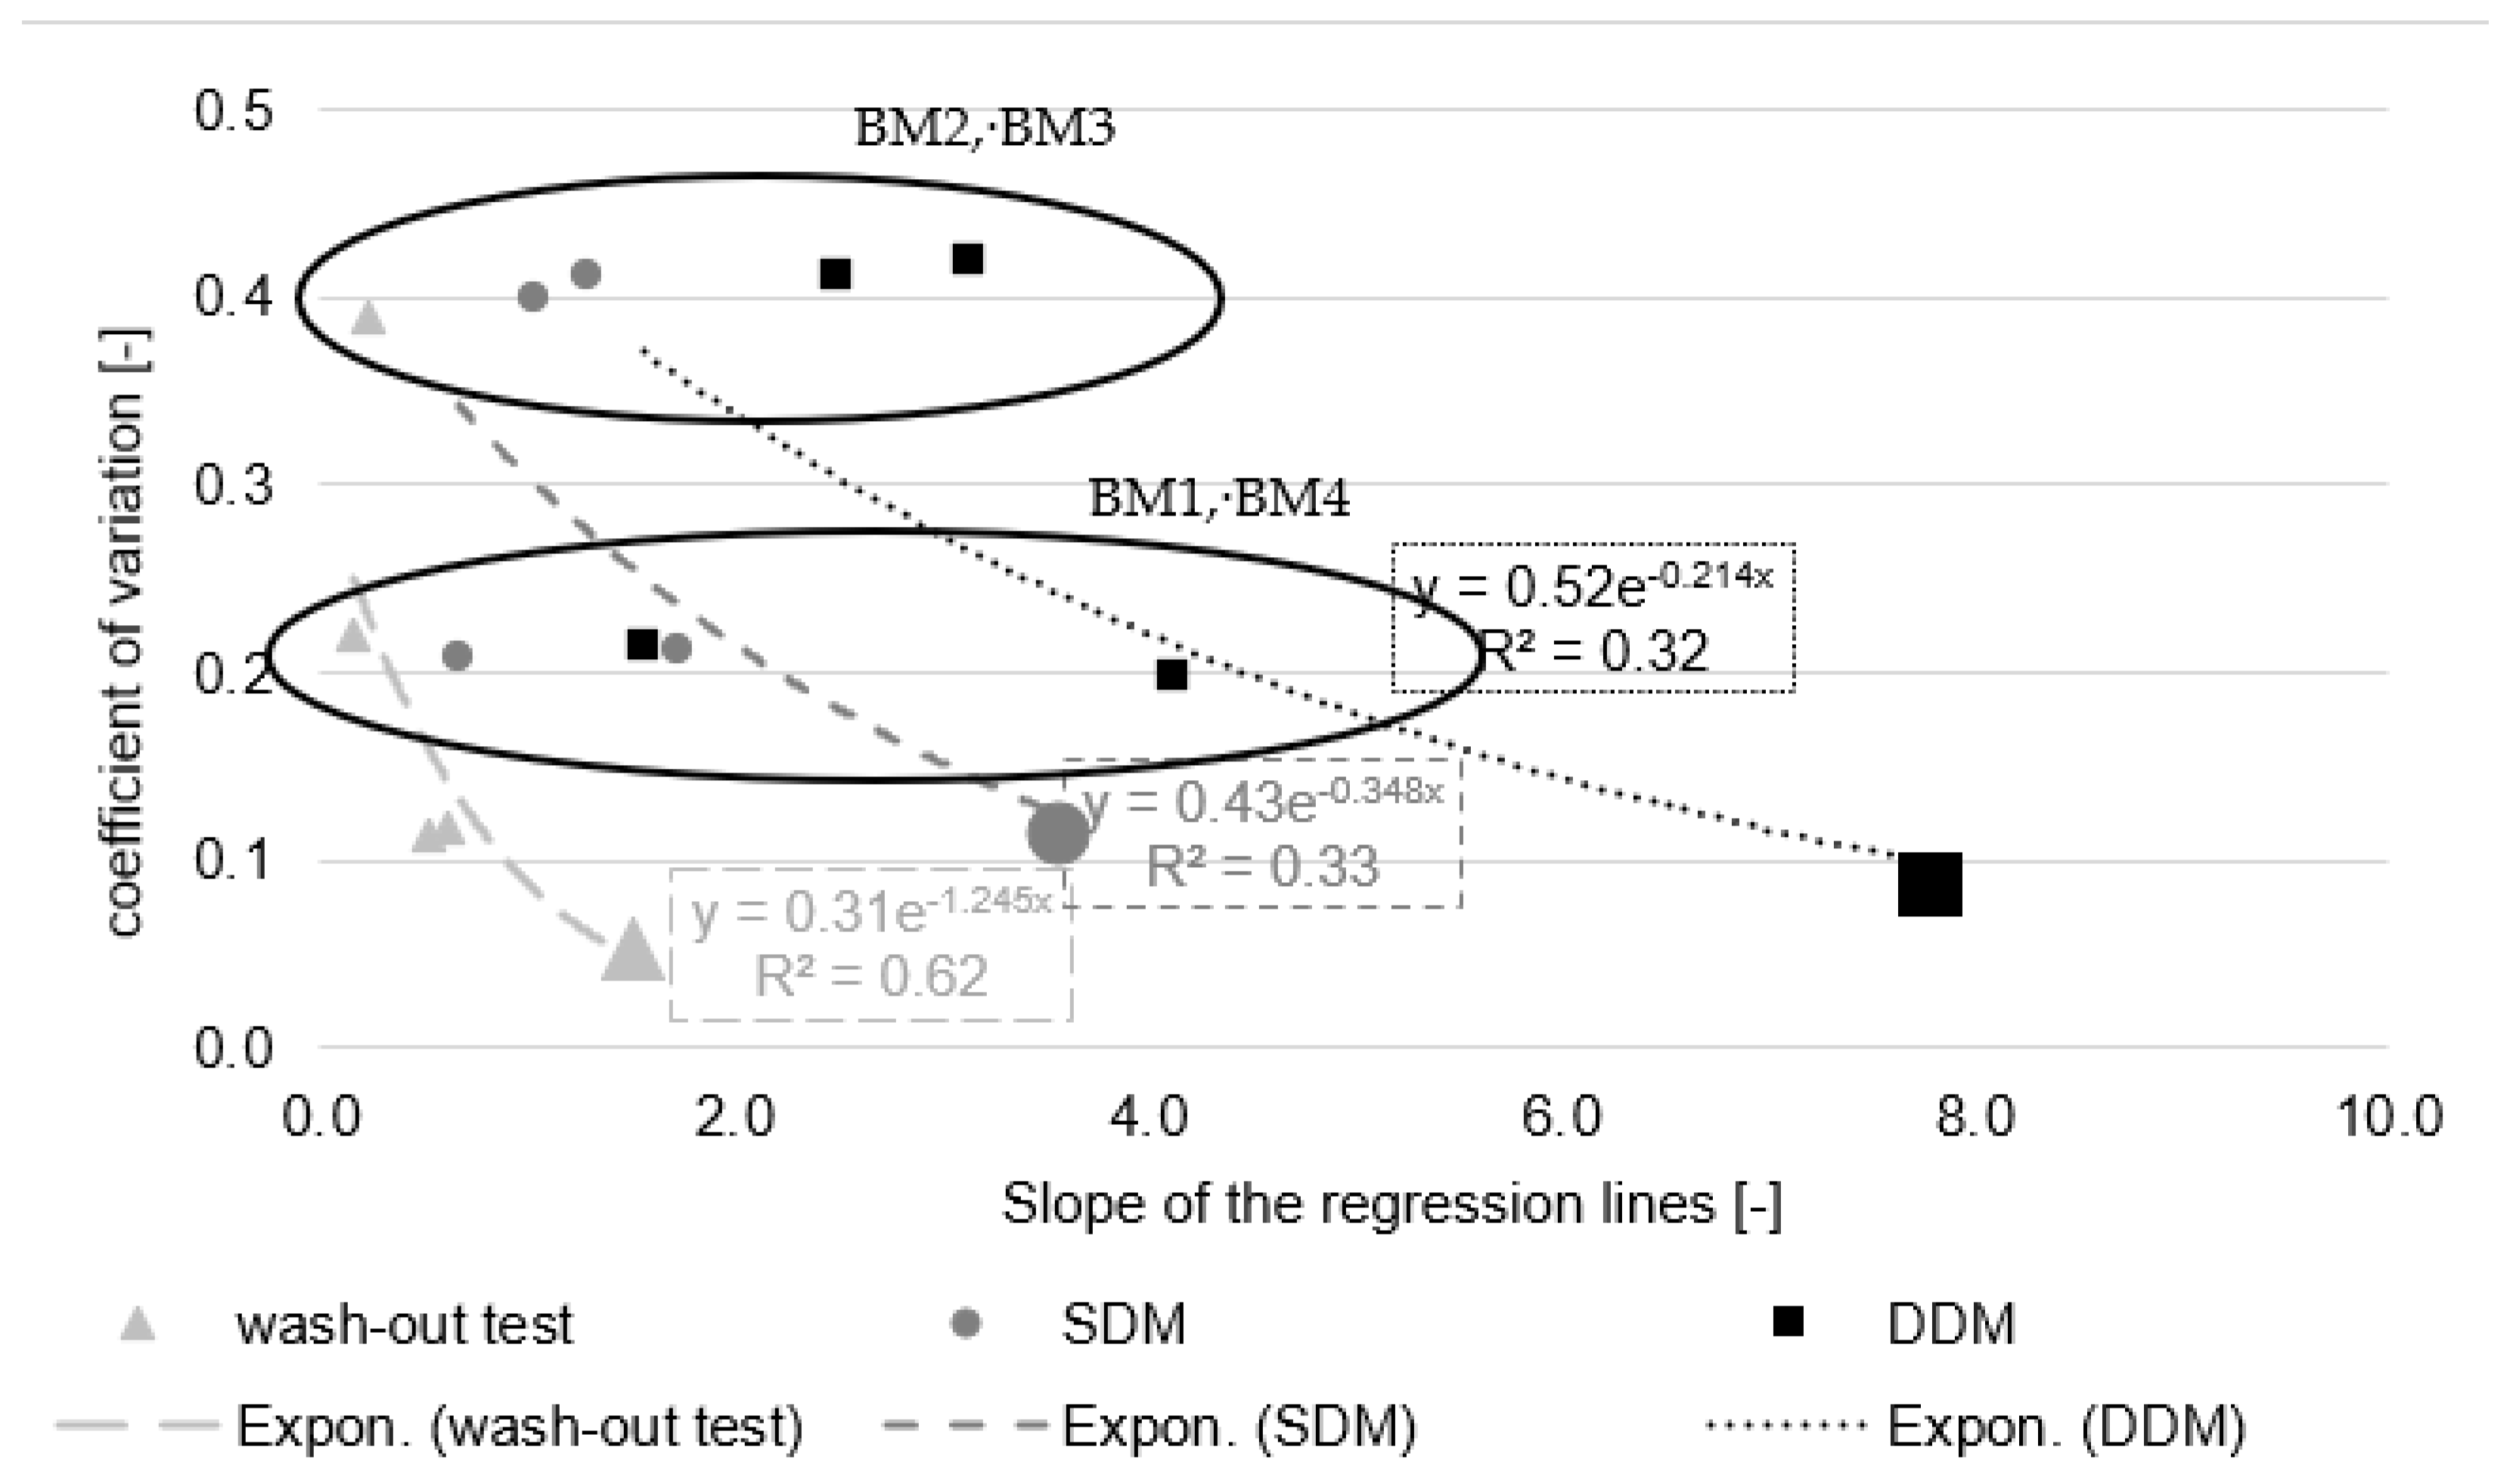
4.5.3. Slope of Regression Function

For the evaluation of the segregation sensitivity, the performance of the concrete at different compaction times is decisive. The scatter at a single compaction time is of minor relevance as long as it does not have a relevant influence on the slope of the regression function. The slope of the regression function defines the segregation sensitivity. The scatter of the slope of the regression function is thus of major interest. Figure 9 presents the determination of the CoV using the example of BM5 of the wash-out test. The exact data on the slope of the individual regression lines, mean value, standard deviation, and CoV are given in Appendix A. Figure 10 overviews the results of the wash-out test, SDM, and DDM of all concretes.
Figure 10 shows that the CoV varied between 0.1 and 0.4. The lowest CoVs were observed for BM5. For the air-entrained concretes BM1, BM2, and BM5, the wash-out test gave lower CoVs than the density methods. This difference did not occur for the non-air-entrained concretes BM3 and BM4. Figure 11 shows a rough correlation of the CoV with the slope of the regression function. Concrete with a higher slope, i.e., a higher segregation sensitivity, revealed a lower CoV. Further research is needed to confirm this correlation.

4.6. Comparison of the Evaluation of the Concretes with the Three Methods

There is currently no clear classification system to evaluate segregation sensitivity. Table 3 provides a rough classification for the wash-out test based on the suggested system in Figure 1. Based on Figure 4 and Figure 5, a visual classification of the investigated concretes into three groups seems adequate. This classification is comparable to that of the wash-out test, except for BM3. Further data are needed to support the suggested way of evaluation.

4.7. Practicability of the Three Methods

In terms of practicability, SDM and DDM are more straightforward implementations compared to the previously established wash-out test. They are simpler and require less effort. As a result, these methods are likely to be more widely accepted by those involved in the construction process, with DDM being particularly notable for its ease of interpretation.
An examination of the test result scatter of the slope of the regression lines of the wash-out test revealed a decrease in the scatter with increasing segregation (Figure 11). A similar trend was observed for the test result scatter of the SDM and DDM (Figure 11). This indicated that the scatter of the test results decreased for those concretes that showed significant segregation tendencies. Consequently, the segregation tendency of concrete could also be readily identified using both SDM and DDM (Table 3). It is noteworthy that all the methods—the wash-out test, the SDM, and the DDM—ranked the concrete in the same order, thereby underscoring their consistency in characterising concrete’s behaviour.
In addition to the conventional wash-out test, density distribution seems to be suitable to assess the segregation sensitivity of concrete, thereby aiding in its proper handling on construction sites. The notable advantage of SDM and DDM, in particular, is the simplicity of the procedure, which allows for a rapid assessment of the segregation sensitivity of concrete. This streamlined approach increases efficiency in the evaluation and management of concrete’s properties.

5. Conclusions

The “BAW Code of practice MESB” requires complex and time-consuming tests to determine the segregation sensitivity of vibrated concrete, with issues regarding clarity and consistency of the test results. The tests are optional and not mandatory in construction sites. At the Aalto University, concrete density distribution is used to assess segregation. This approach has the potential to significantly improve the practicality of fresh concrete testing according to “BAW Code of practice MESB”. As segregation might affect concrete properties such as strength and durability, a practical test procedure is needed, and research is ongoing.
Tests on five concretes (BM1 to BM5) demonstrated that two adapted procedures for fresh concrete, the standard deviation method (SDM) and the density difference method (DDM), yielded results comparable to the established wash-out test. All methods identified the different segregation sensitivities of the concretes tested similarly. The scatter of the linear regression slopes of the wash-out test decreased with an increasing segregation index, similarly to the scatter of the regression slopes of SDM and DDM. Clear assessments for SDM and DDM regression slopes are possible for highly stable and unstable concretes. DDM, due to its simplicity, is practical and provides comparable results to the wash-out test. Density results generally enable the establishment of a reference to DIN 1045.
SDM and DDM represent practical and simplified approaches for testing the segregation sensitivity of fresh concrete. Nevertheless, this evaluation methodology requires further consideration.

Supplementary Materials

The following supporting information can be downloaded at: https://www.mdpi.com/article/10.3390/constrmater5020022/s1.

Author Contributions

Conceptualisation, D.A.S. and F.S.; methodology, M.D., D.A.S., F.S., H.A. and J.P.; validation, M.D. and F.S.; formal analysis, M.D., D.A.S. and F.S.; investigation, M.D.; resources, F.S.; writing—original draft preparation, M.D. and F.S.; writing—review and editing, D.A.S., F.D., H.A. and J.P.; visualisation, M.D.; supervision, D.A.S., F.D. and F.S.; and project administration, F.S. All authors have read and agreed to the published version of the manuscript.

Funding

This research received no external funding.

Informed Consent Statement

Informed consent was obtained from all the subjects involved in this study.

Data Availability Statement

The original contributions presented in the study are included in the article/Supplementary Material, further inquiries can be directed to the corresponding author/s.

Conflicts of Interest

The authors declare no conflicts of interest.

Appendix A

Table A1. Slope of the wash-out test.
Wash-Out Test
Slope BM1BM2BM3BM4BM5
Batch 2−0.57−0.44−0.16−0.16−1.58
Batch 3−0.56−0.58−0.26−0.16−1.55
Batch 4−0.54−0.55−0.13−0.21−1.55
Batch 5−0.65−0.55−0.35−0.15−1.49
Batch 6−0.71-−0.3−0.12−1.38
Mean Value−0.61−0.53−0.24−0.16−1.51
Standard Deviation0.0720.0620.0930.0320.080
Coefficient of Variation0.120.120.390.200.05
Table A2. Slope of the SDM.
SDM
SlopeBM1BM2BM3BM4BM5
Batch 22.222.031.360.733.39
Batch 31.230.961.280.763.94
Batch 41.561.350.340.773.69
Batch 51.790.851.190.602.92
Batch 61.87-0.970.453.82
Mean Value1.741.301.030.663.55
Standard Deviation0.370.530.410.140.41
Coefficient of Variation0.210.410.400.210.11
Table A3. Slope of the DDM.
DDM
Slope BM1BM2BM3BM4BM5
Batch 25.054.973.271.567.71
Batch 32.912.333.361.818.77
Batch 43.833.250.811.968.04
Batch 54.212.042.651.427.00
Batch 64.59-2.381.107.40
Mean Value4.123.142.491.577.78
Standard Deviation0.811.321.030.340.67
Coefficient of Variation0.200.420.410.210.09

References

  1. Ojala, T.; Ahmed, H.; Vehmas, T.; Chen, Y.; Tauqir, A.; Oey, T.; Al-Neshawy, F.; Leivo, M.; Punkki, J. ‘Factors of Compactibility and Risk of Segregation for Concrete’, Science + Technology, Helsinki, Finland, May 2021. Available online: https://aaltodoc.aalto.fi/items/06bb53ef-fe67-4b4a-959a-587d44e1f6dd (accessed on 1 April 2025).
  2. Navarrete, I.; Lopez, M. Understanding the relationship between the segregation of concrete and coarse aggregate density and size. Constr. Build. Mater. 2017, 149, 741–748. [Google Scholar] [CrossRef]
  3. Alfes, C.; Assbrock, O.; Begemann, C.; Breitenbücher, R.; Cokovik, A.; Cotardo, D. Sachstandbericht Frischbeton—Eigenschaften, Einflüsse und Prüfungen; Deutscher Ausschuss für Stahlbeton, Ed.; Beuth Verlag GmbH: Berlin, Germany; Vienna, Austria; Zürich, Switzerland, 2020; Heft 637; ISBN 978-3-410-65843-6. [Google Scholar]
  4. Ojala, T.; Al-Neshawy, F.; Punkki, J. Good Vibrations Project; Aalto University Scholl of Engineering: Espoo, Finland, 2019. [Google Scholar]
  5. Begemann, C.; Haist, M.; Lohaus, L. Prüfverfahren zur Bewertung der Mischungsstabilität von Beton unter Rütteleinwirkung; Institutionelles Repositorium der Leibniz Universität Hannover: Hannover, Germany, 2019. [Google Scholar] [CrossRef]
  6. Westendarp, A. Probleme mit Mischungsstabilität von Beton, Bundesanstalt für Wasserbau, Karlsruhe, BAWBrief, January 2015. Available online: https://hdl.handle.net/20.500.11970/100468 (accessed on 1 April 2025).
  7. Lohaus, L.; Begemann, C.; Breitenbücher, R.; Neumann, J. “Beurteilung der Sedimentationsstabilität von Frischbeton”. Gemeinsamer Abschlussbericht zur Phase 1 des Forschungsvorhabens; Leibniz Universität Hannover Institut für Baustoffe; Ruhr-Universität Bochum Lehrstuhl für Baustofftechnik. 2019. Available online: https://www.baustoff.uni-hannover.de/de/forschung/forschungsprojekte/forschungsprojekte-detailansicht/projects/beurteilung-der-sedimentationsstabilitaet-von-frischbeton-teil-1-sedimentationsversuch (accessed on 1 April 2025).
  8. Wagner, J.-P. Baustellenrelevante Betoneigenschaften—ein Weg zur Qualitätsverbesserung. In Tagungsbericht Ibausil; Finger-Institut für Baustoffe, Bauhaus-Universität: Weimar, Germany, 2018. [Google Scholar]
  9. Haist, M.; Breitenbücher, R.; Lohaus, L.; Moffat, J.; Vogel, C.; Neumann, J. Beurteilung der Sedimentationsstabilität von Frischbeton, Gemeinsamer Abschlussbericht zur Phase 2 des Forschungsvorhaben; Leibniz Universität Hannover Institut für Baustoffe; Ruhr-Universität Bochum Lehrstuhl für Baustofftechnik. 2021. Available online: https://www.baustoff.uni-hannover.de/de/lohaus/forschungsprojekte/projects/beurteilung-der-sedimentationsstabilitaet-von-frischbeton-teil2-viskowaage (accessed on 1 April 2025).
  10. Spörel, F. Anwendung eines Prüfverfahrens zur Ermittlung der Sedimentationssensibilität von Rüttelbeton. In Tagungsbericht Ibausil; Finger-Institut für Baustoffe, Bauhaus-Universität: Weimar, Germany, 2018; Available online: https://henry.baw.de/server/api/core/bitstreams/00a203c9-ae47-4c8a-96b3-3f34c3faddfd/content (accessed on 12 December 2023).
  11. Bundesanstalt für Wasserbau. Entmischungssensibilität von Beton (MESB). In BAW-Merkblatt; Bundesanstalt für Wasserbau: Karlsruhe, Germany, 2019. [Google Scholar]
  12. DAfStb—Richtlinie: Selbstverdichtender Beton (SVB-Richtlinie); Deutscher Ausschuss für Stahlbeton (DAfStb): Berlin, Germany, 2003.
  13. Jakob, O. Sedimentationsstabilität von Rüttelbeton; Masterarbeit, Karlsruher Institut für Technologie: Karlsruhe, Germany, 2018. [Google Scholar]
  14. Lohaus, L.; Begemann, C.; Cotardo, D.; Schack, T. Mischungsstabilität und Robustheit fließfähiger Betone; Researchgate: Dresden, Germany, 2017; Available online: https://www.researchgate.net/publication/325896517_Mischungsstabilitat_und_Robustheit_fliessfahiger_Betone (accessed on 1 April 2025).
  15. Siebert, B. Besondere Verfahren zur Prüfung von Frischbeton (Special Test Methods for Fresh Concrete), Deutscher Beton- und Bautechnik-Verein E.V., Berlin, DBV-Merkblatt, January 2014. Available online: https://www.dinmedia.de/de/technische-regel/dbv-merkblatt-frischbetonpruefungen/203502883 (accessed on 1 April 2025).
  16. DIN EN ISO 3219-2:2021-08; Rheologie Teil 2: Allgemeine Grundlagen der Rotations- und Oszillationsrheometrie. Beuth Verlag GmbH: Berlin, Germany, 2021.
  17. Hoang, Q.G.; Kaci, A.; Kadri, E.-H.; Gallias, J.-L. A new methodology for characterizing segregation of cement grouts during rheological tests. Constr. Build. Mater. 2015, 96, 119–126. [Google Scholar] [CrossRef]
  18. Ojala, T.; Ahmed, H.; Kuusela, P.; Seppänen, A.; Punkki, J. Monitoring of concrete segregation using AC impedance spectroscopy. Constr. Build. Mater. 2023, 384, 131453. Available online: https://www.sciencedirect.com/science/article/pii/S0950061823011662 (accessed on 1 April 2025).
  19. Ahmed, H. Evaluation of Segregation in Hardened Concrete; Aalto University Scholl of Engineering: Espoo, Finland, 2022. [Google Scholar]
  20. DIN EN 12390-7:2021-01; Prüfung von Festbeton—Teil 7: Rohdichte von Festbeton. Beuth Verlag GmbH: Berlin, Germany, 2021.
  21. DIN 1045-2:2023-08; Tragwerke aus Beton, Stahlbeton und Spannbeton—Teil 2: Beton. Beuth Verlag GmbH: Berlin, Germany, 2023.
  22. DIN EN 197-1:2011-11; Zement Teil 1: Zusammensetzung, Anforderungen und Konformitätskriterien von Normalzement. Beuth Verlag GmbH: Berlin, Germany, 2011.
  23. DIN EN 12350-5:2019-09; Prüfung von Frischbeton—Teil 5: Ausbreitmaß; Deutsche Fassung EN 12350-5:2019-09. Beuth Verlag GmbH: Berlin, Germany, 2019.
  24. DIN EN 12350-7:2022-05; Prüfung von Frischbeton—Teil 7: Luftgehalt Druckverfahren; Deutsche Fassung EN 12350-7:2019 + AC:2022. Beuth Verlag GmbH: Berlin, Germany, 2022.
  25. DIN EN 12350-6:2019-09; Prüfung von Frischbeton—Teil 6: Frischbetonrohdichte; Deutsche Fassung EN 12350-6:2019. Beuth Verlag GmbH: Berlin, Germany, 2019.
Figure 1. Classification of the segregation measure based on the wash-out test [11].
Constrmater 05 00022 g001
Figure 2. Grading curve of basalt, granite, and A/B22.
Constrmater 05 00022 g002
Figure 3. Results of the wash-out test.
Constrmater 05 00022 g003
Figure 4. Results of the SDM.
Constrmater 05 00022 g004
Figure 5. Results of the DDM.
Constrmater 05 00022 g005
Figure 6. Correlation between the test results of the wash-out test, SDM, and DDM (fresh concrete).
Constrmater 05 00022 g006
Figure 7. Correlation between the slope of the linear regression functions of the test results of the wash-out test and the SDM, as well as the DDM (fresh concrete).
Constrmater 05 00022 g007
Figure 8. Coefficient of variation (CoV) of the measurement data (wash-out test, SDM, and DDM) depending on the compaction time.
Constrmater 05 00022 g008
Figure 9. Linear regression lines of all 5 batches of the wash-out test of BM5.
Constrmater 05 00022 g009
Figure 10. Coefficient of variation (CoV) of the slope of the linear regression function of the measurement data (wash-out test, SDM, and DDM).
Constrmater 05 00022 g010
Figure 11. Coefficient of variation (CoV) for the slope of the linear regression of the measurement data (wash-out test, SDM, and DDM) relative to the slope of the inclination.
Constrmater 05 00022 g011
Table 1. Concrete mix designs.
UnitBM1BM2BM3BM4BM5
CEM III/A 42.5 N[kg/m3]260320260270350
Fly ash[kg/m3]6770677068
Coarse aggregate[-]basalt granitebasaltgranitebasalt
Grading curve[-]A/B
Maximum aggregate size[mm]2222222222
Aggregate content[kg/m3]19971607208918821647
Water[kg/m3]149191149155207
Concrete density calculated[kg/m3]24492218256523782272
(w/c)eq.[-]0.520.550.520.520.55
Target air content[Vol.-%]55118
Paste content pc[L/m3]265328265275351
Paste content incl. air pc, air[L/m3]315378275285431
Paste density incl. air[kg/m3]15121537173217371404
Air-entraining admixture
based on root resin
[% of c.]0.130.110.000.000.80
SP type[-]PCEPCEPCEPCEPCE
SP dosage[% of c.]0.750.111.451.130.00
Table 2. Measured values of the fresh concrete properties.
UnitBM1BM2BM3BM4BM5
Measured air content (mean)[Vol.-%]6.84.01.81.84.1
Flow table test spread (mean)[mm]460500440480550
Density (mean)[kg/m3]23902270257023702410
Table 3. Ranking and classification of the concretes with the wash-out test vs. SDM and DDM.
Wash-Out TestStandard Deviation Method
(SDM)
Density Difference Method
(DDM)
Range According to Figure 1ConcreteClassificationRankingClassificationRanking
1BM4 and BM31BM41BM4
2BM1 and BM22BM1, BM2, and BM32BM1, BM2, and BM3
3BM53BM53BM5
Disclaimer/Publisher’s Note: The statements, opinions and data contained in all publications are solely those of the individual author(s) and contributor(s) and not of MDPI and/or the editor(s). MDPI and/or the editor(s) disclaim responsibility for any injury to people or property resulting from any ideas, methods, instructions or products referred to in the content.

