Abstract
Ground Penetrating Radar (GPR) is widely used for assessing the deterioration of concrete bridge decks. GPR surveys generate large amounts of data in the form of B-scan images, which display rebar traces as hyperbolas. Accurate analysis of the GPR scans relies on the effective extraction of rebar locations and amplitudes. This paper presents two automated rebar detection algorithms based on Convolutional Neural Network (CNN) machine learning techniques. Two models are proposed: CNN-1 and CNN-2. CNN-1 was trained on raw GPR images to identify hyperbolas, while CNN-2 model used both raw and migrated GPR images for enhanced analysis. The models were evaluated using GPR data collected from three bridges with different overlay types. Performance was assessed through the visual comparison of the generated bridge amplitude maps against ground-truth data, as well as precision, recall, and F1-score metrics. The results demonstrate that CNN-2 outperforms CNN-1 in terms of accuracy and efficiency for rebar detection.
1. Introduction
Bridge deck condition is essential to the mobility and safety of daily traffic on bridges. Steel rebars in concrete bridge decks are susceptible to corrosion and reduction in cross-section area due to the accumulation of deicing salt. Salt, moisture, and surface cracks create favorable conditions for corrosion. Ground Penetrating Radar (GPR), as a nondestructive testing (NDT) technology, has been widely used for assessing steel corrosion in concrete bridge decks [1,2]. The GPR system operates by emitting electromagnetic (EM) pulses from an antenna to the ground and receiving the reflected EM waves at rebars or an interface with different dielectric constants (permittivity) [3]. A series of GPR signals (A-scan) are collected at regular intervals to create a B-scan image. In a typical GPR B-scan, the vertical axis indicates arrival time and the horizontal axis usually indicates the scanning distance. In a typical GPR B-scan over a concrete bridge deck, reflections from steel rebars appear as hyperbolic patterns. The shape, depth, and amplitude of the hyperbolas are affected by the electrical properties of concrete and the condition of rebars. When chloride ions and water penetrate into concrete, its conductivity and permittivity increase [4]. Under such conditions, EM waves have high attenuation compared to in dry, intact concrete. Therefore, in GPR signal analysis, the first step is to identify rebar reflections, followed by extracting the position and amplitude of the hyperbolas, which are then used to assess the condition of concrete bridge decks. GPR surveys on concrete bridges generate large volumes of data, including thousands of hyperbolic rebar signatures. Manually analyzing these GPR images to extract information is a time-consuming process. Many studies have focused on the automatic recognition of rebars and other buried objects in GPR images, utilizing various methods such as pattern recognition [5,6], edge detection [7,8,9,10], Convolutional Neural Networks (CNNs) [11,12,13], and other machine learning techniques [14,15]. Although these studies showed promising results, their precision in complex field-scale bridge decks remains limited. Wang et al. evaluated a semi-automatic rebar detection method based on a genetic algorithm, which achieved an undetected rate of 11.98% and a misjudgment rate of 9.08% in noisy and complex environments [5]. Ma et al. developed a fully automatic algorithm to detect rebars in decommissioned reinforced concrete slabs, achieving an accuracy of 88%. However, the method struggled to handle blurred and overlapping hyperbolic features in GPR B-scans, which may limit its applicability in practice [6]. Faris et al. also highlighted the impact of hyperbolic shape blurriness and attenuation effects in deteriorated concrete environments, which reduce the effectiveness of both machine learning and template-based approaches [14].
To address the limitations of pattern- and edge-based methods, early deep-learning approaches applied single-channel CNNs directly to raw GPR B-scans. For example, Xiang et al. showed that an AlexNet-based CNN could achieve over 94% detection accuracy on sparsely reinforced specimens, but performance degraded on densely meshed slabs due to signal interference and limited pre-processing [16]. Subsequently, Park et al. applied YOLO-v3 to color-mapped and migrated B-scans for real-time diameter estimation, reporting a mean average precision of 93.9% on migrated data. Migration was specifically applied to address the challenge of overlapping signals from closely spaced rebars [12]. More recently, Li et al. embedded multi-hyperbolic attention mechanisms into a Faster R-CNN framework. These mechanisms selectively emphasize important features within the input data to improve pattern recognition. This approach achieved an average precision of 94.93% on tunnel lining datasets by improving the detection of rebar-related hyperbolic features in GPR images. These results demonstrate the effectiveness of specialized attention mechanisms for complex GPR data [17]. Despite these advances, existing methods rely on single-channel inputs, multi-path defect inversion, or customized attention mechanisms, yet none explicitly fuse raw and migrated data in a unified detection framework.
In this study, we propose a dual-channel CNN architecture that directly integrates raw and migrated B-scan inputs into a region-based detection pipeline, thus enhancing feature discrimination for robust rebar localization in field testing data and condition assessment. This research introduces a CNN-based dual channel framework for automated rebar detection in GPR data, specifically designed for concrete bridge deck inspections. By combining raw and migrated GPR B-scan images as input, the model leverages complementary information: one channel captures hyperbolic features while the other provides enhanced context through migration. This dual-channel design enables more reliable characterization of rebar signatures and reduces the risk of misclassification by allowing the network to suppress noise and artifacts not present in both channels. The framework is developed and validated on real-world bridge data, demonstrating improved detection accuracy, robustness, and efficiency compared to single-channel approaches, especially under challenging field conditions with noise, deterioration, or complex rebar arrangements. The proposed approach thus represents a practical advancement in automated, data-driven bridge deck assessment, supporting more effective infrastructure maintenance and management.
In this paper, GPR image pre-processing steps, including zero-time correction, background removal, and migration are presented in Section 2. In the third Section, we describe the methodology for extracting, labeling, and organizing GPR B-scans containing rebar reflections from various bridges for subsequent training and validation. We then introduce the construction of a dual-channel image dataset for training convolutional neural networks. In Section 4 and Section 5, a simple candidate selection algorithm is discussed and applied to B-scans collected from three bridges, followed by a detailed evaluation of automatic rebar identification performance. Our results demonstrate that the dual-channel CNN model significantly improves the accuracy and reliability of rebar detection in GPR images, even in the presence of significant noise and structural deterioration.
2. GPR Image Preprocessing
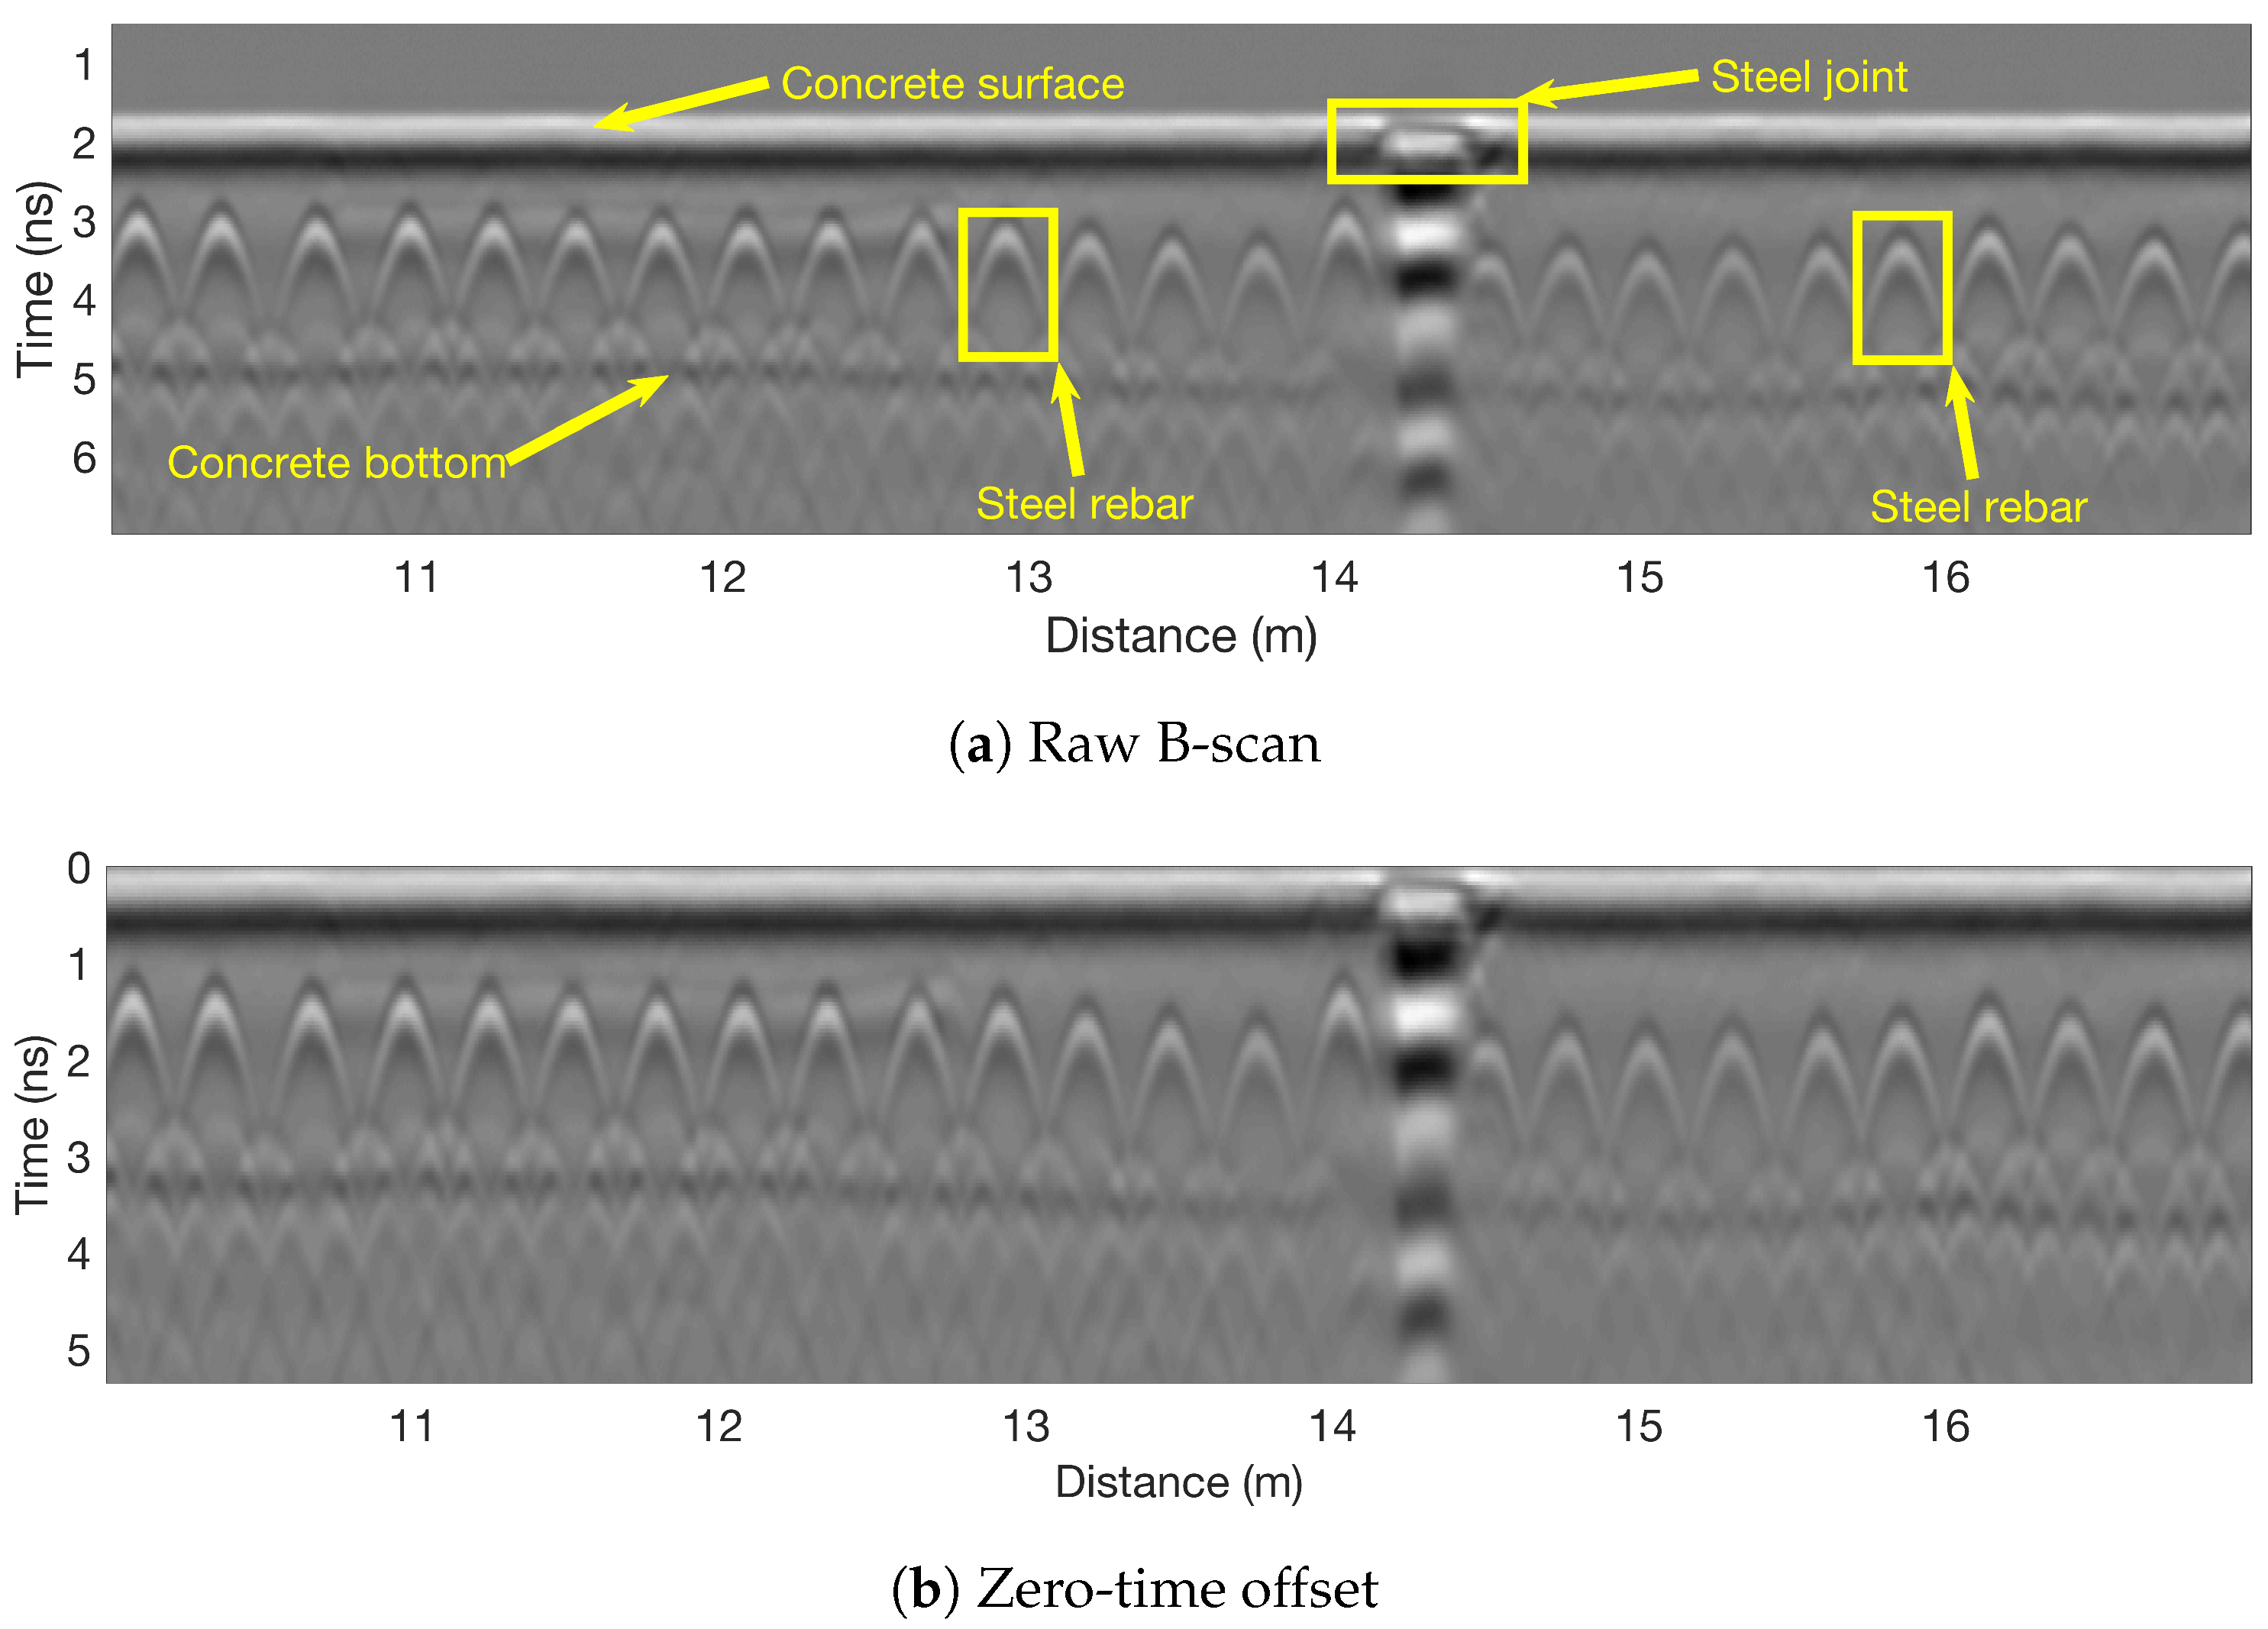
Before performing rebar recognition, raw GPR data should be pre-processed following the procedures recommended in the literature [3,18,19]. The pre-processing procedures will increase the visibility of rebar reflections, reduce the clutter, and shift the image to the correct position. These procedures include zero-time offset, background removal, and migration. We implement these procedures on a B-scan shown in Figure 1a, which was captured over a bare concrete bridge deck.
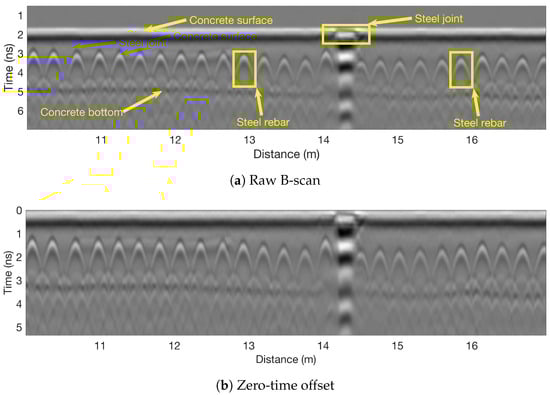
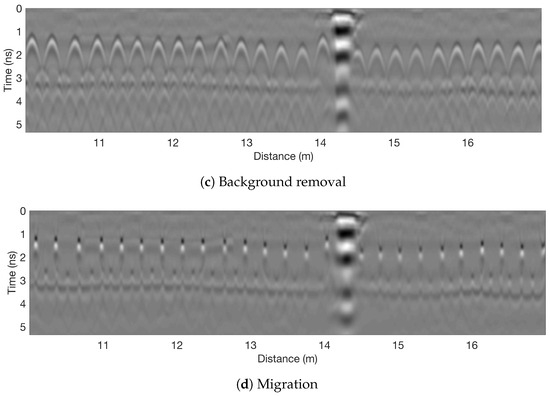
Figure 1.
Preprocessing of GPR data: (a) raw B-scan, (b) zero-time offset correction, (c) background removal, and (d) migration.
- Zero-time calibration: The ground-coupled antenna in a GPR system causes signal transmission delays and dielectric loading in the ground material, leading to a shift in the signal’s timing by a few nanoseconds. To accurately measure the wave velocity and depth of underground objects and perform migration, this time delay should be addressed. Time-zero offset is defined as the adjustment of time-domain GPR signals in which the first arrived reflection shifts to zero. According to references [3,20], we used 0.6 ns prior to the first negative peak of the received signal, and the rest of the signals are shifted accordingly. Figure 1b shows the B-scan after the zero-time offset.
- Background removal: In GPR images, the earliest arrivals correspond to direct waves from transmitter to receiver and reflected waves from the concrete surface. These strong reflections dim other features in the B-scan image, including rebar reflections. Since direct wave and surface reflection are repetitive along the scanning direction, a simple subtraction of the average of traces helps enhance the contrast of features and suppresses the effect of clutter. Figure 1c shows the GPR B-scan after background removal.
- Migration: Migration is a mathematical algorithm that focuses the hyperbolic signature of point scatterers to several image pixels. Among many migration algorithms, we used Stolt’s f-k migration because of its fast computation time [21]. Figure 1d shows the GPR B-scan after performing migration.
3. Rebar Detection Procedure
The rebar detection procedure consists of two main steps: (1) proposing regions of interest (RoIs) that potentially represent rebars, and (2) classifying RoIs into true and false categories using a classifier model. Many studies in the literature integrate these two steps within a single model framework. For example, the Region-Based Convolutional Neural Network (R-CNN) [22] uses a selective search algorithm [23] that generates many candidate regions. A greedy algorithm is used to combine similar regions for region proposals. A CNN model is then trained to extract features from these proposed regions and classify them based on the extracted features in the image. The existing detection methods, such as R-CNN with selective search, face limitations like sensitivity to region proposals, and difficulty handling noisy data. Selective search struggles to balance quality and quantity, leading to missed detections and false positives. To address these issues, this study incorporates migrated images as an additional feature channel, improving feature discrimination, reducing false positives, and enhancing localization accuracy. In this paper, we used migrated images as the additional features for region proposal and classification.
3.1. RoI Proposal
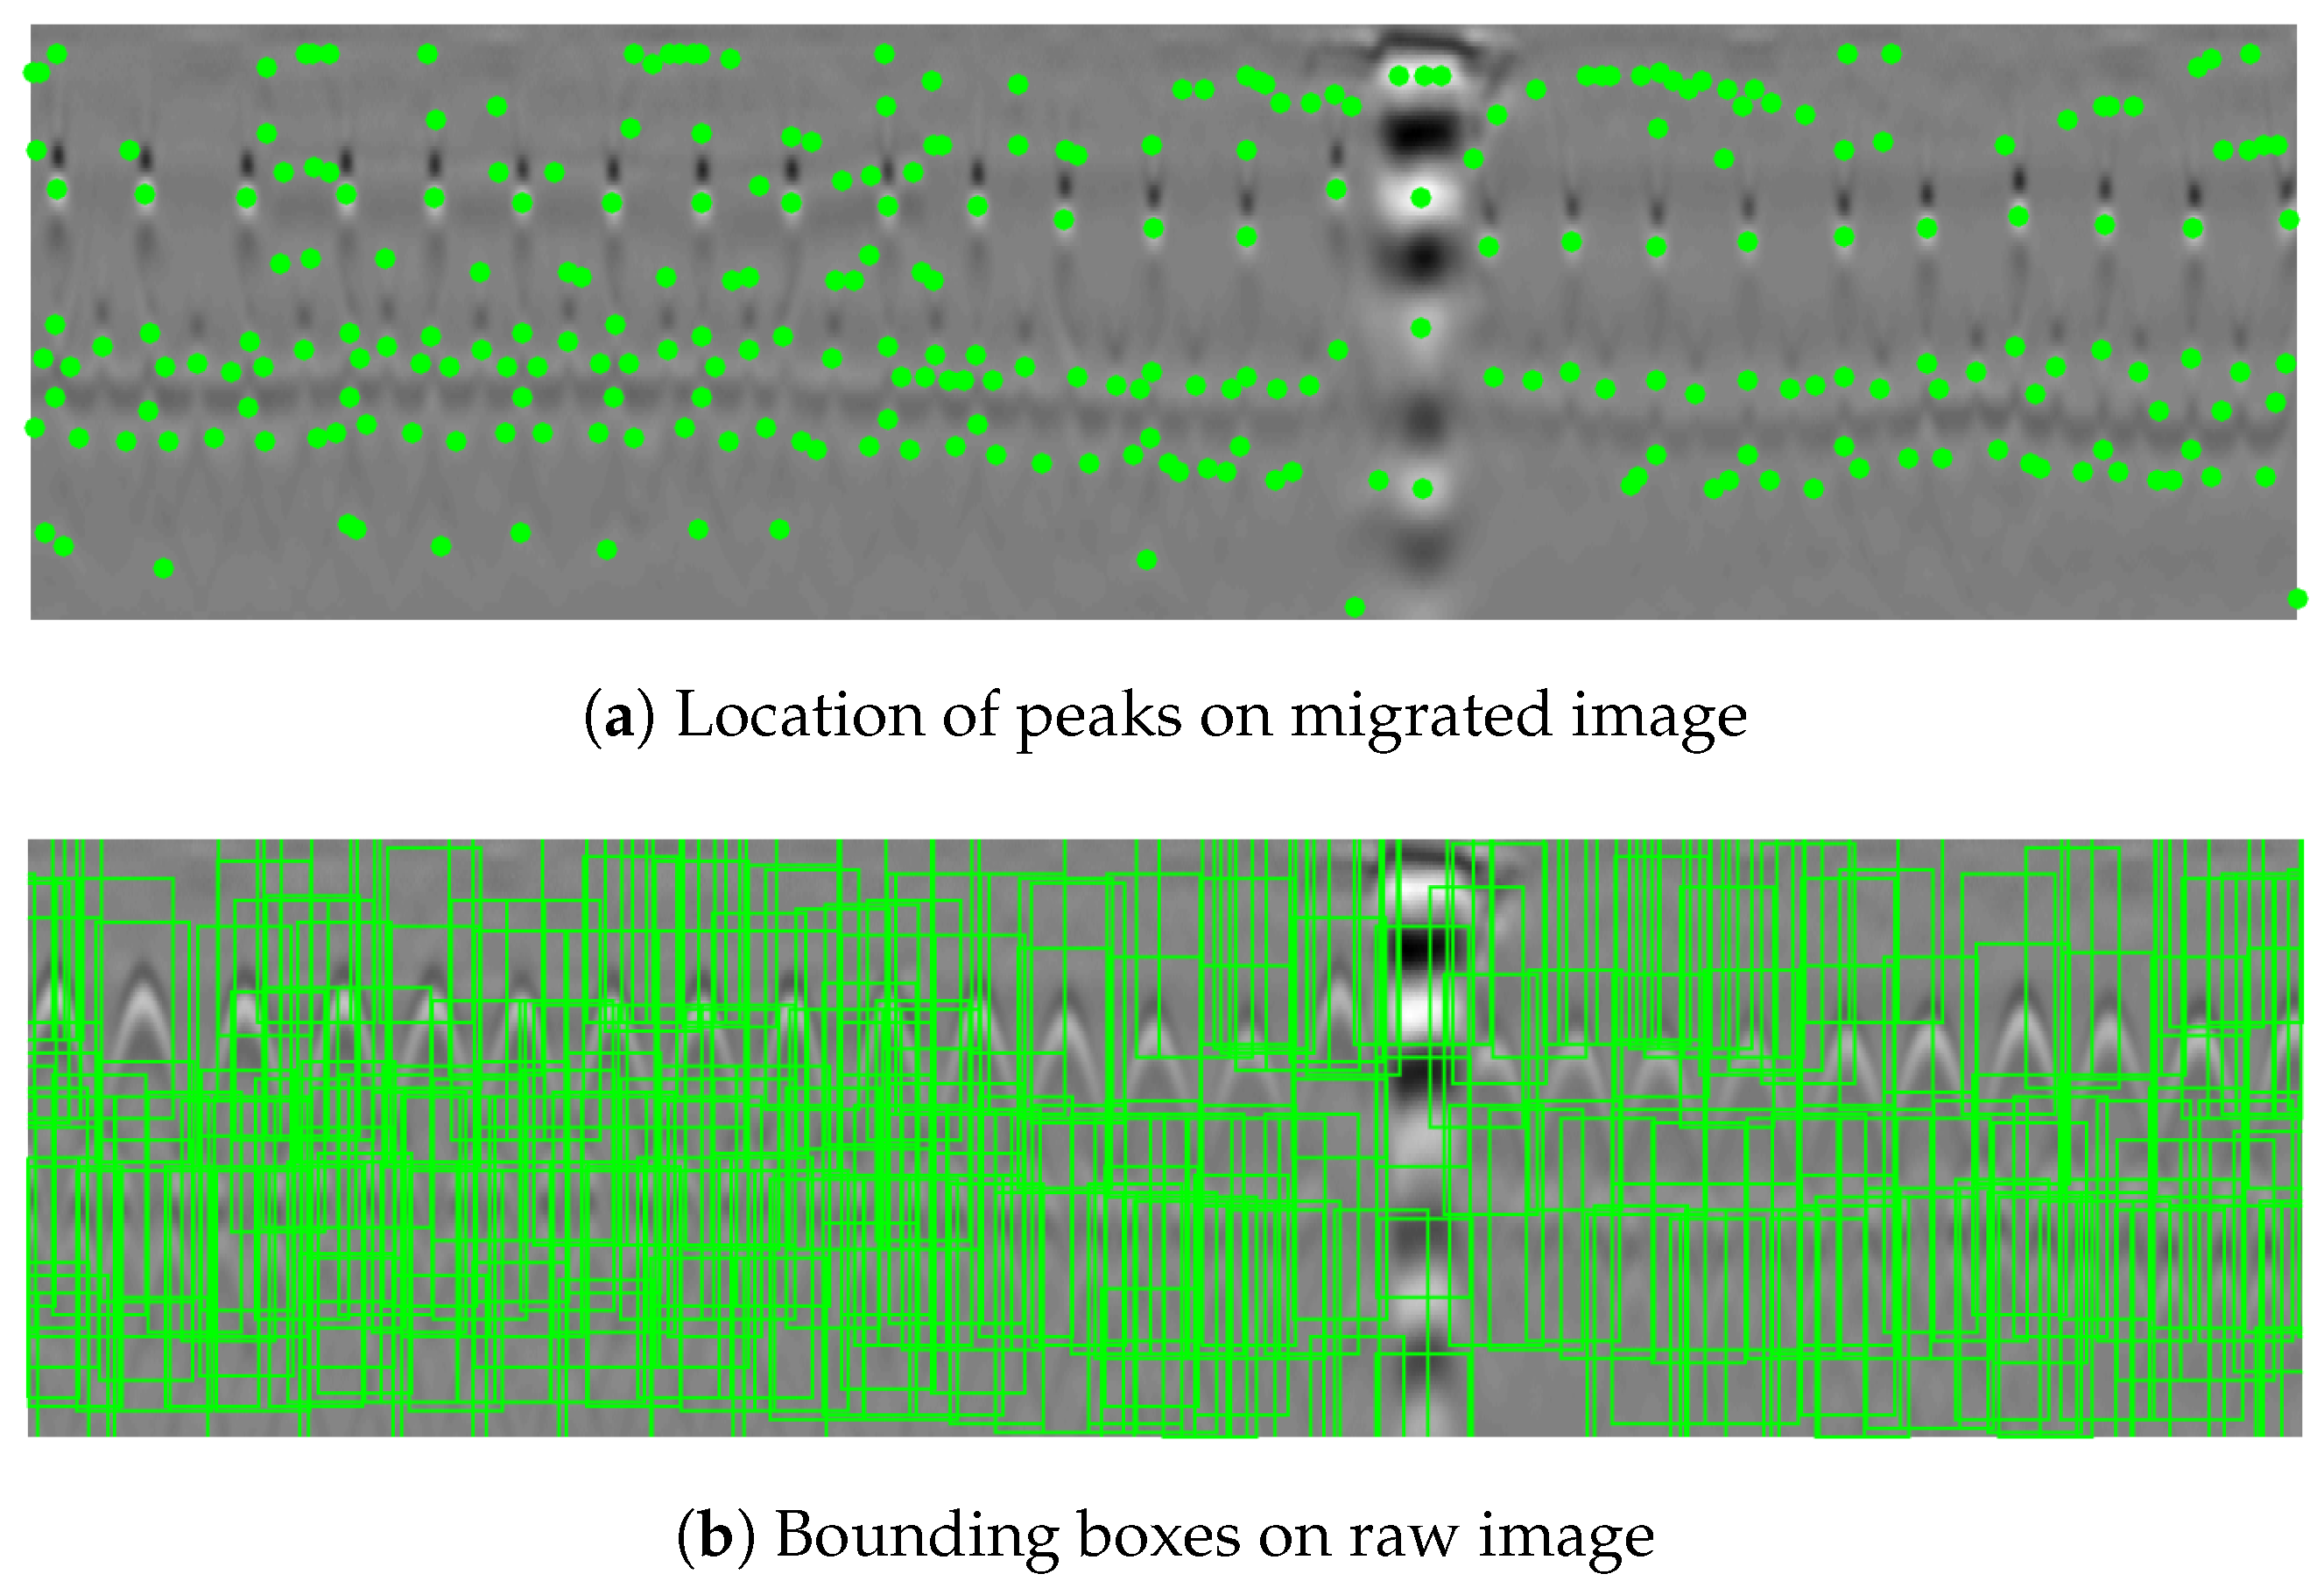
Rebar reflection in the migrated image is concentrated within a region of a few high-intensity pixels. These regions are local extreme points in the two-dimensional B-scan plane. Therefore, a maximum filter returns the location of peaks. To extract maximum points, peak_local_max function from scikit-image Python library was used with a minimum distance of 5 pixels and threshold of 3% of the maximum value in the image. Figure 2a shows the result of peak extraction from the GPR image on the migrated B-scan image. Then a bounding box was defined around every peak, and its content was extracted. The bounding box for a successful image proposal should include a significant portion of hyperbolas in the raw image. Thus dimensions of the proper bounding box may depend on the image resolution and cover thickness. Since all GPR images are interpolated to the same resolution to maintain a consistent scale, and the cover thickness remains relatively uniform across bridges, a fixed bounding box size can be applied. In this study, we used a bounding box of 20 cm (horizontal) × 1.8 ns (vertical) for all bridge data. Figure 2b shows the bounding boxes used for extracting RoIs in GPR images.
Figure 2.
RoIs that may represent rebars on a B-scan image: (a) peak detection on the migrated image and (b) bounding box proposal on the raw image.
3.2. Convolutional Neural Network
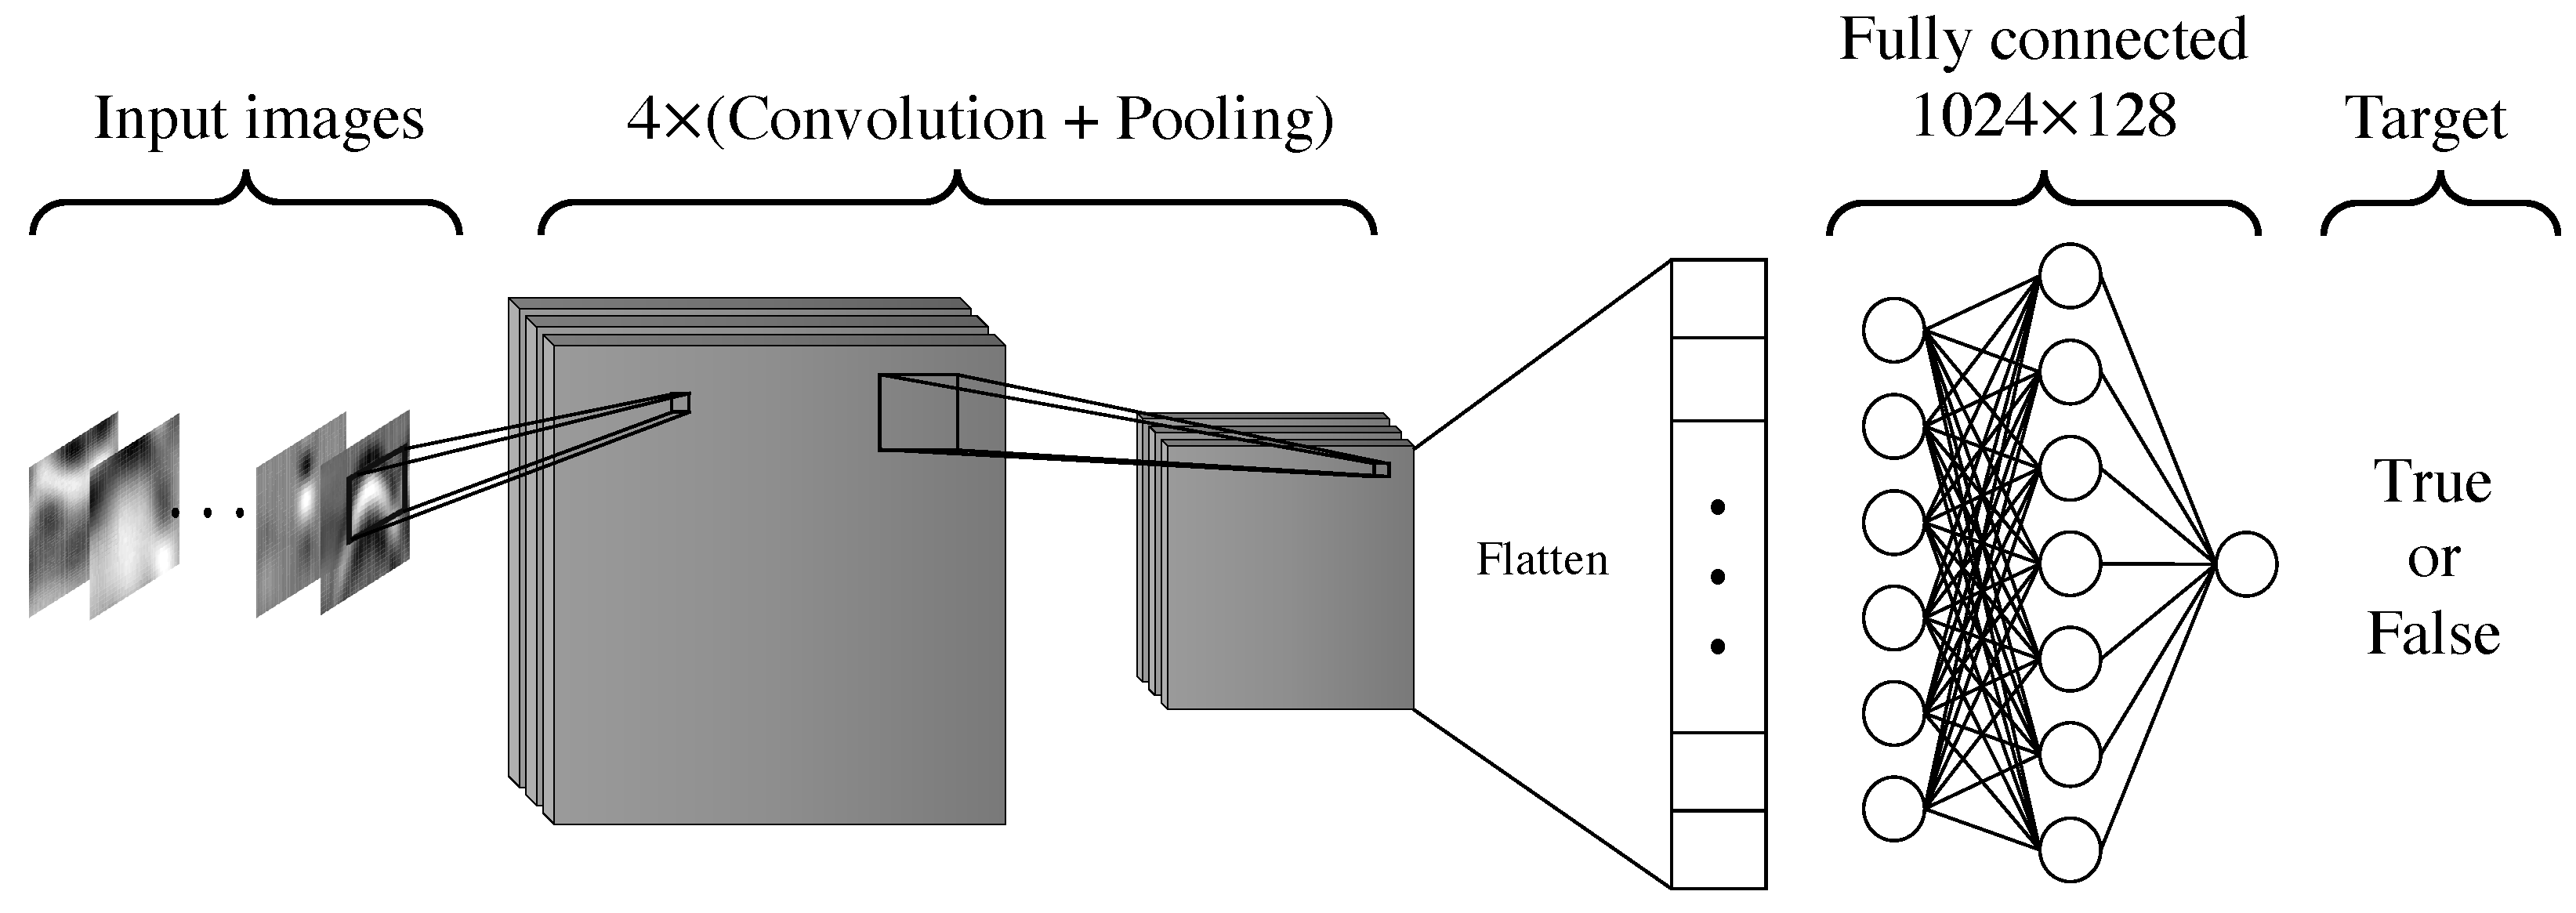
CNN is an artificial neural network that extracts abstract features from complex images. Through multiple iterations, it learns to map images to their respective class labels. A CNN has two main components. The first component includes convolution and pooling layers, which apply filters to the input images, creating a feature space that highlights key characteristics of the images. The multi-dimensional output of the convolution component is flattened and passed to the second component, a fully connected network that maps the extracted features to their target. In classification problems, this target represents a group of images that share a common property. Figure 3 shows the architecture of a deep CNN.
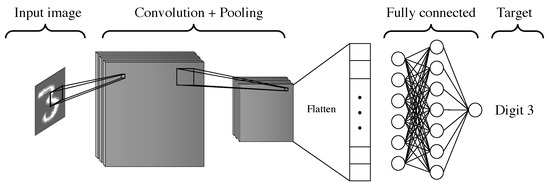
Figure 3.
Convolutional Neural Network architecture.
4. CNN Models and Training
4.1. Training and Validation Data
In machine learning classification problems, every input data belongs to a group that describes the content of the data. For example, the MNIST dataset [24]—which stands for Modified National Institute of Standards and Technology—contains 70,000 grayscale images (28 × 28 pixels) of handwritten digits, each labeled with the corresponding digit from 0 to 9. It serves as a widely used benchmark for evaluating image classification models. Unmigrated GPR images, similar to the MNIST dataset, are in grayscale (single-channel images). For single-channel (grayscale) images, the dimension of the input image is n × m × 1, which n and m are the number of pixels of the input image. Since the dimension of feature space is proportional to the size of input images, we propose to increase the dimension of training images to n × m × 2 by adding the migrated rebar reflection image of the same rebar as the second channel. Figure 4 illustrates examples from the training dataset. In Figure 4a, the first row displays raw images of true rebars, while the second row presents their corresponding migrated images. Figure 4b follows a similar structure to show the raw and migrated images of false rebars. Notably, as seen in Figure 4b, some raw images of false rebars exhibit hyperbolic shapes visually resembling those in the true class, highlighting potential challenges in visual detection. The distinction between true and false rebars becomes apparent only when the migrated image (processed version) is incorporated as a second channel in a dual-channel input.
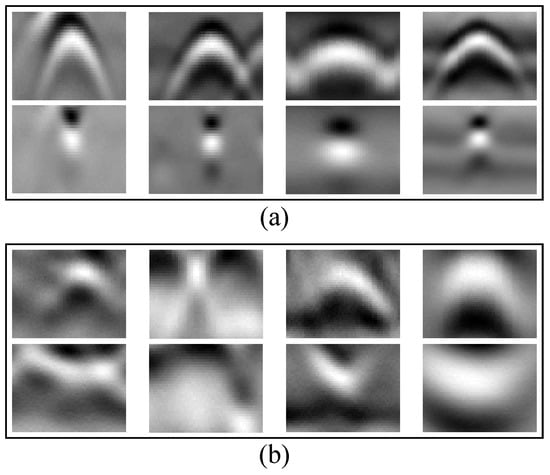
Figure 4.
Example of training images, raw (first row) and migrated (second row). (a) true rebars, (b) false rebars.
In this study, 3428 dual-channel images (raw and migrated data) were manually extracted from a GPR database comprising scans from 14 bridges. Due to variations in the original dimensions of the training data, all images were resized and standardized to 55 × 55 pixels for consistent input formatting.
4.2. CNN Models and Training Performance
Two CNN models (CNN-1 and CNN-2) were developed based on the architecture illustrated in Figure 5. The models differ in their input dimensions: CNN-1 accepts single-channel inputs (raw data) with a shape of 55 × 55 × 1, while CNN-2 processes dual-channel inputs (raw + migrated data) with a shape of 55 × 55 × 2. To evaluate the proposed methodology, both models were trained on 50% of the dataset and validated on the remaining 50% for performance assessment. CNN-1 used only the first channel (raw GPR images) of the training data. CNN-2 incorporated both channels (raw and migrated images) during training. Both models used binary cross-entropy as the loss function and an initial learning rate of 0.01. The learning rate was halved whenever the loss exceeds the minimum observed value for three consecutive iterations.
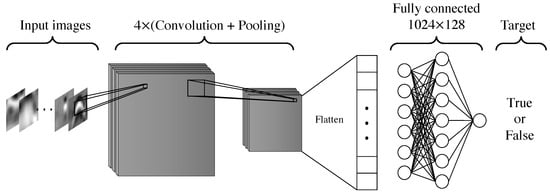
Figure 5.
Dual-channel CNN model architecture.
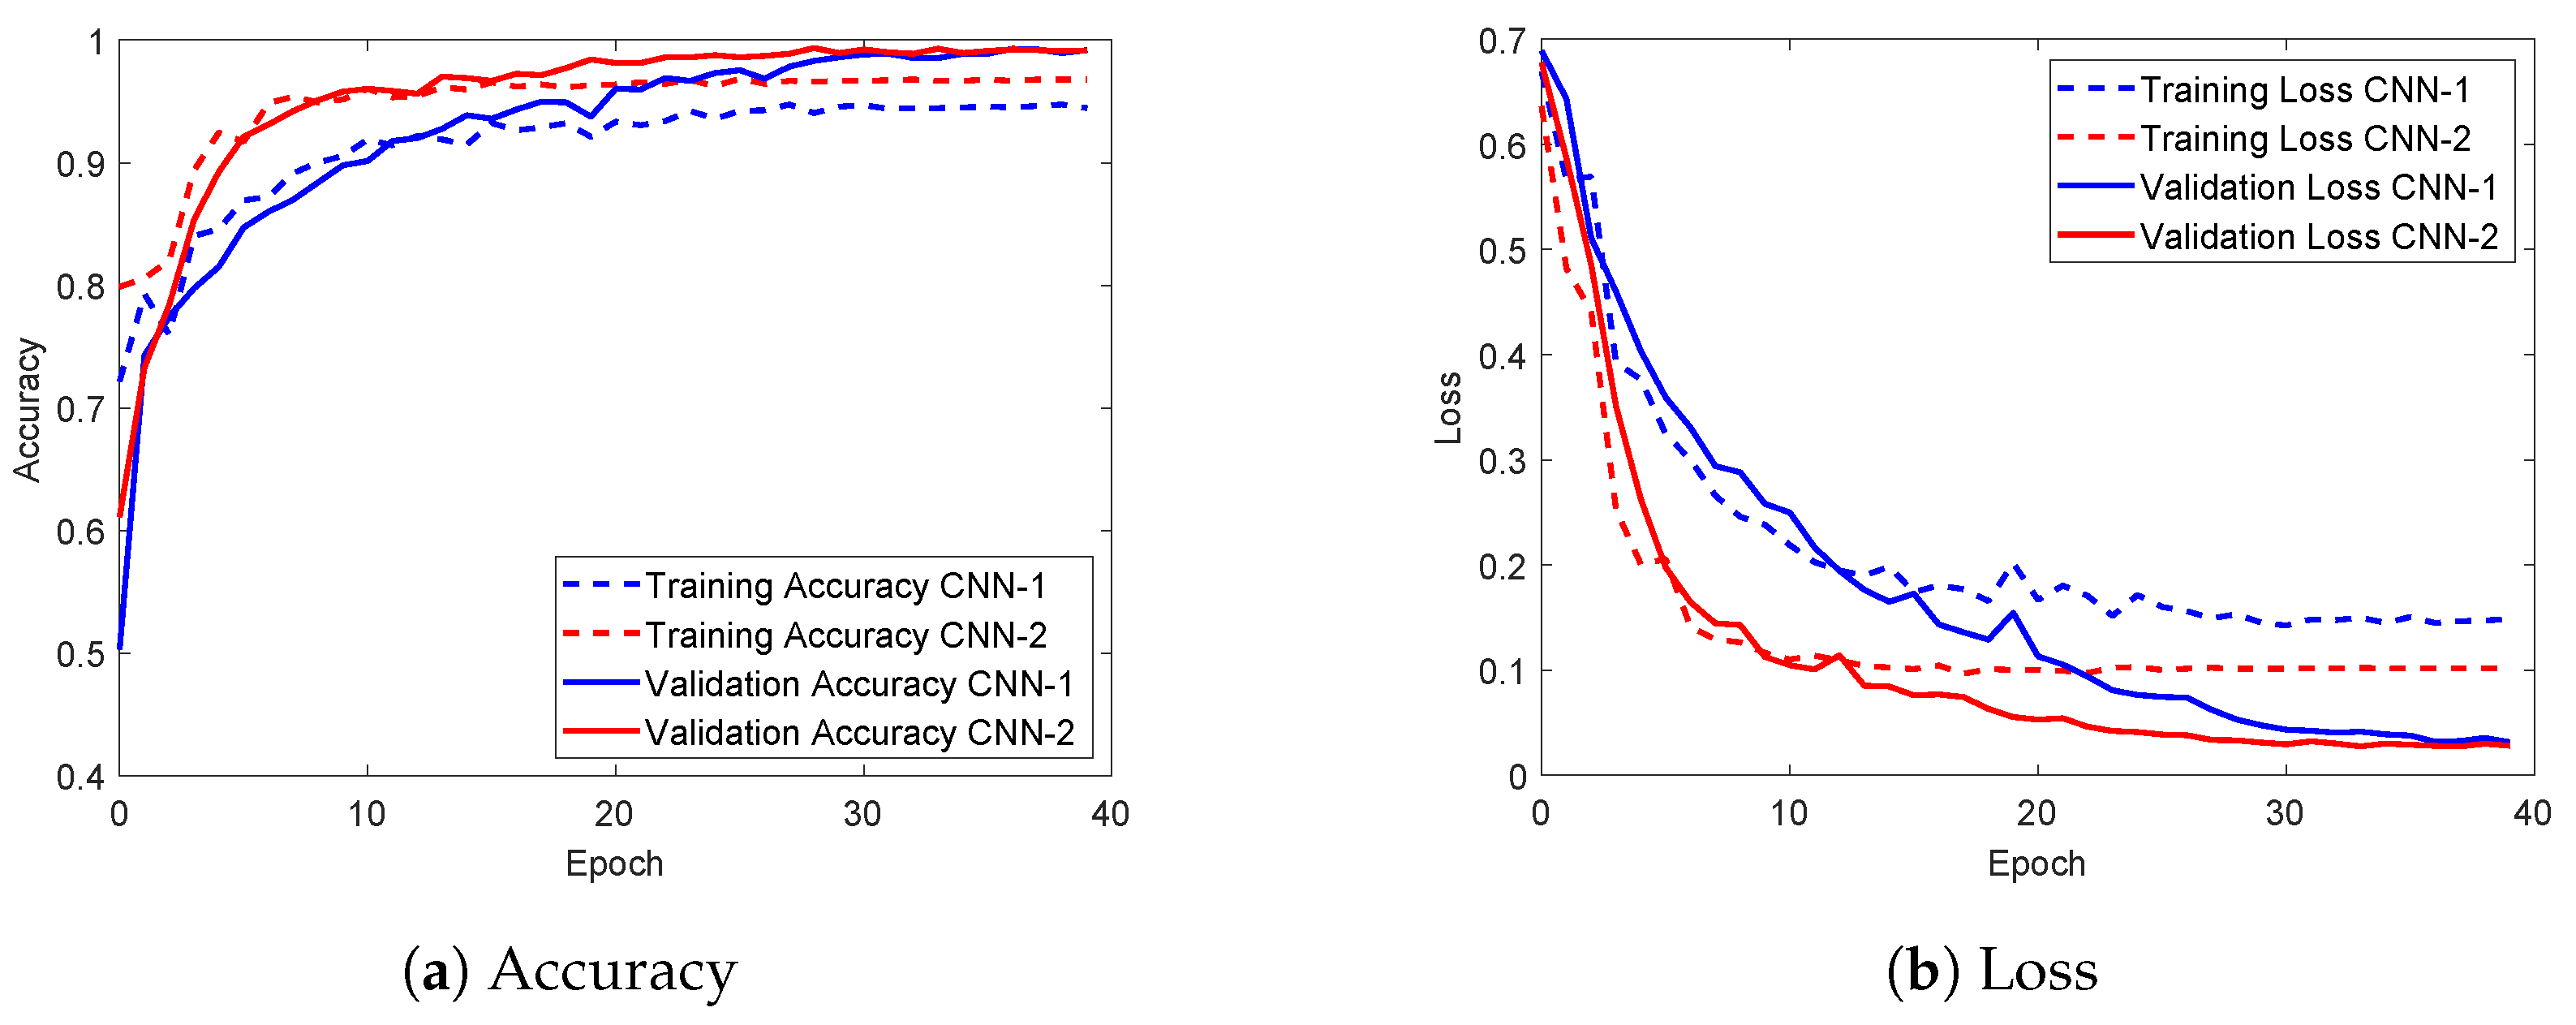
Figure 6 illustrates the result of training and validation on the dataset. Figure 6a compares their training and validation accuracies. CNN-2 achieves peak accuracy significantly faster than CNN-1 on both datasets, with a final 2.3% improvement in validation accuracy over CNN-1. Figure 6b depicts the corresponding loss values. CNN-2 converges to a stable performance plateau more rapidly than CNN-1, indicating enhanced learning efficiency when trained on dual-channel inputs. These results suggest that the inclusion of migrated images as a second channel enables CNN-2 to extract richer, more discriminative features from the input data. By leveraging both raw and migrated data, CNN-2 mitigates the limitations of single-channel inputs (CNN-1), leading to faster convergence and superior classification performance.
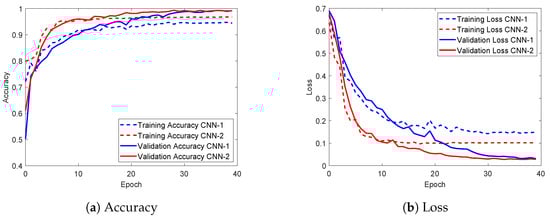
Figure 6.
Training performance of CNN-1 and CNN-2 models: (a) accuracy trends and (b) loss progression over epochs.
5. Model Implementation Results
The GPR amplitude maps (also referred to as attenuation maps) were generated using a multi-step procedure. Raw GPR data were first processed through zero-time correction, background removal, and migration to enhance rebar visibility. The trained CNN-1 and CNN-2 models were then applied to identify rebar locations in field data collected from three bridges in Nebraska. For each detected rebar, the migrated GPR reflection amplitude was extracted and corrected for depth to account for geometric spreading and dielectric loss, following the methods described in references [3,19]. The depth-corrected amplitudes for all rebars in a bridge deck were used to construct spatial attenuation maps. Attenuation was calculated relative to the amplitudes of the rebars in the sound concrete, which is defined as the 90th percentile of the amplitudes of all the rebars. To evaluate the performance of CNN models, we built ground-truth datasets by manually checking CNN-2 to add missed detections and remove false positives. Then three GPR attenuation maps were generated for each bridge: a ground-truth map, a CNN-1 prediction map, and a CNN-2 prediction map. These maps visualize the spatial distribution of signal attenuation across the bridge deck. Regions with lower amplitudes (higher attenuation) are associated with potential concrete degradation or rebar corrosion [18]. Model performance was evaluated using standard classification metrics, including precision, recall, and F1-score, which are presented and compared in the next section.
5.1. Bridge S075 17596
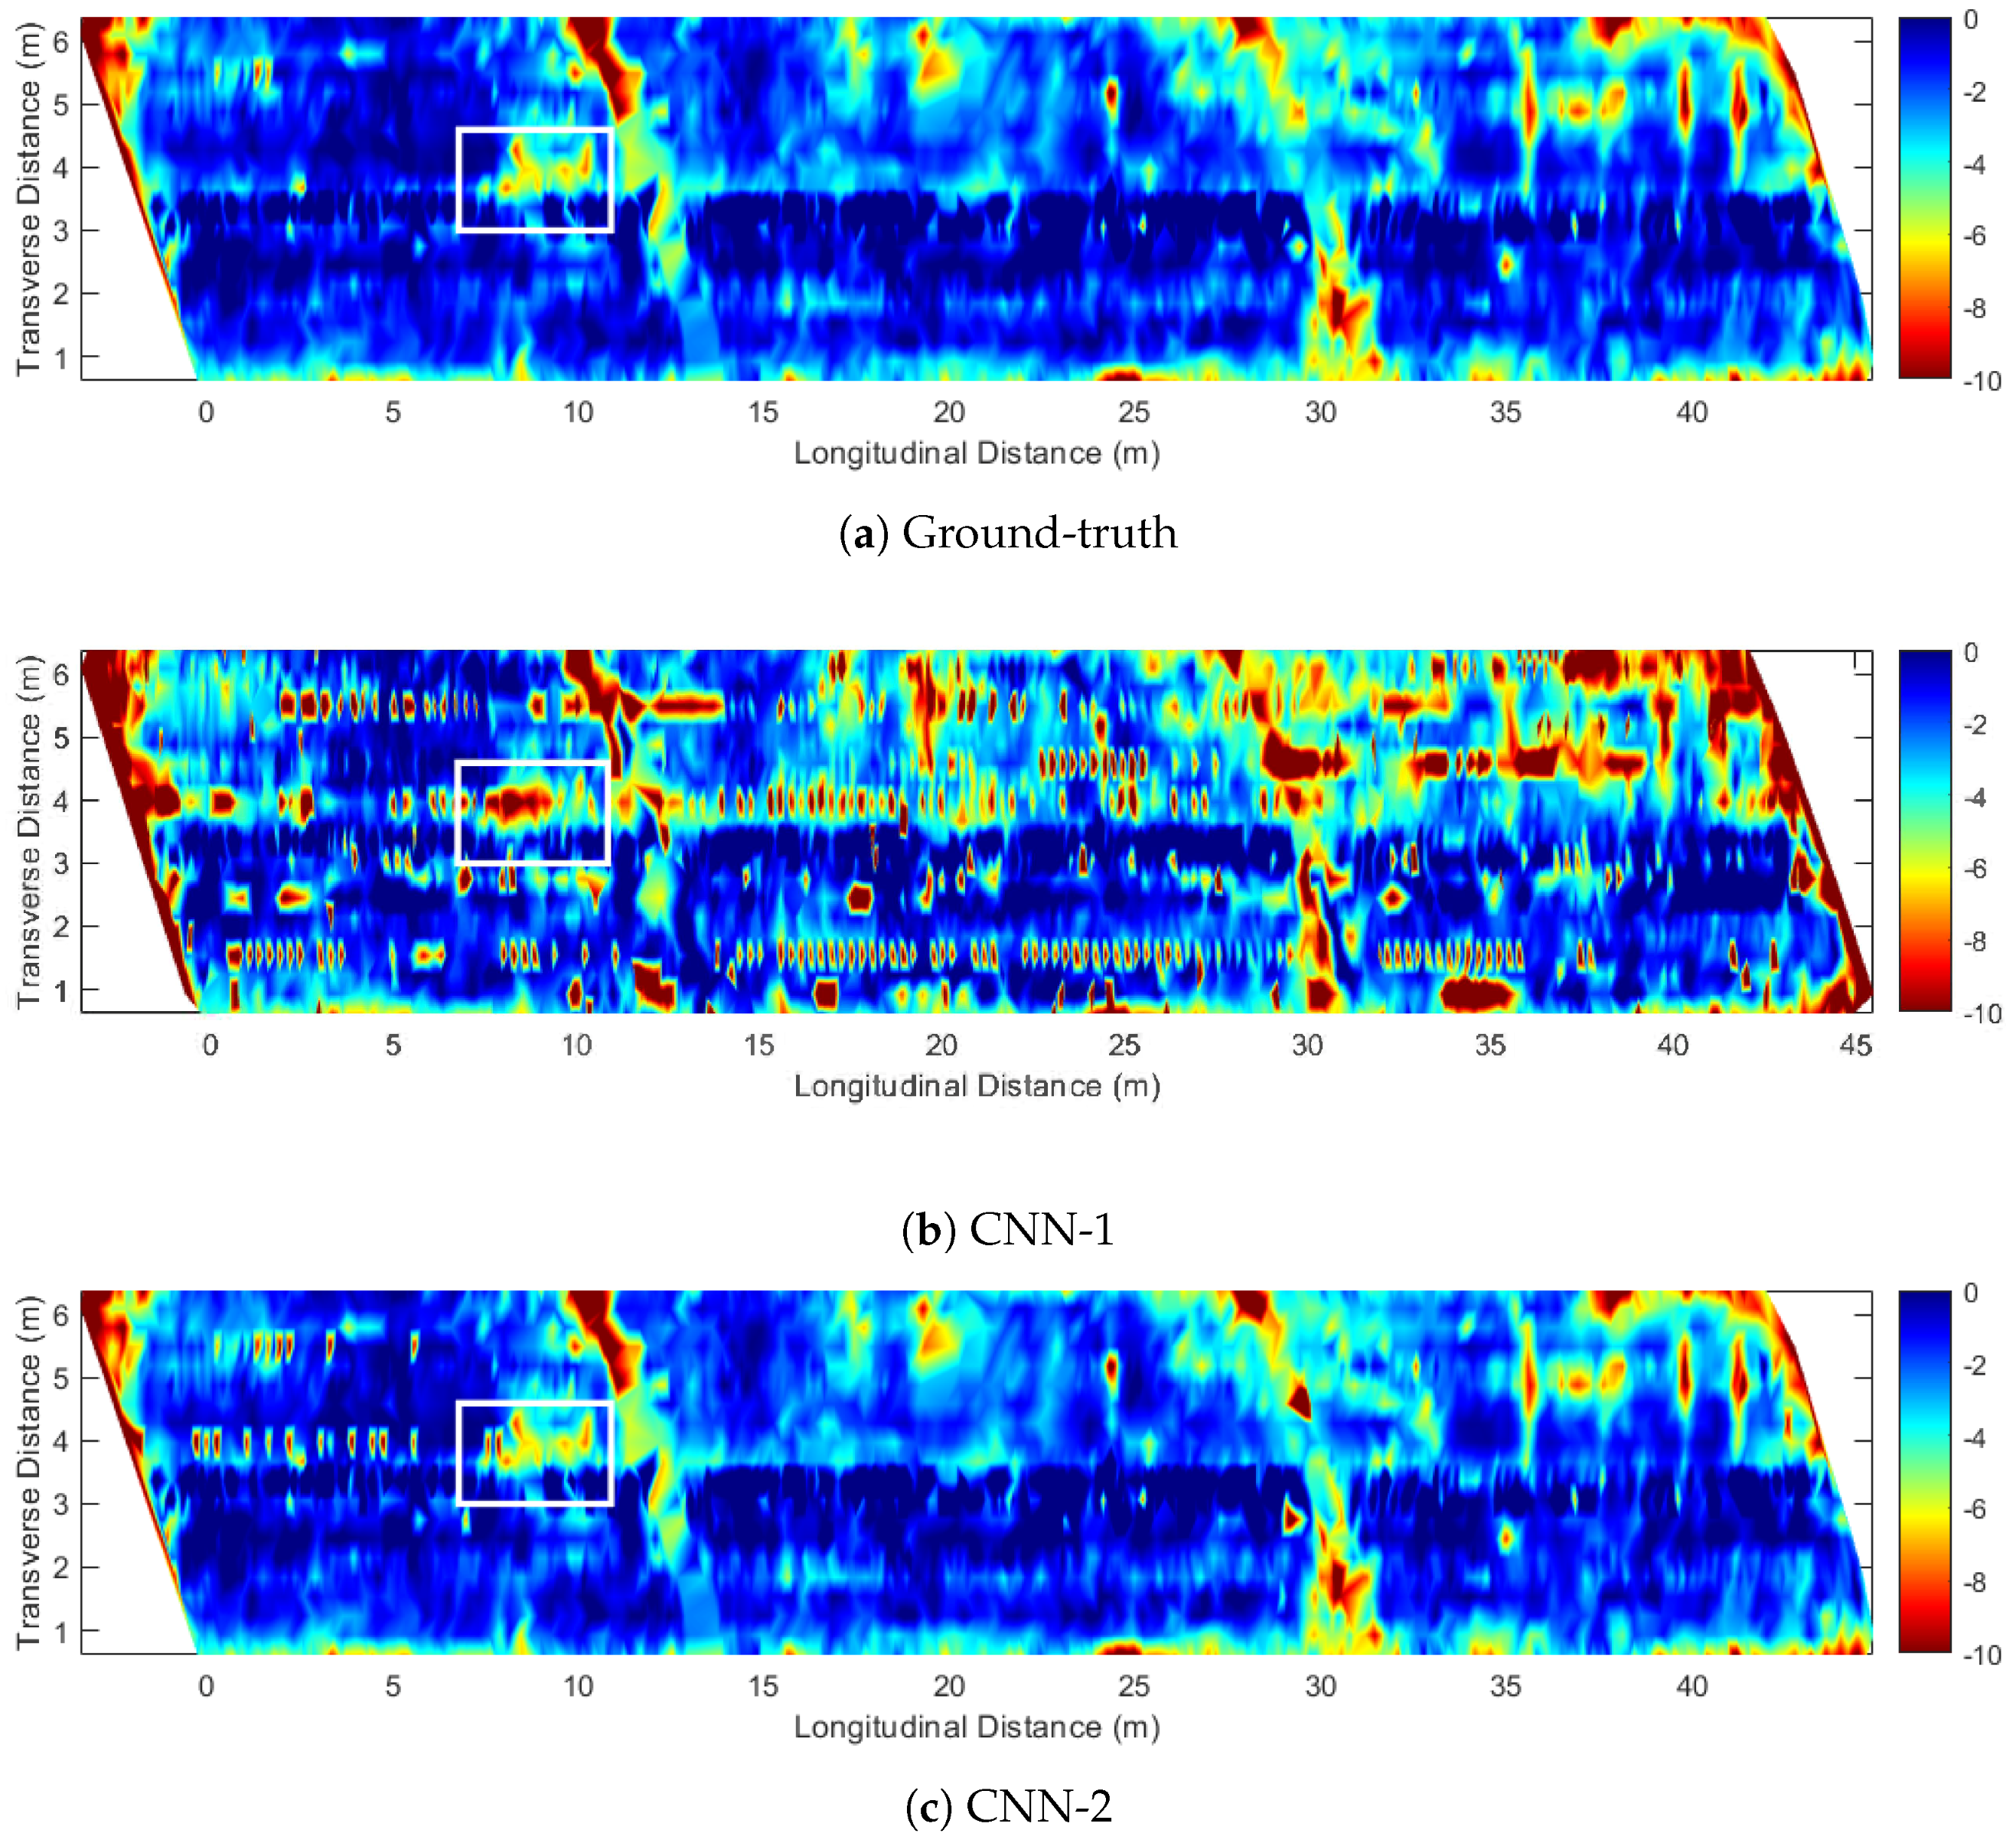
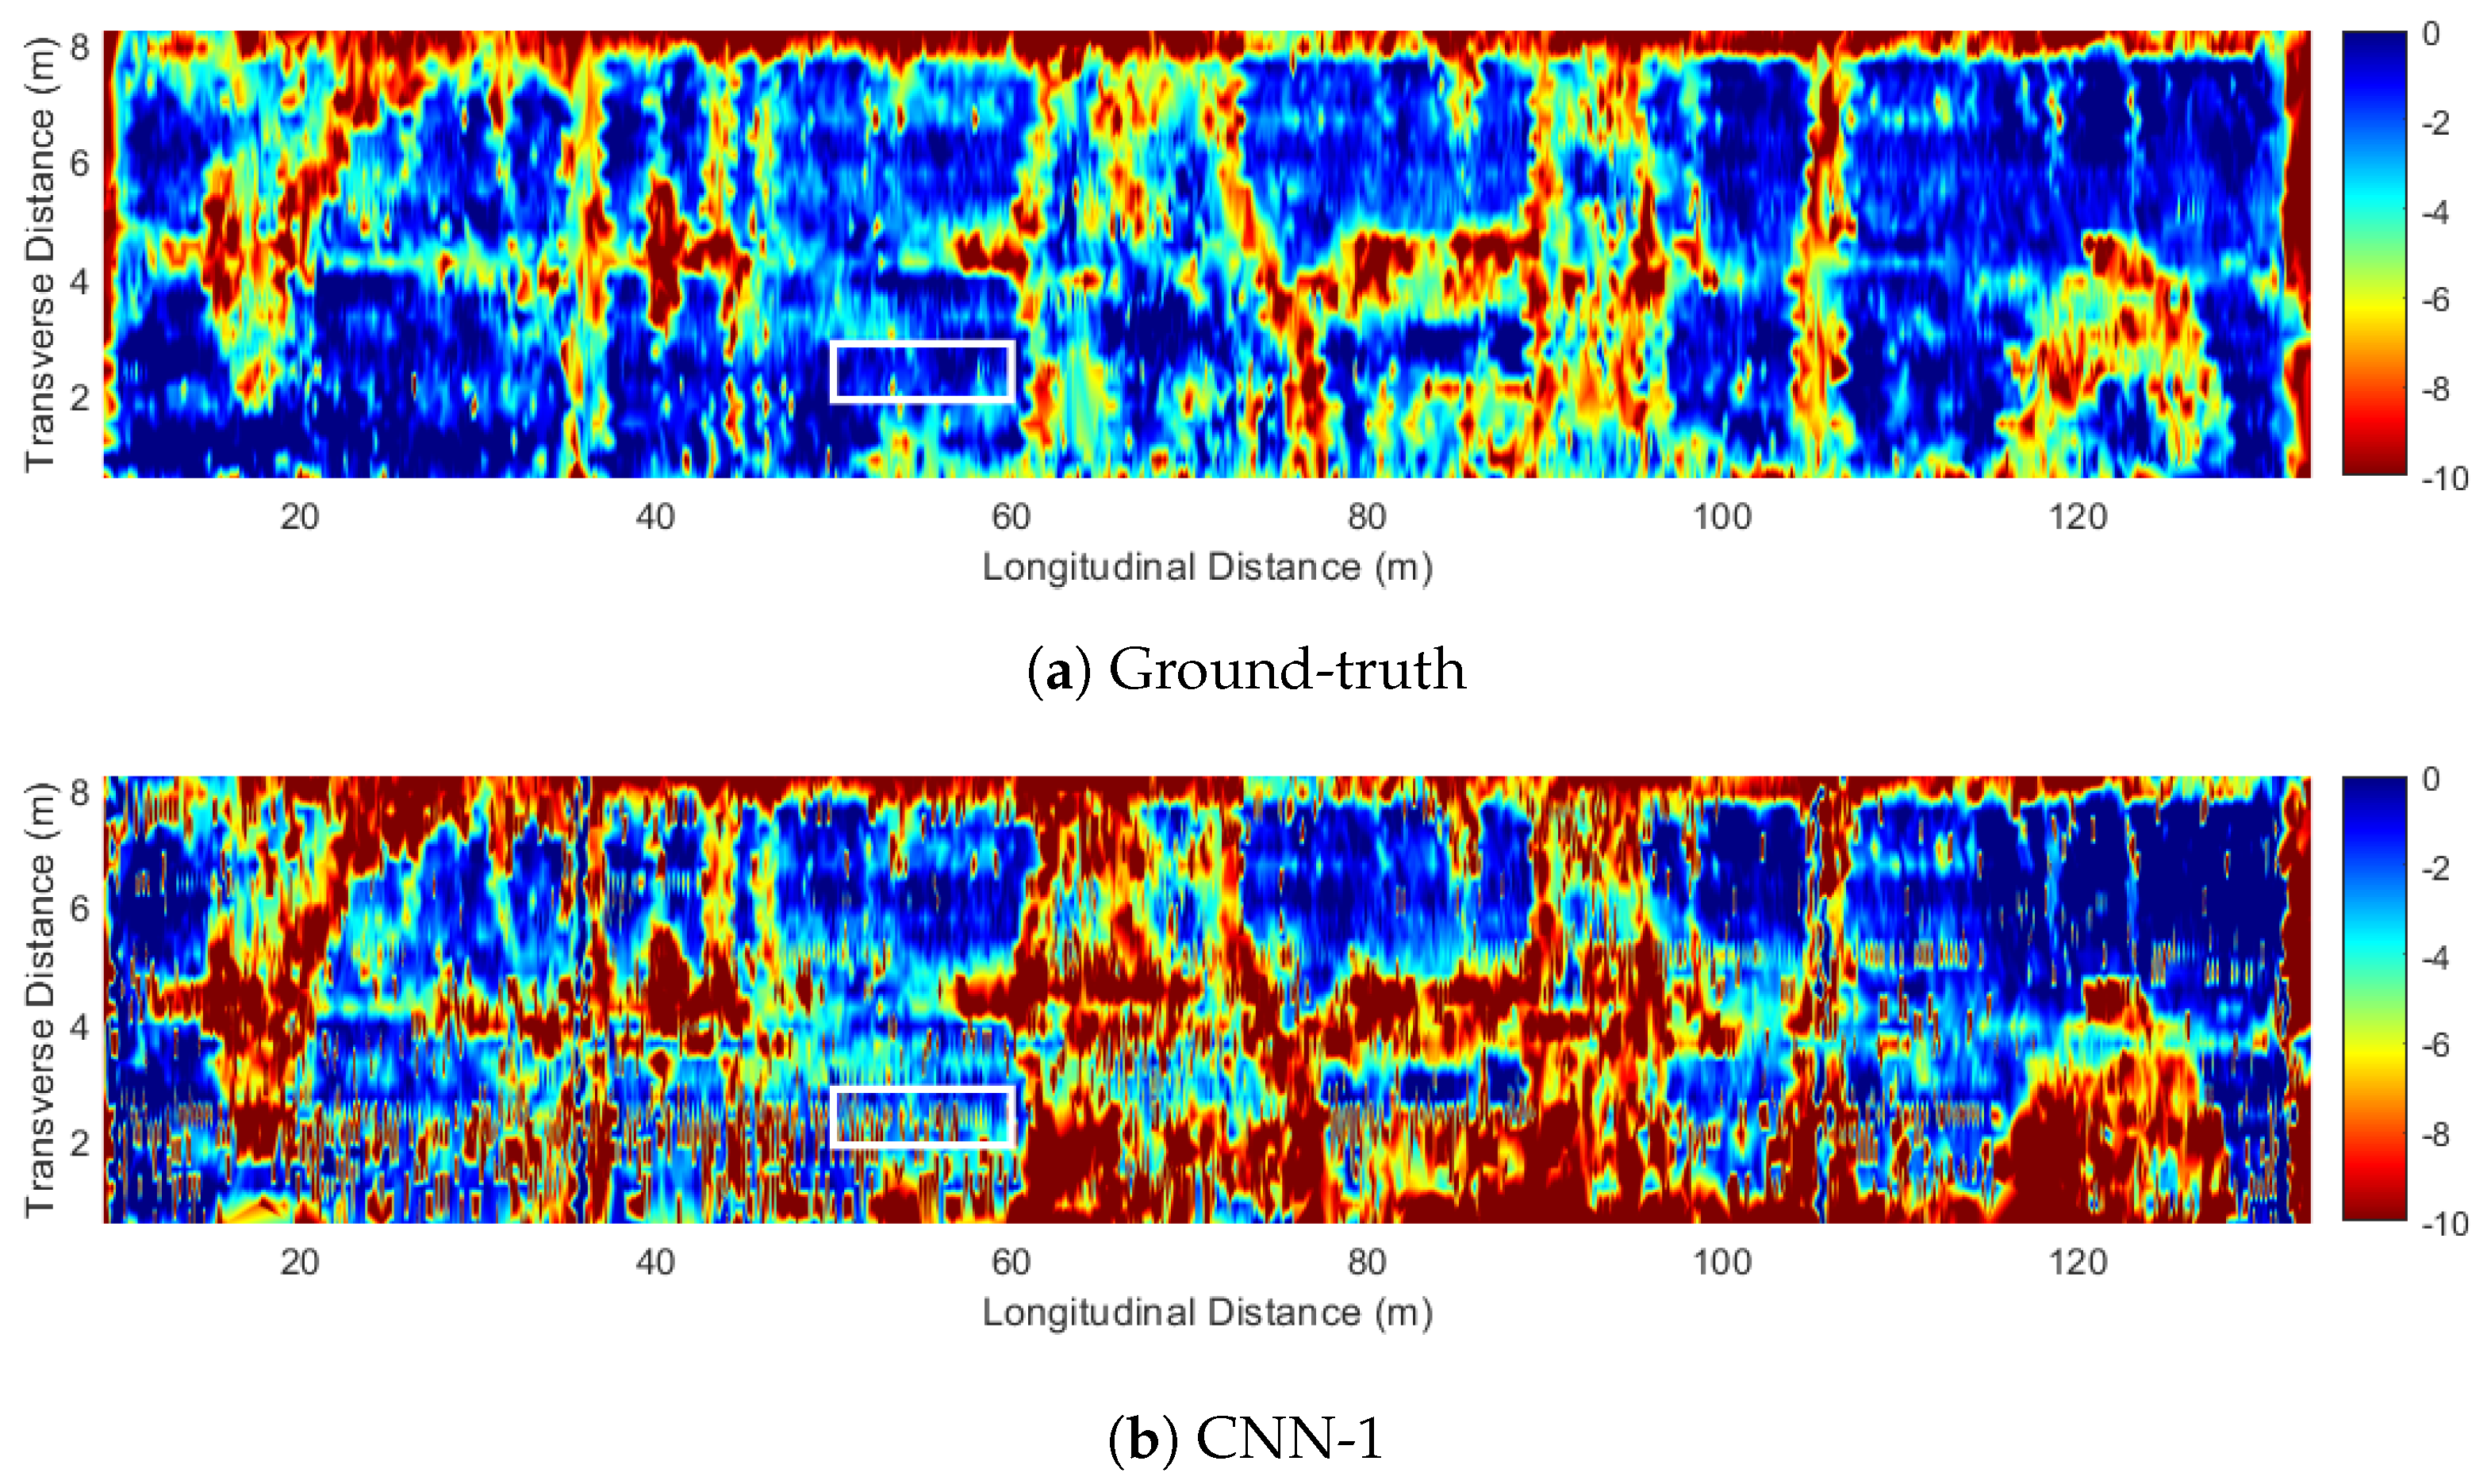
The S075 17596 bridge with an asphalt overlaid concrete deck was reconstructed in 1974. The bridge is 45 m (152 ft) long and 12 m (40 ft) wide. GPR data was collected on bare concrete during deck repairs after the asphalt overlay was removed. At the time of testing, the bridge was classified as “Fair” according to the National Bridge Inventory (NBI) [25]. In the NBI system, a “Fair” condition rating indicates that all primary structural elements are sound but may show minor section loss, cracking, spalling, or scour [26]. A GSSI SIR-4000 GPR unit with a 1.6 GHz ground-coupled antenna was used for data collection. The GPR scans were performed with a line spacing of 30 cm (1 ft) in the transverse direction and a spatial resolution of 3 mm. Figure 7 presents the bridge maps generated from processed GPR data using the methods described in previous sections. In this map, red colors indicate higher attenuation, which may suggest deterioration, while blue colors indicate stronger rebar reflections, typically associated with sound concrete. Figure 7a presents the ground-truth map of the S075 17596 bridge, constructed through manual analysis. Figure 7b,c display the maps generated by the CNN-1 and CNN-2 models, respectively. A visual comparison reveals that the CNN-2 output aligns closely with the ground-truth map, whereas the CNN-1 result exhibits significant deviations in rebar positioning and spatial consistency. To further quantify these discrepancies, Figure 8 provides a focused analysis of representative B-scans corresponding to the rectangular region highlighted in Figure 7, enabling direct evaluation of the models’ performance in reconstructing subsurface features.

Figure 7.
GPR amplitude map of bridge S075 17596: (a) ground-truth labeling, (b) predictions from CNN-1, and (c) predictions from CNN-2.
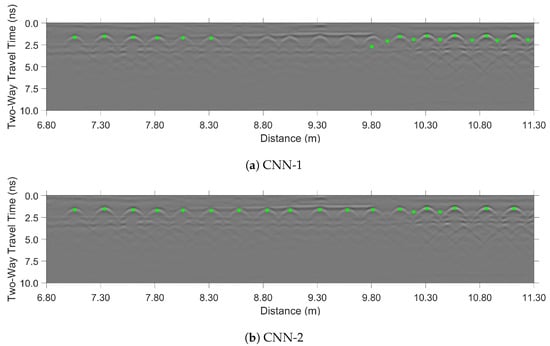
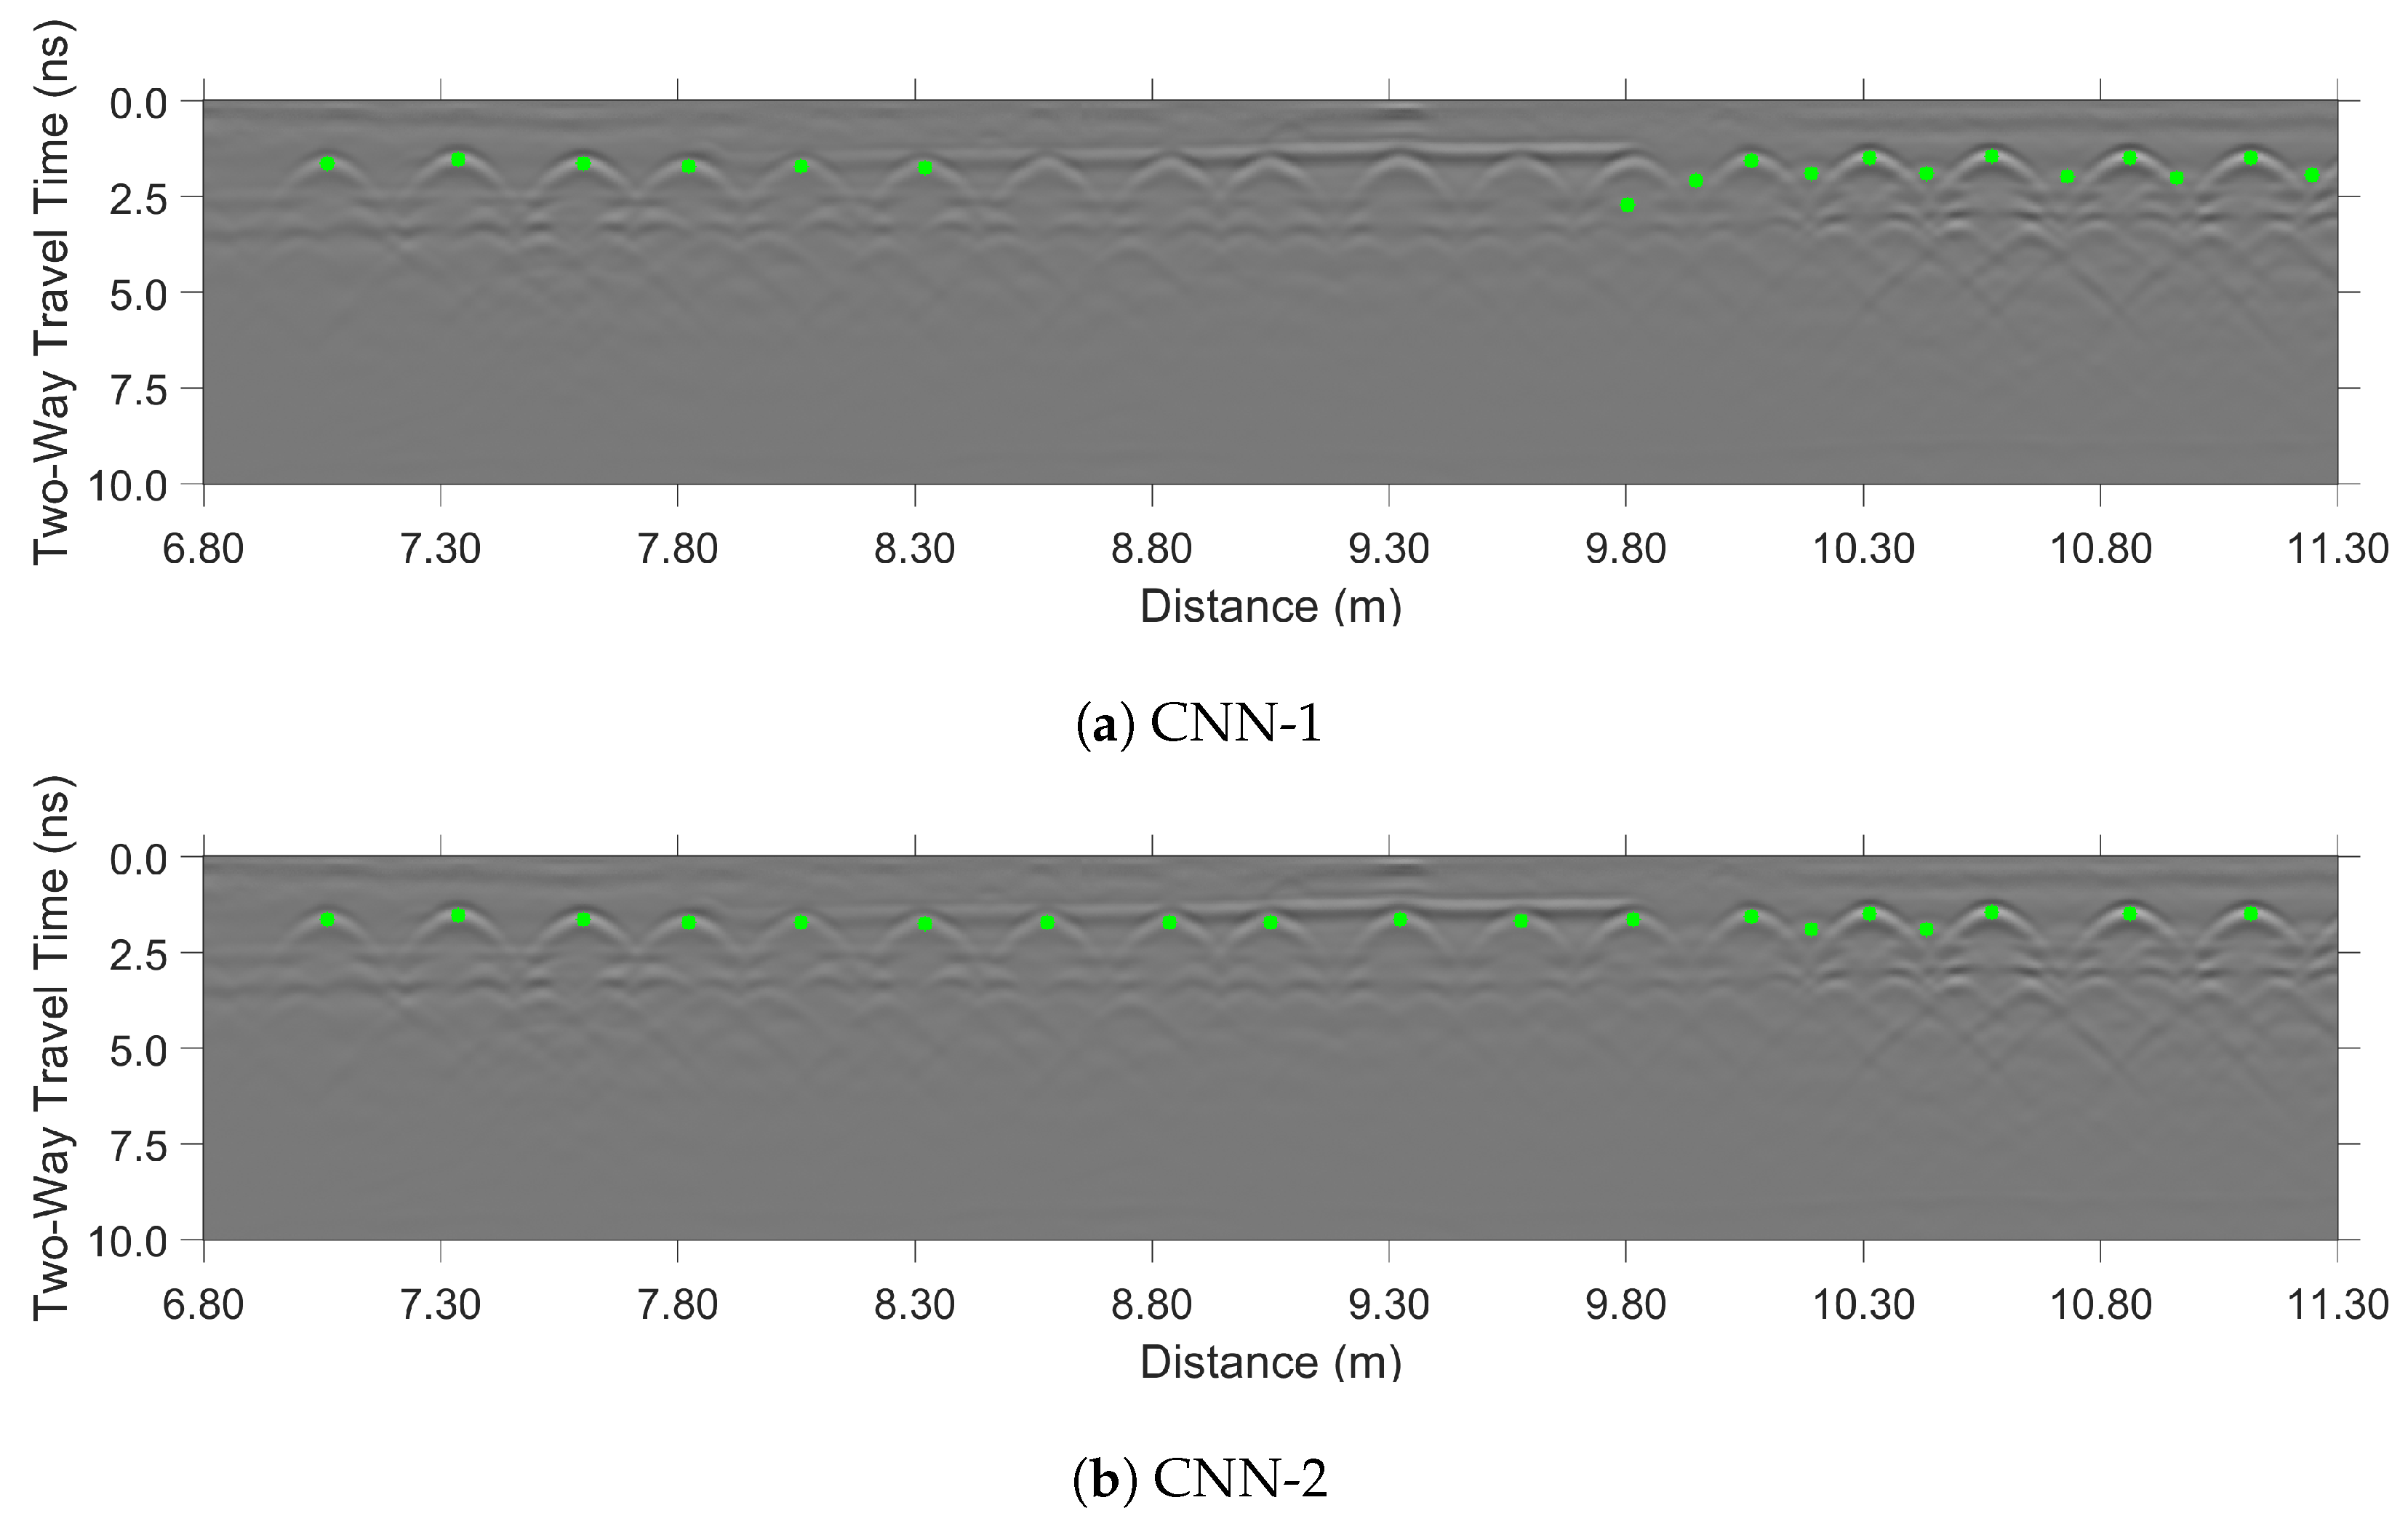
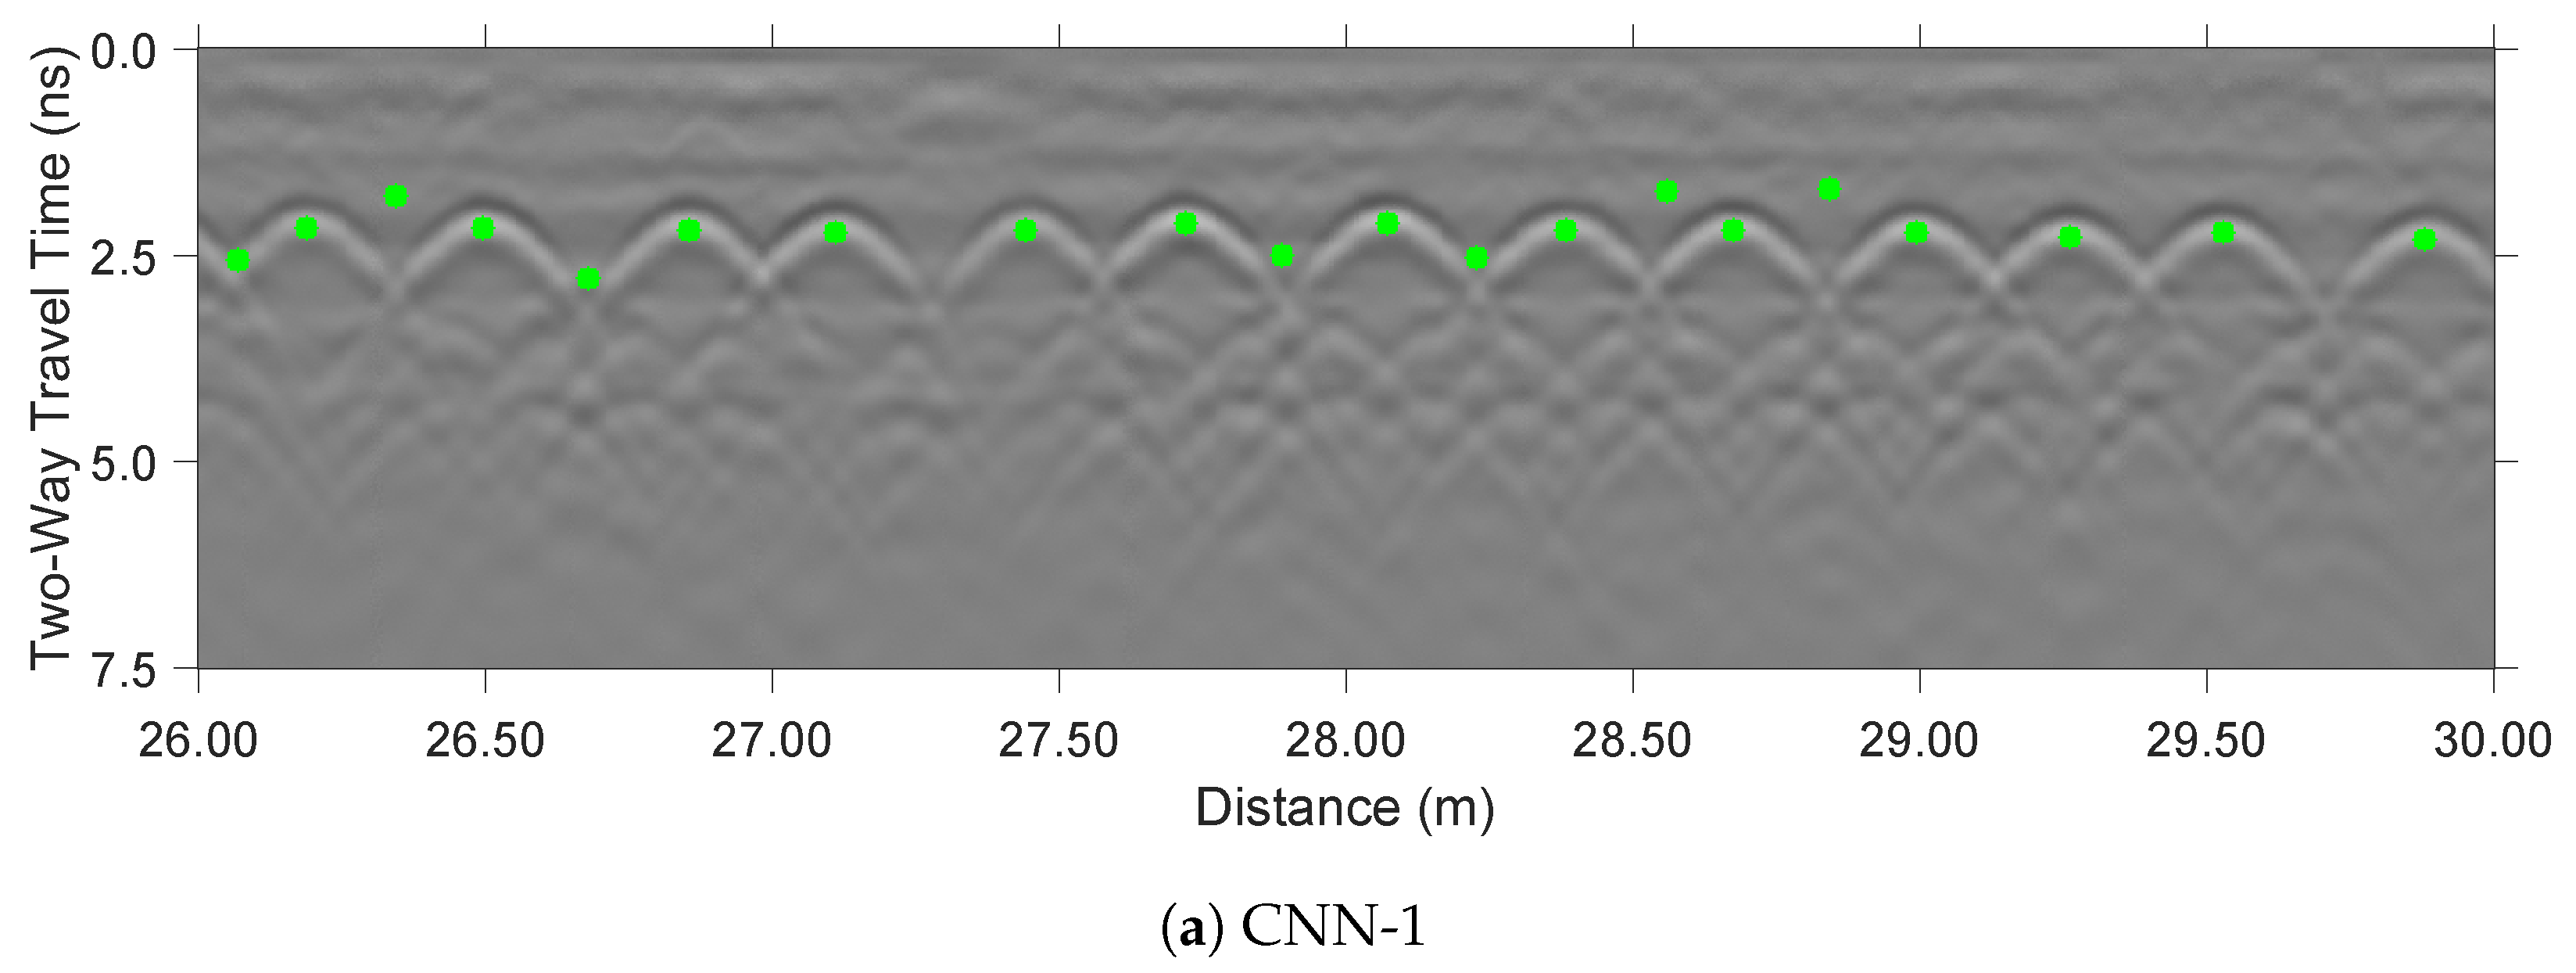
Figure 8.
GPR B-scan for the area highlighted by the white rectangle on Bridge S075 17596: (a) output of CNN-1 and (b) output of CNN-2. CNN-2 identified all rebars in this B-scan but with two false positives.
Figure 8 presents a GPR B-scan in the white box region, along with the rebars identified by CNN-1 and CNN-2 models. The green dots represent the rebars detected by each model. A comparison of the results reveals that the single-channel model (CNN-1) missed several rebars in the region between 8.30 m and 9.70 m. While the hyperbolas in this region appear visually clear, the horizontal trace on top of the hyperbolas in the B-scan likely introduced features that confused CNN-1. These traces may have distorted the model’s interpretation of the hyperbolic patterns, leading it to misclassify them as non-rebar features. Additionally, CNN-1 produced a false positive at 9.80 m, where the horizontal trace likely contributed to the misidentification of a feature unrelated to a rebar. Such horizontal traces can result from delamination or from cases where the scan direction aligns with longitudinal rebars near the surface. In this case, delamination is the probable cause.
In contrast, the dual-channel model (CNN-2) performed better in this region by incorporating both raw and migrated GPR images. The migrated images provided enhanced feature representation, allowing CNN-2 to focus on the true characteristics of the hyperbolas while suppressing the misleading influence of the horizontal trace. These traces are commonly observed in bridge deck GPR data, and their presence highlights the importance of using CNN-2, which is capable of correctly identifying rebar locations even when such horizontal traces are present. As a result, CNN-2 successfully identified the rebars that CNN-1 had missed. However, some minor inaccuracies were still observed in the CNN-2 results, such as two false positive rebars around the 10 m mark.
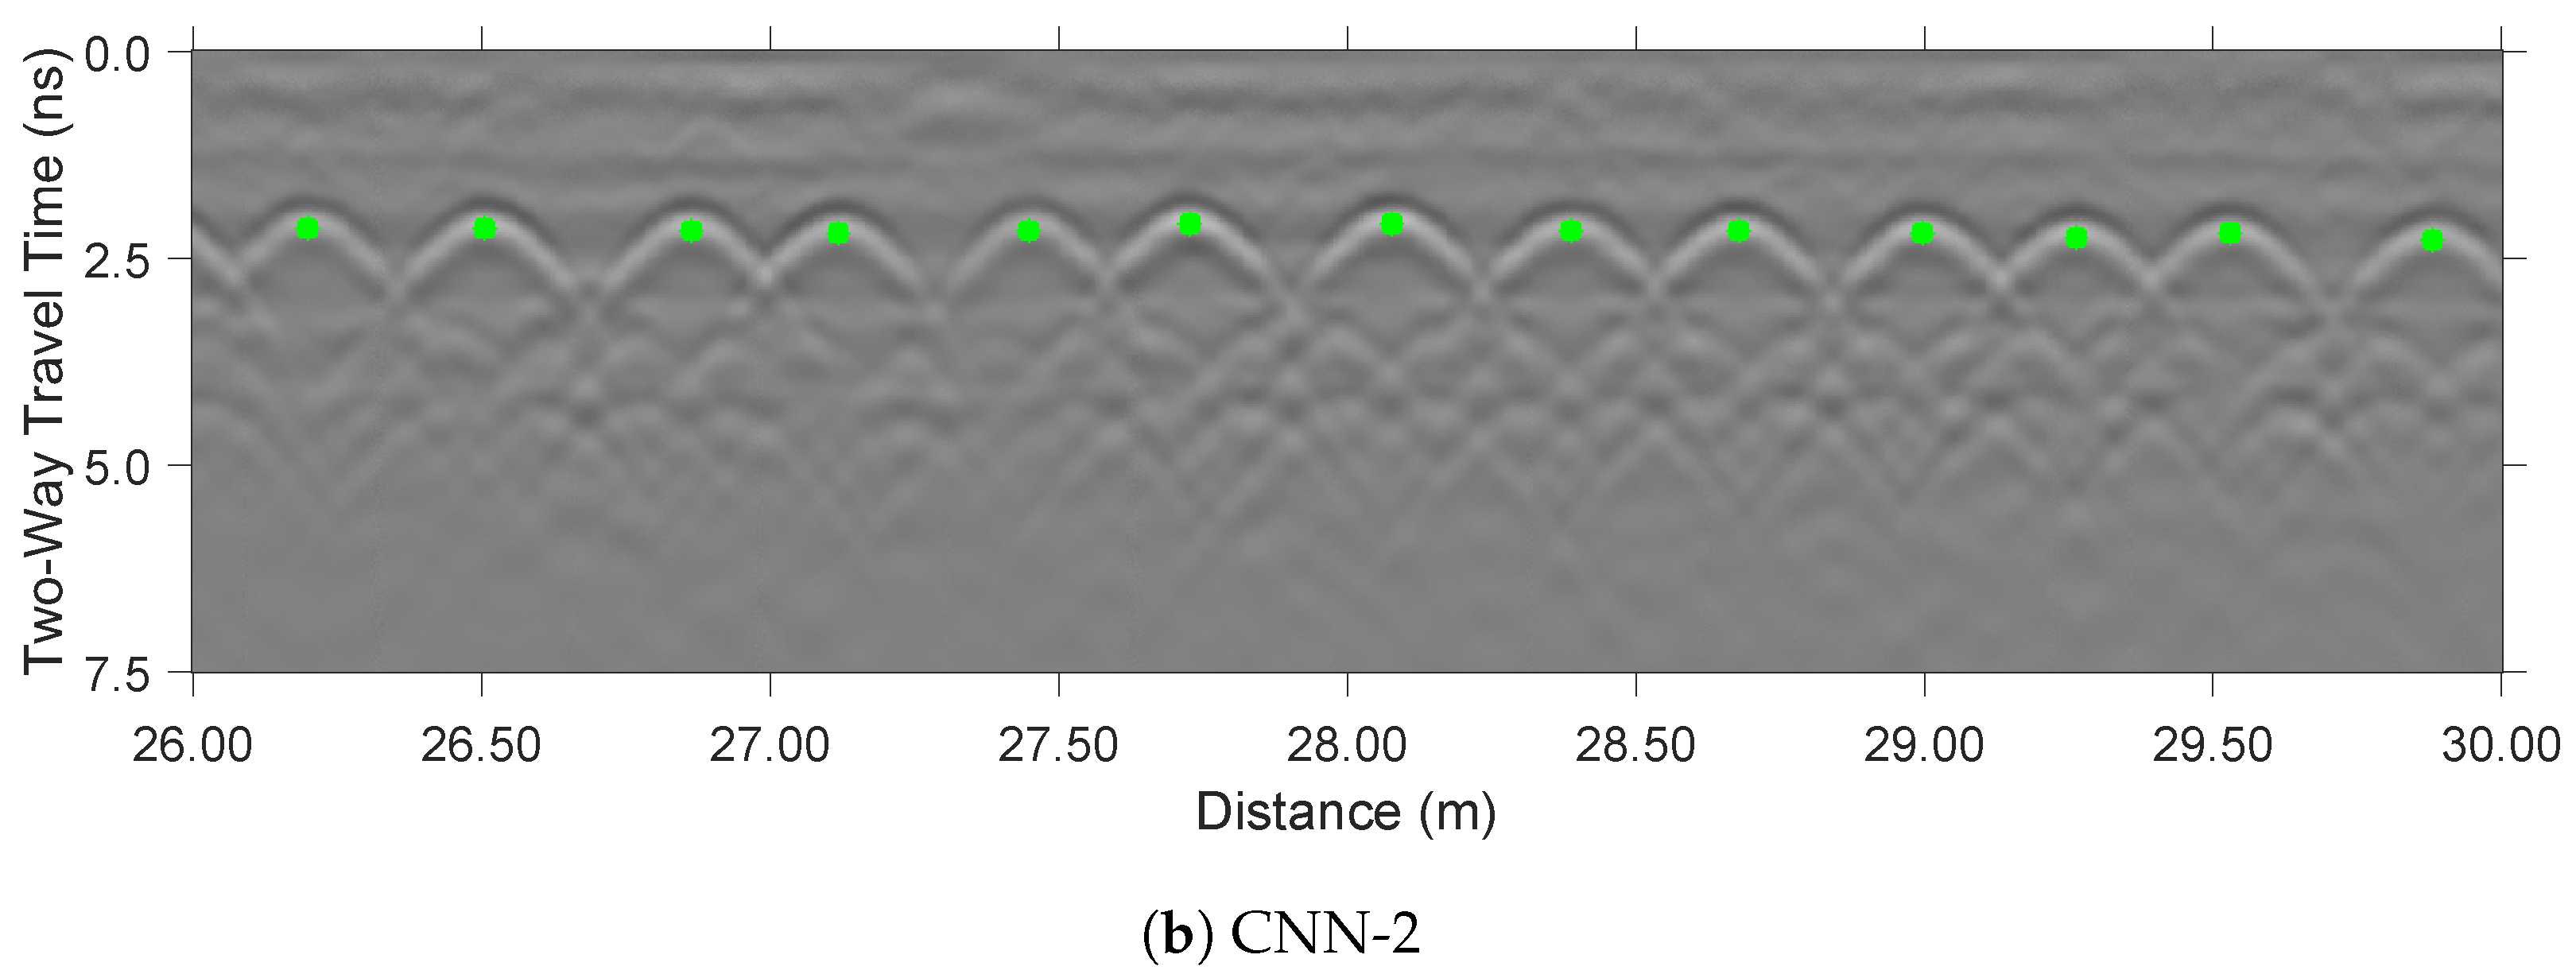
5.2. Bridge S077 05693R
Bridge S077 05693R, with a length of 54.9 m (180.1 ft), has a concrete overlay. Based on the National Bridge Inventory (NBI) during the data collection, the bridge was classified as being in “Fair” condition [25]. According to NBI guidelines, this rating implies that the primary structural components are sound but may exhibit minor section loss, cracking, spalling, or scour [26]. The SIR-4000 GPR system with a 1.6 GHz ground-coupled antenna was used to scan the bridge. The scan line spacing between each scan was 60 cm (2 ft), and a spatial resolution of 3 mm was set for all the scans. Figure 9 displays the GPR attenuation maps using both CNN-1 and CNN-2 models, alongside a ground-truth map (a). Visual comparison shows that the CNN-2 model closely resembles the ground truth. In contrast, the CNN-1 model incorrectly indicates widespread deterioration regions across the bridge, which was caused by false identification of rebars.

Figure 9.
GPR amplitude map of bridge S077 05693R: (a) ground-truth labeling, (b) predictions from CNN-1, and (c) predictions from CNN-2.
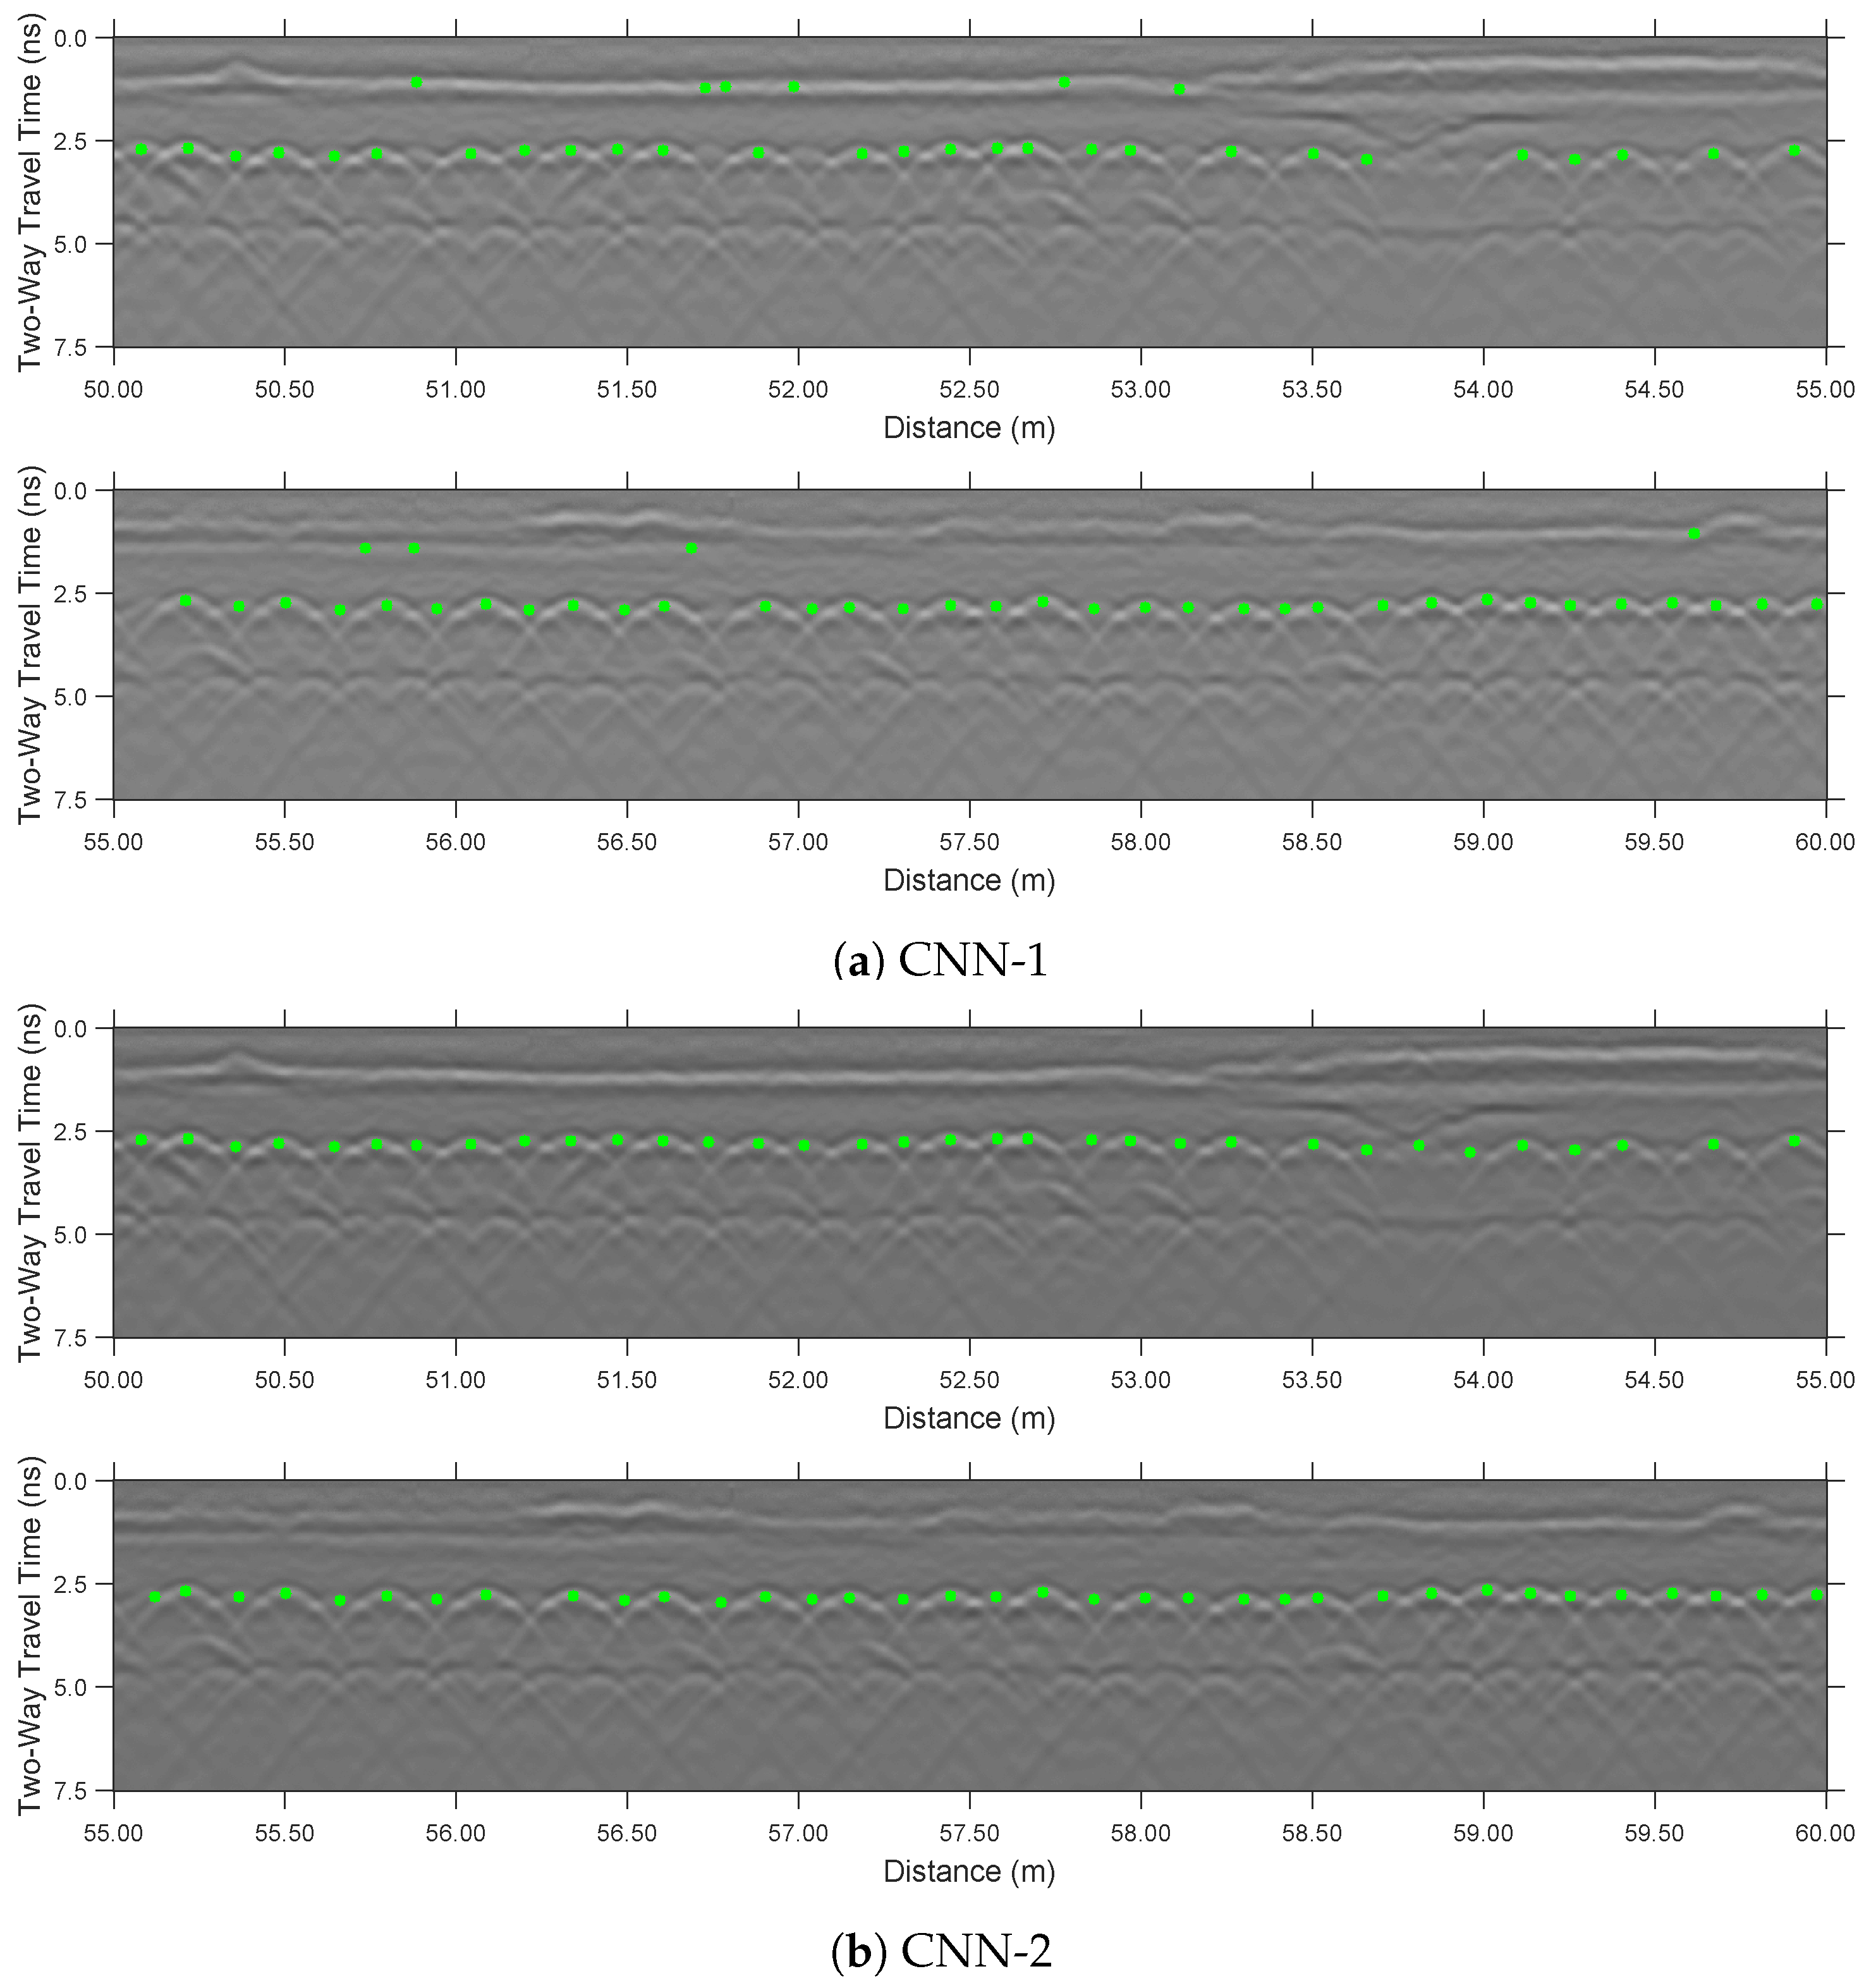
Figure 10 shows the picked rebars in the white rectangular area of Figure 9. While both models accurately identify the true rebars, the CNN-1 model has some false predictions regarding the rebar locations. Because the features extracted from raw B-scan images in CNN-1 are insufficient to distinguish genuine hyperbolic patterns, the model cannot fully discriminate between true rebar reflections and noise-induced artifacts, resulting in inaccurate detections. Consequently, these false predictions produce noisy outputs and large deterioration zones in the bridge map generated by CNN-1 (Figure 9b).
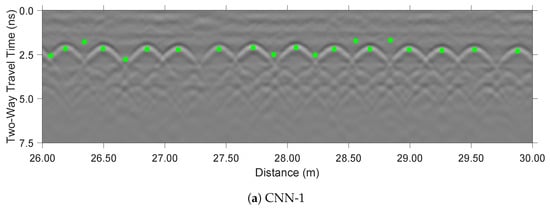
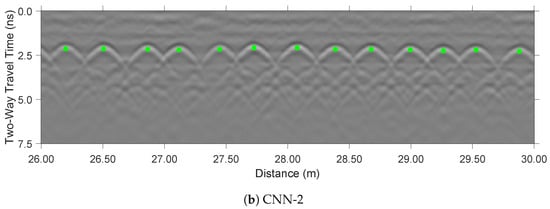
Figure 10.
GPR B-scan for the highlighted area on Bridge S077 05693R map: (a) output from CNN-1 and (b) output from CNN-2. CNN-2 identified all rebars in this B-scan.
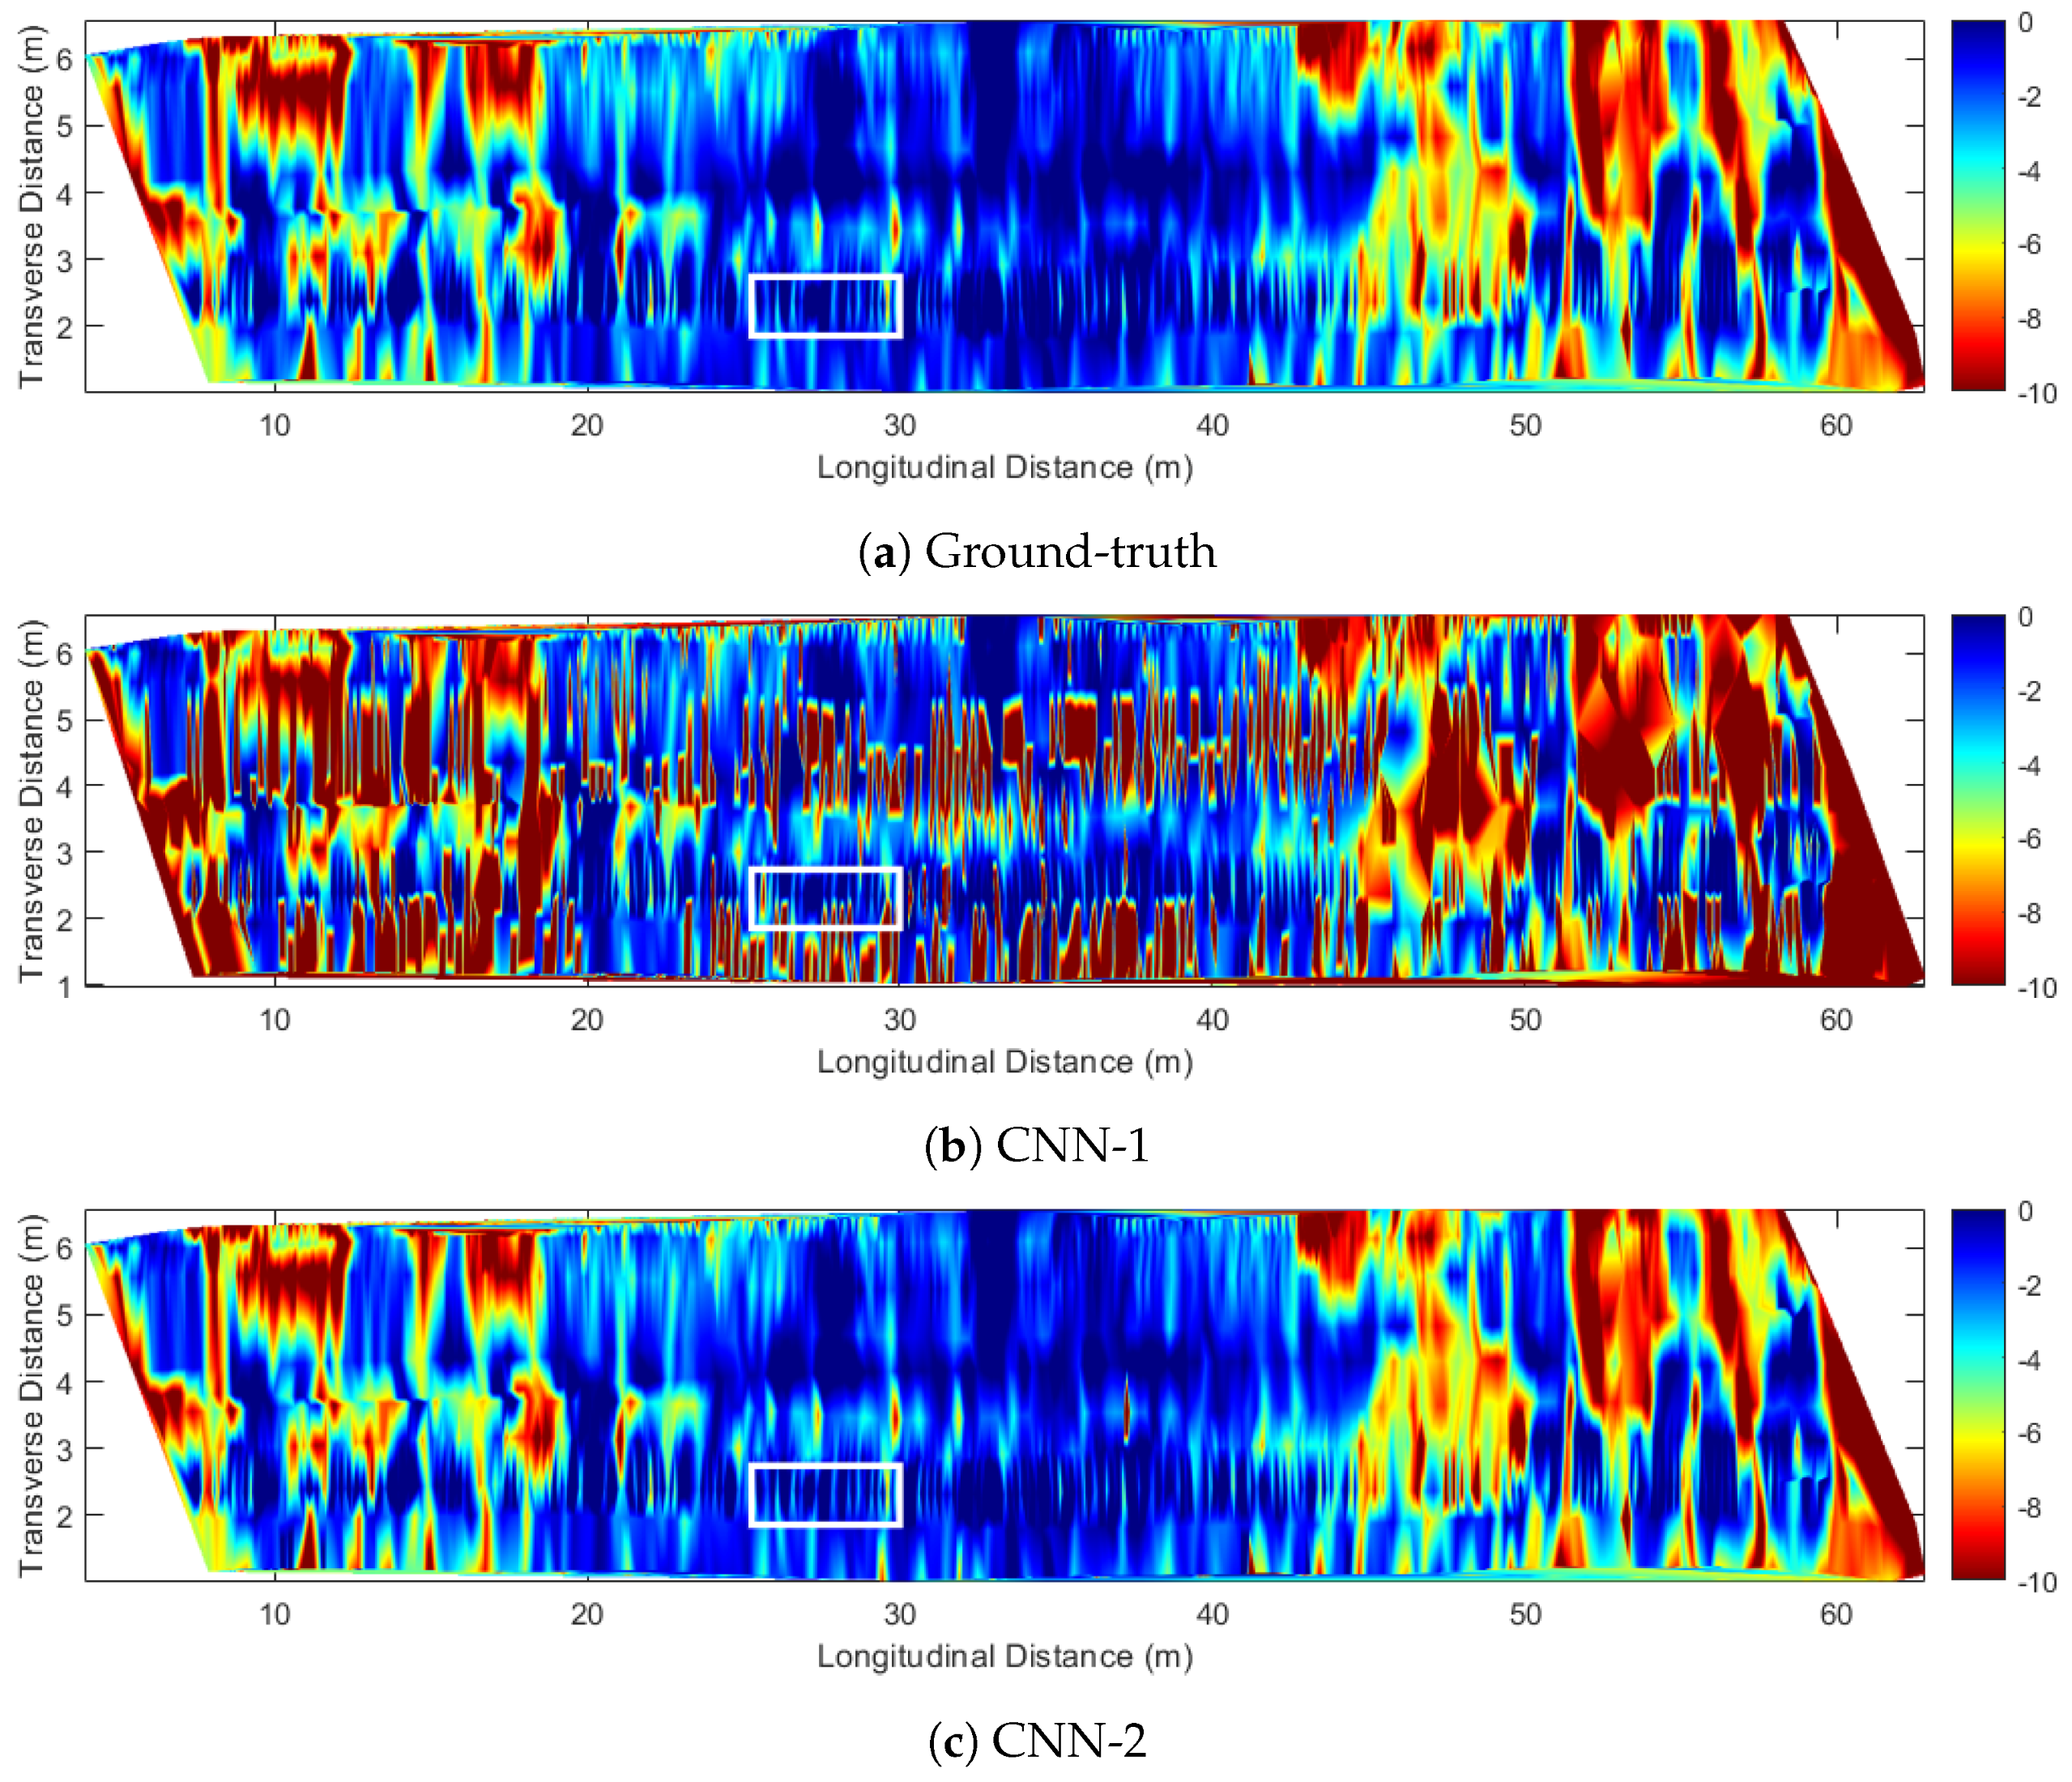
5.3. Bridge S092 46282R
This bridge, which features an asphalt overlay, was constructed in 1960, with a length of 182.9 m (600 ft) and a width of 9.8 m (32 ft). The S092 46282R bridge was decommissioned in 2005 after a replacement bridge was constructed. The deck condition was classified as “Poor” [25] based on 2008 NBI data. In the NBI system, a “Poor” condition indicates advanced section loss, deterioration, spalling, or scour in primary structural elements [26]. The GPR scanning was performed using the GSSI (Nashua, NH, USA) SIR-4000 GPR system with a 1.6 GHz ground-coupled antenna. All scans had a longitudinal resolution 3 mm and a line spacing of 30 cm (1 ft). The GPR amplitude maps are shown in Figure 11, with ground truth, CNN-1 mode, and CNN-2 model. We can see that the differences between CNN-1 and CNN-2 models are significant. The amplitude map given by the CNN-2 model is similar to the ground truth map, while CNN-1 map overestimates the deterioration regions. The B-scan in a region highlighted by a white rectangle is used for further analysis.
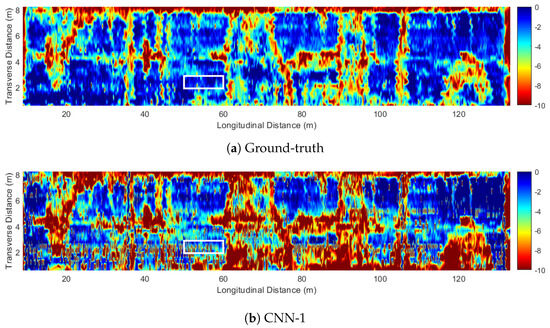
Figure 11.
GPR amplitude map of bridge S092 46282R: (a) ground-truth labeling, (b) predictions from CNN-1, and (c) predictions from CNN-2.
Figure 12 depicts the GPR B-scan and rebar detection results from the CNN-1 and CNN-2 models within the highlighted region of interest, offering a detailed comparative analysis of their performance. This section, located near the bridge deck shoulder, contains densely spaced rebars due to the presence of tie bars across the longitudinal joint. The results reveal that the CNN-1 model exhibits both missed detections (undetected rebars) and false positives (erroneous identifications), whereas the CNN-2 model demonstrates markedly improved accuracy. The superior performance of CNN-2 is particularly notable given the bridge’s designation as “Poor” by NBI, a condition that may complicate rebar identification. Despite these challenges, CNN-2’s predictions consistently align with the ground-truth map, underscoring its robustness in interpreting complex GPR data under suboptimal structural conditions.
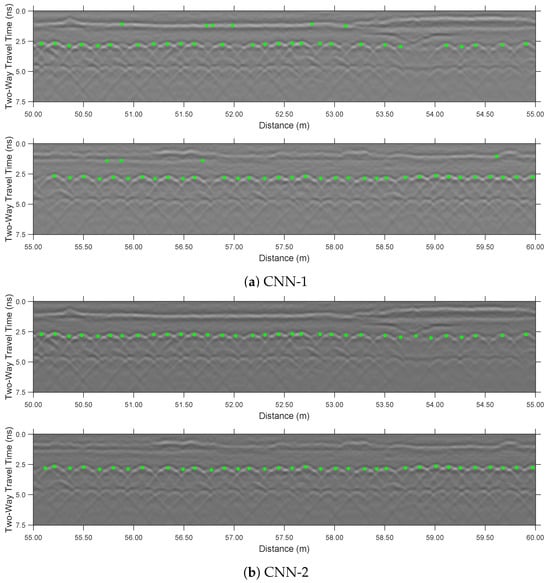
Figure 12.
GPR B-scan for the highlighted area on Bridge S092 46282R map: (a) output from CNN-1 and (b) output from CNN-2. CNN-2 identified all rebars in this B-scan.
5.4. Performance Comparison
To quantitatively assess the performance of the CNN-1 and CNN-2 models in detecting rebars from GPR data, we use three key metrics: precision, recall, and F1-Score. These metrics, typically expressed as percentages, are used to evaluate machine learning models. Precision (Equation (1)) is the proportion of true positive predictions out of all positive predictions. In our case, precision measures the ratio of correctly detected rebars to all detected rebars, including any false positives caused by hyperbolic-shaped patterns in the GPR images. Recall (Equation (2)) is the fraction of true positive predictions among all actual positive instances. For GPR tests, recall represents the proportion of correctly detected rebars among all true rebars. Although high precision and recall percentages generally suggest good model performance, they do not always reflect the overall effectiveness of the model. For instance, achieving 100% precision may result in low recall due to a large False negative, and vice versa, where 100% recall could lead to a large false positive and low precision. To better capture the balance between these two metrics, we calculate the F1-Score (Equation (3)), which is the harmonic mean of precision and recall. The F1-Score provides a more comprehensive measure of performance, with a higher score indicating a better balance between correctly identifying true rebars and minimizing false positives.
The performance metrics of CNN-1 and CNN-2 for the three bridges are summarized in Table 1 and Table 2. For Bridge S075 17596, both models give satisfactory results, with CNN-2 achieving a higher F1-score of 98.31%. The main difference between the models lies in the number of false picks. CNN-1 has 485 false picks, whereas CNN-2 produces only 19. Although both models exhibit similar recall values, but CNN-2 demonstrates superior precision, indicating its ability to better avoid false positives.

Table 1.
Summary of rebar detection performance achieved by CNN-1.
Table 2.
Summary of rebar detection performance achieved by CNN-2.
For Bridge S077 05693R, CNN-1 achieves an F1-score of 83.00%, while CNN-2 reaches 98.92%. This difference is primarily attributed to CNN-2 having fewer false picks and missed detections. These results demonstrate that CNN-2’s predictions are closely aligned with the ground truth and significantly reduce errors compared to CNN-1.
For Bridge S092 46282R, which is classified as being in poor condition, CNN-2 outperforms CNN-1 with a significantly higher F1-score (98.53% vs. 74.31%). CNN-2 reduces both false picks and missed detections compared to CNN-1. The low performance of CNN-1 is related to the poor condition which affects the model’s accuracy. Despite these challenges, CNN-2 still performs quite well in accurately identifying rebars under the difficult conditions.
Overall, CNN-2 consistently outperformed CNN-1 across all bridges. CNN-2 achieved higher precision, recall, and F1-scores, demonstrating its superior reliability in rebar detection while minimizing false detections and missed rebars. These results highlight the advantage of using the dual-channel approach in CNN-2 for improved rebar detection accuracy.
6. Conclusions
Rebar detection is a foundational step in GPR data analysis, as variations in reflection amplitude can indicate changes in concrete condition or rebar integrity. Accurate localization of rebars enables the identification of regions potentially affected by deterioration, providing critical input for structural assessment. Manual identification of rebar signatures in GPR B-scans, however, is labor-intensive due to the high density of hyperbolic reflections generated during GPR surveys. To address these limitations, this paper proposes a CNN-based framework that integrates migrated B-scans as a secondary input channel, thereby enhancing feature discrimination for automated rebar data extraction. The proposed models were validated using GPR datasets acquired from three in-service bridges in Nebraska, USA, and their performance was systematically compared. The findings highlight the potential of dual-channel architectures to significantly enhance the automation and accuracy of rebar detection in complex field conditions. The key findings are summarized as follows:
- Dual-channel input optimization The inclusion of migrated B-scans as a secondary input channel improves rebar detection performance. This is attributed to the complementary signatures of rebar reflections: hyperbolic patterns in raw B-scans and concentrated high-amplitude foci in migrated images. The CNN-2 model, trained on dual-channel data, outperformed the single-channel CNN-1 model across all evaluation metrics, particularly in achieving higher F1-scores, reflecting improved precision and recall.
- Robustness to structural degradation Bridge condition influences rebar detection reliability. CNN-2 demonstrates superior performance over CNN-1 on decks rated both “Fair” and “Poor” by NBI. In deteriorated (“Poor”-condition) decks, CNN-2 exhibits fewer missed rebars and reduced false positives compared to CNN-1, underscoring its robustness in handling structural degradation that complicates hyperbola morphology in raw B-scans.
- Limitations of single-channel training The CNN-1 model was trained on single-channel raw images only to identify hyperbolic features. While it can detect most rebars in bridges with limited deterioration, it is prone to false positives due to other hyperbolic patterns that resemble rebars. In bridges with poor deck conditions, the CNN-1 model misses many rebars and generates a high number of false positives. In contrast, CNN-2 significantly reduces false positives by using dual-channel inputs, producing amplitude maps that align more closely with the ground-truth maps.
- Generalizability across deck overlays The CNN-2 model was trained and validated on GPR data collected from a variety of in-service bridges, each with different overlay conditions: bare concrete, concrete overlay, and asphalt overlay. Field testing of the CNN-2 model demonstrates its reliability and accuracy in rebar detection. This approach reduces the need for manual processing, enhancing the efficiency of GPR-based bridge deck assessments.
While the dual-channel CNN shows clear advantages, some practical limitations remain. The current fixed-size region-of-interest may limit generalization to decks with varying cover depths or scanning resolutions. Future work should focus on implementing adaptive RoI strategies and exploring lightweight CNN architectures for real-time deployment in GPR systems. Expanding the dataset with diverse field conditions and extending the framework to detect additional subsurface features may also improve robustness and applicability.
Author Contributions
J.Z. conceived and designed the research; J.Z. acquired funding and administered the research project; S.P. collected data and developed the analysis program; M.R. developed and applied code for result generation and finalized the results; all authors contributed to data analysis, writing of the original draft, and manuscript revisions. All authors have read and agreed to the published version of the manuscript.
Funding
This research was funded by the Nebraska Department of Transportation under projects FY21(012) and FY23(022).
Institutional Review Board Statement
Not applicable.
Informed Consent Statement
Not applicable.
Data Availability Statement
Data available on request due to privacy restrictions.
Acknowledgments
The authors would like to thank staff members at the Department of Transportation for their supports in providing the bridges information and the arrangements of the traffic controls in the field testing.
Conflicts of Interest
The authors declare no conflicts of interest.
References
- Wang, Z.W.; Zhou, M.; Slabaugh, G.G.; Zhai, J.; Fang, T. Automatic Detection of Bridge Deck Condition From Ground Penetrating Radar Images. IEEE Trans. Autom. Sci. Eng. 2011, 8, 633–640. [Google Scholar] [CrossRef]
- Dinh, K.; Gucunski, N.; Duong, T.H. An algorithm for automatic localization and detection of rebars from GPR data of concrete bridge decks. Autom. Constr. 2018, 89, 292–298. [Google Scholar] [CrossRef]
- Pashoutani, S.; Zhu, J. Ground penetrating radar data processing for concrete bridge deck evaluation. J. Bridge Eng. 2020, 25, 04020030. [Google Scholar] [CrossRef]
- Wong, P.T.-W.; Lai, W.W.-L. Characterization of Complex Dielectric Permittivity of Concrete by GPR Numerical Simulation and Spectral Analysis. J. Nondestruct. Eval. 2021, 41, 1. [Google Scholar] [CrossRef]
- Wang, Y.; Cui, G.; Xu, J. Semi-automatic detection of buried rebar in GPR data using a genetic algorithm. Autom. Constr. 2020, 114, 103186. [Google Scholar] [CrossRef]
- Ma, X.; Liu, H.; Wang, M.L.; Birken, R. Automatic detection of steel rebar in bridge decks from ground penetrating radar data. J. Appl. Geophys. 2018, 158, 93–102. [Google Scholar] [CrossRef]
- Park, S.; Kim, J.; Jeong, S.; Park, S. GPR Data-Based Computer Vision for the Detection of Material Buried Underground. In Proceedings of the 2019 3rd International Conference on Smart Grid and Smart Cities (ICSGSC), Berkeley, CA, USA, 25–28 June 2019; pp. 41–44. [Google Scholar] [CrossRef]
- Zheng, J.; Peng, S.-P.; Yang, F. A novel edge detection for buried target extraction after SVD-2D wavelet processing. J. Appl. Geophys. 2014, 106, 106–113. [Google Scholar] [CrossRef]
- Liu, Y.; Wang, M.; Cai, Q. The target detection for GPR images based on curve fitting. In Proceedings of the 2010 3rd International Congress on Image and Signal Processing, Yantai, China, 16–18 October 2010; Volume 6, pp. 2876–2879. [Google Scholar] [CrossRef]
- Lei, W.; Man, M.; Shi, R.; Liu, G.; Gu, Q. Target detection based on automatic threshold edge detection and template matching algorithm in GPR. In Proceedings of the 2018 IEEE 3rd Advanced Information Technology, Electronic and Automation Control Conference (IAEAC), Chongqing, China, 12–14 October 2018; pp. 1406–1410. [Google Scholar] [CrossRef]
- Dinh, K.; Gucunski, N.; Duong, T.H. Migration-based automated rebar picking for condition assessment of concrete bridge decks with ground penetrating radar. NDT E Int. 2018, 98, 45–54. [Google Scholar] [CrossRef]
- Park, S.; Kim, J.; Jeon, K.; Kim, J.; Park, S. Improvement of GPR-Based Rebar Diameter Estimation Using YOLO-v3. Remote Sens. 2021, 13, 2011. [Google Scholar] [CrossRef]
- Barkataki, N.; Tiru, B.; Sarma, U. A CNN model for predicting size of buried objects from GPR B-Scans. J. Appl. Geophys. 2022, 200, 104620. [Google Scholar] [CrossRef]
- Faris, N.; Zayed, T.; Fares, A.; Abdelkhalek, S.; Abdelkader, E.M. Automated rebar recognition and corrosion assessment of concrete bridge decks using ground penetrating radar. Autom. Constr. 2024, 166, 105631. [Google Scholar] [CrossRef]
- Asadi, P.; Gindy, M.; Alvarez, M.; Asadi, A. A computer vision based rebar detection chain for automatic processing of concrete bridge deck GPR data. Autom. Constr. 2020, 112, 103106. [Google Scholar] [CrossRef]
- Xiang, Z.; Rashidi, A.; Ou, G.G. An Improved Convolutional Neural Network System for Automatically Detecting Rebar in GPR Data. In Computing in Civil Engineering 2019; American Society of Civil Engineers: Reston, VA, USA, 2019; pp. 422–429. [Google Scholar] [CrossRef]
- Li, C.; Cai, N.; Pu, T.; Yang, X.; Liu, H.; Wang, L. Rebar Recognition Using Multi-Hyperbolic Attention in Faster R-CNN. Appl. Sci. 2025, 15, 367. [Google Scholar] [CrossRef]
- Pashoutani, S.; Zhu, J.; Sim, C.; Won, K.; Mazzeo, B.A.; Guthrie, W.S. Multi-sensor data collection and fusion using autoencoders in condition evaluation of concrete bridge decks. J. Infrastruct. Preserv. Resil. 2021, 2, 18. [Google Scholar] [CrossRef]
- Pashoutani, S.; Zhu, J. Real depth-correction in ground penetrating RADAR data analysis for bridge deck evaluation. Sensors 2023, 23, 1027. [Google Scholar] [CrossRef] [PubMed]
- Yelf, R. Where is true time zero? In Proceedings of the Tenth International Conference on Grounds Penetrating Radar (GPR 2004), Delft, The Netherlands, 21–24 June 2004; Volume 1, pp. 279–282. [Google Scholar]
- Garcia, D.; Tarnec, L.L.; Muth, S.; Montagnon, E.; Porée, J.; Cloutier, G. Stolt’s f-k migration for plane wave ultrasound imaging. IEEE Trans. Ultrason. Ferroelectr. Freq. Control 2013, 60, 1853–1867. [Google Scholar] [CrossRef] [PubMed]
- Girshick, R.; Donahue, J.; Darrell, T.; Malik, J. Rich Feature Hierarchies for Accurate Object Detection and Semantic Segmentation. In Proceedings of the 2014 IEEE Conference on Computer Vision and Pattern Recognition, Columbus, OH, USA, 23–28 June 2014; pp. 580–587. [Google Scholar] [CrossRef]
- Uijlings, J.R.R.; van de Sande, K.E.A.; Gevers, T.; Smeulders, A.W.M. Selective Search for Object Recognition. Int. J. Comput. Vis. 2013, 104, 154–171. [Google Scholar] [CrossRef]
- Deng, L. The MNIST Database of Handwritten Digit Images for Machine Learning Research [Best of the Web]. IEEE Signal Process. Mag. 2012, 29, 141–142. [Google Scholar] [CrossRef]
- Federal Highway Administration. Long-Term Bridge Performance (LTBP) Program InfoBridge. Available online: https://infobridge.fhwa.dot.gov/Data (accessed on 7 January 2025).
- Federal Highway Administration. Recording and Coding Guide for the Structure Inventory and Appraisal of the Nation’s Bridges; Technical Report FHWA-PD-96-001; U.S. Department of Transportation: Washington, DC, USA, 1995.


Disclaimer/Publisher’s Note: The statements, opinions and data contained in all publications are solely those of the individual author(s) and contributor(s) and not of MDPI and/or the editor(s). MDPI and/or the editor(s) disclaim responsibility for any injury to people or property resulting from any ideas, methods, instructions or products referred to in the content. |
© 2025 by the authors. Licensee MDPI, Basel, Switzerland. This article is an open access article distributed under the terms and conditions of the Creative Commons Attribution (CC BY) license (https://creativecommons.org/licenses/by/4.0/).