Article

The Effects of Particle Radius, Porosity, and Void Distribution on the Compressive Strength of Cellular Concrete

ERIC-LaGCHEC, Ecole Hassania des Travaux Publics (EHTP), Casablanca 8108, Morocco
*
Author to whom correspondence should be addressed.
Constr. Mater. 2025, 5(1), 15; https://doi.org/10.3390/constrmater5010015
Submission received: 10 January 2025 / Revised: 19 February 2025 / Accepted: 10 March 2025 / Published: 13 March 2025

Abstract

:
Foamed concrete, a lightweight material with excellent thermal insulation and low density, is increasingly popular in construction. This study uses the discrete element method (DEM) to simulate the compressive behavior of foamed concrete, analyzing the effects of particle radius, porosity, and void distribution. The results highlight the important role of geometric and material parameters. Smaller particle radii improve packing density and strength, while a uniform void distribution maximizes compressive strength by minimizing stress concentration. This information provides a basis for optimizing the design of foamed concrete for better mechanical performance and wider applications in sustainable construction.

1. Introduction

Foamed concrete, a lightweight building material made of cement, water, and a foaming agent, is becoming more and more popular because of its special advantages, which include a reduced density and improved thermal insulation [1,2]. The discrete element method (DEM), a numerical technique that models the response of materials at the particle level, is used in this work to investigate the mechanical behavior of cellular concrete [3]. Cellular concrete is an innovative building material that provides a cost-effective and sustainable solution for many construction applications [4,5]. Foamed concrete is a durable material that can be used to build foundations, walls, roofs, and floors [4].
This study uses (DEM) to investigate how particle size, porosity, and void distribution affect the strength of cellular concrete. The goal is to understand how these factors influence mechanical performance and improve material design. It is expected that larger particles create more voids, reducing strength, while higher porosity weakens the material by limiting load transfer. Additionally, the way voids are distributed plays a crucial role—uniformly spread voids improve strength, whereas clustered voids create weak spots that lead to failure. The simulations provide a detailed analysis of these effects under compression, helping to predict material behavior and optimize concrete properties.
The mechanical behavior of cellular concrete poses unique modeling challenges due to its heterogeneous structure of solid phases incorporated with air voids [6,7]. Numerous investigations have been conducted to experimentally understand the behavior of this material [6,7,8,9]. However, accurately characterizing its mechanical properties remains a challenge, particularly in capturing the complex interplay between embedded air spaces and the solid matrix [10]. While various numerical methods have been employed to simulate the material’s behavior, significant gaps persist in effectively representing both its mechanical response and microstructural characteristics [7,9]. The finite element method (FEM) is widely used to predict the overall behavior of concrete structures by modeling them as a continuous field [11]. However, FEM struggles to accurately capture the discrete and heterogeneous nature of concrete at smaller scales, where localized failures and microstructural effects play a crucial role. To address this limitation, the discrete element method (DEM) is employed to simulate concrete at the particle scale, representing the discrete interactions between material components [3,6]. DEM has been extensively used across various disciplines, including physics, materials science, geology, and engineering, to study the behavior of granular materials [
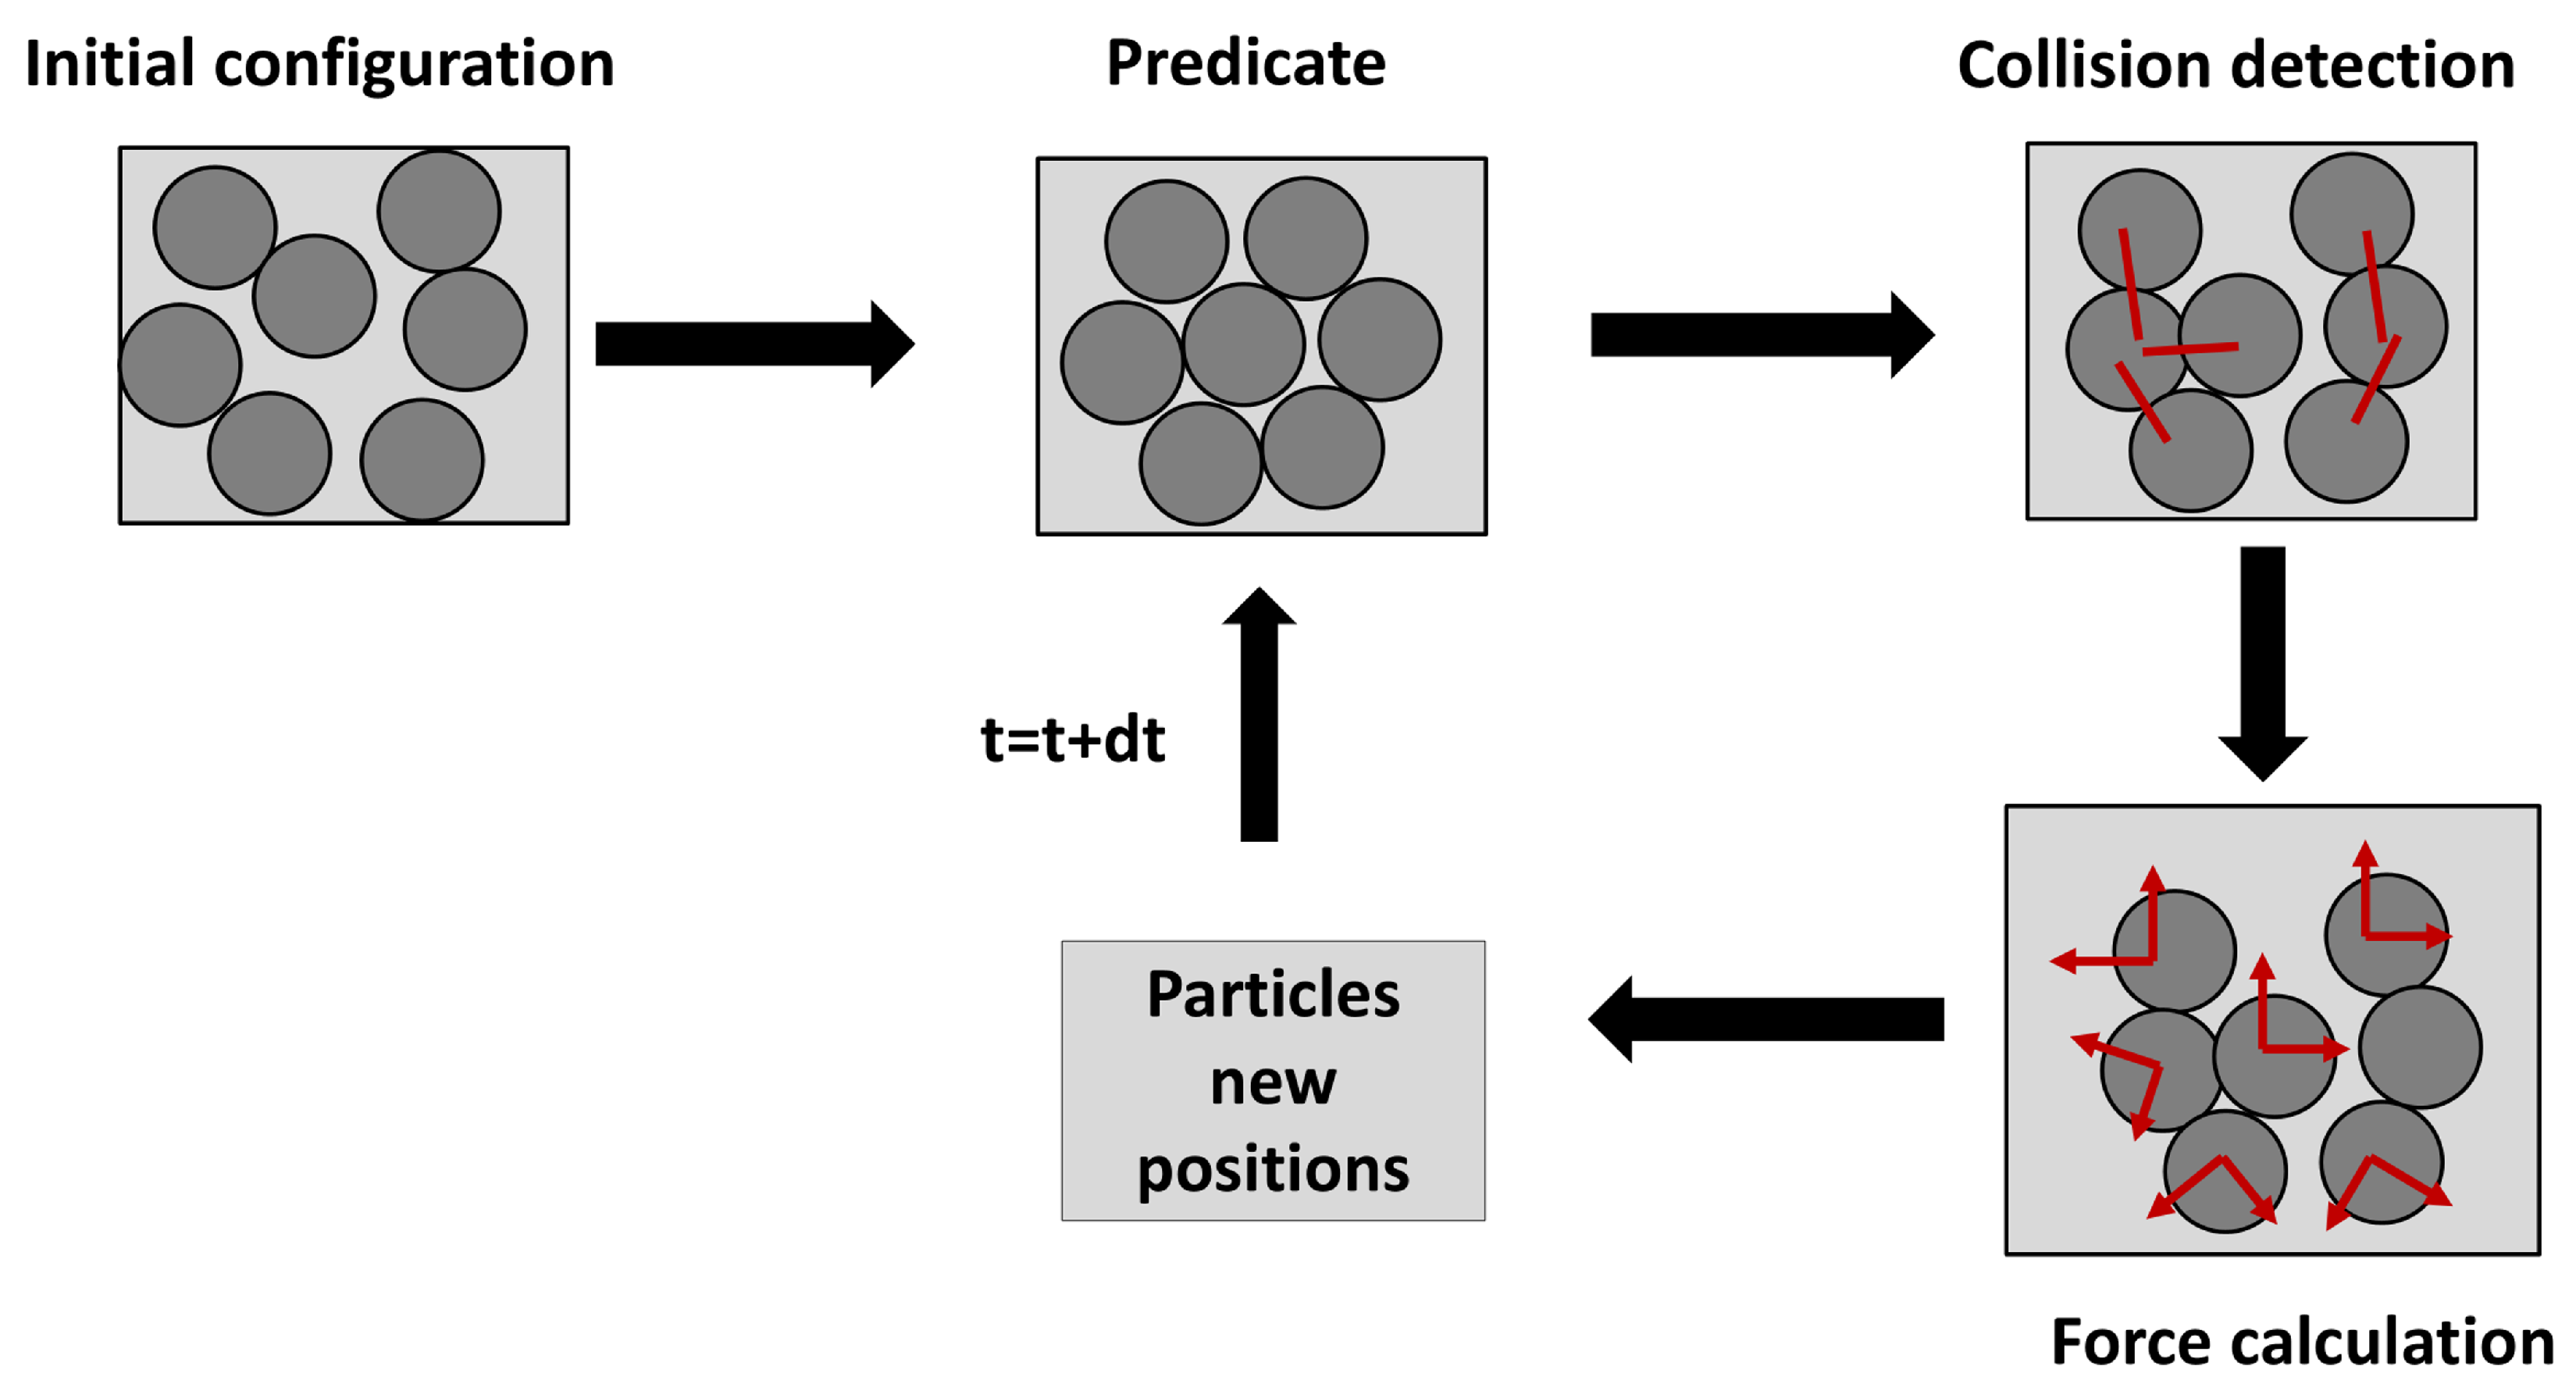
12]. Originally introduced by Cundall and Strack in 1979 for soil modeling [3], DEM represents a system as an assembly of discrete particles that interact through physical forces such as friction, collision, and gravity. The core principle of DEM relies on a numerical algorithm based on Newton’s laws of motion and contact laws governing particle interactions. By simulating the motion of each individual particle, DEM enables the prediction of macroscopic system behavior, including flow characteristics, packing density, and stress distribution. This makes DEM particularly useful for capturing the micro-mechanical behavior of cellular concrete, where the interaction between voids and the solid matrix significantly influences the overall mechanical response. The discrete element method (DEM) has emerged as a powerful numerical tool for simulating cellular concrete and other quasi-brittle materials, providing insights into fracture mechanics, mechanical properties, and multi-scale behaviors. Recent studies have demonstrated the efficacy of DEM in modeling concrete strength and crack propagation, with validated 3D models capturing stress–strain responses and energy release during fracture processes [13]. The interfacial transition zone (ITZ) has been identified as a critical factor influencing concrete mechanical properties, with DEM simulations revealing its dominant role over aggregate tensile strength [14]. Studies on cellular concrete have examined its behavior under autoclaving treatment, improving the understanding of internal heat generation and phase transformations [15]. The development of multi-scale DEM approaches, such as the discrete element-cell method (DECM), has allowed for a more comprehensive analysis of stress distributions in composite materials [16], and simulations of recycled concrete have highlighted the significant influence of ITZ on fracture behavior [17]. Thermal effects on DEM modeling have been examined in geothermal pavement bases, where temperature fluctuations influenced material stiffness and deformation [18], and in rheological analyses, where viscoelastic contact models were found to significantly affect asphalt concrete behavior [19]. Advanced applications of DEM have included tunnel concrete lining damage modeling under fire and explosion loads [20], as well as fresh concrete flowability predictions in slump and J-Ring tests, demonstrating high accuracy in flow behavior simulations [21]. While significant progress has been made in DEM modeling of cellular concrete, future research should focus on refining multi-scale simulations and enhancing experimental validations to further improve predictive accuracy and practical applications in engineering structures.
Conventional numerical techniques like the finite element method (FEM) have been used extensively for concrete modeling. Rezakhani et al. [7], for instance, created a mesoscale FEM to model the alkali-silica reaction in concrete, effectively capturing the cracking and expansion properties. Similar to this, Wei et al. [22] investigated the thermal characteristics of cellular concrete using the finite volume technique, concentrating on the heat transport mechanism. However, the particle interactions and distinct void distributions that significantly impact the mechanical response of cellular concrete are not captured by current continuum-based approaches, which are predicated on homogeneous material assumptions. A meso-equivalent element method was presented by Zhou et al. [6] to simulate foamed concrete with spherical pores, offering information on how the material will react to loading at the millimeter scale. Despite offering a more sophisticated understanding, this method highlights the necessity for more detailed explicit modeling techniques for air void systems. The works by Hentz et al. [23] and Oñate et al. [24] have successfully demonstrated the capability of the discrete element method (DEM) in capturing fine-scale interactions and complex damage mechanisms in reinforced concrete. Although these studies primarily address reinforced concrete, their methodologies indicate the potential of DEM for detailed simulation of particle–particle interactions and localized degradation processes, making it particularly promising for modeling discontinuous and porous materials such as cellular concrete.
Despite these advancements, few studies have used DEM to accurately model the microstructure of cellular concrete, especially when it comes to portraying the distribution of air voids. This limitation is important because the porosity of cellular concrete, which is directly connected to the size, distribution, and connection of these air voids, has a substantial impact on the material’s compressive strength [25]. Predicting the mechanical performance of cellular concrete requires an effective understanding of this connection.
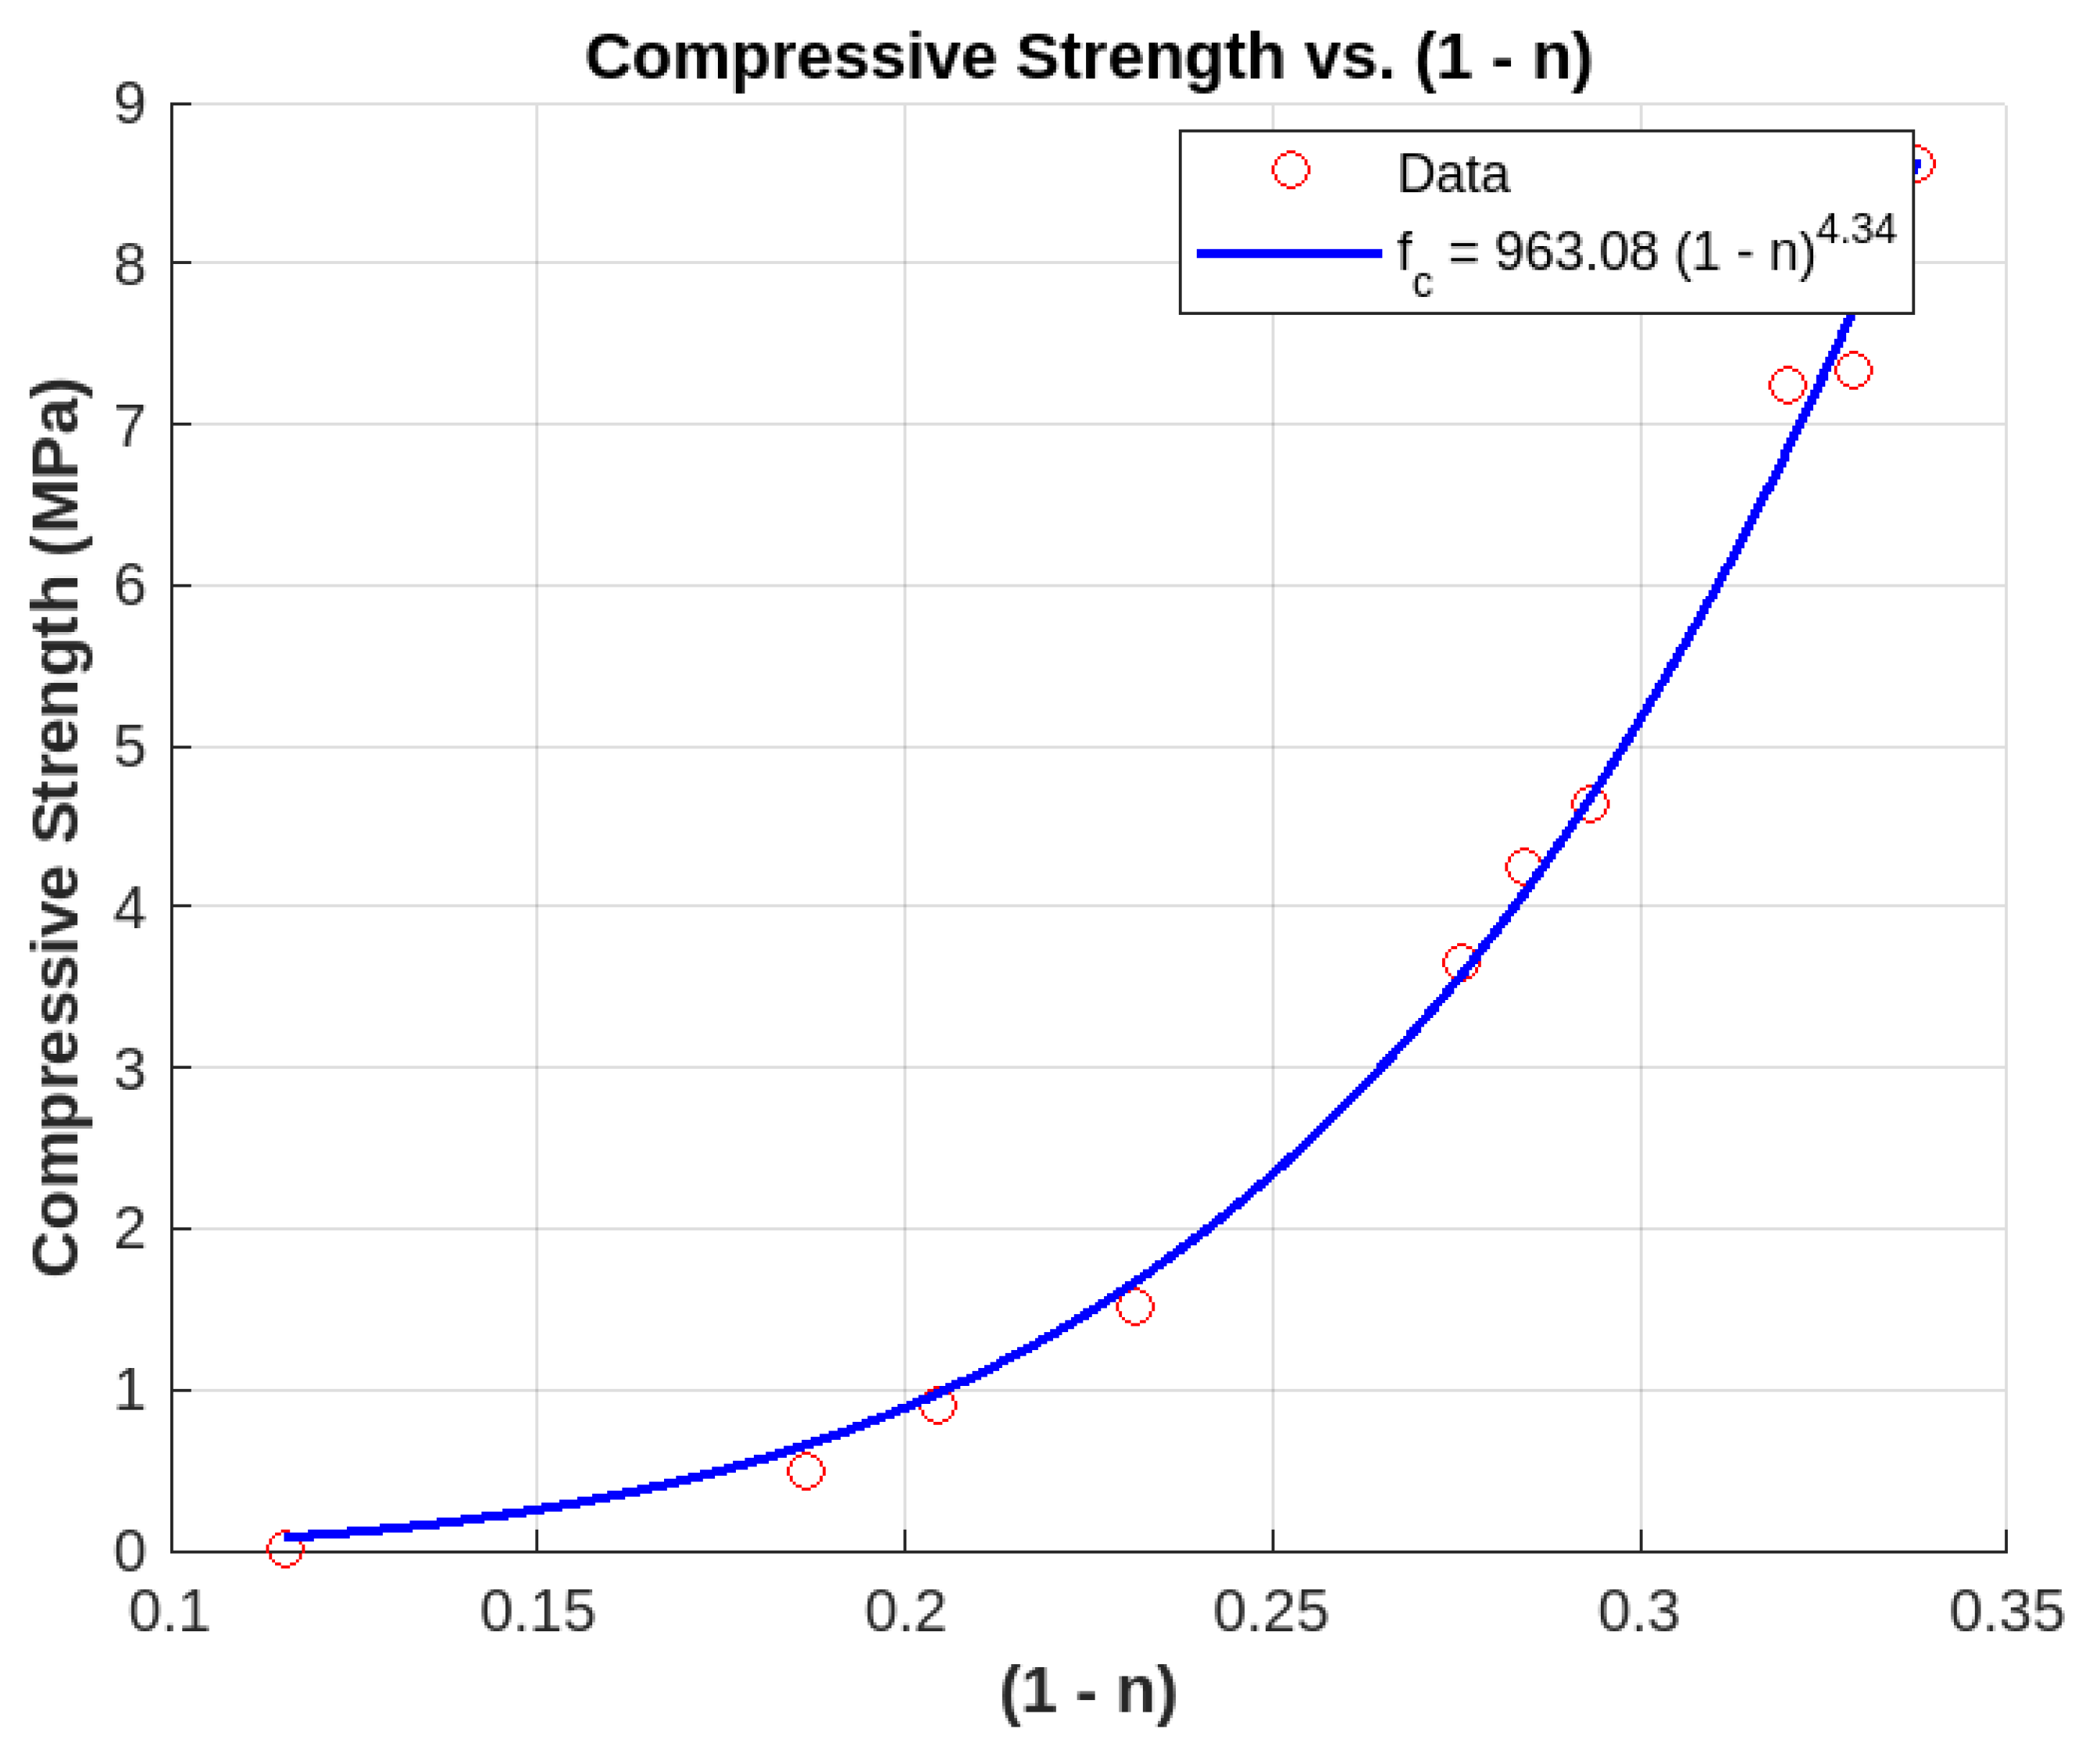
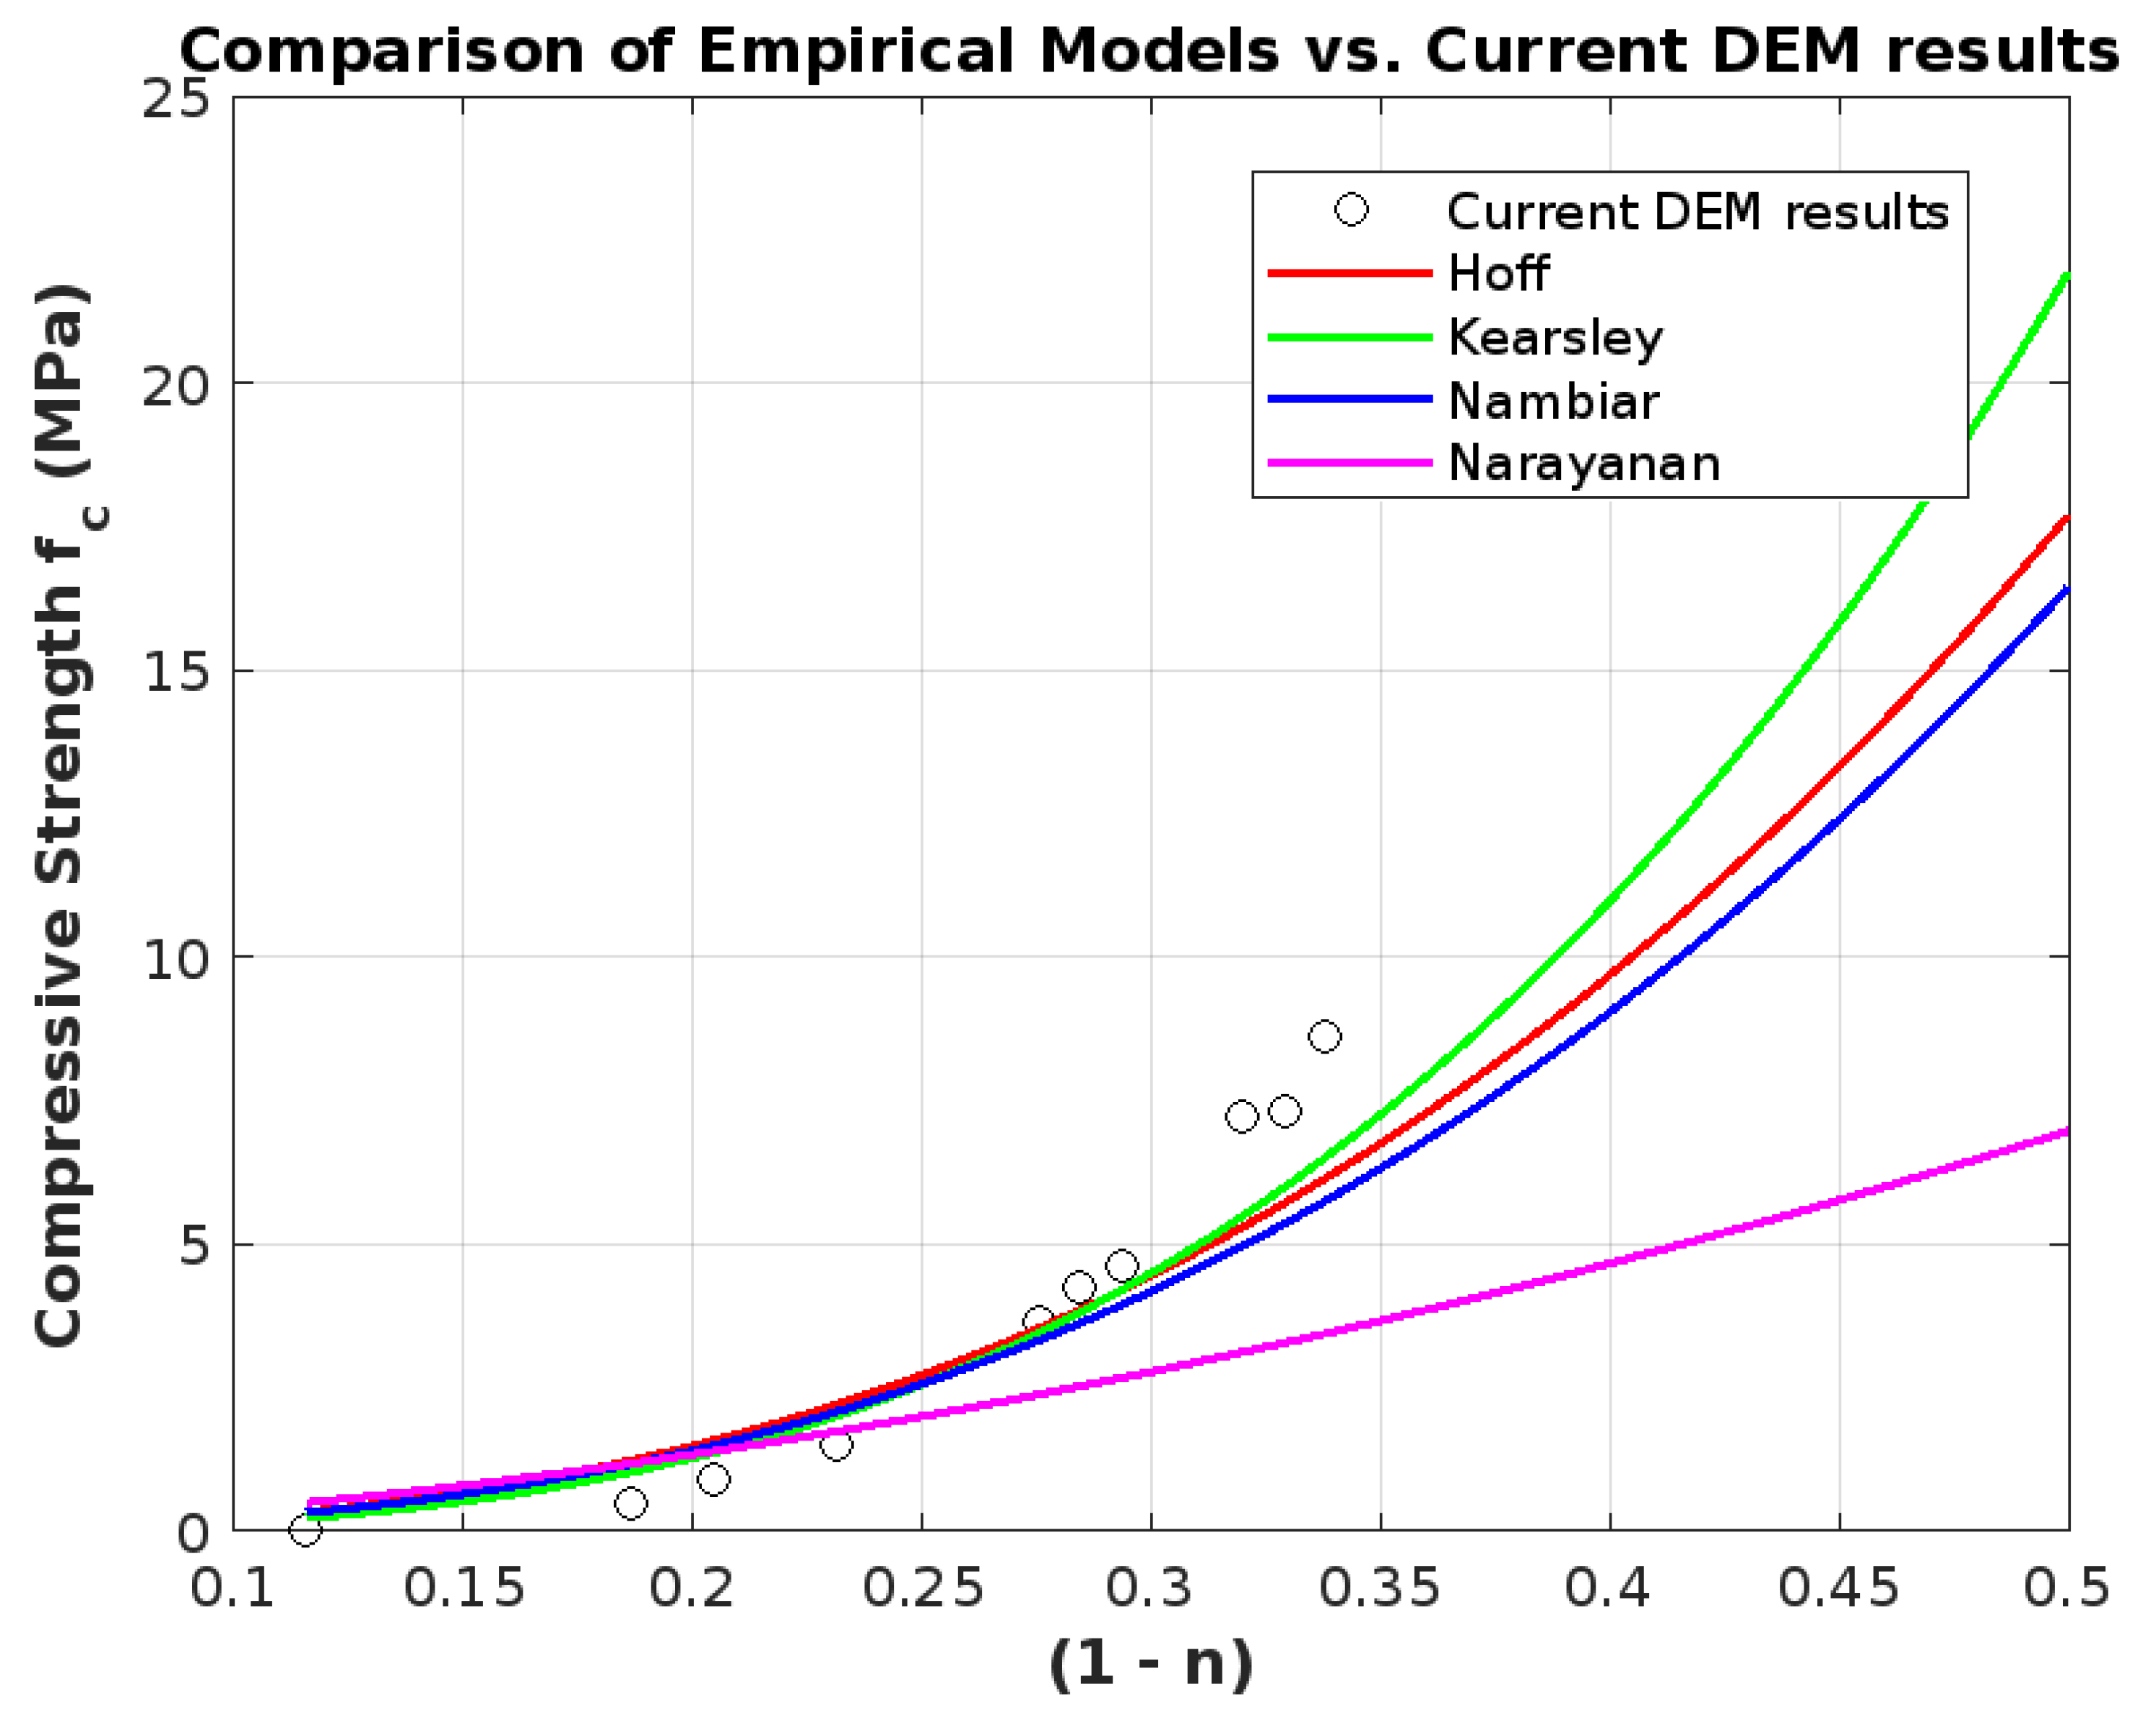
There are many models that predict the compressive strength of cellular concrete in the literature. In [25], a model based on the generalized model of Balshin has been studied and showed good results. The model is based on the following equation:
f c = σ 0 ( 1 n ) α
where f c is the compressive strength, n is the porosity, and σ 0 and α are two constants that depend on the formulation of cellular concrete.
Several mathematical models can be used to predict the compressive strength of foamed concrete. Kearsley and Wainwright [26] have suggested a model that links the density and porosity of foamed concrete to its compressive strength. Their equation’s general form is:
f c = A · ( 1 P ) n · ρ m
where: f c is the compressive strength (MPa), A, n, and m are empirical constants, P is the porosity, and ρ is the density (kg/m3).
Narayanan and Ramamurthy [27] have suggested a comparable relationship that accounts for the material’s density and porosity:
f c = k · ρ a · ( 1 P ) b
where: f c is the compressive strength (MPa), k, a, and b are constants, ρ is the density (kg/m3), and P is the porosity (fraction).
Furthermore, Hoff [25] established a porosity-based relationship in which the porosity of cellular concrete has an inverse relationship with its compressive strength:
f c = C ( 1 P ) n
where: f c is the compressive strength (MPa), C and n are constants determined empirically, and P is the porosity (fraction).
Table 1 summarizes different equations in the literature for the values of these two constants.
Although these analytical models provide useful compressive strength predictions, they are limited by the fact that they do not take into consideration the intricate microstructure of cellular concrete or the interactions between particles and voids. Conversely, the discrete element method (DEM) can model particle-level interactions and void distribution, yielding a more precise compressive strength prediction [3].
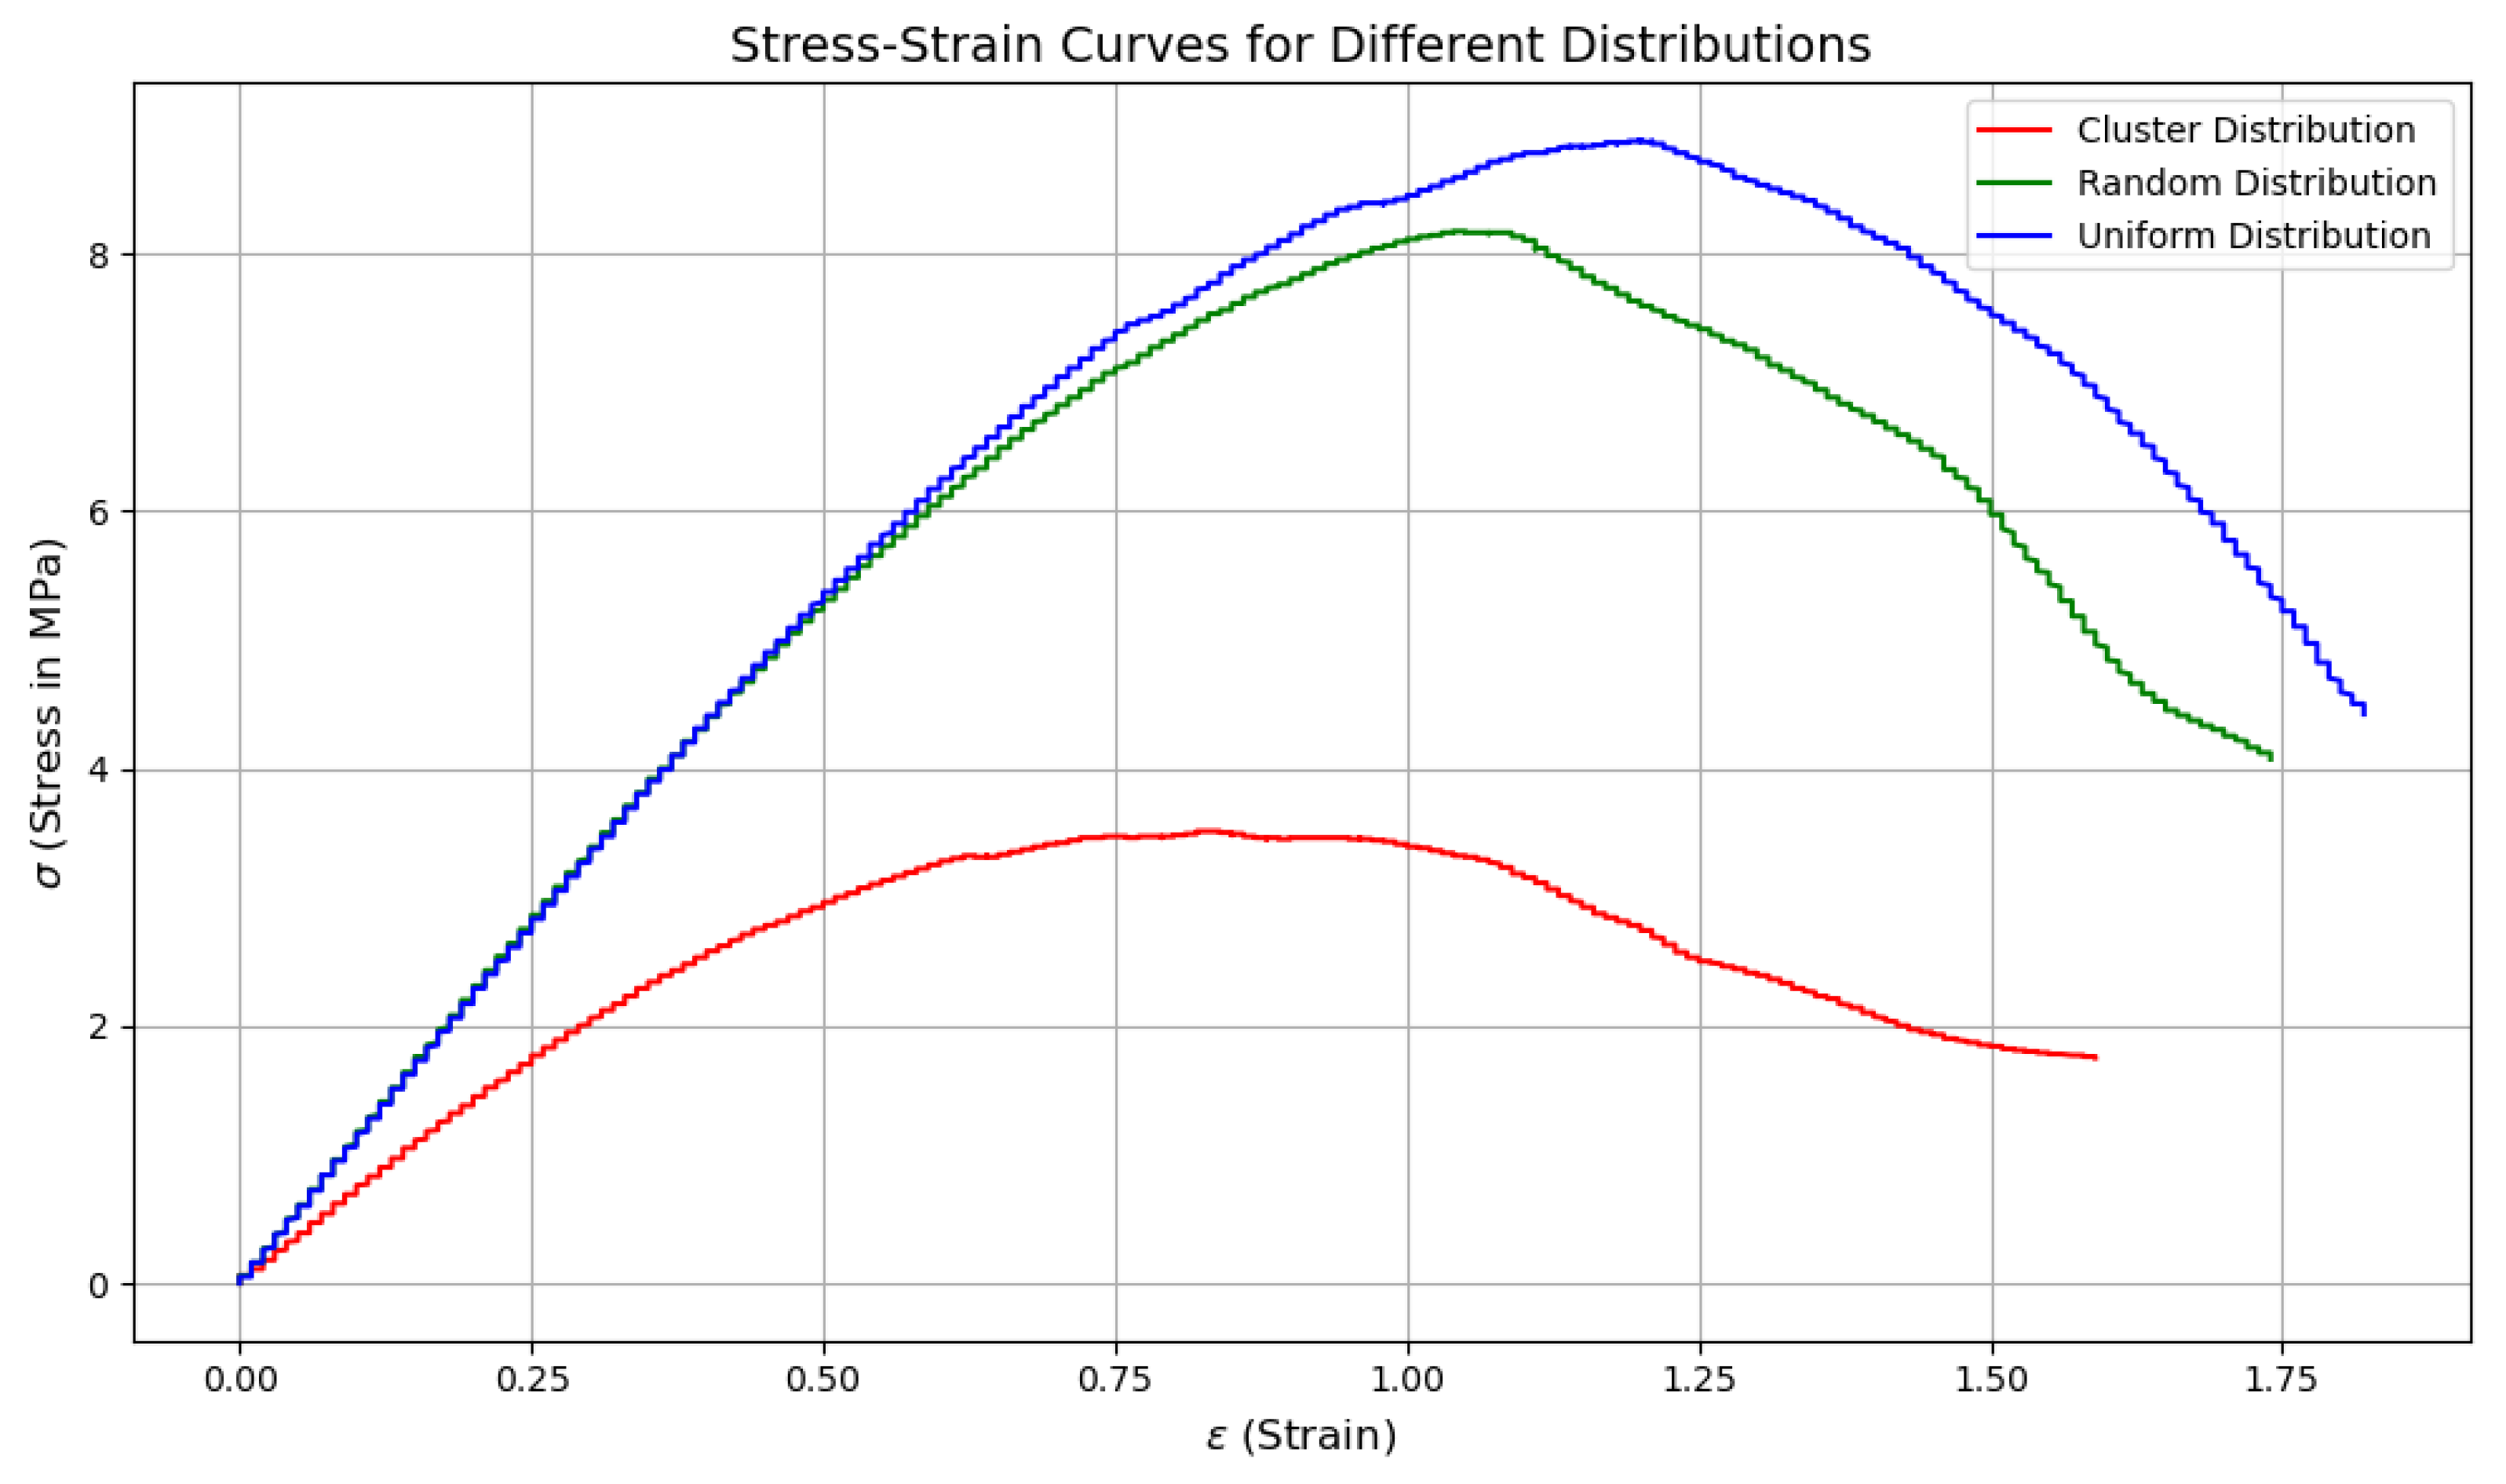
The distribution of voids has a significant impact on how cellular concrete behaves mechanically. Uniform distributions and other homogeneous void designs have been demonstrated to enhance stress distribution and slow the spread of cracks by reducing localized stress concentrations [29]. Clustered voids, on the other hand, create weak spots in the material that cause it to collapse too soon under loading circumstances [29]. Nguyen et al. [10] investigated the impact of voids on the compressive behavior of foamed concrete through both computational and experimental methods. Their results demonstrated that while void clustering considerably weakens the material, uniform void distributions improve load transmission efficiency. Likewise, non-uniform void placement negatively impacts mechanical strength, especially at greater porosity levels, as shown by Narayanan and Ramamurthy [27].
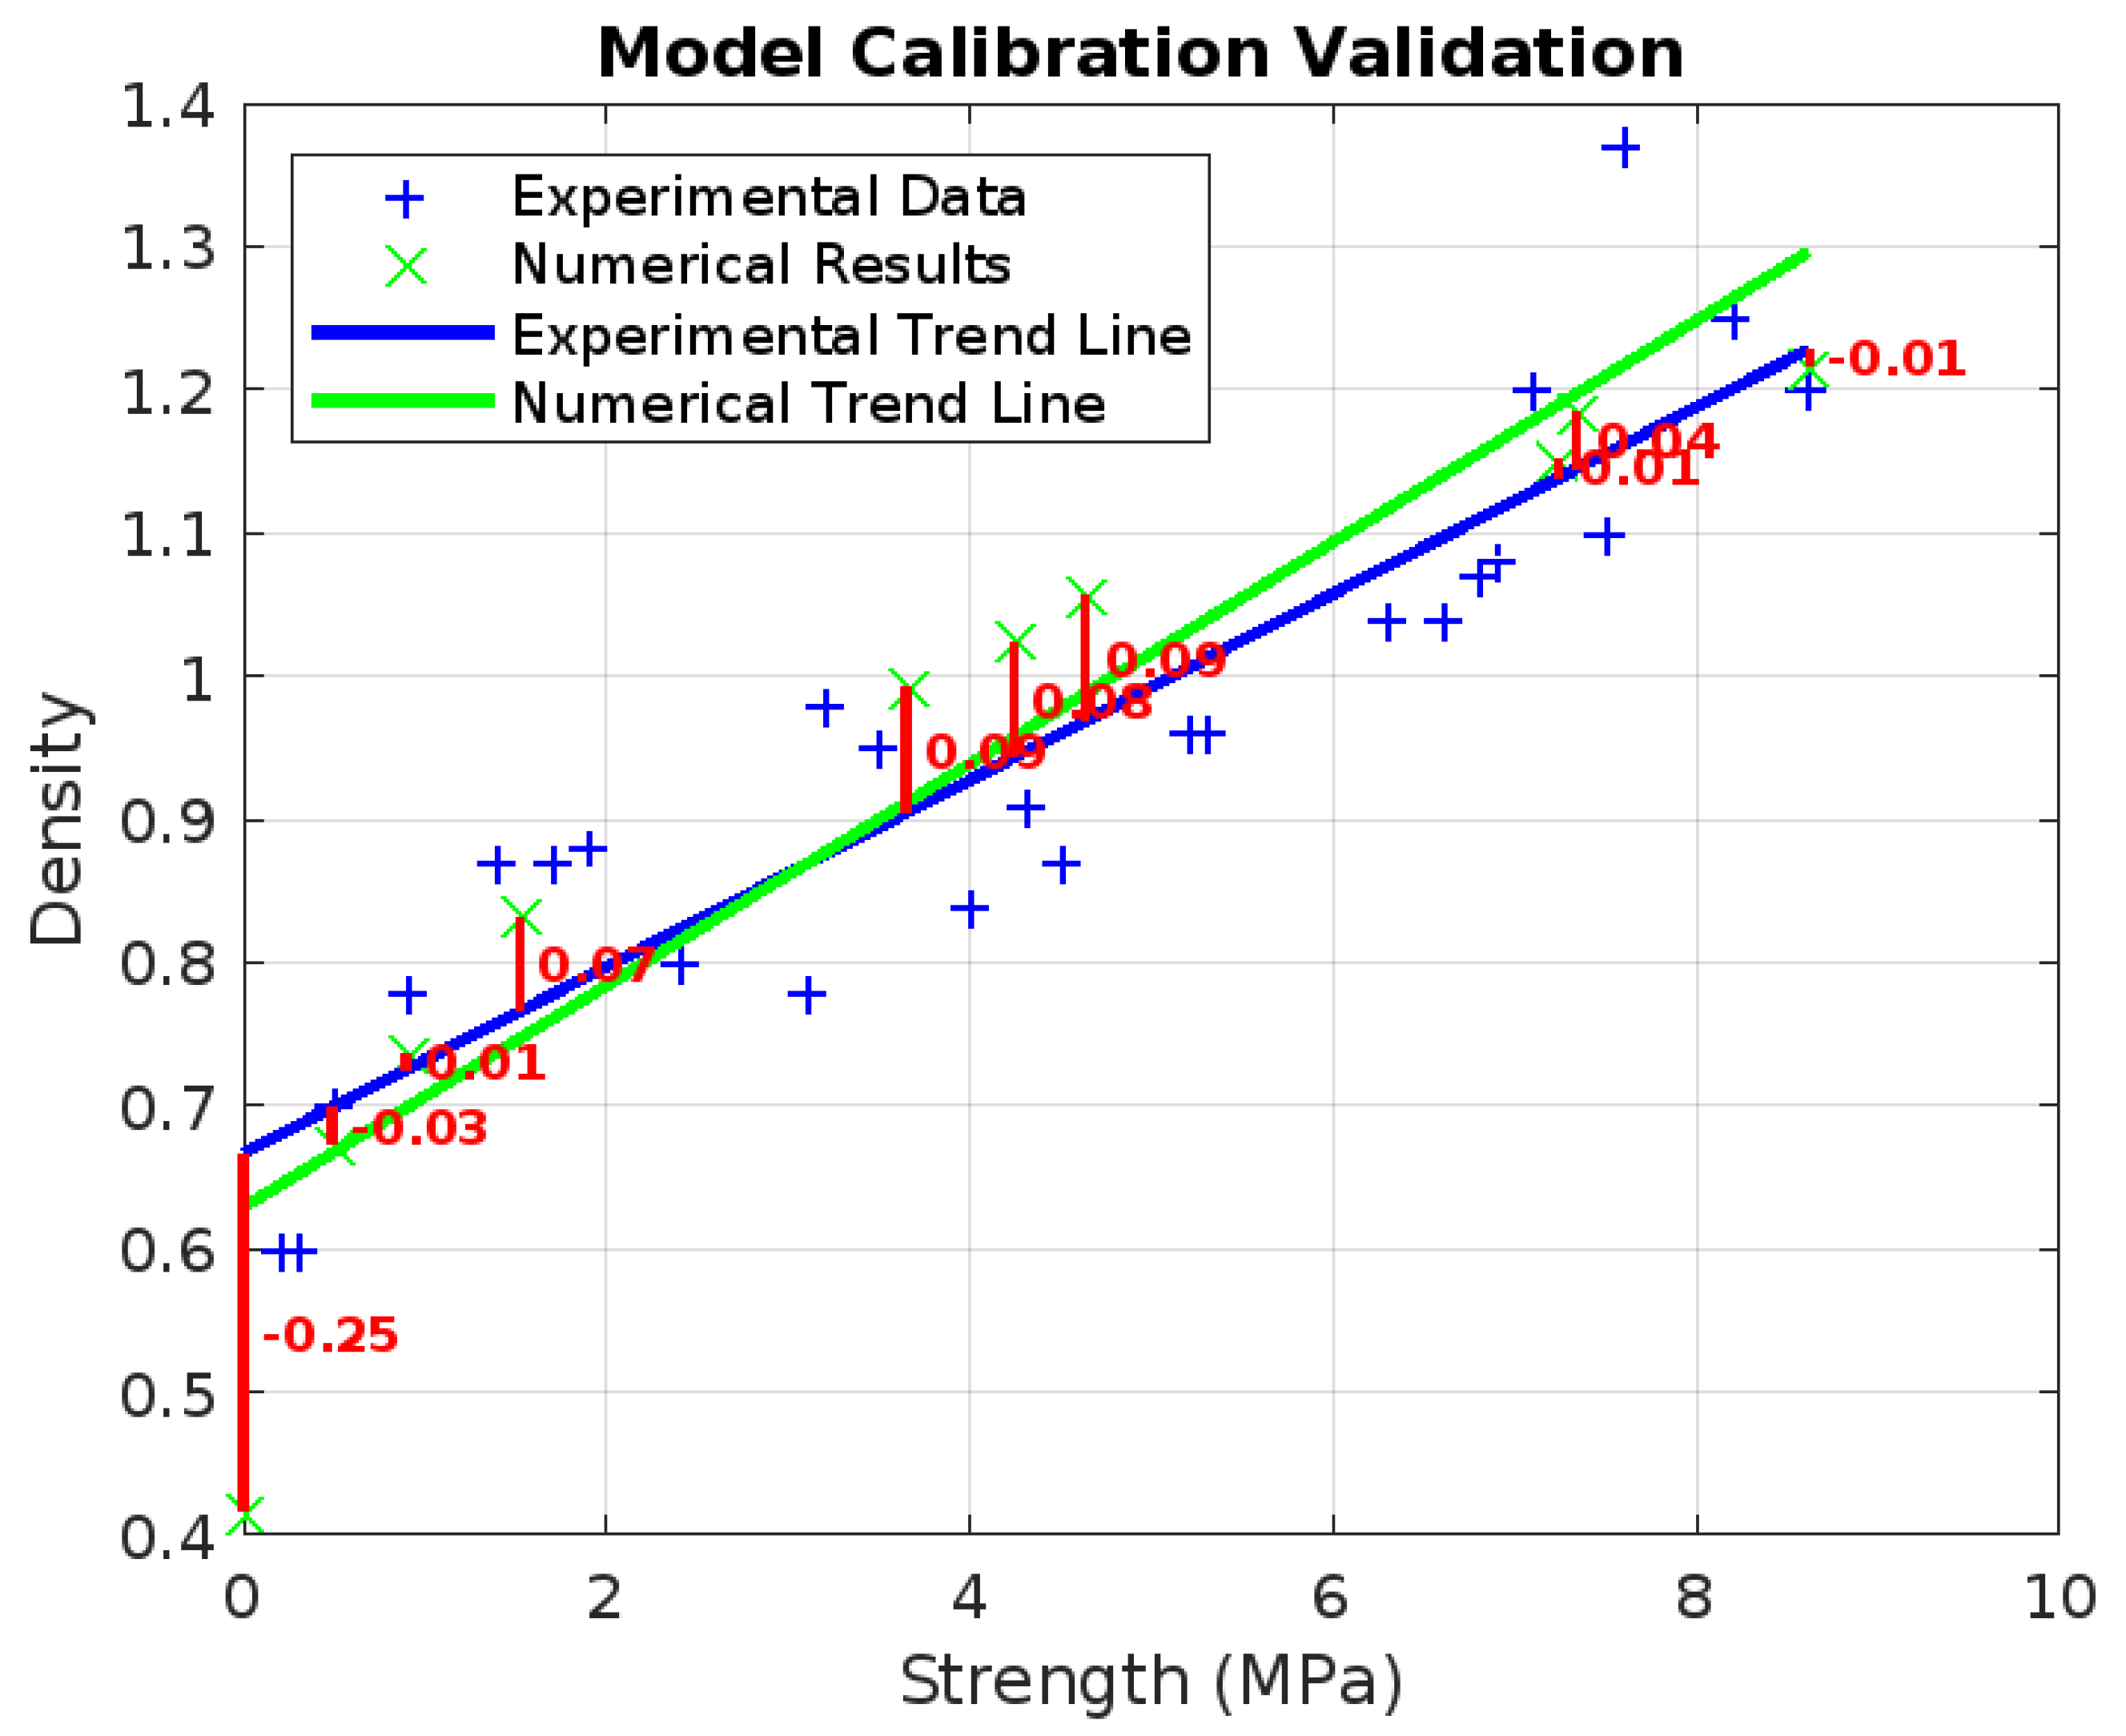
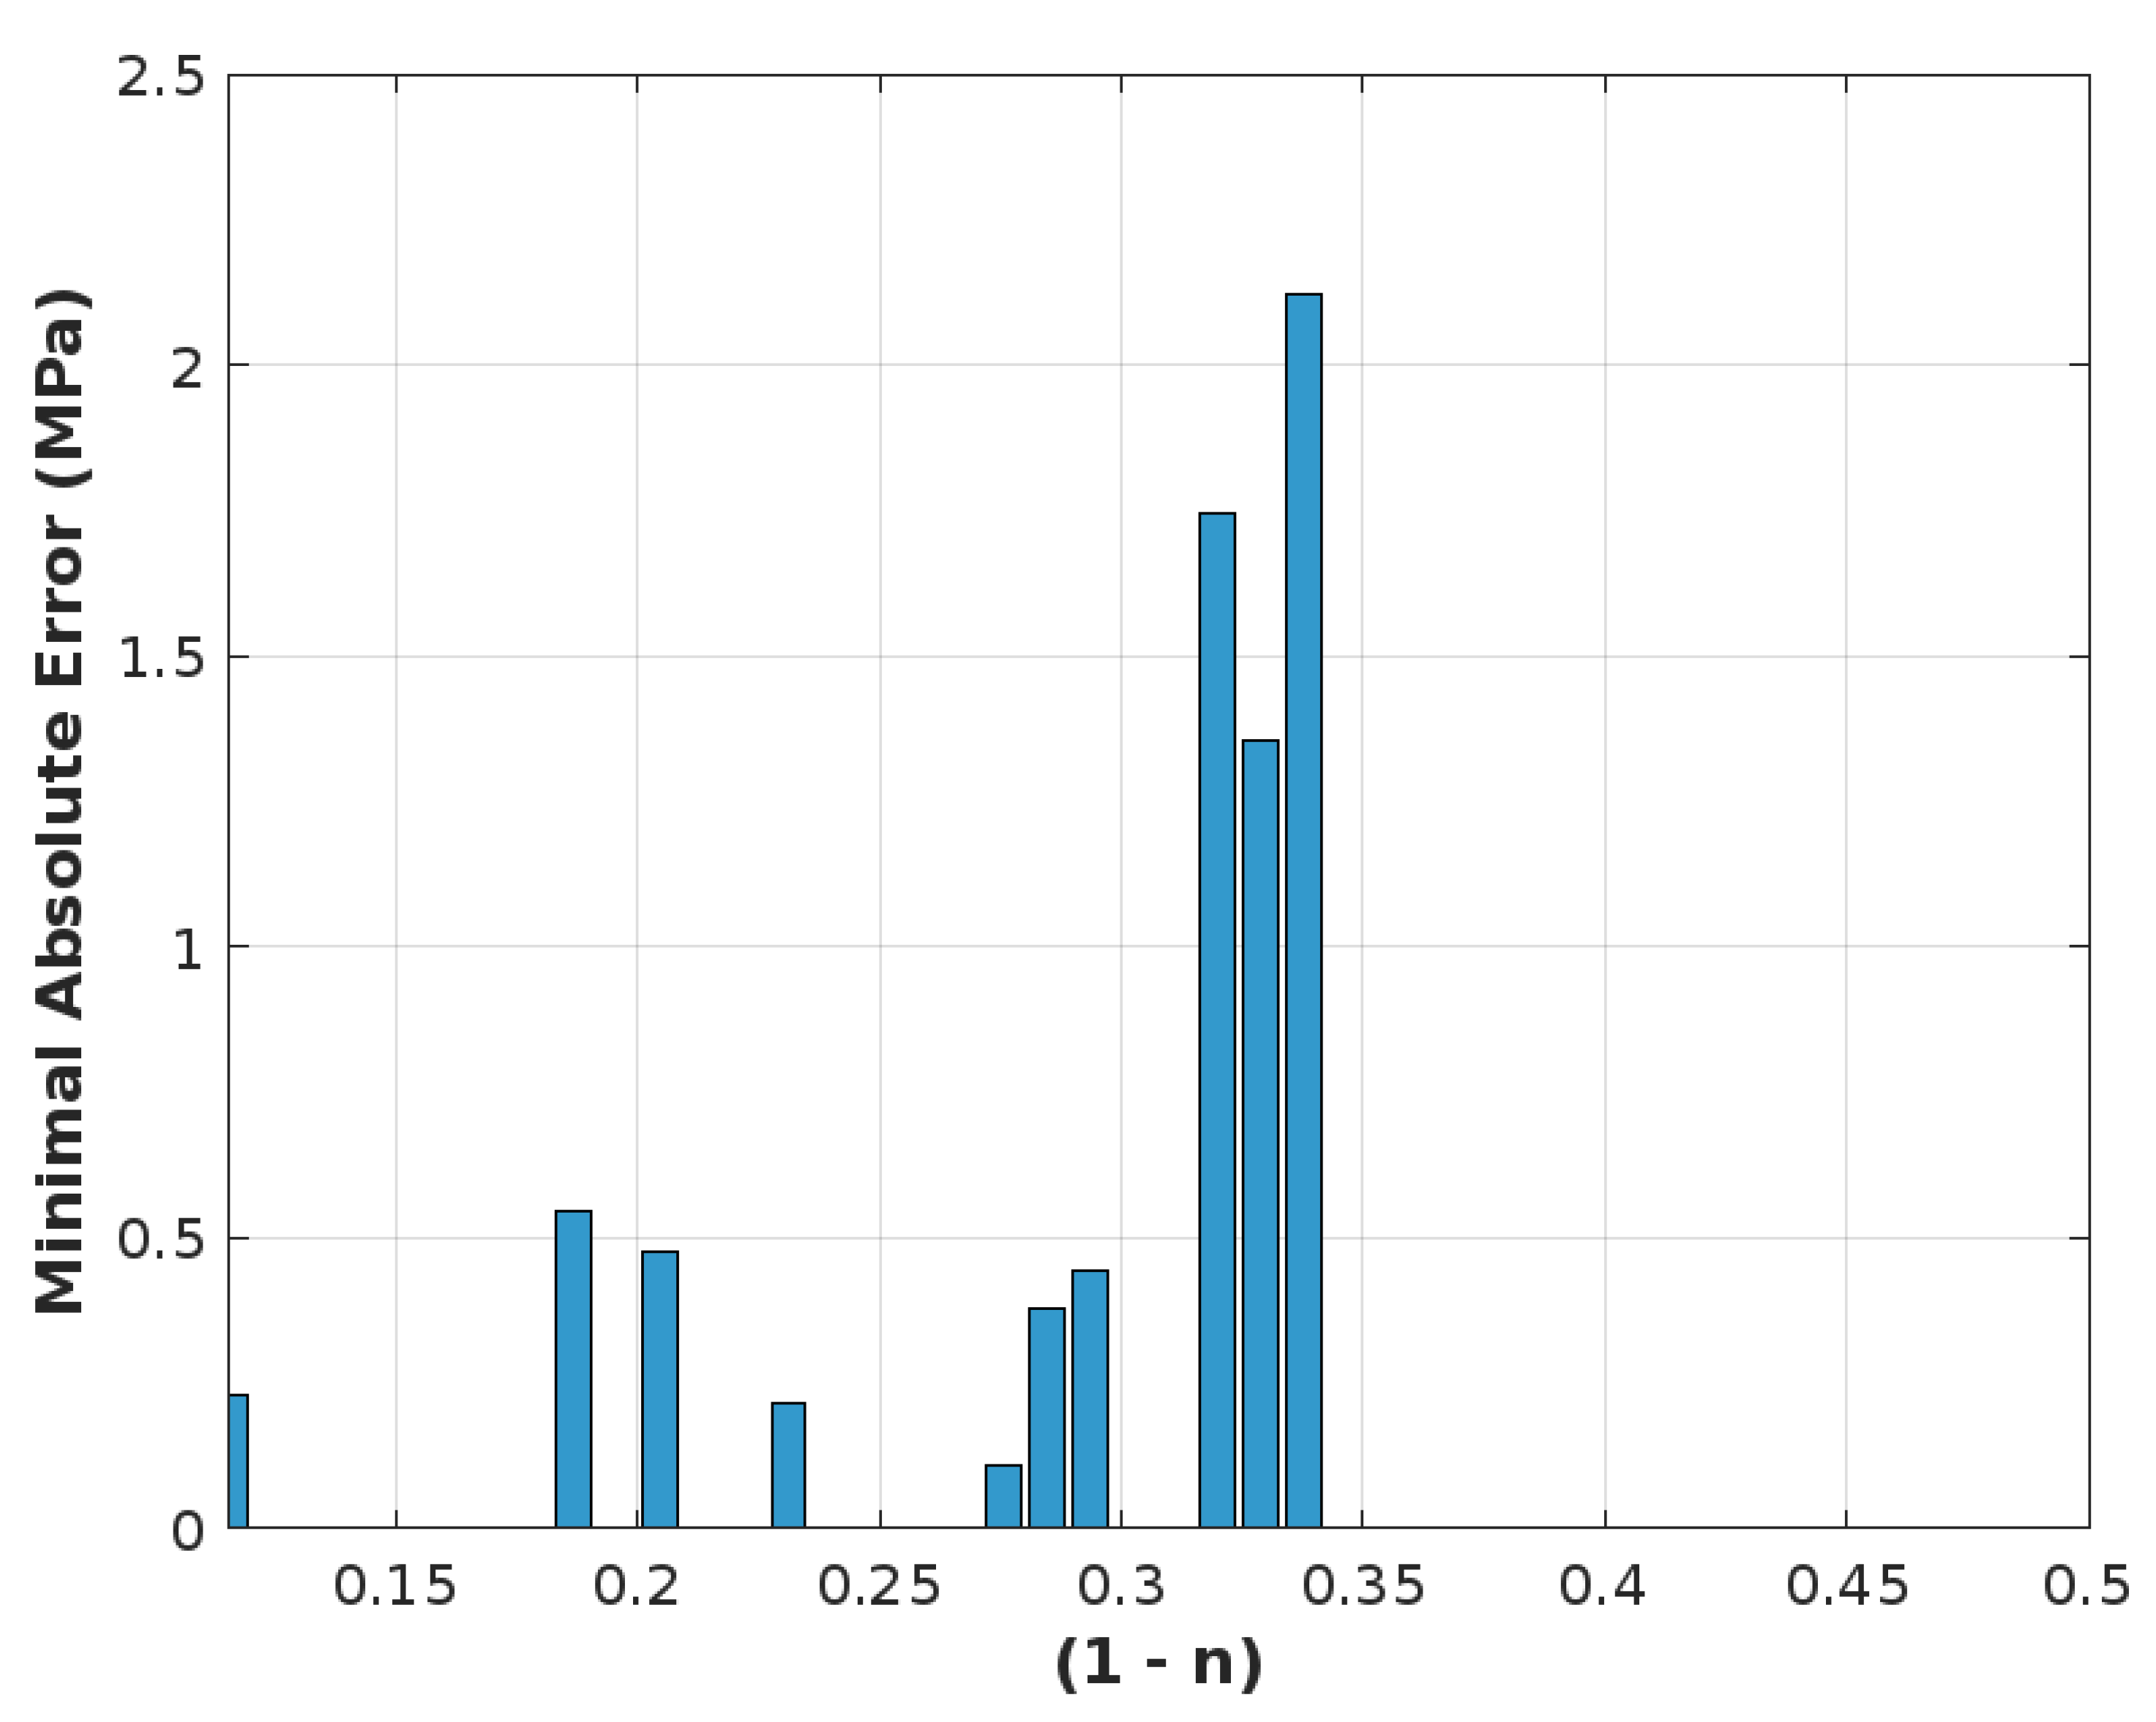
To correctly predict the behavior of cellular concrete, numerical models must be calibrated. In order to match numerical results with experimental data, the Discrete Element Method (DEM) necessitates meticulous calibration of factors including particle size, contact stiffness, and porosity [30]. To produce precise compressive strength predictions. In [10], Nguyen et al. verified their numerical model and found a high correlation between experimental values and simulation results. Density and void distribution were the main criteria used in their calibration process to develop the model.
Our work attempts to close the gaps in the application of DEM to cellular concrete, specifically in the creation of realistic air void models. These contributions have the potential to advance knowledge and use of cellular concrete in structural and sustainable engineering contexts, laying the groundwork for more environmentally friendly and effective building materials.
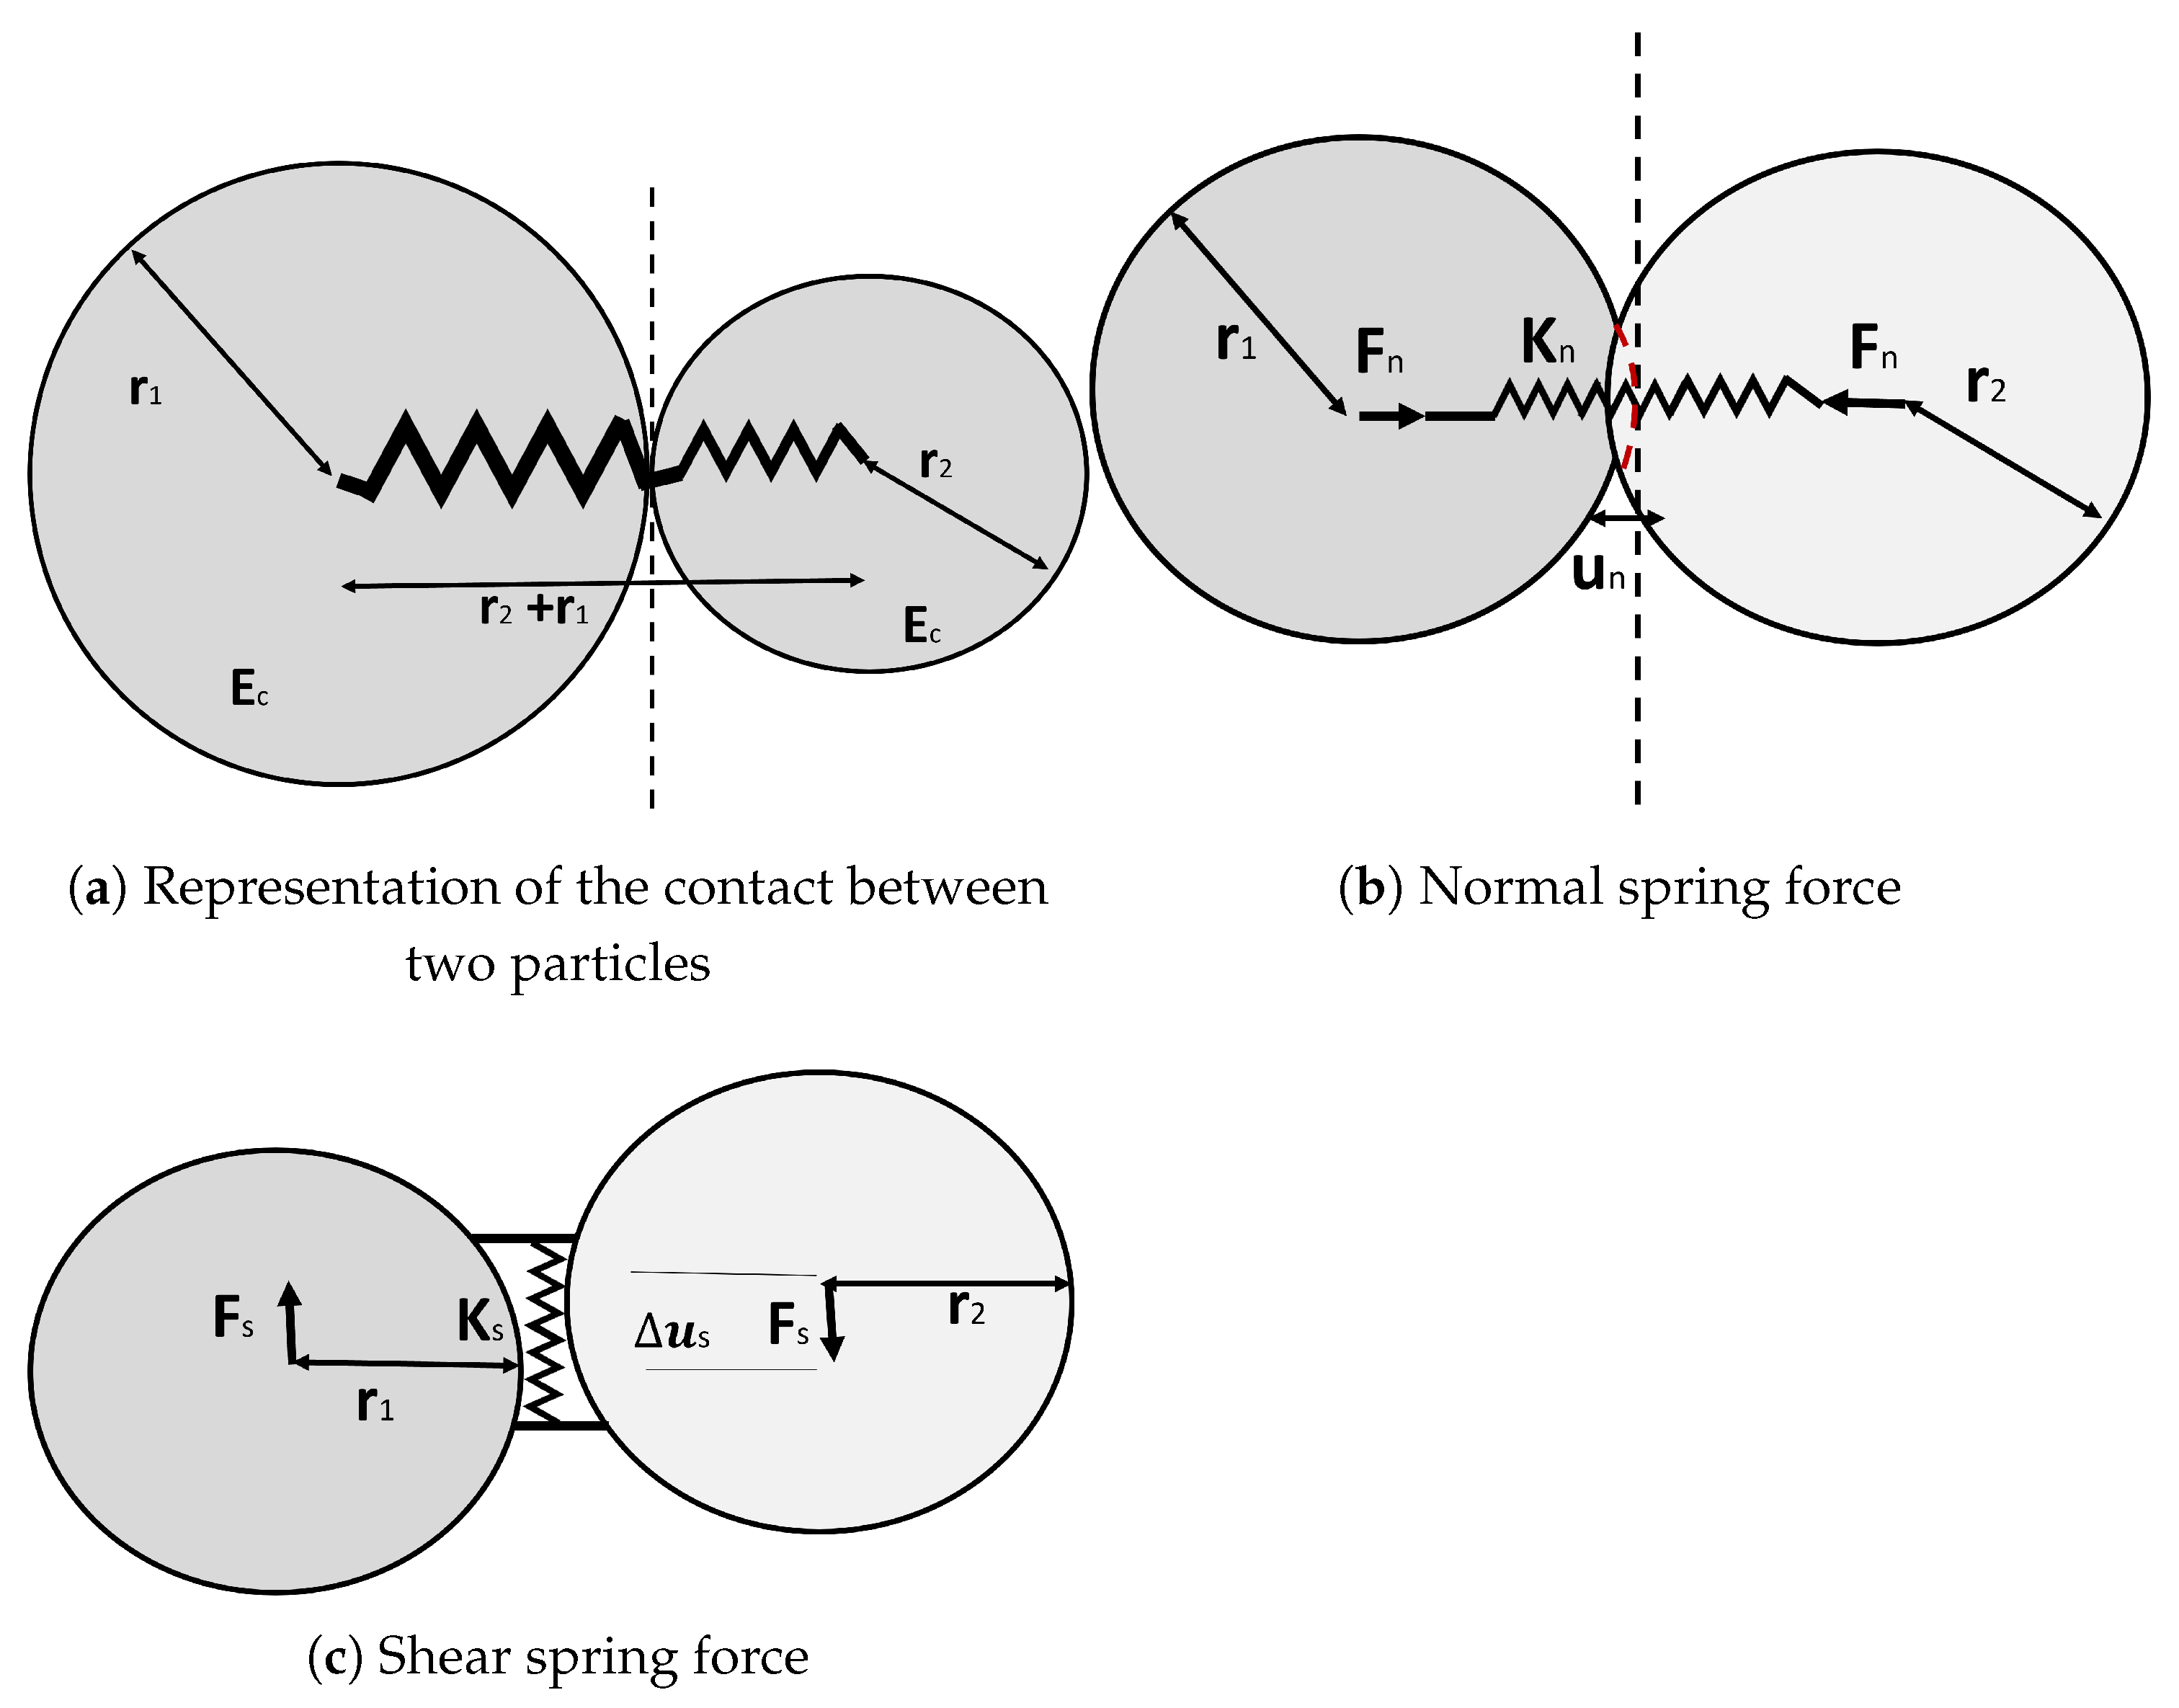
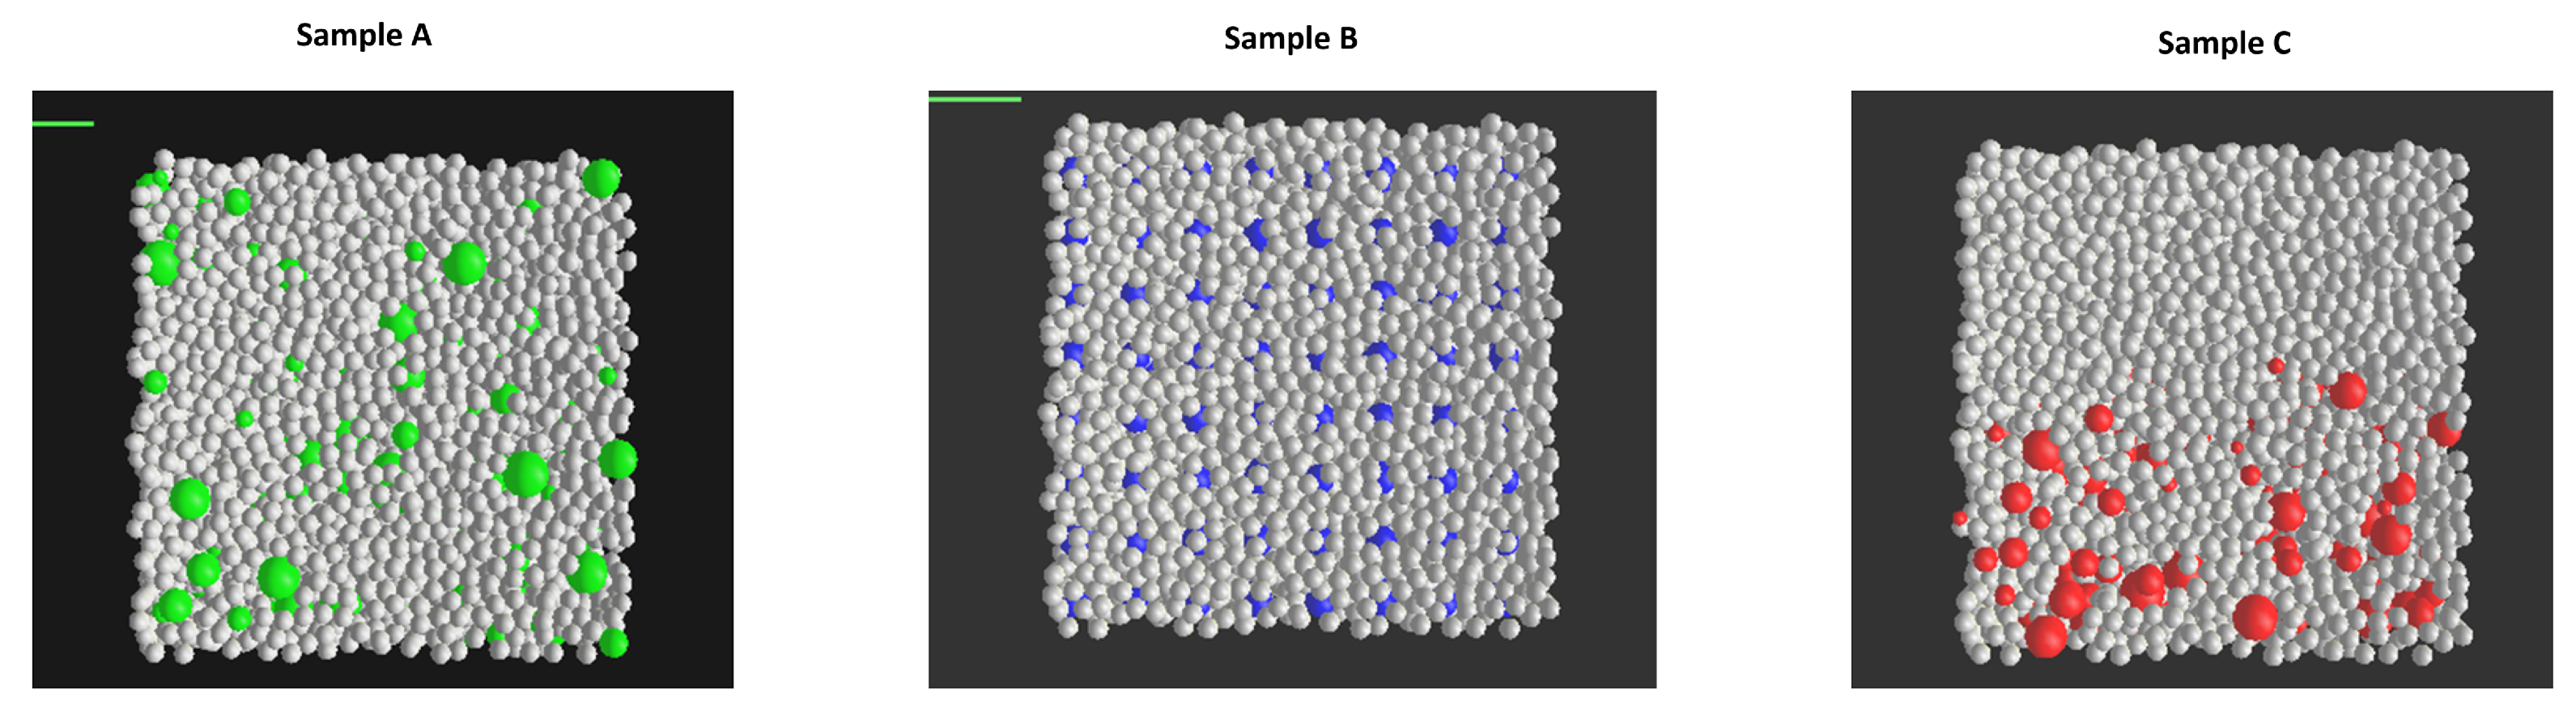
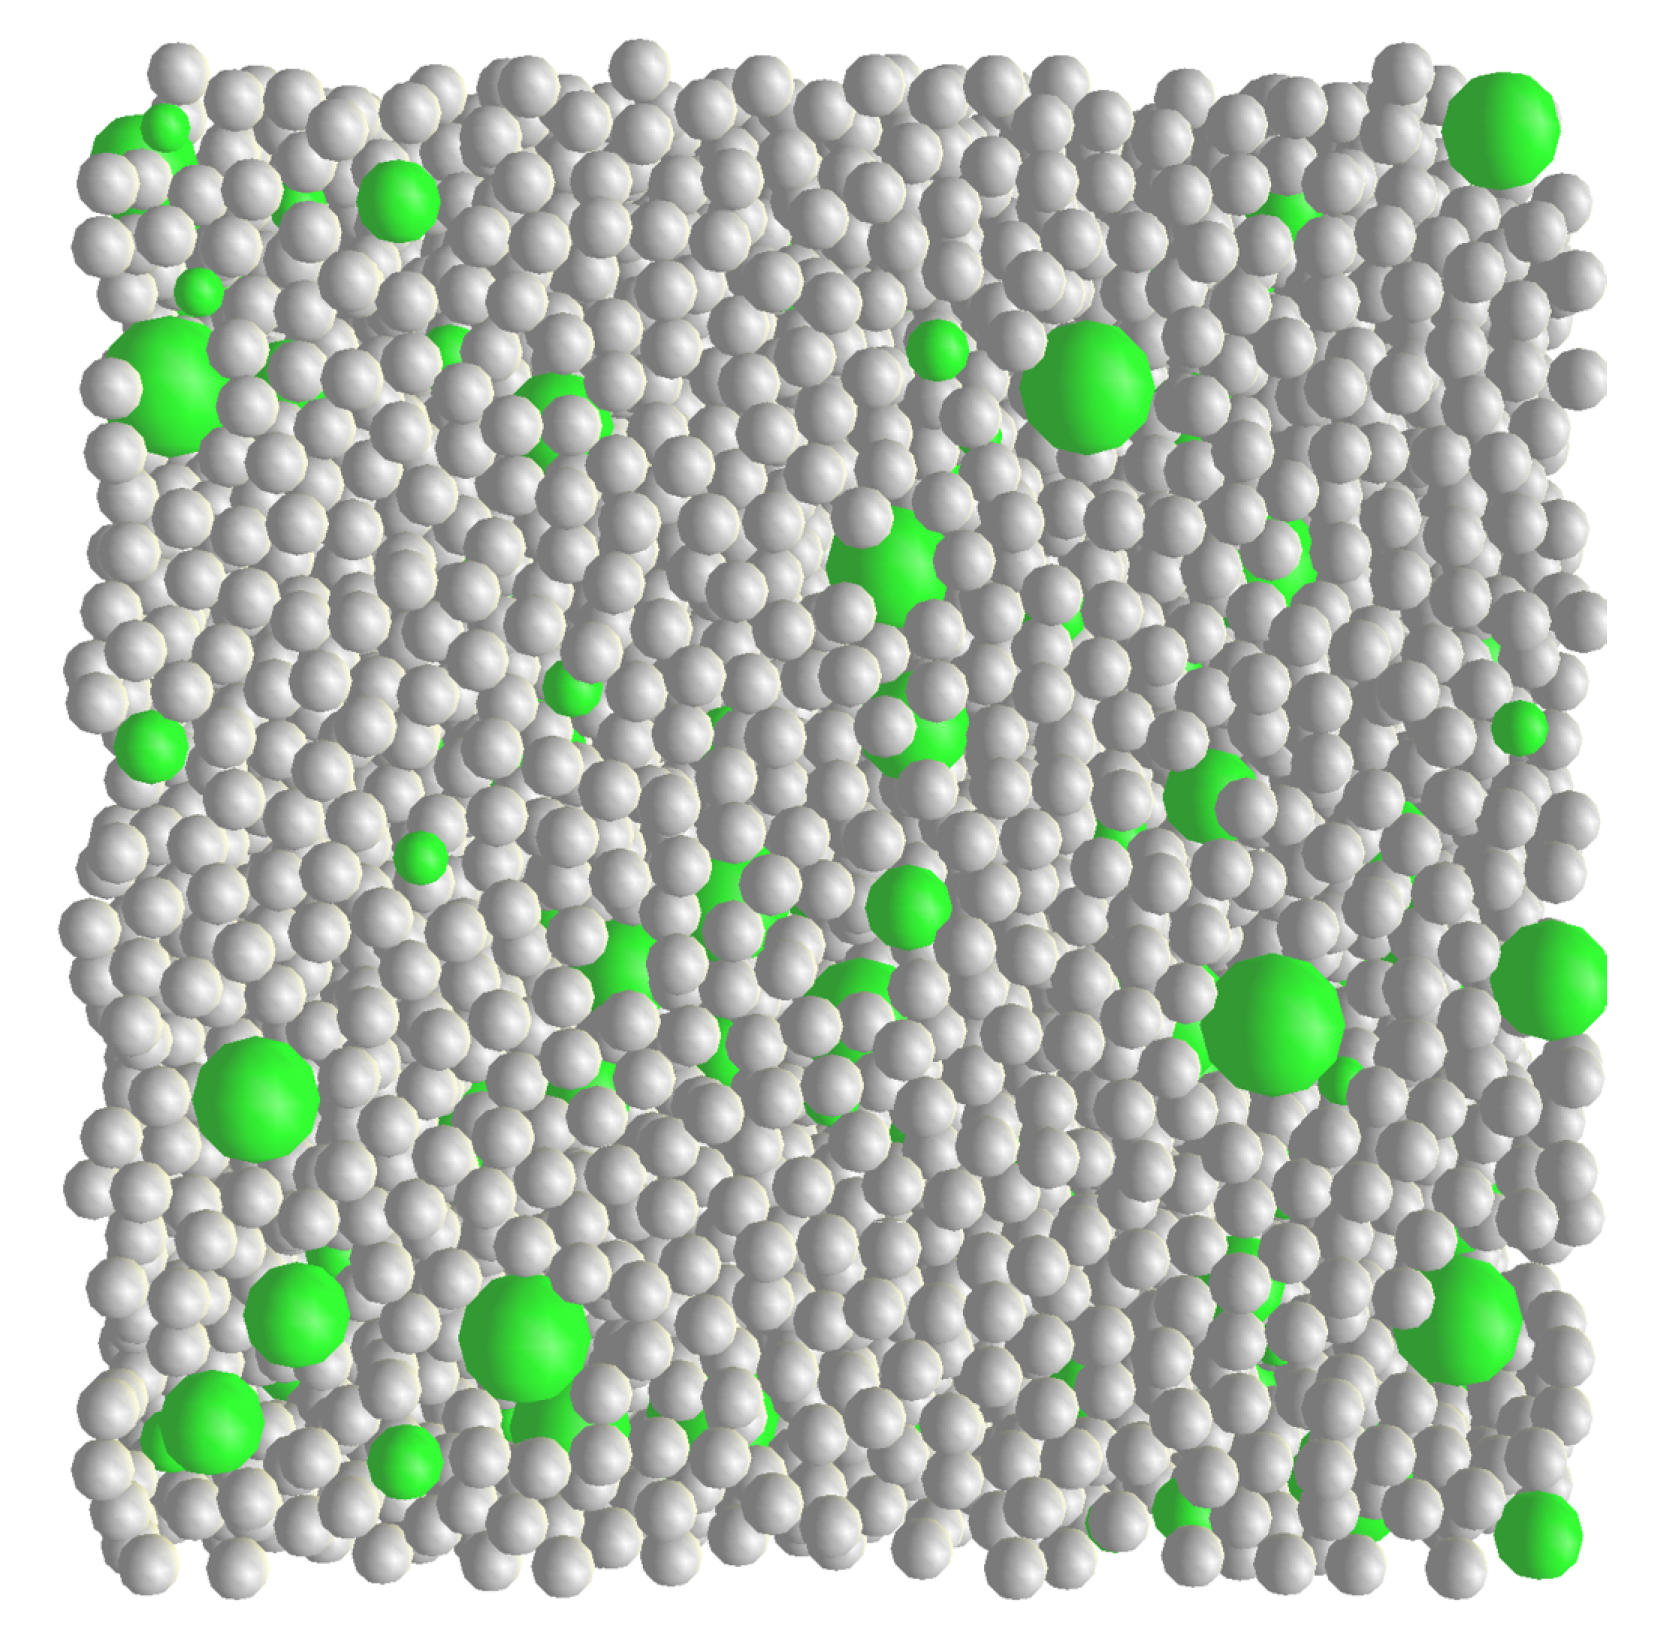
This paper presents a DEM simulation of the compressive strength test of cellular concrete on the YADE platform [
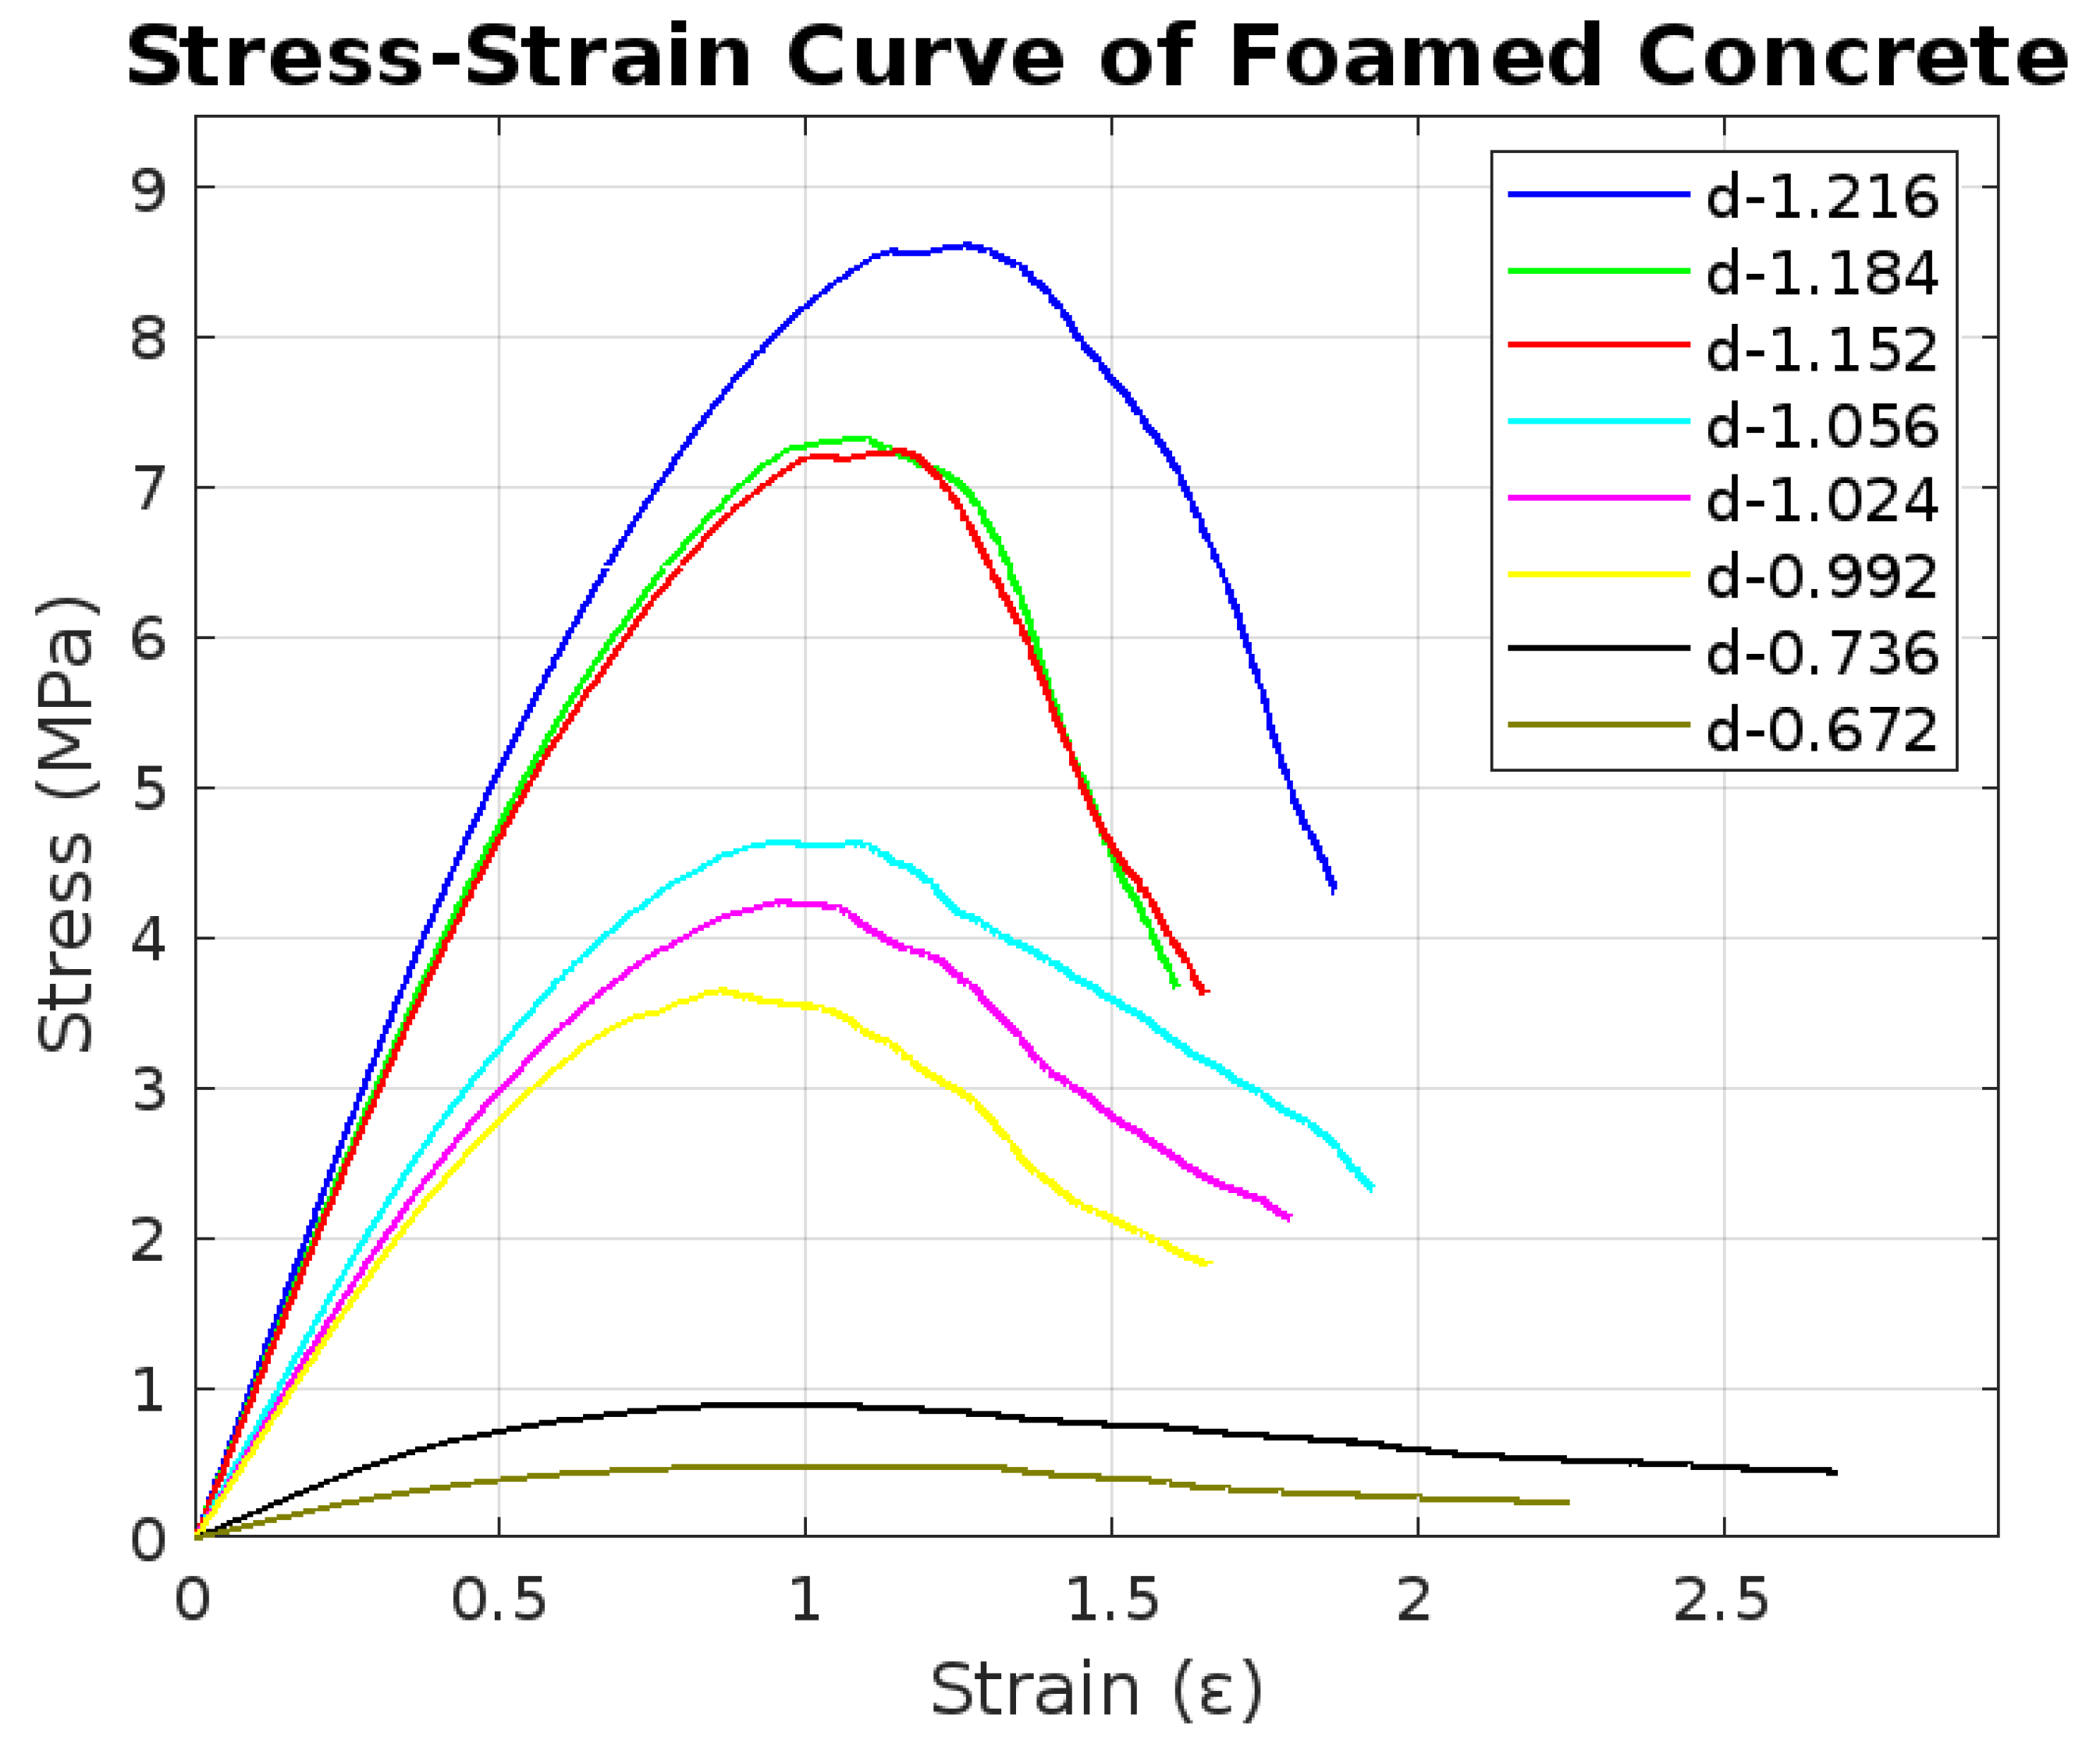
31]. The specimen is modeled by the interaction of a uniform distribution of spheres. The sample contains two phases: the air-void system and the solid skeleton. First, the contact model of the solid skeleton is presented in detail. Then, the numerical specimen is generated. Lastly, a series of uniaxial compressions was performed to investigate the response of cellular concrete.

2. Methodology

2.1. Discrete Element Method (DEM) Overview

The discrete element method (DEM) [32] is a numerical technique for simulating the behavior of granular and discontinuous materials at the microscopic scale. The system is modeled as a finite number of discrete particles interacting through defined contact laws. DEM is particularly well-suited for materials like cellular concrete, which exhibit significant heterogeneity and porosity. The general algorithm is described in Figure 1.
The first step of a DEM simulation is collision detection, the most time-consuming step of a DEM simulation. After defining the shape of particles, the initial boundary conditions, and the parameters of the contact model, a fast collision detection is launched to detect potential interactions, and then an exact collision detection is performed to filter out the impossible collisions. The sweep and prune algorithm [33] is the algorithm used in the YADE DEM simulation [34]. In every time step, the exact collision detection must be run to define the new position of particles, considering that particles are free to move and might encounter other bodies while the simulation is running. Using Newton’s laws of motion and contact laws, the new position of particles is determined by calculating the interaction forces. The displacement and rotation of particles in the current time step is determined using time integration.

2.2. Constitutive Law Model

DEM is based on the formulation of contact law at the particle level. The overall behavior of the specimen will depend mostly on the constitutive law at the granular scale. Cellular concrete can be seen as a bi-phasic material consisting of the air-void system and the solid matrix. To model the response of the specimen subjected to loading, we must formulate an appropriate contact law that will govern the mechanical behavior. The parameters of the contact law will be determined using a calibration procedure [35] based on experimental tests.
In this paper, we are using the contact model developed by Václav Šmilauer [31], a discrete-element-method-(DEM)-based approach to model concrete at the meso-scale (grain level). This model captures the material’s response under various loading conditions, including fracture processes. It integrates concepts from continuum mechanics, such as plasticity, damage, and viscosity, into a discrete particle framework. The model was implemented on the Yade platform, an open-source project for DEM simulations. The Concrete Contact Model CPM in YADE [31] is designed to simulate the behavior of concrete and similar materials composed of bonded particles. This model represents concrete as an assembly of particles connected by bonds that transmit both normal and tangential forces (see Figure 2).
The model assumes that all contact between particles behaves elastically until a specified stress threshold is exceeded, at which point the bond breaks in a brittle manner. The normal force F n and shear force F s are the primary forces transmitted through each contact (Figure 2).
The normal force between two particles is defined as:
F n = k n u n
where F n is the normal force, k n is the normal contact stiffness, and u n is the relative normal displacement between the particles.
The normal contact stiffness k n is calculated from the Young’s modulus E c of the material and the radii r 1 and r 2 of the contacting particles:
k n = E c r 1 r 2 r 1 + r 2
where E c is the Young’s modulus of the material; r 1 and r 2 are the radii of the two contacting particles.
The tensile strength of the contact bond is represented by T c , and the maximum normal force F n , max at which the bond can resist before failure occurs is given by:
F n , max = T c A int
where A int = π min ( r 1 , r 2 ) 2 is the contact area between the two particles.
If the normal force exceeds F n , max , the bond breaks, and the particles no longer interact elastically.
The shear force F s between the particles is calculated incrementally based on the relative shear displacement Δ u s between the particles:
F s = F s , updated + k s Δ u s
where F s is the shear force, F s , updated is the previously updated shear force, and k s is the shear stiffness of the contact, Δ u s is the relative incremental shear displacement.
The shear stiffness k s is related to the normal stiffness k n by the stiffness ratio μ :
k s = μ k n
where μ is the shear-to-normal stiffness ratio, which is typically defined for the material.
The Concrete Contact Model in YADE simulates the elastic and brittle behavior of concrete by using normal and shear forces that depend on particle displacements and material properties. The model is particularly effective for simulating crack propagation and the failure behavior of concrete under various loading conditions.
In the CPM model, the normal stress is related to normal strain by:
σ n = K n ϵ n + H ( ϵ n ) D ( ϵ n )
where σ n is the normal stress, K n the normal stiffness, ϵ n the normal strain, D ( ϵ n ) a damage parameter, and H the Heaviside function.
The CPM model is particularly applicable for cellular concrete due to its ability to capture progressive damage and stiffness degradation caused by voids and microstructural heterogeneity. The presence of air pockets within cellular concrete introduces localized stress concentrations that influence failure mechanisms. By incorporating a damage parameter D ( ϵ n ) , the CPM model accounts for the gradual weakening of the material, mimicking crack initiation and propagation. This feature makes it highly suitable for simulating brittle materials with complex pore structures, such as cellular concrete. Moreover, the CPM model enables the representation of anisotropic mechanical behavior due to directional variations in porosity and particle distribution. It provides insights into how localized deformation occurs in response to external loading, making it a powerful tool for optimizing the mechanical properties of cellular concrete through numerical analysis. By employing these constitutive laws, the DEM framework in YADE provides an effective means of predicting the mechanical behavior of cellular concrete. The model enables a detailed investigation of microstructural influences on material strength and facilitates the optimization of design parameters for improved performance.

2.3. Specimen Generation

This study presents a DEM-based model to investigate the influence of air-void distribution and specimen geometry on the mechanical behavior of cellular concrete. We assume that our numerical specimens are dry, consisting only of two phases: air void and solid phase. The solid skeleton is modeled as an assembly of spherical particles with a uniform radius, ensuring that all geometrical variables of the solid phase are represented by a single parameter. The sphere radius is a fundamental parameter requiring calibration to validate our model.
To examine the effect of volume representation, we studied cubic specimens with side lengths of 25 mm, 50 mm, and 100 mm, and cylindrical specimens with a diameter of 50 mm and a length of 100 mm. Additionally, we studied the impact of void distribution by modeling 3 samples: (i) randomly distributed air voids (voids that are distributed following a normal distribution, introducing randomness but maintaining overall homogeneity), designated as Sample A; (ii) uniformly distributed air voids (voids that are evenly spaced within the sample), designated as Sample B; and (iii) clustered air voids (voids that are grouped into localized clusters, creating non uniform void regions), designated as Sample C, where air bubbles are concentrated in specific regions within the sample (Figure 3).
The air-void network is modeled as spherical particles characterized by two parameters: mean radius and standard deviation. For all configurations, the diameter of the air voids is taken as 1 mm, consistent with values reported in [5].
To generate the cellular concrete specimens, the process begins by defining the air-void network and placing the voids inside the bounding volume of the specimen based on the specified distribution type for each configuration. Once the air voids are generated, solid particles are introduced into the bounding volume, ensuring that no overlap occurs between the positions of solid particles and pre-existing air bubbles (see Figure 4).
The algorithm then performs isotropic compaction on the solid phase to maximize the number of spheres while maintaining quasi-static equilibrium. This ensures that the solid skeleton is fully established with minimal voids outside the designed air-void network. After verifying all these conditions, the specimen generation is complete and ready for subsequent analysis. The porosity of the specimen is then calculated as:
n = 1 V s V t
where V s is the total volume occupied by the solid spheres, and V t is the total specimen volume. This definition inherently accounts for all voids present in the material, including both the interstitial voids between packed spheres and the explicitly introduced spherical voids.
The isotropic compaction process aims to maximize the solid packing fraction while maintaining quasi-static equilibrium. This process reduces the interstitial voids but does not eliminate them entirely. Since porosity is computed using the total volume approach, it already incorporates these interstitial voids, ensuring that the reported values accurately represent the overall void content within the specimen. Thus, the calculated porosities reflect the total void fraction, including both naturally occurring interstitial voids and intentionally introduced air voids, providing a consistent and accurate representation of the material structure.

2.4. Simulation Setup

We simply run strain-controlled uniaxial compression on the cuboid-shaped specimens. Straining is applied along one of the principal axes. The displacement of the specimen is derived from its current distance divided by its reference elongation. Straining imposes displacements on particles at the far positive and negative ends along the strained axis, with the liberty of other degrees of freedom. The strain rate between two successive time steps is considered very small (0.0001), so we can consider that the loading is quasi-static. The time step for the simulation is taken as a fraction of the critical time step of the system. The simulation is completed when the straining achieves 50 or when the specimen is fully damaged. The fundamental parameters of the simulation are summarized in Table 2. These parameters are taken from the findings of [10,36].

2.5. DEM Parameters Calibration

One of the inconveniences of DEM models is that many micro descriptions can all lead to the same macroscopic model. Recently, many attempts to develop a calibration procedure fit for DEM models have been made. Most notably, ref [37] uses a Design of Experiments (DoE) method to calibrate DEM parameters. Fakhimi [38] calibrated a DEM model using dimensional analysis to identify the micro parameters that are most influential on the simulation results. One of the most frequent strategies to calibrate parameters in DEM simulations is the trial-and-error approach. In this approach, different sets of mesoscopic parameters are used to run the simulation, and the results are checked against how the material actually behaves. The parameters are then adjusted step by step until the simulation outputs match the expected performance. Once this match is achieved, the final set of parameters is accepted as the calibrated values.
The experimental base for the current numerical study is based on the findings from a preceding experimental investigation. Experimental results used for model calibration and validation were taken from the findings of Afraitane et al. [39]. In that study, foamed concrete was produced by first preparing a cement slurry with superplasticizer, followed by the addition of fine dune sand and, lastly, a foaming agent to generate stable air bubbles. The fresh mixture was cast in cubic molds of dimensions 50 mm × 50 mm × 50 mm and then cured under controlled conditions (20 °C, relative humidity > 95). Compressive strength was measured at 7 and 28 days, and dry density was determined after 28 days, in accordance with NF EN 196–1. The study used a complete factorial design of 16 unique experiments performed in duplicate (32 trials in total) to evaluate the effects of the water/cement ratio, the content of sand, the superplasticizer, and the foaming agent. These results provided the basis for calibrating the DEM model in the present work.
The experimental results represent the observed macroscopic behavior that our DEM simulation aims to reproduce. The initial estimation of micro-scale parameters, including particle stiffness, bond strength, and friction coefficient, was derived from the work of Václav Šmilauer [34], which provides a framework for DEM modeling of concrete. These values served as a starting point for the calibration process.
To refine the parameters, the DEM model was executed using the initial estimates, and the resulting macroscopic response—compressive strength σ c s i m —was compared against the corresponding experimental value σ c e x p . The calibration followed an iterative trial-and-error approach, structured around minimizing an objective function that quantifies the error between simulation and experiment. The objective function F was defined as the sum of squared errors (SSE):
F = i = 1 N σ c , i s i m σ c , i e x p 2
where N represents the number of experimental observations.
The optimization process involved adjusting microparameters iteratively to minimize F, progressively reducing the discrepancy between simulated and experimental values. This process continued until convergence was reached, meaning that the numerical results closely matched the experimental observations. The final set of DEM parameters obtained after this minimization was considered calibrated, ensuring that the model accurately captured the macroscopic behavior of foamed concrete. This calibration methodology enhances the reliability of the DEM model for predictive simulations and further numerical investigations.

3. Results and Discussions

3.1. Effect of Specimen Dimension

To assess the impact of specimen size, we analyzed three cubic specimens of 25 mm, 50 mm, and 100 mm under uniaxial compression. The results demonstrate that specimen size significantly influences the stress distribution and peak compressive strength (see Figure 5). The particle diameter used in the DEM model is 0.74 mm, chosen based on experimental observations of cellular concrete porosity distribution.
The 100 mm specimen exhibited the highest peak strength 25 MPa due to a greater volume resisting deformation, leading to improved load distribution and stress absorption. The 50 mm specimen showed an intermediate response, with a peak strength of 21 MPa, indicating a balance between material volume and structural integrity. The 25 mm specimen had the lowest compressive strength (20 MPa), which can be attributed to increased boundary effects, a higher surface-area-to-volume ratio, and localized stress concentrations.
The stress-strain curves (Figure 5) reveal that larger specimens generally exhibit higher stiffness, with a more gradual failure mechanism compared to smaller ones, which display sudden and brittle failure patterns. The modulus of elasticity E was estimated using the tangent method at 50 % of peak stress:
E = Δ σ Δ ε
where Δ σ is the stress increment and Δ ε is the corresponding strain increment. As shown in the graph, the specimen dimension does not significantly impact the elastic modulus, as all specimens exhibit comparable stiffness. However, it is observed that the strain at peak stress is influenced by specimen size, with the 100 mm specimen demonstrating larger strain values before failure. This suggests that larger specimens undergo more deformation prior to peak load, which can be attributed to a more distributed internal stress state and reduced constraint effects.
These findings emphasize that specimen size should be carefully considered when conducting numerical and experimental studies on cellular concrete, as variations in dimensions can significantly affect mechanical response and reliability.

3.2. Impact of Particle Radius

We studied the mechanical reaction of a cubic-shaped 50 mm length of cellular concrete with 3 different radii of spheres: 1.5 mm, 1 mm, and 0.75 mm, which approximated the cement matrix. We conducted uniaxial strain testing on the specimens and evaluated their mechanical strength under compression (see Figure 6).
A macro response of the specimens is shown in Figure 6. The specimens demonstrate elasto-plasticity in compression. The initial response of the specimen is elastic and linear until the axial strain reaches the limit of elastic strain. The DEM-based model is sensitive to micro-parameters, and their numerical values affect the simulation’s overall outcome. To explore its influence, an examination of the effect of solid particle size is carried out. The material strength increases in compression when the solid particle radius decreases. One way to interpret this result is that when we increase the solid particle radius, the coordination number is discrete. Thus, fewer particles are interacting, and the microscopic bond is weaker compared to the specimen where the sphere radius is smaller. This leads to a faster loss of mechanical bond when the specimen is under strain. The following Table 3 summarizes the key mechanical properties for each particle size:
These findings suggest that smaller particle sizes improve mechanical performance by increasing packing density and reducing stress concentrations. However, excessively fine particles may lead to higher processing costs and increased water demand in concrete mixtures. The results highlight the importance of optimizing particle size distribution for enhanced mechanical properties in practical applications of cellular concrete.

3.3. Specimen Shape Influence

We study the effect of specimen shape on the mechanical behavior of cellular concrete, comparing cubic and cylindrical (see Figure 7). Cubic specimens provide uniform stress distribution and are commonly used for simplicity and standardization. On the other hand, cylindrical specimens simulate real-world scenarios better, especially for structures like columns and pillars where cylindrical shapes are prevalent. Comparing the curves representing the results of both shapes reveals differences in strength and deformation characteristics (see Figure 8). Cubic specimens may exhibit higher initial strength due to more uniform stress distribution, while cylindrical specimens may display better resistance to lateral deformation under load. Understanding these differences aids in selecting appropriate specimen shapes for specific applications and refining structural designs to optimize performance and durability in real-world scenarios.

3.4. Impact of Porosity on Compressive Strength

Figure 9 illustrates the stress–strain relationship of foam concrete, which is characterized by density (d) variations. For a given material, the solid density ρ s is constant, and the bulk density ρ b is related to the porosity n by
ρ b = ρ s ( 1 n ) .
This equation indicates that any change in porosity n will directly affect the bulk density ρ b when ρ s is fixed. In our study, all samples were made from the same material, so ρ s remains constant. Therefore, if two samples exhibit the same bulk density, they have a similar overall mass per unit volume. Under these conditions, any observed differences in compressive strength must be attributed to variations in the internal pore structure—specifically, differences in the porosity n and its distribution—rather than differences in the material or bulk densities. This clearly shows the relationship between density (d) and porosity (n) that affects the compressive strength ( f c ) of the material. As the density increases, the peak compressive strength decreases. This implies that the material can endure compressive loads. Stress–strain curves indicate that samples with higher density, such as d = 1.216 and d = 1.184 , exhibit significantly higher peak stress values than those with lower density, such as d = 0.736 and d = 0.672 . The trend indicates that porosity (n) and compressive strength ( f c ) are expected to have an opposite relationship. For instance, a high-density sample with lower porosity exhibits higher compressive strength due to fewer voids, whereas a low-density sample with higher porosity undergoes more prolonged deformation under stress, indicating reduced rigidity and strength. This relationship is described by models such as:
f c = σ 0 ( 1 n ) α ,
where n is the porosity, f c is the compressive strength, and σ 0 and α are material-specific constants. Figure 10 shows that the experimental data (red markers) follow this power-law behavior closely, as demonstrated by the fitted curve (blue line). The derived values of σ 0 and α confirm that even small variations in porosity lead to significant changes in compressive strength, thereby validating the model and emphasizing the critical role of pore structure in determining the material’s mechanical performance.

3.5. The Effect of Air Voids Distribution on Compressive Strength

In this section, we examine the impact of void distribution on the compressive strength of the material. The following results illustrate how variations in the spatial arrangement of air voids affect stress distribution and, consequently, mechanical performance. As detailed in Section 2.3, the specimen generation process involved creating a controlled air-void network according to a predefined distribution (uniform, random, or clustered), followed by the insertion of solid particles to form the specimen’s solid skeleton. This approach ensured that the void distribution was accurately represented within the numerical model, with minimal external voids outside the designed network. Table 4 summarizes the specimen properties corresponding to the different void distributions.
The stress–strain curves for the three void distributions are presented in Figure 11:
The three void distributions are represented by stress–strain curves in Figure 11. These observations are derived from the stress–strain curves:
The Uniform distribution curve demonstrates the greatest compressive strength, with a peak stress of approximately 8.9 MPa. A relaxed stress response is characterized by a gradual increase in pressure and a subsequent lingering decline after the peak. Achieving uniformity in void spacing helps to decrease stress concentrations that may cause early failure. A peak in compressive strength of the random (normal) distribution curve is approximately 8.2 MPa. Due to the randomness of void positions, crack activation occurs earlier than in the uniform case, which leads to localized stress concentrations. The peak stress on the cluster distribution curve is approximately 3.5 MPa, which is the lowest value. A sharp decrease in the stress-strain curve after peak stress is indicative of brittle behavior. The occurrence of stress-induced weak zones within the specimen due to void clustering causes early failure.
The results from the simulations indicate that void distribution plays a critical role in determining the compressive strength of cellular concrete. Table 5 summarizes the key findings:
Due to the uniform distribution of the voids, reducing the stress concentration and improving the load transfer, a compressive strength of 8.9 MPa was achieved. Random distribution (normal) showed an average compressive strength of 8.2 MPa, since the randomness of the stress concentration in the region was introduced, which weakened the material. Cluster distribution: The performance was very poor, and the compression resistance was 3.5 MPa, categorizing the zones created from low stiffness that failed early under load. The analysis of the mechanical behavior of porous concrete specimens under compression loading provides important insight into the influence of nonlinear distribution. Different methods of failure were observed depending on the arrangement of voids in the material. The main observations are as follows: Uniform distribution decreased due to the uniform distribution of stress throughout the specimen. This distribution ensures equal load transfer and delays the initiation of crack growth. Random distribution: Failures were initiated at locations with higher local stress concentrations but spread throughout the entire specimen. The random distribution of the voids was introduced by local stress concentrations, which served as the starting point for failure. Clustered distribution: Sudden and localized failures occurred at weak points and large voids. Clustering of voids formed at low-strength areas could not withstand the applied load, causing premature and brittle failure. These results are consistent with the findings of previous studies, which indicates that the distribution of voids can significantly reduces the load-bearing capacity of cellular concrete [40,41]. Uneven arrangements, such as uniform distribution, increase mechanical performance by improving stress distribution and reducing crack locations.

3.6. Model Calibration Using Experimental Results

The numerical model was calibrated using experimental data from Heikal Afraitane [39], whose experimental investigations focus on the mechanical behavior of cellular concrete. The calibration process compared the compressive strength-density relationship obtained from the discrete element method (DEM) simulations with experimental results. Figure 12 illustrates the comparison between the numerical results produced using YADE and the experimental data.
The numerical and experimental data are in close agreement, with the linear trend indicating that there is a linear relationship between density and strength. Blue markers indicate lower strength values for the experimental data compared to green markers, which represent numerical predictions across most of the density range. The red vertical bars indicate the deviations between the numerical results and the experimental trend. The observed discrepancies represent the minimal error threshold accepted within the computational constraints of the calibration procedure. This approach ensures an optimal balance between accuracy and computational efficiency, making the calibration both reliable and time-effective. The slight variation can be linked to differences in experimental circumstances, such as material heterogeneity or void distribution irregularities, and measurement uncertainties that are not explicitly described in the numerical model. Table 6 presents the calibrated microparameters used in the DEM simulation of cellular concrete. These values were optimized to accurately replicate the macroscopic behavior observed in experimental tests:
This numerically consistent finding, along with the experimental results, supports the predictive nature of the DEM model. The higher strength values predicted by the numerical model at larger density ranges may be attributed to simplified assumptions, such as uniform particle size and idealized void distribution. The simulations assumptions may enhance the packing density and stress distribution, but they may not fully reflect real-world material behavior. Including experimental data in computational modeling is crucial to improve accuracy and reliability, as demonstrated by this calibration effort. This finding makes the DEM model an effective means of studying the mechanical properties of cellular concrete and provides much-needed support in future parametric research. Additional research could be required to incorporate more intricate material properties and experimental variability into the numerical model to account for the differences observed at higher densities.

3.7. Comparison of Empirical Models and DEM Results

In this section, we compare the results of the discrete element method (DEM) simulations with empirical models from the literature. The effect of porosity on compressive strength is investigated. Trends and discrepancies are identified by comparing DEM results with established models such as Hoff, Kearsley, or Nambiar and Narayanan. The outcomes emphasize the significance of porosity in assessing compressive strength and offer directions for improving material design. The models presented in Figure 13 represent different types of cellular concrete, each developed under specific conditions. Hoff’s model describes pure foamed concrete, while Kearsley’s model accounts for foamed concrete incorporating fly ash. Nambiar’s model extends to both foamed concrete with fly ash and cement-sand mixtures, whereas Narayanan’s model focuses on aerated concrete, which differs in its pore formation mechanism. Although these models originate from different studies, their applicability to cellular concrete materials is based on fundamental relationships between density and mechanical properties. To ensure a valid comparison, the key macroscopic properties, particularly density and compressive strength, have been verified to be within comparable ranges across all studies. Despite variations in specific mix compositions, these models aim to describe the mechanical behavior of lightweight cementitious materials with entrained air, making their comparison relevant in the context of this study.
The following empirical models were used for comparison:
  • Hoff [25]: f c = 115 ( 1 n ) 2.7
  • Kearsley [26]: f c = 188 ( 1 n ) 3.1
  • Nambiar [28]: f c = 105.4 ( 1 n ) 2.68
  • Narayanan [27]: f c = 24.28 ( 1 n ) 1.8
Figure 13 shows the compressive strength as a function of 1 Porosity for DEM results and empirical models. A trend line for the DEM results was added to visualize the relationship. The Hoff and Kearsley models tend to over-predict compressive strength at higher porosity levels, while the Nambiar model demonstrates strong alignment with DEM results, particularly at lower porosity values. In contrast, the Narayanan model provides conservative predictions across all porosity ranges. Porosity emerges as a critical factor, with increasing porosity significantly reducing compressive strength due to higher void spaces weakening the material structure.
RMSE is defined as
RMSE = 1 N i = 1 N f c , pred , i f c , obs , i 2 ,
and the coefficient of determination ( R 2 ) is given by
R 2 = 1 i = 1 N f c , obs , i f c , pred , i 2 i = 1 N f c , obs , i f ¯ c , obs 2 ,
where f c , obs , i and f c , pred , i are the observed and predicted compressive strengths, respectively, and f ¯ c , obs is the mean of the observed compressive strengths.
As shown in Table 7 and in Figure 14, the performance of the four empirical models was evaluated using these metrics. RMSE quantifies the average error between the predicted and observed values, while R 2 indicates the proportion of variance in the data explained by the model. Notably, the Kearsley model achieves the lowest RMSE (1.03 MPa) and the highest R 2 (0.88), demonstrating its superior accuracy in capturing the relationship between porosity and compressive strength. In contrast, the Narayanan model shows a much higher RMSE (2.64 MPa) and a lower R 2 (0.20), suggesting a poor fit.

4. Conclusions

The study employs DEM simulations to explore the compressive strength of cellular concrete, focusing on the effects of particle radius, porosity, and void distribution. The findings highlight several critical insights. Geometric factors play a pivotal role, as larger sphere radii reduce both compressive strength and packing density, while smaller radii enhance these properties. The study also highlights the crucial role of void distribution in determining compressive strength. The highest compressive strength can be attained by minimizing stress concentrations and maintaining uniform void distribution. Random (normal) void distributions exhibit middle-to-high strength, whereas clustered voids significantly weaken the material and promote premature failure through the formation of weak zones. The results indicate that void distribution must be controlled for applications that require high mechanical performance. Achieving a consistent void distribution is essential for strength and durability.
While the findings provide critical insights, certain limitations must be acknowledged. The study assumes idealized spherical particles, which may not fully capture the complexity of real cellular concrete structures. Further Experimental Validation Needed: The DEM results require experimental comparison to ensure accuracy and applicability in real-world scenarios. Static Loading Conditions: The analysis is limited to uniaxial compression, and the influence of dynamic loading, fatigue, or environmental factors remains unexplored. Incorporating Realistic Microstructures: Future studies should integrate irregular particle shapes and cementitious matrix interactions for improved accuracy. Extended Loading Scenarios: Investigating dynamic loading, cyclic loading, and thermal effects will provide a more comprehensive understanding of cellular concrete behavior. Optimization Studies: Further research should explore machine learning and AI-driven optimization to enhance material design by optimizing void distributions for maximum strength. By addressing these limitations, future research can enhance the predictive capabilities of DEM simulations and improve the structural design of cellular concrete for high-performance applications.

Author Contributions

Conceptualization, F.A.-N. and R.J.; methodology, F.A.-N.; software, F.A.-N.; validation, R.J. and M.F.; investigation, H.A.; resources, H.A.; data curation, F.A.-N.; writing—original draft preparation, F.A.-N.; review and editing, R.J. and M.F.; project administration, R.J. and M.F. All authors have read and agreed to the published version of the manuscript.

Funding

This research received no external funding.

Data Availability Statement

The data presented in this study are available on request the corresponding author.

Conflicts of Interest

The authors declare no conflicts of interest.

References

  1. Gencel, O.; Bilir, T.; Bademler, Z.; Ozbakkaloglu, T. A Detailed Review on Foam Concrete Composites: Ingredients, Properties, and Microstructure. Appl. Sci. 2022, 12, 5752. [Google Scholar] [CrossRef]
  2. Escobar, C.R.; Madera-Sierra, I.; Rojas Manzano, M. Challenges in Foamed Concrete: Exploring Alternative and Sustainable Materials—A Comprehensive Review. Ing. Y Compet. 2023, 25, 1. [Google Scholar] [CrossRef]
  3. Cundall, P.A.; Strack, O.D.L. A discrete numerical model for granular assemblies. Géotechnique 1979, 29, 47–65. [Google Scholar] [CrossRef]
  4. Chica, L.; Alzate, A. Cellular concrete review: New trends for application in construction. Constr. Build. Mater. 2019, 200, 637–647. [Google Scholar] [CrossRef]
  5. Bonakdar, A.; Babbitt, F.; Mobasher, B. Physical and mechanical characterization of Fiber-Reinforced Aerated Concrete (FRAC). Cem. Concr. Compos. 2013, 38, 82–91. [Google Scholar] [CrossRef]
  6. Zhou, L.; Deng, Z.; Li, W.; Ren, J.; Zhu, Y.; Mao, L. Mechanical behavior of the cellular concrete and numerical simulation based on meso-element equivalent method. Constr. Build. Mater. 2023, 394, 132118. [Google Scholar] [CrossRef]
  7. Rezakhani, R.; Gallyamov, E.R.; Molinari, J.-F. Meso-scale Finite Element Modeling of Alkali-Silica-Reaction. CoRR 2020, abs/2007.02600. [Google Scholar] [CrossRef]
  8. Mugahed Amran, Y.H.; Farzadnia, N.; Abang Ali, A.A. Properties and applications of foamed concrete; A review. Constr. Build. Mater. 2015, 101, 990–1005. [Google Scholar] [CrossRef]
  9. Jiang, M.J.; Zhou, W. Micro-mechanical modeling of cellular concrete under uniaxial compression using DEM. Constr. Build. Mater. 2017, 147, 826–840. [Google Scholar]
  10. Nguyen, T.T.; Bui, H.H.; Ngo, T.D.; Nguyen, G.D. Experimental and Numerical Investigation of Influence of Air-Voids on the Compressive Behaviour of Foamed Concrete. Mater. Des. 2017, 130, 103–119. [Google Scholar] [CrossRef]
  11. Nguyen, T.T. Experimental Investigation and Numerical Modeling on Mechanical Behavior of Highly Porous Cement-Based Material: An Overview. Mech. Adv. Mater. Struct. 2023, 31, 9040–9061. [Google Scholar] [CrossRef]
  12. Wriggers, P.; Avci, B. Discrete Element Methods: Basics and Applications in Engineering. In Modeling in Engineering Using Innovative Numerical Methods for Solids and Fluids; De Lorenzis, L., Düster, A., Eds.; Springer International Publishing: Cham, Switzerland, 2020; pp. 1–30. ISBN 978-3-030-37518-8. [Google Scholar] [CrossRef]
  13. Ma’arif, F.; Gao, Z.; Li, F. A Review of the Discrete Element Method Application on Concrete Materials. J. Phys. Conf. Ser. 2020, 1625, 012009. [Google Scholar] [CrossRef]
  14. Wang, P.; Gao, N.; Ji, K.; Stewart, L.; Arson, C. DEM analysis on the role of aggregates on concrete strength. Comput. Geotech. 2020, 119, 103290. [Google Scholar] [CrossRef]
  15. Galitskov, S.; Galitskov, K.; Bolkhovetsky, A.S. Modeling the Process of Autoclaving Treatment of Cellular Concrete Products as a Control Object. In Proceedings of the International Scientific Conference Interstroymeh—2019 (ISM-2019), Kazan, Russia, 12–13 September 2019; Volume 786. [Google Scholar]
  16. Ferretti, E. Multiscale modeling of composite materials with DECM approach: Shape effect of inclusions. Int. J. Mech. 2019, 13, 114–128. [Google Scholar]
  17. Tan, X.; Hu, Z.; Li, W.; Zhou, S.; Li, T. Micromechanical Numerical Modelling on Compressive Failure of Recycled Concrete Using Discrete Element Method (DEM). Materials 2020, 13, 4329. [Google Scholar] [CrossRef]
  18. Baghban, H.; Arulrajah, A.; Narsilio, G.; Horpibulsuk, S. DEM simulation of the thermo-geomechanical effect of recycled concrete aggregate assemblies in geothermal pavement bases. Transp. Geotech. 2021, 28, 100528. [Google Scholar] [CrossRef]
  19. Ren, J.; Liu, Z.; Xue, J.; Xu, Y. Influence of the Mesoscopic Viscoelastic Contact Model on Characterizing the Rheological Behavior of Asphalt Concrete in the DEM Simulation. Adv. Civ. Eng. 2020, 2020, 5248267. [Google Scholar] [CrossRef]
  20. Yang, Z.; Wang, L.; Gao, Z. Modeling of tunnel concrete lining under fire and explosion damage. Adv. Civ. Eng. 2021, 2021, 8124972. [Google Scholar] [CrossRef]
  21. Li, Y.; Hao, J.; Jin, C.; Wang, Z.; Liu, J. Simulation of the flowability of fresh concrete by Discrete Element Method. Front. Mater. 2021, 7, 603154. [Google Scholar] [CrossRef]
  22. She, W.; Yang, Y.; Xie, D.; Zhang, Y. Finite volume analysis of thermal properties in cellular concrete. Int. Conf. Durab. Concr. Struct. 2014, 73, 121–129. [Google Scholar]
  23. Hentz, S.; Donzé, F.V.; Daudeville, L. Discrete Element Modelling of Reinforced Concrete Structures under Impact and Dynamic Loads. Comput. Struct. 2009, 87, 619–630. [Google Scholar] [CrossRef]
  24. Oñate, E.; Zárate, F.; Daudeville, L. A Constitutive Model for DEM Simulation of Concrete under High Stress Levels. Comput. Part. Mech. 2015, 2, 139–160. [Google Scholar] [CrossRef]
  25. Hoff, G.C. Porosity-strength considerations for cellular concrete. Cem. Concr. Res. 1972, 2, 91–100. [Google Scholar] [CrossRef]
  26. Kearsley, E.P.; Wainwright, P.J. The effect of porosity on the strength of foamed concrete. Cem. Concr. Res. 2002, 32, 233–239. [Google Scholar] [CrossRef]
  27. Narayanan, N.; Ramamurthy, K. Prediction relations for compressive strength of aerated concrete. ACI Struct. J. 2000, 97, 367–373. [Google Scholar]
  28. Nambiar, E.K.K.; Ramamurthy, K. Models for strength prediction of foam concrete. Mater. Struct. 2008, 41, 247–254. [Google Scholar] [CrossRef]
  29. Chung, S.-Y.; Kim, J.-S.; Han, T.-S. Effects of Void Clustering on the Thermal and Mechanical Properties of Concrete Evaluated Using Numerical Methods. Multiscale Sci. Eng. 2019, 1, 196–209. [Google Scholar] [CrossRef]
  30. Su, H.; Li, H.; Hu, B.; Yang, J. A Research on the Macroscopic and Mesoscopic Parameters of Concrete Based on an Experimental Design Method. Materials 2021, 14, 1627. [Google Scholar] [CrossRef]
  31. Šmilauer, V. Cohesive Particle Model Using the Discrete Element Method on the Yade Platform. Materials. Université de Grenoble; Czech Technical University in Prague, 2010. Available online: https://tel.archives-ouvertes.fr/tel-00502402 (accessed on 9 January 2025).
  32. The Discrete Element Method in Three Dimensions. In Understanding the Discrete Element Method; Wiley Online Books: Hoboken, NJ, USA, 2014; pp. 289–334. [CrossRef]
  33. Avril, Q.; Gouranton, V.; Arnaldi, B. A Broad Phase Collision Detection Algorithm Adapted to Multi-Cores Architectures. In Proceedings of the VRIC 2010—12th Virtual Reality International Conference, Laval, France, 7–9 April 2010; p. 95. [Google Scholar]
  34. Smilauer, V.; Chareyre, B.; Duriez, J.; Eulitz, A.; Gladky, A.; Guo, N.; Jakob, C.; Kozicki, J.; Kneib, F.; Modenese, C.; et al. Using and Programming; Zenodo: Geneva, Switzerland, 2015. [Google Scholar] [CrossRef]
  35. Plassiard, J.P.; Belheine, N.; Donzé, F.V. A spherical discrete element model: Calibration procedure and incremental response. Granul. Matter 2009, 11, 293–306. [Google Scholar] [CrossRef]
  36. Visagie, M.; Kearsley, E. Properties of foamed concrete as influenced by air-void parameters. Concr. Beton 2002, 101, 8–14. [Google Scholar]
  37. Rackl, M.; Hanley, K.J. A Methodical Calibration Procedure for Discrete Element Models. Powder Technol. 2017, 307, 73–83. [Google Scholar] [CrossRef]
  38. Fakhimi, A. Application of the Discrete Element Method in Modeling of Fractured Rocks. Int. J. Rock Mech. Min. Sci. 2007, 44, 627–639. [Google Scholar] [CrossRef]
  39. Afraitane, H.; Abou-Nouh, F.; Lahlou, K.; Jaafri, R. Optimization of the Formulation of a Cellular Concrete for Bearing Masonry of Sustainable Housing. Mater. Today Proc. 2023. [Google Scholar] [CrossRef]
  40. Lyu, K.; Garboczi, E.J.; Liu, X. A Quantitative Characterization of Spatial Arrangement of Air Voids in Mortars via X-ray CT and Numerical Calculations. Constr. Build. Mater. 2022, 360, 129550. [Google Scholar] [CrossRef]
  41. Chung, S.-Y.; Lehmann, C.; Abd Elrahman, M.; Stephan, D. Pore Characteristics and Their Effects on the Material Properties of Foamed Concrete Evaluated Using Micro-CT Images and Numerical Approaches. Appl. Sci. 2017, 7, 550. [Google Scholar] [CrossRef]
Figure 1. Typical DEM simulation.
Constrmater 05 00015 g001
Figure 2. Illustration of contact and forces in a DEM model.
Constrmater 05 00015 g002
Figure 3. Visualization of Air-Void Distributions in Cellular Concrete Specimens—Sample A: Random (Green), Sample B: Uniform (Blue), and Sample C: Clustered (Red).
Constrmater 05 00015 g003
Figure 4. Cellular concrete sample: in green, the pores; in gray, the solid phase.
Constrmater 05 00015 g004
Figure 5. Strain–stress curve of cubic specimens with different dimensions.
Constrmater 05 00015 g005
Figure 6. Stress-strain curve of cellular concrete specimen with different radius.
Constrmater 05 00015 g006
Figure 7. Strain-stress curve of cubic specimens with different shape.
Constrmater 05 00015 g007
Figure 8. Cracks diffusion.
Constrmater 05 00015 g008
Figure 9. Stress–Strain Curve of Foamed Concrete with varying densities (d).
Constrmater 05 00015 g009
Figure 10. Relationship between compressive strength f c and ( 1 n ) . The red markers represent experimental data points, while the blue curve represents the fitted power-law model f c = σ 0 ( 1 n ) α .
Constrmater 05 00015 g010
Figure 11. Stress–Strain Curve of Foamed Concrete with different distribution of air voids (d).
Constrmater 05 00015 g011
Figure 12. Comparison of compressive strength−density relationship between experimental results (blue markers) and numerical results (green markers).
Constrmater 05 00015 g012
Figure 13. Compressive Strength vs. Porosity: Comparison of DEM results and empirical models.
Constrmater 05 00015 g013
Figure 14. Minimum Absolute Error between DEM Data and Nearest Model Prediction.
Constrmater 05 00015 g014
Table 1. Different compressive strength models in the literature.
Model ByEquation
Hoff [25]115 ( 1 porosity ) 2.7
Kearsley [26]188 ( 1 porosity ) 3.1
Nambiar [28]105.4 ( 1 porosity ) 2.68
Narayanan K [27]24.28 ( 1 porosity ) 1.8
Table 2. Parameters of the simulation.
Simulation ParameterNumerical Value
Normal stiffness7 GPa
Relative shear stiffness0.2
Initial cohesion1.5 MPa
Internal friction angle tan 1 ( 0.6 )
Limit elastic strain 1 . 10 4
Interaction radius1.5
Solid sphere radius0.75 mm
Air-void mean radius1 mm
Air-void radius standard deviation0.5 mm
Table 3. Effect of Particle Radius on Compressive Strength and Elastic Modulus.
Particle Radius (mm)Peak Strength (MPa)Elastic Modulus (GPa)Strain at Peak Stress (%)
0.7526.512.01.8
1.022.310.51.5
1.519.79.21.2
Table 4. Specimen properties for different void distributions.
Void DistributionVoid Radius (m)Sphere Radius (m)Specimen Length (m)Porosity
Cluster0.00150.0010.050.62
Random0.00150.0010.050.62
Uniform0.00150.0010.050.65
Table 5. Compressive strengths for different void distributions.
Void DistributionCompressive Strength (MPa)
Uniform8.9
Random (Normal)8.2
Cluster3.5
Table 6. Calibrated micro-parameters for uniaxial compression test.
Simulation ParameterNumerical Value
Normal stiffness24 GPa
Relative shear stiffness0.2
Initial cohesion1.5 MPa
Internal friction angle tan 1 ( 0.8 )
Limit elastic strain 1 . 10 4
Interaction radius1.5
Solid sphere radius1 mm
Air-void mean radius1.5 mm
Air-void radius standard deviation0.5 mm
Table 7. Comparison of Empirical Models Based on RMSE and R 2 .
ModelRMSE (MPa) R 2
Hoff1.20540.8339
Kearsley1.02920.8789
Nambiar1.39810.7766
Narayanan2.63980.2035
Disclaimer/Publisher’s Note: The statements, opinions and data contained in all publications are solely those of the individual author(s) and contributor(s) and not of MDPI and/or the editor(s). MDPI and/or the editor(s) disclaim responsibility for any injury to people or property resulting from any ideas, methods, instructions or products referred to in the content.

