Article

The Time Development of the Microstructural Properties of Plastic Concrete: Material Insights and Experimental Boundaries

1
Materials Testing and Research Institute Karlsruhe (MPA Karlsruhe), 76049 Karlsruhe, Germany
2
Institute of Concrete Structures and Building Materials (IMB Karlsruhe), 76049 Karlsruhe, Germany
*
Author to whom correspondence should be addressed.
Constr. Mater. 2025, 5(1), 14; https://doi.org/10.3390/constrmater5010014
Submission received: 2 February 2025 / Revised: 3 March 2025 / Accepted: 6 March 2025 / Published: 10 March 2025

Abstract

:
Plastic Concrete is a low-strength ( f c m , 28 d ≤ 1.0 MPa), low-stiffness impervious concrete used for cut-off walls in earthen dams worldwide. These properties are achieved through a very high w/c ratio (w/c ≥ 3.0) and water-binding additions (e.g., bentonite). To date, the effect of mix design, especially w/c ratio, as well as bentonite content and type, on the long-term time development of the microstructural properties and corresponding compressive strength of Plastic Concrete has yet to be systematically studied. Furthermore, in the literature, mercury intrusion porosimetry (MIP) and X-ray diffractometry (XRD) have yet to be applied systematically to Plastic Concrete for this purpose. The present study closes this gap. Ten Plastic Concrete mixes with two bentonite–cement ratios, three types of sodium bentonite and two swelling times were produced. MIP and XRD measurements and compressive strength tests were performed at sample ages of 7 d, 28 d, 56 d, 91 d and four years. The results show that both MIP and XRD can be successfully used; however, meticulous sample preparation and data analysis must be considered. The porosimetry results show a bi-modal pore size distribution, with two age-dependent peaks at approximately 10,000–20,000 nm and 100–700 nm. The results also exhibit a clear pore refinement over time, with coarse porosity dropping from 26% to 15% over four years. In addition, the fine porosity peak is significantly refined over time and positively correlates with the significant increase in compressive strength. The XRD results show no unexpected crystalline phases over the same period. Overall, this study links MIP and corresponding compressive strength data specifically for Plastic Concrete for the first time, confirming the key role that the mix design of Plastic Concrete plays in defining its long-term microstructural and mechanical properties and ensuring more realistic cut-off wall design in the future. In addition, the experimental boundaries for MIP testing on Plastic Concrete are set out for the first time, enabling future research in this field.

1. Introduction

1.1. Background

The most common solution for the remediation of earthen dams and levees is the design and construction of cut-off walls [1,2]. The planned cut-off wall is generally constructed as a slurry-trench wall [3] and extended into an underlying impervious stratum [4]. The excavated trench is filled with a support fluid to stop the excavated trench from collapsing and then backfilled using the tremie method [1,2]. For backfill materials, a wide range of possibilities exist, and there is growing interest in Plastic Concrete due to the material’s suitable characteristics [1].
Plastic Concrete is a low-strength, low-elastic-modulus concrete characterised by a high deformation capacity under load, which, in turn, decreases both rupture probability and crack opening width, which would result in an increase in material permeability [1,2,5]. The key component differentiating Plastic Concrete from ordinary concrete is the very high w/c ratio (w/c ≥ 3.0) used and the addition of water-binding additions (e.g., bentonite), which ensure fresh concrete stability and create a highly ductile and impermeable material [1]. Furthermore, Plastic Concrete has a low cement content (≤200 kg/m3) and uses regular aggregate with a maximum grain size of 12 mm (due to the segregation risk) [1]. With this, Plastic Concrete’s compressive strength typically ranges between 0.5 MPa and 2.5 MPa at 28 days [1].
In general terms, bentonite encompasses any clay rock composed of smectite minerals, which, in turn, dominate the physical properties [6]. Smectite minerals form platelets composed of three layers, with montmorillonite being the most typical representative, consisting of two SiO4-tetrahedrons on opposite sides of an AlO6-octahedron [7,8]. Due to the partial, isomorphic substitution of some cations, a layer charge is generated, which is, in turn, counter-balanced by other cations within the interlayer space such as Ca2+, Mg2+ or Na+ [8,9,10]. Furthermore, the weak layer charge permits the interlayer cations to adsorb and retain water molecules [9,11]. This water adsorption phenomenon causes the clay minerals, especially montmorillonite, to significantly increase in volume, multiplying their starting volume manifold [9,11].
Despite its indisputably beneficial material properties, Plastic Concrete has not yet been thoroughly studied. To date, the design of cut-off walls considers Plastic Concrete to be a linear-elastic material with a defined compressive strength at 28 days [12], and close to no studies provide reliable estimates of its material behaviour over time [1]. The lack of a realistic constitutive law for Plastic Concrete is not least because most previous studies do not establish to which extent the mix design and microstructural properties (especially porosity) influence Plastic Concrete’s mechanical and hydraulic behaviour over an extended period of time.
The most common method used to investigate the pore structure of cementitious materials is mercury intrusion porosimetry (MIP), as it covers the wide range of pore sizes present in hardened cement paste and is a relatively fast measurement technique. The measurement principle is based on applying an increasing pressure to force the intrusion of the non-wetting fluid mercury into pores while measuring the intruded volume for each pressure [13]. The higher the applied pressure, the smaller the sample pores that can be intruded, as described by the Washburn equation [14]. MIP requires unique sample preparation (e.g., direct drying) to evacuate all water in cementitious samples prior to sample testing [13]. The difficulty herein lies in removing as much free water from the pore space as possible and, at the same time, avoiding damaging the pore structure by capillary hydrostatic stresses due to receding water menisci during drying or by removing chemically bound water [13]. Despite criticism on the validity and accuracy of MIP for the quantitative determination of sample porosity due to these sample preparation techniques [13,15,16,17,18], MIP is still a valid measuring technique to comparatively study the pore structure changes of cement-based materials [19,20], e.g., with varying mix design or sample age.
Whilst some research has been carried out on the influence of clay additions on the microstructural and mechanical properties of standard concrete [21,22,23,24,25,26] (within typical w/c ratios ≤ 1.0), there have been few experimental investigations into the microstructural properties of very-high-w/c-ratio mixes (w/c ≥ 3.0) such as Plastic Concrete. Norvell et al. [23] established that the addition of clay, especially montmorillonite, clearly affects the properties of fresh and hardened standard-strength concrete, whilst clay-sized particles have a lesser effect. This is related to the clear water-binding capacity of smectite minerals, and its intensity can be correlated to the cation exchange capacity (CEC) [23]. Furthermore, as reported by Fam and Santamarina [27], the addition of cement to a bentonite slurry, with the accompanying high pH during cement hydration, favours the solubility of SiO2 and Al2O3, which interact with the Ca2+ ions from cement hydration. This increased concentration of Ca2+ causes cation exchange in the interlayer of Na-bentonite, causing shrinkage of the double layer and possible flocculation [27]. Shi et al. [28] reported a decrease in coarse porosity (>200 nm) over time in Plastic Concrete, as measured with MIP, which the authors ascribed to progressing cement hydration; however, the results were based on minimal data. Yang et al. [26] studied the effect of bentonite addition on cement mortar microstructure and established that bentonite addition causes pore refinement due to the reduction in free water during the initial stages of hardening and subsequently densifies the paste matrix. Furthermore, various studies have suggested that bentonite particles may cause a pozzolanic reaction with the Ca(OH)2 present after cement hydration [29,30,31]. It has also been suggested that bentonite may have a nucleation effect on cement phase hydration [26,30] and could incur a chemical reaction forming new crystalline phases [21]. However, despite various studies aiming to study these effects using X-ray diffractometry (XRD) or scanning electron microscopy (SEM), there is still no general agreement [21,28,31,32,33,34]. This is not least due to the explicit dependency of Plastic Concrete properties on the selected mix design and the chosen proportions of cement, bentonite and water, which dominate material performance, especially at high w/c ratios [35].

1.2. Focus and Research Questions

In conclusion, the existing literature does not systematically study the effect of mix design, especially w/c ratio, bentonite content and type, on the specific long-term time development of the microstructural properties and corresponding compressive strength of Plastic Concrete. Furthermore, the possible interaction between bentonite and cement remains unclear, especially in high-w/c-ratio mixes (w/c ≥ 3.0) such as Plastic Concrete. In addition, in the literature, MIP has yet to be applied systematically to Plastic Concrete at varying sample ages, with current Plastic Concrete studies failing to study the microstructural properties of the material beyond the 28-day mark. The successful application of MIP to low-strength concrete ( f c m , 28 d 1.0 MPa), such as Plastic Concrete, also remains to be proven.
This paper, therefore, aims to critically study the effect of Plastic Concrete mix design, especially bentonite content and type, on its microstructural properties. The focus also lies on the long-term (up to 4 years) time development of the microstructural properties of Plastic Concrete and the possible correlation with the material’s compressive strength. The study presented here is the first investigation to systematically use MIP and XRD specifically on Plastic Concrete samples and therefore also aims to set out the experimental boundaries of these measurement techniques for high-water-content, low-strength concrete samples such as Plastic Concrete and enable future studies in this field. The findings should also contribute to our understanding of Plastic Concrete’s microstructure development over an extended period of time (here, up to 4 years) and correlate these to the corresponding compressive strength development, further enhancing the accuracy and specifications of cut-off wall design.

2. Materials and Methods

2.1. Materials

2.1.1. Cement and Bentonite

In the present study, a German OPC cement CEM I 32.5 R was used according to EN 197-1 [36]. Three activated sodium bentonites from different European deposits were used to study the corresponding effect on Plastic Concrete performance: Bentonil CV15, Bentonil WW4 and Tixoton, all produced and provided by CLARIANT Deutschland GmbH. No further SCMs were added.
The chemical composition of the source materials, as determined through X-ray fluorescence analysis (XRF), is given in Table 1. The physical characteristics of the source materials are given in Table 2. In Table 3, the mineralogical composition, as determined by XRD, and the cation exchange capacity (CEC), as determined through the Cu-trien method defined by [37,38], of the bentonites used are shown.

2.1.2. Aggregates and Water

The aggregates used were local Rhine sand and gravel from Graben-Neudorf, Germany. The maximum aggregate size was dmax = 8 mm, in line with considerations in the literature [1]. The particle size distribution is shown in Table 4 and lies between control sieve curve A8 and B8 according to DIN 1045-2 [39].
The mixing water used was tap water from Karlsruhe, previously tempered to 20 °C, in line with the requirements according to DIN EN 1008 [40]. No admixtures were used since currently available PCE-based admixtures interact (negatively) with clay, rendering these ineffective [41].

2.2. Methods

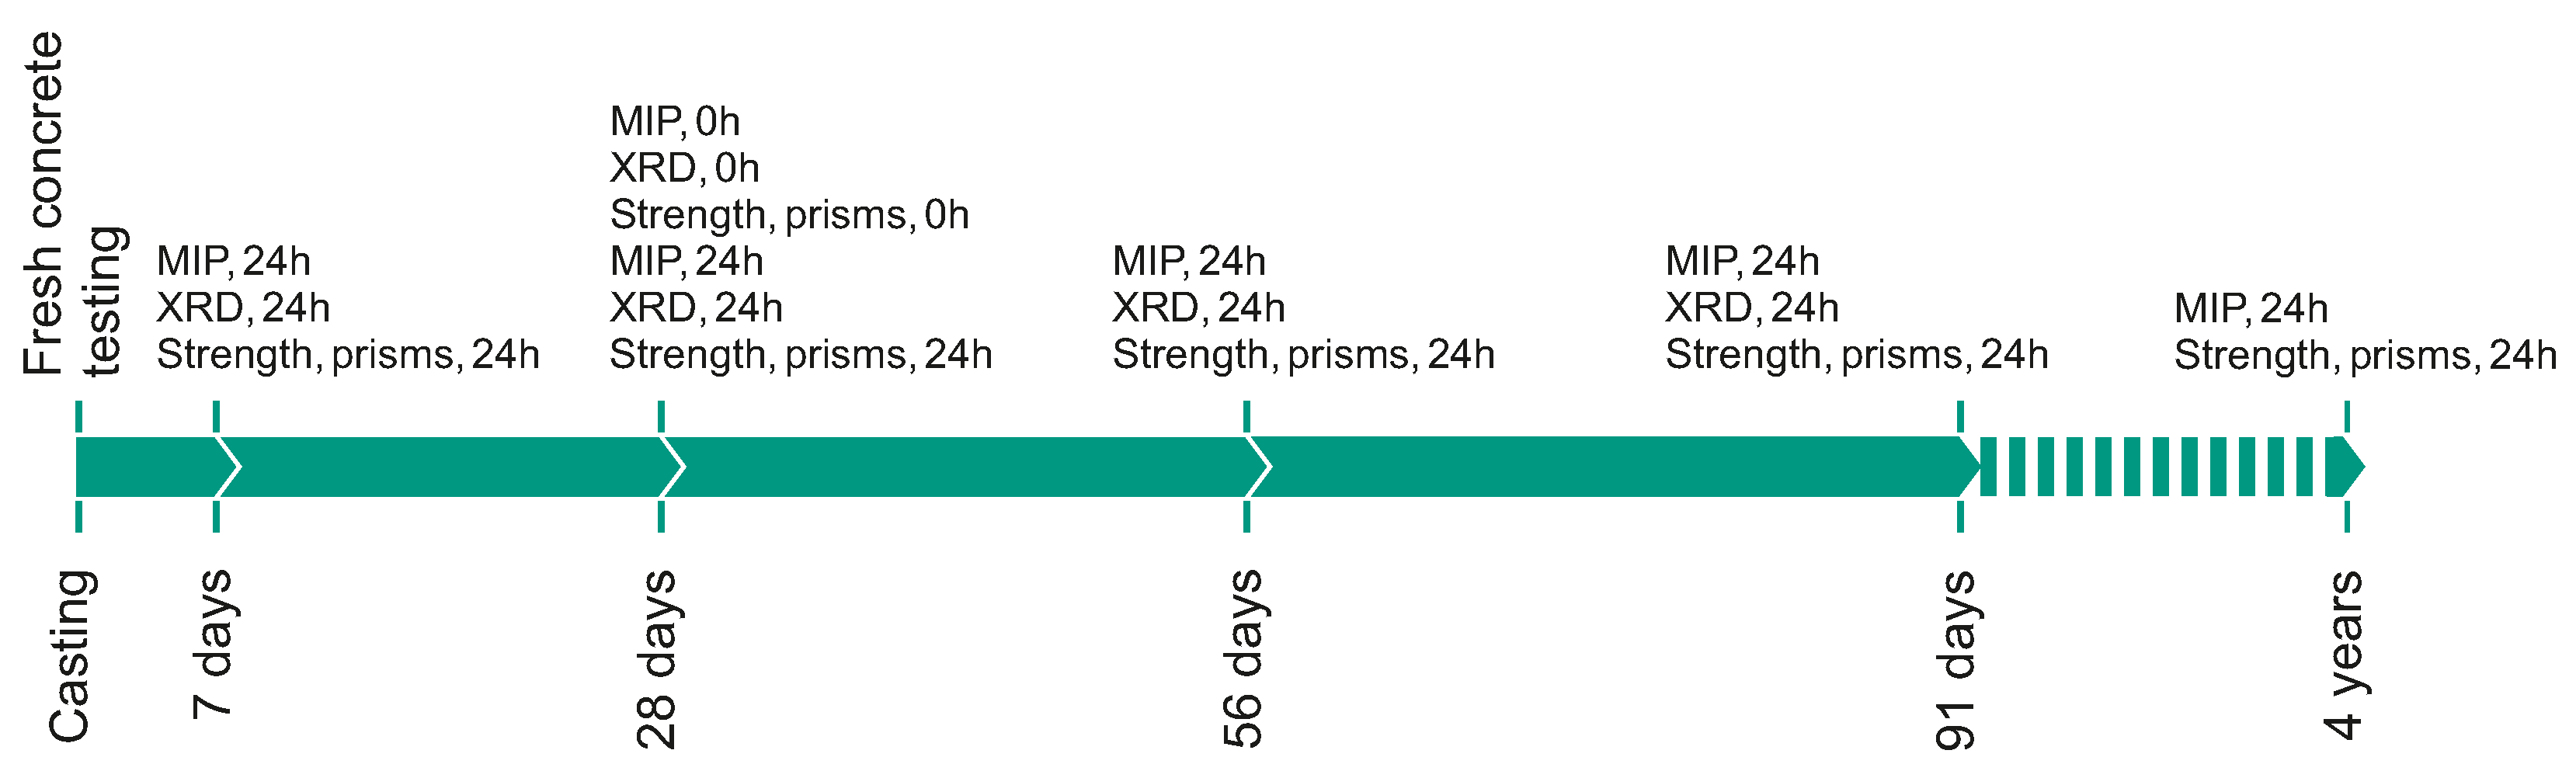
2.2.1. Experimental Setup and Mix Design

As mentioned in Section 1, the correlation between porosity and strength for Plastic Concrete has not yet been studied in detail. Traditionally, mercury intrusion porosimetry (MIP) is used to investigate the porosity of cementitious materials. Furthermore, it is common knowledge that the porosity of cementitious materials changes over time due to the hydration of cement phases. Therefore, this study investigated Plastic Concrete’s porosity change over time using MIP, with tests performed at 7, 28, 56 and 91 days. In addition, some samples were also tested after four years to account for long-term material behaviour. In addition, X-ray diffractometry (XRD) was performed at the same ages to detect any changes in the mineralogical composition over time. Compressive strength tests were also performed at the aforementioned ages to correlate material porosity with Plastic Concrete strength. A timeline of the experimental tests is shown in Figure 1. Some tests were performed with a 24 h bentonite slurry swelling process, some at 0 h, as noted by the indexes (see also Section 2.2.2).
To further understand the changes in Plastic Concrete porosity, the bentonite type, as well as the bentonite content, was varied. Three activated sodium bentonites were used (see Section 2.1.1), and the bentonite-to-cement ratio (b:c-ratio) was varied between 1:3 and 1:2, in line with established proportions in the literature [1]. Furthermore, two swelling times (24 h and 0 h) were used to investigate the possible influence of the bentonite slurry properties on Plastic Concrete porosity. An overview of the varying mix design factors and the corresponding designation of the mixes used are given in Table 5.
It is well established in the literature that the bentonite-to-cement ratio (b:c-ratio), as well as the w/c ratio, has a crucial influence on the material strength obtained for a Plastic Concrete mix [1]. A Plastic Concrete mix with 100 kg/m3 of cement and a w/c ratio of 4.0 was used to obtain a target compressive strength between 0.5 and 2.5 MPa at 28 days [1]. The mix designs of Plastic Concrete used in this study are shown in Table 6.

2.2.2. Concrete Batching and Fresh Concrete Testing

Based on the experimental setup developed in Section 2.2.1, and following the considerations in [1], the Plastic Concrete mixes in this study were produced by combining the dry components (cement and aggregate) with the (pre-hydrated) bentonite slurry. Since no standardised batching procedure exists for Plastic Concrete, this process is described in more detail.
The bentonite slurry was produced in a batch suspension mixer type SC-20-K from MAT Mischanlagentechnik GmbH (Immenstadt, Germany). This mixer reaches a rotational speed of approx. 3000 rpm (50 Hz) and has a nominal power of 5.5 kW. The capacity of the mixer is approximately 20 L, with which the bentonite slurry could be produced in one batch. The batch suspension mixer was filled with 20 L of water (pre-tempered to 20 °C), and bentonite powder was added evenly to avoid clump formation [42] and subsequently mixed in the mixer for 6 min to achieve a homogeneous bentonite slurry [1,43]. The slurry was then filled into buckets through a discharge pipe on the mixer. The 24 h swelling process and storage required for some mix designs also took place in these buckets, which were placed in a climate-controlled room with an air temperature of 20 °C and a relative humidity of 65%.
The fresh Plastic Concrete was mixed using a Zyklos ZZ 75 EH concrete mixer from Pemat Mischtechnik GmbH (Freisbach, Germany). This mixer has a nominal power of 3.3 kW, a rotational speed of approximately 70 rpm and a capacity of 75 L. Based on the required sample quantity, 40 to 50 L of Plastic Concrete was mixed, requiring only one batch per mix design. The ambient temperature in the laboratory was approximately 20 °C.
First, sand, gravel and cement were placed in the mixer drum and premixed for 1 min. After that, the bentonite slurry (with a prior 0 h or 24 h swelling time) was added to the mixer drum. The Plastic Concrete was then mixed for 5 min until a homogeneous concrete mix was obtained. This is in line with the most common mixing procedure for Plastic Concrete [1].
The finalised fresh concrete was then tested, with the slump test according to DIN EN 12350-2 [44] and flow table test according to DIN EN 12350-5 [45] being performed immediately after mixing. Following on from this, the fresh concrete density according to DIN EN 12350-6 [46] and air content according to DIN EN 12350-7 [47] were measured.
Thereafter, part of the concrete was cast into standard 40 × 40 × 160 mm3 steel prism moulds according to DIN EN 196-1 [48] and vibrated on a shaking table with a 40 Hz frequency for 15 s. All samples were then stored in the moulds for 72 h (due to the low early age strength) at 20 °C under plastic foil and wet jute to avoid desiccation of samples following DIN EN 12390-2 [49]. The demoulded samples were then cured under water at 20 °C for the entirety of the sample storage duration.

2.2.3. Mercury Intrusion Porosimetry (MIP)

To ensure comparability of all MIP measurements, it is vital that sample preparation and testing are carried out identically [20]. Therefore, the cast and stored prisms were removed from the water bath and surface dried. After that, a centre piece of the prism was extracted with a chisel and a hammer. The obtained granulate was then oven dried at 60 °C for 24 h, achieving mass constance (see also Section 3.3.3).
Mercury intrusion porosimetry was conducted according to DIN EN 15901-1 [50] using two different devices. The main part of the measurements was carried out in the laboratories of the Institute of Concrete Structures and Building Materials (IMB) using a Micrometrics Autopore V porosimeter. The other measurements were carried out at the Institute of Applied Geosciences (AGW) using a Micrometrics Autopore IV porosimeter. In both cases, the mercury pressure increase was applied stepwise in 142 steps. The measurement was performed in two regimes: a low-pressure regime from approximately 0.004 MPa to 0.2 MPa and a high-pressure regime from approximately 0.2 MPa to 406 MPa. These correspond to pore entry radii of approximately 210,300 nm to 3700 nm and approximately 3700 nm to 1.9 nm, respectively. The contact angle was set to 141.3°, as no cement–bentonite-specific contact angle is available in the literature [51]. Due to the different penetrometers used, the sample mass at IMB was approximately 2.5 g and at AGW approximately 1.0 g. However, it was ensured that the STEM volume (percentage of the maximum intrusion volume utilised in each station) was within the manufacturer’s recommendations (between 25% and 90%) for all measurements at both institutes. For every point in time and selected mix, at least two separate samples were tested.

2.2.4. X-Ray Powder Diffractometery (XRD)

Similarly to the MIP testing, a part of the granulate obtained from the centre piece of the stored prisms was oven dried at 60 °C for 24 h and then ground using a mortar. The obtained powder was then sieved through a 10 μm sieve and loaded into a preparation holder from the back side to ensure a low preferential orientation [52].
X-ray powder diffractometery was conducted according to DIN EN 13925 [52,53,54]. The XRD device used was a D8 Advance diffractometer from Bruker AXS GmbH (Karlsruhe, Germany). CuKαradiation was used with the angular range 2θ between 5° and 70°.

2.2.5. Compressive Strength Testing

Since the Plastic Concrete studied here has a maximum aggregate size dmax of 8 mm, prisms could be used for compressive strength determination. Three prisms were cast following DIN EN 196-1 [48] for all given ages and mixes. The cast prisms were removed from the water bath curing and surface dried using a cloth towel. Thereafter, the prisms were halved and subsequently used for compressive strength testing (testing cross-section 40 × 40 mm2). The compressive strength was not tested according to DIN EN 196-1 [48] but according to DIN EN 1015-11 [55] since the loading speed could be changed in line with the low strength requirements of Plastic Concrete. The loading speed was set to 0.005 kN/s for testing lasting up to 91 days, as similarly described in DIN 4093 [56] for the testing of strengthened soil samples. For the 4-year-old samples, the loading speed was set to 0.025 kN/s to account for the expected higher strength of these samples.

3. Results

3.1. Fresh Concrete Results

As mentioned in Section 2.2.2, fresh concrete tests were performed on the concrete batches produced. Figure 2 provides an overview of the fresh concrete test results.
The graph shows that, at a constant b:c-ratio, the bentonite type used clearly affects the concrete workability, with mixes produced with Tixoton displaying the highest workability overall. This is likely due to the varying water-binding capacity of the different bentonites used in the presence of cement particles, which also affect the stability of the concrete mixes. The results also show that, as expected, for one constant bentonite type, a higher b:c-ratio incurs lower concrete workability due to the water-binding capacity of bentonite. The results are in agreement with other research, where a similar workability loss with increasing bentonite content was reported [23,24,25,34]. On the other hand, no significant difference between the two swelling times (0 h and 24 h) is evident for identical mix compositions. Finally, the results display a good correlation between the flow table and slump test results for Plastic Concrete fresh concrete testing, as expected for concrete within this consistency range. However, further fresh concrete testing should be conducted to ensure the reproducibility of these test results. Therefore, a further study by the authors addresses this issue and analyses the correlation between both test methods [57].

3.2. Compressive Strength Results

As mentioned in Section 2.2.5, the compressive strength was tested according to DIN EN 1015-11 [55]. For every point in time and selected mix, three prisms were split under tension. Subsequently, six prism halves (testing cross-section 40 × 40 mm2) were tested on compression. In Figure 3, the results from compressive strength testing over time are shown, with each point representing the mean value of six results.
Figure 3 shows that the compressive strength increases steadily from 7 days onwards. The compressive strength at 28 days lies between 0.50 MPa and 0.75 MPa, consistent with the results expected from the literature for the chosen mix [1,35]. In addition, the strength increase beyond 28 days is far greater than that of standard concrete, likely due to Plastic Concrete’s far higher w/c ratio. Moreover, these results are consistent with the literature findings that suggest retardation of cement hydration through the addition of bentonite [27,33,58]. The compressive strength of the Plastic Concrete samples tested here increases by approximately 50% to 80% between 28 days and 91 days.
Moreover, the results show a clear correlation between compressive strength and the b:c-ratio used since, for a given bentonite type, the compressive strength of mixes with a 1:2 ratio (circles) lies above that of 1:3 mixes (squares). This is consistent with the assumption that higher bentonite content is incurred at a lower effective w/c ratio, allowing for a more dense cementitious matrix and thus increasing the compressive strength [33,58]. The overall strength is, however, also dependent on the bentonite type used, for which the literature currently does not provide any apparent cause.
Plastic Concrete’s compressive strength development over time is very significant and is therefore investigated in more detail in a further study by the authors [57].

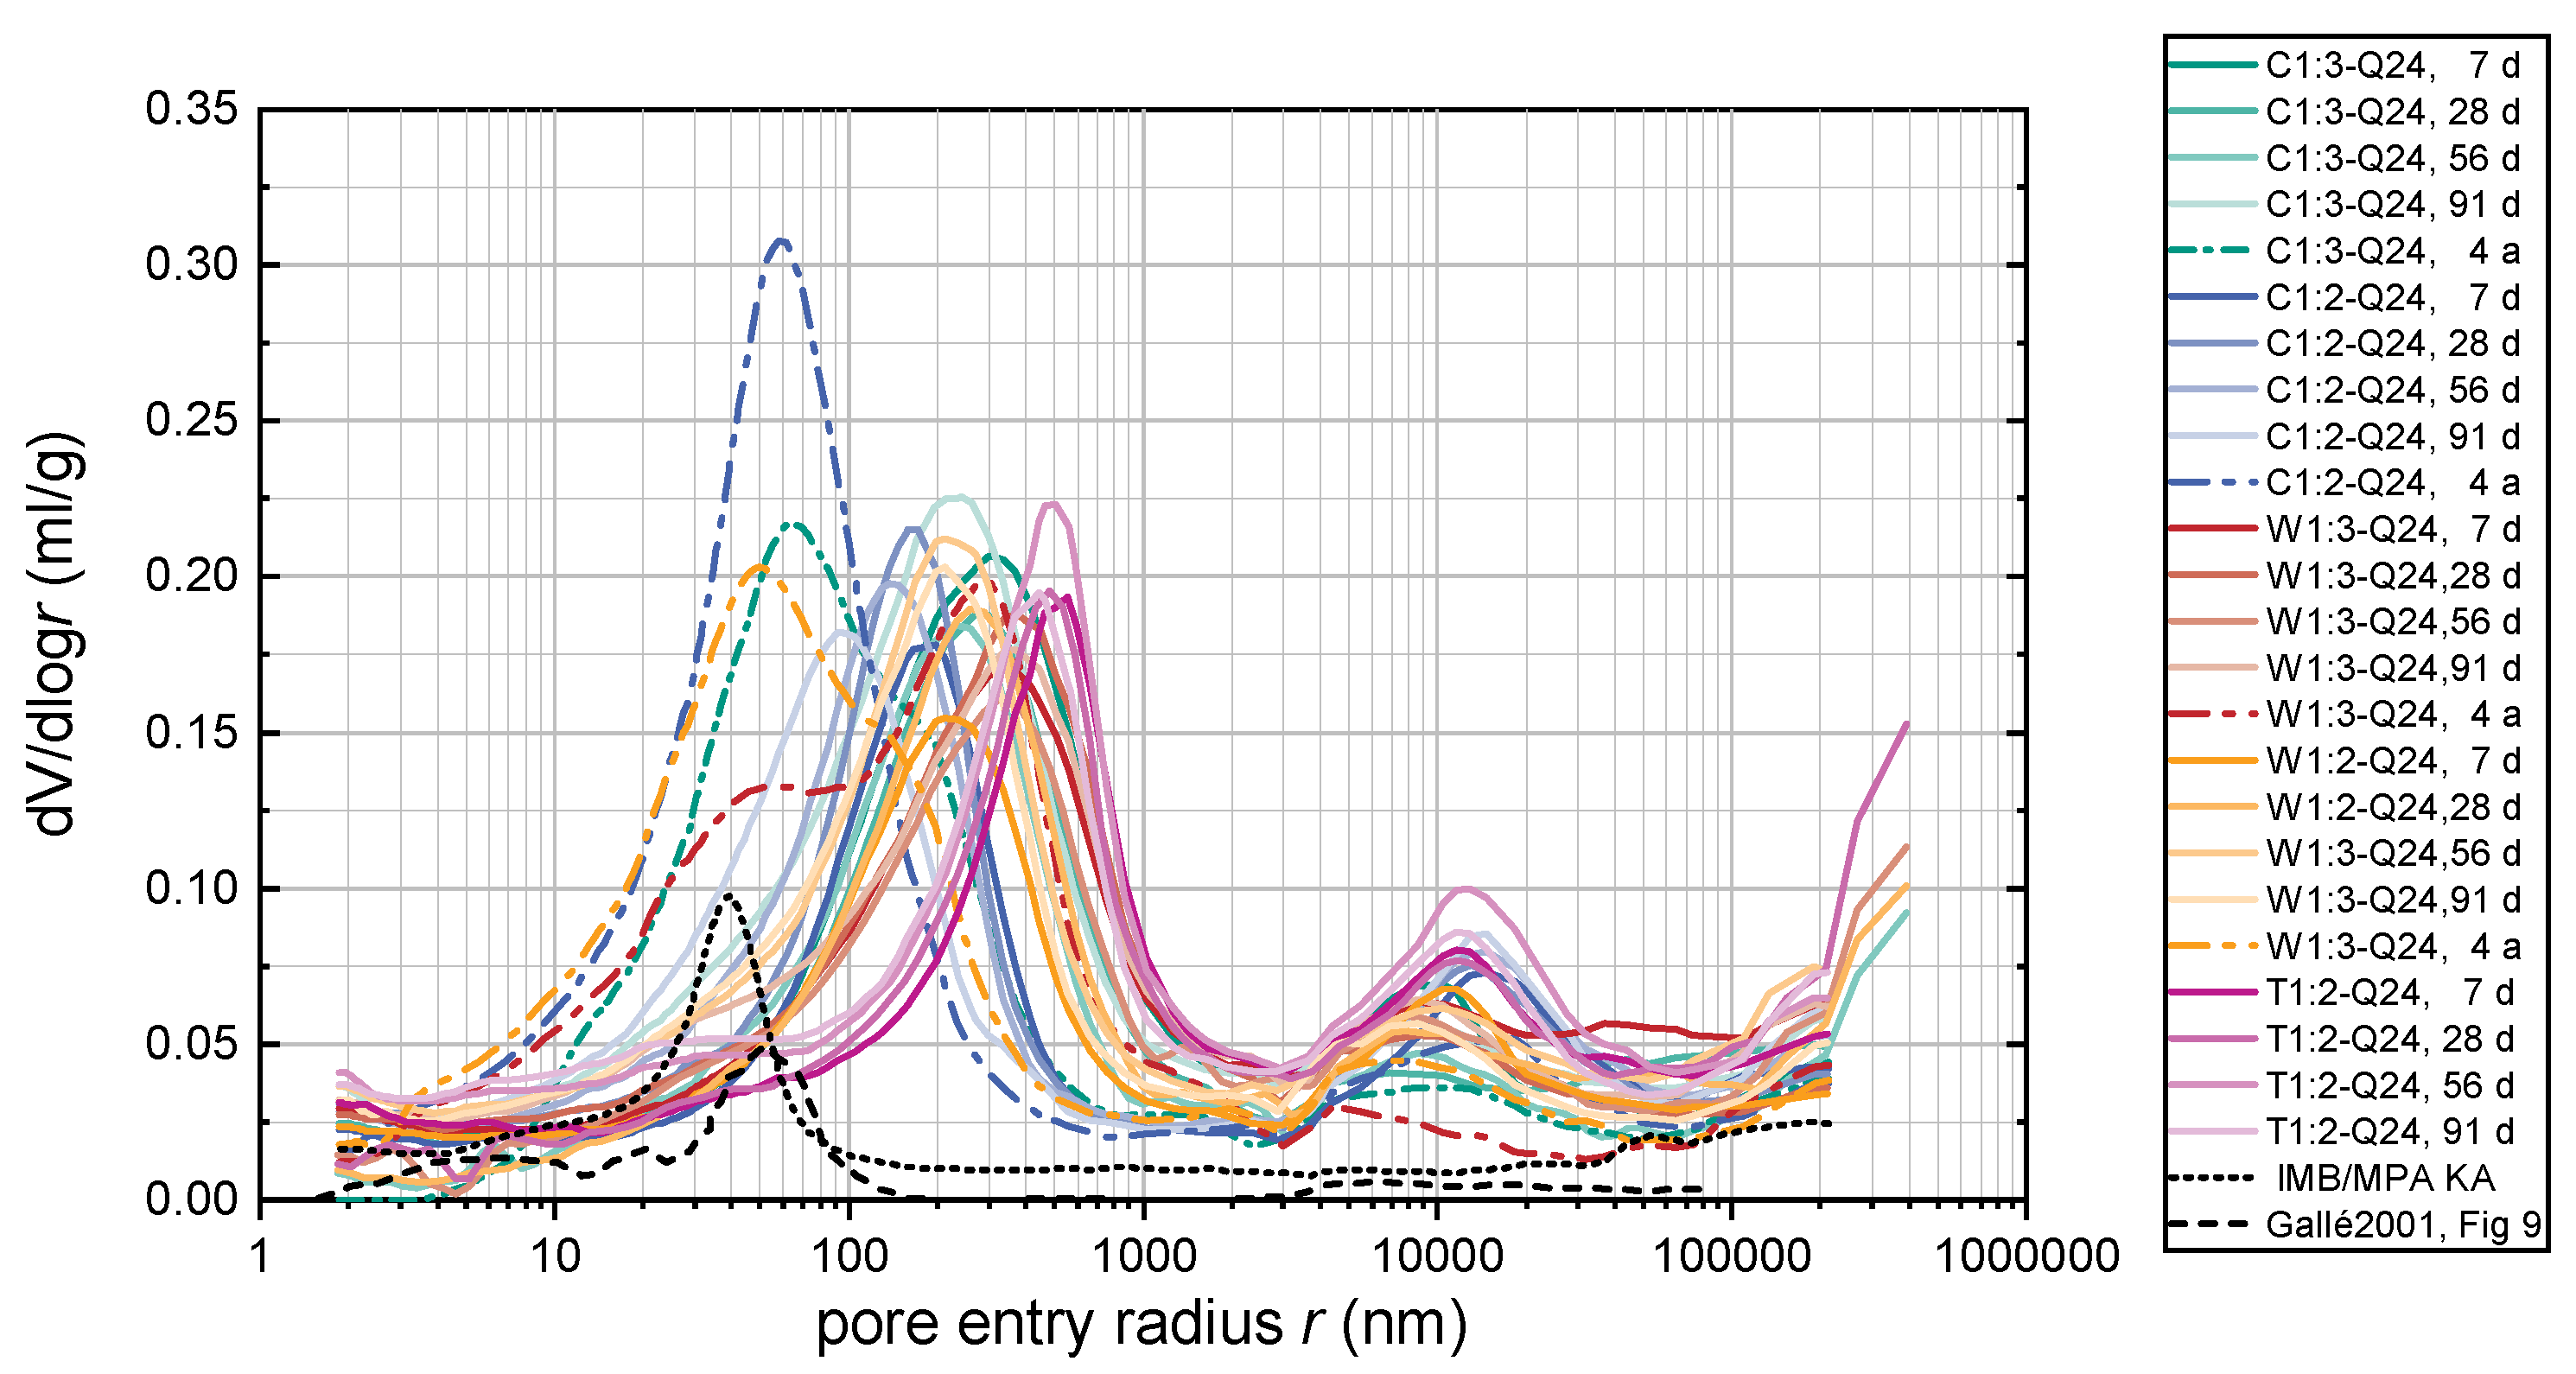
3.3. Porosity Using Mercury Intrusion Porosimetry (MIP)

In Figure 4, the differential mercury intrusion porosimetry results of all tests performed on samples with 24 h swelling time (Q24) at all ages are shown. Standard concrete results from [17] and from internal research at the authors’ institute at a sample age of 28 days with similar drying techniques are shown for comparison purposes.
Firstly, it can be seen that Plastic Concrete samples have a far greater overall porosity than standard concrete, shown by a far higher mercury intrusion volume. In addition, Plastic Concrete samples compellingly show a bi-modal porosity distribution not present in standard concrete. However, it is common knowledge that differing sample preparation techniques and porosimeter settings may affect the results obtained from testing [17,20,51]. As mentioned in Section 1, no systematic MIP tests on Plastic Concrete have been reported in the literature to date. Therefore, no precedent Plastic-Concrete-specific settings could be used, and general concrete settings were relied on. Thus a more detailed investigation into the porosimeter settings and sample preparation techniques was conducted within this study. In the following, various aspects are highlighted which detail the sample preparation, data interpretation and data validation efforts taken into account in this paper.

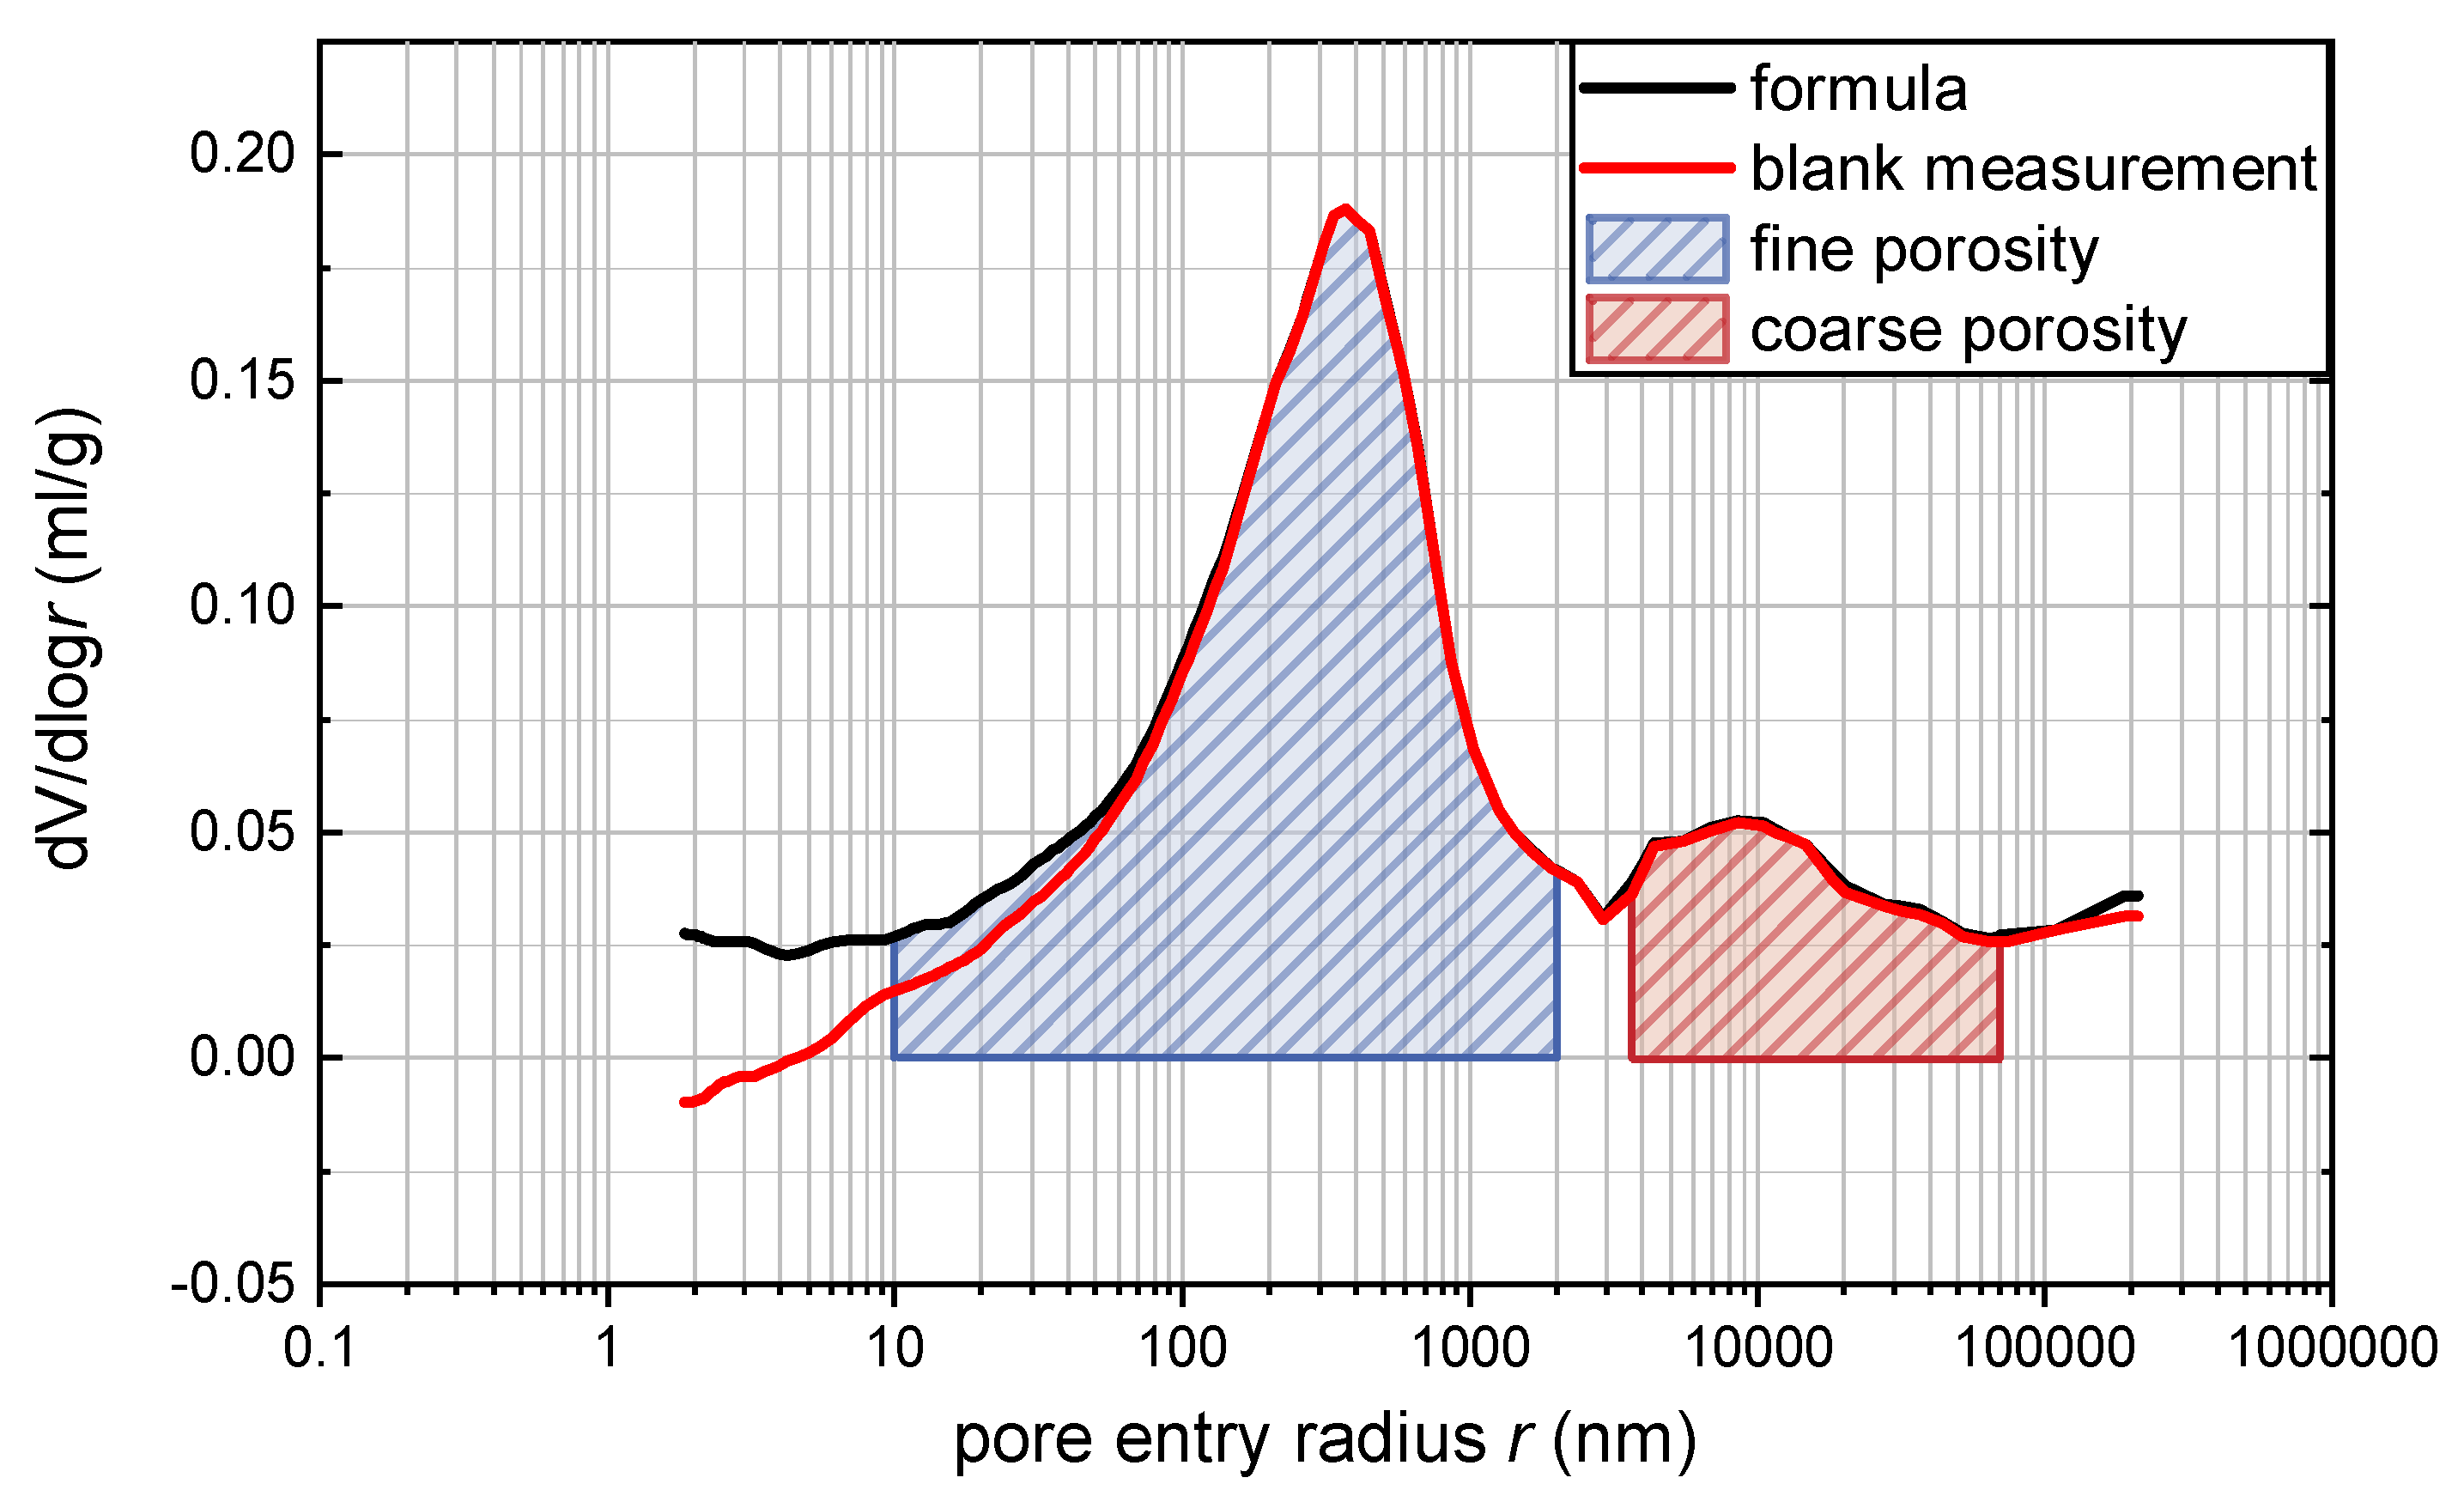
3.3.1. Influence of Porosimeter Settings

As mentioned in Section 2.2.3, two separate mercury intrusion porosimeters were used, with both performing tests applying a low-pressure regime and a high-pressure regime.
In addition, for the reliable evaluation of sample porosity, the following changes during the measurement have to be compensated: the compressibility of mercury and oil, the change in dielectric constants and the change in sample vessel (penetrometer) volume. At the Institute of Concrete Structures and Building Materials (IMB), this was achieved by performing a blank measurement (without any sample) for each sample vessel with the same conditions as the samples and subtracting this baseline (hereinafter “blank measurement calibration”). However, at the Institute of Applied Geosciences (AGW), another possible procedure was used. For each measurement, the same stored formula provided by Micromeritics and based upon the averages of large numbers of different blank measurements of various materials was applied (hereinafter “formula calibration”). A comparative example of the mercury intrusion porosimetry test results is given in Figure 5.
It becomes apparent from Figure 5 that the two calibrating methods provide similar results for a wide pore entry radius range between 70,000 nm and 100 nm. For a very small pore entry radius, especially those smaller than 10 nm, there is a clear diverging trend between both methods. The formula calibration displays an unexpectedly high porosity below the 10 nm mark, clearly overestimating this porosity range. On the other hand, the blank measurement calibration exhibits negative porosity for a pore entry radius smaller than 4 nm, which is also technically impossible. However, since no blank measurement runs were conducted at AGW, all test results from both porosimeters were recalibrated using the formula calibration to ensure overall data comparability. To ensure correct data validation, the porosity for a pore entry radius smaller than 10 nm is therefore excluded from further analysis.
For a very large pore entry radius above 70,000 nm, the porosity increases unexpectedly. This behaviour can be attributed to two effects: On the one hand, the tested Plastic Concrete samples contain aggregates which incur gaps between the individual sand grains in this order of magnitude. On the other hand, MIP can reach its experimental limitations since very large pore entry radius correspond to very-low-pressure regimes, close to the atmospheric pressure, and cause unreliable measurements. To ensure correct data validation, the porosity for a pore entry radius greater than 70,000 nm is therefore excluded from further analysis.
Furthermore, all test results (as also shown in Figure 4) display a drop in mercury intrusion at a pore entry radius of approximately 3000 nm. This radius corresponds to the radius at which the samples must be moved from the low-pressure to the high-pressure testing apparatus within the mercury intrusion porosimeter (see also Section 2.2.3). Therefore, the drop in porosity should be ascribed to the test setup and not material behaviour. Thus, the porosity for a pore entry radius between 4000 nm and 2000 nm is excluded in further analysis.
Taking into account all aforementioned influencing parameters, it seems reasonable to only evaluate the overall porosity in two separate segments, defined as coarse porosity (with a pore entry radius of 70,000 nm to 4000 nm) and fine porosity (with a pore entry radius of 2000 nm to 10 nm), marked in Figure 5. The fine and coarse porosity results will be discussed in Section 4.

3.3.2. Influence of Multiple Measurements

To ensure the repeatability of measurements, preliminary testing was conducted. Three Plastic Concrete samples were prepared from one prism, and triple measurement was performed. Figure 6 displays the average porosity of the three samples and the associated standard deviation.
These data show that the standard deviation is relatively low overall and most pronounced at the fine (left) porosity peak and for large pore entry radius values above 70,000 nm. Since the most pronounced standard deviation in the left peak is limited to a short pore entry radius range, its effect is minor on the cumulative porosity. Furthermore, the larger standard deviation for pore entry radius values above 70,000 nm does not affect the following data interpretation since this porosity was already discarded (see Section 3.3.1). Due to the results mentioned above from the preliminary study, all following mercury intrusion porosimetry tests were performed solely with double measurement.

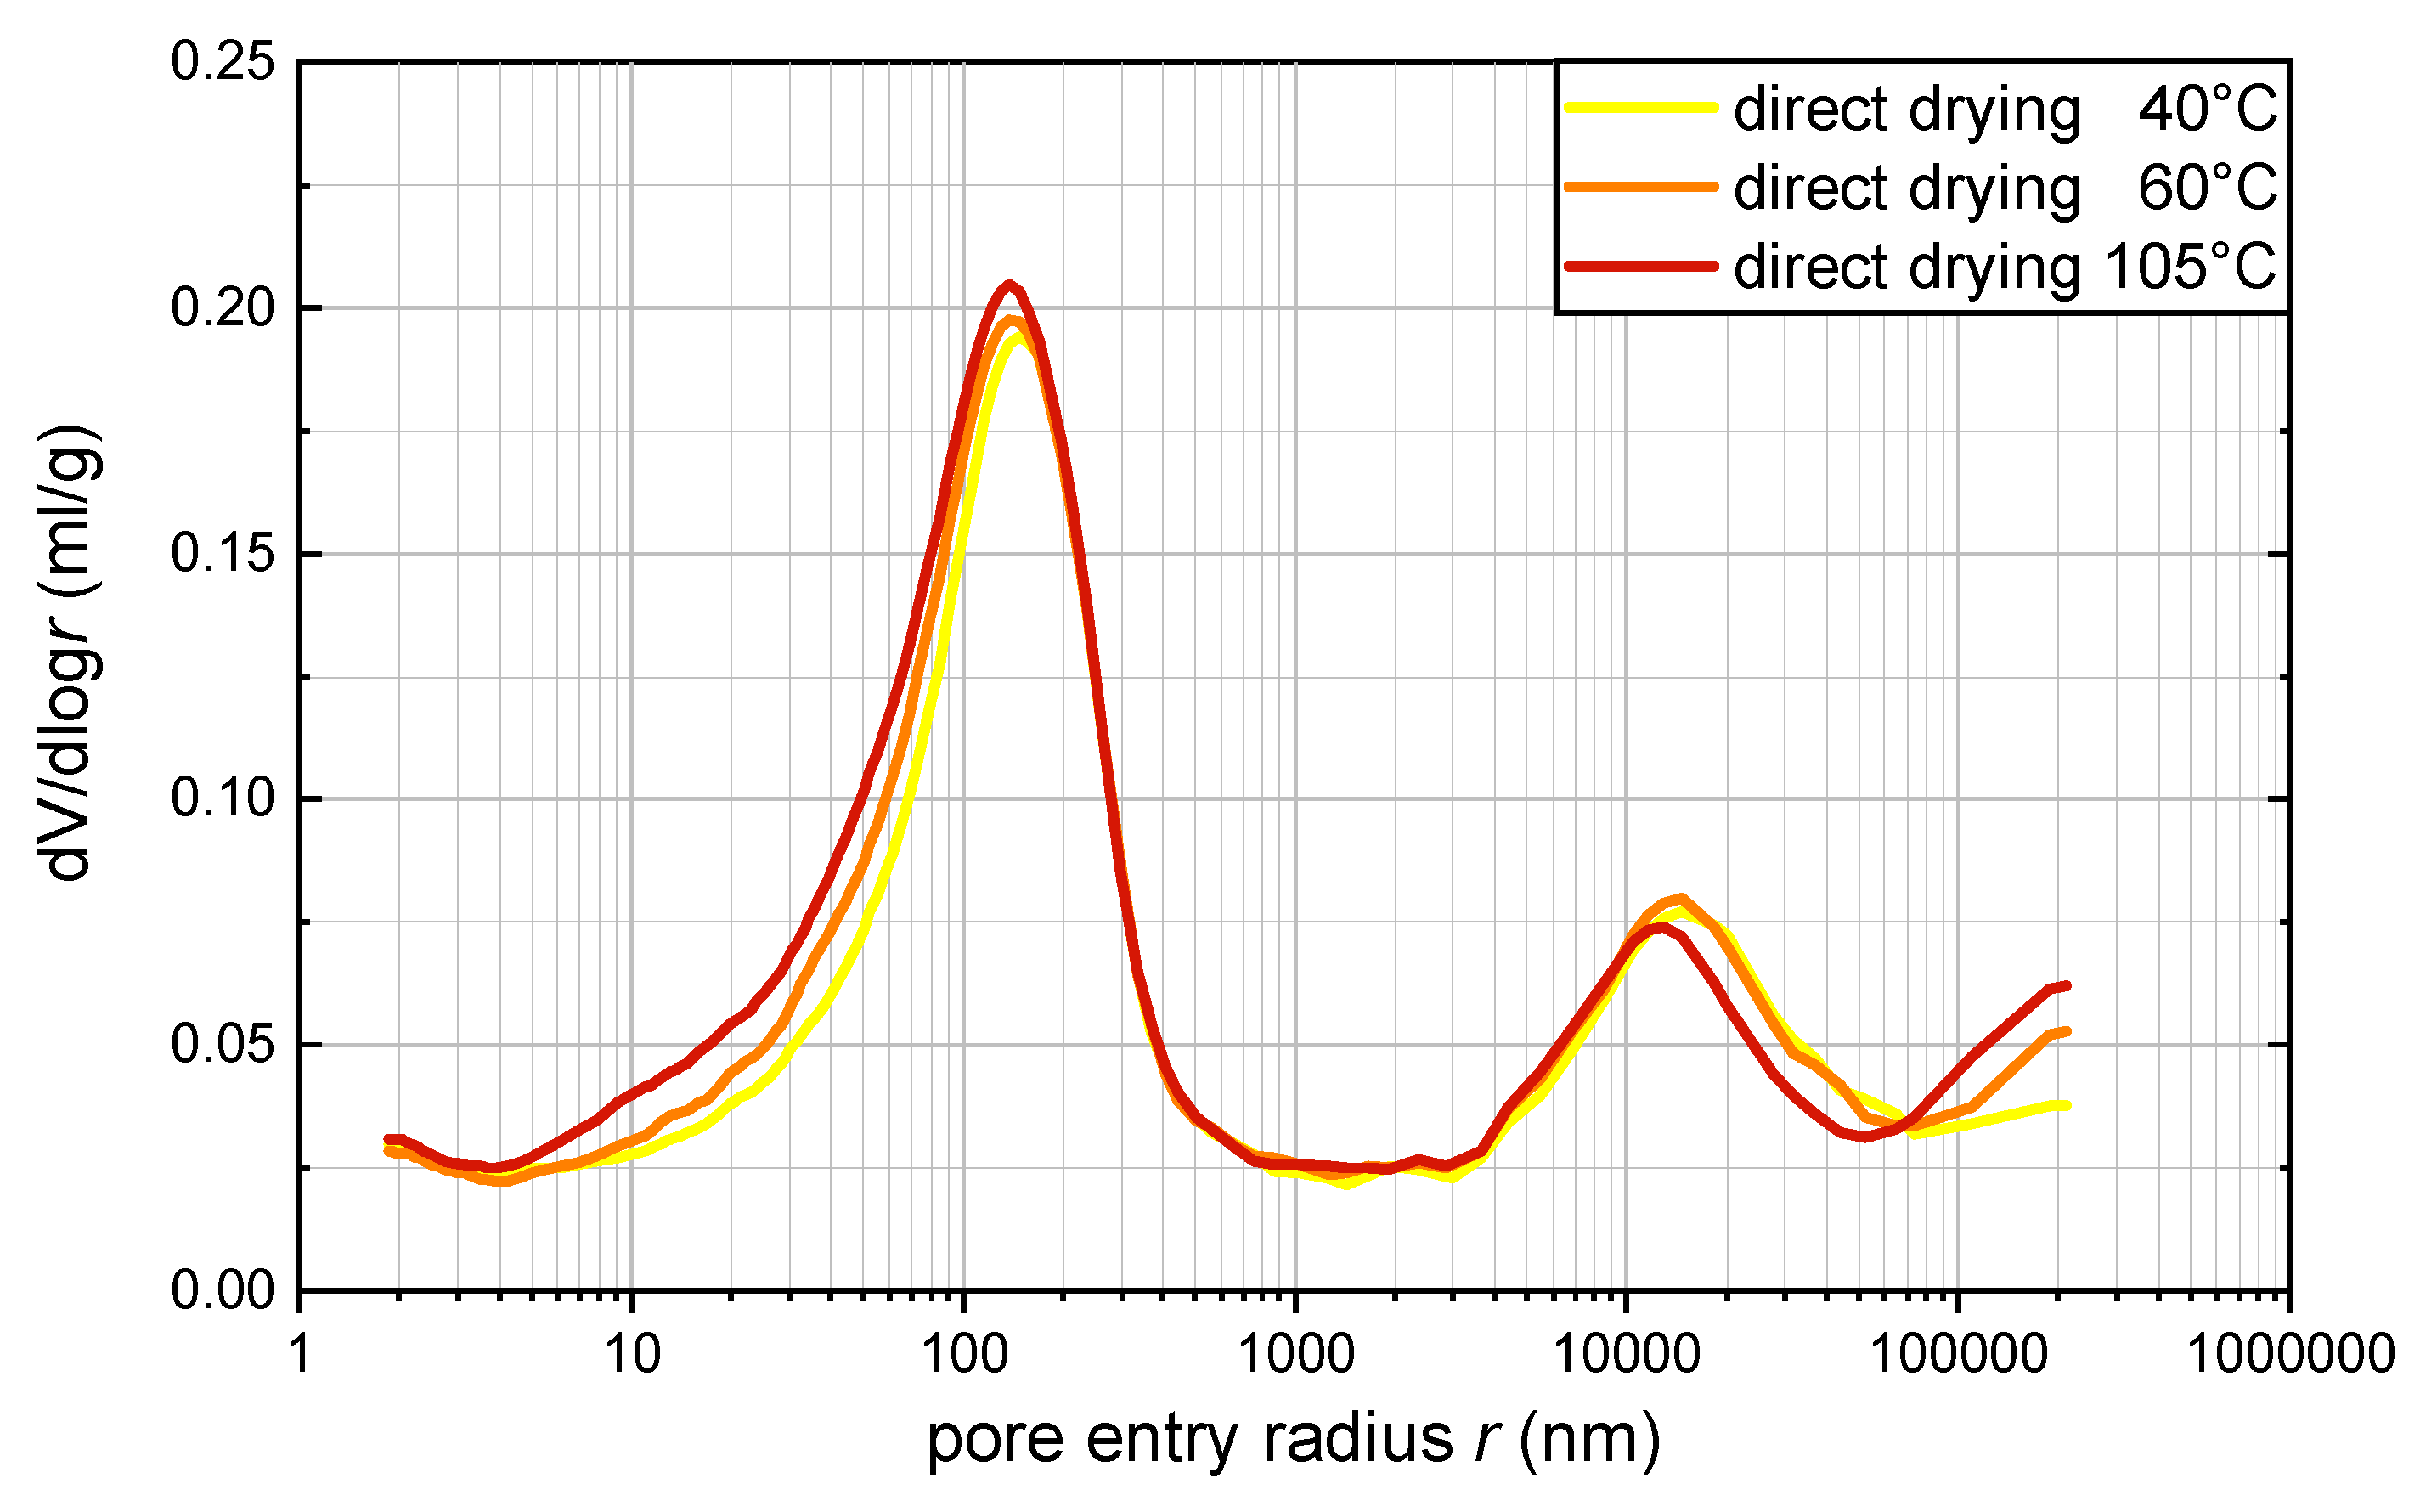
3.3.3. Influence of Drying Temperature

It is common knowledge in the literature that the drying temperature influences the measured porosity of samples [13,17,18]. Especially, too high drying temperatures may cause the pore structure to collapse, increasing the number of large pores. Therefore, to establish the influence of the drying temperature specifically on Plastic Concrete samples, a preliminary study was performed with one Plastic Concrete mix by varying the drying temperature of the prepared granulate before testing. Three granulate samples were therefore oven dried at 40 °C, 60 °C and 105 °C for 24 h, respectively, achieving mass constance. The samples were then tested using an identical MIP test setup. The mercury intrusion porosimetry results are shown in Figure 7.
The results indicate that, within the valid data range between 70,000 nm and 10 nm, some differences in porosity exist with different drying temperatures. As reported in [13], it can be expected that higher drying temperatures incur a shift of the left peak towards a larger radius. However, this cannot be observed here. A sample direct drying temperature of 105 °C exhibits a higher porosity between 10 nm and 100 nm and an apparent shift towards a smaller pore entry radius, as shown in Figure 7. On the other hand, the coarse porosity between 10,000 nm and 70,000 nm is slightly reduced, and an apparent shift towards a larger pore entry radius is visible. It can therefore be confirmed that direct drying at 105 °C leads to a slight overestimation of total porosity, as described in [17]. No significant differences can be observed between direct drying at 40 °C and direct drying at 60 °C. In line with these results, the drying temperature for all the following experiments was therefore set to 60 °C to ensure sufficient, fast drying of specimens with the lowest possible level of structure damage.

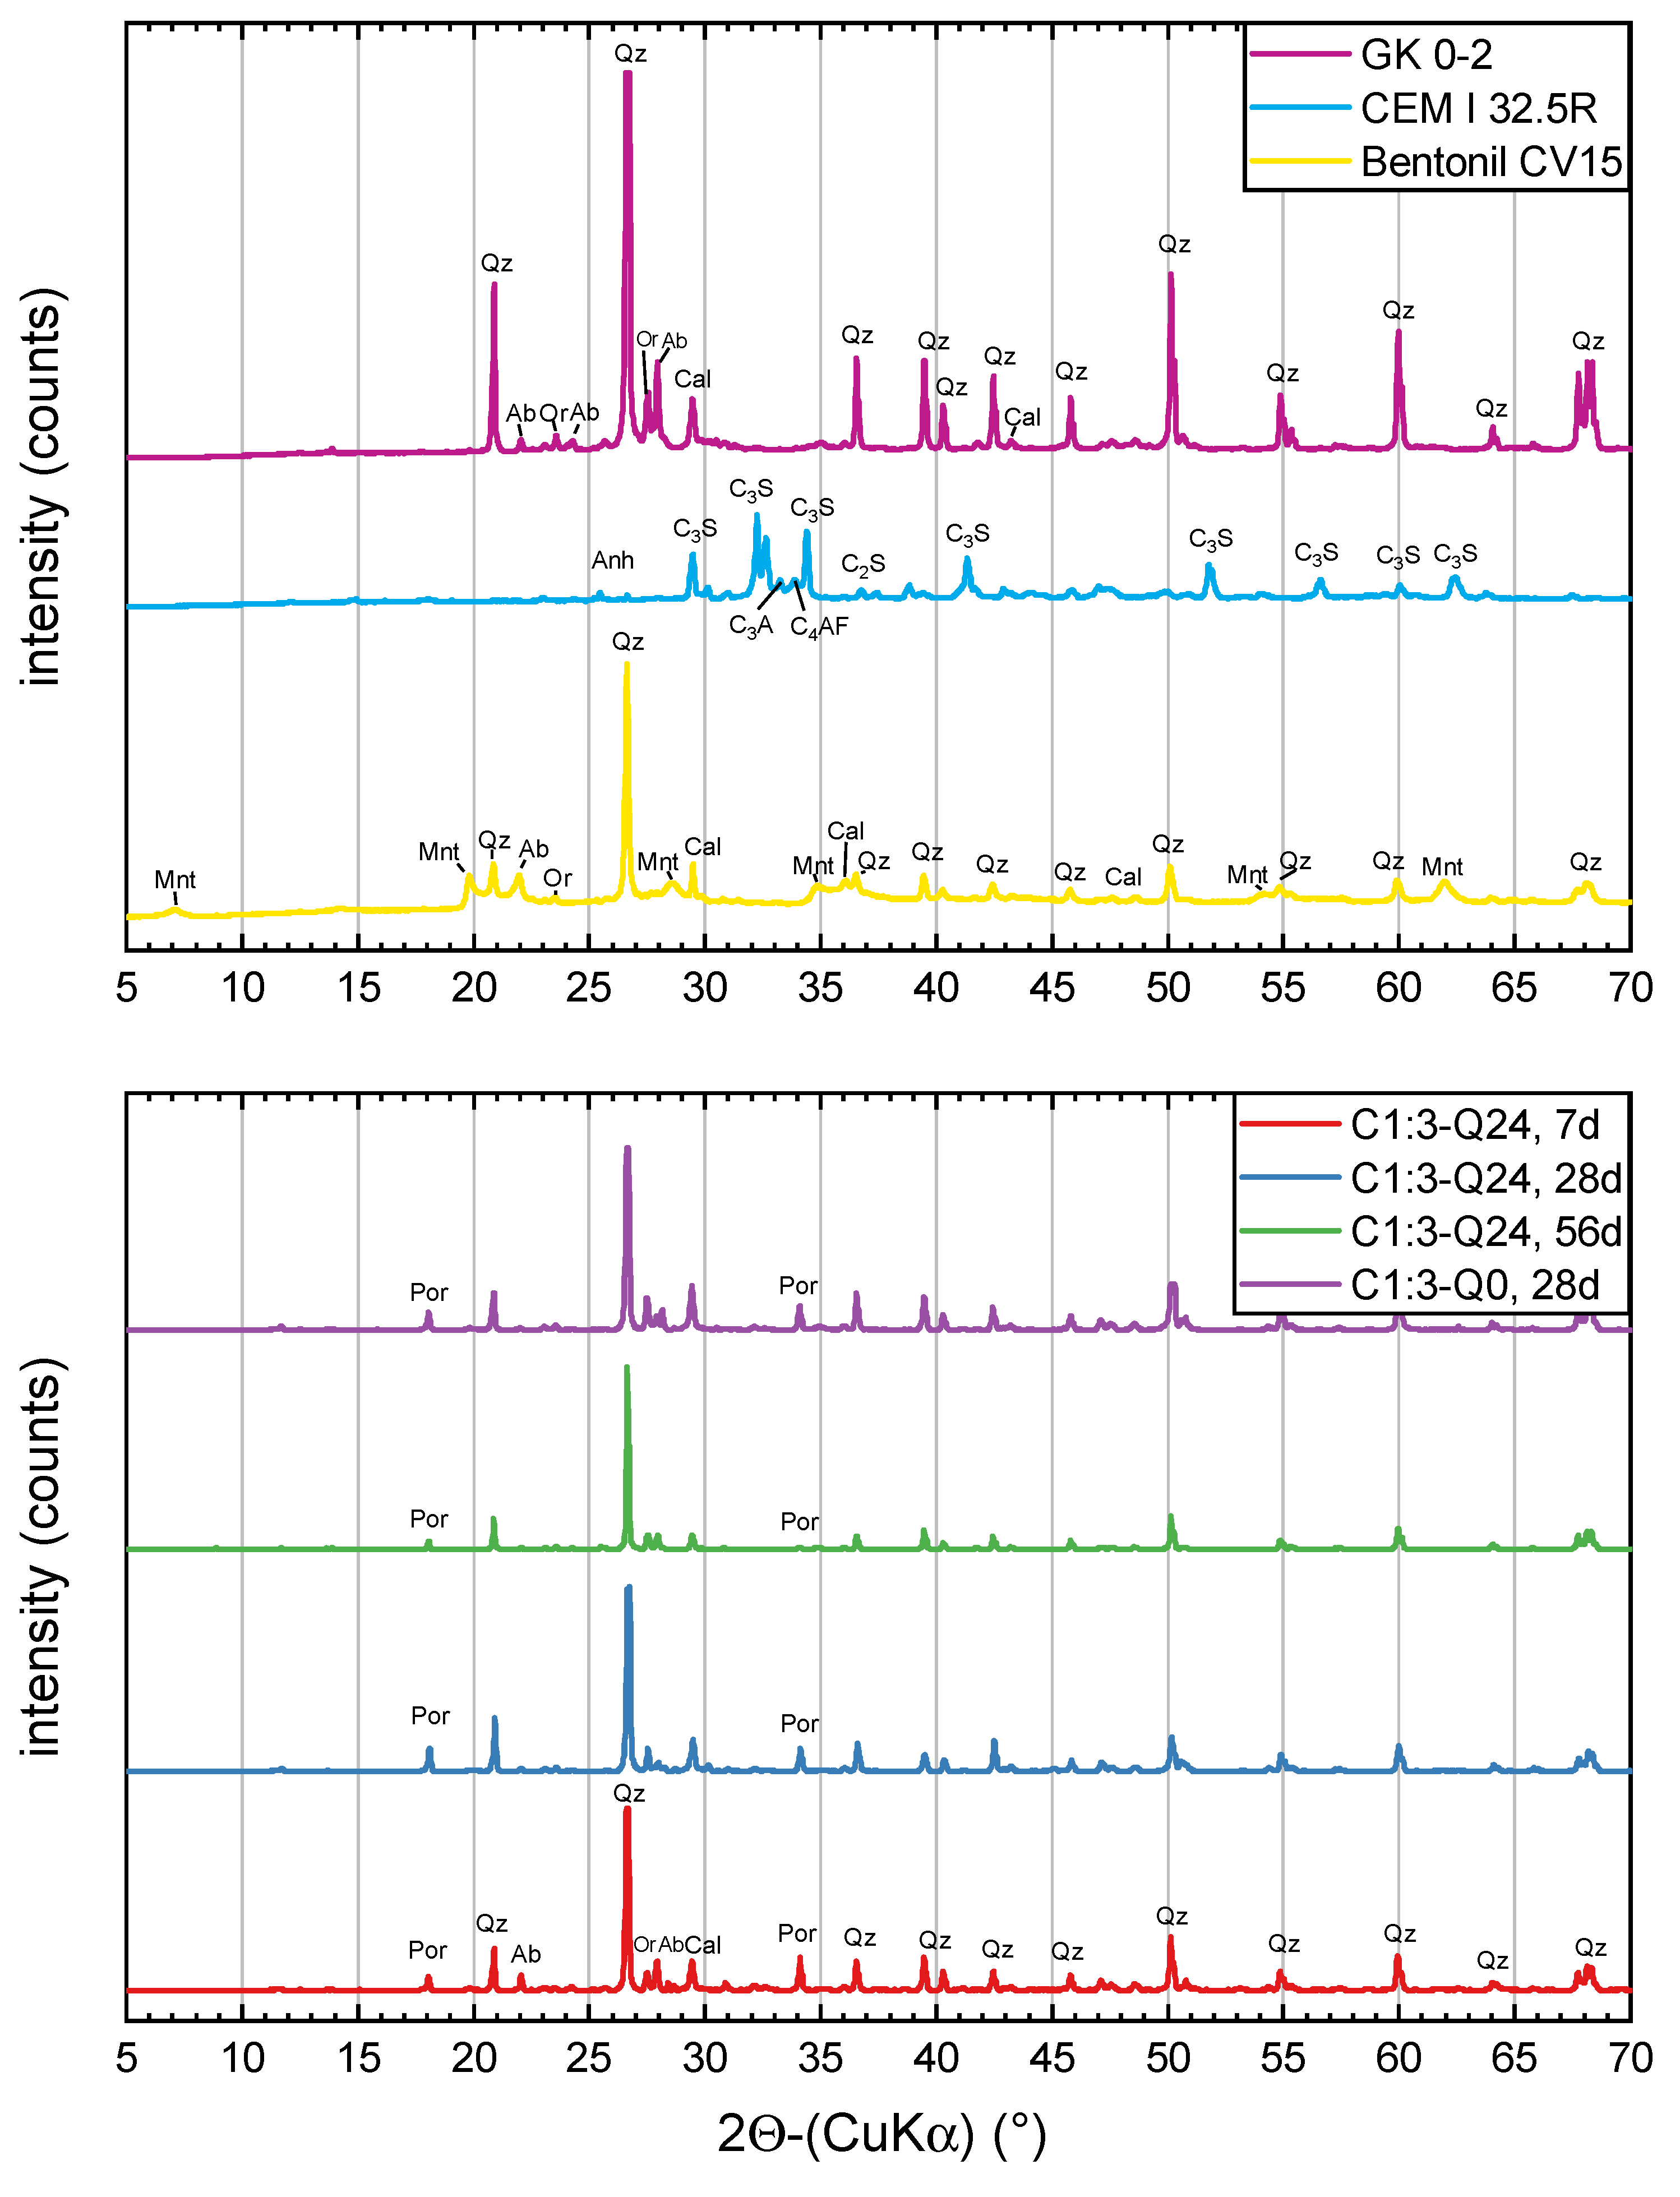
3.4. X-Ray Powder Diffractometery (XRD)

As described in Section 2.2, all Plastic Concrete samples up to the age of 91 days were also tested using X-ray powder diffractometry (XRD). In Figure 8, the X-ray diffractograms of the mixture C1:3, illustrative of all other diffractometery results, at different test ages and swelling times are compared. In addition, the diffractograms of the source materials are also shown.
It is apparent that the results of the Plastic Concrete mixes are almost identical, independent of test age or swelling time. The minimal differences in signal intensity are likely due to sample preparation inhomogeneities. Compared to the source materials, it also becomes clear that the more prominent peaks can be attributed to the aggregates used, especially quartz phases. Bentonite (e.g., montmorillonite) peaks are barely visible in the overall peak intensity of the Plastic Concrete samples. Moreover, some bentonite peaks overlap with those of the aggregates. Some minor changes in the peak intensity of portlandite (Ca(OH)2) can be seen, which correspond to the typical depletion of portlandite during cement hydration [60]. These results reflect those found in the literature, where no additional unexpected mineral phases were observed [28,32,34].
Nonetheless, this cannot rule out the formation of crystalline and amorphous phases due to the measurement uncertainty inherent to XRD testing. Further investigations using other methods (e.g., NMR) or procedures are needed to fully rule out the formation of such phases.

4. Discussion

4.1. Analysis of Bi-Modal Porosity Distribution

The results in Figure 4 show that the Plastic Concrete samples displayed a bi-modal porosity distribution. In addition, the porosity of Plastic Concrete samples was far greater, in a significantly wider porosity range, than that of the standard concrete samples. Especially, the displayed coarse porosity (with a pore entry radius of 70,000 nm to 4000 nm) and its corresponding peak should be analysed in more detail.
It is possible to hypothesise that the coarse porosity peak at approximately 10,000 nm to 20,000 nm occurred due to shrinkage processes in the cement–bentonite paste, caused primarily by the high water content in the Plastic Concrete paste matrix. To follow up on this theory, some of the aforementioned prism samples were taken out of the water bath, split and subsequently studied using light microscopic imagery captured with a Keyence VHX-2000 microscope at a magnification of 1200×. In addition, the same sample was then dried at 60 °C for 24 h and subsequently placed under the microscope in the identical position. The comparative microscopic imagery results of one sample are shown in Figure 9.
It can be seen that the cement–bentonite paste (white) is evenly distributed around the aggregate particles, and no cracking can be seen. After a 24 h drying process at 60 °C, it becomes apparent that the drying process results in microscopic, shrinkage-related cracking, with cracks varying in width from 12 μm to 37 μm. These cracks may also occur in standard cement paste (without bentonite), and can be ascribed to irreversible shrinkage during sample drying, and must be considered as part of MIP’s limitations during data analysis [61]. However, for Plastic Concrete, it remains unclear whether shrinkage during sample preparation may be, at least partially, reversible due to the rehydration of bentonite particles in contact with water [26,33]. In addition, it can be expected that, due to the (likely) rehydration of bentonite, the pore entry radius of Plastic Concrete samples in non-dried conditions will decrease, thus reducing overall sample porosity and decreasing sample permeability. Furthermore, the mentioned cracks are of the same order of magnitude as the right peak of the mercury intrusion porosimetry differential curves, as shown in Figure 4 and Figure 7, and would explain this secondary rise in porosity. Moreover, and as shown in Section 3.3.3, the occurrence of these cracks is unavoidable, independent of the selected drying temperature, due in part also to the high w/c ratio used in Plastic Concrete. Furthermore, the vacuum applied during the mercury intrusion porosimetry measurements could further increase crack width. Additionally, sample preparation through crushing can further coarsen the measured pore structure, especially in the range of large pores, further enhancing these results [20]. This undesired micro-cracking of Plastic Concrete mortar samples, however, could also reduce the “ink-bottle” effect of MIP measurements [16], enhancing accessibility to the internal porosity and providing better comparative results for all tested mixes.
Despite the results of coarse porosity being influenced by sample preparation, the magnitude of this influence is also likely dependent on sample age due to the expected pore refinement over time, as described in the following section. This further supports the use of MIP in the present research since the study focused on comparing similar samples with identical sample preparation.

4.2. Microstructural Change over Time

As shown in Section 3.2 and Section 3.3, an increase in Plastic Concrete compressive strength, as well as a change in porosity, can be observed. In concrete technology, a decrease in porosity has been shown to result in higher compressive strength; thus, it can be hypothesised that this behaviour also exists for Plastic Concrete. Due to the difficulties present in Plastic Concrete MIP data interpretation described in Section 3.3.1 and Section 3.3.2, the cumulative porosity cannot be used to establish this correlation. Therefore, the cumulative porosity of the two segments, coarse porosity (70,000 nm to 4000 nm) and fine porosity (2000 nm to 10 nm), were calculated for all Plastic Concrete mixes and ages.
In Figure 10, the porosity of the W1:2-Q24 mix, representative of all mixes, is shown in detail. The cumulative pore volume of the two segments is therein laid out against sample age. In addition, the percentage share of the porosity is shown within the individual columns.
It becomes apparent that the coarse porosity share decreases and the fine porosity share increases over time. This likely relates to pore refinement due to continuous cement hydration within the samples. However, the unexpected increase in cumulative fine porosity is likely to be due to data calculation errors since the porosity between 4000 nm and 2000 nm is not considered for calculation. Due to pore refinement over time, some porosity in this middle segment shifts towards finer porosity and is then recorded within the fine porosity segment, thus increasing overall porosity. Furthermore, with increasing sample age, the total coarse porosity (4000 nm to 70,000 nm) decreases, as also shown in [28]. The decreasing porosity is likely due to an increase in C-S-H and concurrent pore refinement over a long period of time, which thus increases the sample strength at a microscopic scale and thereby reduces the influence of sample preparation (see Section 4.1). The significant increase in fine porosity between 91 days and 4 years further confirms the very slow cement hydration rate in Plastic Concrete, concomitant with the high w/c ratio and the use of bentonite [35,58].
The representative effects on porosity over time of mix W1:2-Q24 (as demonstrated in Figure 10) also apply to all other mixes. In Figure 11, an overview of the differential mercury intrusion porosimetry results of all mixes over time depending on mix design is given.
As can be seen in Figure 11, the pore entry radius of the left peak shifts slightly towards smaller pores with increasing sample age in the first 91 days in all tested mixes. In addition, as mentioned previously, the coarse porosity (described by the right peak) also decreases for all samples over time, thus confirming the results shown in Figure 10. Furthermore, no systematic correlation between the bentonite content and the overall porosity can be seen, confirming results from previous studies [28]. The samples tested at 28 days with different swelling times (0 h/24 h) also do not show significant differences. However, comparing the results of mixes of identical bentonite type but differing bentonite content (e.g., C1:2 vs. C1:3), it becomes apparent that the pore entry radius of the left peak decreases with increasing bentonite content, suggesting a slight pore refinement due to a reduced w/c ratio. The results in Figure 11 also show that there is a significant change in both fine porosity (left peak) and coarse porosity (right peak) between 91 days and 4 years, further confirming the pore refinement over time. In addition, this effect is more predominant with mixes with a higher bentonite content (b:c-ratio = 1:2), which can be ascribed to the lower effective w/c ratio.
Finally, the literature often suggests using two parameters to characterise MIP results: threshold pore entry radius and critical pore entry radius [20,51]. However, the bi-modal porosity distribution in this study’s results makes it impossible to determine these parameters since the cumulative intrusion curve displays more than one inflexion point. Alternatively, a simple approach can be used where the pore diameter at which the cumulative porosity equals 5% of the total intrudable porosity [20]. However, for the present results, the 5% will always lie within the coarse porosity peak and can therefore not be used to describe the overall sample porosity.

4.3. Porosity and Compressive Strength Correlation

Based on the proven pore refinement of Plastic Concrete samples over time, it can be expected that this positively correlates with the increasing compressive strength. To further analyse this correlation, the pore entry radius at the maximum of the fine porosity peak in the differential MIP results (shown in Figure 4) was extracted and plotted against the compressive strength of the same sample. The results are shown in Figure 12.
From this graph, it can be seen that no direct correlation between an absolute compressive strength value and a pore entry radius of the left peak exists. However, the pore entry radius range is clearly associated with the selected mix design, e.g., the pore entry radius of the left peak for C1:2 mixes lies between 95 nm and 197 nm, while those of T1:2 lie between a different range of 444 nm and 556 nm. In addition, for one given bentonite type, the pore entry radius of the left peak decreases with increasing bentonite content, further confirming the reduction in the effective w/c ratio. The swelling time has a minor effect on the pore entry radius or compressive strength (solid vs. open symbols). The pore entry radius of the left peak can therefore be used to identify the specific mix used. Moreover, for a given mix, the pore entry radius mostly decreases with increasing compressive strength, and thus increasing time, further confirming the porosity refinement of the samples and a positive correlation with its compressive strength. These results can further be verified with the results of the 4-year-old samples (not shown here, see Figure 4). Furthermore, the pore entry radius of the left peak correlates more closely to the porosity refinement than the cumulative porosity since it is less affected by the standard deviation of sample testing (see Section 3.3.2) as well as the shrinkage cracking (see Section 4.1).
Overall, these results indicate that pore refinement over time also exists for Plastic Concrete, correlating to an increase in compressive strength independent of the selected mix design.

5. Conclusions

5.1. Summary

This study aimed to determine the effect of Plastic Concrete mix design, especially bentonite content and type, on the long-term development of Plastic Concrete’s microstructural properties and corresponding compressive strength. In addition, this study was designed to systemically use mercury intrusion porosimetry (MIP) and X-ray diffractometry (XRD) for the first time on Plastic Concrete samples, thereby setting out the experimental boundaries of these measurement techniques for high-water-content, low-strength concrete mixes such as Plastic Concrete.
Firstly, the results show that the fresh Plastic Concrete properties are clearly dependent on the bentonite type and b:c-ratio used. These parameters also influence the achievable compressive strength. The Plastic Concrete’s compressive strength increases over time, especially beyond the 28-day mark, and is significantly higher than that of standard concrete.
The results of this study also show that MIP, despite the technique’s inherent limitations, could successfully be applied for the first time to systematically study the pore structure changes of Plastic Concrete with varying mix designs and sample ages. The porosimetry results of Plastic Concrete samples showed a bi-modal pore size distribution with two singular, age-dependant peaks, which have not been reported in the literature to date. In addition, the experimental boundaries of MIP testing specifically for Plastic Concrete samples were set out for the first time, with this study highlighting the key aspects to be considered regarding sample preparation (e.g., drying temperature), porosimeter setup (e.g., calibration) and data analysis (e.g., measurement standard deviation). Furthermore, the obtained data show a clear pore refinement over time, with the coarse porosity share dropping significantly over the four years. In addition, this pore refinement positively correlates with a significant increase in compressive strength. In addition, the fine porosity peak clearly relates to the bentonite type and b:c-ratio used. XRD was also successfully performed on Plastic Concrete samples, confirming that no unexpected crystalline phases form over 91 days. Overall, the mix design, especially bentonite content and type, significantly influenced the microstructural properties and compressive strength results, which were clearly dependent on sample age, with significant material property changes far beyond the 28-day mark. Finally, the results presented here provide a solid basis for further research using MIP on high-water-content, low-strength concrete samples such as Plastic Concrete.
All in all, the present study is the first to comprehensively investigate the effect of mix design, especially bentonite content and type, on the microstructural properties and compressive strength of Plastic Concrete. In addition, it has provided more profound insights into the time development of these properties over an extended study period of 4 years. Furthermore, these findings are of significant value for Plastic Concrete cut-off wall design since a more realistic and accurate time-dependent design of Plastic Concrete cut-off wall design will be possible in future.

5.2. Future Research

Future research should be carried out to explore the effect of different sample preparation techniques on the measured porosity of Plastic Concrete using mercury intrusion porosimetry (MIP). It may therefore be expedient to use other sample preparation techniques such as solvent exchange, vacuum drying or freeze drying [17,18] rather than the direct drying method established in this study. However, whether these alternative techniques also work for high-water-content cementitious systems such as Plastic Concrete remains unclear. Other microstructural analysis techniques such as backscatter-mode SEM [15] or Small-Angle X-Ray Scattering (SAXS) [13] may also provide further porosity measurements for Plastic Concrete samples. However, these are also technically more challenging and not available at all research institutions. Also, methods like isothermal calorimetry, Nuclear Magnetic Resonance (NMR), Thermogravimetric Analysis (TGA) and SAXS could provide new insights into whether bentonite has a nucleation effect on C-S-H crystallisation in Plastic Concrete [62]. In addition, XRD tests on Plastic Concrete with paste samples (without aggregate), as described in [58], could further confirm the assumption that no new mineral phases develop during the hydration of Plastic Concrete. Finally, in situ XRD, as described by [63], could be beneficial for establishing the early reaction mechanisms of Plastic Concrete more clearly since no sample drying and preparation are required. Based on the results of this study, which show that similar compressive strengths can be achieved while exhibiting different fine porosity (with different b:c-ratios and bentonite types), further research should be carried out to systematically study which fine porosity is most suitable for typical applications such as cut-off walls (e.g., which mix provides the lowest overall material permeability). Finally, to validate the effects of porosity changes on permeability and long-term durability, water absorption tests could be performed. In this way, the correlation between microstructure evolution and functional performance could be strengthened. However, as conventional methods are labour intensive, it could be beneficial to use new methods that leverage automatic weight measurement [64] and computer vision technique [65] to analyse the fluid absorption of building materials.

Author Contributions

D.A.S.: conceptualisation, methodology, investigation, validation, formal analysis, writing—original draft, writing—review and editing, visualisation, project administration; A.B.: validation, writing—review and editing; J.B.: investigation, visualisation; F.D.: resources, funding acquisition, writing—review and editing. All authors have read and agreed to the published version of the manuscript.

Funding

This research received no external funding.

Data Availability Statement

Data are contained within the article.

Acknowledgments

The authors of this article would like to thank Clariant AG for providing the bentonite materials and MAT Mischanlagentechnik GmbH for providing the bentonite mixer. In addition, the authors would like to thank the Institute of Applied Geosciences (AGW) at KIT for the support during the MIP testing campaign. Furthermore, the authors thank Katja Emmerich and Eleanor Bakker (CMM Karlsruhe/KIT) for their help in CEC testing and Astrid Hirsch (IMB/MPA Karlsruhe) for her support in XRD phase identification.

Conflicts of Interest

The authors declare no conflicts of interest.

References

  1. Alós Shepherd, D.; Kotan, E.; Dehn, F. Plastic concrete for cut-off walls: A review. Constr. Build. Mater. 2020, 255, 119248. [Google Scholar] [CrossRef]
  2. Bruce, D.A. (Ed.) Specialty Construction Techniques for Dam and Levee Remediation; CRC Press: Boca Raton, FL, USA, 2013. [Google Scholar]
  3. Xanthakos, P.P. Slurry Walls; McGraw-Hill: New York, NY, USA, 1979. [Google Scholar]
  4. U.S. Bureau of Reclamation. Design Standards No. 13: Embankment Dam, Chapter 16: Cutoff Walls, Revision 14; U.S. Bureau of Reclamation: Washington, DC, USA, 2014. [Google Scholar]
  5. Ghazavi, M.; Safarzadeh, Z.; Hashemolhoseini, H. Response of Plastic Concrete Cut-Off Walls in Earth Dams to Seismic Loading Using Finite Element Methods. In Proceedings of the 13th World Conference on Earthquake Engineering, Vancouver, BC, USA, 1–6 August 2004; Canadian Association for Earthquake Engineering: Vancouver, BC, USA, 2004. [Google Scholar]
  6. Grim, R.E.; Güven, N. Bentonites: Geology, Mineralogy, Properties and Uses; Developments in sedimentology; Elsevier: Amsterdam, The Netherlands, 1978; Volume 24. [Google Scholar]
  7. von Soos, P.; Engel, J. Eigenschaften von Boden und Fels—Ihre Ermittlung im Labor. In Grundbau-Taschenbuch, Teil 1: Geotechnische Grundlagen; Witt, K.J., Ed.; Ernst & Sohn: Berlin, Germany, 2008; pp. 123–218. [Google Scholar]
  8. Praetorius, S.; Schößer, B. Bentonithandbuch: Ringspaltschmierung für den Rohrvortrieb; Bauingenieur-Praxis, Ernst & Sohn: Berlin, Germany, 2016. [Google Scholar]
  9. Koch, D. Eigenschaften und Einsatzmöglichkeiten von Bentonit/Zement-Mischungen im Speziealtiefbau. In Spezialtiefbau; Eichler, K., Ed.; Kontakt & Studium, Expert Verlag: Renningen, Germany, 2015; pp. 170–189. [Google Scholar]
  10. Jasmund, K.; Lagaly, G. (Eds.) Tonminerale und Tone: Struktur, Eigenschaften, Anwendungen und Einsatz in Industrie und Umwelt; Steinkopff: Darmstadt, Germany, 1993. [Google Scholar] [CrossRef]
  11. Bergaya, F.; Lagaly, G. (Eds.) Handbook of Clay Science, Part A: Fundamentals, 2nd ed.; Developments in clay science; Elsevier: Burlington, NJ, USA, 2013. [Google Scholar]
  12. Beckhaus, K.; Kayser, J.; Kleist, F.; Quarg-Vonscheidt, J.; Alós Shepherd, D. Design concept for sustainable cut-off walls made of highly deformable filling materials. In Proceedings of the 12th ICOLD European Club Symposium 2023 (ECS 2023), Interlaken, Switzerland, 5–8 September 2023; Boes, R., Droz, P., Leroy, R., Eds.; CRC Press: Milton, ON, Canada, 2023; pp. 641–650. [Google Scholar] [CrossRef]
  13. Bogner, A.; Schatz, J.; Dehn, F.; Müller, H.S. Influence of Drying on the Microstructure of Hardened Cement Paste: A Mercury Intrusion Porosimetry, Nitrogen Sorption and SAXS Study. J. Adv. Concr. Technol. 2020, 18, 83–94. [Google Scholar] [CrossRef]
  14. Washburn, E.W. Note on a Method of Determining the Distribution of Pore Sizes in a Porous Material. Proc. Natl. Acad. Sci. USA 1921, 7, 115–116. [Google Scholar] [CrossRef]
  15. Diamond, S. A discussion of the paper “Effect of drying on cement-based materials pore structure as identified by mercury porosimetry—A comparative study between oven-, vacuum-, and freeze-drying” by C. Gallé. Cem. Concr. Res. 2003, 33, 169–170. [Google Scholar] [CrossRef]
  16. Diamond, S. Mercury porosimetry: An inappropriate method for the measurement of pore size distributions in cement-based materials. Cem. Concr. Res. 2000, 30, 1517–1525. [Google Scholar] [CrossRef]
  17. Gallé, C. Effect of drying on cement-based materials pore structure as identified by mercury intrusion porosimetry. Cem. Concr. Res. 2001, 31, 1467–1477. [Google Scholar] [CrossRef]
  18. Winnefeld, F.; Schöler, A.; Lothenbach, B. Sample preparation (Chapter 1). In A Practical Guide to Microstructural Analysis of Cementitious Materials; Scrivener, K., Snellings, R., Lothenbach, B., Eds.; CRC Press: Boca Raton, FL, USA, 2016. [Google Scholar]
  19. Gallé, C. Reply to the discussion by S. Diamond of the paper “Effect of drying on cement-based materials pore structure as identified by mercury intrusion porosimetry: A comparative study between oven-, vacuum- and freeze-drying”. Cem. Concr. Res. 2003, 33, 171–172. [Google Scholar] [CrossRef]
  20. Ma, H. Mercury intrusion porosimetry in concrete technology: Tips in measurement, pore structure parameter acquisition and application. J. Porous Mater. 2014, 21, 207–215. [Google Scholar] [CrossRef]
  21. Andrade, C.; Martínez-Serrano, A.; Sanjuán, M.Á.; Tenorio Ríos, J.A. Reduced Carbonation, Sulfate and Chloride Ingress Due to the Substitution of Cement by 10% Non-Precalcined Bentonite. Materials 2021, 14, 1300. [Google Scholar] [CrossRef]
  22. Nehdi, M.L. Clay in cement-based materials: Critical overview of state-of-the-art. Constr. Build. Mater. 2014, 51, 372–382. [Google Scholar] [CrossRef]
  23. Norvell, J.K.; Stewart, J.G.; Juenger, M.C.; Fowler, D.W. Influence of Clays and Clay-Sized Particles on Concrete Performance. J. Mater. Civ. Eng. 2007, 19, 1053–1059. [Google Scholar] [CrossRef]
  24. Solomon, F.; Ekolu, S.O. Strength behaviour of clay-cement concrete and quality implications for low-cost construction materials. In Proceedings of the Concrete Repair, Rehabilitation and Retrofitting III, Proceedings of the 3rd International Conference on Concrete Repair, Rehabilitation and Retrofitting (ICCRRR), Cape Town, South Africa, 3–5 September 2012; Alexander, M.G., Beushausen, H.D., Dehn, F., Moyo, P., Eds.; CRC Press: Boca Raton, FL, USA, 2012; pp. 1420–1425. [Google Scholar]
  25. Ahmad, J.; Kontoleon, K.J.; Al-Mulali, M.Z.; Shaik, S.; Hechmi El Ouni, M.; El-Shorbagy, M.A. Partial Substitution of Binding Material by Bentonite Clay (BC) in Concrete: A Review. Buildings 2022, 12, 634. [Google Scholar] [CrossRef]
  26. Hu, Y.; Diao, L.; Lai, Z.; He, Y.; Yan, T.; He, X.; Wu, J.; Lu, Z.; Lv, S. Effects of bentonite on pore structure and permeability of cement mortar. Constr. Build. Mater. 2019, 224, 276–283. [Google Scholar] [CrossRef]
  27. Fam, M.A.; Santamarina, J.C. Study of Clay-Cement Slurries with Mechanical and Electromagnetic Waves. J. Geotech. Eng. 1996, 122, 365–373. [Google Scholar] [CrossRef]
  28. Shi, Y.; Chen, X.; Li, J.; Li, X.; Peng, Z. Micro–macro properties of plastic concrete anti-seepage wall materials mixed with low-liquid limit clay. Adv. Mech. Eng. 2019, 11, 168781401984973. [Google Scholar] [CrossRef]
  29. Chang, T.P.; Shih, J.Y.; Yang, K.M.; Hsiao, T.C. Material properties of portland cement paste with nano-montmorillonite. J. Mater. Sci. 2007, 42, 7478–7487. [Google Scholar] [CrossRef]
  30. Niu, X.J.; Li, Q.B.; Hu, Y.; Tan, Y.S.; Liu, C.F. Properties of cement-based materials incorporating nano-clay and calcined nano-clay: A review. Constr. Build. Mater. 2021, 284, 122820. [Google Scholar] [CrossRef]
  31. Tang, B.; Cui, W.; Zhang, B.Z.; Jiang, Z.A. The macroscopic mechanical characteristics and microscopic evolution mechanism of plastic concrete. Constr. Build. Mater. 2023, 391, 131898. [Google Scholar] [CrossRef]
  32. Flessati, L.; Della Vecchia, G.; Musso, G. Mechanical Behavior and Constitutive Modeling of Cement–Bentonite Mixtures for Cutoff Walls. J. Mater. Civ. Eng. 2021, 33, 04020483. [Google Scholar] [CrossRef]
  33. Cao, B.; Chen, J.; Al-Tabbaa, A. Crack-resistant cement–bentonite cut-off wall materials incorporating superabsorbent polymers. Can. Geotech. J. 2021, 58, 800–810. [Google Scholar] [CrossRef]
  34. Fernandes, V.A.; Purnell, P.; Still, G.T.; Thomas, T.H. The effect of clay content in sands used for cementitious materials in developing countries. Cem. Concr. Res. 2007, 37, 751–758. [Google Scholar] [CrossRef]
  35. Barbu, C.S.; Sabau, A.D.; Manoli, D.M.; Serbulea, M.S. Water/Cement/Bentonite Ratio Selection Method for Artificial Groundwater Barriers Made of Cutoff Walls. Water 2022, 14, 376. [Google Scholar] [CrossRef]
  36. EN 197-1:2011-11; Cement—Part 1: Composition, Specifications and Conformity Criteria for Common Cements (German Version). Comité Européen de Normalisation: Brussels, Belgium, 2011.
  37. Meier, L.P.; Kahr, G. Determination of the cation exchange capacity (CEC) of clay minerals using the complexes of Copper (II) ion with Triethylenetetramine and Tretraethylenepentamine. Clays Clay Miner. 1999, 47, 386–388. [Google Scholar] [CrossRef]
  38. Steudel, A. Selection Strategy and Modification of Layer Silicates for Technical Applications. Master’s Thesis, Karlsruhe Institute of Technology, Karlsruhe, Germany, 2009. [Google Scholar] [CrossRef]
  39. DIN 1045-2:2008-08; Tragwerke aus Beton, Stahlbeton und Spannbeton—Teil 2: Beton—Festlegung, Eigenschaften, Herstellung und Konformität—Anwendungsregeln zu DIN EN 206-1. Deutsches Institut für Normung: Berlin, Germany, 2008.
  40. EN 1008:2002-10; Mixing Water for Concrete—Specification for Sampling, Testing and Assessing the Suitability of Water, Including Water Recovered from Processes in the Concrete Industry, as Mixing Water for Concrete (German Version). Comité Européen de Normalisation: Brussels, Belgium, 2002.
  41. Lei, L.; Palacios, M.; Plank, J.; Jeknavorian, A.A. Interaction between polycarboxylate superplasticizers and non-calcined clays and calcined clays: A review. Cem. Concr. Res. 2022, 154, 106717. [Google Scholar] [CrossRef]
  42. Fadaie, M.A.; Nekooei, M.; Javadi, P. Effect of Dry and Saturated Bentonite on Plastic Concrete. KSCE J. Civ. Eng. 2019, 23, 3431–3442. [Google Scholar] [CrossRef]
  43. Adjei, S.; Elkatatny, S.; Al-Majed, A. Effect of Bentonite Prehydration Time on the Stability of Lightweight Oil-Well Cement System. Geofluids 2021, 2021, 9957159. [Google Scholar] [CrossRef]
  44. EN 12350-2:2019-09; Testing Fresh Concrete—Part 2: Slump Test (German Version). Comité Européen de Normalisation: Brussels, Belgium, 2019.
  45. EN 12350-5:2019-09; Testing Fresh Concrete—Part 5: Flow Table Test (German Version). Comité Européen de Normalisation: Brussels, Belgium, 2019.
  46. EN 12350-6:2019-09; Testing Fresh Concrete—Part 6: Density (German Version). Comité Européen de Normalisation: Brussels, Belgium, 2019.
  47. EN 12350-7:2019:09; Testing Fresh Concrete—Part 7: Air Content—Pressure Methods (German Version). Comité Européen de Normalisation: Brussels, Belgium, 2019.
  48. EN 196-1:2016-11; Methods of Testing Cement—Part 1: Determination of Strength (German Version). Comité Européen de Normalisation: Brussels, Belgium, 2016.
  49. EN 12390-2:2019-10; Testing Hardened Concrete—Part 2: Making and Curing Specimens for Strength Tests (German Version). Comité Européen de Normalisation: Brussels, Belgium, 2019.
  50. EN 15901-1:2016; Evaluation of Pore Size Distribution and Porosity of Solid Materials by Mercury Porosimetry and Gas Adsorption—Part 1: Mercury Porosimetry (German Version). Comité Européen de Normalisation: Brussels, Belgium, 2016.
  51. Berodier, E.; Bizzozero, J.; Muller, A.C.A. Mercury intrusion porosimetry (Chapter 9). In A Practical Guide to Microstructural Analysis of Cementitious Materials; Scrivener, K., Snellings, R., Lothenbach, B., Eds.; CRC Press: Boca Raton, FL, USA, 2016. [Google Scholar]
  52. EN 13925-2:2003-07; Non-Destructive Testing—X-Ray Diffraction from Polycristalline and Amorphous Material—Part 2: Procedures (German Version). Comité Européen de Normalisation: Brussels, Belgium, 2003.
  53. EN 13925-1:2003-07; Non-Destructive Testing—X-Ray Diffraction from Polycristalline and Amorphous Material—Part 1: General Principles (German Version). Comité Européen de Normalisation: Brussels, Belgium, 2003.
  54. EN 13925-3:2005-07; Non-Destructive Testing—X-Ray Diffraction from Polycristalline and Amorphous Material—Part 3: Instruments (German Version). Comité Européen de Normalisation: Brussels, Belgium, 2005.
  55. EN 1015-11:2020-01; Methods of Test for Mortar for Masonry—Part 11: Determination of Flexural and Compressive Strength of Hardened Mortar (German Version). Comité Européen de Normalisation: Brussels, Belgium, 2020.
  56. DIN 4093:2015-11; Bemessung von Verfestigten Bodenkörpern—Hergestellt mit Düsenstrahl-, Deep-Mixing- oder Injektions-Verfahren. Deutsches Institut für Normung: Berlin, Germany, 2015.
  57. Alós Shepherd, D.; Dehn, F. Experimental Study into the Mechanical Properties of Plastic Concrete: Compressive Strength Development over Time, Tensile Strength and Elastic Modulus. Case Stud. Constr. Mater. 2023, 19, e02521. [Google Scholar] [CrossRef]
  58. Zhao, H.; Ma, Y.; Zhang, J.; Hu, Z.; Li, H.; Wang, Y.; Liu, J.; Wang, K. Effect of clay content on shrinkage of cementitious materials. Constr. Build. Mater. 2022, 322, 125959. [Google Scholar] [CrossRef]
  59. Warr, L.N. IMA–CNMNC approved mineral symbols. Mineral. Mag. 2021, 85, 291–320. [Google Scholar] [CrossRef]
  60. Snellings, R. X-ray powder diffraction applied to cement (Chapter 4). In A Practical Guide to Microstructural Analysis of Cementitious Materials; Scrivener, K., Snellings, R., Lothenbach, B., Eds.; CRC Press: Boca Raton, FL, USA, 2016. [Google Scholar]
  61. Chatterji, S. A discussion of the paper “Mercury porosimetry—An inappropriate method for the measurement of pore size distributions in cement-based materials” by S. Diamond. Cem. Concr. Res. 2001, 31, 1657–1658. [Google Scholar] [CrossRef]
  62. Bogner, A.; Link, J.; Baum, M.; Mahlbacher, M.; Gil-Diaz, T.; Lützenkirchen, J.; Sowoidnich, T.; Heberling, F.; Schäfer, T.; Ludwig, H.M.; et al. Early hydration and microstructure formation of Portland cement paste studied by oscillation rheology, isothermal calorimetry, 1H NMR relaxometry, conductance and SAXS. Cem. Concr. Res. 2020, 130, 105977. [Google Scholar] [CrossRef]
  63. de Matos, P.R.; Andrade Neto, J.S.; Jansen, D.; de La Torre, A.G.; Kirchheim, A.P.; Campos, C.E. In-situ laboratory X-ray diffraction applied to assess cement hydration. Cem. Concr. Res. 2022, 162, 106988. [Google Scholar] [CrossRef]
  64. Sabir, B.B.; Wild, S.; O’Farrell, M. A water sorptivity test for martar and concrete. Mater. Struct. 1998, 31, 568–574. [Google Scholar] [CrossRef]
  65. Kabir, H.; Wu, J.; Dahal, S.; Joo, T.; Garg, N. Automated estimation of cementitious sorptivity via computer vision. Nat. Commun. 2024, 15, 9935. [Google Scholar] [CrossRef] [PubMed]
Figure 1. Timeline of the experimental testing carried out in this study (index = swelling time).
Constrmater 05 00014 g001
Figure 2. Fresh concrete test results of all mixes.
Constrmater 05 00014 g002
Figure 3. Mean compressive strength (and standard deviation) of six prism halves ( 40 × 40 mm2) over time depending on Plastic Concrete mix design.
Constrmater 05 00014 g003
Figure 4. Overview of all differential mercury intrusion porosimetry results for Q24 at all time steps with two standard concretes as comparison [17].
Constrmater 05 00014 g004
Figure 5. Exemplary comparison of a differential mercury intrusion porosimetry results using blank measurement calibration or the formula calibration provided by Micrometrics.
Constrmater 05 00014 g005
Figure 6. Differential mercury intrusion porosimetry results from triple measurement and corresponding standard deviation.
Constrmater 05 00014 g006
Figure 7. Differential mercury intrusion porosimetry results depending on sample drying temperature.
Constrmater 05 00014 g007
Figure 8. XRD diffractogramms of Plastic Concrete mix CV15 1:3 over time and corresponding source materials, vertically shifted. Phase identification with nomenclature according to [59].
Constrmater 05 00014 g008
Figure 9. Light microscopic imagery of a prism sample (a) before and (b) after drying at 60 °C for 24 h at a magnification of 1200×.
Constrmater 05 00014 g009
Figure 10. Cumulative porosity and percentage share of porosity of the W1:2-Q24 mix over time.
Constrmater 05 00014 g010
Figure 11. Differential mercury intrusion porosimetry results depending on mix design and sample age.
Constrmater 05 00014 g011
Figure 12. Compressive strength of Plastic Concrete samples with corresponding pore entry radius of the left peak up to 91 days.
Constrmater 05 00014 g012
Table 1. Chemical composition of the cement and bentonites used, corrected by LoI.
CaOSiO2Al2O3MgOFe2O3OthersLoI
CEM I(wt.%)61.822.25.22.92.43.62.7
CV15(wt.%)2.359.812.01.92.23.415.7
WW4(wt.%)4.050.616.73.13.84.117.8
Tixoton(wt.%)3.949.217.52.55.35.418.2
Table 2. Physical characteristics of the cement and bentonite source materials used.
d10%PSD *
d50%
(μm)
d90%No-DryDensity
60 °C
(g/cm3)
105 °CSpecific Surface
Blaine
(cm2/g)
CEM I1.5217.2055.303.10-  -  3477
CV151.207.1338.342.402.722.79-
WW40.934.7539.902.542.722.86-
Tixoton1.9716.7857.192.572.722.78-
* Determination in water with Na4P2O7 by laser granulometry.
Table 3. Mineralogical composition determined by XRD and the CEC of the bentonites used.
CV15WW4Tixoton
QuartzXXX
Carbonate (mainly calcite)XXX
Illite/Mica (di) X
MontmorilloniteXXX
PlagioclaseXXX
K-feldspar XX
CEC (cmol+/kg)618865
“X” marks where the minerals are present.
Table 4. Particle size distribution of aggregates used.
Sieve size(mm)0.1250.250.51248
Sieve passing(wt.%)0.16.622.531.938.064.698.9
Table 5. Overview of the varying mix design factors and corresponding designation of the mix designs used.
b:c-RatioSwelling TimeBentonite Type
Bentonil CV15 Bentonil WW4 Tixoton
1:324 hC1:3-Q24W1:3-Q24-
0 hC1:3-Q0W1:3-Q0-
1:224 hC1:2-Q24W1:2-Q24T1:2-Q24
0 hC1:2-Q0W1:2-Q0T1:2-Q0
Table 6. Mix designs of Plastic Concrete.
Mix I
(kg/m3)
Mix II
(kg/m3)
CEM I 32.5 R100.0100.0
Water400.0400.0
Bentonite  33.3  50.0
Sand (0–2) mm542.3536.3
Gravel (2–8) mm920.3910.1
b:c-ratio1:31:2
Disclaimer/Publisher’s Note: The statements, opinions and data contained in all publications are solely those of the individual author(s) and contributor(s) and not of MDPI and/or the editor(s). MDPI and/or the editor(s) disclaim responsibility for any injury to people or property resulting from any ideas, methods, instructions or products referred to in the content.

