Article

Influence of Ballast and Sub-Ballast Thickness on Structural Behavior of Heavy-Haul Railway Platform Determined by Using Finite Element Modeling

by
Magdiel Acaz de Oliveira Teixeira
1,
William Wilson dos Santos
1,*,
Lisley Madeira Coelho
1,
Lidiane Hellen dos Santos Santana
1,
Fábio Grisolia de Ávila
1,
Sergio Neves Monteiro
2 and
Antônio Carlos Rodrigues Guimarães
1
1
Department of Fortification and Construction, Military Institute of Engineering-IME, Praça General Tibúrcio, 80, Urca, Rio de Janeiro 22290-270, Brazil
2
Department of Materials Science, Military Institute of Engineering-IME, Praça General Tibúrcio, 80, Urca, Rio de Janeiro 22290-270, Brazil
*
Author to whom correspondence should be addressed.
Constr. Mater. 2025, 5(1), 13; https://doi.org/10.3390/constrmater5010013
Submission received: 13 February 2025 / Revised: 27 February 2025 / Accepted: 4 March 2025 / Published: 6 March 2025

Abstract

:
This study investigates the influence of ballast and sub-ballast thicknesses on the structural behavior of a heavy-haul railway platform by using finite element modeling with SysTrain software (v. 1.84) A parametric analysis was conducted to assess how variations in layer thickness affect key performance parameters, including total deflection, bending moments in the rails, and vertical stresses within the railway track. The results indicate that reducing ballast thickness increases deflection and vertical stresses, while excessive thickness elevates system stiffness, reducing its ability to dissipate stresses. This condition can intensify the transmission of dynamic loads to track components, accelerating rail and sleeper wear and requiring more frequent corrective interventions, thereby increasing maintenance costs. Deflections remained within the 6.35 mm limit established by AREMA, except for one case (6.85 mm), where an excessive ballast thickness (160 cm) combined with low material stiffness resulted in non-compliance. Vertical stresses in the substructure ranged from 106.9 kPa to 155.9 kPa, staying within admissible limits. Additionally, the study highlights the significant role of material properties, particularly the resilient modulus, in the overall track performance. The findings enhance the understanding of how ballast and sub-ballast geometry affect railway structural behavior, demonstrating how numerical modeling with SysTrain can support decision-making in track design and maintenance strategies.

1. Introduction

The modeling of the railway platform, also known as the track structure, has been extensively studied by various authors, such as Zhang et al. [1], Nielsen et al. [2], Xu et al. [3], Jing et al. [4], Varandas et al. [5], among others. However, the influence of track geometry, particularly the thickness of its layers, on structural behavior remains an area with significant research potential, especially with the advancement of numerical modeling technologies.
The infrastructure of a railway consists of three main layers: ballast, sub-ballast, and subgrade. Among these, the ballast plays a crucial role, as it is responsible for transferring loads from the railway to the underlying layers, necessitating a significant amount of construction material, specifically granular materials. The selection of materials for railway ballast is a critical step, given that the aggregates used are subject to deformation and progressive deterioration under heavy cyclic loads [6]. The behavior of the track under load is influenced by factors such as the frequency and amplitude of loading, as well as the dynamic response of the structure. This issue is exacerbated under impact loading conditions, which accelerate the degradation of ballast particles, particularly when the track foundation consists of stiffer soils [7]. Additionally, the variation of particle shape parameters and moisture content also affects the performance of the ballast, impacting its shear strength and overall stability [8,9,10].
Furthermore, the degradation of railway infrastructure is not limited to the deterioration of ballast but can also lead to significant structural failures in the subgrade and railway embankments. Among the most common failure mechanisms are permanent deformation of the subgrade, erosion caused by fine particle pumping, and slope instability [11]. Fine particle pumping, for instance, occurs due to water infiltration and cyclic loads from railway traffic, resulting in the migration of fine particles into the ballast and the reduction of its drainage capacity and support. These failures often necessitate costly corrective maintenance and can compromise the operational safety of the railway [11].
The ballast is a granular layer that sits directly above the sub-ballast or subgrade, and its thickness is one of the most important parameters. According to Schram [12], the height of the ballast is measured using the track axis as a reference point. In contrast, VALEC recommends measuring the thickness of the ballast based on the rail axis.
Rangel [13] argues that considering the layer’s height with the track axis as a reference is preferable from a safety standpoint, especially when accounting for potential construction errors in the platform grade level. According to Queiroz [14], at the end of the 19th century, empirical specifications were commonly used to determine ballast thickness. In Germany, some specifications even suggested a thickness equal to the distance between sleepers plus 20 cm (resulting in an excessively thick layer). In the United States, the distance between sleeper centers plus an additional 7.5 to 10 cm was used, resulting in thicknesses ranging from 40 to 60 cm, which in some cases were also excessive. Moving away from empirical methods, the Societé National du Chemins de Fer (SNCF) in France developed a method in the 1970s based on the CBR (California Bearing Ratio) of a platform and train traffic.
According to Silva Filho [15], during technical visits in Australia, it was observed that some railways built on competent soils operate with ballast heights varying around 25 cm, yielding excellent results in terms of track serviceability. However, some maintenance departments of railway companies show resistance to adopting thinner ballast layers, arguing that it would increase the stiffness of the layer and, consequently, accelerate the wear of rails and rolling stock.
Regarding the sub-ballast, Stopatto [16] describes it as the material layer that completes the platform and supports the ballast. Its function is to absorb the forces transmitted by the ballast and transfer them to the underlying layer at a rate compatible with the subgrade’s bearing capacity while also preventing the penetration of aggregates from the lower part of the ballast.
According to Indraratna et al. [17], the sub-ballast functions as a reinforcement layer for the subgrade or as a drainage layer, and it must exhibit moderate water permeability. Rangel [13] highlights that the thickness of the sub-ballast, typically composed of gravel or a mixture of soil and crushed stone, generally ranges from 15 to 30 cm. Therefore, the dimensions of the cross-section, particularly the thickness of the ballast and sub-ballast layers, play a crucial role in the structural behavior of the railway track. This issue requires further analysis, especially through advanced computational tools capable of providing more accurate simulations.
In this context, the application of mechanistic-empirical design methods, which utilize the resilient modulus and permanent deformation as parameters, enables a more accurate and representative modeling of the structural behavior of pavements [18,19,20,21]. Several studies have emphasized the importance of these methods in the evaluation and design of both road and railway pavements [22,23,24,25,26,27,28].
In this regard, computational modeling has proven to be an essential tool to complement geotechnical characterization. Several studies, such as that by Spada [29], using software such as Ferrovia 1.0, ANSYS (V.15) and Kentrack 4.0 to analyze the structural behavior of railway sidewalks, demonstrate the relevance of these tools in accurately simulating stress–strain behavior and identifying pathologies. Prakoso [30] discussed two- and three-dimensional modeling of railway superstructures using the finite element method (FEM) in ANSYS software, while Rangel [13] applied ABAQUS(V.2016) to estimate deflections in railway sidewalks.
Elkady et al. [31] investigated the reinforcement of soft clay soils using combinations of geotextile, geofoam, and construction and demolition waste (C&D) through 3D numerical modeling in ABAQUS software. The results indicated that the combination of geotextile and geofoam reduced the predicted vertical deformations by up to 50% under train loads, highlighting the feasibility of using C&D waste as an alternative aggregate in railway embankments. Silva Filho [15] analyzed the impact of different types of wagons on the sidewalk of the Carajás Railroad using Ferrovia 3.0 software. In addition, Silva Filho et al. [32] compared the structural evaluation of railway tracks between Ferrovia 3.0 and ANSYS v15, highlighting limitations in traditional modeling approaches.
Other studies have also utilized the SysTrain software to evaluate the structural behavior of railway pavements. Ribeiro [33] developed a railway pavement management system for the Estrada de Ferro Vitória-Minas and conducted simulations using both SysTrain and Kentrack. Later, Ribeiro [34] applied SysTrain for a stress–strain analysis through finite element modeling, iteratively processing data between pavement elements and determining the effective stresses that act on the structure. Silva Filho [35] assessed the feasibility of using sandy soil in the sub-ballast layer. Cruz [36] carried out field tests and modeling to evaluate the integrity of a railway platform, and Delgado et al. [37] analyzed the structural behavior of platforms using static loading models and nonlinear elastic materials. Santos et al. [38] also employed SysTrain to investigate steel slag as an alternative railway ballast. The results from cyclic triaxial tests and numerical simulations suggest its viability as a sustainable replacement for natural aggregates, demonstrating stable behavior under repeated loads.
Additionally, Fonte et al. [39] employed allowable stress values obtained from SysTrain to assess the structural behavior of the pavement. In the study by Silva Filho et al. [40], SysTrain was used to simulate 184 different configurations, varying material properties, and layer geometry. This allowed for the calculation of track modulus variation, bending stress in the rails, and normal stress in the subgrade in order to evaluate the impact of these variables on the structural performance of the track.
In this context, the integration of geotechnical investigations of materials with tools such as Ferrovia, ANSYS, ABAQUS, and Kentrack allows for a detailed analysis of pavement behavior. SysTrain is a tool developed exclusively for railway applications and offers functionalities that can be particularly useful in analyzing railway behavior. Studies conducted by Silva Filho [35] demonstrated that the results calculated by SysTrain and ANSYS were virtually identical, corroborating the reliability of the adopted theory and the implemented computational code. Furthermore, Silva Filho et al. [32] compared the results obtained using the classical methodology, Ferrovia 3.0, and ANSYS, finding similar responses.
It is important to highlight that SysTrain provides an additional functionality that enables the verification of the shakedown concept, which refers to the accommodation of permanent deformations of materials over time under repeated loads. This analysis connects experimental tests, such as cyclic triaxial tests, to finite element modeling (FEM), as the parameters obtained from these tests are essential for evaluating shakedown behavior. This connection is crucial, as it ensures that the railway structure not only supports dynamic loads but also maintains its integrity and functionality over time. Understanding shakedown behavior is valuable for predicting track durability, minimizing the risk of structural failures, and reducing the need for corrective maintenance. The specialized features of SysTrain make it a relevant tool for performance analysis in railway infrastructure, and future comparative studies may help elucidate its characteristics in relation to other tools used in railway engineering.
The objective of this study is to simulate, through the use of SysTrain software, the mechanistic performance of the railway platform that connects the stations of Boa Vista Nova and Cravinhos in the state of São Paulo. The study will vary the thickness of the ballast and sub-ballast layers to provide recommendations for optimal design and validate the software as an intuitive and reliable auxiliary modeling tool.

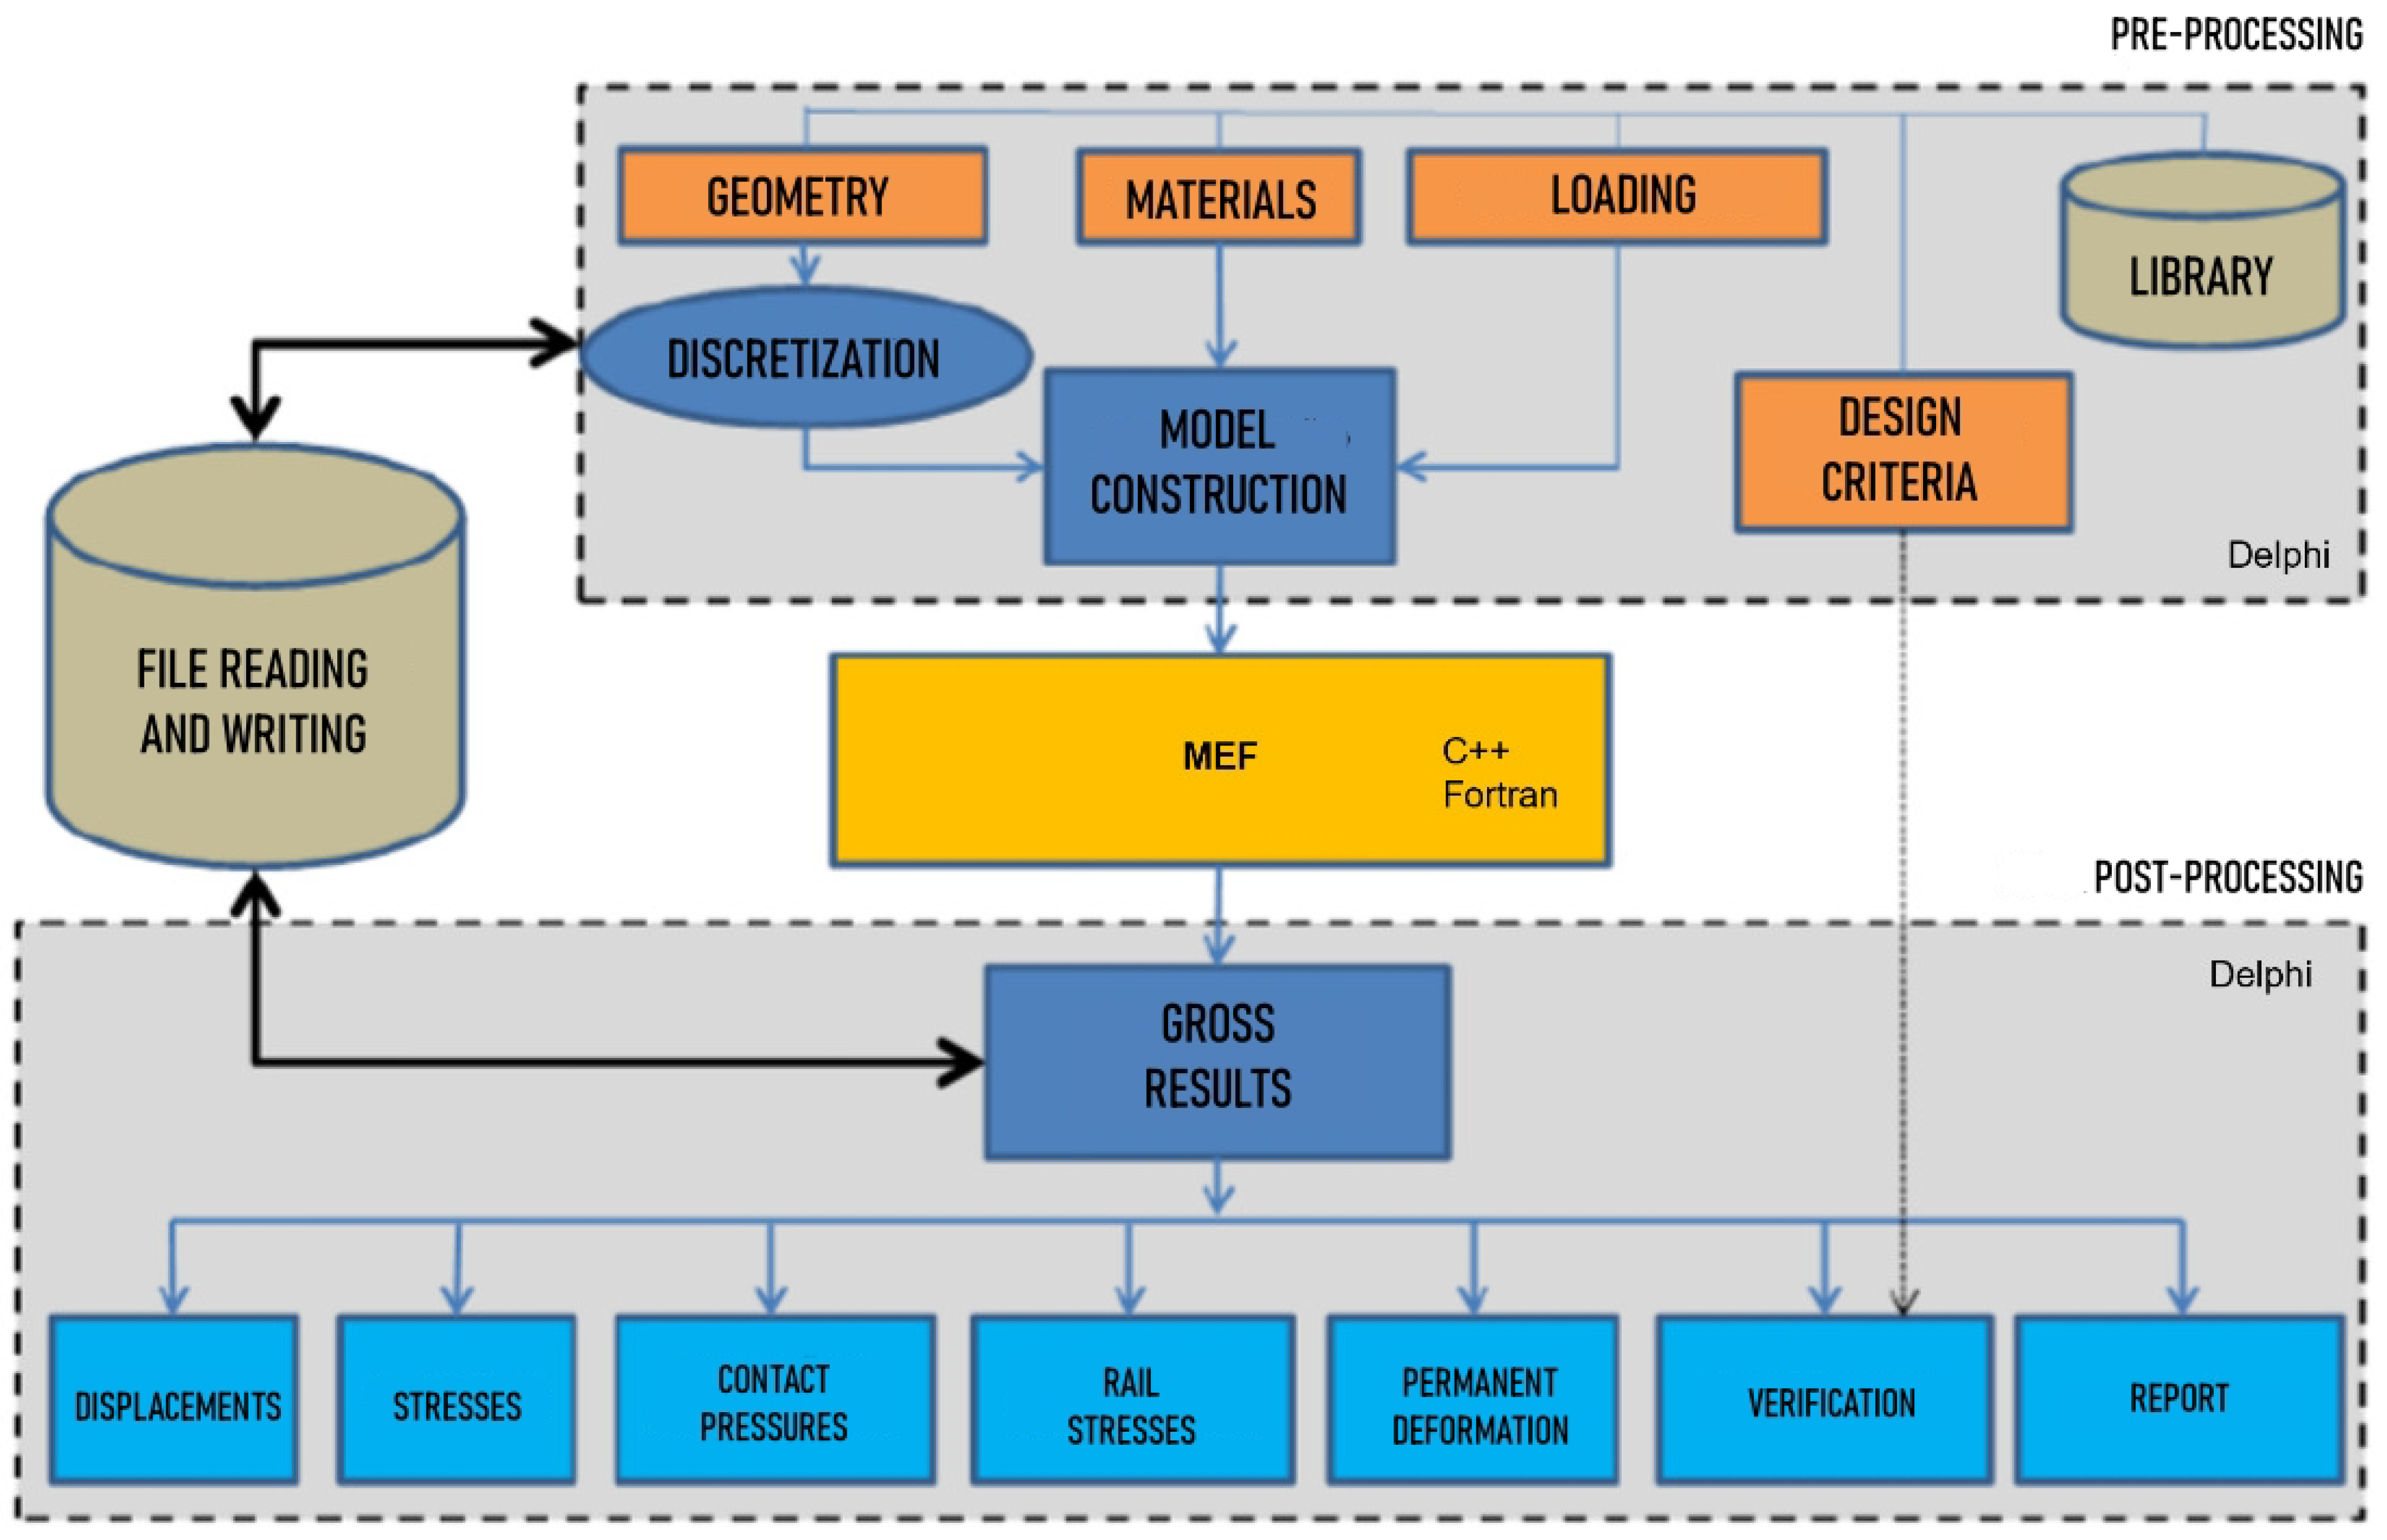
The Systrain Software

SysTrain, formerly known as VALEtrack, was developed in 2016 through a partnership between VALE, Elgayer, and the Military Institute of Engineering (IME) [13]. The software simulates both the components of the superstructure (rails, sleepers, and fastening system) and the layers of the substructure (ballast, sub-ballast, and subgrade) by using the Finite Element Method (FEM). Its main features include the following: (i) 3D parametric modeling of the track with predefined geometry; (ii) the use of nonlinear elastic constitutive models, with behavior parameters for various materials already incorporated and the ability to add new models and materials; (iii) fast and accurate stress–strain analysis in the elastic regime under static loads; (iv) predefined train loading models.
The software was calibrated using monitoring data from a Brazilian railway line [37]. The ease of use of SysTrain is enhanced by the generation of clear graphical outputs based on the input parameters and aids in understanding the distribution of stresses in the horizontal, transverse, and vertical axes, as illustrated in Figure 1.
On the main screen of SysTrain, tabs with menus for data input, calculations, graphs, and output reports are presented, allowing for a clear visualization of the information processed by the program. The interface enables the parametric customization of the railway structure and encompasses the definition of geometric elements such as rails, sleepers, and the three-dimensional finite element mesh. Users can rotate the model in all directions to facilitate the verification of the configuration before starting calculations.
The program offers nine constitutive models for the materials that make up both the track bed and the underlying layers, with options including Linear Isotropic, Resilient Clay, Resilient Granular, Resilient Cohesive, and Resilient Combined, among others.
The mesh discretization was defined based on specific parameters, including longitudinal divisions of the rail and layers, transverse and vertical divisions of the sleepers, as well as discretization of the ballast and underlying layers. The resulting mesh can be visualized in the software, allowing for necessary adjustments. To ensure a balance between accuracy and computational efficiency, a mesh sensitivity analysis was conducted. This process involved progressively refining the element size until variations in the results became insignificant, thus avoiding excessive refinement that would unnecessarily increase computational time. Additionally, transverse and longitudinal symmetry planes were applied, reducing the modeled domain without compromising the structural behavior of the track.
Figure 2 illustrates the main screen of the program, where a complete structure with an associated finite element mesh can be observed. The figure highlights the main components of the structure: the track bed, the ballast layer (in gray), the sub-ballast layer (in yellow), and the subgrade (in green). The load, which is applied to the mesh, refers to the loading from the first axle of a four-axle hopper car, while the loads from the other axles (shown in blue) are not considered in the analysis. The three-dimensional finite element mesh incorporates the dual symmetry of the structure, which was analyzed from the reference axis and the number of sleepers involved, both defined by the user.
Calculation settings, such as the number of parallel processes, type of analysis, precision, and convergence criteria, can be adjusted according to project needs. After simulation, the results are available in both graphical form and detailed reports, accessible through the “Visualization” and “Verification” options in the menu, which allow for in-depth and personalized analysis of the data generated by the program.

2. Methodology

For this case study, 10 soil sampling points from Cruz’s (2019) research were considered. Based on the characterization tests of the samples, including Atterberg limits (NBR 6459 [41] and NBR 7180 [42]), grain size distribution (NBR 7181 [43]), and the MCT (Miniature Compacted Tropical) methodology (DNIT 259 [44]), as well as triaxial tests for Resilient Modulus (DNIT 134 [45]), Dynamic Cone Penetrometer (DCP) tests (NBR 17091 [46]) used to verify the resistance and thickness of the subgrade layer, and Light Weight Deflectometer (LWD) tests (ASTM E2583 [47]) employed to determine the dynamic modulus of the ballast and sub-ballast layers, the behavior parameters of the materials for the ballast, sub-ballast, and subgrade layers were defined for use in the numerical modeling of this study.
The parameters obtained from these tests were input into the SysTrain software to evaluate the mechanical performance of the railway platform. The simulations utilized data collected from field and laboratory tests conducted between kilometers 264+500 (Campinas, SP, Brazil) and 264+300 (Ribeirão Preto, SP, Brazil) of the VLI railway network, known as the “Centro Sudeste Paulista Corridor”, as illustrated in Figure 3.

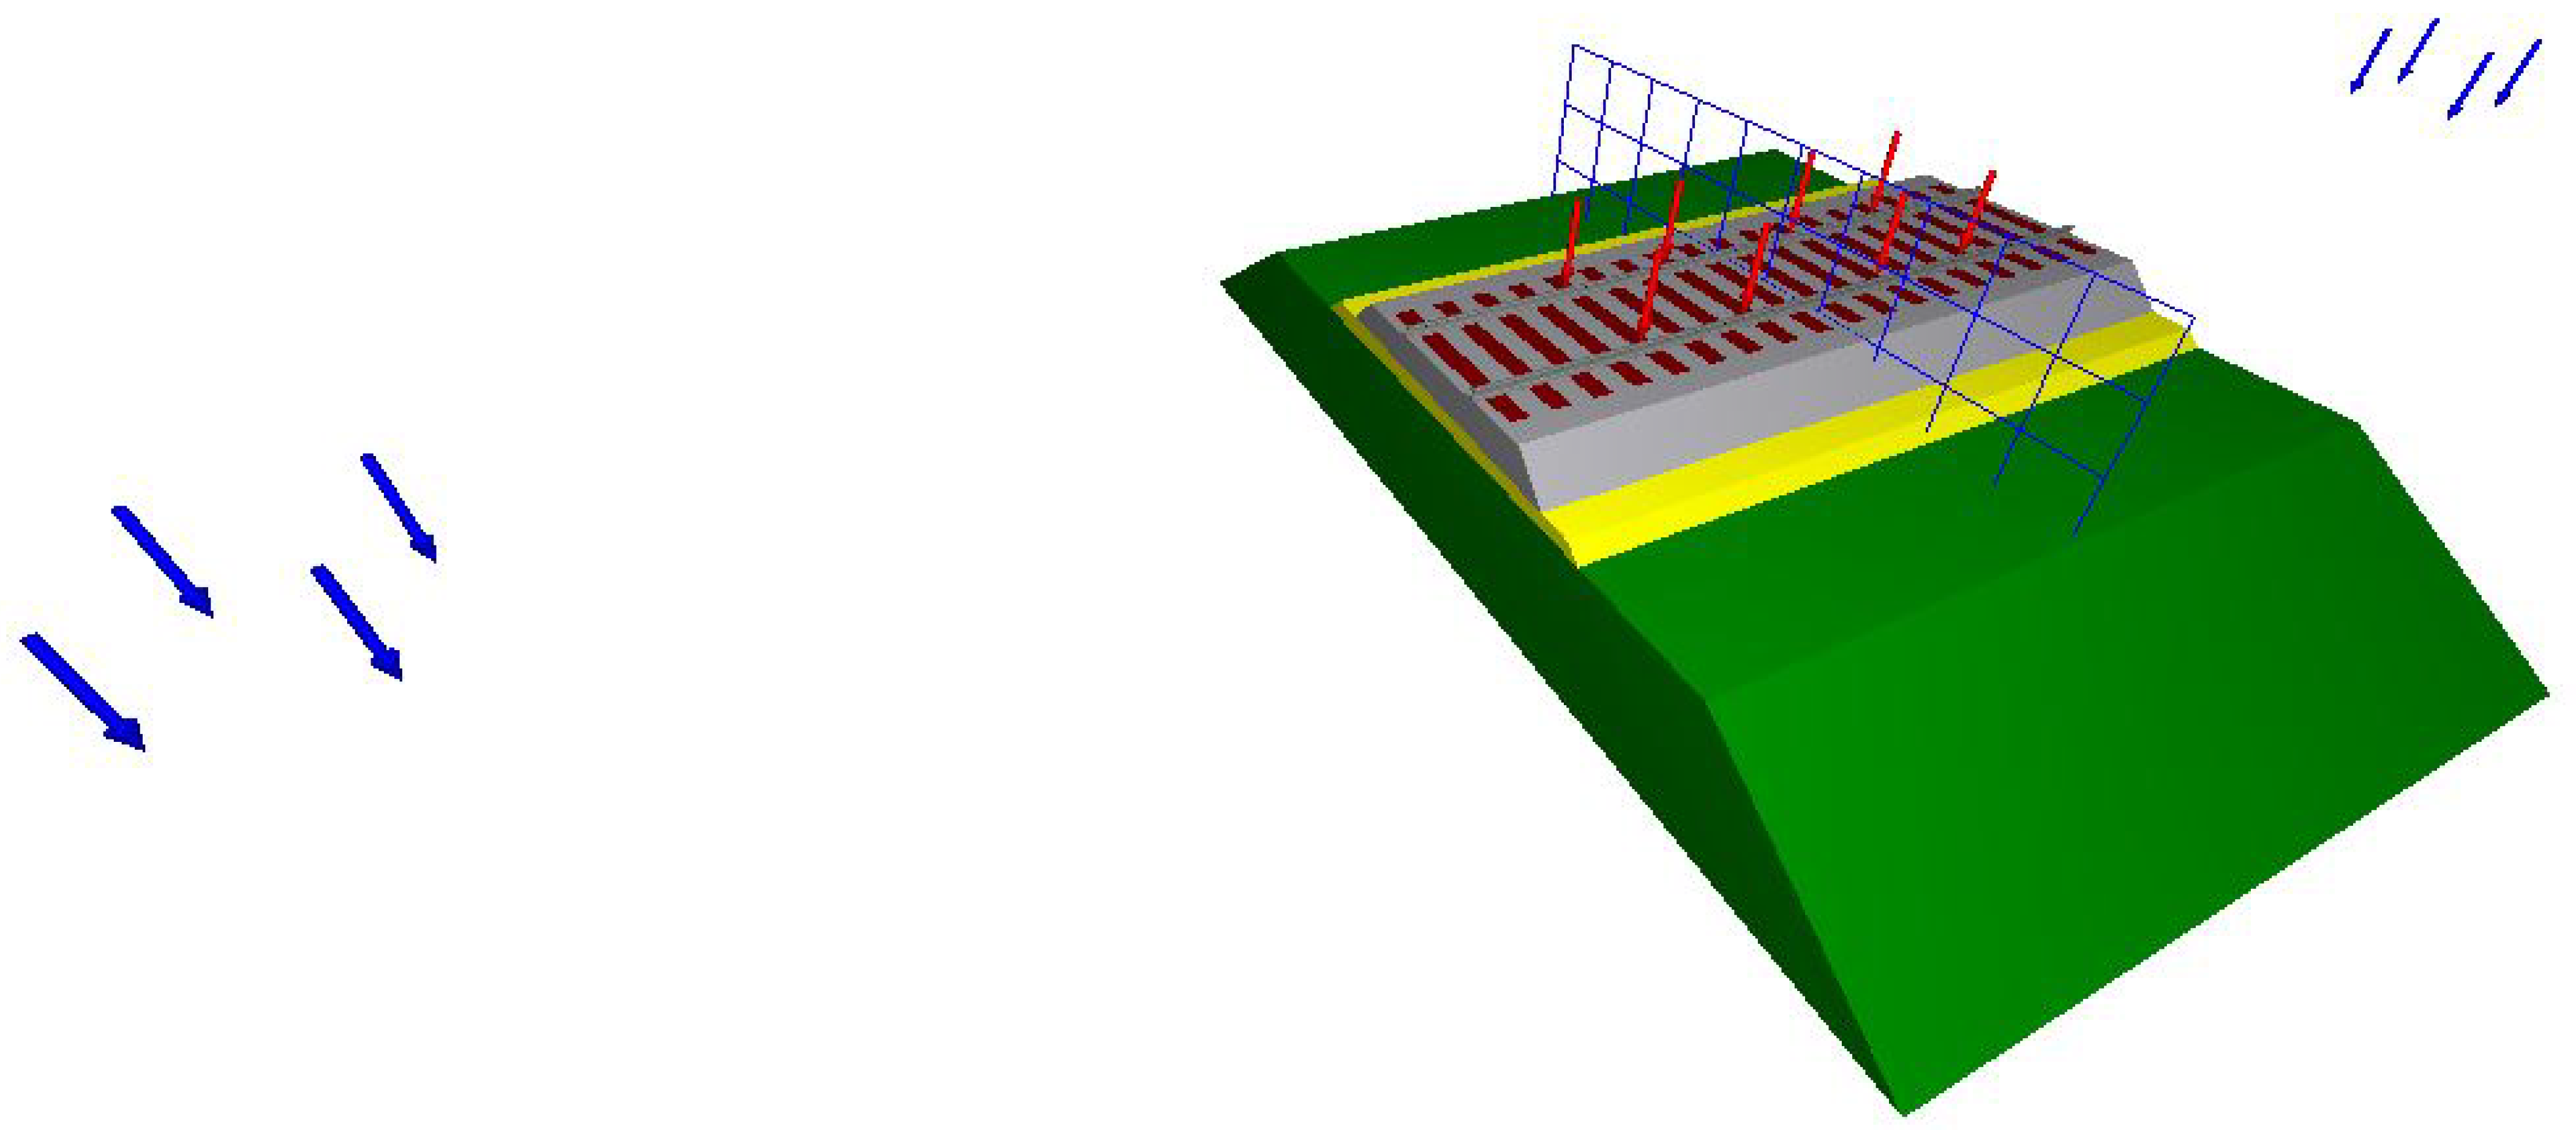
2.1. Computational Modeling—SysTrain

For the analysis of the stress–strain behavior of the railway track, the SysTrain software was used. It is a tool based on the finite element method that facilitates the structural evaluation and design of railways.

2.1.1. Input Data

The main input data regarding the geometry of the track were obtained from the results of field and laboratory tests, as well as information provided by the operator of the segment. The remaining data were adopted based on conventional values found in current technical standards and/or standard values from the software.
Table 1 presents the input data regarding the simulated geometry, including information about the rail, sleeper, and the different layers of pavement. Table 2 and Table 3 provide data on the materials used, including density ( γ ), modulus of elasticity (E), and Poisson’s ratio ( ν ). The values of deviatoric stress ( σ d ) and confining stress ( σ 3 ) are also indicated. Additionally, the coefficients k 1 , k 2 , and k 3 , which describe the parameters of the composite resilient modulus model ([48,49]) for each analyzed sample, are presented in Equation (1)), which is shown below.
Resilient   modulus = k 1 · σ 3 k 2 · σ d k 3
The loading applied to all samples, which is considered a Hopper-type wagon, is equipped with two bogies. The distance between the coupling and the axle was 1.21 m, while the distance between the axles was 1.7 m. The distance between the bogies was 13.945 m. The wagon has two members and supports a total load of 100 tons. The first selected axle was axle 1, with the entire composition consisting of a total of 8 axles (Figure 4). Symmetry was used in the load distribution, taking the center of the wagon as the reference point. The reference axle was axle 4, and the analysis included 4 additional sleepers beyond the external load.
Although 10 samples were modeled and evaluated, only the graphical results for Sample 09, which are chosen at random, are presented. This selection exemplifies the functionalities and detailed computational tools used in the study, serving as a representative case for the method applied to all the other samples.

2.1.2. Simulations

Based on these initial input data, which are representative of the current operational conditions of the section, 55 simulations were conducted for each sample, with a variation of 15 cm in the thicknesses of the ballast and sub-ballast. The thicknesses ranged from 10 cm to 160 cm for the ballast and from 0.1 cm to 150 cm for the sub-ballast, totaling 550 simulations. An initial thickness of 0.1 cm was adopted for the ballast to simulate the absence of the layer due to the software’s inability to simulate a thickness of 0 cm.
Additionally, for the purpose of verifying pavement admissibility under the current operational conditions of the section, one simulation was performed for each sample, resulting in a total of ten simulations.

2.1.3. Output Data

Based on the input data, the samples were modeled in Systrain, which provided several outputs, including the maximum bending moment in the rails, the total structural deflection, the maximum vertical stress in the layers, and the maximum contact pressure on the ballast. These values enabled an assessment of the railway pavement’s performance in relation to these parameters as a function of the layer thicknesses.

3. Results and Discussions

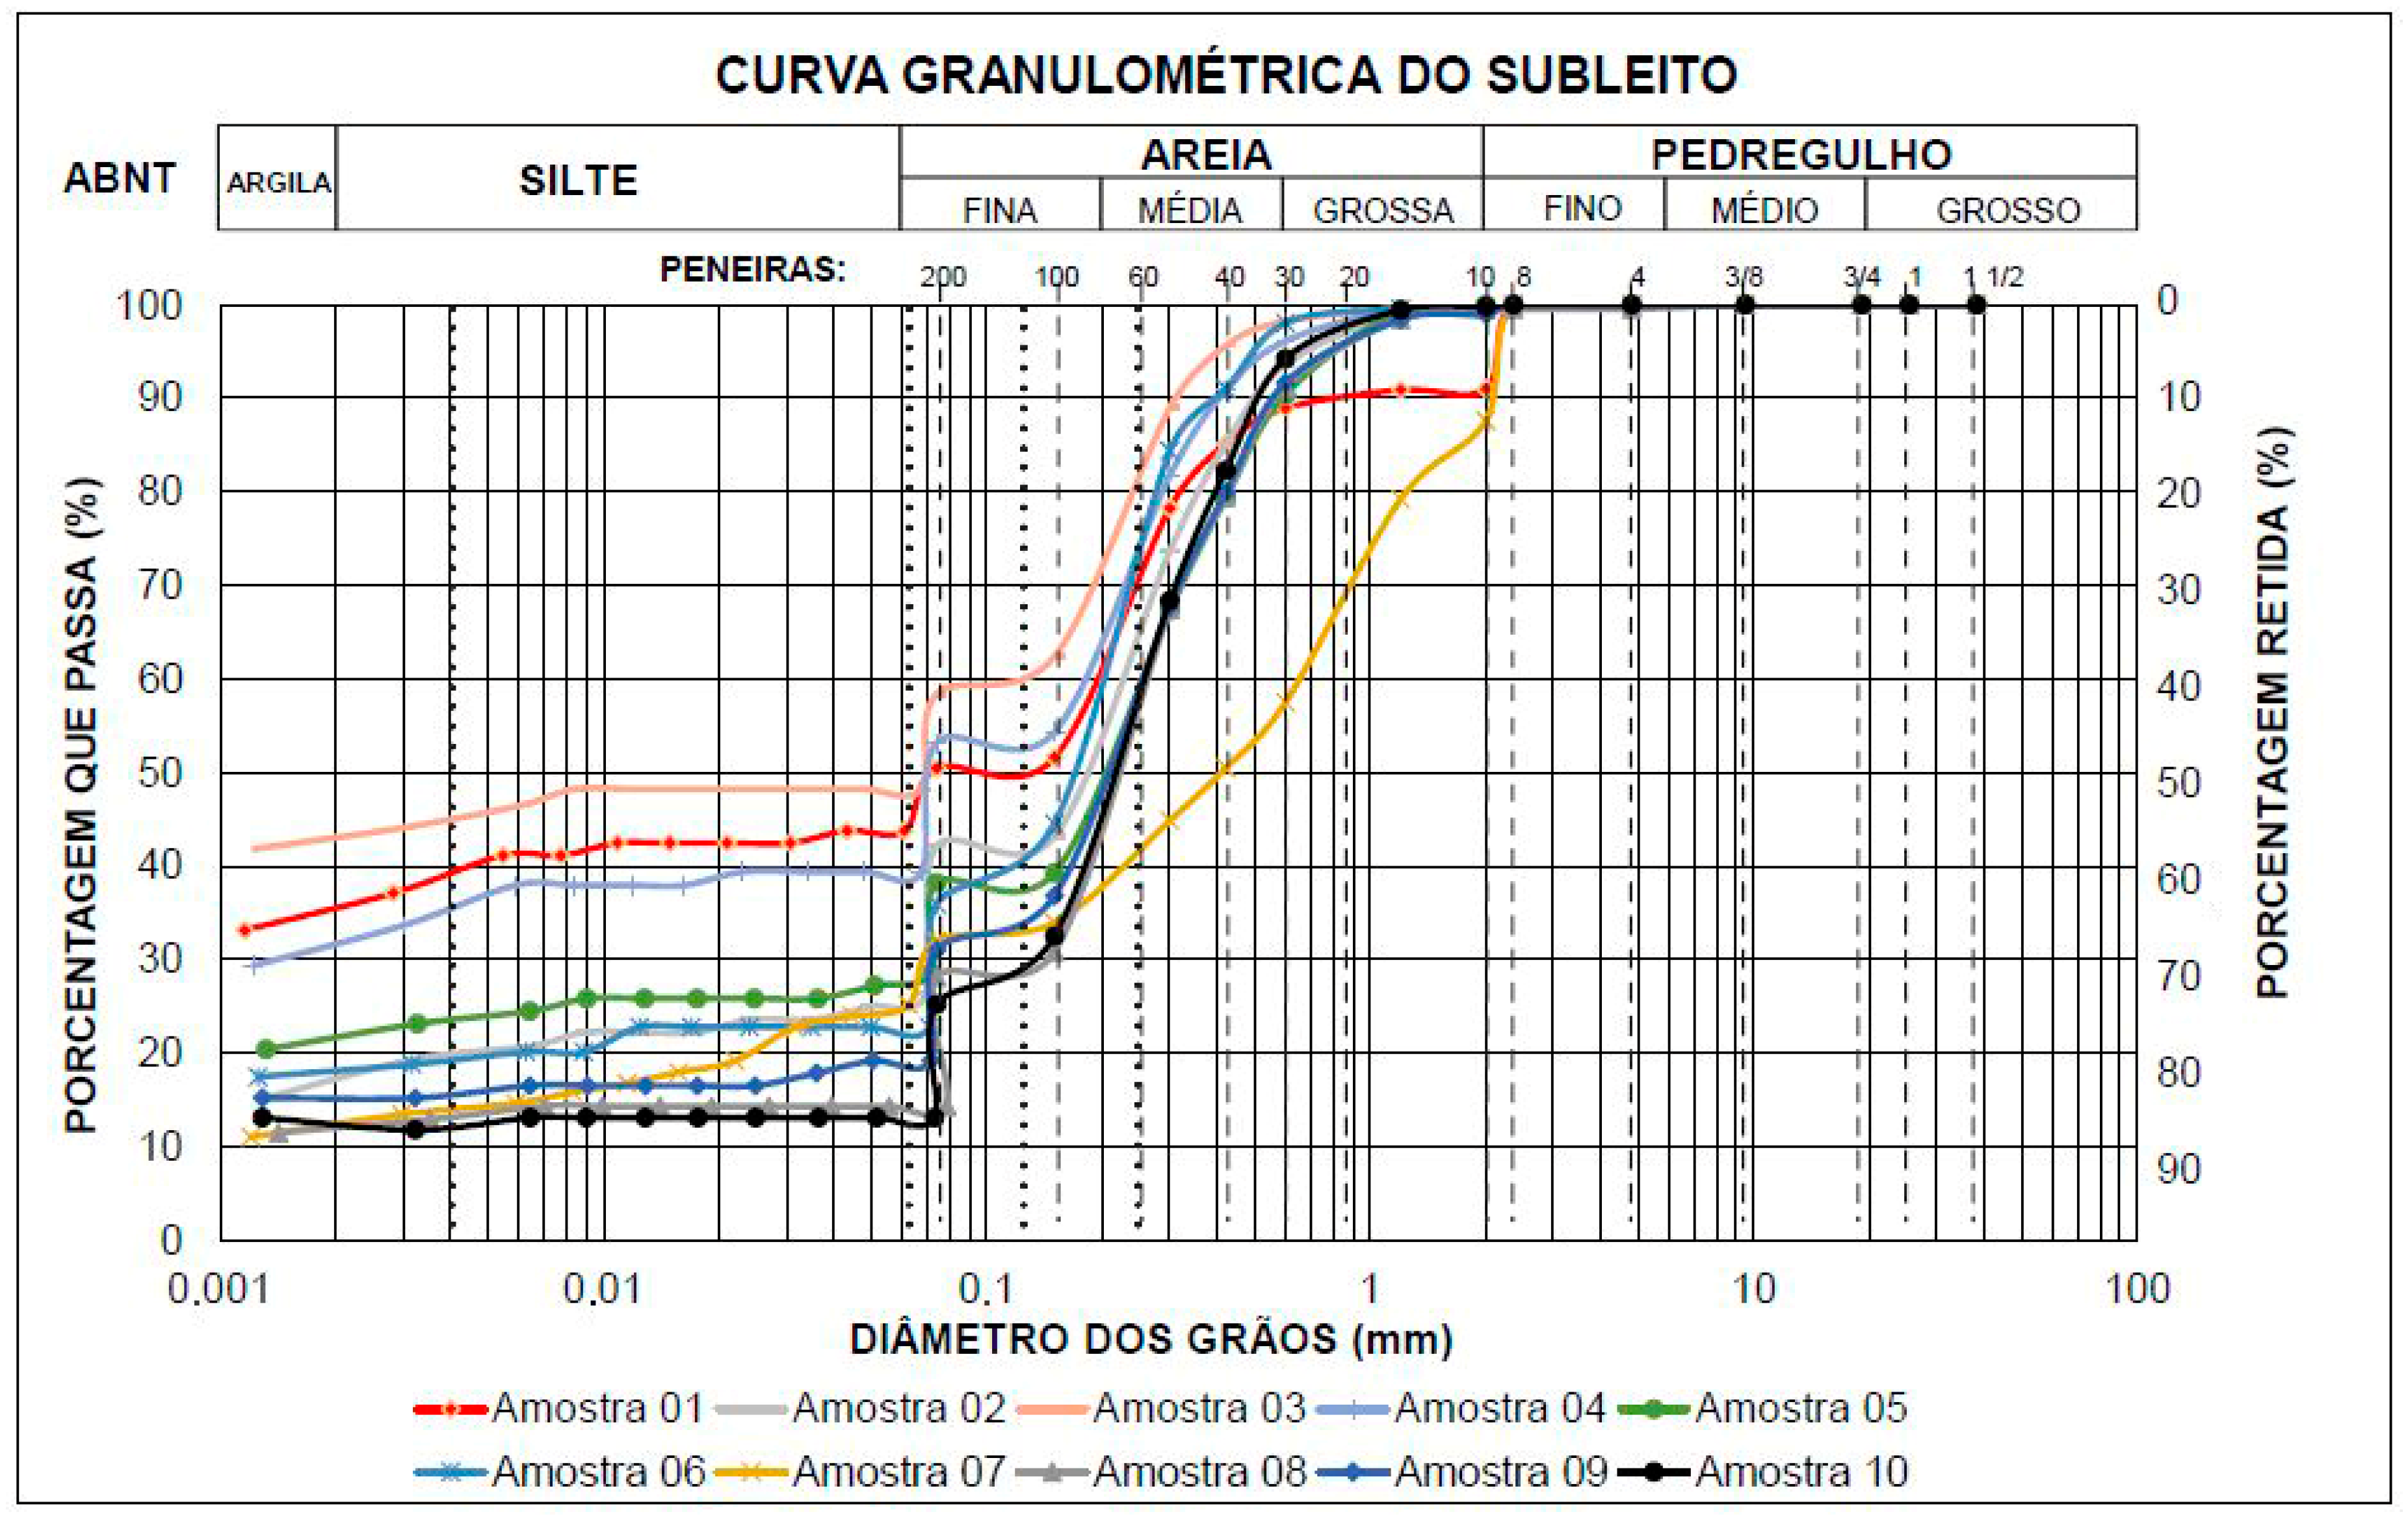
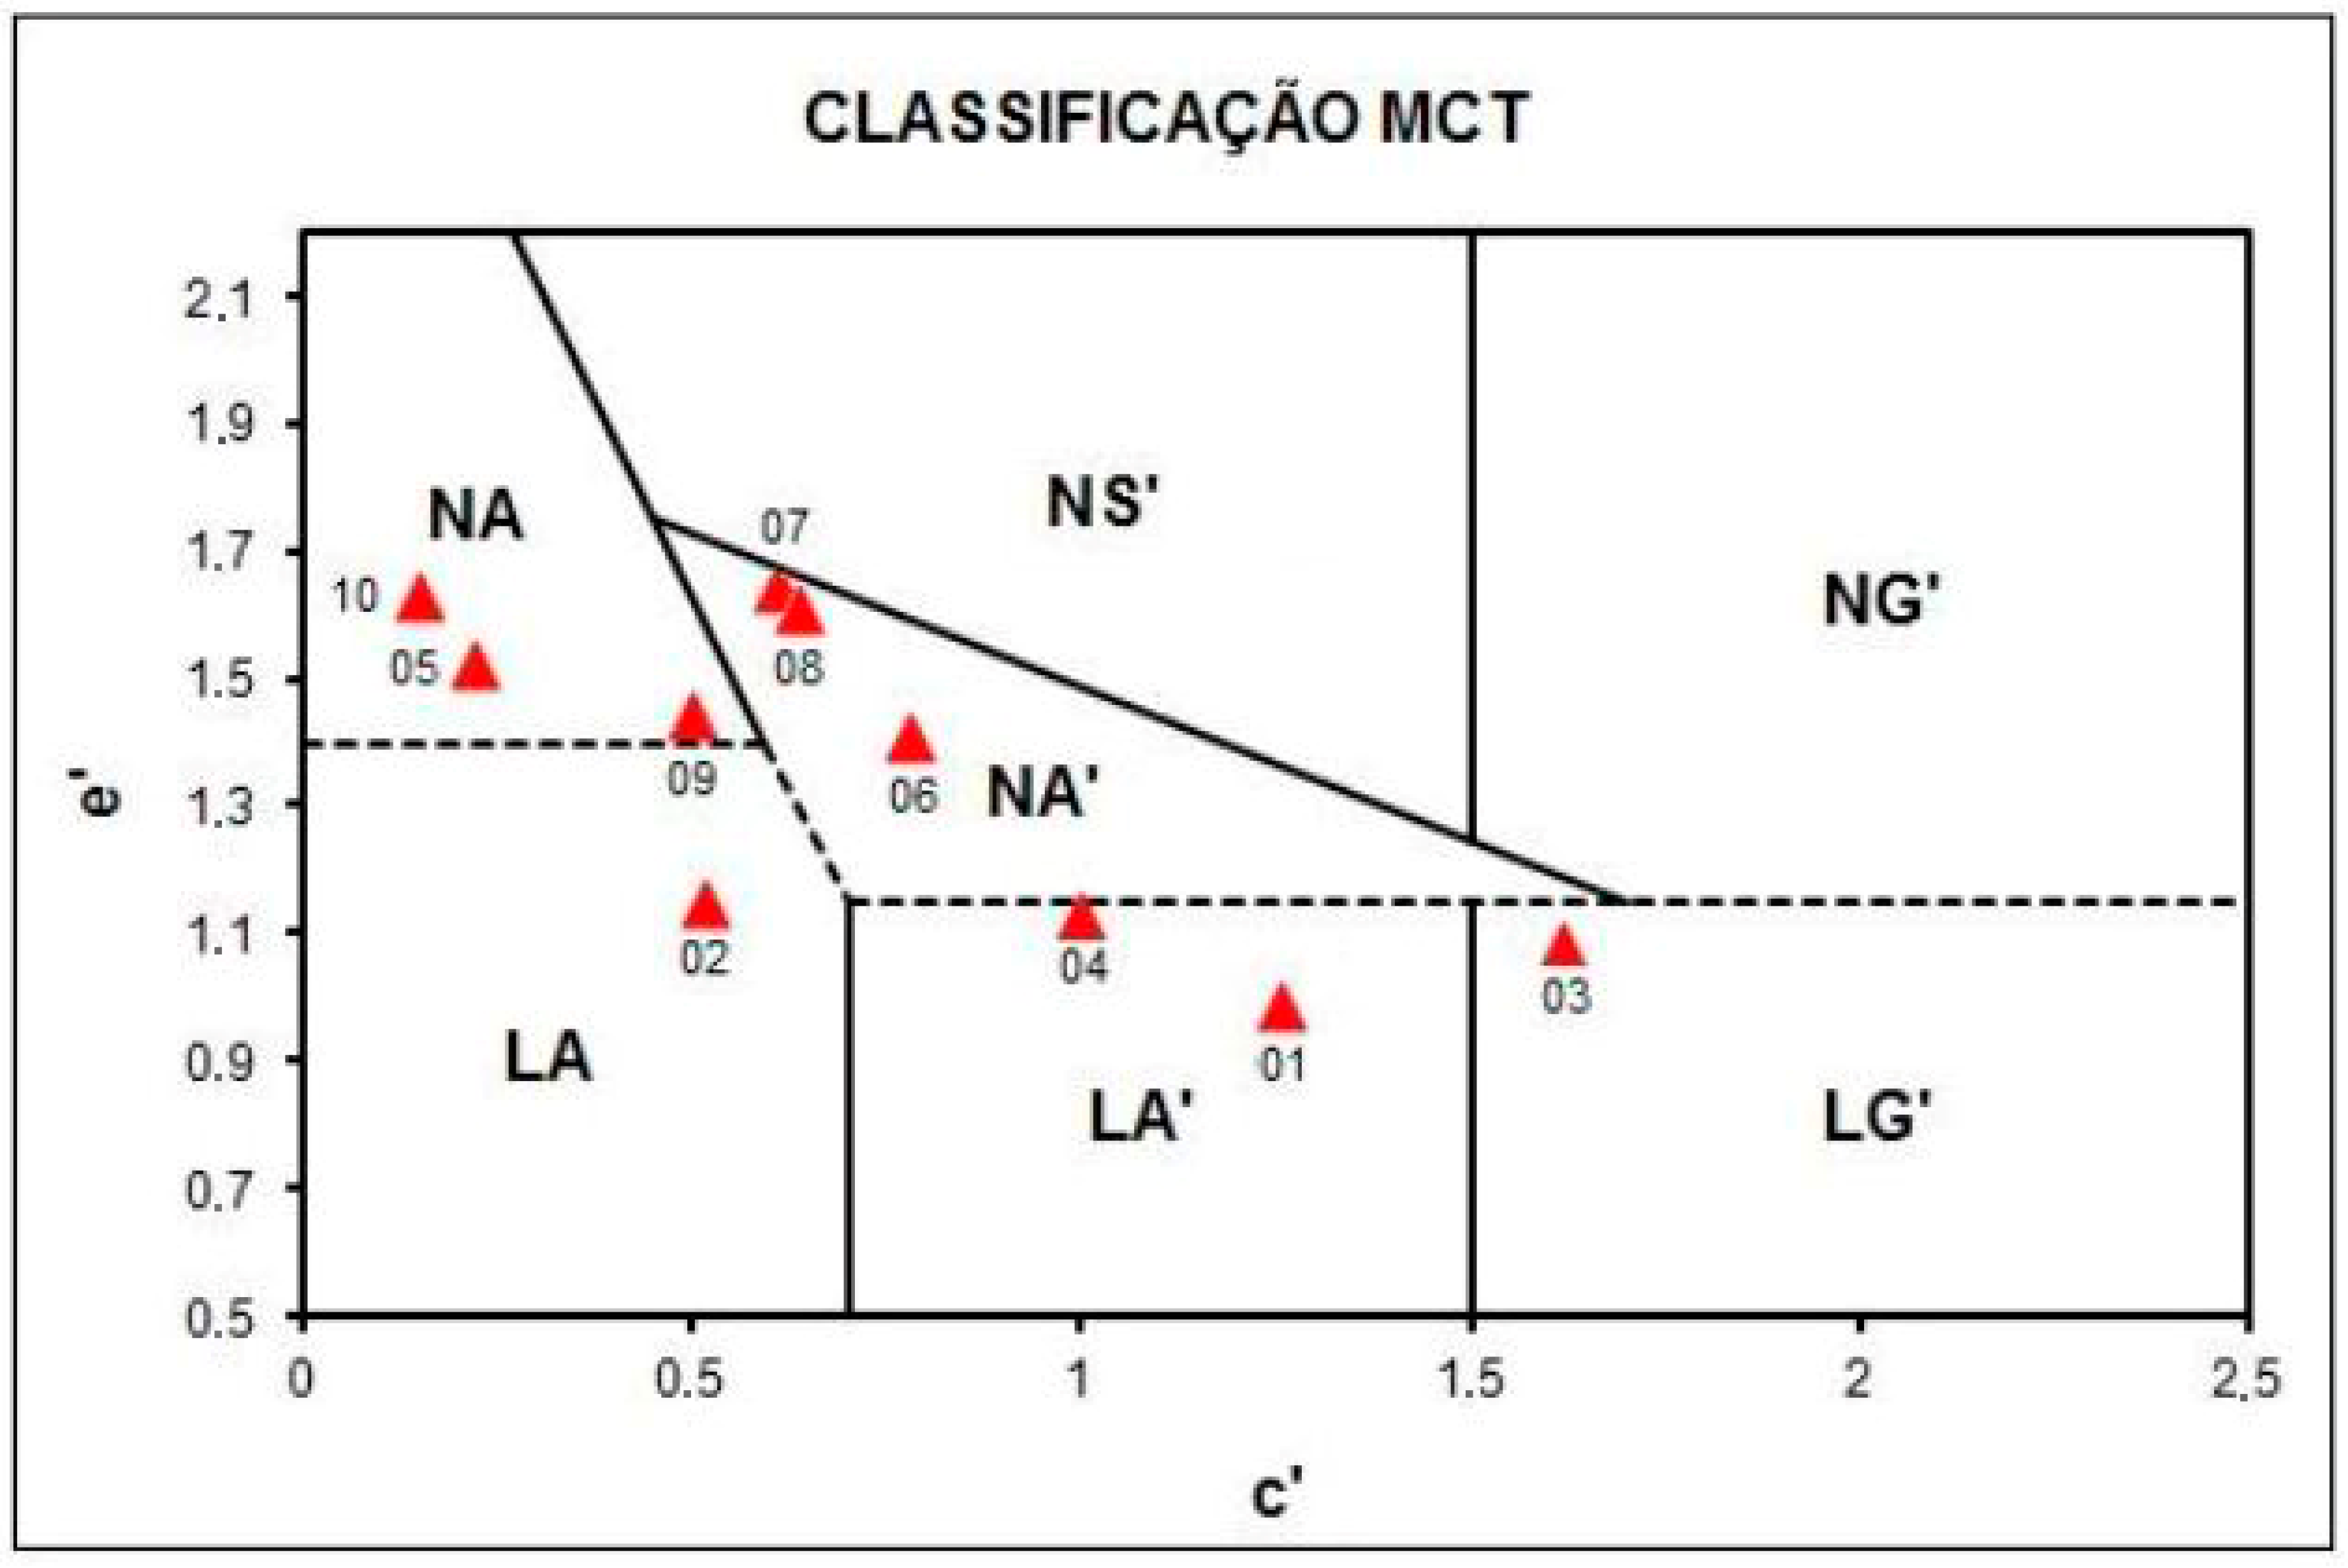
3.1. Analysis of Physical Characterization Tests

Table 4 presents the results obtained from the subgrade characterization tests, including the laboratory density ( ρ l a b ) and field density ( ρ n ), the optimum moisture content ( W o ) and field moisture content ( W n ), as well as the liquid limit (LL), plastic limit (LP) and plasticity index (IP). The classifications of the samples according to traditional systems (TRB and SUCS) and the MCT classification method are also provided.
Among all samples, only Sample 03 exhibited an IP and was classified as plastic. The remaining samples were considered non-plastic as it was not possible to determine the values of LL and LP (Table 4).
Figure 5 presents the results of the grain size distribution tests for the subgrade layer at various points along the railway analyzed in this study. The data in the table show the percentage distribution of the different granular constituents, including clay, silt, fine sand, medium sand, coarse sand, and gravel, for each of the collected samples.
In the particle size classification (Table 4), Samples 02, 05, 06, 08, 09, and 10 predominantly consist of medium to fine sand, with a higher proportion of medium sand, except for Sample 06, where fine sand is predominant. Sample 07 contains a higher proportion of coarse sand, followed by medium and fine sand. Samples 01, 03, and 04 are primarily composed of clay and medium sand. Only Samples 01 and 07 exhibited a significant presence of gravel.
According to Nogami and Villibor [50], the MCT Methodology (Miniature, Compacted, Tropical) classifies soils into two main groups: lateritic behavior (L) and non-lateritic behavior (N). This distinction is based on the particle size distribution and mechanical behavior of the soils, allowing further subdivisions according to the predominance of sandy, silty, or clayey fractions.
  • Classes:
    -
    N—Soils with “non-lateritic” behavior
    *
    NA (Sands): Sands, Silty Sands, Silts (l)
    *
    NA’ (Sandy Soils): Silty Sands, Clayey Sands
    *
    NS (Silty Soils): Silts (k, m), Sandy Silts, and Clayey Silts
    *
    NG (Clayey Soils): Clays, Sandy Clays, Silty Clays
    -
    L—Soils with lateritic behavior
    *
    LA (Sands): Sands with low clay content
    *
    LA’ (Sandy Soils): Clayey Sands, Sandy Clays
    *
    LG (Clayey Soils): Clays, Sandy Clays
The MCT classification of the samples is presented in Figure 6.
Of the ten analyzed samples, four exhibited lateritic characteristics. Samples 01 and 04 were classified as LA’, Sample 02 as LA, and Sample 03 as LG’. According to Nogami and Villibor [50], these soils are suitable for pavement applications due to their favorable mechanical behavior. The remaining six samples exhibited non-lateritic characteristics, being classified as NA and NA’. Among them, Samples 06, 07, and 08 were identified as NA’, while Samples 05, 09, and 10 were classified as NA.
Of the ten analyzed subgrade samples (Figure 6), eight exhibited a particle size distribution between 99% and 100% passing through sieve No. 10 (2.00 mm), meeting the requirements of the DNIT 259 [44] standard for MCT classification, which mandates 100% passing through this sieve. Samples 01 and 07, despite having 88% and 91% passing, respectively, can also be considered fine soils for MCT classification purposes.
The analysis of the classifications presented in Table 4 indicates that, across the three classification systems, the results are consistent with the type of material studied. According to the TRB classification, Samples 01 to 06 are predominantly silt-rich soils, while Samples 07 to 10 are composed of granular materials such as gravel with silt and silty sands. Based on the SUCS classification, Samples 01 and 04 correspond to fine silty sands, Samples 02 and 05 to 10 consist of silty sands, and Sample 03 is classified as a clayey gravelly sand with silt.
Under the MCT classification, Samples 01 and 04 are characterized as lateritic sandy soils, Sample 02 is a sandy soil with a low fine fraction, and Sample 03 is a clayey sandy soil. Samples 06, 07, and 08 are classified as sandy soils containing fines, whereas Samples 05, 09, and 10 consist mainly of sands and silts.
Regarding the LL, LP, and IP, although their application in railway engineering is not extensively referenced, Paiva et al. [51] indicated that, according to ES 316 [52], LL should be below 25%, and IP should not exceed 6%. As shown in Table 4, Sample 03 presented an LL within the specified limit; however, its IP exceeded 6%. The remaining samples (01, 02, 04, 05, 06, 07, 08, 09, and 10) were classified as non-plastic (NP).

3.2. Systrain Simulations

In finite element modeling, mesh discretization is a crucial aspect that directly affects the accuracy of the results. The generated mesh results from the discretization defined by parameters such as the length divisions of the rail along the track, the divisions of the layers between the sleepers, and the transverse and vertical divisions of the sleepers and ballast. After applying both transverse and longitudinal symmetry, the modeled geometry corresponds to 1/4 of the selected geometry. A mesh sensitivity analysis was conducted, involving adjusting the element size in successive attempts until no significant changes in the results were observed. Thus, the optimal element size was determined, balancing calculation accuracy and the computational time required to ensure that all numerical analyses performed were reliable and representative of the actual conditions of the railway system.

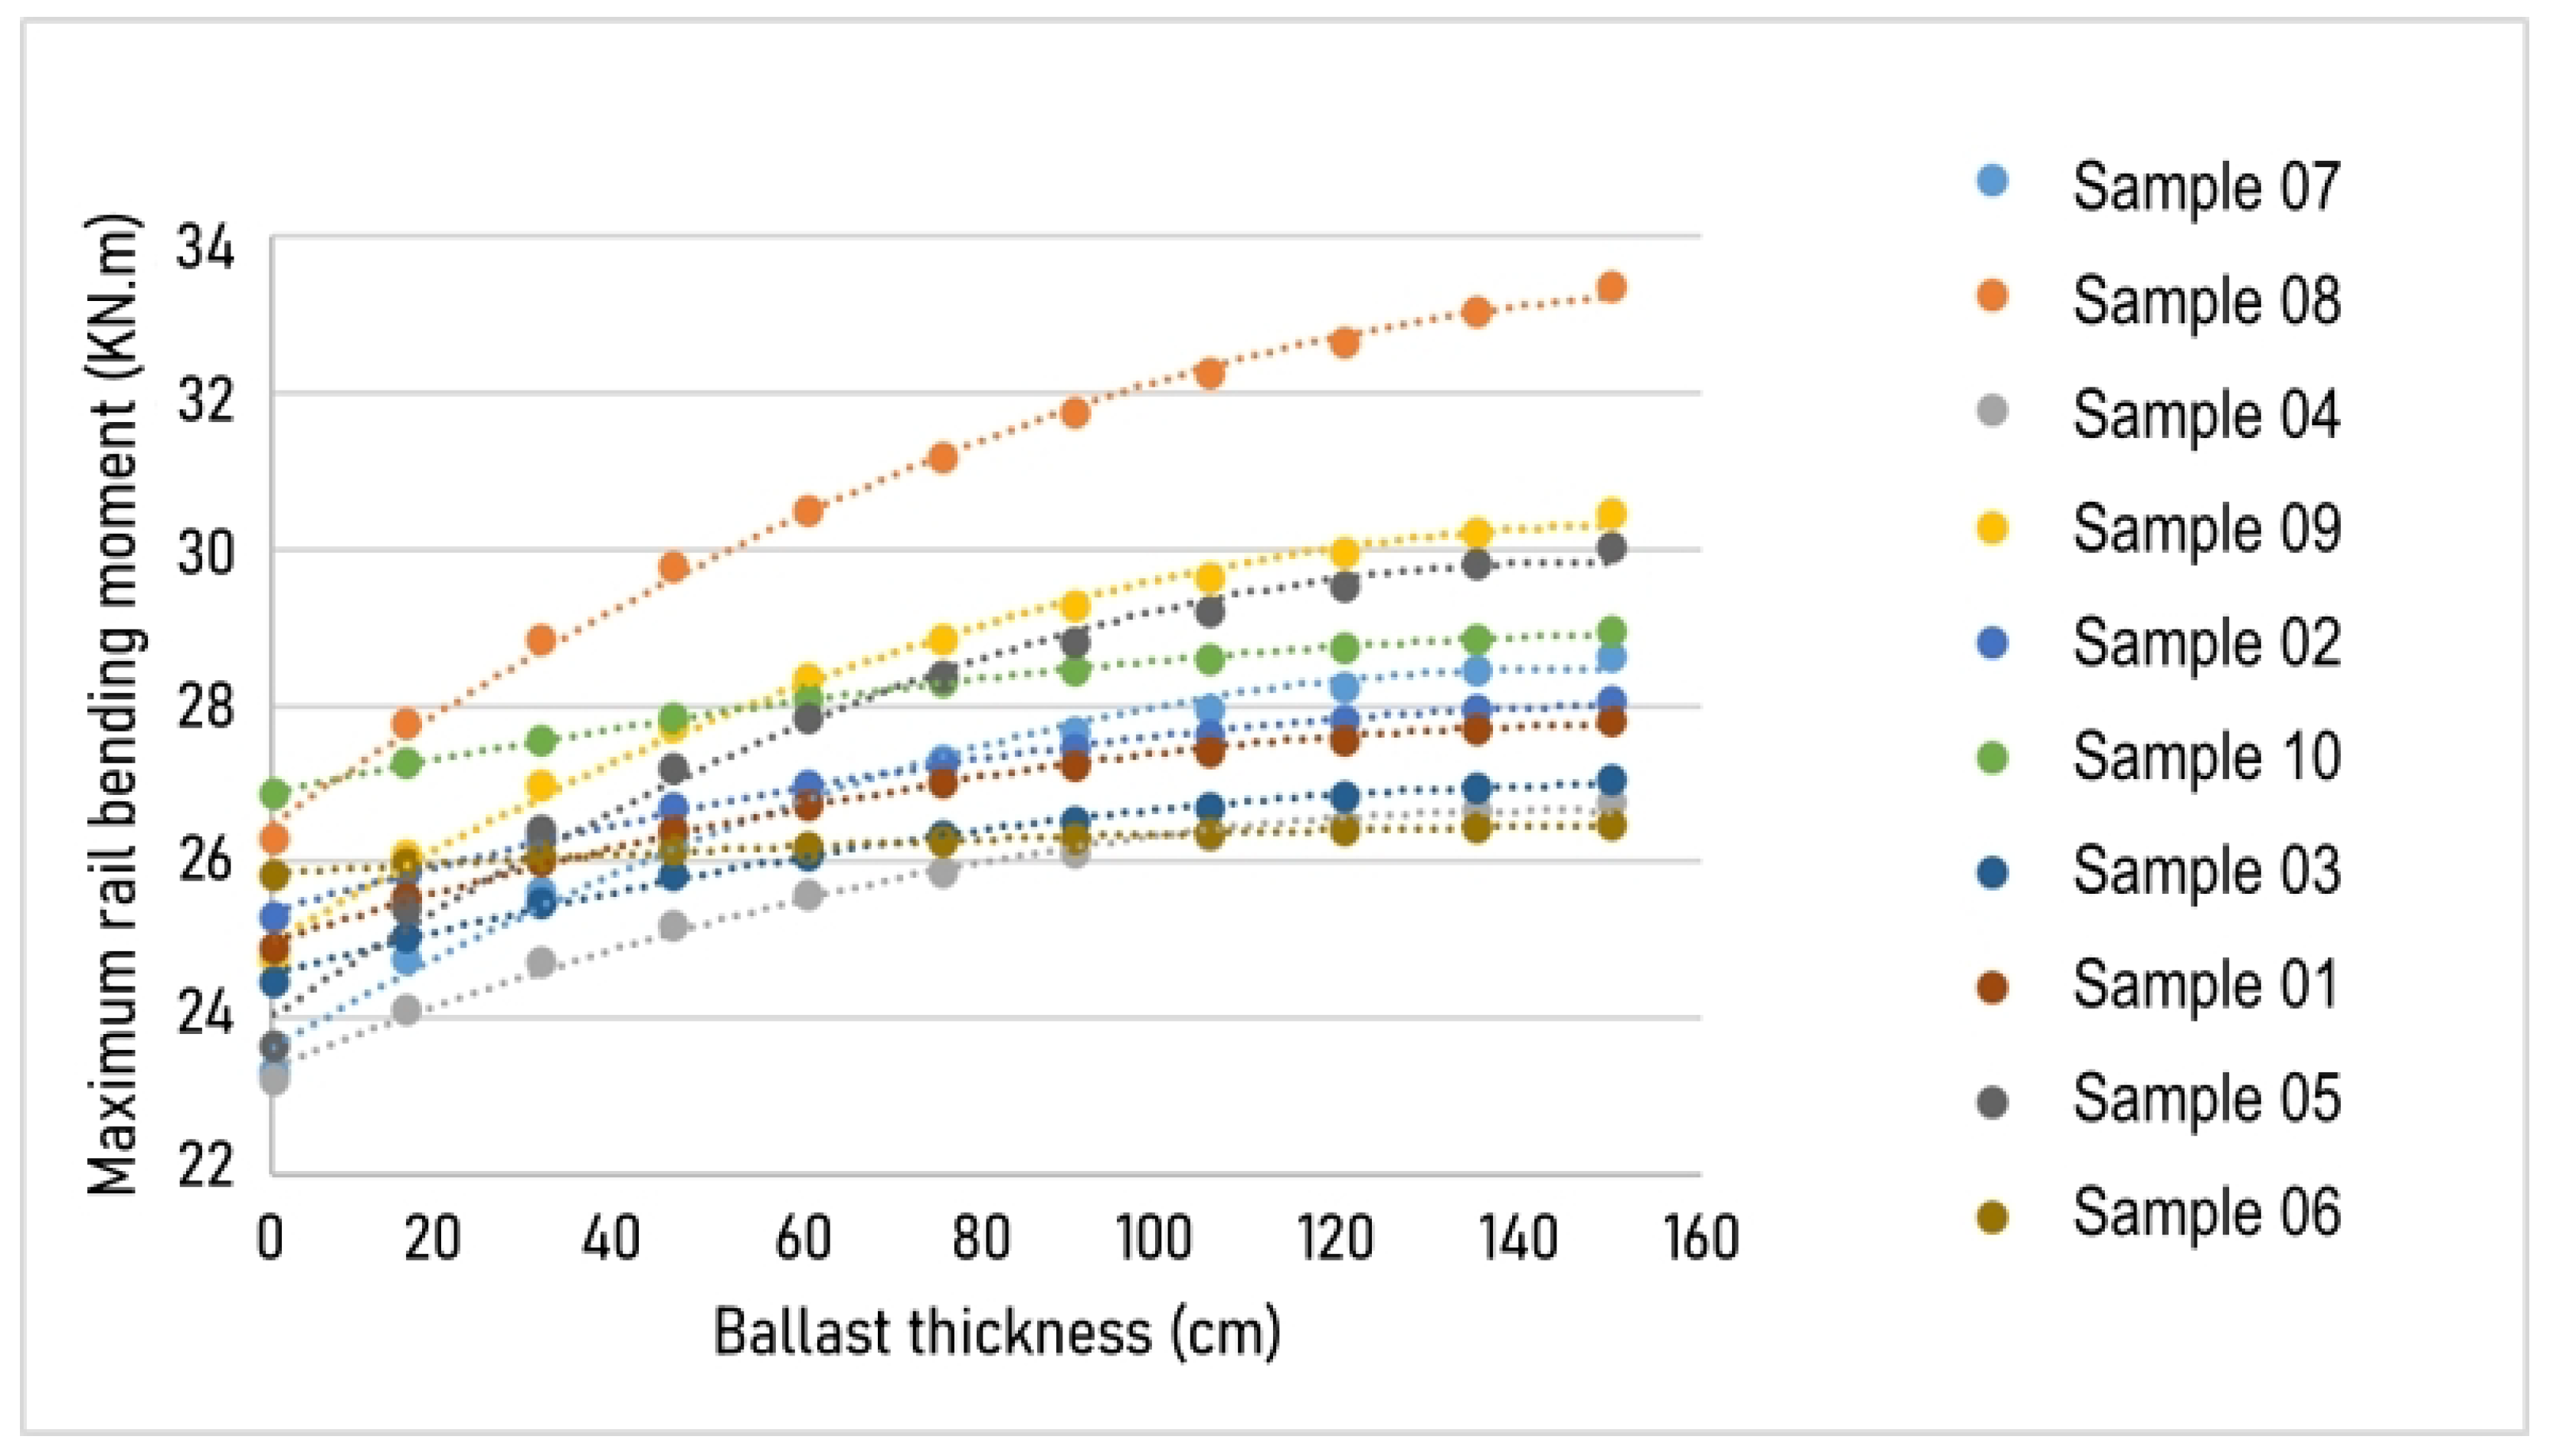
3.3. Influence of Ballast Thickness

Figure 7 and Figure 8 show the variation in design parameters as a function of ballast thickness. The maximum bending moment in the rails was directly proportional to the ballast thickness, with similar behavior between the graphs, as shown in Figure 7. The curve for Sample 08 stood out for its combination of small subgrade thickness and low resilient modulus of the layers.
Figure 8 illustrates the relationship between the thickness of the ballast and the maximum total deflection of the railway structure, considering various samples under cyclic loading conditions. Samples 05, 08, and 10 showed higher maximum deflections, which may be associated with variations in the properties of the subgrade or less efficient resilient behavior of the ballast material. On the other hand, Samples 07, 04, and 06, with lower deflection values, suggest a better ability to dissipate vertical loads, which can be explained by an optimized combination of ballast thickness and strength of the materials involved. Despite these differences, there is a consistent overall trend between the samples, which reinforces the fact that the thickness of the ballast influences the structural behavior of the sidewalk and is a determining parameter in reducing the maximum deflection of the structure, as pointed out in previous studies [53,54,55].
The behavior of the vertical stresses acting on the ballast for the different samples is summarized in Table 5, where it is possible to see a significant variation in the maximum stress values as a function of ballast thickness. The maximum vertical stresses varied between 88.4 kPa (sample 10 with 60 cm of ballast) and 160.3 kPa (Sample 05 with 0.1 cm of ballast), showing the direct influence of the thickness of the ballast on the dissipation of the applied loads.
These values are in line with other studies, such as that by Cruz [36], who reported similar stresses in his simulations using equivalent modeling in the Systrain software. Similar results were also obtained by Delgado et al. [37], who investigated a different type of steel aggregate and observed close stress values. These results corroborate the effectiveness and reliability of the simulations carried out.
To illustrate the displacement in the ballast layer, Figure 9 shows the vertical stress acting on the ballast for Sample 09.
The highest total deflection was observed in Sample 08, with 5.16 mm, the highest value among all the samples tested. This value, although higher, remains below the limit of 6.35 mm established by AREMA [56] for permanent deformations in railway ballast, especially under high load conditions. Other references in the literature also suggest similar limits: Silva Filho [35] recommends a maximum of 4.4 mm for plastic deformations in railroad sidewalks, while Hay [57] proposes 5.0 mm for heavy-load railroads, adopted by Werkmeister, Dawson and Wellner [58] in investigations into shakedown. It is important to note that, in this case, the simulation was carried out considering the most critical scenario in terms of ballast thickness.
To illustrate the behavior of the sidewalk under deflection, Figure 10, which corresponds to Sample 09, shows the total deflection of the simulated sidewalk. The greatest deformations are observed in the regions where the truck axles are located, which is where the vertical load is concentrated. This pattern is to be expected as the interaction of the loads applied by the trucks causes an increase in stresses, specifically in these areas, resulting in more significant deformations.

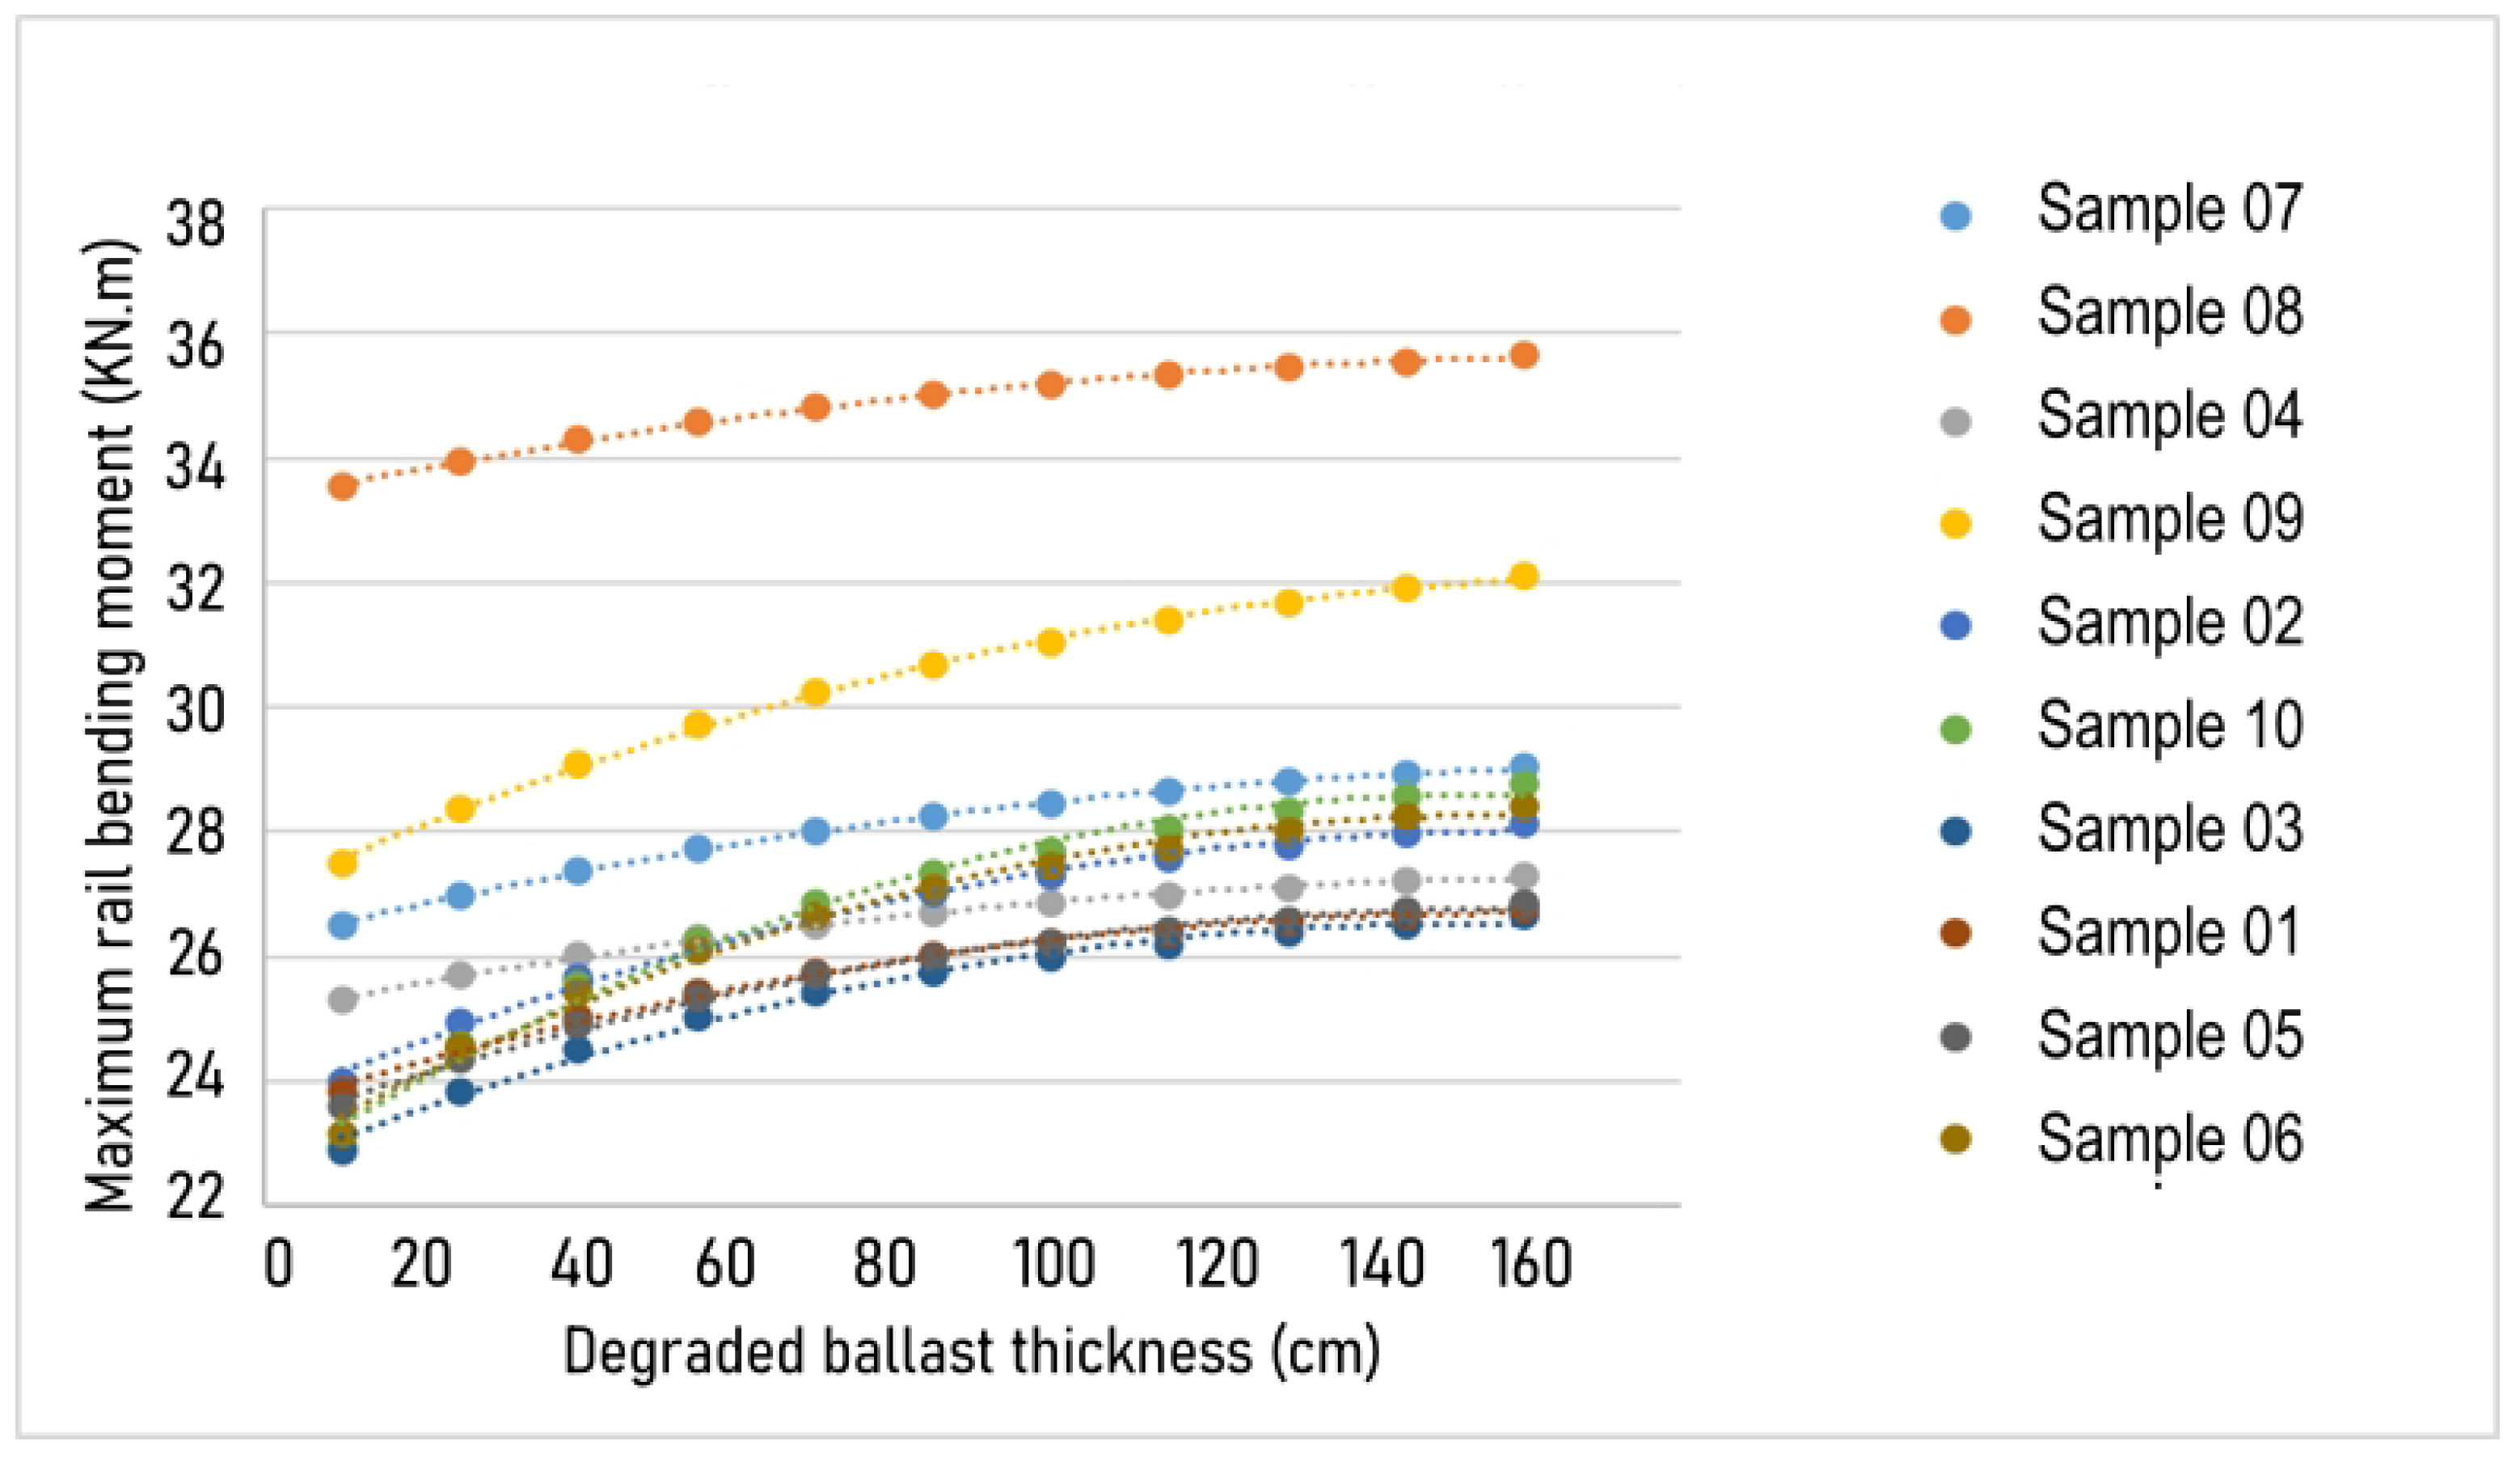
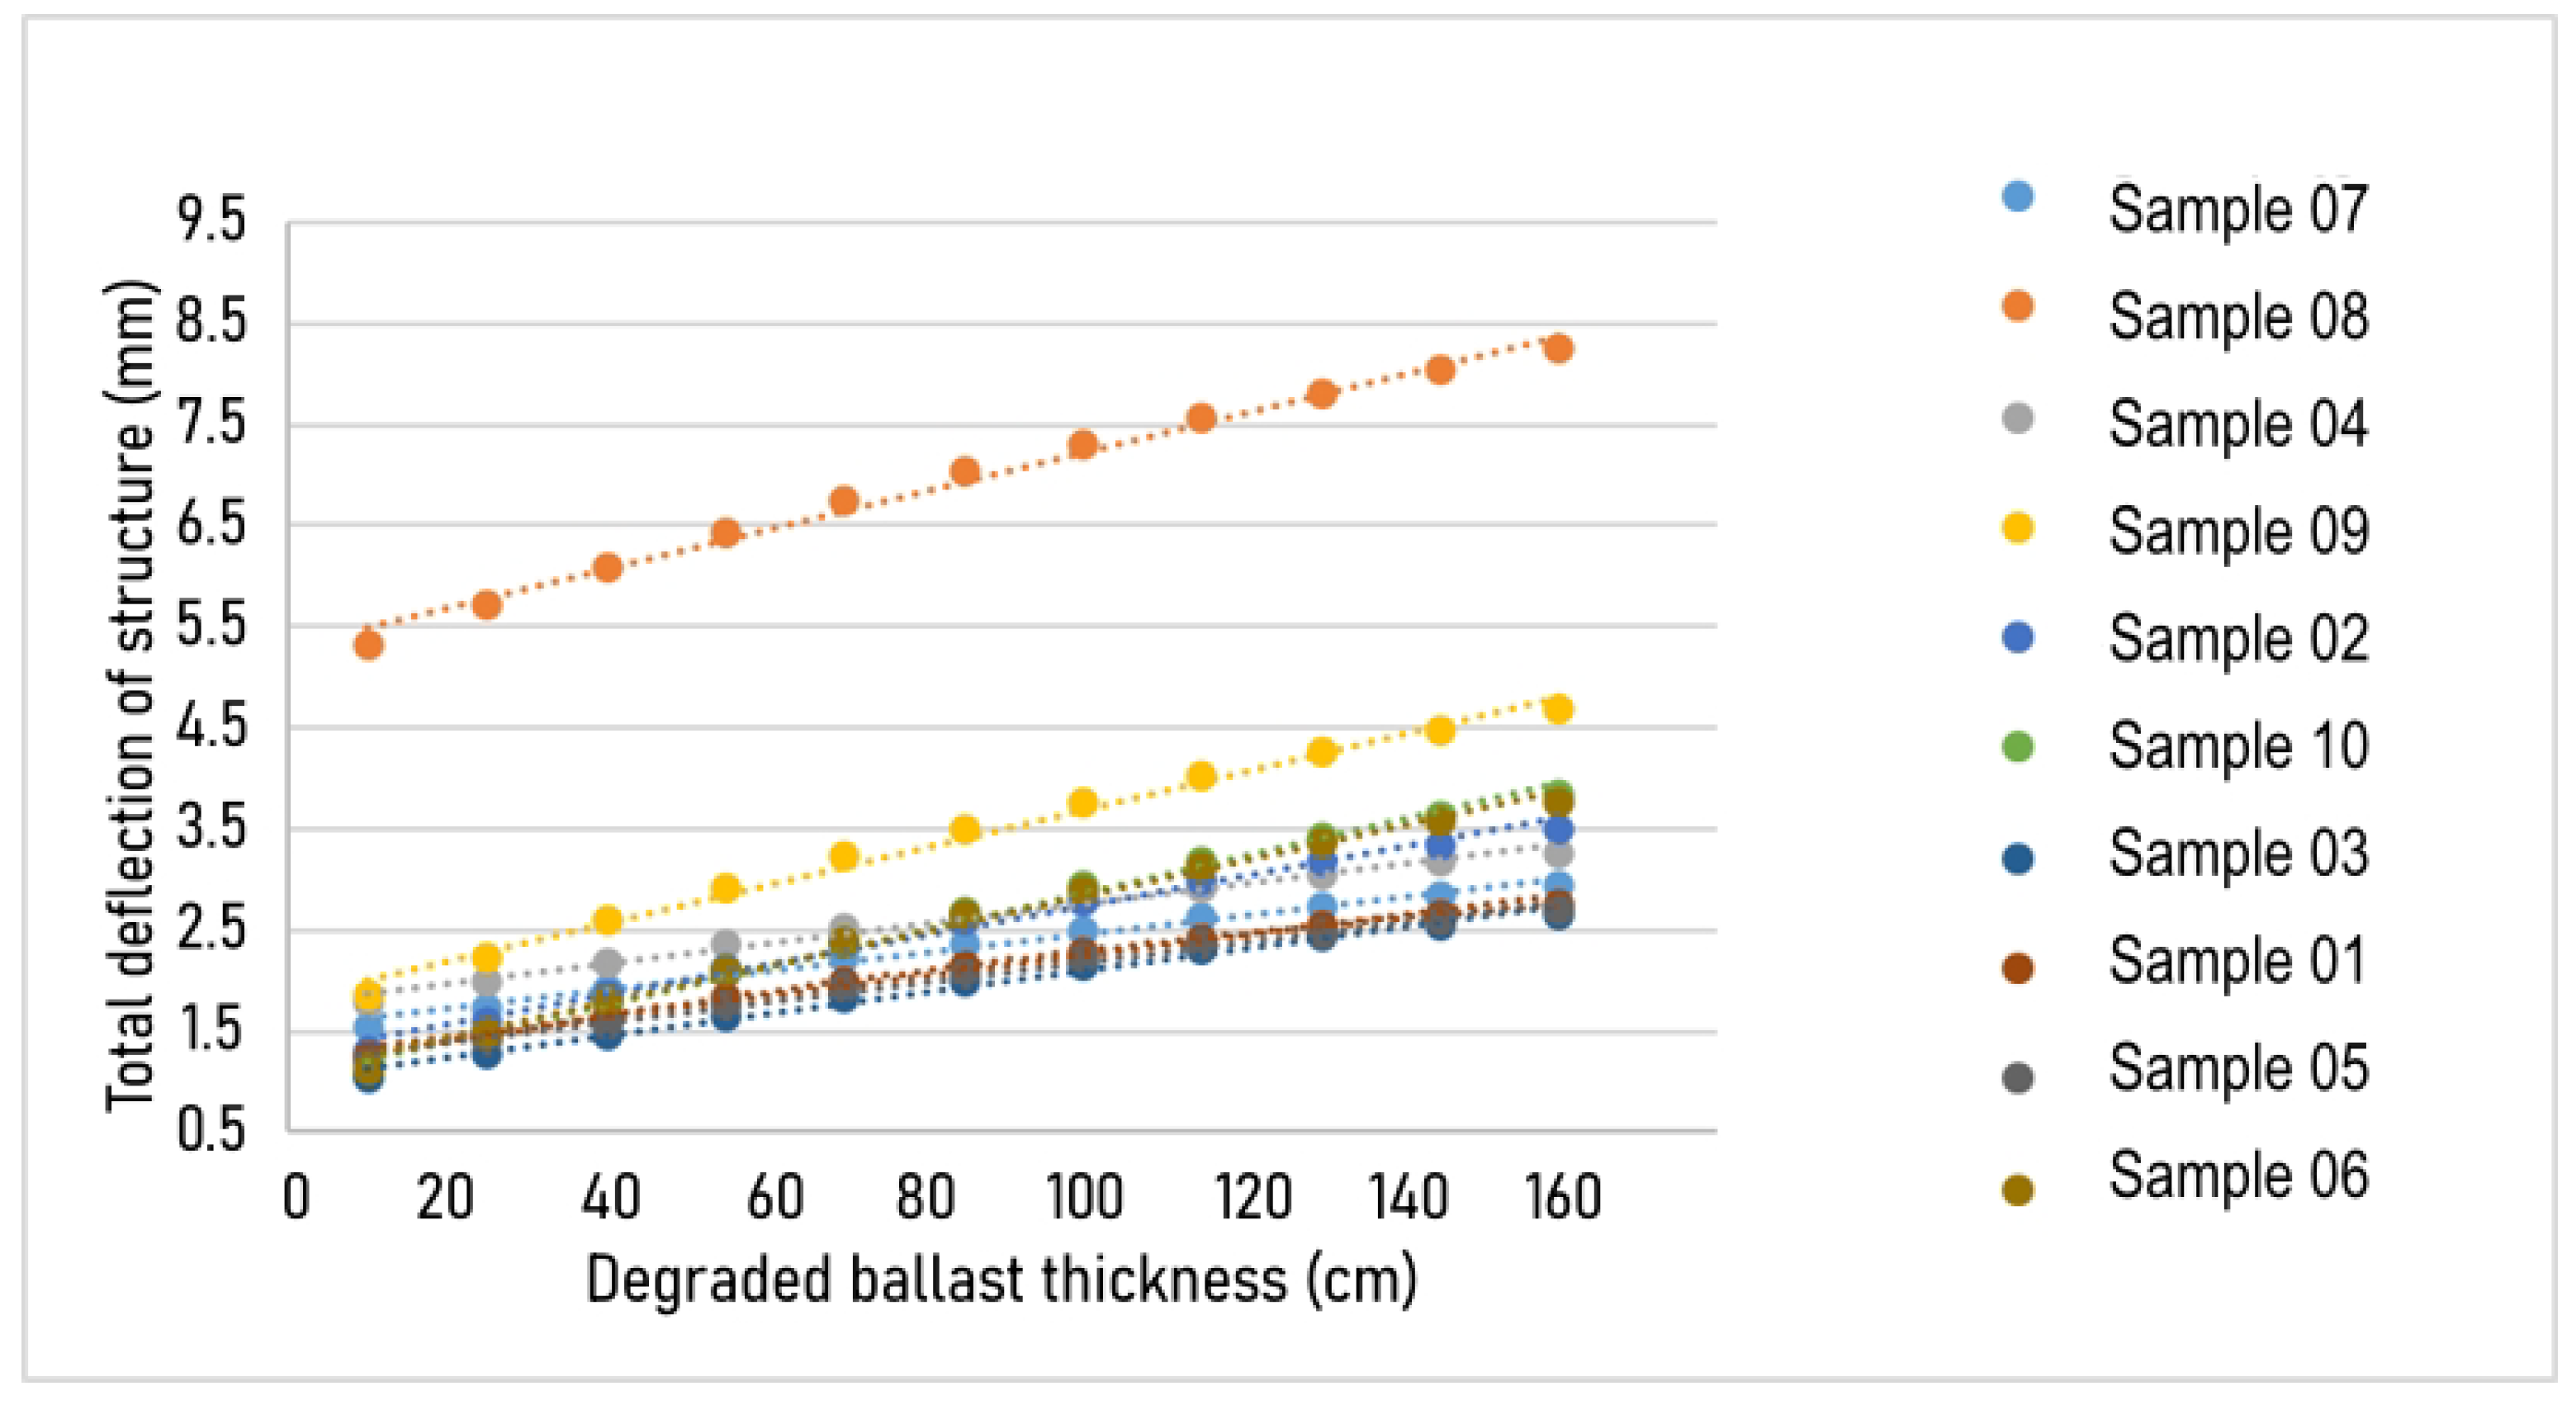
3.4. Degraded Ballast Thickness Variation

Figure 11 and Figure 12 present the graphs showing the variation of the design parameters as a function of subgrade thickness.
As Figure 11 shows, the maximum bending moment in the rails was directly proportional to the thickness of the degraded ballast for all the samples.
When analyzing the influence of the thickness of the layers, it was observed that both the maximum bending moment in the rails and the total deflection of the structure were directly proportional to the thickness of the ballast and sub-ballast. This behavior can be explained by the increase in stresses in the underlying layers, caused by the increase in the layer’s own weight as its height rises.
It was noted that Sample 08 behaved differently from the other samples. This is probably due to the combination of extreme values for the thickness of the layers (160 cm for the ballast and 10 cm for the degraded ballast) and the modulus of elasticity of these layers (16.2 MPa for the ballast and 9.8 MPa for the degraded ballast) in the respective section analyzed.

3.5. Checking Admissibility

Table 5, Table 6 and Table 7 show the results of the numerical simulations carried out to analyze the sidewalk. For the deflection of the railway sidewalk, the limits recommended by the AREMA [56] manual were considered as a comparison, according to Table 6.
The deflection of the railway sidewalk varied between 1.8 and 6.85 mm, with Sample 08 showing a vertical displacement greater than the limit established by the AREMA [56] manual. This condition indicates that, in most cases, the sidewalk shows satisfactory resistance to simulated traffic. However, Sample 08 stood out for having a lower resilience modulus model, which contributed to its greater deflection.
The lower stiffness of the material in this sample resulted in a reduced capacity to dissipate the applied stresses, leading to excessive vertical displacement under load.
In order to calculate the admissible bending stress in the rails, the resilient modulus of the rail billet was used instead of the resilient modulus of the skid since it has the lowest value and consequently provides the highest stress value. The results remained within the limits established by Brina the [59] criteria, ranging from 623.61 kgf/cm2 to 841.58 kgf/cm2, as shown in Table 7.
As for the stress values in the subgrade, the results are between 106.9 kPa and 155.9 kPa (Table 8), which are below the admissible stress estimated in Equation (2) according to Heukelom and Klomp [60]. Therefore, all the samples were considered admissible.
σ adm = 0.006 × M R 1 + 0.7 × log N
Figure 13 illustrates the distribution of vertical stresses in the subgrade for Sample 09, highlighting the critical regions under the applied load. As can be seen in the figure, the highest stresses are concentrated in the areas directly under the loading zones, which reflects the response of the subgrade to the transmission of stresses by the ballast layer.
It should be noted that the resilient modulus value for this configuration was estimated for use in Equation (2) based on the confining and deflecting stresses from the simulation results in SysTrain, which is representative of the current stress state to which the sidewalk is subjected and applied to the model equations for each sample.
The number of cycles (N) was calculated using Equation (3), while considering a train consisting of two locomotives, each with six axles and seventy-four wagons and each with four axles operating ten daily journeys over a 30-year concession period.
N = ( n l × e l + n v × e v ) × N p × N a × P p
Onde:
  • N = number of cycles of a composition during the design period;
  • n l = number of locomotives;
  • e l = number of axles per locomotive;
  • n v = number of railcars;
  • e v = number of axles per wagon;
  • N p = number of daily journeys of the composition;
  • N a = number of days in a year (365 days);
  • P p = project period in years.

4. Conclusions

This study analyzed the mechanistic behavior of a railway platform using the finite element method while considering the variation in the thickness of the ballast and sub-ballast layers. SysTrain software was used for the numerical modeling, with the aim of validating it as an intuitive and reliable numerical modeling tool. The main conclusions reached in this article are as follows:
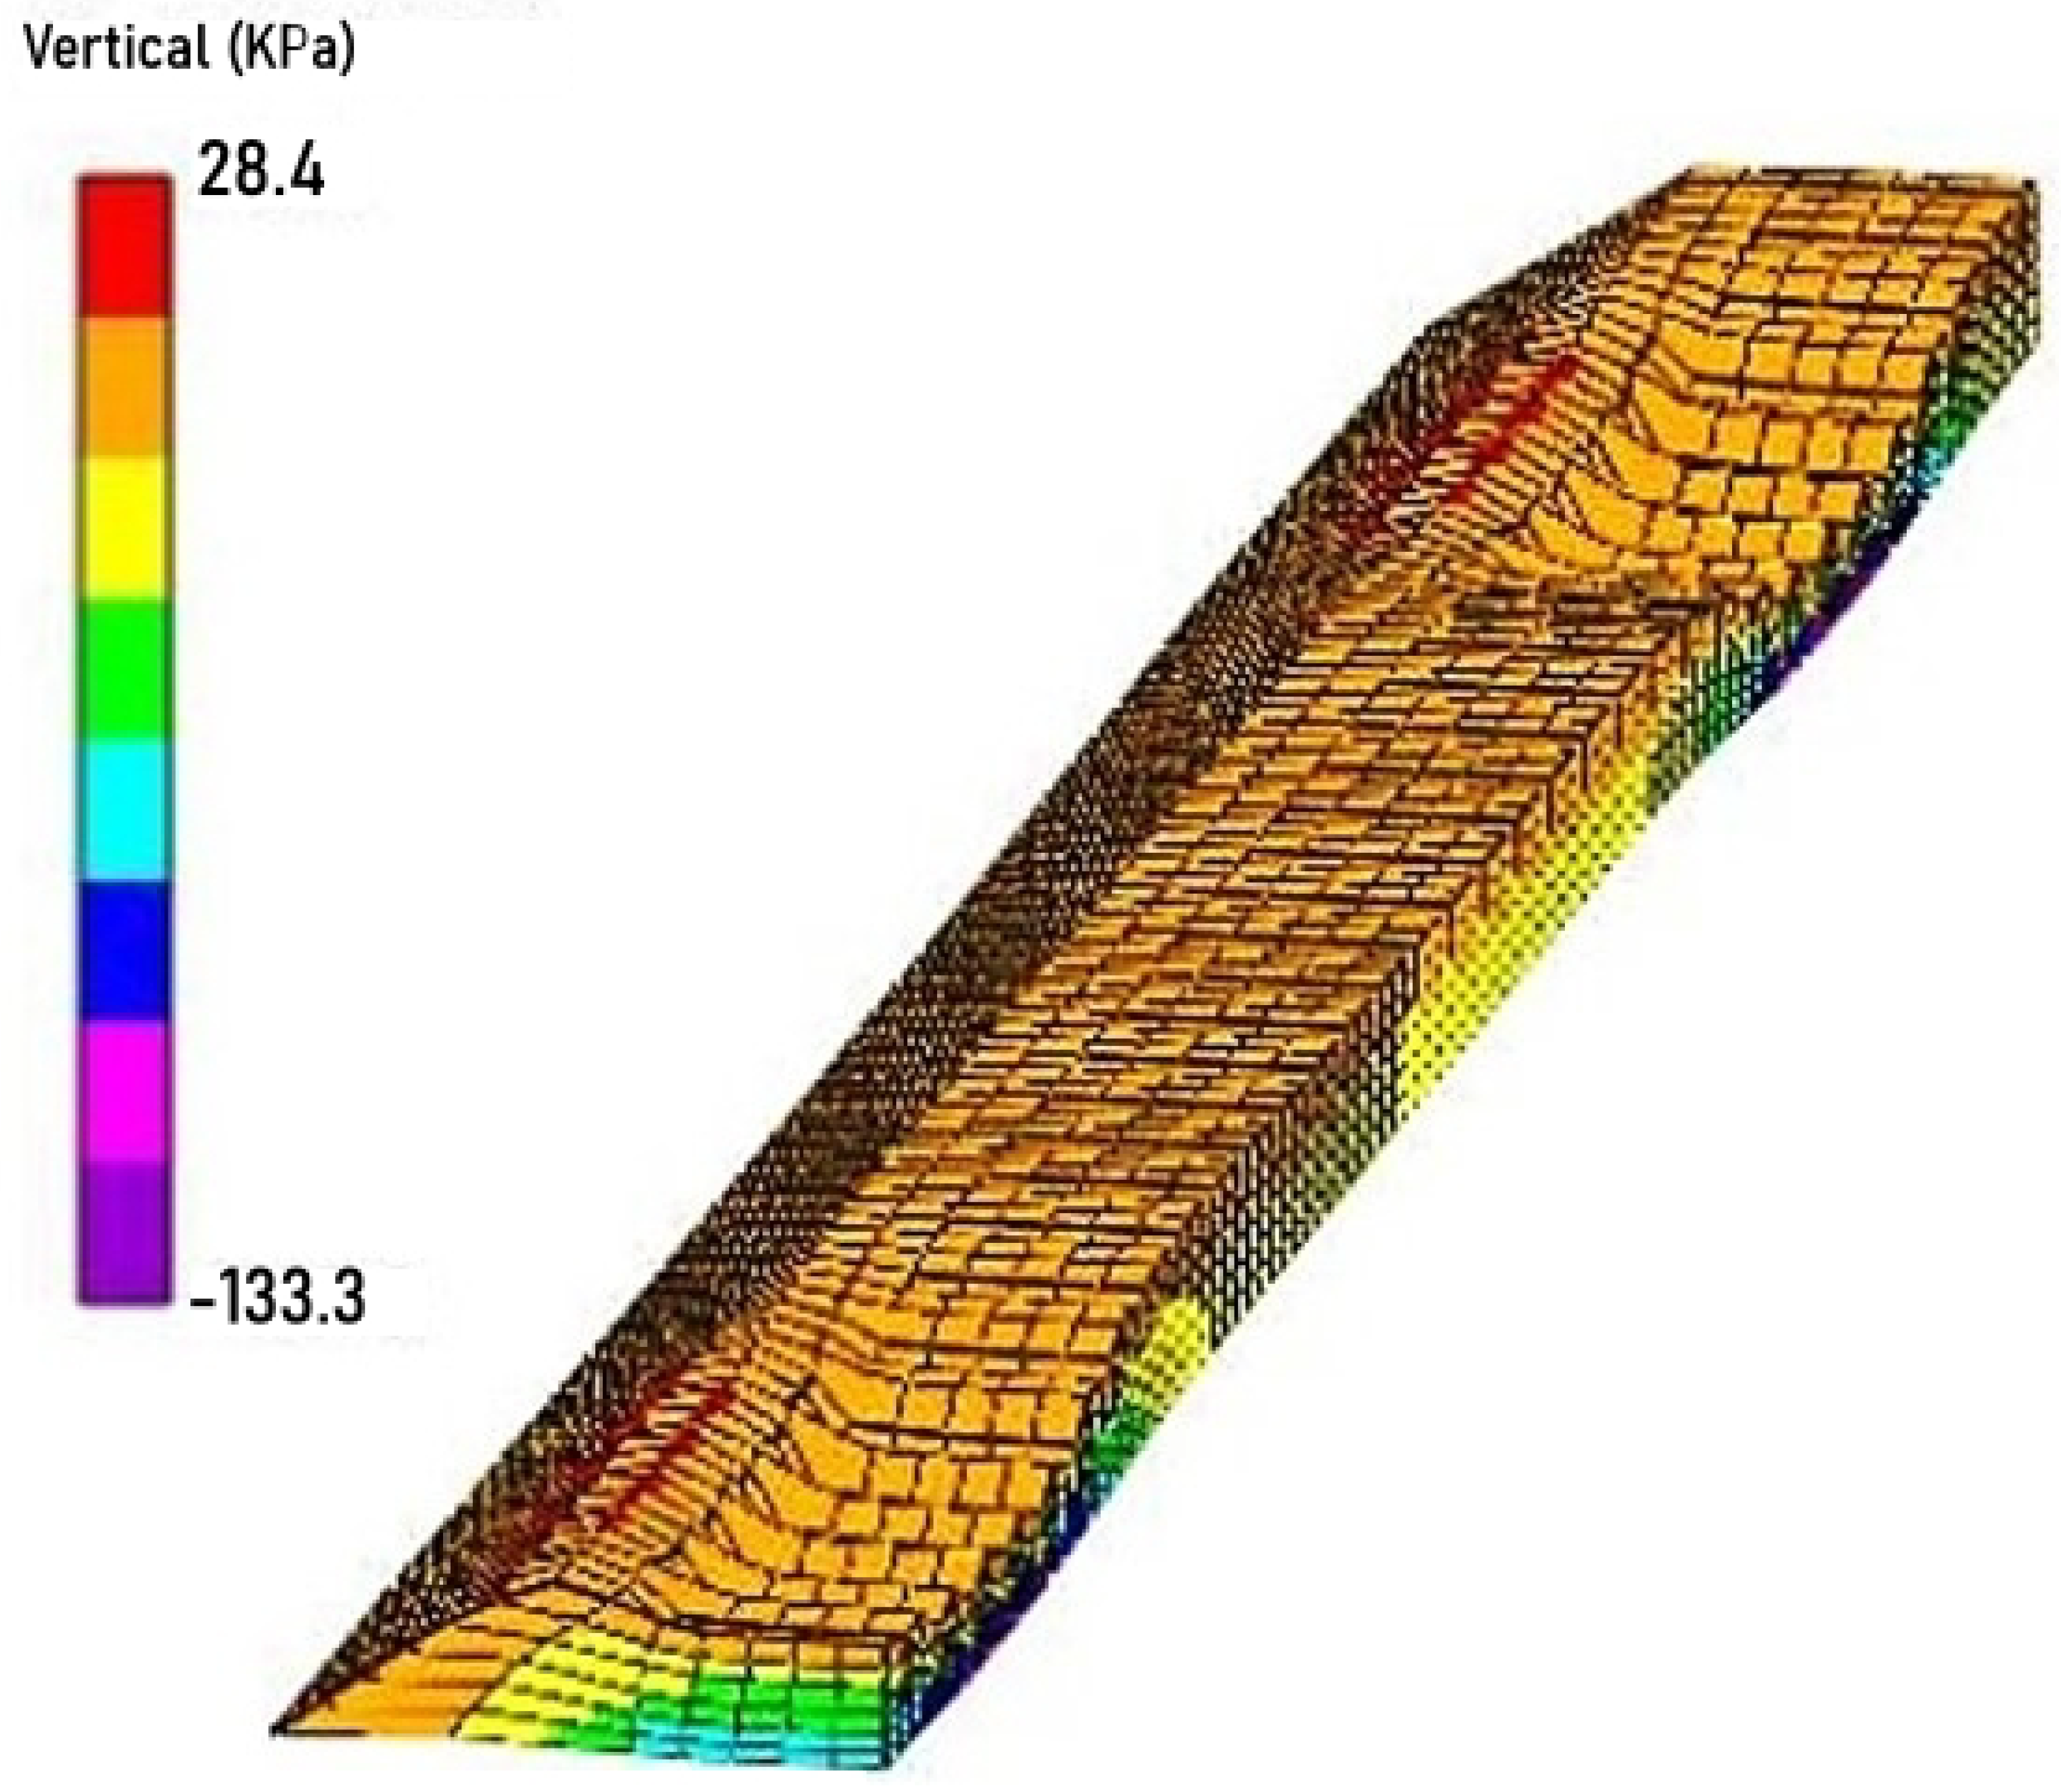
  • From the results of the 10 simulations of current track conditions, it was found that even in the most critical situations, all samples proved to be admissible in terms of rail bending stress and total vertical stress in the subgrade.
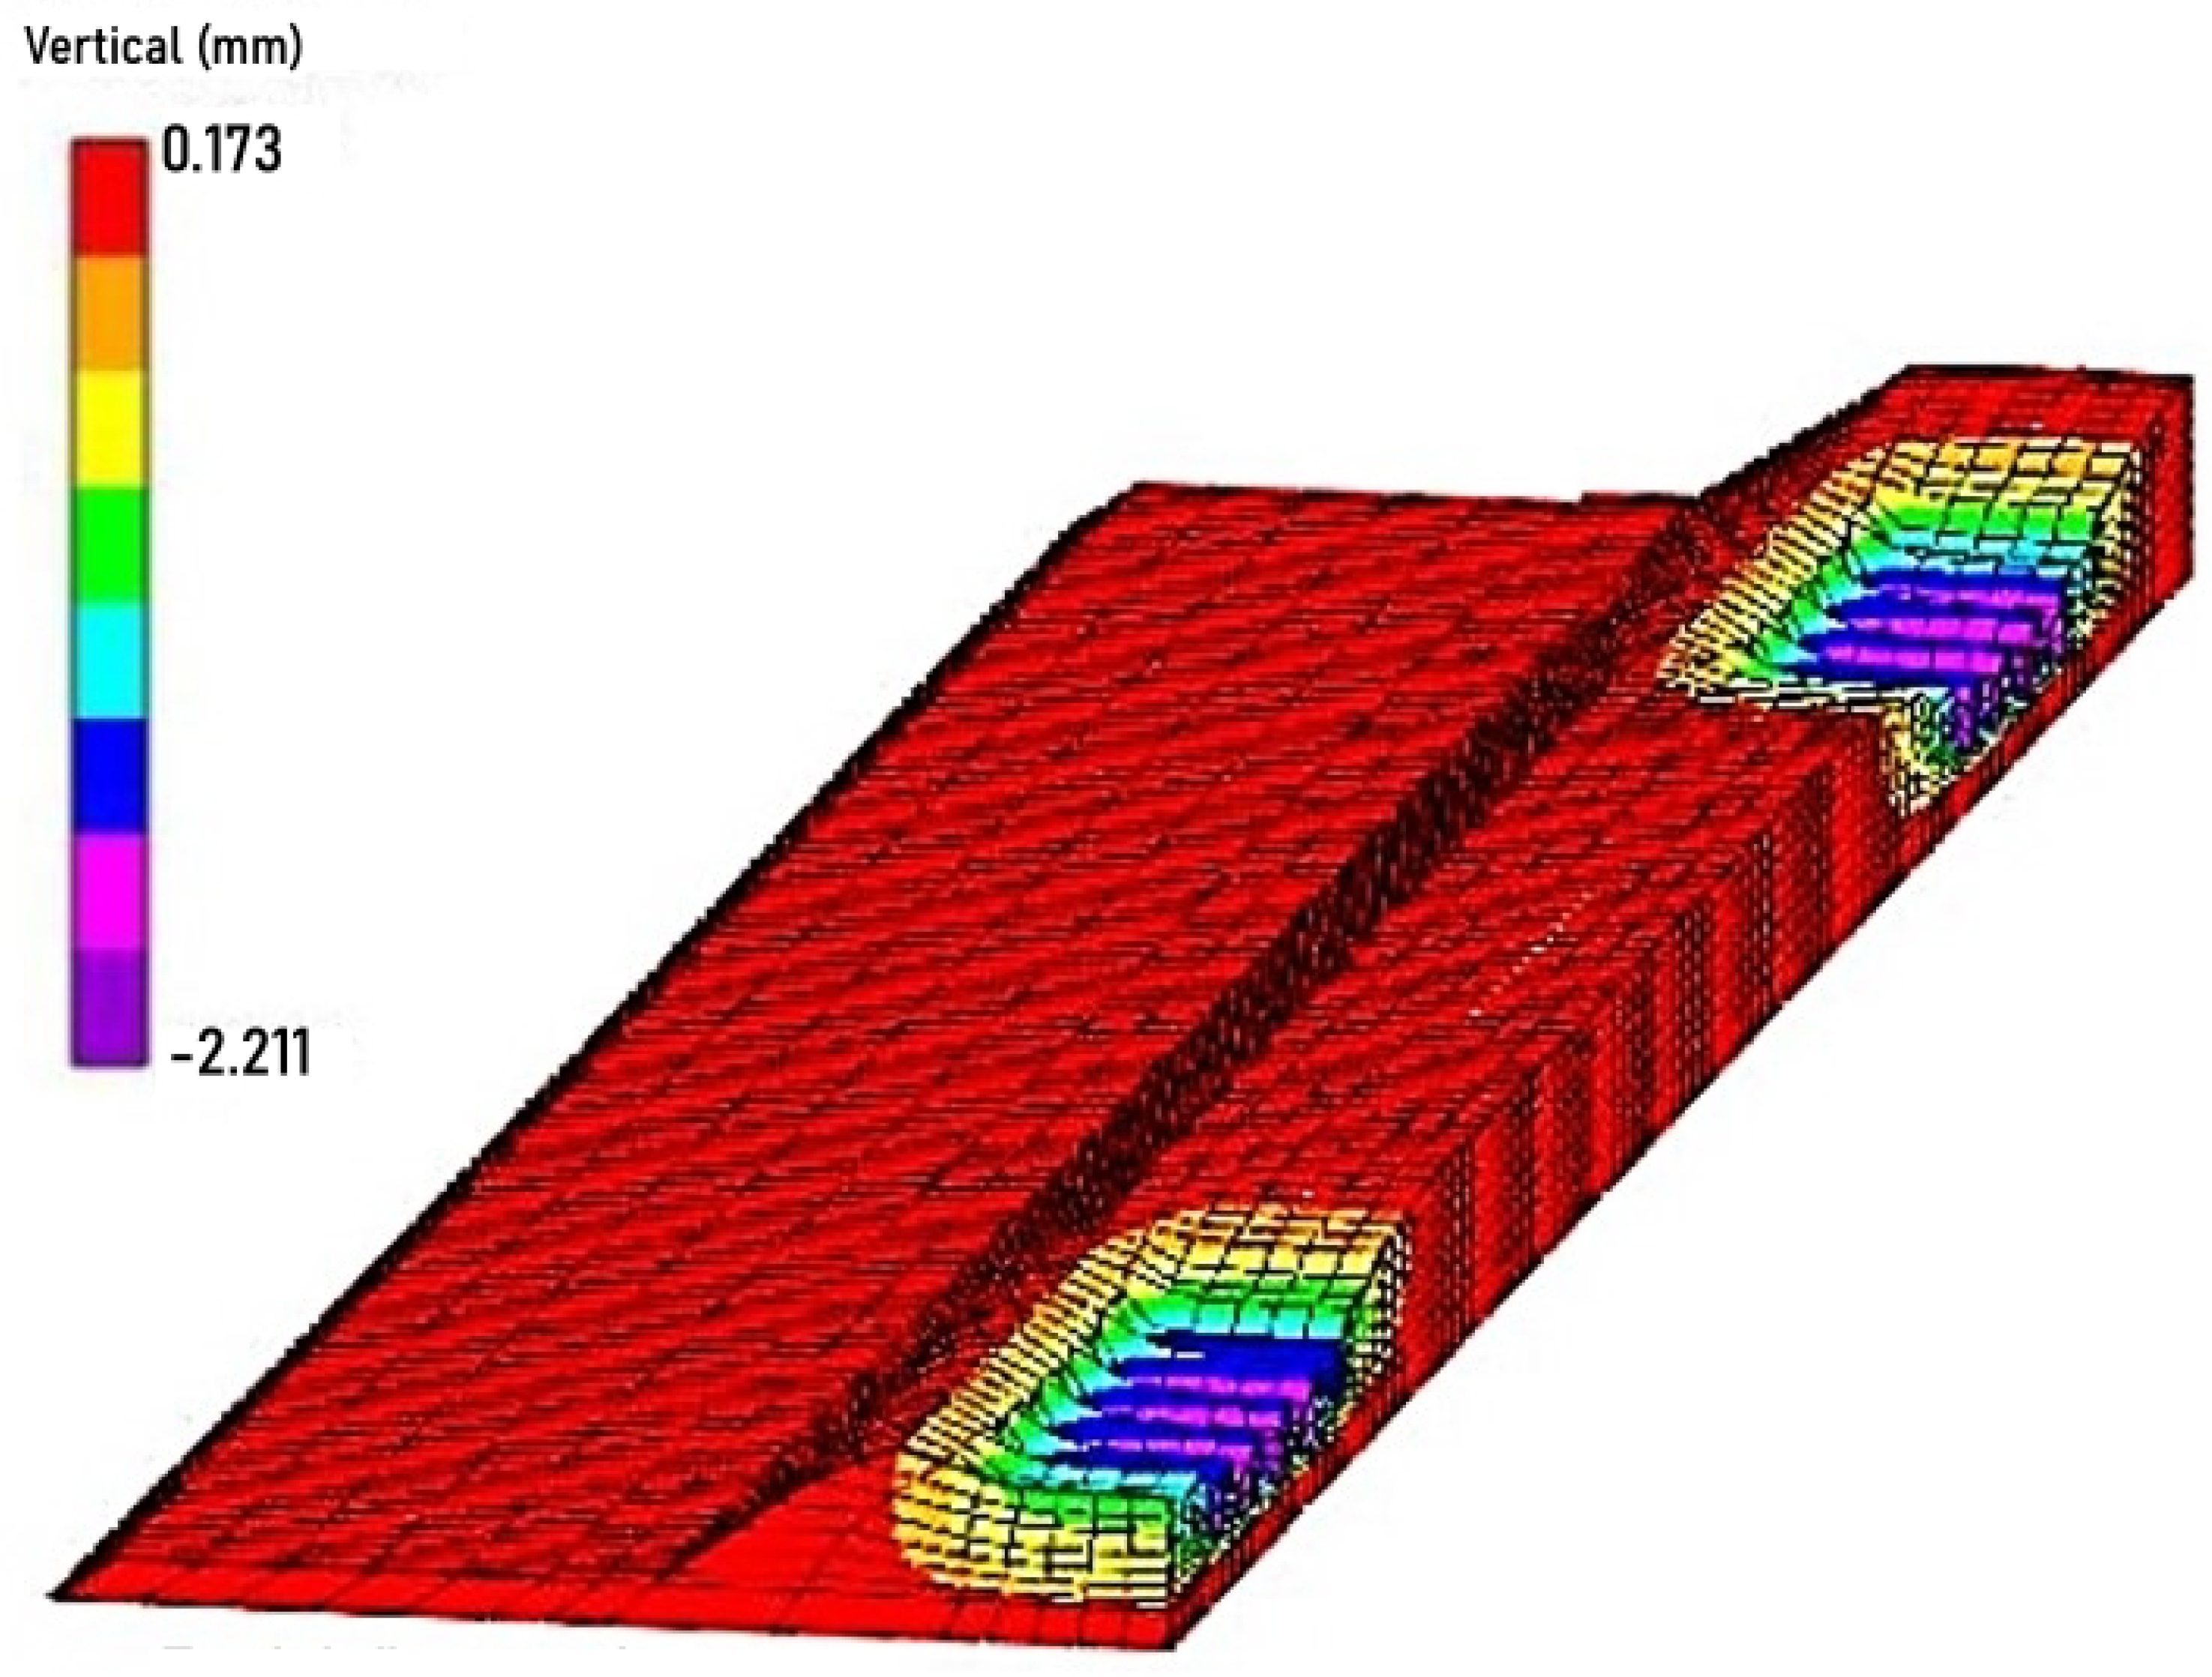
  • Sample 08 showed a total deflection above the admissible value (6.85 mm), which can be explained by its high ballast thickness (approximately 160 cm) resulting from indiscriminate tamping over time.
  • Although most samples met the design criteria, Sample 08 indicates that the structural conditions of this specific track section may not be technically satisfactory, reinforcing the importance of monitoring ballast thickness and implementing a maintenance plan when necessary.
  • The analysis of layer thickness influence generally showed that both the maximum bending moment in the rails and the total deflection of the structure were directly proportional to the ballast and sub-ballast thickness. This behavior can be attributed to the increased stress in the underlying layers due to the higher self-weight of the thicker layers.
Based on the results and the analysis of the graphs, it is recommended that the ideal thicknesses of the railway pavement layers be the minimum values that meet all design criteria. The conventional thickness values of 30 cm for the ballast and 25 cm for the sub-ballast have proven to be good technical and construction references. It is also crucial to implement a regular maintenance plan to monitor the ballast thickness, especially in critical sections such as Sample 08. Additionally, the use of computational tools like SysTrain can provide valuable technical support for understanding the impact of design parameters on track performance and maintenance needs.
These findings contribute to a more comprehensive understanding of the relationship between layer thickness and railway platform performance. This reinforces the importance of computational tools as complementary resources for decision-making in railway engineering.

Author Contributions

Conceptualization, M.A.d.O.T., W.W.d.S., L.M.C. and L.H.d.S.S.; methodology, M.A.d.O.T., W.W.d.S., L.M.C. and L.H.d.S.S.; software, M.A.d.O.T.; validation, M.A.d.O.T., W.W.d.S. and L.M.C.; formal analysis, W.W.d.S., L.M.C. and L.H.d.S.S.; investigation, M.A.d.O.T., W.W.d.S. and L.M.C.; resources, W.W.d.S.; data curation, M.A.d.O.T. and W.W.d.S.; writing—original draft preparation, M.A.d.O.T.; writing—review and editing, W.W.d.S., L.M.C. and L.H.d.S.S.; visualization, M.A.d.O.T., W.W.d.S., L.M.C., F.G.d.Á., S.N.M. and A.C.R.G.; supervision, F.G.d.Á., S.N.M. and A.C.R.G.; project administration, A.C.R.G. All authors have read and agreed to the published version of the manuscript.

Funding

This study was financed in part by the Coordenação de Aperfeiçoamento de Pessoal de Nível Superior-Brasil (CAPES)—Finance Code 001.

Data Availability Statement

The data presented in this study are available on request from the corresponding author.

Conflicts of Interest

The authors declare no conflicts of interest.

References

  1. Zhang, T.W.; Cui, Y.J.; Lamas-Lopez, F.; Calon, N.; D’Aguiar, S.C. Modelling stress distribution in substructure of French conventional railway tracks. Constr. Build. Mater. 2020, 116, 326–334. [Google Scholar] [CrossRef]
  2. Nielsen, J.C.O.; Li, X. Railway track geometry degradation due to differential settlement of ballast/subgrade—Numerical prediction by an iterative procedure. J. Sound Vib. 2018, 412, 441–456. [Google Scholar] [CrossRef]
  3. Xu, L.; Zhao, Y.; Li, Z.; Shi, C.; Yu, Z. Three-dimensional vehicle-ballasted track-subgrade interaction: Model construction and numerical analysis. Appl. Math. Model. 2020, 86, 424–445. [Google Scholar] [CrossRef]
  4. Jing, G.; Wang, J.; Wang, H.; Siahkouhi, M. Numerical investigation of the behavior of stone ballast mixed by steel slag in ballasted railway track. Constr. Build. Mater. 2020, 262, 120015. [Google Scholar] [CrossRef]
  5. Varandas, J.N.; Paixão, A.; Fortunato, E.; Hölscher, P. A Numerical Study on the Stress Changes in the Ballast Due to Train Passages. Procedia Eng. 2016, 143, 1169–1176. [Google Scholar] [CrossRef]
  6. Jayasuriya, C.; Indraratna, B.; Ngo, T.N. Experimental study to examine the role of under sleeper pads for improved performance of ballast under cyclic loading. Transp. Geotech. 2019, 19, 61–73. [Google Scholar] [CrossRef]
  7. Ferdous, W.; Manalo, A.; Erp, G.V.; Aravinthan, T.; Ghabraie, K. Evaluation of an innovative composite railway sleeper for a narrow-gauge track under static load. J. Compos. Constr. 2018, 22, 04017050. [Google Scholar] [CrossRef]
  8. Gomes, B.; Guimarães, A.C.R.; do Nascimento, F.A.C.; Tanabe, J. Ballast with siderurgic aggregates: Variation analysis of the shape parameters of particles submitted to triaxial tests through 3D scanner. Soils Rocks 2023, 46, 3. [Google Scholar] [CrossRef]
  9. Andrade, G.; Dieguez, C.A.; Lima, B.T.; Guimarães, A.C.R. Evaluation of limestone aggregates for railway ballast: Particle characteristics and shear strength analysis. Soils Rocks 2024, 47, e2024011223. [Google Scholar] [CrossRef]
  10. Guimarães, A.C.R.; Filho, J.C.S.; Castro, C.D. Contribution to the use of alternative material in heavy haul railway sub-ballast layer. Transp. Geotech. 2021, 30, 100524. [Google Scholar] [CrossRef]
  11. Roshan, M.J.; A Rashid, A.S.; Abdul Wahab, N.; Tamassoki, S.; Jusoh, S.N.; Hezmi, M.A.; Nik Daud, N.N.; Mohd Apandi, N.; Azmi, M. Improved methods to prevent railway embankment failure and subgrade degradation: A review. Transp. Geotech. 2022, 37, 100834. [Google Scholar] [CrossRef]
  12. Scharmm, G. Technique and Economics in Permanent Way; Emma: Porto Alegre, Brazil, 1977. [Google Scholar]
  13. Rangel, G.W.A. A Method for Estimating Railway Pavement Deflection: Based on Numerical Simulations Using the Finite Element Method (FEM); New Academic Issues: Rio de Janeiro, Brazil, 2018. [Google Scholar]
  14. Queiroz, R.C. Experimental Study of Stresses and Strains in Railway Infrastructure and Superstructure Layers. Ph.D. Thesis, University of São Paulo, São Carlos, Brazil, 1990. [Google Scholar]
  15. Filho, J.C.S. Numerical Analysis of the Mechanical Behavior of a Railway Track for Different Types of Rail Vehicles. Master’s Thesis, NUGEO/UFOP, Ouro Preto, Brazil, 2013. [Google Scholar]
  16. Stopatto, S. Railway Permanent Way: Concepts and Applications; T.A.: São Paulo, Brazil, 1987. [Google Scholar]
  17. Indraratna, B.; Salim, W.; Rujikiatkamjorn, C. Advanced Rail Geotechnology—Ballasted Track, 1st ed.; CRC Press: London, UK, 2011. [Google Scholar] [CrossRef]
  18. Ji, R.; Nantung, T.; Siddiki, N.; Liao, T.; Kim, D. Field and laboratory determination of subgrade resilient modulus and its application in pavement design. J. Test. Eval. 2015, 43, 1109–1119. [Google Scholar] [CrossRef]
  19. Ng, K.; Henrichs, Z.; Ksaibati, K.; Wulff, S. Resilient modulus of subgrade materials for mechanistic-empirical pavement design guide. Road Mater. Pavement Des. 2018, 19, 1523–1545. [Google Scholar] [CrossRef]
  20. De Lima, C.; Da Motta, L.; Aragao, F.; Guimaraes, A. Mechanical characterization of fine-grained lateritic soils for mechanistic-empirical flexible pavement design. J. Test. Eval. 2019, 48, 1–17. [Google Scholar] [CrossRef]
  21. Kuttah, D. Determining the resilient modulus of sandy subgrade using cyclic light weight deflectometer test. Transp. Geotech. 2021, 27, 100482. [Google Scholar] [CrossRef]
  22. Nazzal, M.D.; Mohammad, L.N. Estimation of resilient modulus of subgrade soils using falling weight deflectometer. Transp. Res. Rec. 2010, 2186, 1–10. [Google Scholar] [CrossRef]
  23. Medina, J.; Motta, L. Mecânica dos Pavimentos, 3rd ed.; Editora Interciência: Rio de Janeiro, Brazil, 2015; p. 572. [Google Scholar]
  24. Sadrossadat, E.; Heidaripanah, A.; Osouli, S. Prediction of the resilient modulus of flexible pavement subgrade soils using adaptive neuro-fuzzy inference systems. Constr. Build. Mater. 2016, 123, 235–247. [Google Scholar] [CrossRef]
  25. Mazari, M.; Nazarian, S. Mechanistic approach for construction quality management of compacted geomaterials. Transp. Geotech. 2017, 13, 92–102. [Google Scholar] [CrossRef]
  26. Kavussi, A.; Qorbaninik, M.; Hassani, A. The influence of moisture content and compaction level on LWD modulus of unbound granular base layers. Transp. Geotech. 2019, 20, 100252. [Google Scholar] [CrossRef]
  27. Allah, S.; Tanyu, B.F.; Dawson, A. Reclaimed Asphalt Pavement (RAP) as an Unbound Base Course Material: A Mechanistic Design Approach Based on Multi-stage Repeated Load Triaxial Tests. Transp. Geotech. 2022, 33, 100729. [Google Scholar] [CrossRef]
  28. Almeida, B.D.; Coelho, L.M.; Guimarães, A.C.R.; Monteiro, S.N. Effect of Sand Addition on Laterite Soil Stabilization. Materials 2024, 17, 6033. [Google Scholar] [CrossRef] [PubMed]
  29. Spada, J.L.G. A Pavement Mechanics Approach Applied to Understanding the Stress-Strain Behavior Mechanism of the Railway Track. Ph.D. Thesis, Federal University of Rio de Janeiro, Rio de Janeiro, Brazil, 2003. [Google Scholar]
  30. Prakoso, P.B. The basic concepts of modelling railway track systems using conventional and finite element methods. Info-Teknik 2012, 13, 57–65. [Google Scholar]
  31. El-kady, M.S.; Azam, A.; Yosri, A.M.; Nabil, M. Modelling of railway embankment stabilized with geotextile, geo-foam, and waste aggregates. Case Stud. Constr. Mater. 2023, 18, e01800. [Google Scholar] [CrossRef]
  32. Filho, J.C.S.; Guimarães, A.C.; Nascimento, G.D.C. A Comparative Study Using Traditional Method and Computational Platform for Stress Propagation Analysis in Railway Pavement. In Proceedings of the 45th Annual Pavement Meeting-RAPv, Brasília, DF, Brazil, 20 September 2016. [Google Scholar]
  33. Ribeiro, F.S. Contribution to the Analysis of the Life Cycle Cost of a Railway Pavement Management System. Ph.D. Thesis, Polytechnic School, University of São Paulo, São Paulo, Brazil, 2017. [Google Scholar]
  34. Ribeiro, F.; Nascimento, F.; Silva, M. Environmental performance analysis of railway infrastructure using life cycle assessment: Selecting pavement projects based on global warming potential impacts. J. Clean. Prod. 2022, 365, 132558. [Google Scholar] [CrossRef]
  35. Filho, J.C.S. Contribution to the Development of a Mechanistic-Empirical Design Method for Railway Pavements with a Focus on Tropical Soils. Ph.D. Thesis, Military Institute of Engineering, Rio de Janeiro, Brazil, 2018. [Google Scholar]
  36. Cruz, L.O.S.R. Procedure for Evaluation of the Structural Integrity of the Railway Platform. Master’s Thesis, Military Institute of Engineering, Rio de Janeiro, Brazil, 2019. [Google Scholar]
  37. Delgado, B.; Fonseca, A.; Fortunato, E.; Paixão, A.; Alves, R. Geomechanical assessment of an inert steel slag aggregate as an alternative ballast material for heavy haul rail tracks. Constr. Build. Mater. 2021, 279, 122438. [Google Scholar] [CrossRef]
  38. dos Santos, W.W.; Coelho, L.M.; Monteiro, S.N.; Marques, M.E.S.; Guimarães, A.C.R. Evaluation of Steel Slag as a Sustainable Alternative Aggregate for Railway Ballast: A Shakedown Theory-Based Approach. Buildings 2024, 14, 3546. [Google Scholar] [CrossRef]
  39. Fonte, M.S.; Donato, M.; Gouveia, B.G.; Santana, C.S.A.; Silva, M.A.V.d. Analysis of the influence of tropical soil classification methods on railway subgrades according to repeated load triaxial (RLT) and light weight deflectometer (LWD) tests. Case Stud. Constr. Mater. 2022, 17, e01301. [Google Scholar] [CrossRef]
  40. Silva Filho, J.; Skwarok, A.; Witiuk, R. Study of the track dynamics for optimizing the railway superstructure. In Advances in Transportation Geotechnics IV; Lecture Notes in Civil Engineering; Tutumluer, E., Nazarian, S., Al-Qadi, I., Qamhia, I., Eds.; Springer: Cham, Switzerland, 2022; Volume 165. [Google Scholar] [CrossRef]
  41. ABNT—Brazilian Association of Technical Standards. NBR 6459: Solo—Determinação do Limite de Liquidez; ABNT: Rio de Janeiro, Brazil, 2016. [Google Scholar]
  42. ABNT—Brazilian Association of Technical Standards. NBR 7180: Soil—Determination of Plasticity Limit; ABNT: Rio de Janeiro, Brazil, 1984. [Google Scholar]
  43. ABNT—Brazilian Association of Technical Standards. NBR 7181: Soil—Granulometric Analysis; ABNT: Rio de Janeiro, Brazil, 1984. [Google Scholar]
  44. DNIT—National Department of Transport Infrastructure. DNIT 259—CLA: Soil—Classification of Fine Tropical Soils for Road Purposes Using Compact Samples in Miniature Equipment—Classification; National Department of Transport Infrastructure (DNIT): Brasilia, Brazil, 2023. [Google Scholar]
  45. DNIT—National Department of Transport Infrastructure. DNIT-134-ME. Pavement—Soils—Determination of Resilient Modulus—Test Method; National Department of Transport Infrastructure: Brasília, Brazil, 2018. [Google Scholar]
  46. ABNT—Brazilian Association of Technical Standards. NBR 17091: Soils—Dynamic Cone Penetration Test; ABNT: Rio de Janeiro, Brazil, 2023. [Google Scholar]
  47. ASTM E2583: Standard Test Method for Measuring Deflections with a Light Weight Deflectometer (LWD); ASTM: West Conshohocken, PA, USA, 2015.
  48. Pezo, R.F. A General Method of Reporting Resilient Modulus Tests of Soils: A Pavement Engineer’s Point of View. In Proceedings of the 72nd Annual Meeting of the Transportation Research Board (TRB), Washington, DC, USA, 12–14 January 1993. No. 93082. [Google Scholar]
  49. Macêdo, J.A.G. Interpretation of Geotechnical Tests for Structural Evaluation of Flexible Pavements. Ph.D. Thesis, Federal University of Rio de Janeiro, Rio de Janeiro, Brazil, 1996; 456p. [Google Scholar]
  50. Nogami, J.S.; Villibor, D.F. Low-Cost Paving with Lateritic Soils; Editora Villibor: São Paulo, Brazil, 1995. [Google Scholar]
  51. de Paiva, C.E.; Buck, A.P.; Ferreira, A. Sub-ballast performance in Brazilian railway infrastructures. Constr. Build. Mater. 2018, 190, 164–169. [Google Scholar] [CrossRef]
  52. São Paulo Metropolitan Railway Company. Material Specification for Sub-Ballast Supply for Permanent Way; Technical Report; São Paulo Metropolitan Railway Company: São Paulo, Brazil, 1979. [Google Scholar]
  53. Real, J.; Gómez, L.; Montalbán, L.; Real, T. Study of the influence of geometrical and mechanical parameters on ballasted railway tracks design. J. Mech. Sci. Technol. 2012, 26, 2837–2844. [Google Scholar] [CrossRef]
  54. Gomes, M.B.B.; Santos, J.T.A.d.; Almeida, B.D.; Serra, G.A.; Guimarães, A.C.R. Parametric Analysis of Ballast Thickness for Elastoplastic Deformations in Railway Pavement. In Proceedings of the 25th National Road Conservation Meeting (ENACOR) and 48th Annual Pavement Meeting (RAPv), Foz do Iguaçu, Brazil, 19 September 2023; Available online: https://enacorrapv.com.br/anais/2023/TT917.pdf (accessed on 3 March 2025).
  55. Zhuang, Y.; Wang, K. Three-dimensional shakedown analysis of ballasted railway structures under moving surface loads with different load distributions. Soil Dyn. Earthq. Eng. 2017, 100, 296–300. [Google Scholar] [CrossRef]
  56. AREMA—American Railway Engineering and Maintenance-of-Way Association. Manual for Railway Engineering; AREMA: Lanham, MD, USA, 2020. [Google Scholar]
  57. Hay, W.W. Railroad Engineering, 1st ed.; John Wiley and Sons: Hoboken, NJ, USA, 1991. [Google Scholar]
  58. Werkmeister, S.; Dawson, A.R.; Wellner, F. Permanent Deformation Behavior of Granular Materials and the Shakedown Concept. Transp. Res. Rec. 2001, 1757, 75–81. [Google Scholar] [CrossRef]
  59. Brina, H.L. Railways, 1st ed.; Technical and Scientific Books: Rio de Janeiro, Brazil, 1988; Volume 2. [Google Scholar]
  60. Heukelom, W.; Klomp, A. Dynamic Testing as a Means of Controlling Pavement during and after Construction. In Proceedings of the 1st International Conference on the Structural Design of Asphalt Pavement, Ann Arbor, MI, USA, 20–24 August 1962; pp. 667–685. [Google Scholar]
Figure 1. Systrain structure (adapted from [35]).
Constrmater 05 00013 g001
Figure 2. Example of data input in SysTrain, illustrating the customized structure of the track, the finite element mesh, and the specified loads for the analysis.
Constrmater 05 00013 g002
Figure 3. Location of the Centro-Sudeste Paulista Corridor.
Constrmater 05 00013 g003
Figure 4. Load distribution and demonstration of the Hopper-Type Wagon Axles.
Constrmater 05 00013 g004
Figure 5. Particle size distribution curve of the subgrade of the studied samples.
Constrmater 05 00013 g005
Figure 6. MCT classification of the 10 samples.
Constrmater 05 00013 g006
Figure 7. Maximum bending moment in the rails as a function of ballast thickness.
Constrmater 05 00013 g007
Figure 8. Total deflection of the structure as a function of ballast thickness.
Constrmater 05 00013 g008
Figure 9. Total tension in the ballast layer (09).
Constrmater 05 00013 g009
Figure 10. Total deflection of the overall structure (09).
Constrmater 05 00013 g010
Figure 11. Maximum bending moment in the rails as a function of the thickness of the degraded ballast.
Constrmater 05 00013 g011
Figure 12. Total deflection of the structure as a function of the thickness of the degraded ballast.
Constrmater 05 00013 g012
Figure 13. Total stress in the subgrade layer (09).
Constrmater 05 00013 g013
Table 1. Geometric input data.
INPUT DATASAMPLE
07 08 04 09 02 10 03 01 05 06
GEOMETRY
Rail
Gauge of 1.00 m/Samples 07, 08, 09: Section TR-68; Others: TR-57
Sleeper
Spacing (cm)60606060606060606060
Length (m)1.751.752.001.752.002.002.002.002.002.00
Height (cm)19191619161616161616
Lower Width (cm)20202220222222222222
Upper Width (cm)16162216222222222222
Ballast
Height (cm)501606040150.11015510
For all samples: Shoulder of 40 cm; Slope (H/V): 1.5; Bottom slope: 3%; Covering: Yes.
Degraded Ballast
Height (cm)10102010457050602550
For all samples: Shoulder of 50 cm; Slope (H/V): 1.2; Bottom slope: 1%
Subgrade
For all samples: Height of 20 cm; shoulder: 2 m, slope (H/V): 1.5, bottom: 1%.
Table 2. Properties of rail and sleeper materials for analyzed samples.
INPUT DATASAMPLE
07 08 04 09 02 10 03 01 05 06
Rail
For all samples: name: steel; type: linear isotropic; γ : 7850 kg/m3; E: 210 GPa; ν : 0.3.
Sleeper
NameConcreteConcreteWoodConcreteWoodWoodWoodWoodWoodWood
TypeLinear Isotropic
γ (kg/m3)2400240010402400104010401040104010401040
E (GPa)323216.5833216.58316.58316.58316.58316.58316.583
ν 0.30.30.230.30.230.230.230.230.230.23
Table 3. Properties of ballast and subgrade materials.
INPUT DATASAMPLE
07 08 04 09 02 10 03 01 05 06
Ballast
TypeLinear Elastic Resilient
γ (kg/m3)2000
E (MPa)3716.238.626.229.625.737.231.318.1546.23
ν 0.3
k 1 3716.238.626.229.625.737.231.318.1546.23
Degraded Ballast
TypeLinear Elastic Resilient
γ (kg/m3)1900
E (MPa)37.69.833.318.426.922.739.242.444.0622.43
ν 0.3
k 1 37.69.833.318.426.922.739.242.444.0622.43
Subgrade
TypeComposite Resilient
[ γ (kg/m3)]1900
ν 0.3
[ σ d e σ 3 min (MPa)]0.0207
[ σ d max (MPa)]0.412
[ σ 3 max (MPa)]0.137
k 1 490.07132.07922.16426.87970.67399.86740.581045.81468.25833.64
k 2 0.280.320.480.360.360.240.120.560.520.12
k 3 −0.36−0.68−0.360.36−0.36−0.36−0.28−0.2−0.48−0.32
Table 4. Soil Classification—Subgrade.
Amostra ρ lab
(g/cm3)
ρ n
(g/cm3)
Wn
(%)
Wo
(%)
LL
(%)
LP
(%)
IP
(%)
Class.
TRB
Class.
SUCS
Class.
MCT
012.708--8.50--NPA-4MLLA’
022.628-8.106.25--NPA-4SMLA
032.6261.32810.5010.821.814.47.4A-4CLLG’
042.681-12.307.50--NPA-4MLLA’
052.6251.8757.504.75--NPA-4SMNA
062.6331.7805.803.92--NPA-4SMNA’
072.946-4.7011.0--NPA-2-4SMNA’
082.4201.9735.803.74--NPA-2-4SMNA’
092.6531.9266.903.88--NPA-2-4SMNA
102.7451.7946.973.00--NPA-2-4SMNA
Table 5. Comparison of maximum deflections for different ballast thicknesses.
Ballast
Thickness
(cm)
Sample
07
Sample
08
Sample
04
Sample
09
Sample
02
Sample
10
Sample
03
Sample
01
Sample
05
Sample
06
0.1158.1144.2135.2149.3112.8112.7121.1124.8160.3100.6
15117.8109.1115.3111.9102.294.6107.2105.6110.999.3
30109.0106107.5108.397.991.399.1100.498.498.1
45113.9111.9105.2114.193.490.4101.098.496.898
60113.7111.8102114.193.088.498.596.592.996.5
75118115.9100.6118.593.093.0100.597.590.595.6
90118.3118.798.4121.391.492.2100.197.993.195.2
105121.4118.797.3121.694.195.299.298.596.294.7
120121.4118.497.3121.694.195.299.299.296.294.7
135123.6120.4100.3123.597.095.0101.199.999.297.1
150123.3119.9103.5123100.598.8101.1102.8103.498.2
Table 6. Admissibility check for the total admissible deflection of the structure.
SampleTotal Displacement (mm)Permissible Displacement (AREMA)
δ adm (mm) Verification
012.146.35OK
022.226.35OK
031.766.35OK
042.186.35OK
051.526.35OK
062.296.35OK
071.806.35OK
086.856.35NOK
092.216.35OK
102.826.35OK
Verifications by AREMA: OK (Verified), NOK (Not Verified).
Table 7. Admissibility check for the admissible normal stress in the rails.
SampleWb
(cm3)
Mmáx
(kN·m)
Mmáx
(kgf·cm)
σ
(kgf/cm2)
Criteria of Brina [59]
σ adm (kPa) σ adm (kgf/cm2) Verification
01294.8022.88233,311.07791.42150,0001529.57OK
02294.8023.17236,268.25801.45150,0001529.57OK
03294.8022.10225,357.28764.44150,0001529.57OK
04294.8022.94233,922.90793.50150,0001529.57OK
05294.8021.57219,952.79746.11150,0001529.57OK
06294.8023.26237,185.99804.57150,0001529.57OK
07391.6023.91243,814.15622.61150,0001529.57OK
08391.6032.99336,404.38859.05150,0001529.57OK
09391.6025.04255,336.94652.04150,0001529.57OK
10294.8024.33248,096.95841.58150,0001529.57OK
Verifications by Brina: OK (Verified), NOK (Not Verified).
Table 8. Verification of admissibility with regard to the total admissible vertical stress in the subgrade according to the Heukelom and Klomp criterion [60].
SamplePermissible Tension (kPa)Vertical Tension (kPa)Verification
01221.27116.80OK
02727.43140.90OK
03995.46109.60OK
04537.54151.90OK
05115.85112.00OK
06756.92106.90OK
07462.15112.30OK
08543.60143.60OK
09242.95108.90OK
10471.72107.00OK
Verifications by Heukelom and Klomp: OK (Verified), NOK (Not Verified).
Disclaimer/Publisher’s Note: The statements, opinions and data contained in all publications are solely those of the individual author(s) and contributor(s) and not of MDPI and/or the editor(s). MDPI and/or the editor(s) disclaim responsibility for any injury to people or property resulting from any ideas, methods, instructions or products referred to in the content.

