3.1.1. Force Analysis on the Fiber
The coarse polypropylene fiber used in the tests is a profiled wavy fiber with crests and troughs, as shown in
Figure 7.
As can be seen in
Figure 7, the coarse polypropylene fiber had a diameter of 0.8 mm in its thin part and 1.0 mm in its thick part. The fiber provided by the manufacturer had an equivalent diameter of 0.8 mm and a tensile strength of ≥530 MPa. The tensile resistance of the coarse polypropylene fiber was calculated from the following equation:
where T is the tensile resistance of the coarse polypropylene fiber,
d is the fiber diameter.
On this basis, the tensile resistance of the coarse polypropylene fiber was calculated to be
F = 266 N. Theoretically speaking, the fiber would break when applied with a tensile force of >266 N. Depending on the forces applied by the soil on the fiber, the fiber might be pulled out or broken in pullout tests. The specific forces included occlusal friction and cohesion. Force analysis was performed on the coarse polypropylene fiber in a plain soil sample, as shown in
Figure 8.
As can be seen in
Figure 8, the force condition on the interface of the coarse polypropylene fiber is more complicated than that on the interface of the non-profiled fiber. The general linear fiber is only subject to sliding friction and cohesive force in soil. In contrast, coarse polypropylene fiber under a drawing force, due to the presence of obvious crests and troughs, is subjected to sliding friction and cohesion, but also significantly affected by occlusal friction. The fiber in soil will experience a relative slide only after the drawing force has overcome the three forces. Conversely, when the three forces applied on the fiber exceed the tensile strength of the fiber and the drawing force gradually increases to the maximum drawing force bearable by the fiber, the fiber will break. In actual tests, it was found that the coarse polypropylene fiber was pulled out from the plain soil and the low-compaction cemented Xi’an and Sanya soil but was basically broken in the cases of the high-compaction cemented soil (except Korla soil) and the fine polypropylene fiber-reinforced cemented soil. See the two typical morphologies of the coarse polypropylene fiber (pulled out and break) in the fiber pullout tests in
Figure 9.
The coarse polypropylene fiber in the pullout tests had two different morphologies, which correspond to two completely different shapes of the pullout curves (drawing force-displacement curves). See an analysis of the pullout curves below.
3.1.2. Typical Pullout Curves of the Fiber
Four random sets of pullout test data were selected from the soil samples from which the fiber could be pulled out from the XSc1, XSc2, and XSc3 sample groups. In cases where the fiber could not be pulled out from the soil samples, four random sets of pullout test data were selected from the test group of SC1c3d2. See the drawing force–displacement curves prepared using these data in
Figure 10.
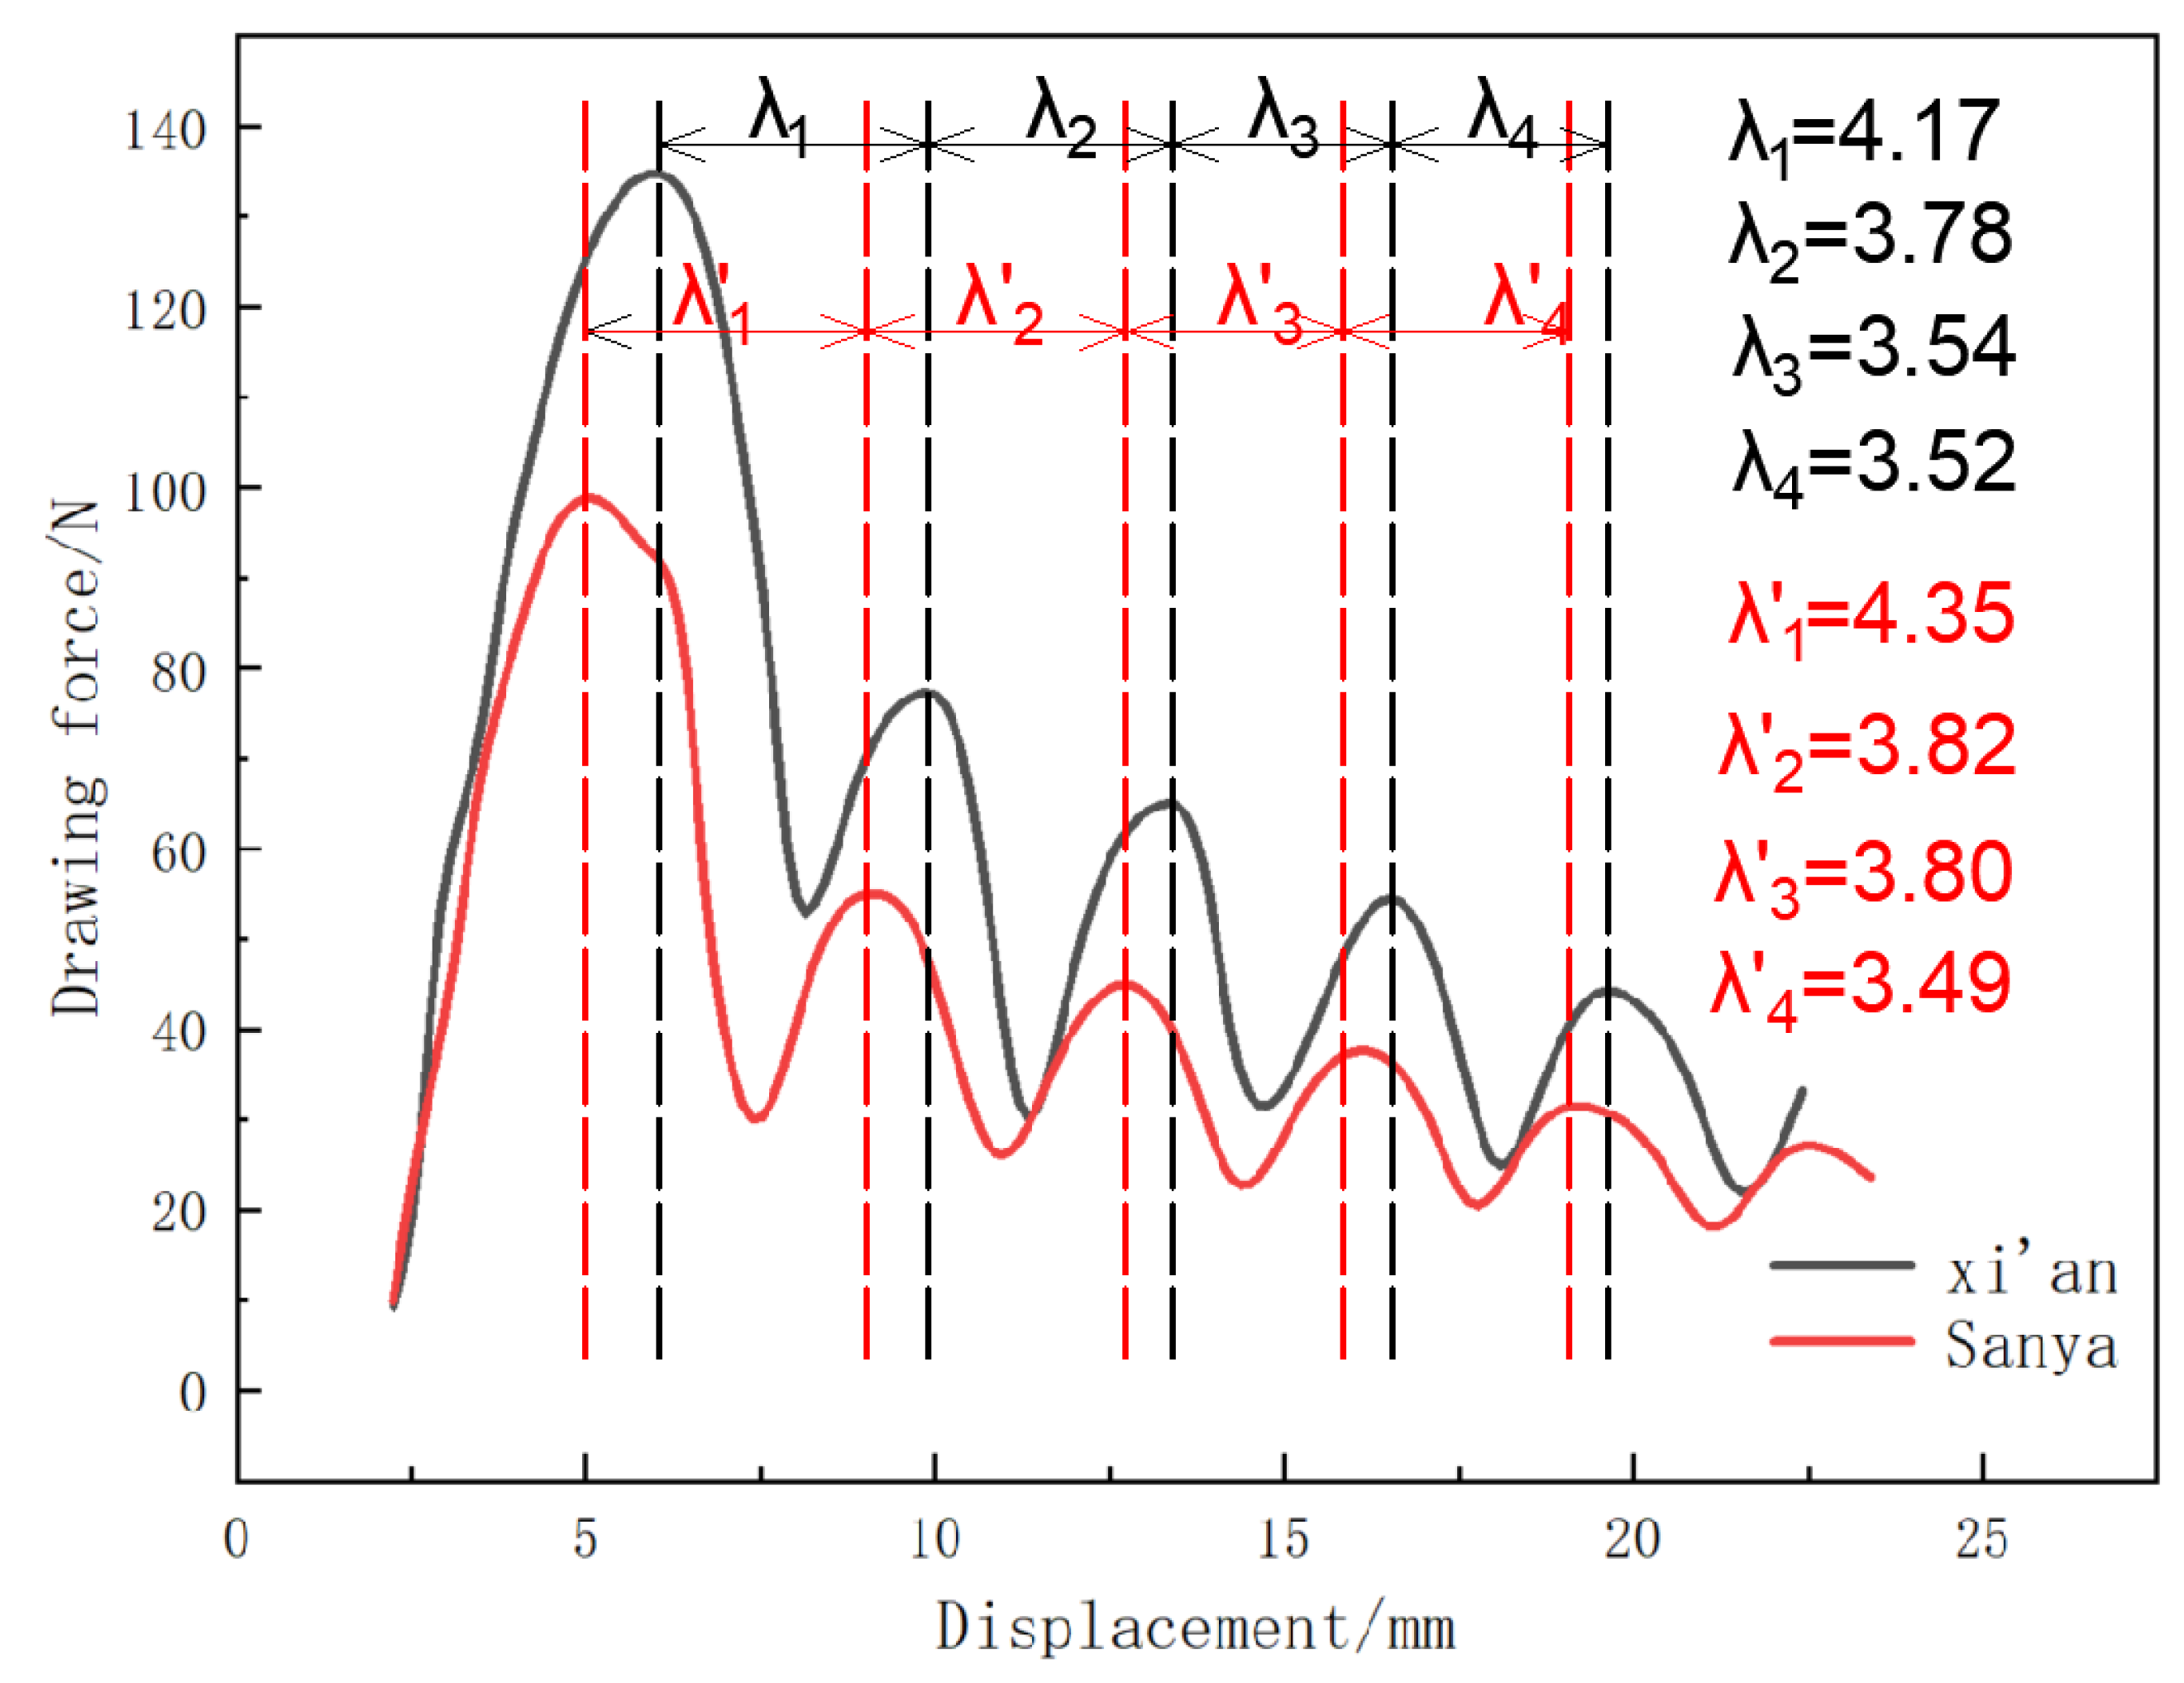
It can be seen that the drawing force–displacement curves of this group showed high similarities in the pullout process, suggesting that the method designed in the tests is scientific and practical and has high repeatability. The pullout curves of this group manifested obvious multi-peak features, which were closely related to the morphology of the coarse polypropylene fiber used (a wavy fiber). When the wavy fiber was under a drawing force, sliding friction, cohesion, and occlusal force blocked the fiber from a relative slide so the fiber and soil would remain an integral whole. When the drawing force increased and equaled the resistance of the sliding friction, cohesion, and occlusal force, the fiber would debond from the soil and experience a relative slide, producing the first crest on the pullout curve. After that, the fiber slid and was still affected by sliding friction and cohesion, accompanied by an abrupt drop in the drawing force. After sliding by one wavelength, the crest of the coarse polypropylene fiber would once again overlap with that of the soil, in which case the fiber would again be subjected to an occlusal force, resulting in another increase in the drawing force. However, due to the reduced embedded depth of the fiber at this point, the sliding friction, cohesion, and occlusal force would all decline. As a result, the second crest drawing force on the pullout curve greatly declined. Similarly, crests would reoccur on the pullout curve with the fiber being further pulled out, and the crest drawing forces would decrease continuously.
By extracting three wavelengths (
,
, and
) f from four random pullout curves of the sample groups of XSc1, XSc2, and XSc3, we can show their variations, as illustrated in
Figure 11a. Their values are generally in the range of 3.9 to 4.1 mm. The wavelengths of the coarse polypropylene fiber were about 4.0 mm. The essential consistency between the two results further indicates that the multi-peak features of the pullout curves are closely related to the morphology of the coarse polypropylene fiber itself. The results also suggest that the interactive features of the reinforcement–soil interface can be adjusted by modifying the feature parameters of the reinforcing fibers themselves (such as wavelength and diameter). This finding is valuable to engineering applications.
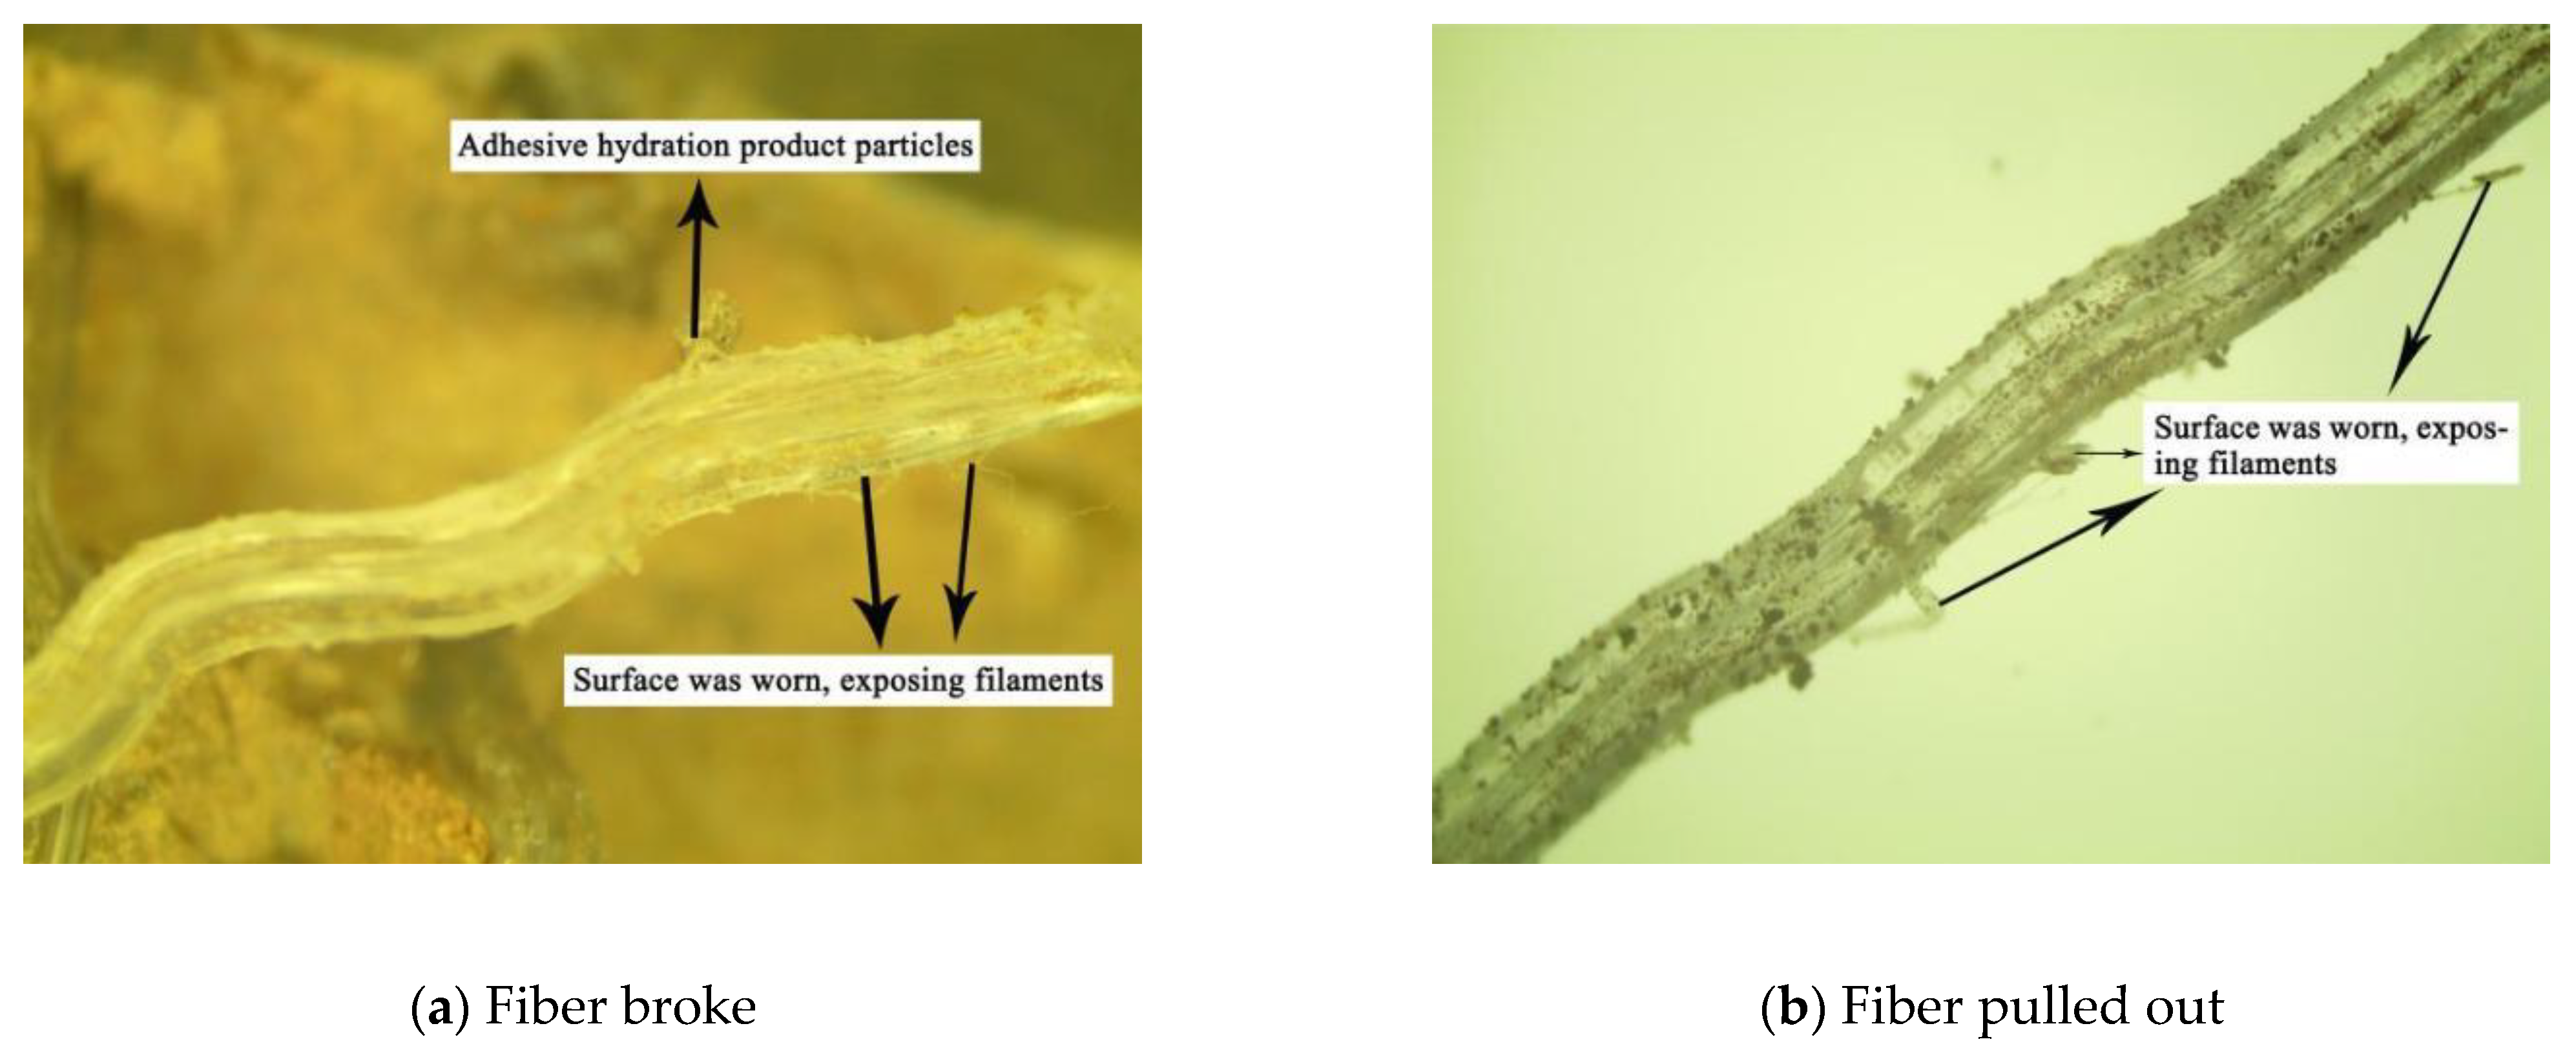
As seen from its tendency chart, the pullout curve wavelength gradually declined, possibly because of the wear in the fiber and soil wavy structures during fiber pullout. Notably, the wear was serious in the high-compaction plain soil, and low-compaction cemented soil samples but mild in the low-compaction plain soil samples. On that account, we observed the fiber pulled out from the high-compaction plain soil and the low-compaction cemented soil samples and that pulled out from the low-compaction plain soil sample, as shown in
Figure 12 (a: morphology of the fiber pulled out from the high-compaction plain soil and the low-compaction cemented soil samples; b: morphology of the fiber pulled out from the low-compaction plain soil samples). In the circumstances with close fiber–soil bonding and a large occlusal force, the fiber experienced serious surface wear when pulled out. In contrast, the surface wear was less serious in the loose fiber–soil bonding. It should be noted that, in the presence of close fiber soil bonding, while the fiber was under a sizeable occlusal force, the soil was also subjected to a sizeable reactive force. As a result, the crest structure of the soil was also worn during fiber pullout, resulting in a gradual decline in the pullout curve wave-length.
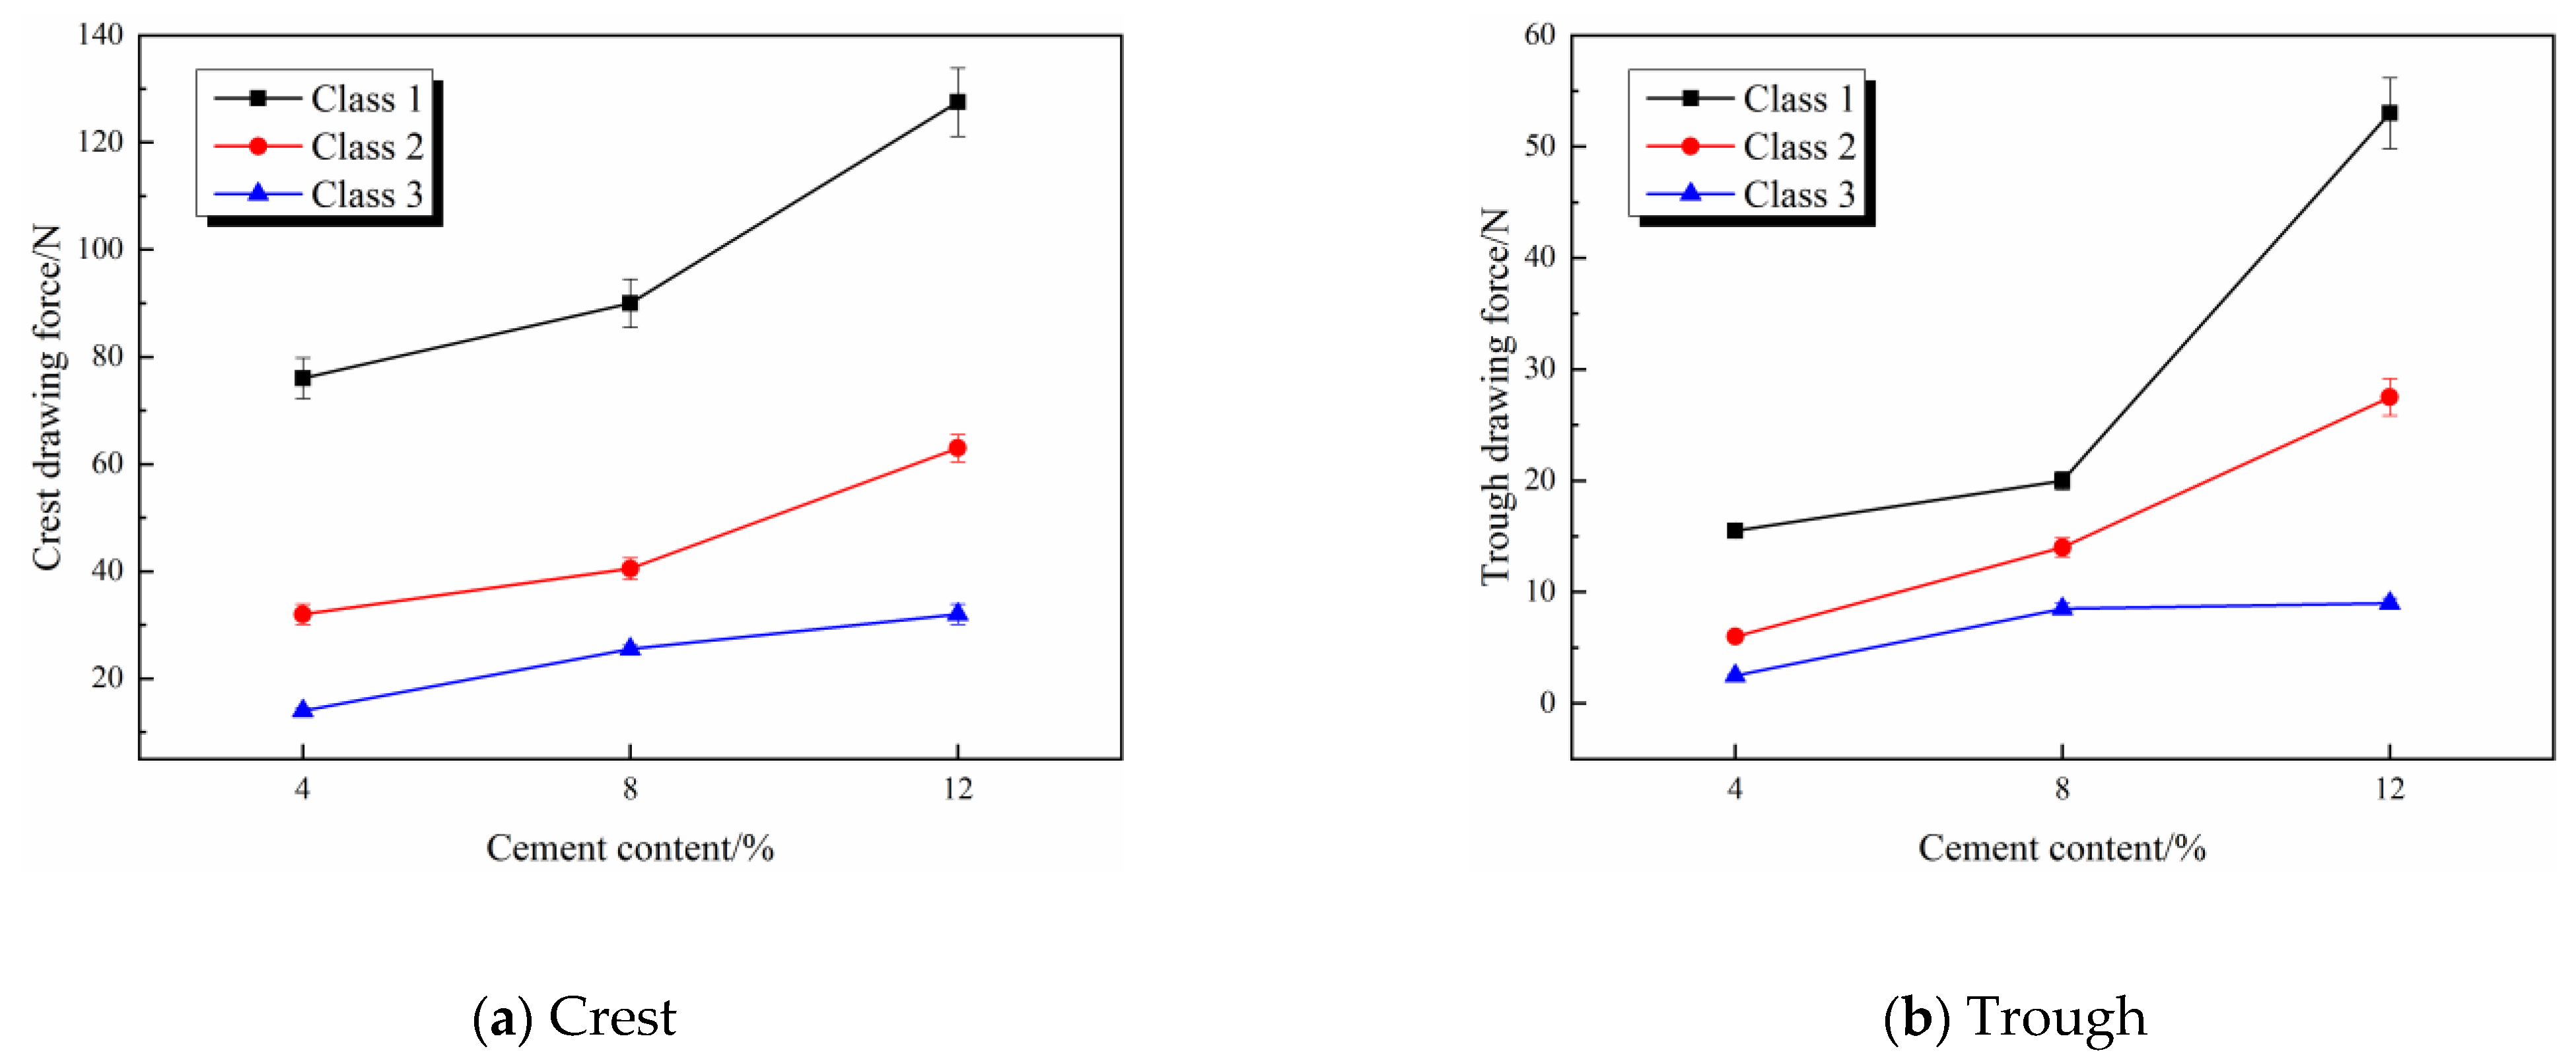
We can show their variations by extracting four crest and trough drawing forces from four random pullout curves of the XSc1, XSc2, and XSc3 sample groups, as illustrated in
Figure 13. It can be seen that, with the fiber being further pulled out of the soil, both the crest and trough drawing forces gradually declined. Taking sample 1 as an example, its Class-3 crest drawing forces were 85.5 N, 49.5 N, and 37.5 N, and its trough drawing forces were 31.5 N, 24.5 N, and 23 N, respectively. From Class 1 to Class 2 and then to Class 3, the crest drawing forces declined by 42.1% and 24.2%, and the trough drawing forces declined by 22.2% and 6.1%, respectively. There was a decrease in the amplitudes of the decline in the crest and trough drawing forces, especially the trough drawing forces. The values of crest and trough drawing forces were small as well.
This was also attributable to the wear in the coarse polypropylene fiber and soil during fiber pullout. The different morphologies of the fiber wear can be shown in
Figure 12. The variation laws of the trough drawing forces can be explained as follows: when the fiber slid to the point where the pullout curve presented a trough shape, the occlusal force applied on the fiber was the smallest, in which case the main forces blocking the sliding of the fiber were sliding friction and cohesion. The two forces are closely related to the embedding length of the fiber. With the fiber being further pulled out, its embedding length naturally turned shorter, resulting in a gradual decrease in the two forces. However, the two forces were smaller than the occlusal force between the coarse polypropylene fiber and the soil. For this reason, the two forces (sliding friction and cohesion) gradually declined but remained at relatively low levels; the trough drawing forces gradually declined but remained at relatively low levels as well.
To explain it in more detail, we cut open the position where the fiber was located in the soil before and after the pullout, observed them under a microscope, and took microphotographs, as shown in
Figure 14. It is clear that, before the coarse polypropylene fiber was pulled out from the soil, its wavy structure produced uneven pits in the soil. After the coarse polypropylene fiber was pulled out, these “uneven pits” were polished smooth, so the occlusal force between the fiber and soil was inevitably reduced.
It can be seen that the drawing force–displacement curves of this group also showed high similarities in the pullout process, thus testifying to the high repeatability of the method designed in the tests. In the pullout process, the drawing force–displacement curves first rapidly increased to the peak value and then abruptly dropped to 0 once and for all or several times (each time with a slump, as manifested by the several “steps” on the pullout curves). In the case of the one-off abrupt drop to 0, the fiber in the samples experienced one-off overall breakage; in contrast, in the case of the stepped drop to 0 by several times, the fiber in the samples experienced gradual complete breakage in several steps, as shown in
Figure 15. Clearly, in the one-off overall breakage, there was a neat section; in the gradual complete breakage, there were bundled broken filaments. In either case, the fiber near the fracture was elongated, suggesting that the fiber here had also been deformed.
In addition, it should be noted that when the coarse polypropylene fiber was broken in the test process, the maximum drawing force concentrated within the range of 180~210 N and did not reach the maximum theoretical drawing force at break (i.e., the tensile strength of 266 N) calculated from the parameters provided by the manufacturer, possibly because the manufacturer provided a large tensile strength.


