Article

Features of the Reinforcement–Soil Interfacial Effect in Fiber-Reinforced Soil Based on Pullout Tests

1
College of Civil Aviation, Nanjing University of Aeronautics and Astronautics, Nanjing 211106, China
2
Department of Airfield and Building Engineering, Air Force Engineering University, Xi’an 710038, China
3
Air Force Logistics Department, Beijing 100006, China
4
Chinese People’s Liberation Army Unit 95979, Taian 271000, China
5
Air Force Research Institute, Beijing 100000, China
6
Armed Police Force Research Institute, Beijing 100012, China
*
Author to whom correspondence should be addressed.
Constr. Mater. 2024, 4(4), 810-838; https://doi.org/10.3390/constrmater4040044
Submission received: 27 October 2024 / Revised: 4 December 2024 / Accepted: 12 December 2024 / Published: 16 December 2024

Abstract

:
To investigate the reinforcement–soil interfacial effects in fiber-reinforced soil, this study developed a novel horizontal pullout tester and conducted pullout tests on coarse polypropylene fibers in plain soil, cemented soil, and fine fiber-reinforced cemented soil. Three soil types were analyzed: low liquid limit clay, high liquid limit clay, and clay sand. The pullout tester proved to be both scientifically robust and efficient. Depending on the soil properties, coarse polypropylene fibers were pulled out intact or fractured. The pullout curves displayed distinct multi-peak patterns, with wavelengths closely linked to the fiber’s intrinsic characteristics. The pullout curve wavelength for plain soil matched the fiber’s intrinsic wavelength, while it was slightly greater in cemented soils. The peak pullout force increased with extended curing periods, higher cement content, more excellent compaction, and the addition of fine polypropylene fibers. Among these factors, compaction had the most significant impact on enhancing the soil–fiber interfacial effect. Friction, cohesion, and fiber interweaving created interlocking effects, inhibiting fiber sliding. Cement hydration processes further deformed the fiber, increasing its friction coefficient and sliding resistance. Hydration products also fill soil voids, improving soil compactness, enlarging the fiber–soil contact area, and enhancing frictional and occlusal forces at the interface.

1. Introduction

Airstrips refer to airports with a simplified structure and reduced pavement strength that are rapidly planned and constructed according to mission requirements to accommodate one or several specific aircraft types in a short period (months or years) [1]. They guarantee the emergency take-off and landing of military aircraft in cases where the only permanent airport has been destroyed, where there is a requirement for the swift projection of combat forces in places without any permanent airport, and where there is a requirement for the regular take-off and landing of specific civil aircraft types in remote areas [2,3]. Compared to permanent airports, airstrips are characterized by rapid construction, low investment, and high flexibility and are often constructed in places without adequate logistical support, so their construction materials should be obtained locally as far as possible [4,5].
Solidified soil pavements can give full play to local resources and ensure pavement-bearing capacity while significantly shortening construction time. Cement is readily available, cheap, and easy to store and transport. Due to its wide availability, low cost, and ease of storage and transportation, cement is commonly used in cemented soil, which offers the advantages of simple construction and high early strength. Consequently, cemented soil is widely utilized as the sub-base and base course material for cost-effective airfield construction [6,7]. However, studies on the applications of cemented soil have revealed a series of problems, such as frequent cracking, poor water stability, and high susceptibility to brittle failure under loads. In this context, the addition of fibers into cemented soil offers a promising technique. Differing from geofabrics, such as geogrids, geotextiles, and geocells, fibers can achieve random uniform distribution in soil and exert a reinforcing effect in each direction, thus effectively improving the strength, cracking resistance, and ductility of soil [7,8,9].
Polypropylene fiber has proven effective in reinforcing plain soil and cemented soil, and its desirable dispersibility ensures its uniform distribution in soil and significantly improves the compressive strength, tensile strength, integrity, wear resistance, and cracking resistance of plain soil and cemented soil [10,11,12,13,14,15]. The key to the reinforcing effect and the significant improvement lies in the friction and cohesion between fiber and soil, collectively defined as interfacial shear strength. A higher interfacial shear strength between fiber and soil means a more significant reinforcing effect exerted by fiber on soil, which will block fiber sliding in soil, achieve an adequate distribution of loads, and limit soil deformation [16,17,18,19]. It is vital to study the features of the reinforcement–soil interfacial effect, as they play a crucial role in how the reinforcing effect of fiber is brought into play [20,21]. Existing studies on the reinforcement–soil interfacial effect are mainly concentrated on qualitative analysis and have not paid adequate attention to quantitative research, especially the features of the reinforcement–soil interface between fiber and cemented soil/fiber-reinforced cemented soil. Tang et al. (2009) evaluated the performance of polypropylene fiber (PP fiber) using single-fiber pullout tests conducted with a modified instrument. Their results demonstrated that cement inclusions significantly increased the interfacial shear strength between the fiber and soil. The interfacial pullout strength (IPS) and interfacial resistance strength (IRS) both increased with higher additive content and longer curing times [22]. Ruan et al. (2021) performed a series of unconfined compressive strength and bending strength tests to investigate the effect of polypropylene fiber on cement mortar soil defects. The results showed that the bending compressive strength initially increased with higher fiber content but eventually decreased as fiber incorporation rose [23]. Lei Lang et al. (2024) examined the feasibility of using polypropylene fiber (PF) to enhance the tensile strength of cement-stabilized dredged sediment (CDS). The study found that the highest tensile strengths for CPFDS samples at curing periods of 7, 28, 60, and 90 days were achieved at PF contents of 0.6%, 1.0%, 1.0%, and 1.0%, respectively. CPFDS also exhibited pronounced tensile strain-hardening characteristics [24]. Zhang et al. (2014) conducted a quantitative investigation of fiber–soil interfacial behavior, focusing on the influence of fiber types and normal pressures. Pullout tests on three types of soil-embedded optical fibers under varying normal pressures were analyzed using a model that quantified the fiber–soil interfacial behaviors [25].
In view of this, this study combined qualitative and quantitative approaches to investigate the features of the reinforcement–soil interface between fiber and plain soil/cemented soil. First, a horizontal direct tensile/pullout tester was designed. It was used to conduct single fiber pullout tests on plain soil, cemented soil, and fine polypropylene fiber-reinforced cemented soil for three kinds of soil, namely, Xi’an soil (low liquid limit clay), Sanya soil (high liquid limit clay), and Korla soil (clay sand). The variations in drawing forces during fiber pullout were analyzed, and the effects of compaction degree, cement content, and curing period on interfacial shear strength were discussed. The interaction characteristics and reinforcement mechanisms of the reinforced soil interface were examined through microscopic analysis, offering insights into how coarse and fine fibers enhance soil–cement strength and crack resistance. The difference in engineering characteristics such as the crack resistance of coarse and fine fiber reinforced soil–cement is fundamentally due to their different interfacial interaction characteristics. Only by elucidating the underlying mechanism can we better guide practice.

2. Test Overview

2.1. Test Materials

2.1.1. Soil Samples

Three representative kinds of soil collected from Xi’an (Shanxi Province), Sanya (Hainan Province), and Korla (the Xinjiang Uygur Autonomous Region) were used as soil samples in this study, as shown in Figure 1. The classification results of the three kinds of soil are in Table 1. Soil liquid limit and plastic limit are measured and classified by using a combined liquid–plastic limit tester in accordance with Highway Geotechnical Test Regulations (JTG3430-2020) [26]. The difference between liquid limit and plastic limit is the Plasticity Inde of soil. 2 kg soil samples were used to determine these values.

2.1.2. Fibers

Two kinds of fiber were selected: fine polypropylene fiber and coarse polypropylene fiber. Their technical parameters and morphologies are presented in Table 2 and Figure 2.

2.1.3. Cement

P.O. 42.5 ordinary Portland cement with a density of 3.10 g/cm3 was used, with the cement content expressed as a percentage of the dry soil mass. The technical parameters are listed in Table 3. The cement is Jidong Dongshi brand P.O 42.5 ordinary Portland cement.

2.2. Test Methods

A direct tensile/pullout tester was designed, which was available for both direct tensile tests and single fiber pullout tests, as shown in Figure 3.
Static pressure molding was performed using the sample preparation mold shown in Figure 4. In sample preparation, direct tensile and pullout tests were used to share the mold frame and the bottom spacer. The upper and lower spacers used in the direct tensile tests for sample preparation were the same. The upper spacer used in the pullout tests comprised five separate spacers, i.e., #1–#5. In sample preparation, the bottom spacer, #1–#2 spacers, and #4–#5 spacers were placed in succession in the mold frame. The #3 spacer was an upper holder block placed after solid filling of soil and fiber, followed by compaction molding using a jack.
The thickness of the sample is unchanged; the compaction degree is adjusted by controlling the total soil requirement of the sample. When the compaction degree is higher, the total soil requirement is increased. When the degree of compaction is low, the total amount of soil required can be reduced. The thickness of the designed sample was 60 mm. To make full use of them, three pieces of fiber were designed in the thickness direction of each sample with an interval of 15 mm along the centerline of the profile. Each sample was divided equally into four portions in the thickness direction, and the soil was filled by an equal amount four times. The total soil demand of a sample was calculated by the design compaction degree, and four equal portions were divided. After the pouring and preliminary compaction of the first portion, the first piece of fiber was embedded. Next, the second portion was poured and preliminarily compacted, followed by the second piece of fiber. Similarly, all four portions were poured sequentially and then compacted with a jack. After the preliminary compaction of a layer of soil, one end of the fiber to be embedded was led through the seam of the 3# spacer using tweezers. At the same time, the other end was placed on the soil sample (i.e., the zone where the 2# spacer was located) according to the design embedding length (20 mm). The fiber was kept vertical on the centerline. The morphology of the 3# spacer and the process of fiber embedding can be shown in Figure 5.
After embedding the three pieces of fiber and filling the four layers of soil, static pressure molding and demolding were provided, and the samples were cured in a standard curing box until the completion of the curing period, as illustrated in Figure 6. Coarse polypropylene fiber was used in the pullout tests. The tension position applied is 10 mm from the clearance of the specimen surface. The soil samples were plain soil, cemented, and fine polypropylene fiber-reinforced cemented soil samples prepared from the three kinds of soil.
In the pullout tests, the motor drove the clamp, which drove a sample to move leftwards at a speed of 0.8 mm/min. The chuck clamped the fiber on the right side so the fiber embedded in the sample would slide. The data indicated by the force sensor and the digital dial indicator were acquired synchronously at a uniform frequency of 10 Hz.

2.3. Test Scheme

2.3.1. Sample Combinations

The soil samples, fibers, and cement selected in this study involved many parameters, such as variety, content, and compaction degree. For the convenience of distinguishing between different soil samples, fibers, and cement, these parameters were denoted by letters: X denotes Xi’an soil, S denotes Sanya soil, K denotes Korla soil, C denotes cement, and M denotes fine polypropylene fiber. The water–cement ratio of the sample is 0.43. Three different kinds of sample codes were used, as explained below. As shown in Table 4.
① [X/S/K]S[c1/2/3]: plain soil sample, where “S” denotes plain soil, and “c1/2/3” denotes compaction degrees of 85%, 90%, and 95%. For instance, “XSc1” denotes a plain Xi’an soil sample with a compaction degree of 85%.
② [X/S/K][C1/2/3][c1/2/3][d1/2/3]: cemented soil sample, where “C1/2/3” means that the cement contents are 4%, 8%, and 12% of the dry mass of the soil, “c1/2/3” denotes compaction degrees of 85%, 90%, and 95%, and “d1/2/3” denotes curing periods of 1 d, 7 d, and 14 d. For instance, “XC1c1d1” notes a cemented Xi’an soil sample with a compaction degree of 85%, a cement content of 6%, and a curing period of 1 d.
③ [X/S/K][M1/2/3]: fine polypropylene fiber-reinforced cemented soil sample with a cement content of 8%, a fine polypropylene fiber length of 12 mm, a compaction degree of 95%, and a curing period of 7d, where “M1/2/3” means that the fiber contents are 0.1%, 0.2%, and 0.3% of the dry mass of the soil. For instance, “XM1” denotes a cemented Xi’an soil sample reinforced by 0.1% fine polypropylene fiber.

2.3.2. Duplicate Tests

According to the test design, duplicate tests should be conducted on each group of samples, and each group should have six data sets. Considering that each pullout test sample contained three pieces of fiber available for three pullout tests (equivalent to three duplicate tests), two samples for each group would meet this requirement. In the same group, outliers were eliminated by the triple mean square error method. It was allowed to have only one outlier. Otherwise, the corresponding tests would have to be repeated. A group of tests would be deemed as valid only when the coefficient of variation C v (%) was less than 6%. Failing that, the number of samples should be increased to supplement the tests. In that case, the results of new and old tests should be statistically rated again until the coefficient of variation (%) meets the relevant criterion.

3. Results and Discussions

3.1. Typical Pullout Curves of the Coarse Polypropylene Fiber

3.1.1. Force Analysis on the Fiber

The coarse polypropylene fiber used in the tests is a profiled wavy fiber with crests and troughs, as shown in Figure 7.
As can be seen in Figure 7, the coarse polypropylene fiber had a diameter of 0.8 mm in its thin part and 1.0 mm in its thick part. The fiber provided by the manufacturer had an equivalent diameter of 0.8 mm and a tensile strength of ≥530 MPa. The tensile resistance of the coarse polypropylene fiber was calculated from the following equation:
F = T π d 2 2
where T is the tensile resistance of the coarse polypropylene fiber, d is the fiber diameter.
On this basis, the tensile resistance of the coarse polypropylene fiber was calculated to be F = 266 N. Theoretically speaking, the fiber would break when applied with a tensile force of >266 N. Depending on the forces applied by the soil on the fiber, the fiber might be pulled out or broken in pullout tests. The specific forces included occlusal friction and cohesion. Force analysis was performed on the coarse polypropylene fiber in a plain soil sample, as shown in Figure 8.
As can be seen in 
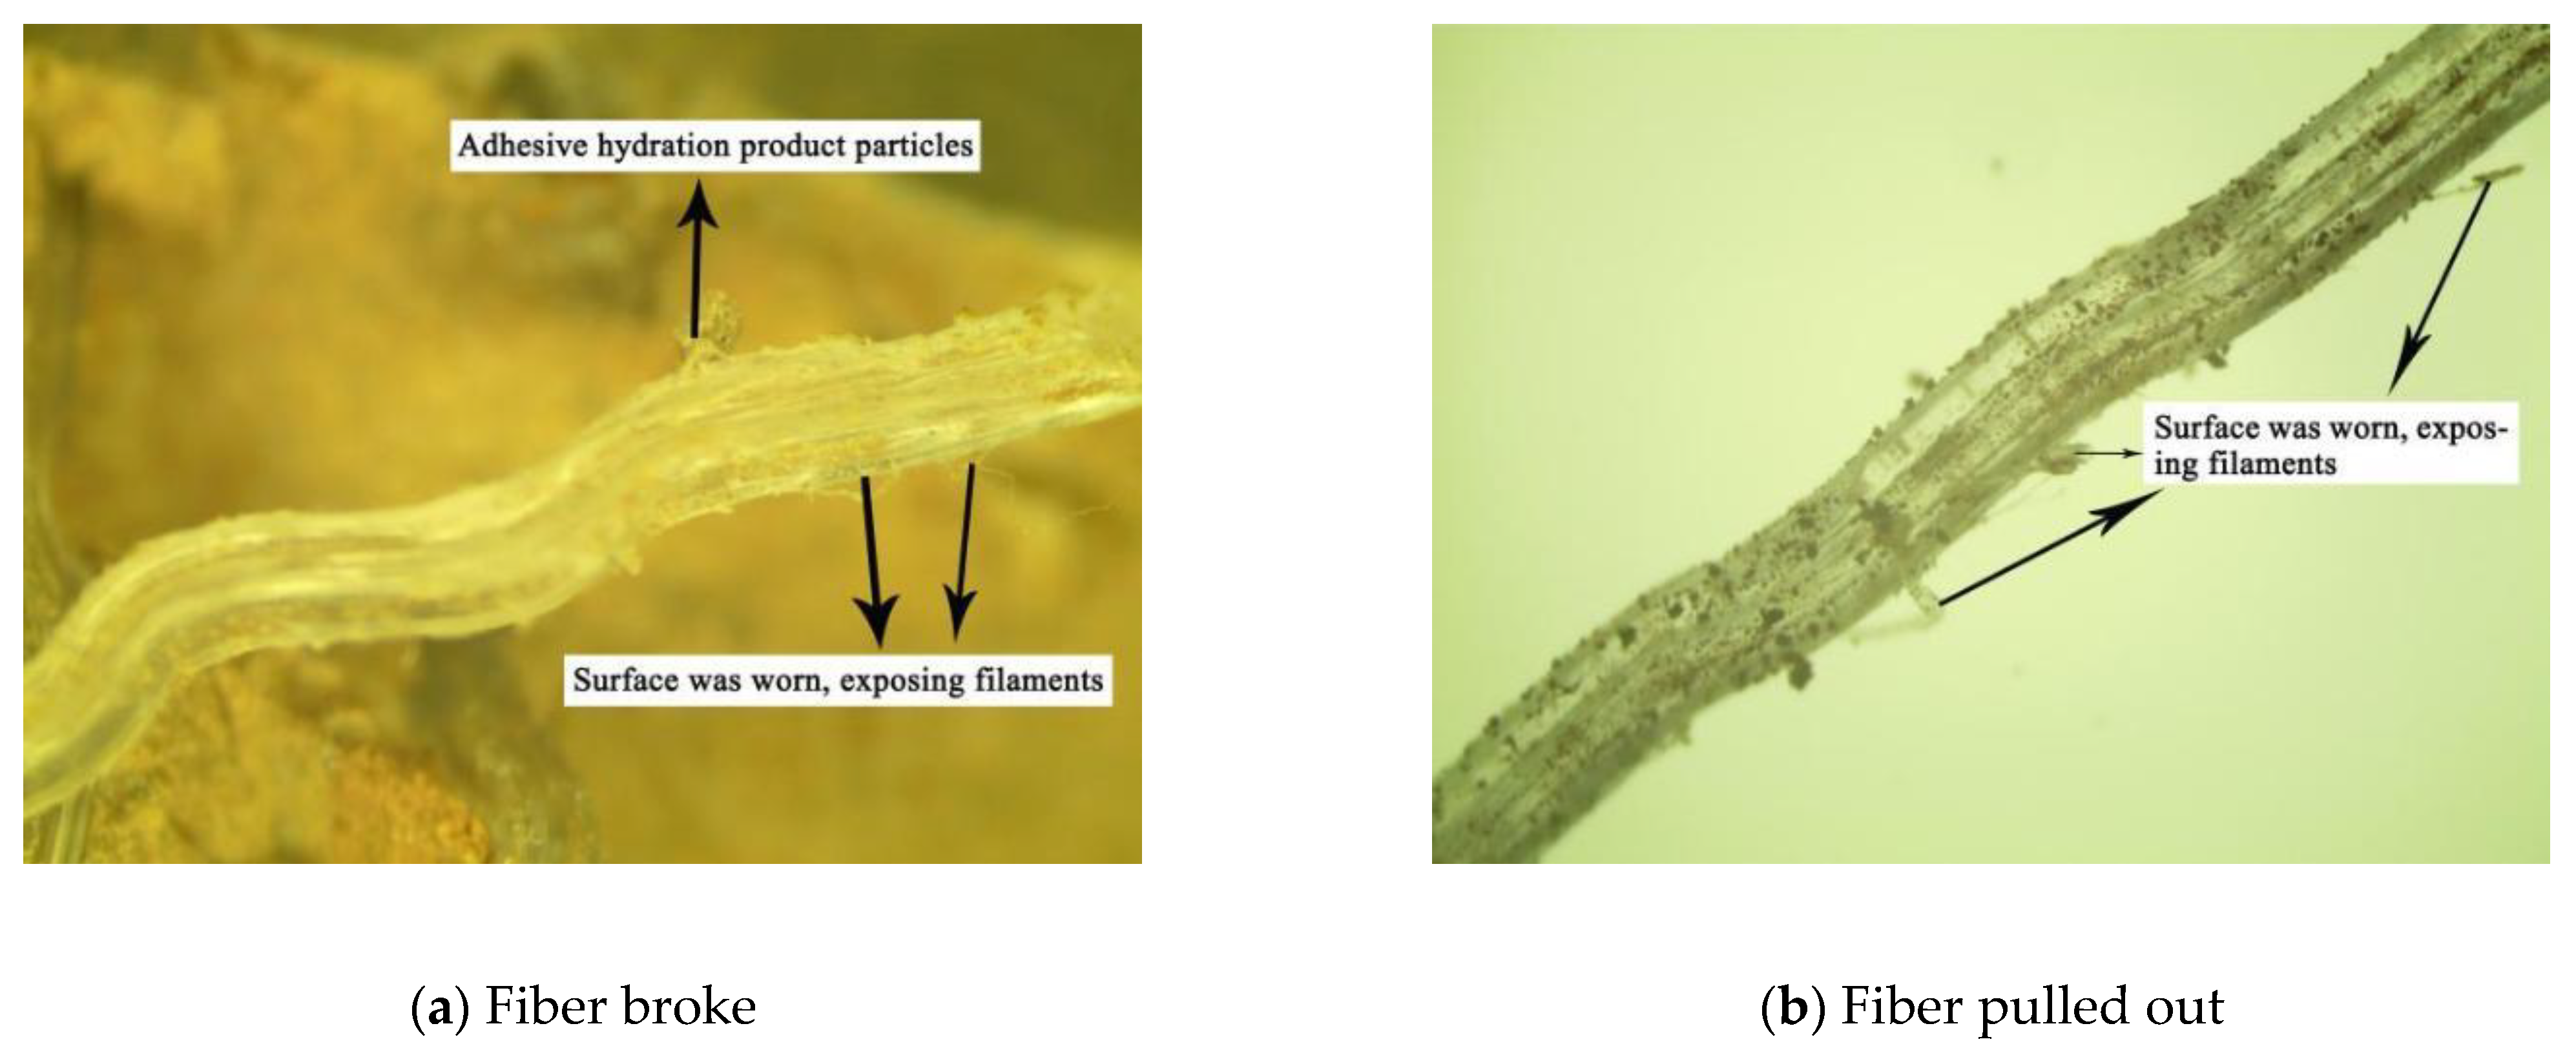
Figure 8, the force condition on the interface of the coarse polypropylene fiber is more complicated than that on the interface of the non-profiled fiber. The general linear fiber is only subject to sliding friction and cohesive force in soil. In contrast, coarse polypropylene fiber under a drawing force, due to the presence of obvious crests and troughs, is subjected to sliding friction and cohesion, but also significantly affected by occlusal friction. The fiber in soil will experience a relative slide only after the drawing force has overcome the three forces. Conversely, when the three forces applied on the fiber exceed the tensile strength of the fiber and the drawing force gradually increases to the maximum drawing force bearable by the fiber, the fiber will break. In actual tests, it was found that the coarse polypropylene fiber was pulled out from the plain soil and the low-compaction cemented Xi’an and Sanya soil but was basically broken in the cases of the high-compaction cemented soil (except Korla soil) and the fine polypropylene fiber-reinforced cemented soil. See the two typical morphologies of the coarse polypropylene fiber (pulled out and break) in the fiber pullout tests in Figure 9.
The coarse polypropylene fiber in the pullout tests had two different morphologies, which correspond to two completely different shapes of the pullout curves (drawing force-displacement curves). See an analysis of the pullout curves below.

3.1.2. Typical Pullout Curves of the Fiber

Four random sets of pullout test data were selected from the soil samples from which the fiber could be pulled out from the XSc1, XSc2, and XSc3 sample groups. In cases where the fiber could not be pulled out from the soil samples, four random sets of pullout test data were selected from the test group of SC1c3d2. See the drawing force–displacement curves prepared using these data in Figure 10.
It can be seen that the drawing force–displacement curves of this group showed high similarities in the pullout process, suggesting that the method designed in the tests is scientific and practical and has high repeatability. The pullout curves of this group manifested obvious multi-peak features, which were closely related to the morphology of the coarse polypropylene fiber used (a wavy fiber). When the wavy fiber was under a drawing force, sliding friction, cohesion, and occlusal force blocked the fiber from a relative slide so the fiber and soil would remain an integral whole. When the drawing force increased and equaled the resistance of the sliding friction, cohesion, and occlusal force, the fiber would debond from the soil and experience a relative slide, producing the first crest on the pullout curve. After that, the fiber slid and was still affected by sliding friction and cohesion, accompanied by an abrupt drop in the drawing force. After sliding by one wavelength, the crest of the coarse polypropylene fiber would once again overlap with that of the soil, in which case the fiber would again be subjected to an occlusal force, resulting in another increase in the drawing force. However, due to the reduced embedded depth of the fiber at this point, the sliding friction, cohesion, and occlusal force would all decline. As a result, the second crest drawing force on the pullout curve greatly declined. Similarly, crests would reoccur on the pullout curve with the fiber being further pulled out, and the crest drawing forces would decrease continuously.
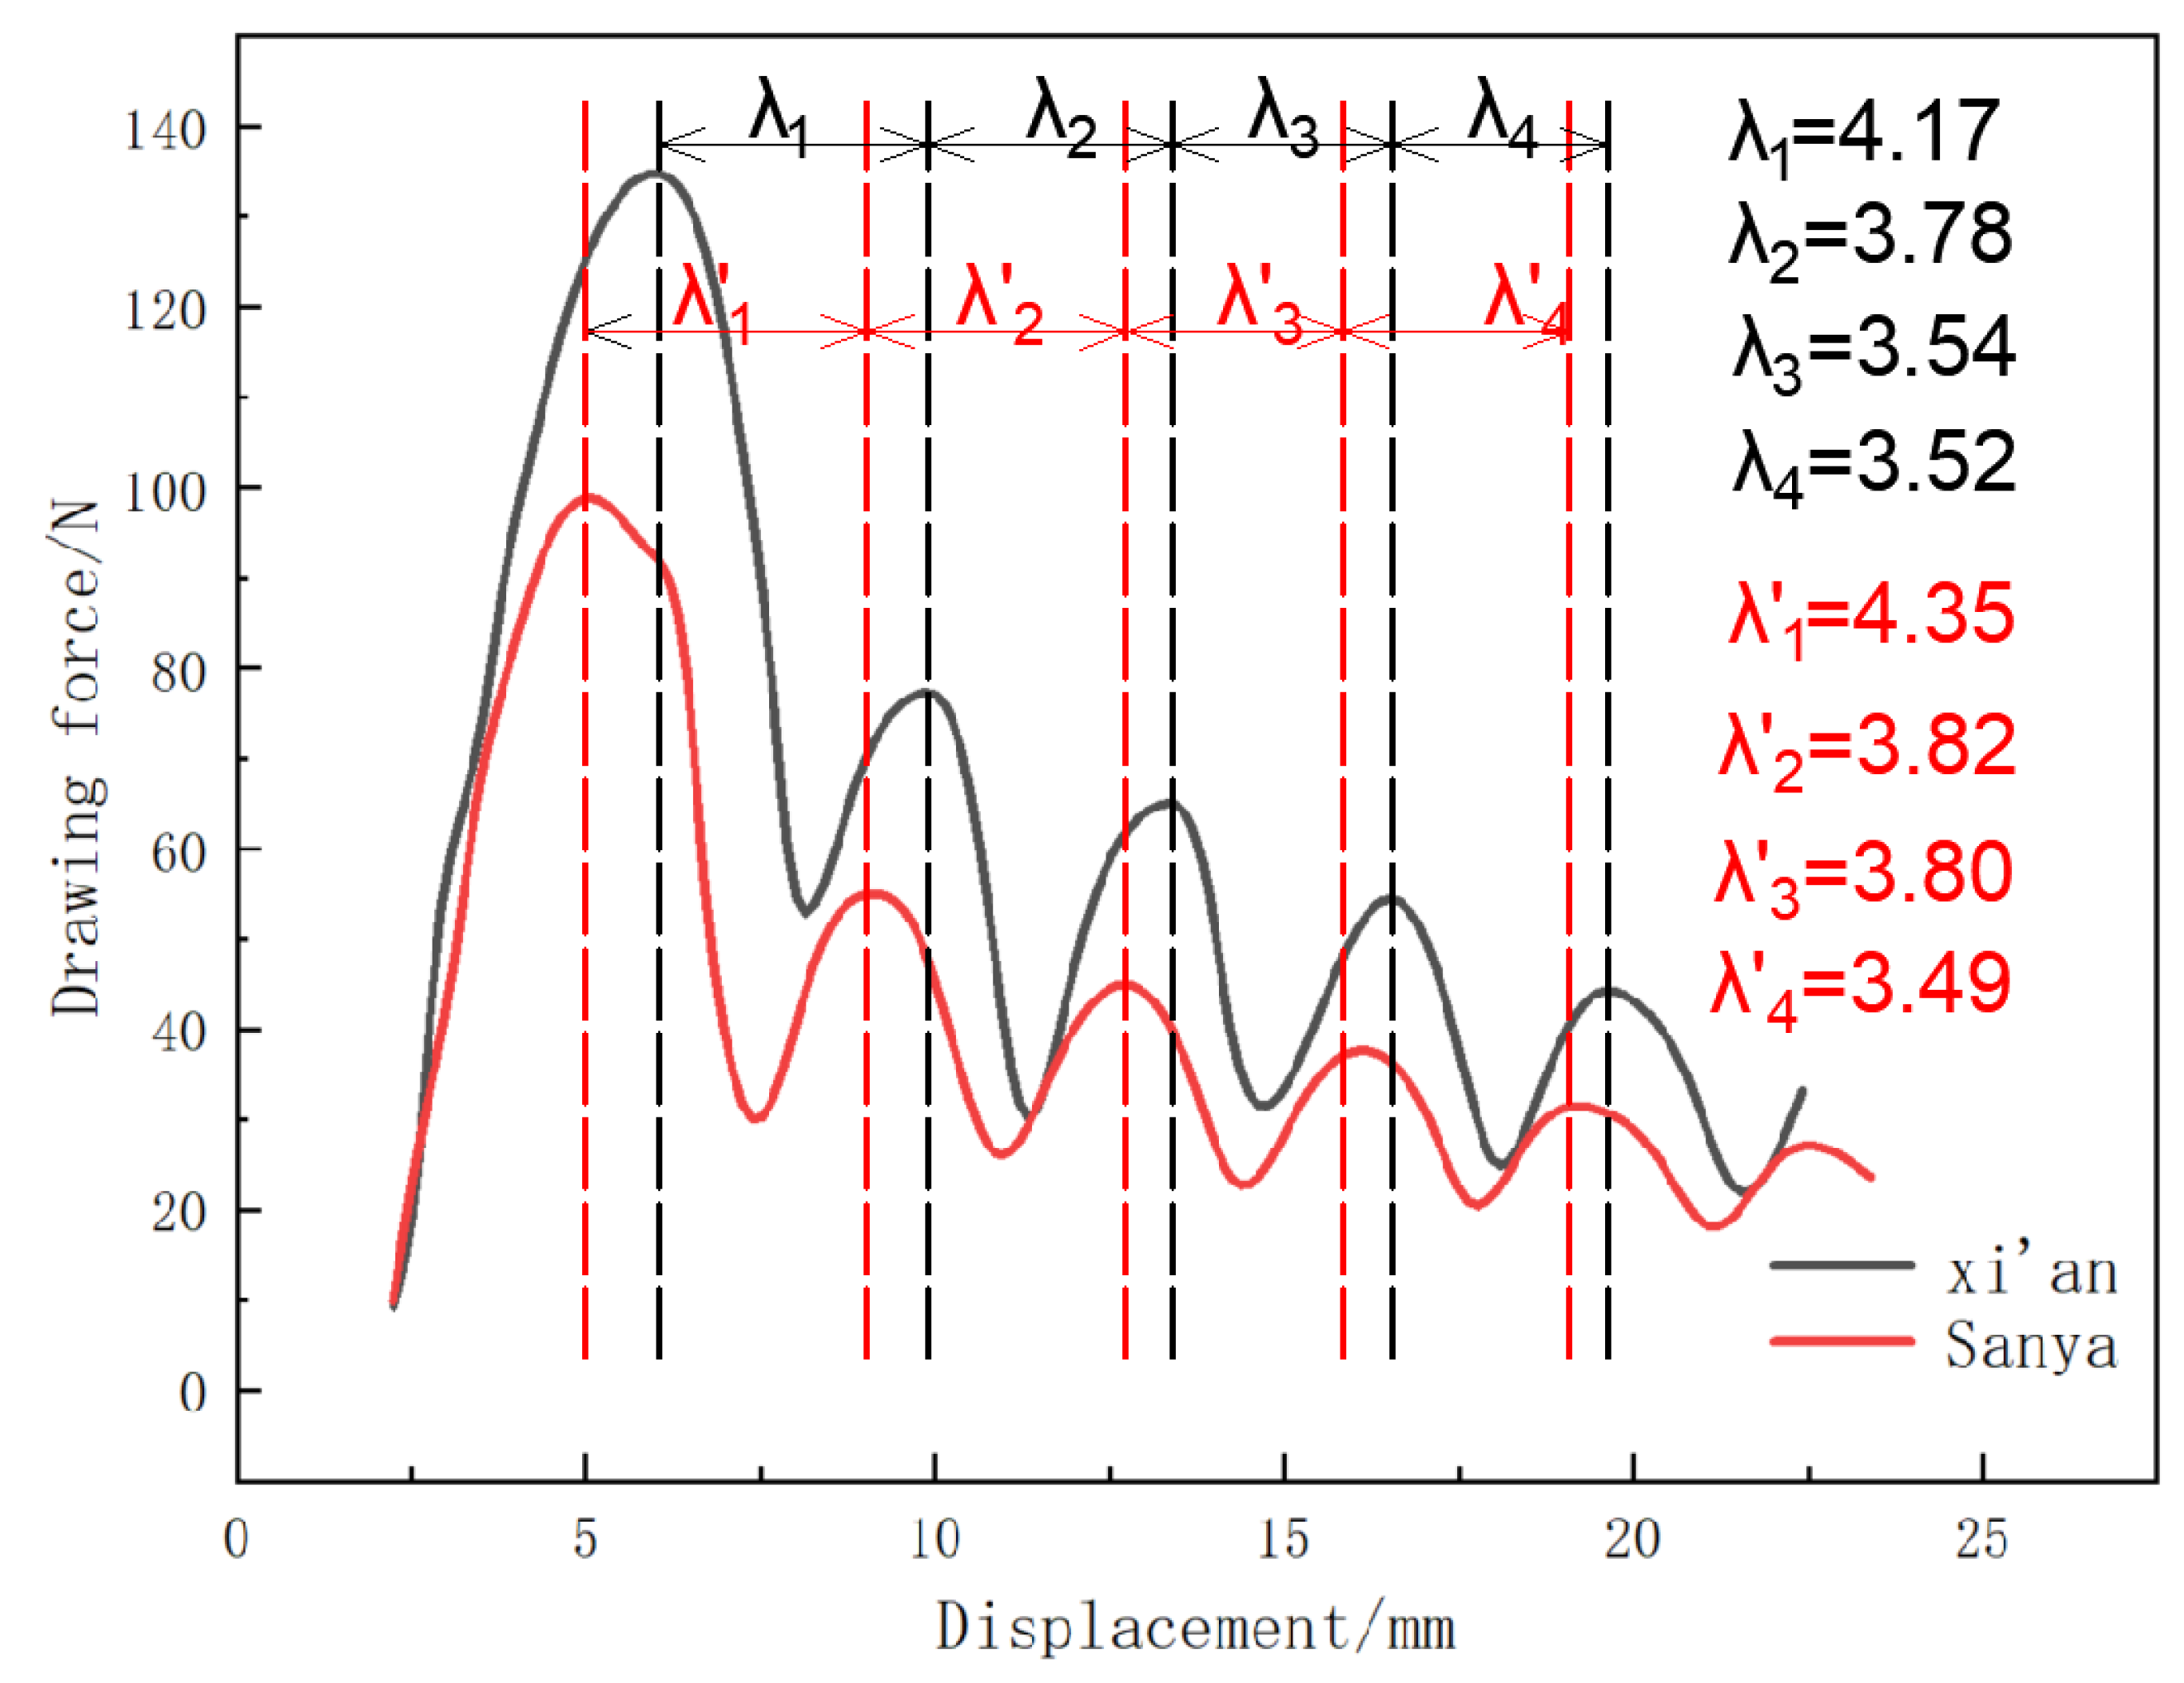
By extracting three wavelengths ( λ 1 , λ 2 , and λ 3 ) f from four random pullout curves of the sample groups of XSc1, XSc2, and XSc3, we can show their variations, as illustrated in Figure 11a. Their values are generally in the range of 3.9 to 4.1 mm. The wavelengths of the coarse polypropylene fiber were about 4.0 mm. The essential consistency between the two results further indicates that the multi-peak features of the pullout curves are closely related to the morphology of the coarse polypropylene fiber itself. The results also suggest that the interactive features of the reinforcement–soil interface can be adjusted by modifying the feature parameters of the reinforcing fibers themselves (such as wavelength and diameter). This finding is valuable to engineering applications.
As seen from its tendency chart, the pullout curve wavelength gradually declined, possibly because of the wear in the fiber and soil wavy structures during fiber pullout. Notably, the wear was serious in the high-compaction plain soil, and low-compaction cemented soil samples but mild in the low-compaction plain soil samples. On that account, we observed the fiber pulled out from the high-compaction plain soil and the low-compaction cemented soil samples and that pulled out from the low-compaction plain soil sample, as shown in Figure 12 (a: morphology of the fiber pulled out from the high-compaction plain soil and the low-compaction cemented soil samples; b: morphology of the fiber pulled out from the low-compaction plain soil samples). In the circumstances with close fiber–soil bonding and a large occlusal force, the fiber experienced serious surface wear when pulled out. In contrast, the surface wear was less serious in the loose fiber–soil bonding. It should be noted that, in the presence of close fiber soil bonding, while the fiber was under a sizeable occlusal force, the soil was also subjected to a sizeable reactive force. As a result, the crest structure of the soil was also worn during fiber pullout, resulting in a gradual decline in the pullout curve wave-length.
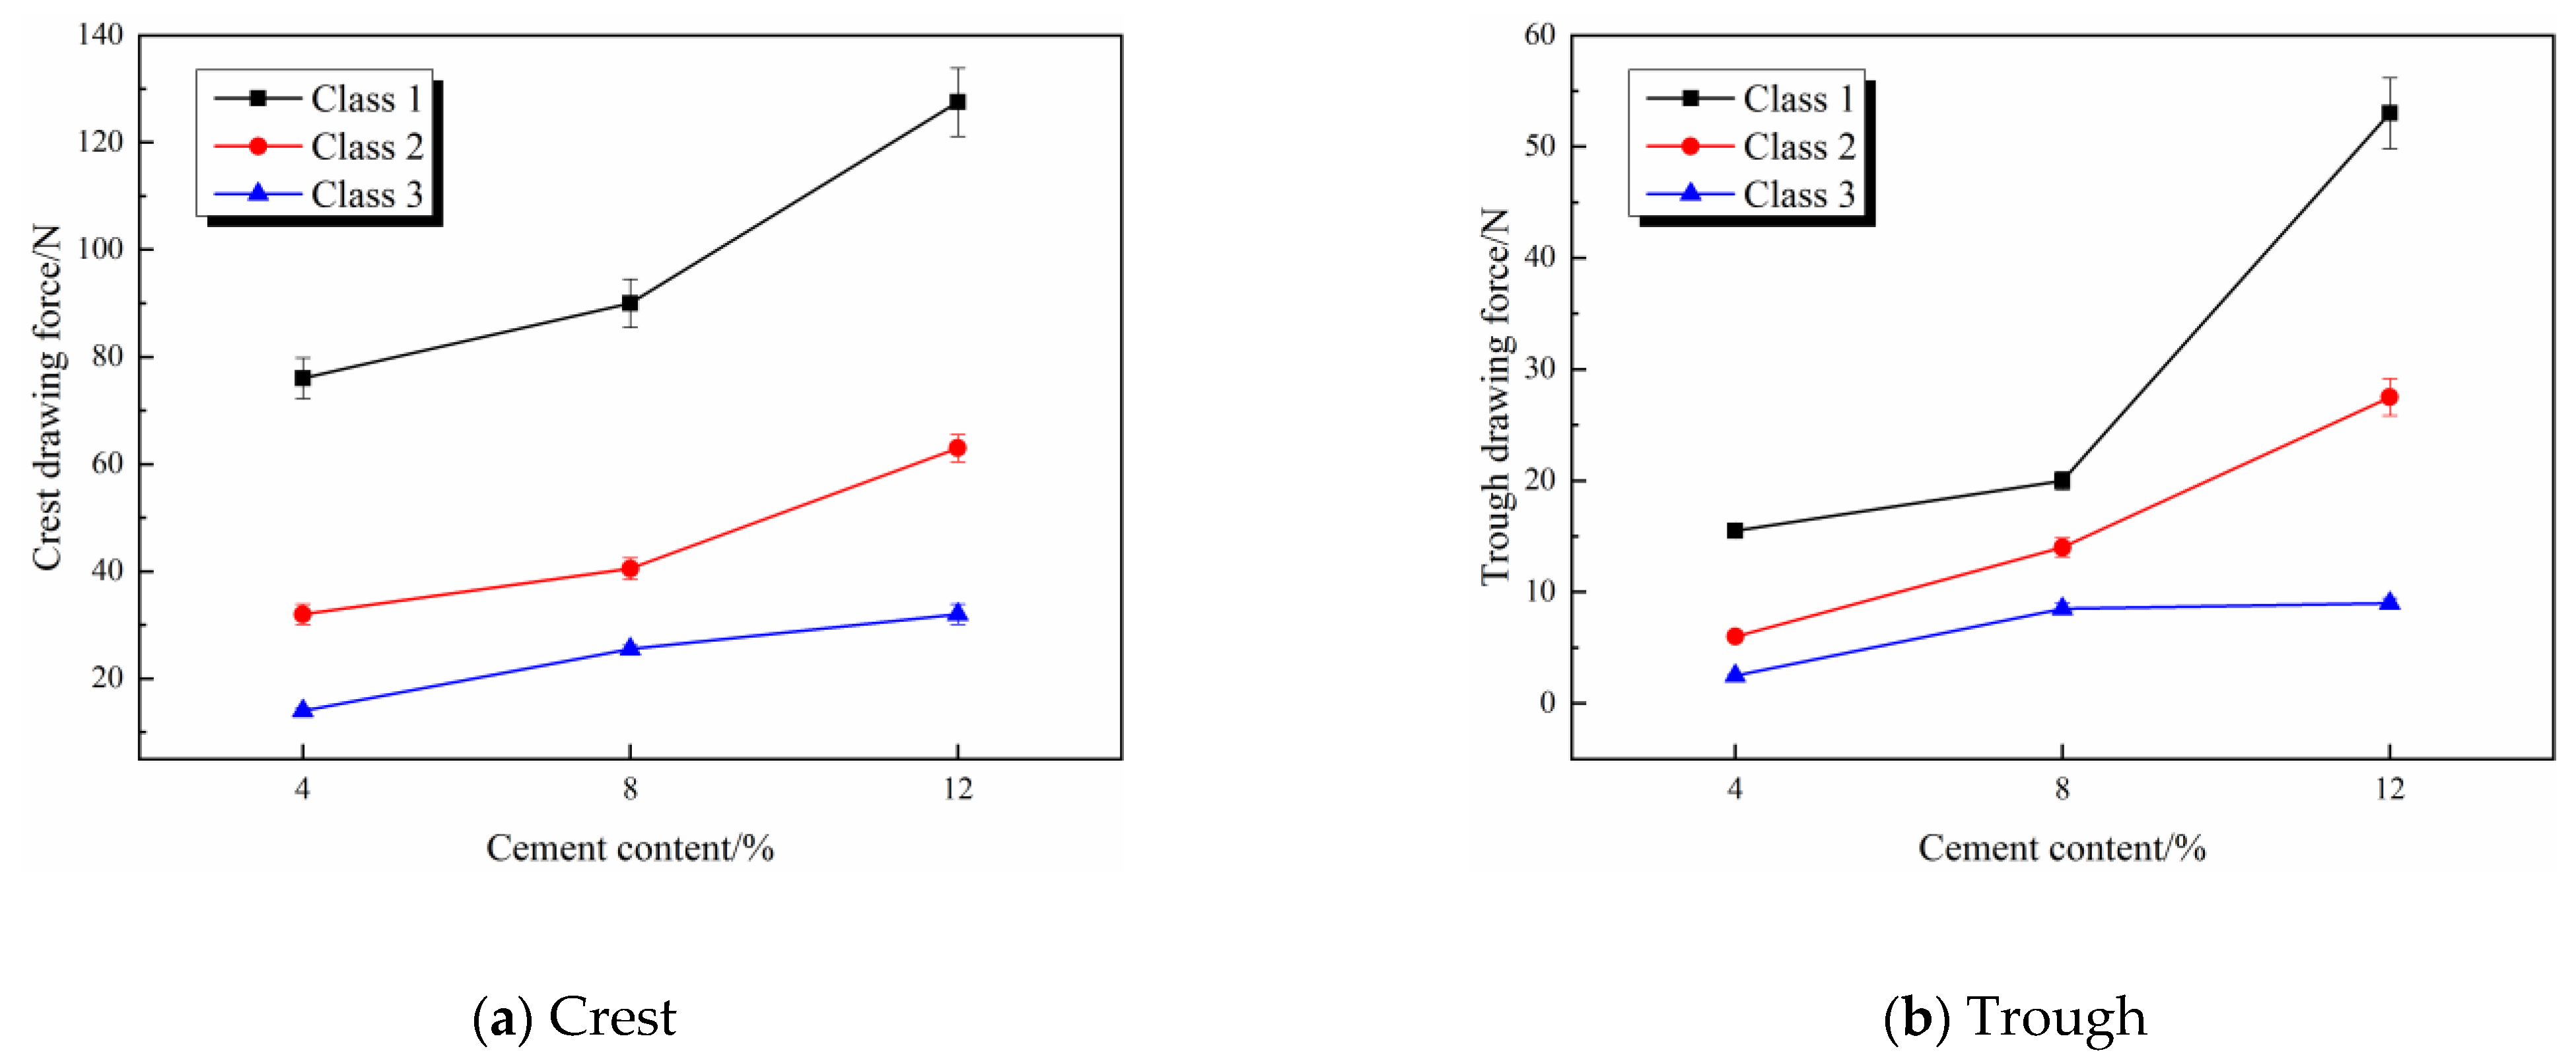
We can show their variations by extracting four crest and trough drawing forces from four random pullout curves of the XSc1, XSc2, and XSc3 sample groups, as illustrated in Figure 13. It can be seen that, with the fiber being further pulled out of the soil, both the crest and trough drawing forces gradually declined. Taking sample 1 as an example, its Class-3 crest drawing forces were 85.5 N, 49.5 N, and 37.5 N, and its trough drawing forces were 31.5 N, 24.5 N, and 23 N, respectively. From Class 1 to Class 2 and then to Class 3, the crest drawing forces declined by 42.1% and 24.2%, and the trough drawing forces declined by 22.2% and 6.1%, respectively. There was a decrease in the amplitudes of the decline in the crest and trough drawing forces, especially the trough drawing forces. The values of crest and trough drawing forces were small as well.
This was also attributable to the wear in the coarse polypropylene fiber and soil during fiber pullout. The different morphologies of the fiber wear can be shown in Figure 12. The variation laws of the trough drawing forces can be explained as follows: when the fiber slid to the point where the pullout curve presented a trough shape, the occlusal force applied on the fiber was the smallest, in which case the main forces blocking the sliding of the fiber were sliding friction and cohesion. The two forces are closely related to the embedding length of the fiber. With the fiber being further pulled out, its embedding length naturally turned shorter, resulting in a gradual decrease in the two forces. However, the two forces were smaller than the occlusal force between the coarse polypropylene fiber and the soil. For this reason, the two forces (sliding friction and cohesion) gradually declined but remained at relatively low levels; the trough drawing forces gradually declined but remained at relatively low levels as well.
To explain it in more detail, we cut open the position where the fiber was located in the soil before and after the pullout, observed them under a microscope, and took microphotographs, as shown in Figure 14. It is clear that, before the coarse polypropylene fiber was pulled out from the soil, its wavy structure produced uneven pits in the soil. After the coarse polypropylene fiber was pulled out, these “uneven pits” were polished smooth, so the occlusal force between the fiber and soil was inevitably reduced.
It can be seen that the drawing force–displacement curves of this group also showed high similarities in the pullout process, thus testifying to the high repeatability of the method designed in the tests. In the pullout process, the drawing force–displacement curves first rapidly increased to the peak value and then abruptly dropped to 0 once and for all or several times (each time with a slump, as manifested by the several “steps” on the pullout curves). In the case of the one-off abrupt drop to 0, the fiber in the samples experienced one-off overall breakage; in contrast, in the case of the stepped drop to 0 by several times, the fiber in the samples experienced gradual complete breakage in several steps, as shown in Figure 15. Clearly, in the one-off overall breakage, there was a neat section; in the gradual complete breakage, there were bundled broken filaments. In either case, the fiber near the fracture was elongated, suggesting that the fiber here had also been deformed.
In addition, it should be noted that when the coarse polypropylene fiber was broken in the test process, the maximum drawing force concentrated within the range of 180~210 N and did not reach the maximum theoretical drawing force at break (i.e., the tensile strength of 266 N) calculated from the parameters provided by the manufacturer, possibly because the manufacturer provided a large tensile strength.

3.2. Single-Fiber Pullout Tests on Plain Soil

Coarse polypropylene fiber pullout tests were conducted on plain soil for the three kinds of soil (Xi’an soil, Sanya soil, and Korla soil), and it was found that the coarse polypropylene fiber in plain soil could be pulled out entirely in each case. See the statistics of the Class-1 and Class-2 crest drawing forces in the pullout process in Table 5.
The data in Table 5 can be used to prepare the variation curves of the crest and trough drawing forces with compaction degree during fiber pullout from the plain Xi’an and Sanya soil samples, as shown in Figure 16. There were no data on Korla soil samples with compaction degrees of 85% and 90% in Table 5. It is challenging for Korla soil (sandy soil with minimal cohesion between the plain soil particles) to prepare integral samples after compaction and demolding under the two compaction degrees. Thus, no fiber pullout tests were conducted on plain Korla soil samples with 85% and 90% compaction degrees.
As seen from Table 5 and Figure 16, for the plain Xi’an and Sanya soil samples, the crest and trough drawing forces on the pullout curves of the coarse polypropylene fiber all gradually increased with increasing compaction degree. When the compaction degree was raised from 85% to 95%, the Class-1, Class-2, and Class-3 crest drawing forces on the pullout curves of the fiber in Xi’an soil increased by 12.3% and 19.2%, 23.5%, and 23.8%, and 23.6% and 14.7%, respectively; the maximum drawing force reached 87 N. In contrast, those on the pullout curves of the fiber in the Sanya soil increased by 35.7% and 24.2%, 40% and 24.5%, and 39.3% and 28.2%, respectively; the maximum drawing force reached 59 N. Apparently, the crest drawing forces applied on the Xi’an soil samples in the fiber pullout tests were more significant than those applied on the Sanya soil samples, but raising the compaction degree increased the crest drawing forces applied on the Sanya soil samples by a higher amplitude. This can be explained as follows: Xi’an soil has a greater interparticle cohesion than Sanya soil. During the pullout process, the forces applied to a fiber include sliding friction, cohesion, and occlusal force. When the compaction degree is raised, the contact area between the fiber and the soil particles significantly increases, resulting in increased sliding friction and occlusal force. In the fiber pullout tests, the two forces accounted for a large proportion of the forces applied on the Sanya soil samples, so raising the compaction degree would more significantly increase the crest drawing forces applied on the Sanya soil samples. However, it seems that greater crest drawing forces were applied to the Xi’an soil samples in the fiber pullout tests, which is attributable to the large cohesion of the Xi’an soil itself.
In contrast, the trough drawing forces were far smaller than the crest drawing forces, and also increased with increasing compaction degree and decreased with the evolving waveform class. This is because, with the fiber being further pulled out, its embedding depth gradually declined, accompanied by a decrease in the sliding friction and cohesion applied to the fiber in the pullout process. In addition, the wavy structure of the soil would also be constantly worn by the wavy structure of the fiber during fiber pullout, resulting in a gradually reducing occlusal force applied by the soil on the fiber (Figure 14).
The properties of Korla soil as a sandy soil determine a minimal cohesion between soil particles and between the Korla soil and the fiber. When the coarse polypropylene fiber was pulled out from a plain Korla soil sample, the resistance applied to the fiber was mainly composed of sliding friction and occlusal force. The minimal cohesion made molding the low-compaction plain Korla soil samples difficult. In molding the high-compaction plain Korla soil samples, the crest drawing forces applied on the high-compaction plain Korla soil samples were smaller than those on the Xi’an and Sanya soil samples. Taking the plain soil samples with a 95% compaction degree for illustration, the Class-1, Class-2, and Class-3 crest drawing forces applied on the Xi’an soil samples were 1.47, 1.70, and 1.56 times those applied on the Sanya soil samples, and 3.78, 3.82, and 4.48 times of those applied on the Korla soil samples, respectively. The crest drawing force and cohesion can rank the three kinds of soil similarly. This means that cohesion and compaction degrees play vital roles in the magnitude of the resistance to fiber sliding in soil. In particular, soil compaction should be carried out in strict accordance with design requirements during construction to play a full role in the reinforcing effect of fibers.

3.3. Single-Fiber Pullout Tests on Cemented Soil

See the results of the pullout tests on the cemented Xi’an soil, Sanya soil, and Korla soil samples in Table 6.
Only those with a low compaction degree (85%) showed a successful fiber pullout among the cemented Xi’an and Sanya soil samples with different parameters under investigation. In other cases, the fiber was pulled off but not broken. The samples with broken fibers were excluded from subsequent analysis. In the case of the cemented Korla soil samples, the fiber could be pulled out without breakage in each parameter combination. For this reason, this study mainly focused on analyzing the Korla soil samples and the low-compaction Xi’an and Sanya soil samples.

3.3.1. Low-Compaction Cemented Xi’an and Sanya Soil

It was observed that the pull-out curves of coarse polypropylene fibers reinforced with low-pressure solid cement in the Xi’an and Sanya soil samples (XC2c1d2 and SC2c1d2) exhibit a multi-peak waveform. However, there are notable differences when compared to the pull-out curves of the plain soil samples. Typical pull-out curves for XC2c1d2 and SC2c1d2 are shown in Figure 17.
As seen in Table 6 and Figure 17, adding cement significantly increased the crest and trough drawing forces. To be specific, compared to the plain soil samples with a low compaction degree (85%), the cemented Xi’an soil samples witnessed increases in the Class-1, Class-2, and Class-3 crest drawing forces of 106.9%, 113.2%, and 118.2%, and increases in the trough drawing forces of 200%, 140%, and 350%, respectively. The cemented Sanya soil samples showed increases in the Class-1, Class-2, and Class-3 crest drawing forces of 184.3%, 188.6%, and 178.6%, and increases in the trough drawing forces of 70.4%, 85%, and 82.4%, respectively. Compared to the high-compaction plain soil samples (95%), the low-compaction cemented soil samples also experienced significant increases in the crest and trough drawing forces. Specifically, compared to the plain soil samples with a compaction degree of 95%, the cemented Xi’an soil samples witnessed increases in the Class-1, Class-2, and Class-3 crest drawing forces of 54.6%, 43.6%, and 53.8%, and increases in the trough drawing forces of 43.1%, −4%, and −8.2%, respectively. The cemented Sanya soil samples showed increases in the Class-1, Class-2, and Class-3 crest drawing forces of 68.6%, 65.6%, and 56%, and increases in the trough drawing forces of 27.8%, 12.1%, and 14.8%, respectively. Apparently, the presence of cement significantly increased the forces between the fiber and soil, especially in the case of the low-compaction soil samples. This is because the added high-strength cement hydration products can increase the cohesion between the fiber and soil and improve the compactness of the soil by filling the voids between soil particles.
The pullout curves of the coarse polypropylene fiber in the low-compaction cemented Xi’an and Sanya soil samples also presented obvious multi-peak patterns. The crest and trough drawing forces gradually declined, further pulling the fiber out. However, there were differences between the cemented soil samples and the plain soil samples in the variation laws of the pullout curve wavelength. First, the cemented soil samples had greater Class-1 wavelengths ( λ 1 ), but their Class-2, Class-3, and Class-4 wavelengths declined by higher amplitudes and deviated greatly from the theoretical wavelength of the coarse polypropylene fiber itself (4 mm). The reason is that cement hydration products can significantly increase the cohesion and occlusal force between fibers and soil particles, and therefore, to debond from the soil and slide in it, the fiber needs to overcome greater forces. The addition of cement hydration products was equivalent to increasing the fiber wavelength. This explains why the pullout curve Class-1 wavelength of the cemented soil was greater than that of the plain soil and the intrinsic wavelength of the fiber. On the other hand, when the fiber overcomes greater forces to debond from the soil and slide in it, it is also subjected to greater reactive forces and worn to larger extents. As a result, the pullout curve wavelength of the cemented soil declined by a higher amplitude with the continuous pullout of the fiber [28,29].
Figure 18 shows the meso-morphology of a worn coarse polypropylene fiber (a: fiber morphology after being broken, where the fiber is pulled out after sample breakage and shows wear signs on the surface; b: fiber morphology after being pulled out, where the worn surface has many adherent soil particles, and the exposed filaments are also clearly visible).

3.3.2. Cemented Korla Soil

Effect of Curing Period

Figure 19 and Table 6 show that the crest and trough drawing forces gradually increased with the curing period. Still, different amplitudes increased the crest and trough drawing forces of different classes. Specifically, the Class-1 and trough drawing forces increased greatly, but the Class-2 and Class-3 crest and trough drawing forces increased slightly. When the curing period was extended from 1 d to 7 d and then to 14 d, the Class-1 crest drawing forces increased by 19.2% and 16.1%, and the Class-1 trough drawing forces increased by 48.1% and 82.5%, respectively. In contrast, the Class-2 crest drawing forces increased by 20.9% and 8.6%, and the Class-2 trough drawing forces increased by 64.7% and 17.9%, respectively. This is because extending the curing period gradually increases the strength of cement hydration products and the cohesion between fibers and soil. When the fiber under tension debonds from the soil and slides in it, the cohesion between the fiber and the soil is impaired. When the fiber is further pulled out, the cohesion declines significantly compared to its status before the fiber sliding.

Effect of Cement Content

Figure 20 and Table 6 show that the crest and trough drawing forces gradually increased with increasing cement content. Still, different amplitudes increased the crest and trough drawing forces of the different classes. Specifically, the Class-1 and Class-2 crest and trough drawing forces were more significant than the Class-3 crest and trough drawing forces. When the cement content increased from 4% to 8% and then to 12%, the Class-1 crest drawing forces increased by 18.4% and 41.7%, and the Class-1 trough drawing forces increased by 29.0% and 165.0%, respectively. In contrast, the Class-2 crest drawing forces increased by 26.6% and 55.6%, and the Class-2 trough drawing forces increased by 133.3% and 96.4%, respectively. The Class-3 crest drawing forces increased by 82.1% and 25.5%, and the Class-3 trough drawing forces increased by 240% and 5.9%, respectively. Increasing the cement content mainly increased hydration products. It enlarged the anchorage zone formed by the fiber and the surrounding soil, increasing the cohesion between the fiber and soil. Meanwhile, more hydration products resulted in a higher compaction degree between soil particles, in which case the fiber had to overcome greater forces to debond from the soil and slide in it and would also be subjected to greater reactive forces [30,31]. At Class 3, the fiber and soil wavy structures were worn, so the blocking effect was also greatly weakened.

Effect of Compaction Degree

According to Figure 21 and Table 6, the crest and trough drawing forces on the pullout curves of the fiber in the samples increased with increasing compaction degree, no matter whether it was Class 1, 2, or 3. When the compaction degree was raised from 85% to 90% and then to 95%, the Class-1 crest drawing forces increased by 128.3% and 48.8%, and the Class-1 trough drawing forces increased by 21.7% and 42.9%, respectively. In contrast, the Class-2 crest drawing forces increased by 122.7% and 65.3%, and the Class-2 trough drawing forces increased by 50% and 55.6%, respectively. The Class-3 crest drawing force increased by 46.7% and 131.8%, and the Class-3 trough drawing force increased by 75% and 142.9%, respectively. Raising the compaction degree mainly enlarged the contact area between the fiber and soil. It significantly increased the sliding friction and occlusal force between them, especially for the wavy fibers such as the coarse polypropylene fiber. The results further suggest that compaction degree plays a vital role in the reinforcing effect of fibers and should be strictly controlled according to design requirements during construction.

Analysis of the Pullout Curves

Figure 22 shows the typical pullout curves of the fiber in the cemented Korla soil samples, where “a” denotes a KC2c1 d2 sample representative of the low-compaction sample group and “b” denotes a KC2c3 d2 sample representative of the high-compaction sample group. It can be seen that the pullout curves of the cemented Korla soil samples have unsmooth and non-obvious wavy shapes compared to those of the low-compaction cemented Xi’an and Sanya soil samples, especially the low-compaction sample group (KC2c1 d2). This indicates that the fiber experienced discontinuous or abrupt sliding during pullout from the cemented Korla soil samples. The reason is that, for the Korla soil (a sandy soil with extremely low cohesion between plain soil particles), the main forces blocking the debonding and sliding of the fiber in the soil are the occlusal force and sliding friction. In contrast, the contact area between the fiber and soil particles is small for low-compaction samples, and the occlusal force and sliding friction applied by soil particles on the fiber are also small. Hence, the pullout curves of the low-compaction samples seem to be unsmooth.
Figure 23 shows the typical morphology of the coarse polypropylene fiber pulled out from the cemented Korla soil samples, where “a” denotes a KC2c1 d2 sample representative of the low-compaction sample group and “b” denotes a KC3c3 d2 sample representative of the high compaction sample group. The fiber pulled out from low-compaction samples has a wear-free surface with a few soil particles on its surface. On the contrary, the fiber pulled out from the high-compaction samples is seriously worn, and many soil particles are on its surface. The results suggest that the features of the interfacial effect between the fiber and soil particles can be significantly improved by technical routes (such as raising the compact degree and increasing the cement content), thus further enhancing the reinforcing effect of the fiber.

3.4. Single-Fiber Pullout Tests on Fine Polypropylene Fiber-Reinforced Cemented Soil

Regarding the fine polypropylene fiber-reinforced cemented soil sample, it was found that the coarse polypropylene fiber in the Xi’an and Sanya soil samples was pulled off and could not be pulled out. On the contrary, the coarse polypropylene fiber in the Korla soil samples could be successfully pulled out without breakage. Thus, the single fiber pullout tests analyzed only the Korla soil samples, as detailed in Table 7.
It was found in the single fiber pullout tests that, due to its random distribution in the fine polypropylene fiber-reinforced cemented soil samples, the coarse polypropylene fiber showed high variability in its crest drawing forces during pullout. Because of the great difficulty to meet the requirement of C v < 6% in tests, the limit was ultimately loosened to 12%. See the variation laws of the crest and trough drawing forces with fine polypropylene fiber content in Figure 24.
As can be seen from Figure 24 and Table 7, with the increase in the fine polypropylene fiber content, the variation laws of the Class-1, Class-2, and Class-3 crest and trough drawing forces on the pullout curves are not very obvious and show high discreteness, which is partially attributable to the adjustment of the limit of the coefficient of variation in the tests. However, the Class-1 crest presented an apparent regularity. Compared to the ordinary cemented soil samples, those reinforced by fine polypropylene fiber showed apparent increases in the Class-1 crest drawing forces, with basically linear amplitude. As a result of the increased fine polypropylene fiber content, the Class-1 crest drawing forces gradually increased as well. This is probably due to the random distribution of the fine polypropylene fiber in the cemented soil. In addition, the uniformity of fiber distribution also significantly affects the test results.
Figure 25 shows the typical pullout curves of the coarse polypropylene fiber in the fine polypropylene fiber-reinforced Korla cemented soil samples, KM1 sample represent the sample group with low fine polypropylene fiber content and KM3 sample represent the sample group with high fine polypropylene fiber content. It can be seen that the pullout curves of KM1 and KM3 have consistent shapes and are smoother than those of the cemented soil samples. The Class-2 crest and trough drawing forces dropped more significantly, and the multi-peak patterns of the pullout curves are more obvious with increasing fiber content.
The increase in the Class-1 crest drawing forces after adding fine polypropylene fiber into cemented soil can be explained as follows: the coarse polypropylene fiber used in the tests is wavy. The sliding of the fiber in the soil is blocked mainly by the sliding friction, occlusal force, and the cohesion between the fiber and the soil. Given that Korla soil has minimal cohesion between plain soil particles, adding cement can create an anchorage zone around the fiber, equivalent to enhancing the cohesion between the fiber and soil [32]. When added to fine polypropylene fiber, its “bridging” effect can reorganize the dispersed fiber into a spatial network structure, and link cemented soil into an integral whole, thus effectively enhancing soil integrity. This is equivalent to enlarging the anchorage zone around the coarse fiber, in which case the coarse fiber needs to overcome greater forces to debond from the soil and slide in it. With the hardening of the cement, the position of the fine polypropylene fiber in the cemented soil also becomes fixed. The blocking effect greatly declines after the debonding and sliding of the coarse polypropylene fiber [33]. Figure 26 shows the typical morphology of the coarse polypropylene fiber pulled out from a fine polypropylene fiber-reinforced Korla cemented soil sample. We can observe the fine polypropylene fiber brought out by the coarse polypropylene fiber and the exposed filaments and adherent soil particles on the worn surface of the coarse fiber.

3.5. Analysis of the Features of the Reinforcement–Soil Interfacial Effect Based on Micro and Meso-Images

Adding coarse and fine fibers significantly improved the compressive strength, tensile strength, integrity, wear resistance, and cracking resistance of plain and cemented soil samples. However, the reinforcing effects of coarse and fine fibers varied between plain and cemented soils, with the cemented soil exhibiting a more pronounced enhancement. To better understand these reinforcing effects, we conducted micro- and meso-level observations of the fiber-reinforced plain and cemented soil samples, analyzing the characteristics of the interfacial reinforcement–soil impact based on these observations.

3.5.1. The Reinforcement–Soil Interfacial Effect in Plain Soil

Figure 27 shows the micromorphology and meso-morphology of the coarse and fine polypropylene fiber in plain soil. It can be seen that there were many adherent soil particles on the surface of fine polypropylene fiber in soil, especially the Xi’an and Sanya soil (both are soils with numerous clayey particles). In general, the reinforcing effect of fine polypropylene fiber in plain soil is realized mainly through the friction and cohesion between the fiber and soil. That is, when the fiber is about to slide in soil under tension, the two forces will exert a blocking effect on it. In the case of the coarse polypropylene fiber with a special wavy structure, the forces applied on it in soil not only include friction and cohesion but also include the occlusal force between it and the soil. The fine polypropylene fiber dispersed in the soil is interwoven into a web or a spatial network structure. The network structure creates an interlocking effect between soil particles, thus limiting the dislocation between the fiber and soil particles and enhancing soil strength and integrity. However, due to the small interparticle cohesion, neither the spatial network structure nor the interlocking effect between soil particles is very stable. The application of a large force will cause the fiber to slide, resulting in the rearrangement of the fiber and soil particles [34].
Plain soil has a loose spatial structure and large relative spaces between soil particles, so the friction and cohesion between the fiber and soil are small. The large pore structures in plain soil also make it difficult to give full play to the reinforcing effect of the wavy structure of coarse polypropylene fiber. The results of the coarse polypropylene fiber pullout tests show that the compaction degree greatly affected the crest drawing forces, and the variations in the compaction degree influenced the spaces between the fiber and the soil particles (i.e., the closeness of bonding between them). For the three kinds of soil (Xi’an soil, Sanya soil, and Korla soil), the gradual decrease in the crest drawing forces resulted from reduced cohesion.

3.5.2. The Reinforcement–Soil Interfacial Effect in Cemented Soil

Figure 28 shows the micromorphology of the fine polypropylene fiber in cemented soil. It can be seen that the fiber surface has massive cement hydration products characterized by extremely high bonding strength. The adherence of cement hydration products is equivalent to increasing the cohesion between the fiber and soil, as vividly manifested by the substantial increase in the crest drawing forces.
Moreover, cement hydration releases a lot of heat, which might soften the fiber. Increased hydration products might also exclude the fiber. Under the combined action of the two aspects, the previously smooth fiber surface became uneven (Figure 28b). The elongated and flaky crystals produced by cement hydration could even pierce into the fiber. The emergence of uneven pits is equivalent to increasing the friction coefficient of the fiber, which further increased the friction and occlusal force between the fiber and the soil.
The wrapping of fiber by massive cement hydration products produced a layer of high-strength cement crystals on the fiber’s surface, which is equivalent to enhancing the strength and stiffness of the fiber, as shown in Figure 29a. When applied with forces, the fiber wrapped by crystals could effectively spread these forces to the peripheral zones, thus reducing the stress concentration, delaying the occurrence of cracks, and improving bearing capacity. The generation of cement hydration products in large quantities also effectively filled the voids between the soil particles, improved the compactness of the soil, enlarged the contact area between the fiber and the soil, and increased the friction and occlusal force between the fiber and the soil. When the crystals wrapping the fiber connected with the cement hydration products in the peripheral zones of the fiber, an anchorage zone was created around the fiber, as shown in Figure 29b. The anchorage zone had high strength and posed a great resistance to the rearrangement of the fiber and soil particles. Apart from the soil, the fiber had to overcome this “anchoring force”. The scope of the anchorage zone was wider than the area of the fiber’s surface, so it greatly increased the forces blocking fiber sliding and effectively inhibited the formation and propagation of cracks, thus enhancing the ductility of the cemented soil. In some cases, the blocking forces even exceeded the tensile strength of the fiber, which explains why the coarse polypropylene fiber in the cemented Xi’an and Sanya soil samples was broken in the pullout tests.

4. Conclusions

(1) A horizontal direct tensile/pullout tester and its matching sample preparation mold were designed. It was found that the tester and the mold could be used to satisfactorily conduct direct tensile tests and pullout tests on plain soil, cemented soil, and fiber-reinforced cemented soil samples. Data were automatically acquired in this study to reduce interferences from human factors.
(2) Coarse polypropylene fiber pullout tests were conducted on plain soil, cemented soil, and fine polypropylene fiber-reinforced cemented soil for three kinds: Xi’an soil, Sanya soil, and Korla soil. Coarse polypropylene fiber was pulled out from the plain soil and low-compaction cemented soil samples of the Xi’an and Sanya soil and from the plain soil, cemented soil, and fiber-reinforced cemented soil samples of the Korla soil but pulled off in the other cases.
(3) The coarse polypropylene fiber presented obvious multi-peak patterns. The pullout curve wavelength was closely related to the intrinsic wavelength of the fiber. The pullout curve of the Class-1 wavelength of the fiber pulled out from the plain soil samples was the same as the intrinsic wavelength of the, while that of the fiber pulled out from the cemented soil samples was slightly more significant than the intrinsic wavelength of the fiber. The Class-2 and higher-class fiber wavelengths pulled out from the plain soil samples and those of the fiber pulled out from the cemented soil samples both gradually declined. The Class-2 and higher-class fiber wavelengths pulled out from the cemented soil samples dropped more quickly by a higher amplitude.
(4) The peak drawing force of the coarse polypropylene fiber could be increased by extending the curing period, increasing the cement content, raising the compaction degree, and adding fine polypropylene fiber. Among these measures, raising the compaction degree significantly enhanced the features of the soil–fiber interfacial effect. In particular, for sandy soils with extremely small cohesion between plain soil particles, such as the Korla soil, the compaction degree should be strictly controlled according to design requirements during construction.
(5) The friction and cohesion between the fiber and the soil and the interweaving of the fiber into a web exerted interlocking effects on the soil particles, further blocking fiber sliding in the soil. The heat released by cement hydration and the extrusion by hydration products caused deformation in the fiber, producing an occlusal force between the fiber and the soil and increasing the fiber’s sliding resistance. The wrapping of fiber by massive cement hydration products not only enhanced the strength and stiffness of the fiber but also effectively spread the forces applied to the fiber to the peripheral zones. Massive cement hydration products also filled the voids between the soil particles, improved the compactness of the soil, enlarged the contact area between the fiber and the soil, and increased the friction and occlusal force between the fiber and the soil.

Author Contributions

Conceptualization, D.X.; methodology, D.X. and J.Z.; validation, D.X. and W.X.; formal analysis, D.X. and J.W. (Jiang Wang); investigation, D.X. and N.Q.; data curation, D.X. and J.W. (Juan Wu); writing—original draft preparation, D.X.; writing—review and editing, D.X. and J.Z.; visualization, H.L. and B.Q.; project administration, D.X. and Z.Y.; funding acquisition, D.X. and J.Z. All authors have read and agreed to the published version of the manuscript.

Funding

This study was funded by National Natural Science Foundation of China (Grant No.52308470 and No.11972374); National Key R & D Program of China (2022YFC3102902); Natural Science Basic Research Program of Shaanxi (2023-JC-YB-375); Shaanxi Province Key R&D Plan Project (Grant No.2022SF-084).

Data Availability Statement

The data that support the findings of this study are available from the corresponding author upon reasonable request.

Acknowledgments

Thanks to all those who have contributed to this paper. The authors appreciate the anonymous reviewers for providing valuable comments and suggestions that helped improve the paper.

Conflicts of Interest

The authors declare no conflicts of interest.

References

  1. Hu, C.; Weng, X.Z.; Liu, C.; Jiang, L.; Liu, J.Z.; Li, W.L. Performance of polypropylene fiber-reinforced solidified soil. Adv. Civ. Eng. 2021, 202, 8859358. [Google Scholar] [CrossRef]
  2. Zhang, J.; Xu, W.; Weng, X.Z.; Gao, P.W.; Yao, Z.H.; Su, L.H.; Wang, J. Application and research status of concrete canvas and its application prospect in emergency engineering. J. Eng. Fibers Fabr. 2020, 15, 1558925020975759. [Google Scholar]
  3. Anderton, G.L.; Berney, I.V.; Emest, S.; Mann, T.A.; Newman, J.K.; Baylot, E.A.; Mason, Q. Joint Rapid Airfield Construction (JRAC) 2007 Technology Demonstration (No. ERDC/GSL-TR-08-17); US Army Engineer Research and Development Center, Geotechnical and Structures Lab: Vicksburg, MS, USA, 2008. [Google Scholar]
  4. Tingle, J.S.; Grogan, W.P. Behavior of unsurfaced airfields supporting operations of C-17 aircraft. J. Transp. Eng. 1999, 125, 75–84. [Google Scholar] [CrossRef]
  5. Zhang, J.; Weng, X.Z.; Liu, J.Z.; Yang, B.H.; Wen, X.P.; Wang, T. Anti-slip and wear resistance performance of three novel coatings as surface course of airstrip. Int. J. Pavement Eng. 2018, 19, 370–378. [Google Scholar] [CrossRef]
  6. Rushing, T.W.; Howard, I.L. Prediction of soil deformation beneath temporary airfield matting systems based on full-scale testing. J. Terramechanics 2015, 58, 1–9. [Google Scholar] [CrossRef]
  7. Zhang, J.; Weng, X.Z.; Liu, J.Z. Strength and water stability of a fiber-reinforced cemented loess. J. Eng. Fibers Fabr. 2018, 13, 72–83. [Google Scholar] [CrossRef]
  8. Ghavami, K.; Toledo Filho, R.D.; Barbosa, N.P. Behaviour of composite soil reinforced with natural fibres. Cem. Concr. Compos. 1999, 21, 39–48. [Google Scholar] [CrossRef]
  9. Zhao, Y.Y.; Yang, Y.; Ling, X.Z.; Gong, W.M.; Li, G.Y.; Su, L. Dynamic behavior of natural sand soils and fiber reinforced soils in heavy-haul railway embankment under multistage cyclic loading. Transp. Geotech. 2021, 28, 100507. [Google Scholar] [CrossRef]
  10. Diambra, A.; Ibraim, E. Modelling of fibre–cohesive soil mixtures. Acta Geotech. 2014, 9, 1029–1043. [Google Scholar] [CrossRef]
  11. Xu, J.; Wu, Z.P.; Chen, H.; Shao, L.T.; Zhou, X.G.; Wang, S.H. Triaxial shear behavior of basalt fiber-reinforced loess based on digital image technology. KSCE J. Civ. Eng. 2021, 25, 3714–3726. [Google Scholar] [CrossRef]
  12. Tang, C.S.; Wang, D.Y.; Cui, Y.J.; Shi, B.; Li, J. Tensile strength of fiber-reinforced soil. J. Mater. Civ. Eng. 2016, 28, 04016031. [Google Scholar] [CrossRef]
  13. Kafodya, I.; Okonta, F. Effects of natural fiber inclusions and pre-compression on the strength properties of lime-fly ash stabilised soil. Constr. Build. Mater. 2018, 170, 737–746. [Google Scholar] [CrossRef]
  14. Letelier, G.A.; Riedel, J.C.; Antico, F.C.; Sandoval, C.S. Experimental mechanical-damage assessment of earthen mixes reinforced with micro polypropylene fibers. Constr. Build. Mater. 2019, 198, 762–776. [Google Scholar] [CrossRef]
  15. Anagnostopoulos, C.A.; Tzetzis, D.; Berketis, K. Shear strength behaviour of polypropylene fibre reinforced cohesive soils. Geomech. Geoengin. 2013, 87, 241–251. [Google Scholar] [CrossRef]
  16. Jalali, J.; Noorzad, R. Discrete fiber reinforcement efficiency in the mechanical properties and wet-dry performance of fat clay treated with industrial sewage sludge ash. Constr. Build. Mater. 2021, 284, 122739. [Google Scholar] [CrossRef]
  17. Zhu, H.H.; Zhang, C.C.; Tang, C.S.; Shi, B.; Wang, B.J. Modeling the pullout behavior of short fiber in reinforced soil. Geotext. Geomembr. 2014, 42, 329–338. [Google Scholar] [CrossRef]
  18. Estabragh, A.R.; Soltani, A.; Javadi, A.A. Models for predicting the seepage velocity and seepage force in a fiber reinforced silty soil. Comput. Geotech. 2016, 75, 174–181. [Google Scholar] [CrossRef]
  19. Lirer, S.; Flora, A.; Consoli, N.C. On the strength of fibre-reinforced soils. Soils Found. 2011, 51, 601–609. [Google Scholar] [CrossRef]
  20. Hejazi, S.M.; Sheikhzadeh, M.; Abtahi, S.M.; Zadhoush, A. Shear modeling of fiber reinforced soil composite on the base of fiber pull-out test. Fibers Polym. 2013, 14, 277–284. [Google Scholar] [CrossRef]
  21. Festugato, L.; da Silva, A.P.; Diambra, A.; Consoli, N.C.; Ibraim, E. Modelling tensile/compressive strength ratio of fibre reinforced cemented soils. Geotext. Geomembr. 2018, 46, 155–165. [Google Scholar] [CrossRef]
  22. Tang, C.-S.; Shi, B.; Zhao, L.-Z. Interfacial shear strength of fiber reinforced soil. Geotext. Geomembr. 2010, 28, 54–62. [Google Scholar] [CrossRef]
  23. Ruan, B.; Ding, H.; Teng, J.; Deng, W.; Zheng, S.; Ruan, C. Mechanical Properties and Microstructure of Polypropylene Fiber Reinforced Cement Mortar Soil. KSCE J. Civ. Eng. 2021, 25, 1985–1997. [Google Scholar] [CrossRef]
  24. Lang, L.; Li, J.; Chen, X.; Han, L.; Wang, P. Tensile strength behavior of cement-stabilized dredged sediment reinforced by polypropylene fiber. Front. Struct. Civ. Eng. 2024, 18, 380–392. [Google Scholar] [CrossRef]
  25. Zhang, C.C.; Zhu, H.H.; She, J.K.; Zhang, D.; Shi, B. Quantitative Evaluation of Optical Fiber/Soil Interfacial Behavior and Its Implications for Sensing Fiber Selection. IEEE Sens. J. 2014, 15, 3059–3067. [Google Scholar] [CrossRef]
  26. JTG 3430-2020; Code for Geotechnical Testing of highway. Ministry of Transport of the People’s Republic of China: Beijing, China, 2020.
  27. Zhang, J.; Xu, W.; Gao, P.; Yao, Z.; Su, L.; Qiu, N.; Huang, W. Compressive strength characteristics of hybrid fiber-reinforced cemented soil. Int. J. Pavement Eng. 2023, 2, 2104843.24. [Google Scholar] [CrossRef]
  28. Lenoir, T.; Preteseille, M.; Ricordel, S. Contribution of the fiber reinforcement on the fatigue behavior of two cement-modified soils. Int. J. Fatigue 2016, 93, 71–81. [Google Scholar] [CrossRef]
  29. Yan, C.G.; An, N.; Wang, Y.C.; Sun, W.F. Effect of dry-wet cycles and freeze-thaw cycles on the antierosion ability of fiber-reinforced loess. Adv. Mater. Sci. Eng. 2021, 2021, 8834598. [Google Scholar] [CrossRef]
  30. Yang, B.H.; Weng, X.Z.; Liu, J.Z.; Kou, Y.N.; Jiang, L.; Li, H.L.; Yan, X.C. Strength characteristics of modified polypropylene fiber and cement-reinforced loess. J. Cent. South Univ. 2017, 24, 560–568. [Google Scholar] [CrossRef]
  31. Tang, C.S.; Li, J.; Wang, D.Y.; Shi, B. Investigation on the interfacial mechanical behavior of wave-shaped fiber reinforced soil by pullout test. Geotext. Geomembr. 2016, 44, 872–883. [Google Scholar] [CrossRef]
  32. Ferreira, S.R.; Andrade, R.G.M.; Koenders, E.; Silva, F.A.; Fairbairn, E.M.R.; Filho, R.D.T. Pull-out behavior and tensile response of natural fibers under different relative humidity levels. Constr. Build. Mater. 2021, 308, 124823. [Google Scholar] [CrossRef]
  33. Zhang, C.C.; Zhu, H.H.; Shi, B.; Wu, F.D.; Yin, J.H. Experimental investigation of pullout behavior of fiber-reinforced polymer reinforcements in sand. J. Compos. Constr. 2014, 19, 04014062. [Google Scholar] [CrossRef]
  34. Li, C.; Zornberg, J.G. Mobilization of reinforcement forces in fiber-reinforced soil. J. Geotech. Geoenviron. Eng. 2013, 139, 107–115. [Google Scholar] [CrossRef]
Figure 1. Morphologies of the three kinds of soil.
Constrmater 04 00044 g001
Figure 2. Morphologies of fibers [27].
Constrmater 04 00044 g002
Figure 3. Direct tensile/pullout tester designed.
Constrmater 04 00044 g003aConstrmater 04 00044 g003b
Figure 4. Sample preparation mold. (a) Mold frame and bottom spacer; (b) dimensions of the mold frame and the upper spacer used in the direct tensile tests for sample preparation; (c) physical photo of the spacer used in the pullout tests for sample preparation; (d) dimensions of the spacer used in the pullout tests for sample preparation.
Constrmater 04 00044 g004aConstrmater 04 00044 g004b
Figure 5. Morphology of the 3# spacer and the process of fiber embedding.
Constrmater 04 00044 g005
Figure 6. The overall sample preparation process.
Constrmater 04 00044 g006aConstrmater 04 00044 g006b
Figure 7. Fiber morphology and diameter measurement.
Constrmater 04 00044 g007
Figure 8. Force analysis on the fiber in soil.
Constrmater 04 00044 g008
Figure 9. Two typical morphologies in the fiber pullout tests.
Constrmater 04 00044 g009
Figure 10. Two typical pullout curves of fiber.
Constrmater 04 00044 g010
Figure 11. Pullout curve wavelength and determination of the fiber wavelength.
Constrmater 04 00044 g011
Figure 12. Different morphologies of fiber wear.
Constrmater 04 00044 g012
Figure 13. The relationship between the crest and trough drawing forces on the pullout curves.
Constrmater 04 00044 g013
Figure 14. Morphological comparison of the uneven pits before and after fiber pullout.
Constrmater 04 00044 g014
Figure 15. Two different breakage morphologies of the fiber.
Constrmater 04 00044 g015
Figure 16. Variation laws of the crest and trough drawing forces with compaction degree on the pullout curves.
Constrmater 04 00044 g016
Figure 17. Typical pullout curves of the coarse polypropylene fiber in the low-compaction cemented Xi’an and Sanya soil.
Constrmater 04 00044 g017
Figure 18. Meso-morphology of worn fiber.
Constrmater 04 00044 g018
Figure 19. Variation laws of the crest and trough drawing forces with the curing period on the pullout curves of the fiber in the cemented Korla soil.
Constrmater 04 00044 g019
Figure 20. Variation laws of the crest and trough drawing forces with cement content on the pullout curves of the fiber in the cemented Korla soil.
Constrmater 04 00044 g020
Figure 21. Variation laws of the crest and trough drawing forces with compaction degree on the pullout curves of the fiber in the cemented Korla soil.
Constrmater 04 00044 g021
Figure 22. Typical pullout curves of the fiber in the cemented Korla soil samples.
Constrmater 04 00044 g022
Figure 23. Typical morphology of a fiber pulled out from the cemented Korla soil.
Constrmater 04 00044 g023
Figure 24. Variation laws of the crest and trough drawing forces with fiber content in fine polypropylene fiber-reinforced Korla cemented soil.
Constrmater 04 00044 g024
Figure 25. Typical pullout curves of the coarse polypropylene fiber in the fine polypropylene fiber-reinforced Korla cemented soil.
Constrmater 04 00044 g025
Figure 26. Typical morphology of the fiber pulled out from the fine polypropylene fiber-reinforced Korla cemented soil.
Constrmater 04 00044 g026
Figure 27. Micromorphology and meso-morphology of the coarse and fine polypropylene fiber in plain soil.
Constrmater 04 00044 g027
Figure 28. Micromorphology of fine polypropylene fiber in cemented soil.
Constrmater 04 00044 g028
Figure 29. Micromorphology of fine polypropylene fiber in cemented soil. (a) Image of a fiber wrapped by cement hydration products; (b) schematic diagram of the anchorage zone.
Constrmater 04 00044 g029
Table 1. Classification of the three types of soil.
SoilLiquid Limit/%Plastic Limit/%Plasticity IndexClassification
Xi’an34.221.712.5Low liquid limit clay (CL)
Sanya66.531.435.1High liquid limit clay (CH)
Korla20.115.94.2Clay sand (SC)
Table 2. Technical parameters of the fibers.
Fiber TypeDiameter/μmStrength/MPaElastic Modulus/GPaDensity/(g/cm3)Elongation at Break/%
Fine polypropylene fiber30≥400≥3.50.9115~35
Coarse polypropylene fiber800≥530≥70.9515~17
Table 3. Technical parameters of the cement.
Cement GradeSetting Time/hFlexural Strength/MPaCompressive Strength/MPaFineness/%Standard Consistency Water Demand/%
InitialFinal3 d28 d3 d28 d
P·O 42.52.165.166.418.9429.751.71.627.5
Table 4. Sample combinations.
Sample CodesSoil TypeCompaction DegreesCement Contents/%Curing Period/dFiber Contents/%
XSc1plain soil85---
XSc290---
XSc395---
XC1c1d1cemented soil8541-
XC1c2d181-
XC1c3d1121-
XC1c1d247-
XC1c2d287-
XC1c3d2127-
XC1c1d3414-
XC1c2d3814-
XC1c3d31214-
XC2c1d19041-
XC2c2d181-
XC2c3d1121-
XC2c1d247-
XC2c2d287-
XC2c3d2127-
XC2c1d3414-
XC2c2d3814-
XC2c3d31214-
XC3c1d19541-
XC3c2d181-
XC3c3d1121-
XC3c1d247-
XC3c2d287-
XC3c3d2127-
XC3c1d3414-
XC3c2d3814-
XC3c3d31214-
XM1Fine polypropylene fiber-reinforced cemented soil95870.1
XM20.2
XM30.3
Table 5. Statistics of the crest and trough drawing forces on the pullout curves of the fiber in plain soil.
Soil SampleCompaction Degree/%CodeWaveform ClassClass 1/NClass 2/NClass 3/N
Crest and TroughMean σ Mean σ Mean σ
Xi’an soil85%XSc1Crest653.25341.727.51.38
Trough15.50.93100.450.3
90%XSc2Crest733.65422.1341.02
Trough281.1221.51.2917.51.05
95%XSc3Crest875.1521.49392.25
Trough32.50.93251.4724.51.15
Sanya soil85%SSc1Crest351.7517.51.05140.56
Trough13.50.54100.58.50.43
90%SSc2Crest47.52.3824.50.9819.51.17
Trough181.0815.50.9312.50.63
95%SSc3Crest591.7730.50.92251
Trough181.0816.50.8313.50.81
Korla soil85%KSc1Crest------
Trough------
90%KSc2Crest------
Trough------
95%KSc3Crest231.3813.50.828.50.52
Trough100.65.50.322.00.13
Table 6. Statistics of the crest and trough drawing forces on the pullout curves of the fiber in the cemented soil.
Soil SampleVariableCodeWaveform ClassClass 1/NClass 2/NClass 3/N
Crest and TroughMean σ Mean σ Mean σ
Xi’anCompaction degree85%XC2c1d2Crest134.58.0772.54.35603.60
Trough46.51.86240.9622.50.90
SanyaCompaction degree85%SC2c1d2Crest99.54.9850.52.53391.95
Trough231.3818.51.1115.50.93
KorlaCuring period1 dKC2c3d1Crest75.53.7833.51.6821.51.08
Trough13.50.818.50.3460.36
7 dKC2c3d2Crest904.5040.52.0325.50.77
Trough200.80140.848.50.51
14 dKC2c3d3Crest104.56.27441.3227.51.65
Trough36.51.1016.50.99170.85
Cement content4%KC1c3d2Crest763.80321.92140.56
Trough15.50.6260.302.50.13
12%KC3c3d2Crest127.56.38632.52321.92
Trough533.1827.51.6590.45
Compaction degree85%KC2c1d2Crest26.50.80110.337.50.30
Trough11.50.6960.3020.12
90%KC2c2d2Crest60.53.6324.51.23110.55
Trough140.7090.303.50.14
Table 7. Statistics of the crest and trough drawing forces on the pullout curves of the fiber in the fine polypropylene fiber-reinforced Korla cemented soil.
Fine Fiber Content/%CodeWaveform ClassClass 1/NClass 2/NClass 3/N
Crest and TroughMean σ Mean σ Mean σ
0.1KM1Crest100.510.05302.70131.43
Trough19.51.7670.7750.55
0.2KM2Crest1118.88323.8413.51.62
Trough13.51.498.50.941.50.17
0.3KM3Crest121.512.1536.53.29192.28
Trough262.3412.51.255.50.72
Disclaimer/Publisher’s Note: The statements, opinions and data contained in all publications are solely those of the individual author(s) and contributor(s) and not of MDPI and/or the editor(s). MDPI and/or the editor(s) disclaim responsibility for any injury to people or property resulting from any ideas, methods, instructions or products referred to in the content.

