
Article

Study on Rock Mechanics Response Characteristics of Through-Going Structures with Different Dip Angles

1
School of Resources and Safety Engineering, Central South University, Changsha 410083, China
2
School of Civil and Environmental Engineering, Changsha University of Science and Technology, Changsha 410083, China
*
Author to whom correspondence should be addressed.
Geotechnics 2026, 6(3), 78; https://doi.org/10.3390/geotechnics6030078
Submission received: 14 June 2026 / Revised: 14 August 2026 / Accepted: 19 August 2026 / Published: 25 August 2026

Abstract

Through-going structures are widely distributed in rock masses of underground engineering, and their dip angles act as the core factor affecting the stress field and mechanical response of surrounding rock. To reveal the mechanical mechanism of rock masses containing through-going structures with different dip angles, this study adopts a combined method of theoretical derivation, indoor model testing and numerical simulation. Firstly, a plane strain mechanical model is established to classify Tectonically-induced Stress, Residual Gravitational Stress and engineering-induced stress, and the theoretical formulas for stress components, stress residual coefficient and stress deflection angle are derived. Secondly, rock-like specimens with through-going structures of various dip angles are prepared and biaxial compression tests are carried out to monitor mechanical parameters such as surrounding rock strain and peak strength. Finally, a large-scale numerical model is built by FLAC2D (version 7.0) software to simulate the whole process of stress equilibrium and excavation unloading of rock mass under a normal stress of 20 MPa. Then the data of principal stress, stress components, stress residual coefficient and deflection angle under different dip angles are extracted. The results show that the dip angle of through-going structure exerts a prominent regulatory effect on the rock mass stress field. With the increase of the dip angle, the Tectonically-induced Stress decreases continuously while the Residual Gravitational Stress rises gradually. The variation trend of stress deflection angle is highly consistent with structural dip angle, and the influence of Residual Gravitational Stress on deflection angle is limited. Due to the differences in loading modes and model sizes between indoor tests and numerical simulations, the evolution laws of stress residual coefficient show opposite trends, but both results verify the dominant effect of structural dip angle. Combined with theoretical, experimental and numerical results, the proposed theoretical system can effectively describe the stress evolution law of rock masses with through-going structures, which provides theoretical reference and technical support for the stability analysis of surrounding rock in similar underground engineering.

1. Introduction

Through-going structural features are widely present in the rock masses of underground engineering. Their spatial distribution and occurrence characteristics have a significant constraining effect on the safety of rock mass excavation and the overall stability of the project [1]. Through-going structural features are usually defined as faults, large joints, weak interlayers and interlayer displacement zones with continuous strike and dip extension, which can completely penetrate the disturbed range of the engineering [2]. The rock mass connectivity rate of such structures is nearly 100%, and there is a lack of effective rock bridges within the rock mass. The rock mechanical properties are mainly controlled by the shear strength of the structural planes [3]. These features not only significantly deteriorate the overall mechanical properties of the rock mass but also easily become the dominant channels for groundwater seepage, rock deformation and failure. They are the key geological factors determining the stability of underground engineering and slope engineering [4].
With the continuous advancement of underground engineering projects such as mines and tunnels, the academic community’s research on the mechanical properties of engineering rocks has gradually deepened. Along with the iterative upgrading of geotechnical detection technologies and research analysis tools, the research on the mechanical mechanisms of rocks with different inclinations has been continuously improved, and the theoretical system and research level of structural mechanics have also achieved significant development [5,6]. The development of advanced detection technologies has effectively improved the identification accuracy and quantitative analysis level of continuous structures. The three-dimensional point cloud technology can automatically extract geometric parameters such as the inclination, trend, and roughness of structural planes, promoting the shift from manual recording to automated quantitative analysis in the investigation of rock mass structural planes [7,8]. Semi-automatic identification methods can enhance the efficiency and stability of extracting complex structural planes [9]. Non-contact technologies such as unmanned aerial vehicle photogrammetry and digital photogrammetry provide reliable means for the exploration of high and steep slopes, complex outcrops, and the continuity of rock mass structures [10,11]. Combined with deep learning algorithms, large-scale three-dimensional point clouds can also achieve refined identification of complex rock mass structural planes [12]. Microscopic studies have shown that the rough morphology, contact state, dilatation effect and damage evolution jointly control the mechanical response of continuous structures. Experiments have confirmed that the joint morphology, freeze-thaw damage, surface roughness and filling material characteristics will change the shear strength, tension-shear performance, crack stiffness, and permeability of the rock mass, and affect the characteristics of monitoring signals such as acoustic emission and temperature [13,14,15,16]. The use of acoustic emission parameters can distinguish the types of microcracks, providing support for analyzing the damage and failure mechanisms of structural planes [17]. On a macroscopic scale, the spatial distribution and combination forms of continuous structures such as faults, long-term joints and weak interlayers directly determine the stability of the excavated rock mass. Existing studies have shown that the mechanical parameters of structural planes, spatial variability and excavation unloading effects will induce various instability phenomena such as crack expansion, sliding, overturning, wedge failure and rock bridge fracture, which is also an important cause of non-continuous structural plane continuity [18,19,20,21,22]. Thus, macroscopic structural mechanics research is an important basis for evaluating the stability of rock masses [23]. Although relevant research on transverse structures has made progress at present, there are still shortcomings. Most studies focus on the shear characteristics of the structures, while insufficient attention has been paid to the exploration of the steady-state stress laws of rock masses under the regulation of the geological conditions. The theoretical system is not systematic enough, and the engineering application value of the microscopic research is limited.
The dip angle, as the core manifestation parameter of the through-going structure, has a particularly significant impact on the stress field and mechanical response characteristics of the engineering rock mass. Due to the cutting and disturbance caused by different dip angles of the through-going structure, the self-weight stress of the rock mass undergoes attenuation, deflection and distortion, resulting in a distinct anisotropic feature in the stress distribution of the engineering rock mass [24]. When the dip angle is small, the rock mass stress is prone to slide and accumulate along the structural plane, thereby triggering local shear instability failure. When the dip angle is in the medium range, the internal stress transmission path of the rock mass becomes more complex, leading to multi-dimensional stress redistribution effects. When the structure is nearly vertical, its influence on the deflection regulation of the main stress of the rock mass weakens, but it is likely to cause tensile cracking and tensile deformation failure of the structural plane [25,26,27,28]. In summary, the dip angle can effectively control the amplitude and spatial direction of the rock mass stress and dominate the evolution law and failure mechanism of the rock mass instability, being the core controlling factor affecting the stability of the engineering rock mass. This paper conducts a systematic theoretical analysis on the regulatory laws of the dip angle on the rock mass of the through-going structure and combines indoor physical experiments and numerical simulations to verify the core laws derived from theoretical analysis. The experimental and simulation results and theoretical analysis conclusions have a high degree of consistency.

2. Theoretical Analysis

2.1. Analysis of Model Generalization and Mechanism of Action

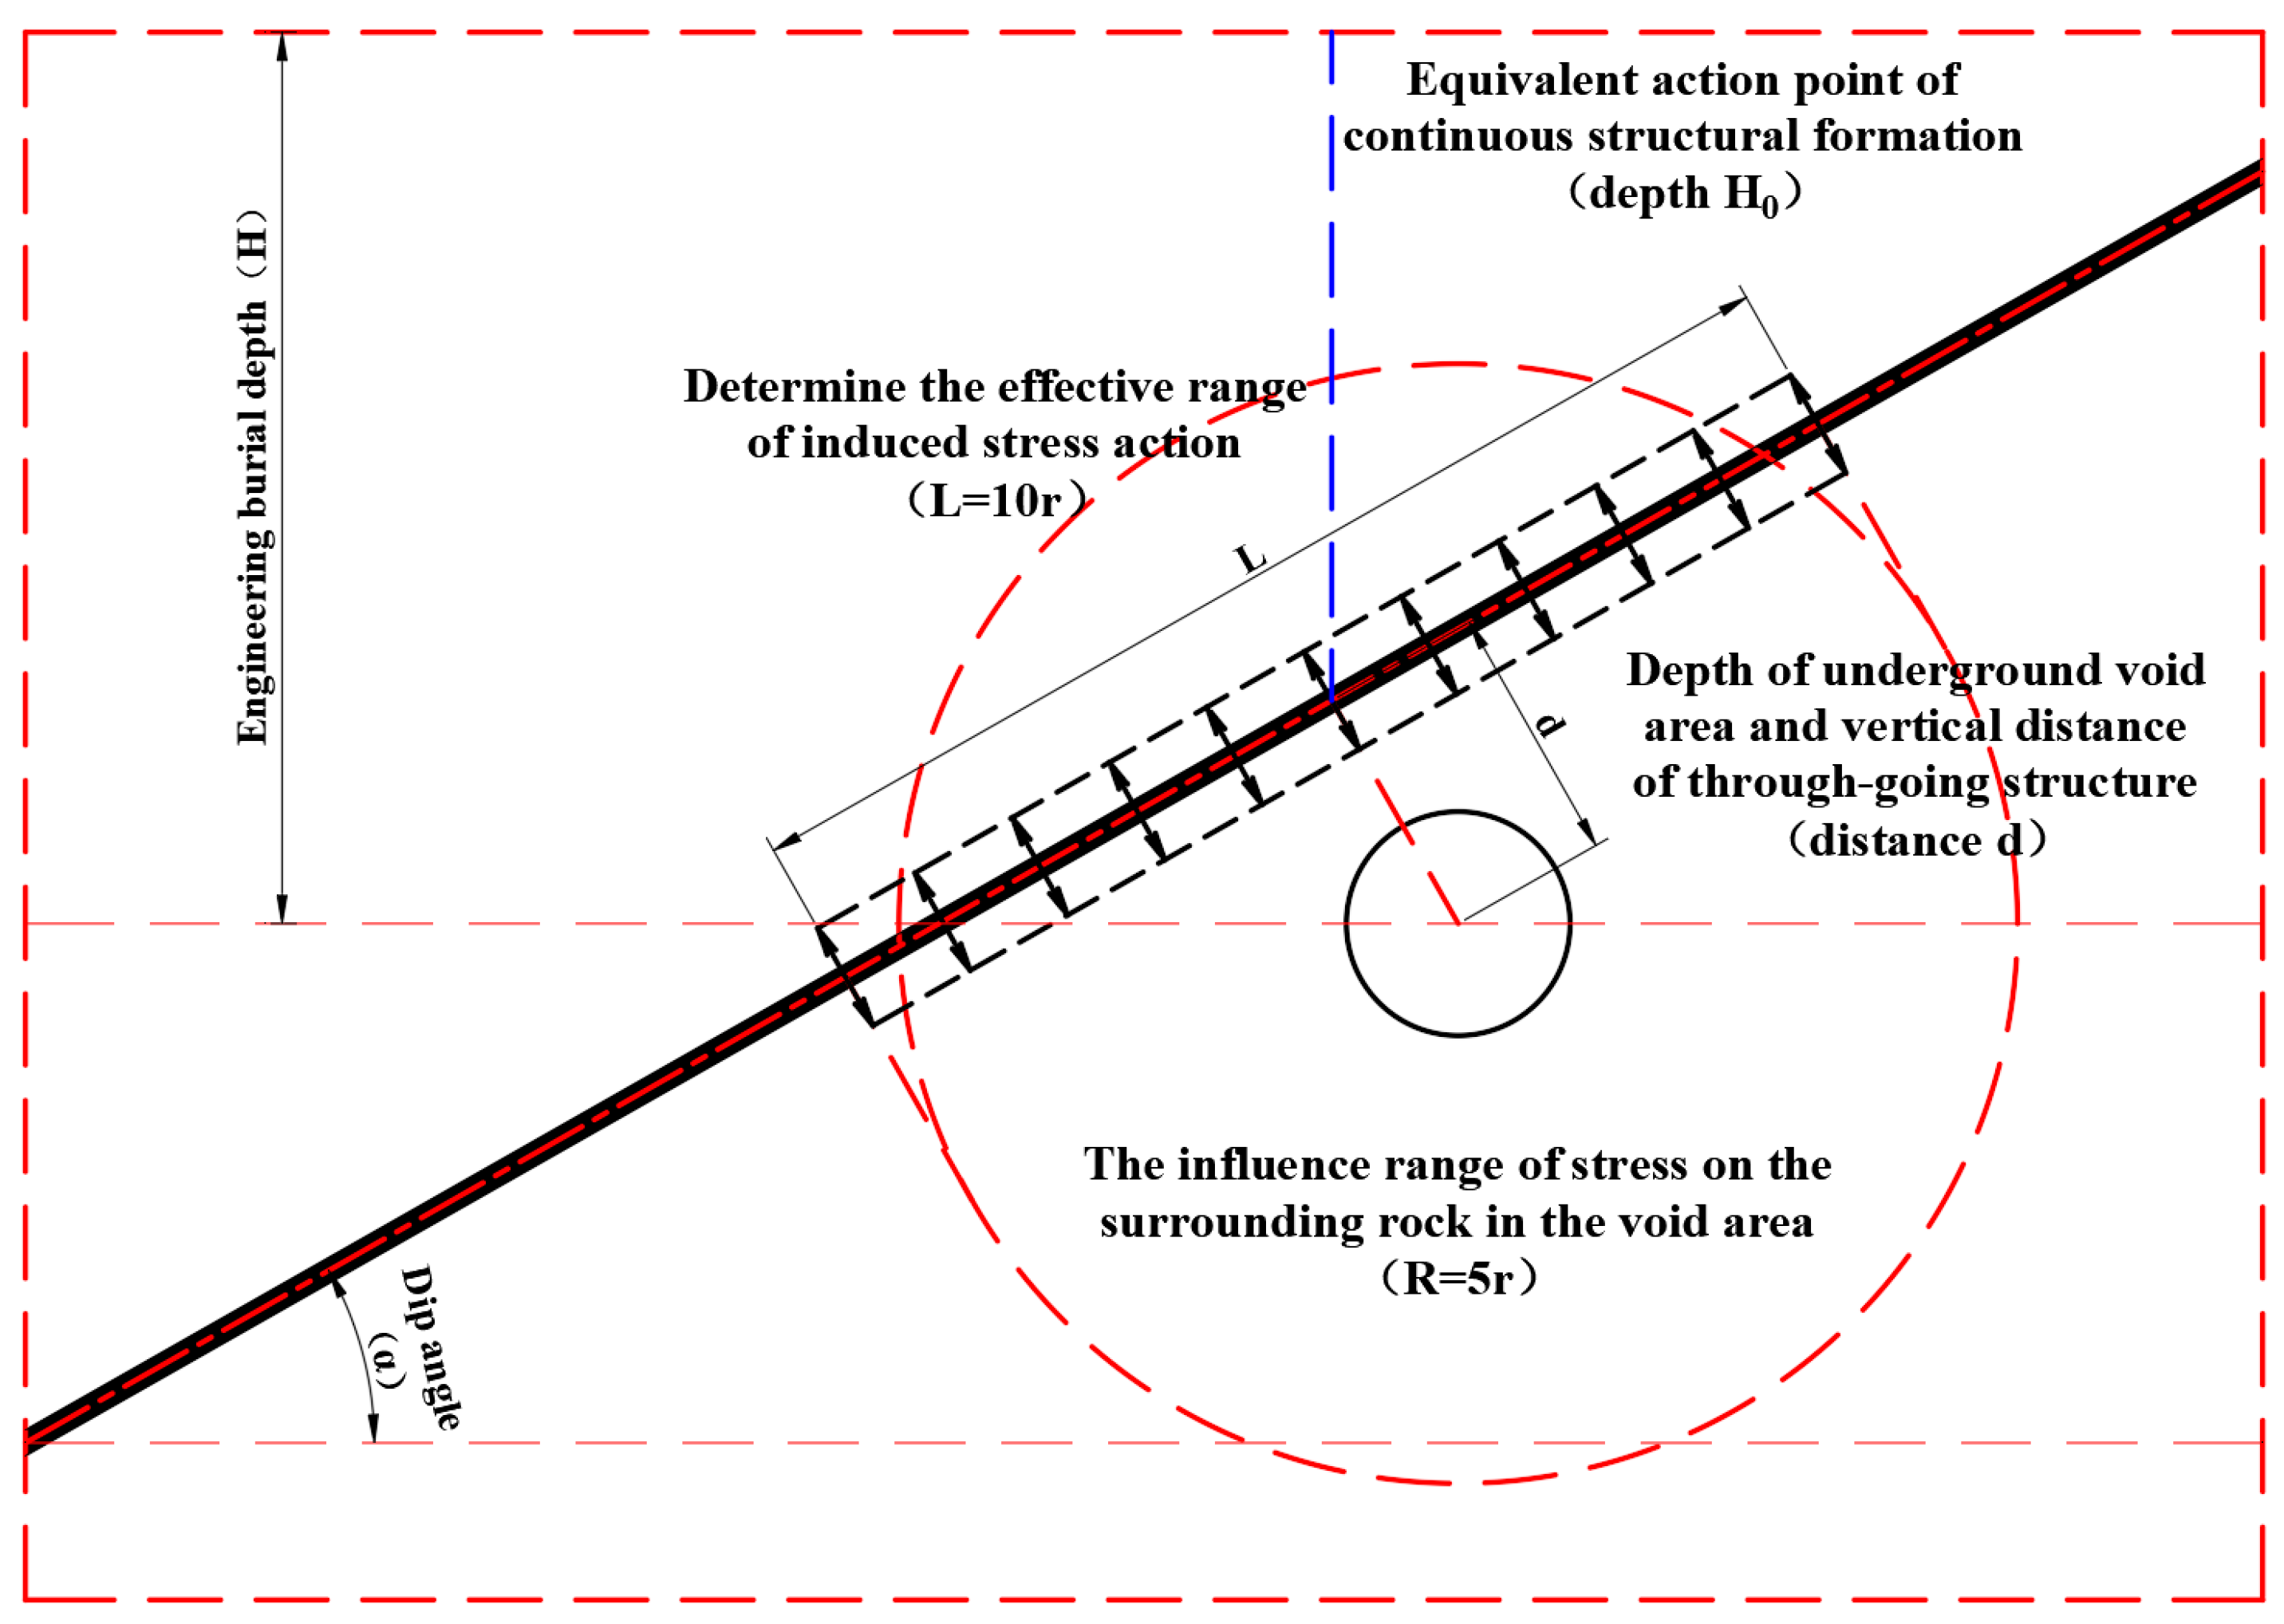
When conducting the engineering mechanics response analysis of rock masses with through-going structures, since the axial length of deep-buried tunnels and mine shafts is significantly greater than the cross-sectional size, the axial strain can be approximated as zero and the three-dimensional space mechanics problem can be reasonably simplified. Therefore, this paper generalizes the research object as a plane strain model. The specific model construction situation is shown in Figure 1. Under the premise of ignoring secondary influencing factors such as temperature and groundwater seepage, this paper focuses on exploring the original rock stress deflection, stress concentration and failure evolution laws within the excavation cross-section, effectively reducing the difficulty of theoretical derivation and numerical calculation. Based on this model, according to the change in stress transmission path caused by the through-going structures and the actual stress state caused by engineering excavation-induced unloading disturbance, this paper constructs a stress analysis framework with vector operation conditions, clearly distinguishing the three stress types: the stress induced by the structural morphology (Tectonically-Induced Stresses, σTIS), the residual self-weight stress remaining after being cut by the structure (Residual Gravitational Stress, σGR), and the engineering disturbance stress induced by excavation (Engineering-Induced Stresses, σEIS). Further mechanism analysis shows that the through-going structures, on the one hand, will cut the original rock structure and block the vertical transmission of self-weight stress, exhibiting significant stress isolation characteristics. On the other hand, they will change the stress propagation direction and form a directional force transmission effect along the structural plane, demonstrating obvious stress induction characteristics. The two mechanical effects interact with each other and couple with each other, becoming the core mechanism controlling the mechanical behavior of rock masses with through-going structures and the stability of surrounding rocks.
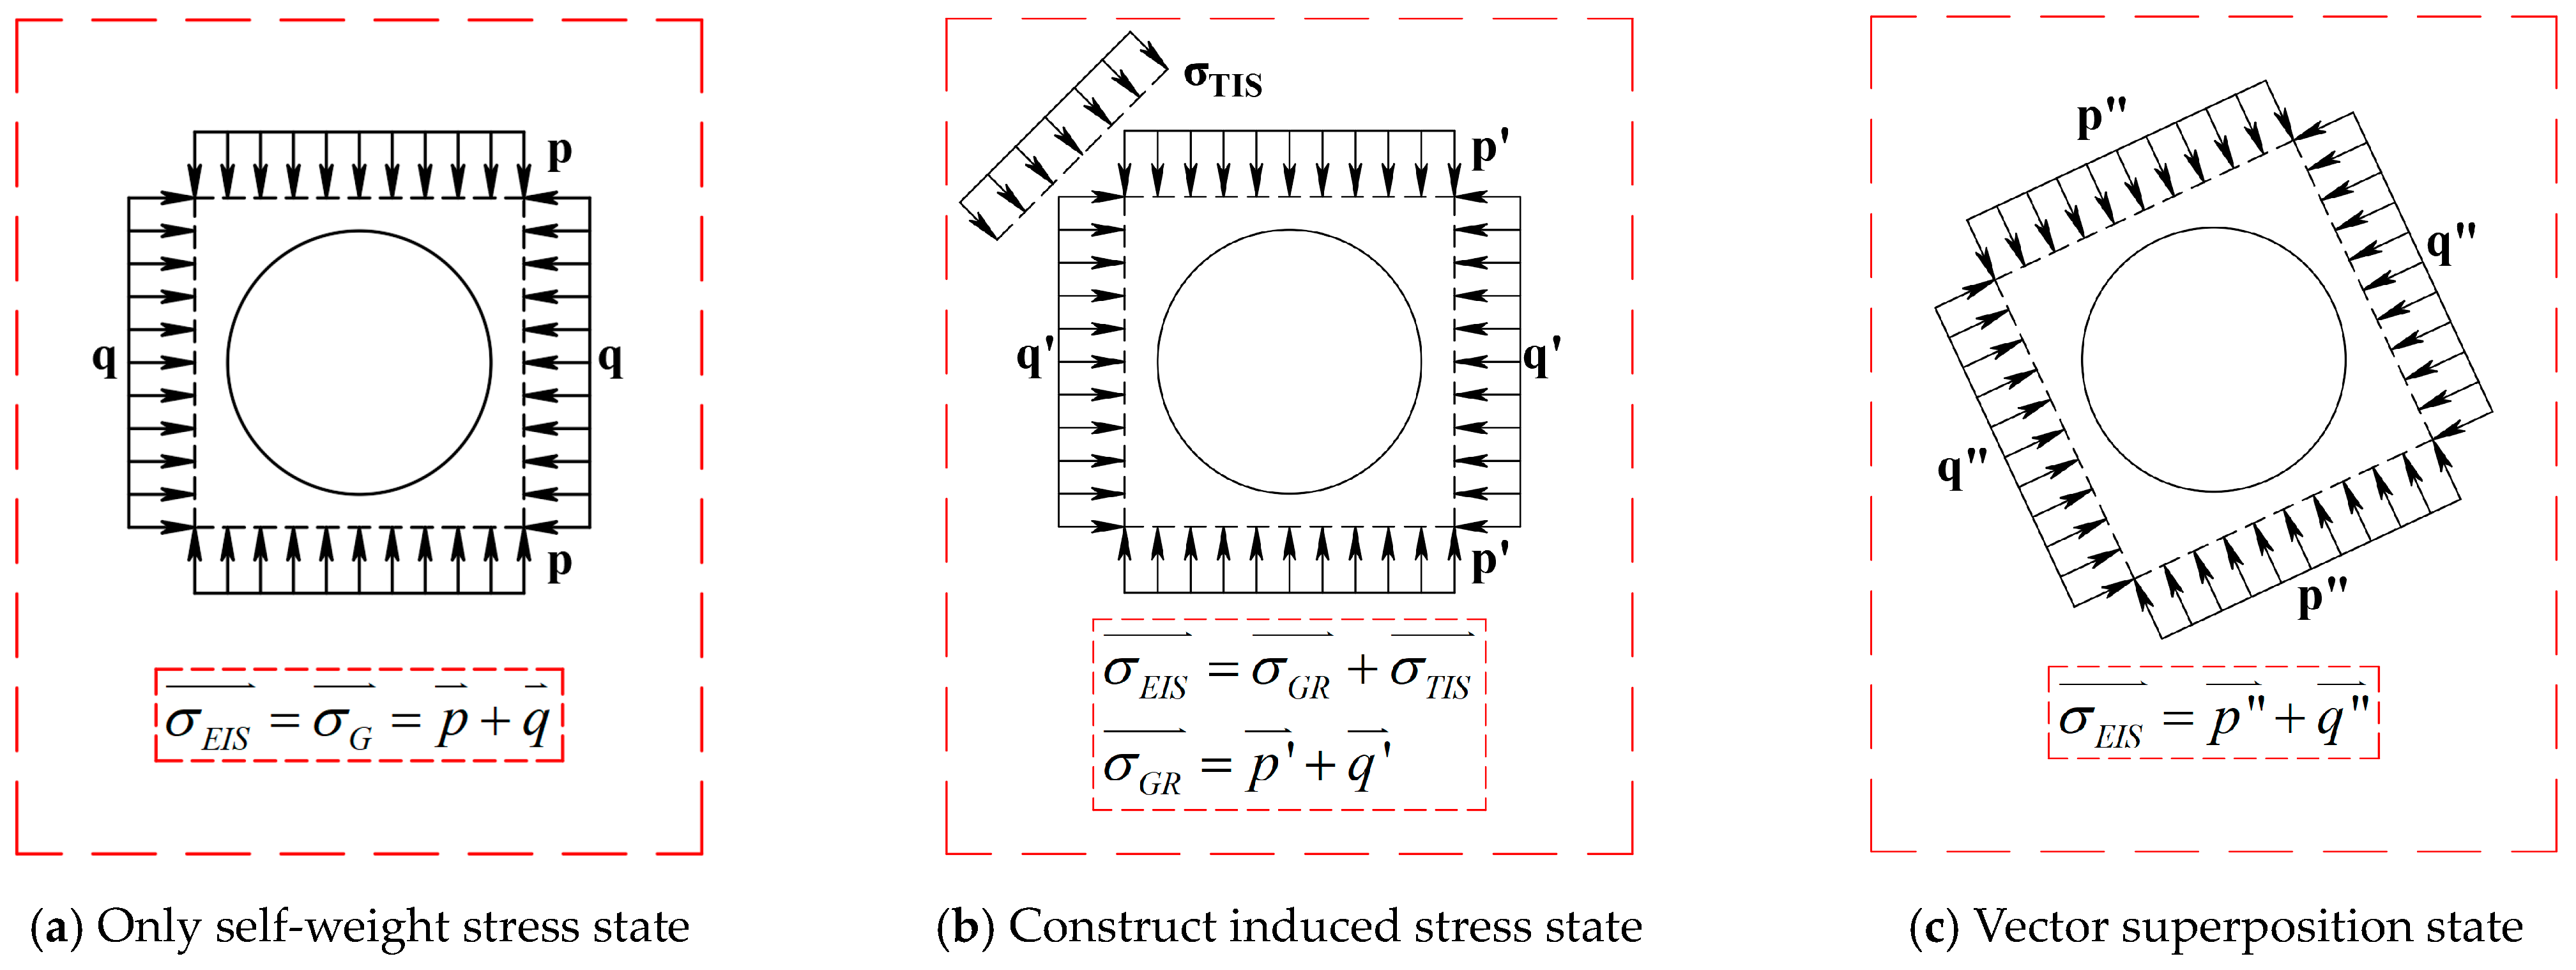
As shown in Figure 1, the engineering burial depth H, the rock weight γ, the structural dip angle α, the equivalent burial depth H0 and the spacing d are the main parameters that regulate the stress response of the rock mass. Since the rock weight is an inherent property of the rock mass, it will not be analyzed as a variable in this study. The rock mass above the engineering void zone is separated into two mechanical units by the penetrating structure, and the self-weight stress within different units exhibits completely different transmission patterns. The self-weight pressure of the rock mass on the upper side of the structure continuously acts on the structural plane of the structure. Under the joint regulation of the structural isolation effect and the inducing effect, the original self-weight stress deflects, dissipates and reconstructs, thereby forming the Tectonically-Induced Stresses, which are then transmitted along the extension direction of the structure to the surrounding rock of the engineering void zone. While the rock mass on the lower side of the structure is free from the disturbance influence of the penetrating structure, the self-weight stress maintains the original vertical transmission characteristics and directly acts on the periphery of the engineering void zone. This part of the stress presents as Residual Gravitational Stress. Thus, it can be seen that the initial stress state of the engineering surrounding rock is essentially the vector superposition of the induced self-weight stress and the residual self-weight stress. After the completion of the engineering excavation, the surrounding rock undergoes an unloading effect and forms Engineering-Induced Stresses. The combined stress field after superposition and the engineering disturbance stress balance each other, ultimately reaching a mechanical equilibrium state. The specific stress interaction relationship is shown in Figure 2. The above stress balance relationship can be characterized by Equation (1).
σ E I S = σ T I S + σ G R
σTIS—Tectonically-Induced Stresses. The additional stress component caused by deflection and redistribution of in-situ stress field controlled by the occurrence (dip angle, thickness) of a through-going weak structural zone. It is secondary stress induced by mechanical isolation and guidance of discontinuity, rather than tectonic stress directly exerted by regional tectonic movement. Its magnitude is highly dependent on structural dip angle, MPa. σGR—Residual Gravitational Stress. The residual gravity-originated stress component retained in the surrounding rock below the structural zone after original gravity stress transmits and dissipates across the through-going weak structure. It is generally lower than the theoretical gravity stress of intact rock mass due to stress dissipation within the structural band, MPa. σEIS—Engineering-Induced Stresses. Disturbance-induced additional stress triggered by excavation unloading of underground engineering. Excavation disturbs primary stress equilibrium and leads to stress transfer to and concentration in a nearby excavation boundary. For rock mass containing a through-going structure, it superimposes on Tectonically-induced Stress and gravity-residual stress to form the actual stress field around underground opening, MPa.
Figure 2. Schematic diagram of stress evolution in through-going structural rock mass.
Geotechnics 06 00078 g002

2.2. Theoretical Calculation and Analysis

From the generalized model in Figure 1, it can be seen that when the self-weight stress acts on the structural plane, it can be decomposed into two components: the normal component and the tangential component. The tangential component represents a shear effect, but the structural plane does not undergo displacement or relative movement. This part of the shear stress is only stored in the form of elastic potential energy within the structure and does not change the stress state of the engineering rock mass. The normal component is the Tectonically-Induced Stresses. Considering that the continuity of the structure will cause energy loss during the stress transmission process, this paper introduces the stress residual coefficient η to characterize the proportion of the stress remaining after the self-weight stress passes through the structure, excluding the isolation and induction effects, in order to quantify the stress attenuation effect caused by different structural orientations. Based on the above analysis, the calculation formula for the induced stress of the structure is derived, as shown in Equation (2).
σ T I S = η γ cos α H d cos α
η—Stress residual coefficient. It describes the degree of stress attenuation of self-weight stress after passing the through-going structure, and its magnitude directly affects the size of the Tectonically-Induced Stresses. γ—Unit weight of overlying rock mass, kN/m3. α—Dip angle of through-going structural zone, °. H—Vertical overburden depth of calculation point, m. d—Normal thickness of through-going structural zone, m.
Due to the isolation effect of the continuous structural system, most of the overlying rock mass’s self-weight is blocked. The expression of the Residual Gravitational Stresses corresponding to the upper part of the engineering void zone is shown in Equation (3).
σ G R = γ d cos α
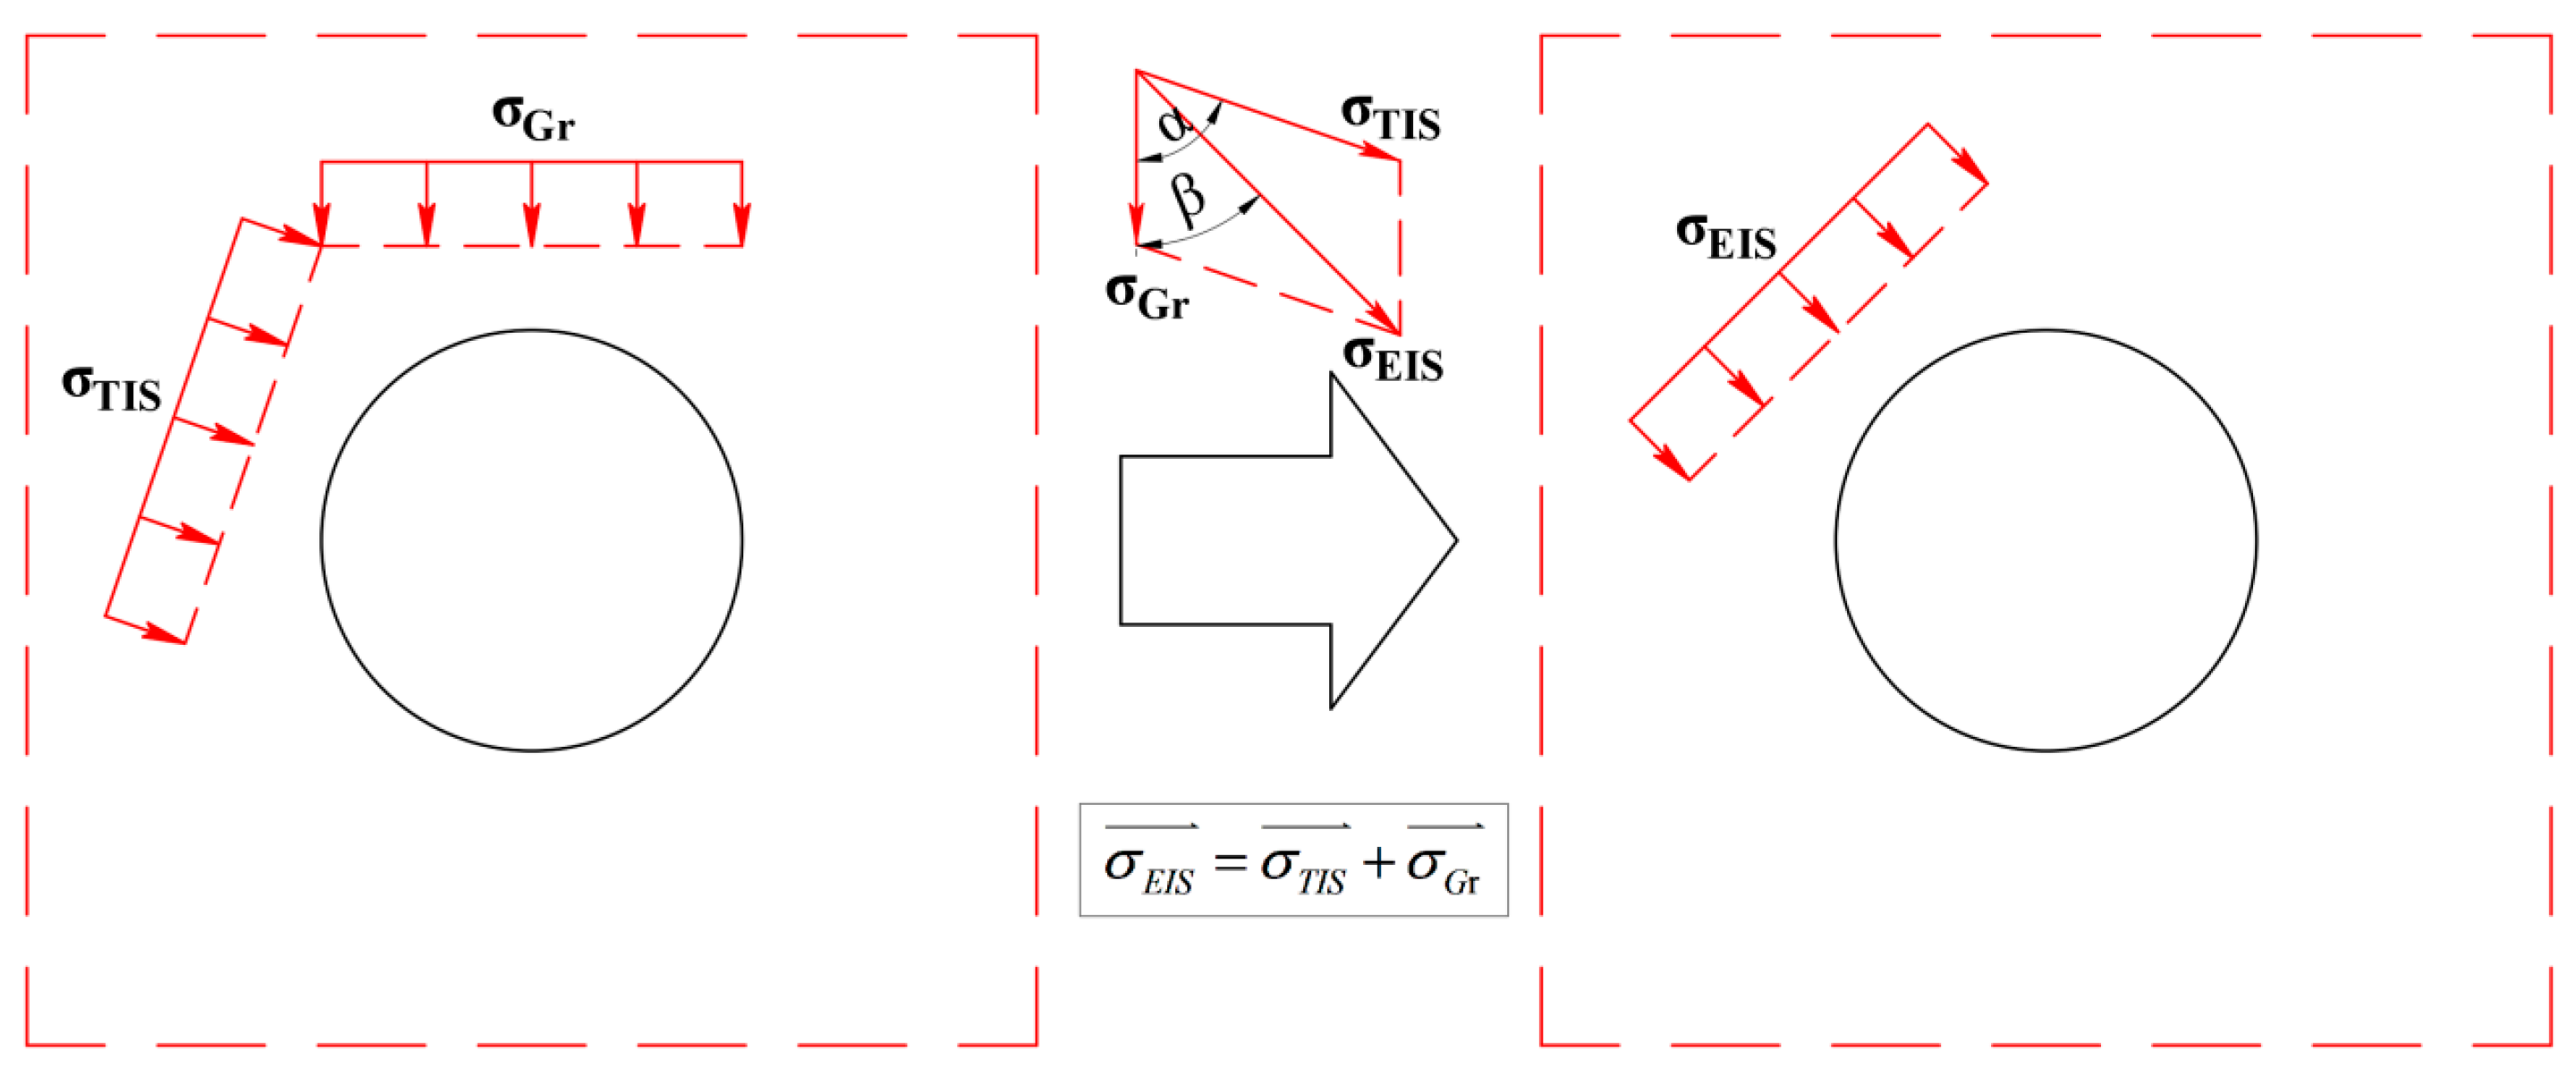
Based on the vector synthesis rule of Equation (1), Equations (2) and (3) are combined to obtain the amplitudes of the two types of stresses. The vector superposition in the horizontal and vertical directions is carried out for the Tectonically-Induced Stresses and the Residual Gravitational Stresses, respectively. The specific situation of the vector superposition calculation is shown in Figure 3.
According to the force balance condition of the rock mass, the vector expression of the Engineering-Induced Stresses is derived as shown in Equation (4).
σ E I S = η γ cos 2 α H d cos α , η γ sin α cos α H d cos α γ d 2 cos α
As shown in Figure 3, due to the influence of the through-going structure, the stress field of the engineering surrounding rock undergoes a rigid deflection, and this deflection angle is defined as β. By deriving based on Equation (4), the calculation expression of the deflection angle β is given by Equation (5).
β = arccot tan α d 2 η cos 3 α H d cos α
where β is the deflection angle of principal stress after stress redistribution. It is defined as the clockwise rotation angle from the vertical reference axis to the orientation of redistributed major principal stress, with a value range of 0° to 90°.
To support the subsequent experimental tests, numerical simulation calculations and verification work, this paper adopts the plane strain model and combines the classical analytical solution of Kirsch in elasticity mechanics to establish the functional relationship between the stress field and the circumferential stress of the hole, and conducts theoretical derivation. Finally, the correlation expression between the engineering disturbance stress and the circumferential stress of the hole is obtained, as shown in Equation (6).
σ θ = 1 + λ 1 + cos 2 θ σ E I S
λ—The lateral stress coefficient of the rock. θ—Angle of the position where the research is conducted, °.

2.3. Theoretical Analysis Conclusion

Combining vector synthesis calculation with theoretical analysis under the conditions of fixed continuity structure and engineering center spacing d and engineering burial depth H, the system based on Equations (4) and (5) systematically explored the influence law of structural dip angle on the stress field. The results show that the structural dip angle has a global regulatory effect on the rock mass stress field. As the dip angle gradually increases, the shear effect of the structural plane strengthens, the stress dissipation degree intensifies, and the Tectonically-Induced Stresses show a continuous attenuation trend. When the structure is in a gently dipping state, the stress amplitude reaches its peak, and the stress-induced effect is the most significant. When the structure changes to a steeply dipping state, the induced stress significantly decreases, and the corresponding effect is significantly weakened. The variation law of the Residual Gravitational Stresses is opposite to this. The greater the structural dip angle, the weaker the isolation effect on the upper rock mass, and the residual self-weight stress transmitted to the engineering surrounding rock continuously rises. Under the steeply dipping structure condition, the stress level of the surrounding rock basically approaches that of the intact homogeneous rock mass.
The Engineering-Induced Stresses are composed of the vector superposition of the Tectonically-Induced Stresses and the Residual Gravitational Stresses, and they present a distinct zonal characteristic under the coupling effect of dip angle. Under the condition of a gently dipping structure, the high-amplitude Tectonically-Induced Stresses dominate, the overall stress level of the surrounding rock is high, and the probability of shear instability of the rock mass significantly increases. In the middle dip structure interval, the two types of stress fluctuate, the stress distribution in the surrounding rock is complex and anisotropic, and the rock mass is prone to a composite failure form of shear and tension. Under the steeply dipping structure condition, the Residual Gravitational Stresses become the main controlling factor, the stress field gradually returns to the normal self-weight stress distribution form, but the structural plane is prone to deformation problems such as cracking and opening.
Furthermore, the stress deflection angle is significantly regulated by the structural dip angle, and the trends of their changes are highly consistent. The fundamental mechanical principle lies in the vector coupling effect between the Tectonically-Induced Stress and the Residual Gravitational Stress. The through-going structural plane breaks the isotropic distribution of the initial stress field, and the dominant direction of the Tectonically-Induced Stress is highly coupled with the structural dip angle. The Residual Gravitational Stress provides a vertical stress base constraint, and the vector synthesis of the two forces forces the principal stress direction to deviate toward the dominant direction of the structural plane. Eventually, a regular pattern characteristic of the co-evolution of the deflection angle and the structural dip angle is formed.

3. Test Method and Result Analysis

The indoor experiments can effectively test the theoretical framework of this paper and reproduce the stress response characteristics of the rock mass under static engineering conditions. The experiments adopt independent specimen parameters, loading procedures and monitoring systems, which are completely independent of and without data correlation with the subsequent numerical simulations. This method can not only independently verify the correctness of the theoretical derivation but also be compared and analyzed with the numerical simulation results.

3.1. Test Method

3.1.1. Specimen Model

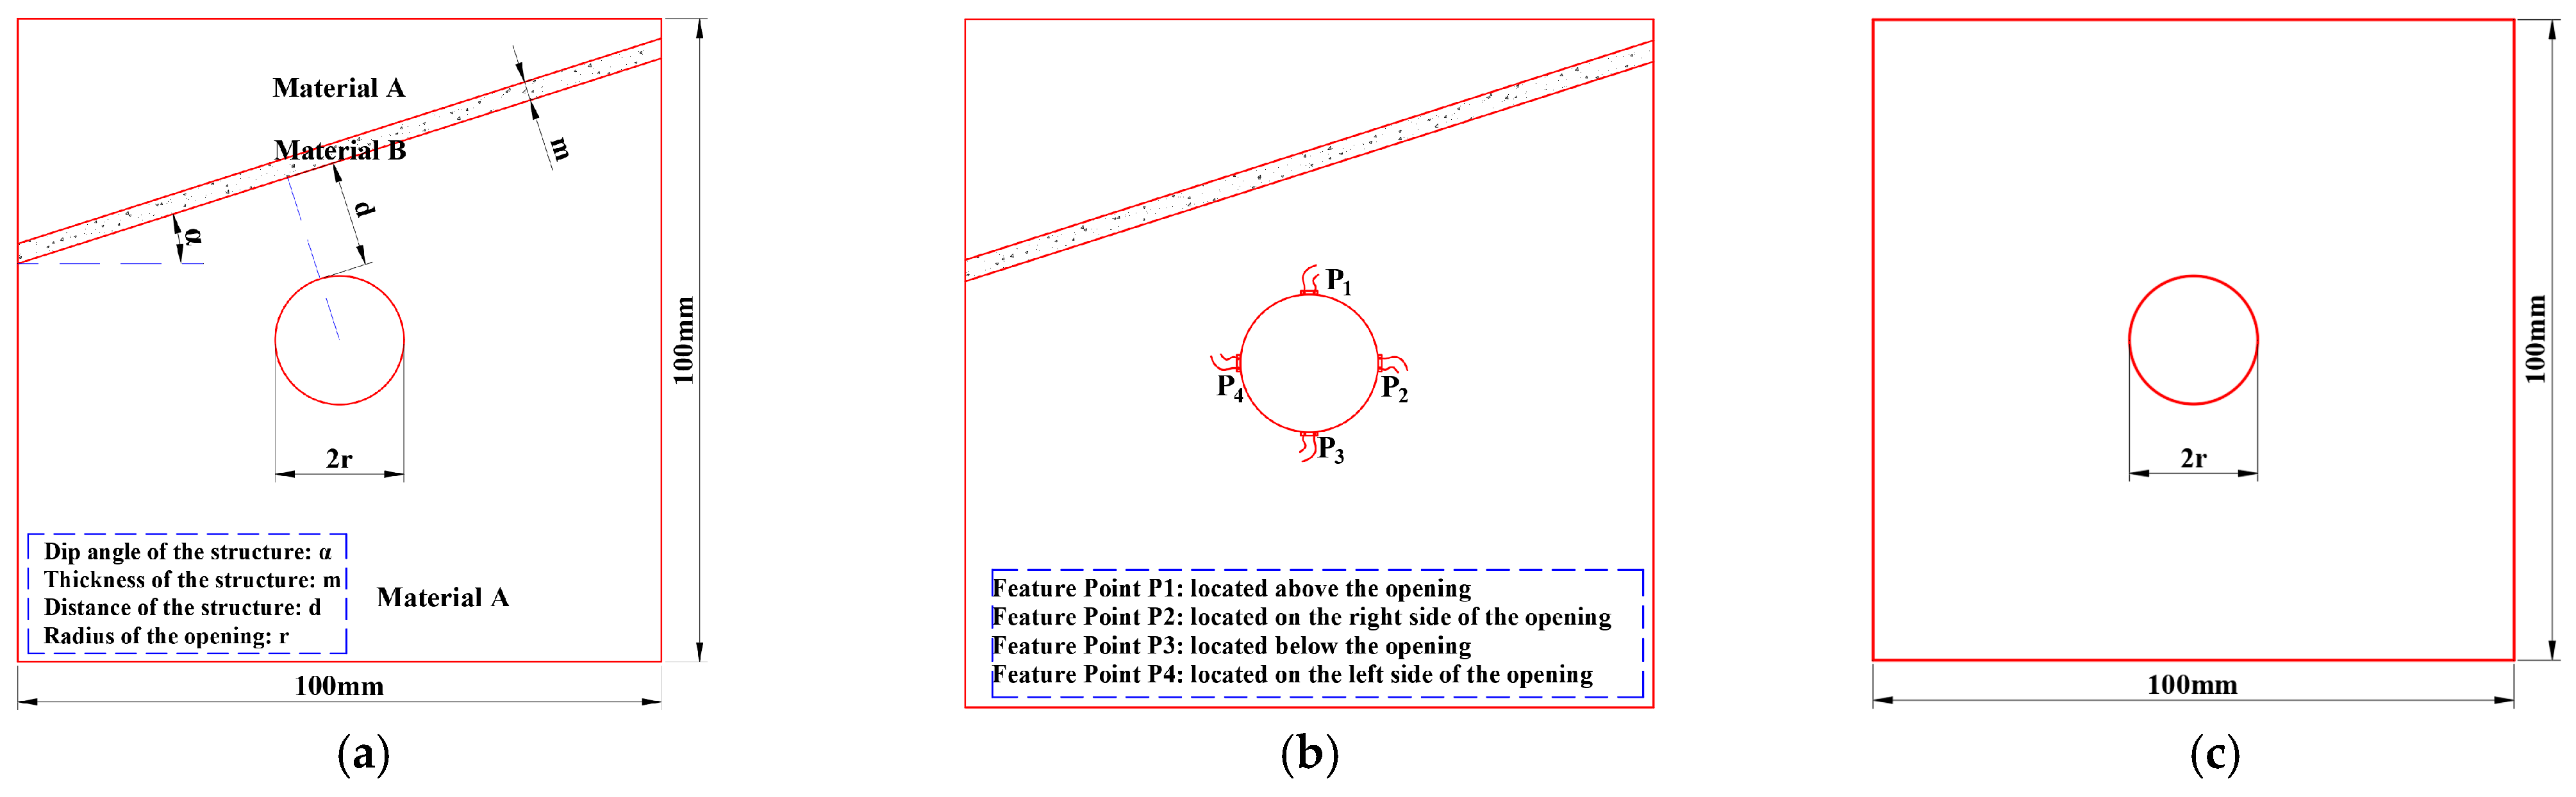
The specimen models used in the test are made of rock and rock-like materials. The rock material is the main part of the specimen, and the rock-like material is the internal filling of the prefabricated through-going structure. The two materials constitute the engineering rock mass specimen with through-going structures required for this test. With reference to the Standard for Test Methods of Engineering Rock Masses (GB/T50266-2013) [29], the specimen size is a 100 × 100 × 100 mm cubic model. The specimen model is prefabricated with a central cavity and prefabricated fractures penetrating the entire specimen to simulate engineering gobs and through-going structures, as shown in Figure 4. The influence range of stress changes caused by excavation should be 3 to 5 times the radius of the excavated engineering, so the prefabricated cavity radius r = 10 mm. The key parameters of prefabricated through-going structures are mainly structural dip angle (α) and structural location. The dip angles are set to 10°, 15° and 20°, and specimens without through-going structures are set as the control group. Meanwhile, to facilitate the analysis of the response mechanism of in-situ stress-confining pressure, four strain monitoring characteristic points are set at the upper, lower, left and right positions of the prefabricated cavity to monitor the circumferential strain of the cavity.

3.1.2. Filler Selection and Strength Test

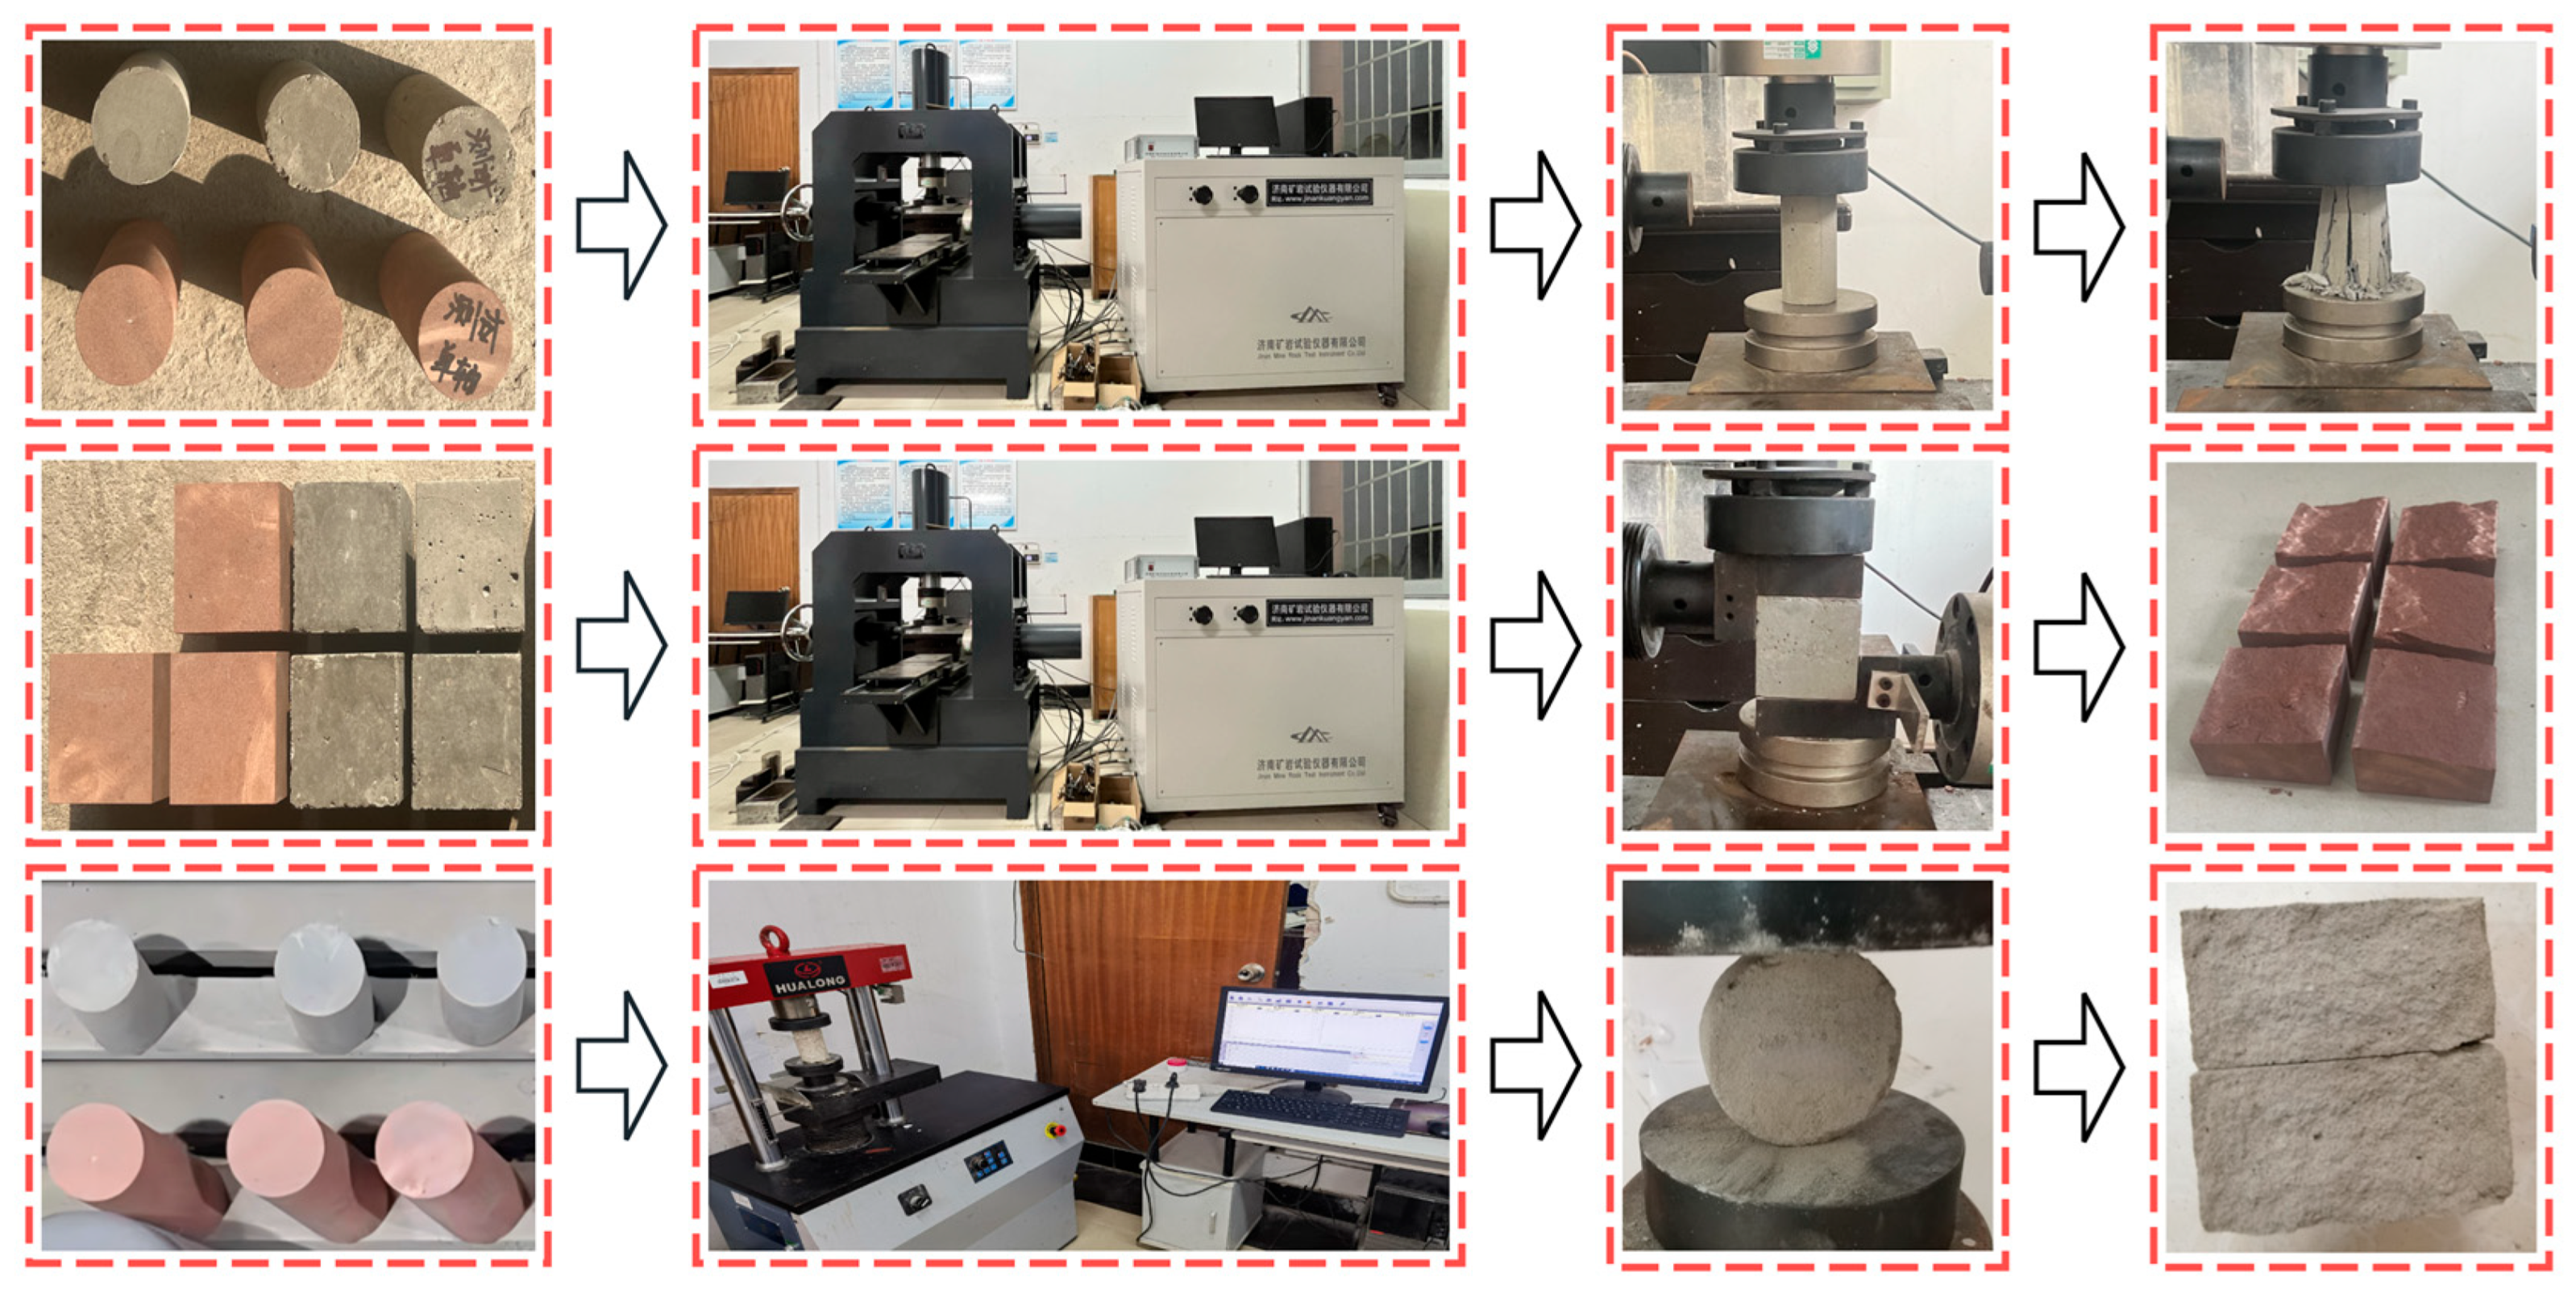
The basic model is constructed by prefabricating cavities and through-going structures in the test. The common fillings in structures in nature can be summarized as siliceous filling, argillaceous filling, calcareous filling and ferruginous filling. All types of fillings have cementing characteristics, and are mainly brittle with certain stiffness without the influence of groundwater. Considering the difficulty of sample processing and compressibility, red sandstone is used as the main material of the rock mass, and cement is used as the rock-like filling for filling through-going structures. The cement model selected for the test is P.O. 425 ordinary Portland cement, and pre-experiments are conducted to determine the cement slurry concentration with a water-cement ratio of 1:2.4. Meanwhile, to understand the mechanical characteristics of the basic materials, uniaxial compression tests, Brazilian splitting tests and shear tests are carried out on red sandstone and cement fillings using a YZW100 multi-functional direct shear apparatus and an SNA420 servo universal material testing machine. The test process is shown in Figure 5, and the basic parameters of red sandstone and cement cementitious materials are obtained as shown in Table 1.

3.1.3. Sample Processing and Preparation

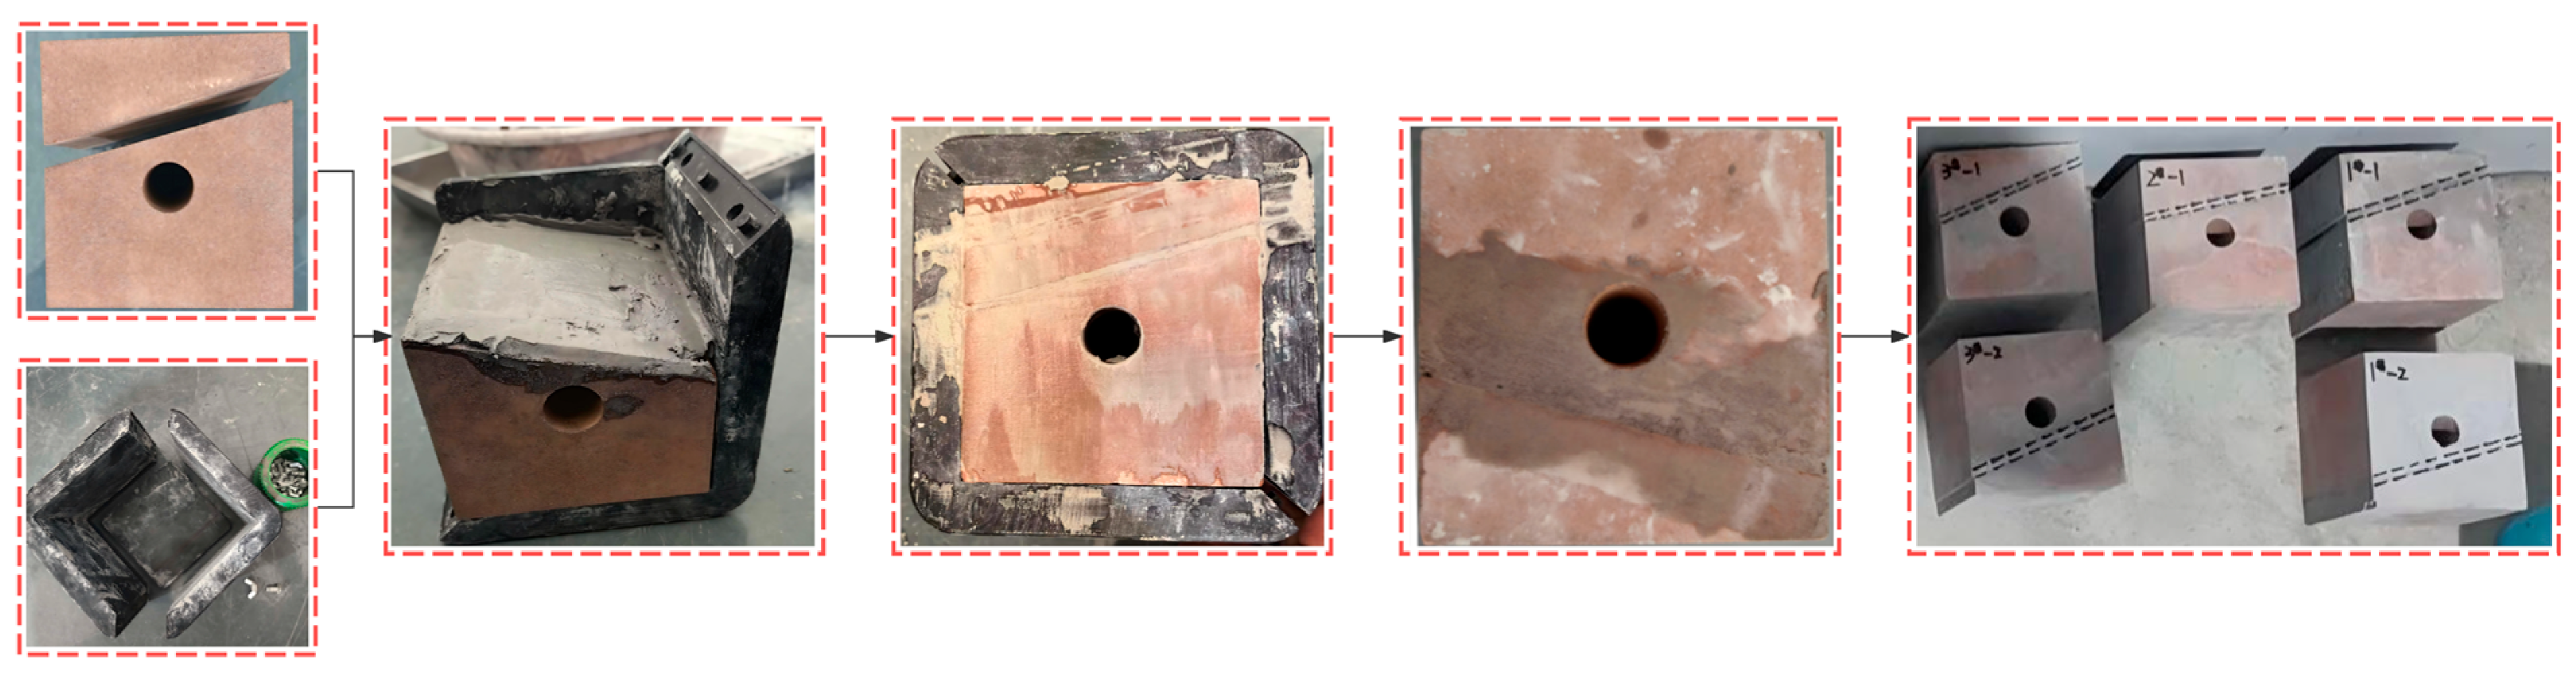
The red sandstone is cut according to the specific location, size and dip angle parameters of the preset structure. During the cutting process, it is necessary to ensure that the cutting surface is flat and the size error meets the test specifications. The cut red sandstone sample is placed into a mold (100 × 100 × 100 mm) and a grouting gap is reserved as designed. Before grouting, impurities in the gap must be cleaned to avoid affecting the bonding effect between the cement slurry and red sandstone specimen. Then, the prepared cement slurry is slowly injected into the gap and fully vibrated to fill the entire gap with cement slurry. The specimen is then left standing for 12 h to initially set the cement slurry, and demolded after standing. The demolded specimens are inspected for problems such as insufficient grouting, bubbles in the gap or cement slurry loss, and timely supplementary grouting is performed for insufficiently grouted specimens. After treatment, they are placed in a standard curing environment for 28 days with a curing humidity of 98%. After curing, strain gauges (BF120-1AA unidirectional strain gauges, technical parameters: nominal resistance 120 Ω, grid size 1 × 1 mm) are pasted at the preset characteristic monitoring positions on the front of the specimen to complete the preparation of the entire specimen, as shown in Figure 6.

3.1.4. Sample Test

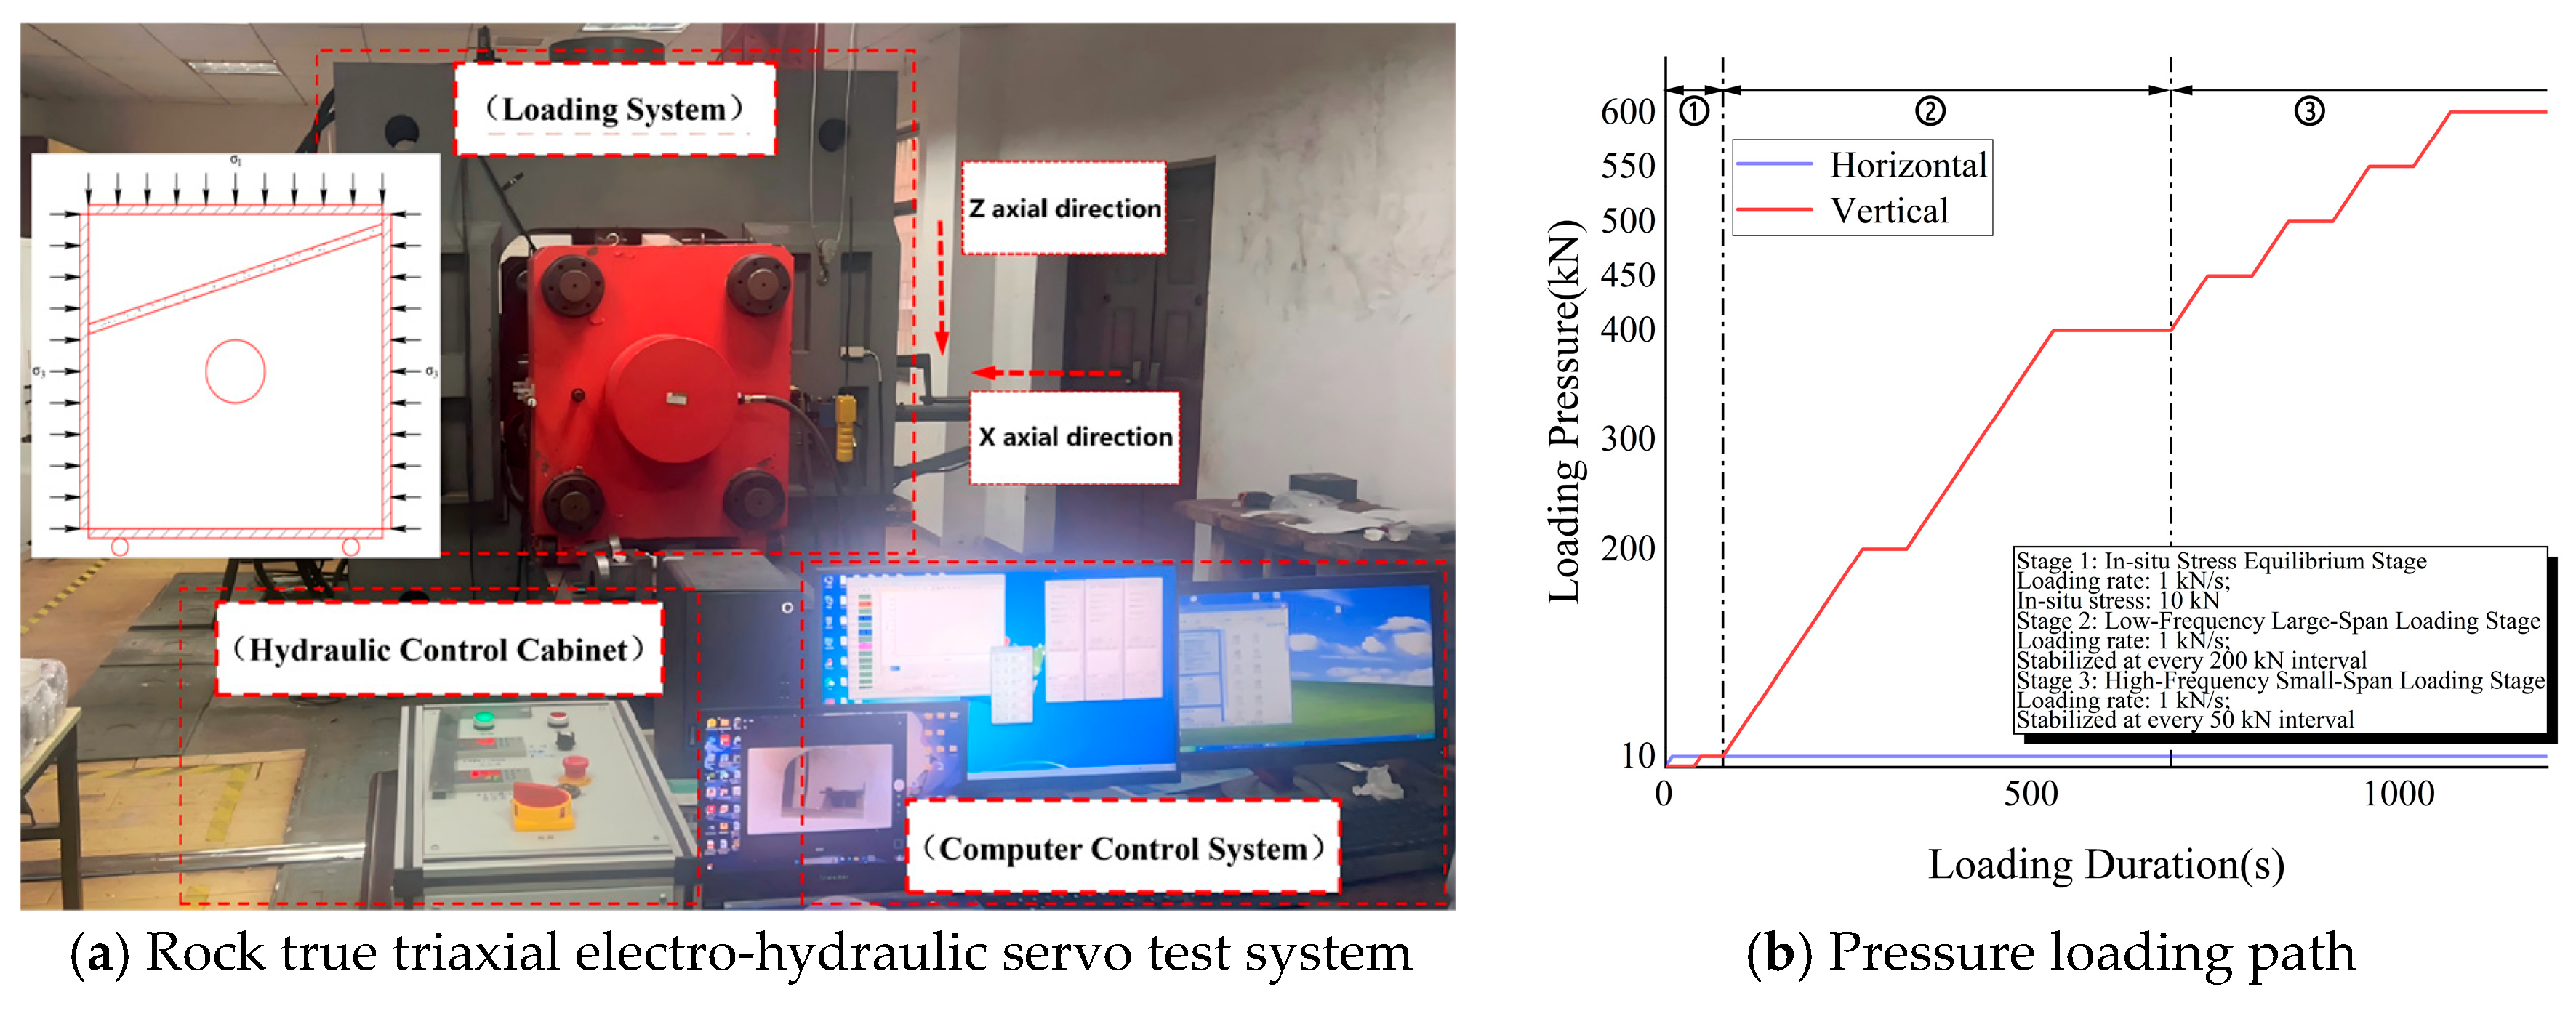
The prepared samples are taken out for biaxial compression tests and real-time strain monitoring. The biaxial compression test adopts a rock true triaxial electro-hydraulic servo mutagenesis (disturbance) test system, which uses its X-axis and Z-axis biaxial loading capabilities to apply horizontal confining pressure and vertical normal pressure to the rock specimens, respectively. Strain monitoring uses self-purchased data acquisition modules and supporting data acquisition systems, which have the characteristics of high data acquisition accuracy, fast response speed and strong operational stability. In order to prevent the test machine fixture from generating friction between the rock specimens and thereby affecting the test results, before the start of this test, a layer of Vaseline was applied to the contact surfaces between the rock specimens and the fixture to reduce the deviation in results caused by friction.
According to the law of in-situ stress distribution, this test mainly uses a biaxial compression testing machine to apply normal stress and lateral stress. The loading process mainly includes three stages: the in-situ stress balance stage, the low-frequency large-span loading stage and the high-frequency small-span loading stage. The specific loading method is as follows: ① Place the specimen, apply 1 kN pressure successively in the horizontal and vertical directions and keep it stable to clamp the specimen; ② Increase the horizontal pressure to 10 kN at a loading rate of 1 kN·s−1, keep it stable for 60 s, then increase the vertical pressure to 10 kN and keep it stable for another 60 s; ③ Increase the vertical pressure to 200 kN and 400 kN respectively, and keep each for 60 s; ④ Increase the vertical pressure by 50 kN each time and keep it for 60 s until the specimen fails. The specific loading path is shown in Figure 7.

3.2. Test Results

3.2.1. Stress–Strain Curves and Displacement Monitoring

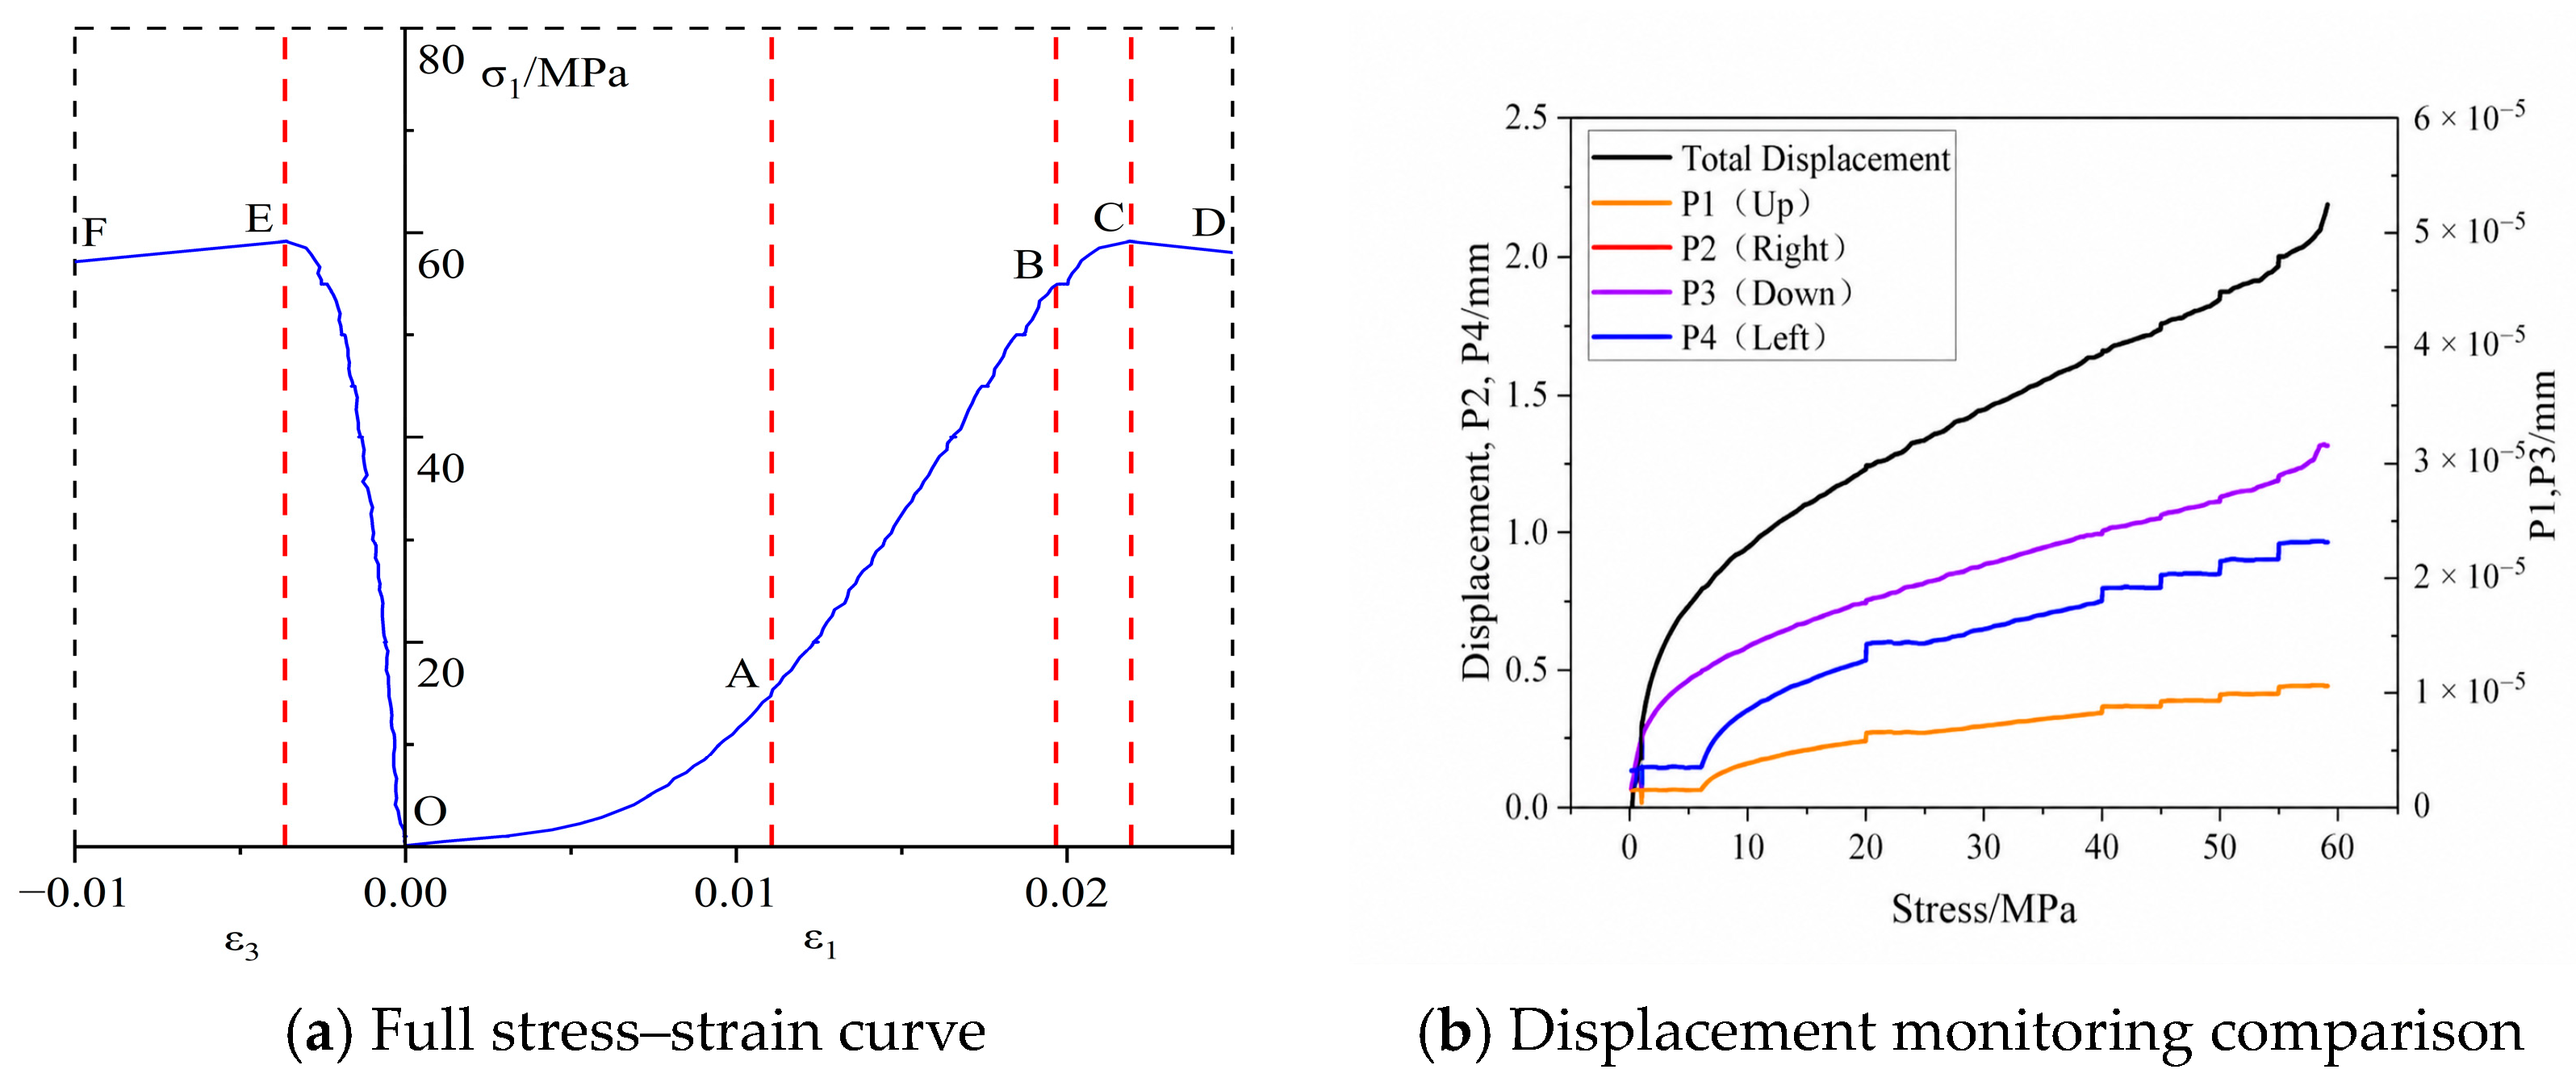
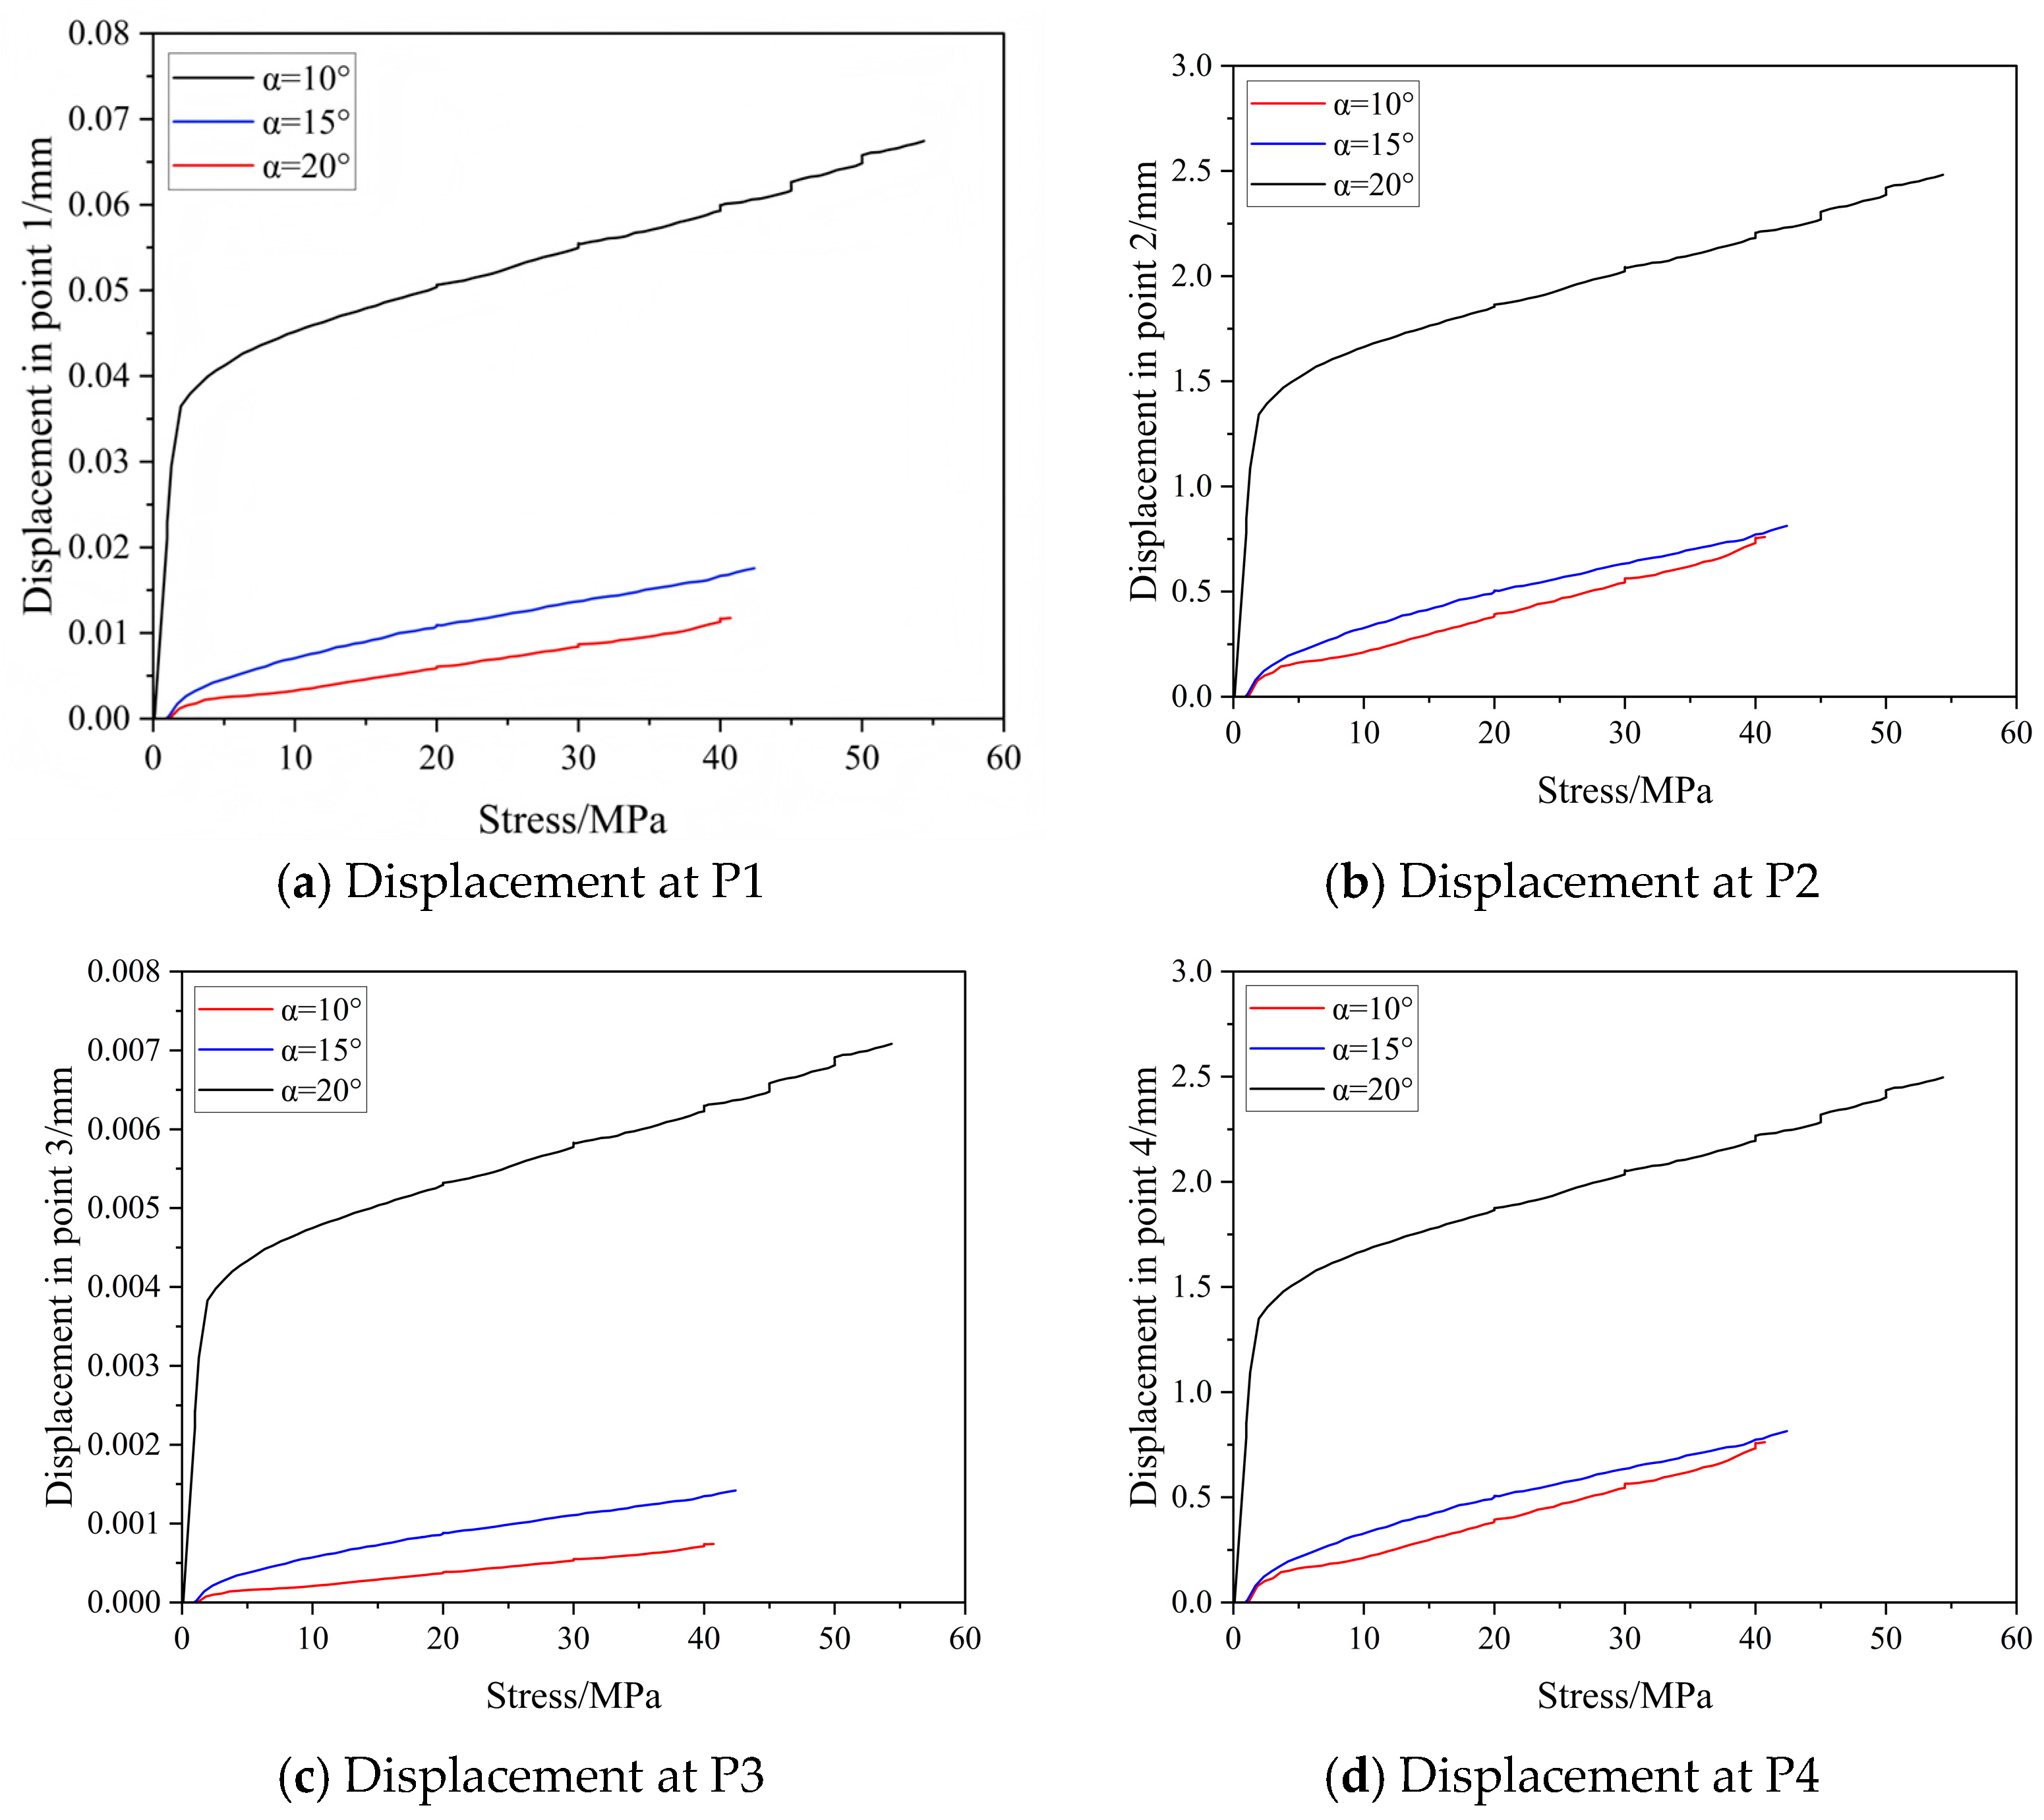
Through data collection, analysis and conversion processing in the test, the effective data are systematically analyzed and converted to obtain the stress–strain response characteristics of rock masses with through-going structures of different dip angles and the displacement variation law of monitoring points, as shown in Figure 8 and Figure 9.
Figure 8a shows the stress-axial strain curve O-A-B-C-D. Segment O-A is the initial compaction stage. Pre-existing microcracks and pores close under loading, resulting in concave curves, volumetric compression and gradually rising stiffness. Segment A-B follows Hooke’s law with linear elastic deformation; deformation is mostly recoverable, and Point B denotes the elastic limit. Segment B-C represents stable crack growth and strain hardening. The curve slope declines as microcracks initiate, propagate and coalesce, with plastic deformation growing until peak strength at Point C. Segment C-D is the post-peak stage, wherein stress declines gradually. The fractured rock retains bearing capacity via particle interlocking and friction, showing ductile failure. Curve O-E-F illustrates Poisson’s effect and volumetric dilation. In the pre-peak O-E stage, lateral strain increases slowly with predominant volumetric compression. In the post-peak E-F stage, stress drops sharply while lateral strain rises rapidly. Large-scale crack coalescence induces obvious volumetric dilation, indicating a transition from brittle to ductile failure. In summary, the curves comprehensively reflect the rock’s mechanical responses under biaxial loading, covering compaction, elasticity, strain hardening, peak failure and residual strength. The mild post-peak decline demonstrates the specimen’s good ductility and residual bearing capacity.
In Figure 8b, overall displacement rises monotonically at an accelerating rate. At 0–20 MPa, rapid displacement growth corresponds to internal compaction. From 20 to 40 MPa, the curve slope stabilizes, marking the elastic stage. Above 40 MPa, displacement accelerates again as plastic deformation develops. Microcracks initiate, propagate and coalesce to drive continuous deformation, presenting progressive ductile behavior without abrupt brittle failure. Displacement varies distinctly across monitoring points, following the order: P3 (bottom) > P4 (left) ≈ P2 (right) > P1 (top). P1 at the top has the smallest and steadily increasing displacement due to strong constraints, forming a stable zone. P2 and P4 show similar stepwise displacement growth, resulting from discontinuous deformation induced by local cracking. P3, at the bottom, exhibits the largest and fastest-growing displacement, acting as the major deformation concentration zone under strong stress coupling with the loading boundary. With increasing stress, the displacement gap between monitoring points widens, and deformation heterogeneity intensifies. The bottom and side regions are prone to late-stage stress concentration and failure, while the top remains constrained. Under biaxial loading, the model features prominent bottom deformation, moderate lateral deformation and stable minor deformation at the top.
It can be seen from Figure 9 that the characteristics of the stress–strain curves and the displacement behaviors at monitoring points of rock specimens with through-going structures under different dip angles are similar to those of the control group. Under the influence of through-going structures, the overall strength of the rock specimens exhibits degradation and their peak compressive strengths decrease to varying degrees compared with specimens without through-going structures. Meanwhile, the distribution pattern of displacement at each characteristic monitoring point of the specimens has also changed significantly. In addition, in the presence of through-going structures, the elastic modulus of the rock specimens changes accordingly, further reflecting the significant influence of through-going structures on the mechanical properties of rock masses.

3.2.2. Peak Strength Characteristics

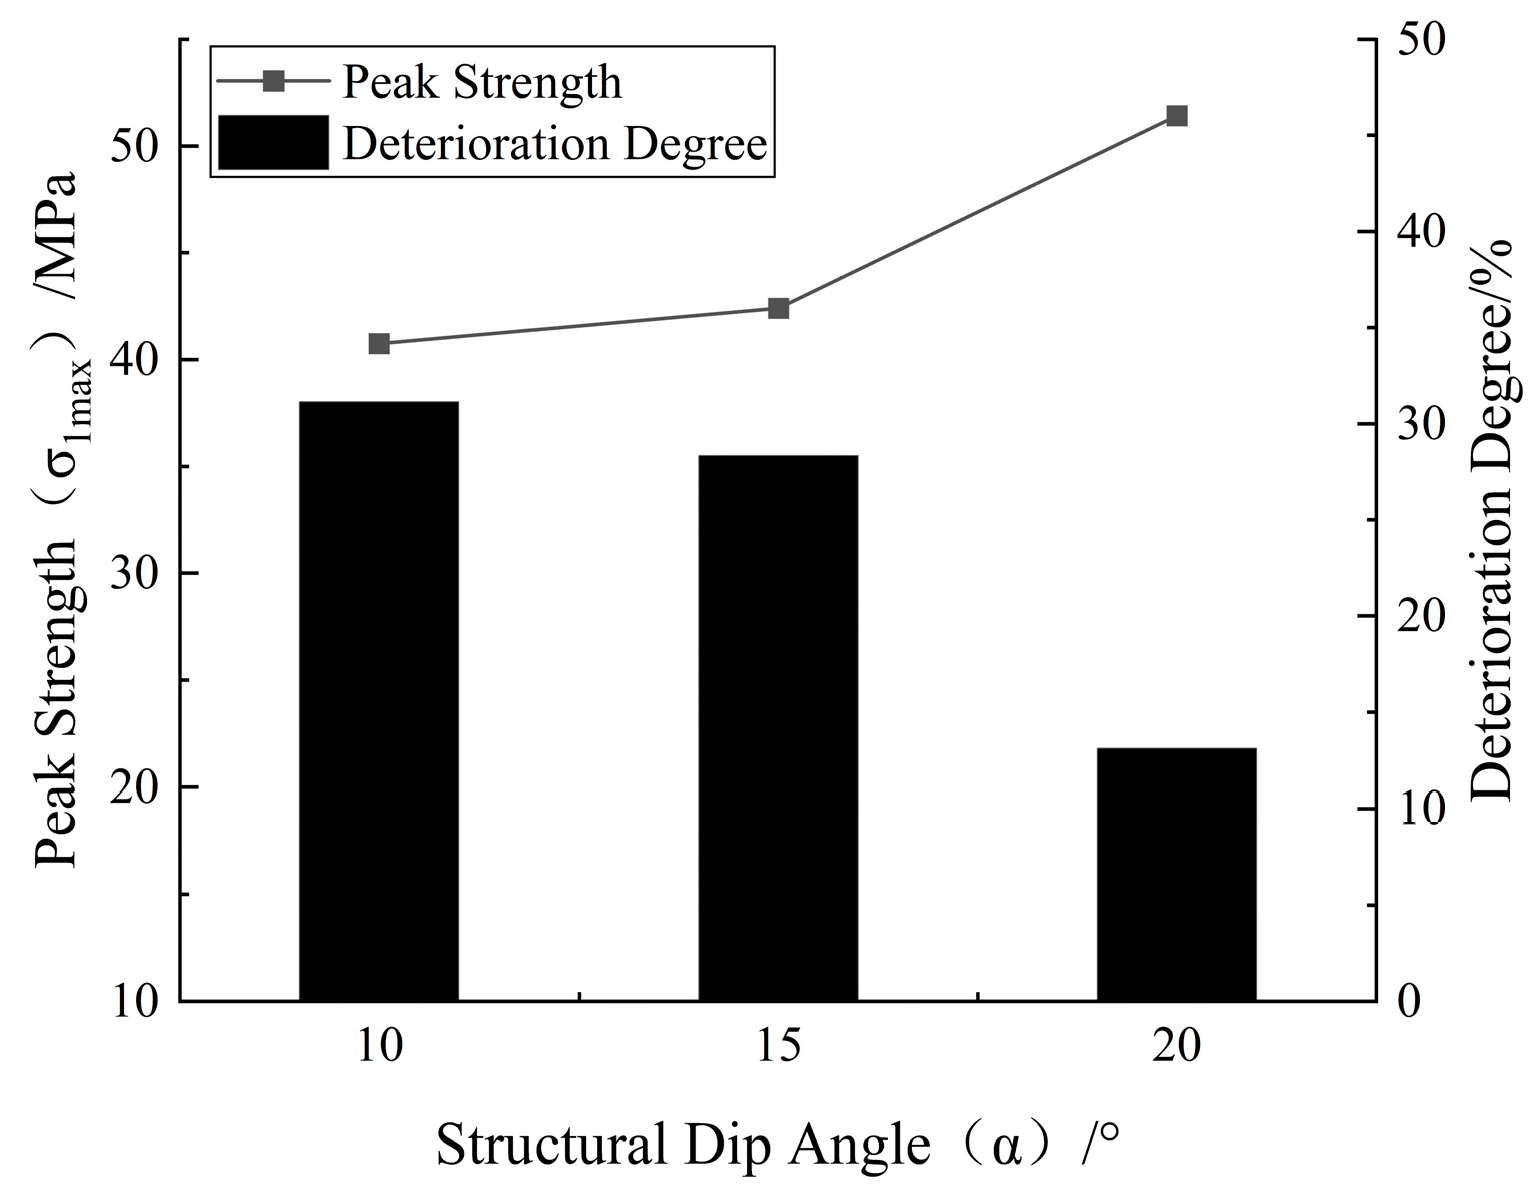
The specific peak strength of rock specimens when they fail in the biaxial compression test and the degree of strength deterioration compared with rock specimens without through-going structures are shown in Figure 10 and Table 2.
From the data in Figure 10 and Table 2, it can be seen that the peak strength of the specimens with through-going structures is lower than that of the intact rock mass. The test results show that the peak strength of the specimens gradually increases with the increase of the structural inclination angle: the peak strengths corresponding to the inclination angles of 10°, 15°, and 20° are 40.75 MPa, 42.41 MPa, and 51.42 MPa, respectively, and the strength attenuation rate decreases simultaneously. This indicates that the weakening effect of the large inclination structures on the mechanical properties of the rock is relatively limited, and the bearing capacity of the specimens is closer to that of the intact rock mass. The two are overall showing a negative correlation pattern between the inclination angle of the structure and the degree of strength attenuation. Based on the previous theoretical analysis, when the normal stress remains unchanged, the increase in the inclination angle of the structure will gradually reduce the Tectonically-Induced Stresses, and the force level around the holes will also decrease. In conclusion, although the through-going structures will deteriorate the overall peak strength of the rock mass, increasing the inclination angle of the structure can effectively improve this phenomenon, and the peak strength of the specimens will continue to rise.

3.2.3. Circumferential Strain

At peak strength, the strain values of the four characteristic points around the cavity are shown in Table 3. The strain data under a uniform reference stress of 20 MPa are listed in Table 4.
As shown in Table 3, in the specimen without structural defects, the strain at the upper and lower parts of the opening (P1, P3) is significantly lower than that at the left and right parts (P2, P4), showing typical transverse stress concentration characteristics. The strain at the left and right parts is nearly symmetric, reflecting the stress distribution law of the surrounding rock under uniform loading.
The through-going structure substantially changes the strain field around cavities, with its dip angle acting as a dominant control factor. Strain concentration migrates toward the structure. At 20°, P1 records a strain of 674.30 × 10⁻⁵, 9.5 times the value at P3, reflecting stress field reorientation caused by the structure. A rising dip angle exacerbates local strain accumulation. From 10° to 20°, strain at P1 rises by 474%, indicating a stronger stress disturbance and a higher failure risk for steep structures. For horizontal strain, P2 and P4 show symmetric high strain in intact samples. Their strain falls below 1.0 at small dip angles (10°, 15°) but climbs to around 2.5 at 20°. Large dip angles severely disrupt horizontal stress, increasing lateral strain and aggravating the non-uniformity of the surrounding stress–strain field.
At peak strength, the circumferential strain at monitoring points around the opening can qualitatively reflect the stress redistribution characteristics of the surrounding rock. However, due to differences in peak strength among different specimens, the corresponding external loading stress levels are not uniform, resulting in a lack of a unified mechanical reference for circumferential strain data under this condition, making scientific comparison and quantitative analysis across working conditions difficult. To overcome this limitation, based on the monotonic loading mode and the deformation behavior of each specimen in the elastic stage, this paper selects the stable maintenance stage at a loading stress of 20 MPa as the unified mechanical benchmark. After rechecking, when the normal stress was 20 MPa, the stress–strain states of all the specimens were all in the elastic deformation stage. The strain monitoring data of each point at this stage are extracted and averaged for in-depth analysis, with the relevant test results listed in Table 4.
As shown in Table 4, the strain distribution around the holes in the intact rock mass exhibits a significant symmetry: the strains at the upper part P1 and the lower part P3 are only 0.07 × 10⁻⁵ and 0.18 × 10⁻⁵, respectively, while the strains at the left and right sides P2 and P4 are both 0.60. This reflects that the stress redistribution around the holes in the intact rock mass is uniform and symmetrical. The through-going structure will significantly change the strain characteristics around the holes, and the strain response is closely related to the dip angle of the structure. When the dip angle increases from 10° to 20°, the strains at all measurement points continue to rise: the strain at P1 increases from 60.51 × 10⁻⁵ to 506.66 × 10⁻⁵, the strain at P3 increases from 3.83 × 10⁻⁵ to 53.23 × 10⁻⁵, and the strains at P2 and P4 increase from 0.39 to 1.86 and 1.88, respectively. Among them, the strain at P1 is always much higher than that at P3 and the vertical strain difference around the hole is significant. The strains at P2 and P4 are basically the same. The symmetry of the horizontal strain is not significantly affected.

3.3. Comparison Between Theoretical Calculations and Experimental Results

Based on the experimental data and the analysis of mechanical mechanisms, it can be concluded that the experimental results fully confirm the regulatory mechanism of the structural dip angle on the mechanical response of rock masses containing through-going structures. As the structural dip angle increases, the Tectonically-Induced Stress gradually decreases, while the Residual Gravitational Stress continuously rises. This causes the gently dipping structures to exhibit a significant stress-induced effect, while the surrounding rock stress state of the steeply dipping structures becomes more similar to that of intact rock masses. To further deeply reveal the regulatory laws of the dip angle, subsequent calculations and analyses of the residual stress coefficient and stress deflection angle based on theoretical formulas and experimental strain data will be carried out systematically. This will improve and verify the aforementioned theoretical results.
The test results indicate that the rock mass stress mainly propagates along the upward path. The strain fluctuations in the upper and lower regions of the holes are significant and cannot be used as an analytical basis. However, the strains on the left and right sides of the holes are less affected by tectonic disturbances and have good data stability. Therefore, the average strains on both sides are selected for the research. At the same time, after the specimen was subjected to tectonic cutting, the Residual Gravitational Stress value was extremely low, and this value was ignored in the current analysis. Based on Equations (4)–(6), the theoretical formulas for the horizontal circumferential strain and stress residual coefficient were derived, and the calculated values were quantitatively compared with the measured data. The relevant results are shown in Table 5.
Based on the test data in Table 5, a detailed analysis can be conducted on the stress residual coefficient and the variation pattern of the deflection angle under the influence of the structural dip angle as well as the underlying mechanism. As the structural dip angle increases from 10° to 20° continuously, the stress residual coefficient η significantly rises from 11.39 to 62.69, showing a significant positive correlation. The mechanical essence of this change lies in that when the structural dip angle increases, the angle between the structural plane and the principal stress direction changes, resulting in the reconfiguration of the shear slip resistance of the structural plane and the stress transmission path. This leads to more stress disturbances being unable to be released through the elastic deformation and plastic dissipation processes of the rock mass, thus being retained in the surrounding rock around the holes in the form of residual stress, ultimately manifesting as a significant increase in the residual coefficient. At the same time, the data shows that the stress deflection angle and the structural dip angle change completely synchronously. Under the conditions of 10°, 15°, and 20°, the deflection angles correspond to 10°, 15°, and 20°, respectively. This result directly verifies the directional induction effect of the continuous structure on the principal stress field: the existence of the structural plane breaks the original isotropic stress field distribution of the rock mass, forcing the principal stress direction to deviate toward the advantageous direction of the structural plane; the deflection angle is highly consistent with the structural dip angle. These patterns jointly reveal the internal mechanism by which the structural dip angle changes the stress transmission path and the principal stress direction, thereby regulating the residual stress level around the holes. This provides direct experimental support for the theory of stress redistribution in rock masses with continuous structures.

4. Numerical Simulation Method and Result Analysis

Numerical simulation is an effective means to verify the theoretical derivations in this paper. Compared with indoor experiments, numerical simulation has unique application advantages. The numerical model constructed in this paper uses an independent data set and is separate from the physical experiments in two different research systems. There is no data crossover or correlation between the two. By using this model, not only can the scientific nature of the theoretical derivation be directly demonstrated, the simulation results can be compared and analyzed with the experimental data, achieving mutual verification through multiple methods.

4.1. Numerical Simulation Method

4.1.1. Construction of Numerical Analysis Model

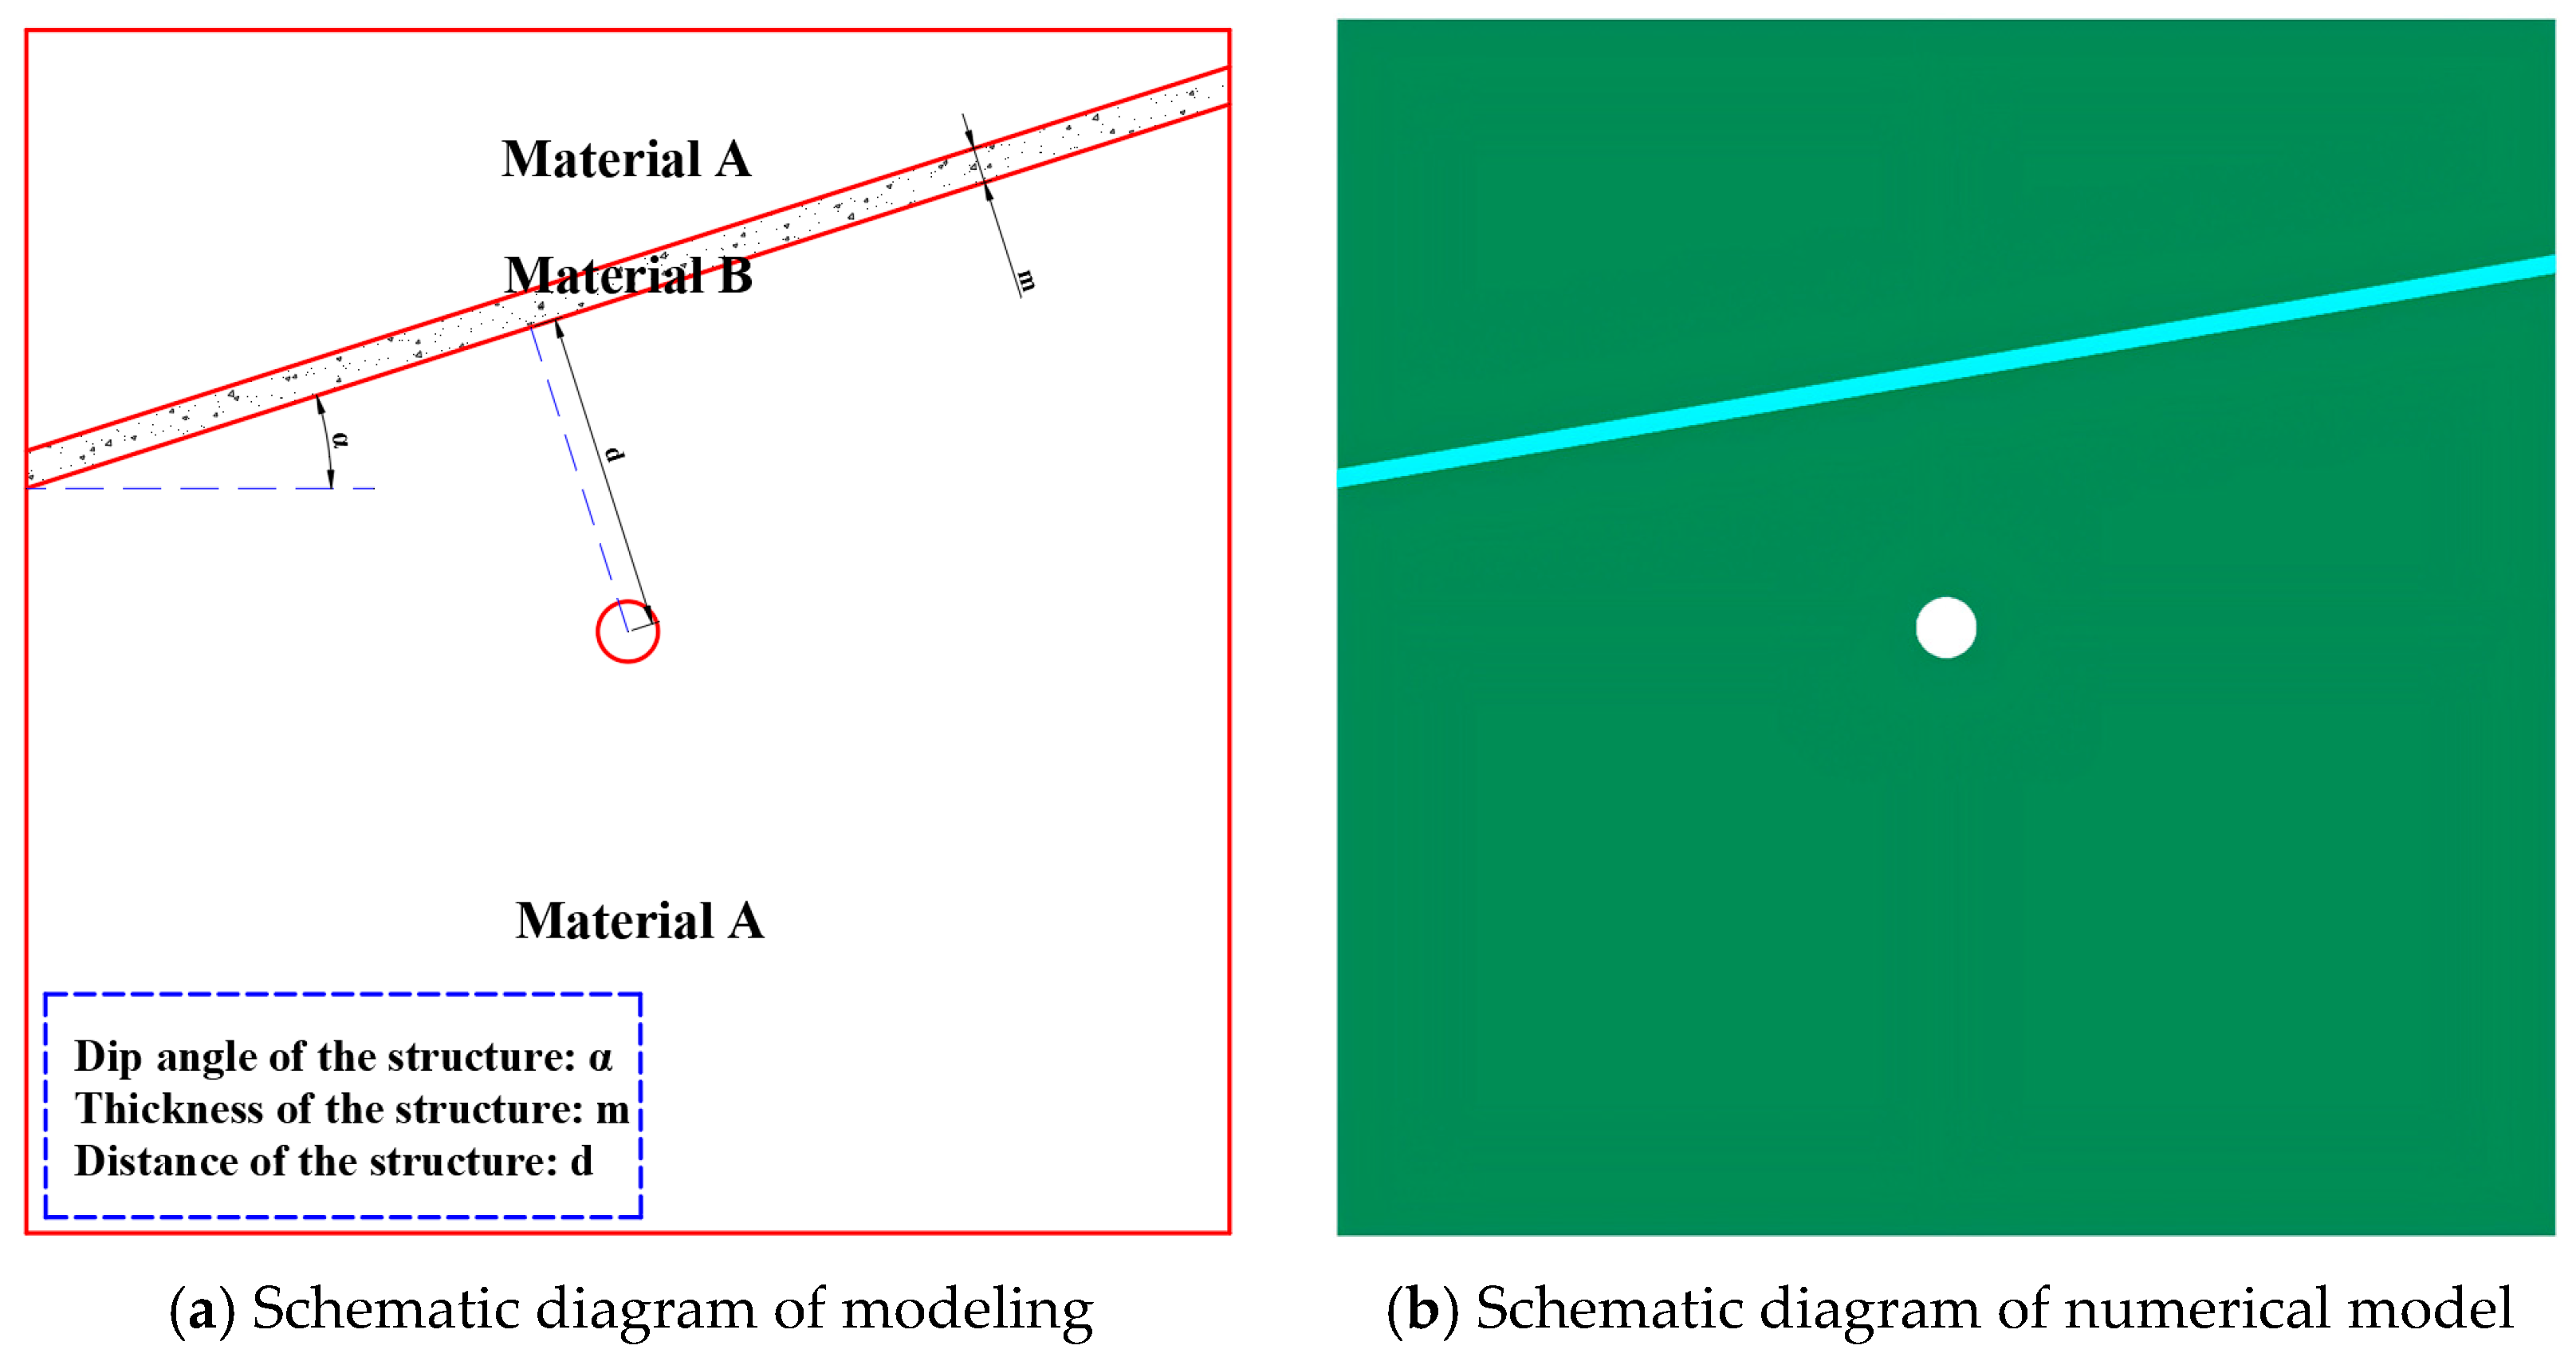
This numerical simulation relies on the FLAC2D numerical analysis software to establish a numerical calculation model, and the spatial scale of the model is set to 200 m × 200 m, which is 20 times the engineering excavation diameter. A circular excavation cavity with a radius of 5 m is set in the central area of the model, corresponding to a gob with an excavation diameter of 10 m. This size belongs to the common gob design scale of deep rock mass engineering, so as to accurately simulate the free surface formed after underground engineering excavation. The specific model is shown in Figure 11.

4.1.2. Rock Mechanical Parameters and Boundary Conditions

In this numerical simulation, a numerical calculation model is established based on the FLAC2D software. The spatial dimension of the model is set to 200 × 200 m, which is 20 times the diameter of the engineering excavation. A circular excavation opening with a radius of 5 m is arranged in the central area of the model, corresponding to a 10 m diameter void. This size falls within the common design range of voids in deep rock engineering, thereby accurately simulating the free surface formed after underground engineering excavation. The inclination angle values used for construction are 10°, 15°, 20°, and 25°. The specific model is shown in Figure 5.
(1)
Rock Mechanical Parameters
The physical and mechanical parameters of the rock mass medium in this numerical simulation all follow the design indicators and measured results of laboratory tests. Among them, the continuous rock mass area in the model is directly assigned the physical and mechanical parameters measured in laboratory tests based on red sandstone and the internal filling of the through-going structure adopts the strength and mechanical parameters measured after the prefabricated cement slurry is cured under standard conditions for 28 days. Combined with the constitutive model adaptation requirements and parameter calculation rules of FLAC2D numerical simulation, the mechanical parameters required for model assignment are systematically converted, checked and revised, and finally the complete parameter value system for this numerical simulation is determined, as shown in Table 6.
(2)
Boundary Conditions
In this numerical simulation, the global initial stress field of the rock mass model with through-going structures is set as the self-weight stress field, and the gravitational acceleration is set to g = 10 m·s−2 to simplify the iterative calculation. The entire rock mass of the model adopts the Mohr–Coulomb constitutive model for mechanical solution, which is consistent with the mechanical response characteristics of plastic yield and shear failure of rock masses with through-going structures. For the refined numerical model of through-going structures constructed, normal fixed displacement constraints are applied to the left and right lateral boundaries and the bottom boundary to strictly limit the displacement and deformation development of the above boundaries during the iterative calculation, ensuring the stability and mechanical rationality of the numerical model boundary conditions. To accurately restore the in-situ stress environment corresponding to the actual engineering burial depth, a uniform vertical compressive stress consistent with the direction of gravity is applied to the top boundary of the model. To achieve an effective benchmark between laboratory tests and numerical simulation results, and taking into account the principle of elastic stage data selection, the vertical stress applied to the upper boundary of the model is uniformly set to 20 MPa. Combined with the overlying rock density ρ = 2.98 × 10³ kg·m−3 for self-weight stress back calculation, the equivalent burial depth is about 670 m, which is basically consistent with the actual occurrence burial depth characteristics of common mining areas in this study, ensuring that the model stress environment is highly consistent with the preset theoretical stress environment.
(3)
Explanation
This numerical simulation was conducted based on a specific burial depth condition to construct a rock mass model with a through-going structure. Although the model size and material strength parameters were based on the settings of indoor experiments, there was no direct correspondence between them. The uniform loading stress and material parameters were only used for facilitating the subsequent data comparison and analysis. This time, a large-scale model was adopted, aiming to expand the number of inclination parameter groups and achieve synchronous simulation of the excavation and unloading conditions. Therefore, the model’s geometric size and mechanical parameters were not matched and fitted with the indoor experiments.

4.2. Numerical Simulation Results

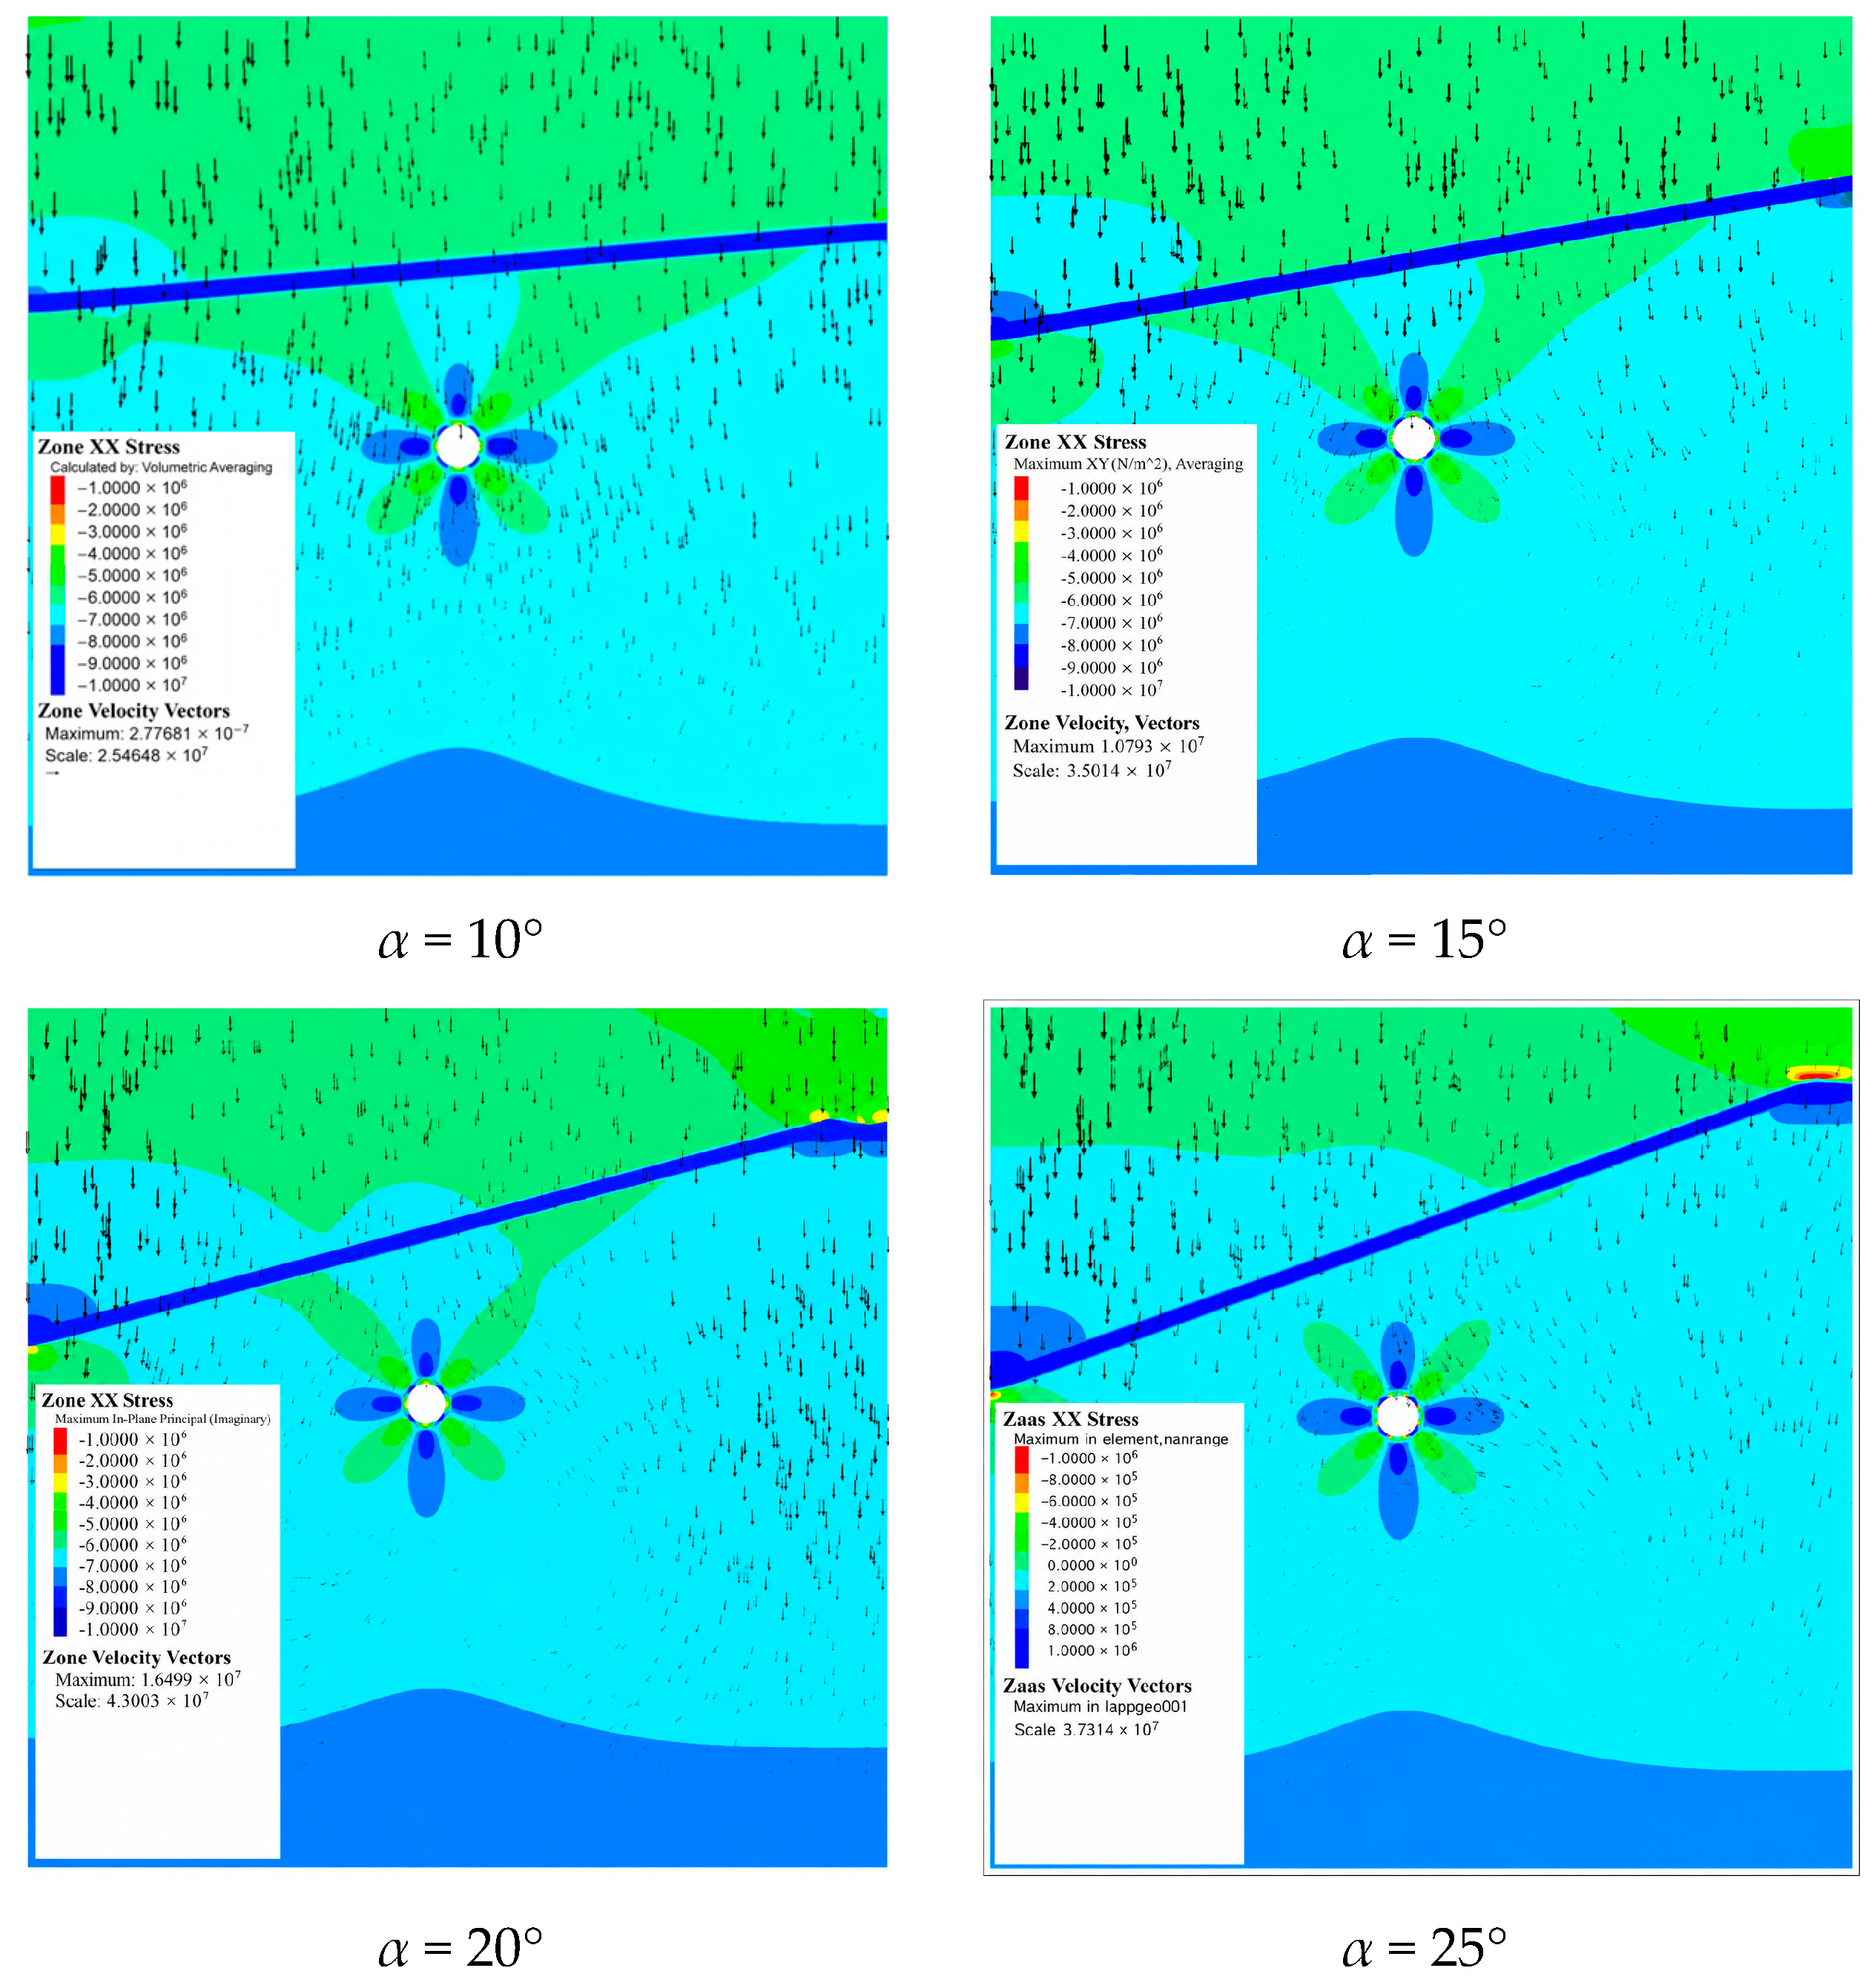
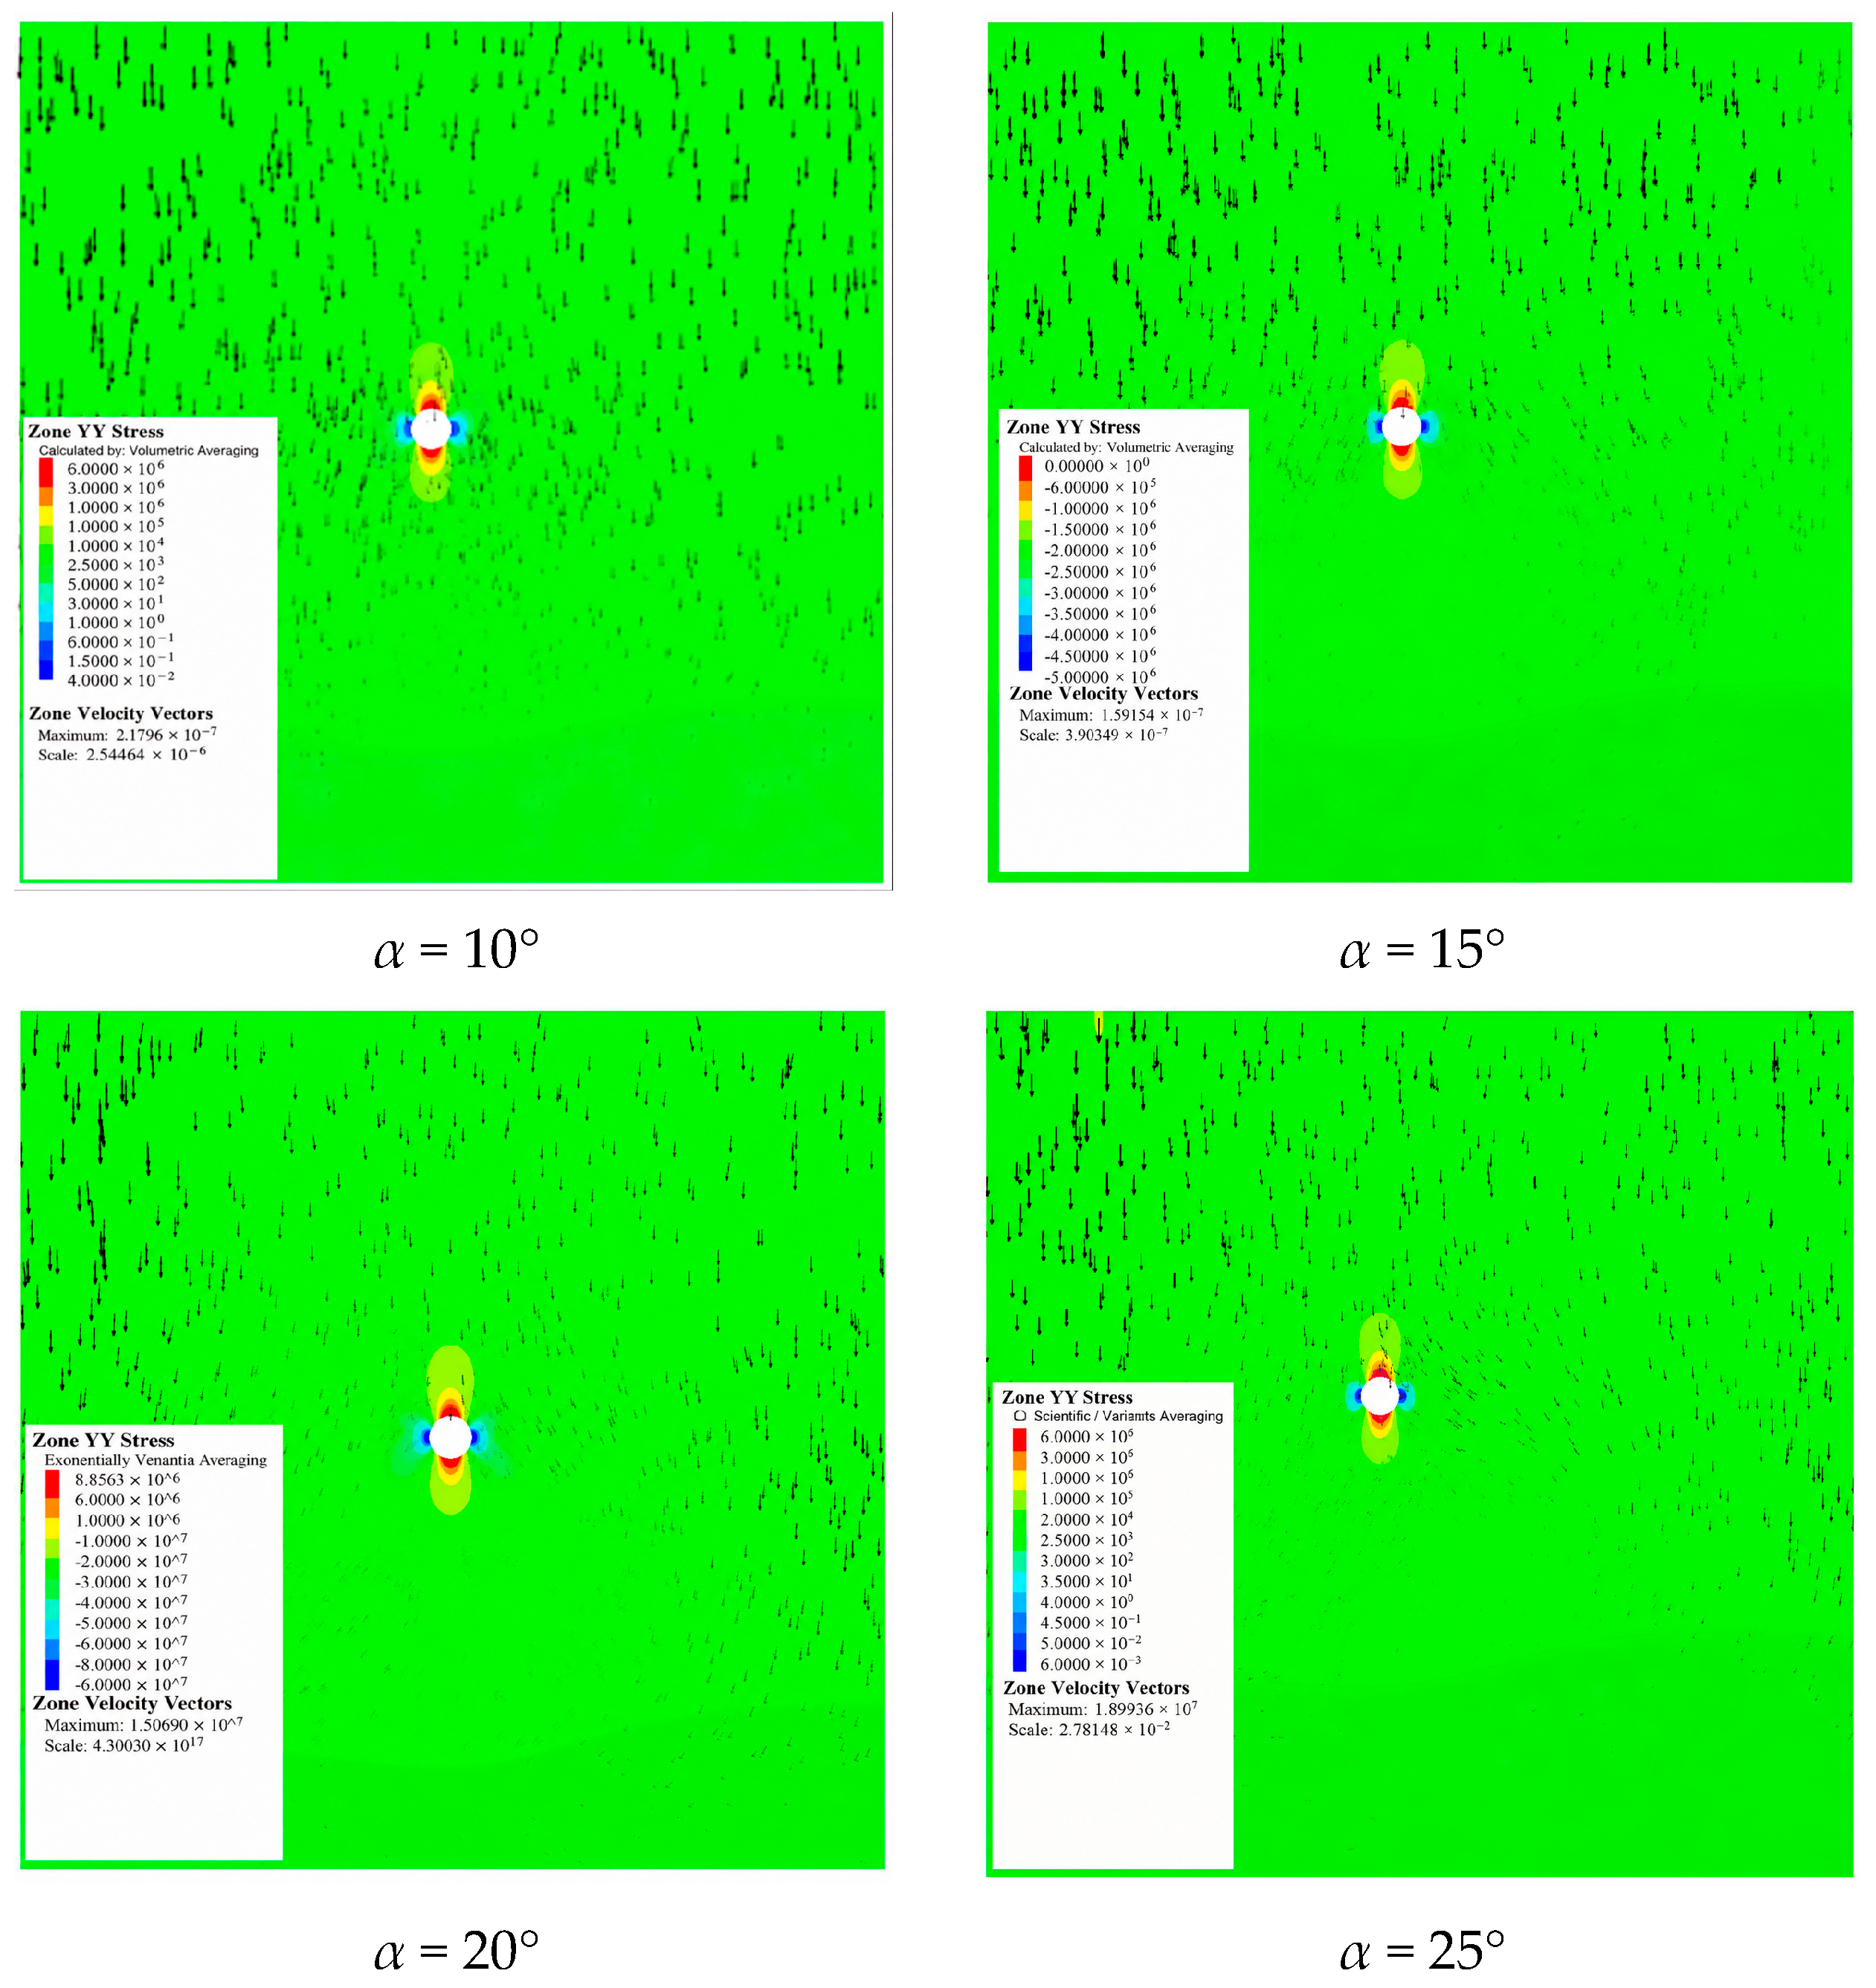
Through numerical simulation for computational analysis, this paper focuses on the stress balance of rock mass under a normal stress of 20 MPa during the entire process of excavation and unloading and explores the evolution laws of the maximum and minimum principal stresses, as well as the horizontal and vertical stress components, in the rock mass with different inclination angles that are connected in a continuous manner. The distribution cloud diagrams of the horizontal and vertical stress components are shown in Figure 12 and Figure 13, respectively.
Based on the calculation results, the key data of the through-going structural rock mass models under different inclinations were extracted. The specific situation is shown in Table 7.
Based on Table 7, Figure 11 and Figure 12, it can be observed that as the structural dip angle increases, both the maximum principal stress and the maximum horizontal principal stress of the rock mass show a slight downward trend; the minimum principal stress (vertical principal stress) remains stable within the range of 56.2 to 56.4 MPa, and its value is significantly higher than the maximum principal stress (horizontal principal stress), demonstrating the typical distribution characteristics of a self-weight stress field.

4.3. Theoretical Comparison Calculation and Analysis

Based on the derived Equations (4) to (5) in the previous text, calculations were carried out to decompose the induced stress and residual self-weight stress into vectors and then superimpose them along the horizontal and vertical directions, respectively, to obtain the horizontal and vertical components of the engineering disturbance stress. The calculation results are shown in Table 8.
Based on Equation (6) derived in the previous text, a comparative analysis was conducted between the theoretical calculation and the numerical simulation results of the surrounding rock stress. Due to the stress redistribution caused by the excavation, the stress differences in the upper and lower regions of the hole are significant, while the stress distribution on the left and right sides is relatively uniform. Under the intact rock condition, the theoretical values of the circumferential stress on both sides of the hole are equal. Therefore, in this paper, the average circumferential stress values on the left and right sides of the hole were selected and the stress residual coefficient and stress deflection angle were solved successively. The calculation results are shown in Table 9.
Based on the data in Table 9, a detailed analysis can be conducted on the residual stress coefficient and the variation pattern of the deflection angle under different structural inclination angles, as well as the underlying mechanism. As the inclination angle of the continuous structural increases from 10° to 25°, the residual stress coefficient η continuously decreases from 2.5312 to 1.2312, showing a significant negative correlation. The mechanical essence of this change lies in the statement: As the structural inclination angle increases, the angle between the structural plane and the principal stress direction gradually changes, causing the shear slip resistance of the structural plane and the stress transmission path to be reconfigured. Stress perturbation is more likely to be released through the elastic deformation and plastic dissipation processes of the rock mass, thereby reducing the proportion of residual stress remaining in the surrounding rock around the hole, ultimately resulting in the continuous decline of the residual coefficient.
At the same time, the data shows that the stress deflection angle changes synchronously with the structural inclination angle: under the conditions of 10°, 15°, 20°, and 25°, the deflection angles are 9.9°, 14.7°, 19.5°, and 24.2°. respectively, with deviations from the structural inclination angle all being less than 1°. This result directly verifies the directional induction effect of the continuous structure on the principal stress field. The existence of the structural plane breaks the original isotropic stress field distribution of the rock mass, forcing the principal stress direction to deviate toward the advantageous direction of the structural plane. The deflection angle is highly consistent with the structural inclination angle. The deviation mainly stems from the local disturbance effect of the stress field in the numerical simulation process.
Furthermore, the data shows that the horizontal principal stress component remains basically stable between 9.42 and 9.48 MPa under different inclination angles, while the vertical principal stress component significantly decreases from 57.45 MPa to 21.08 MPa. This further confirms the weakening effect of the structural inclination on the vertical stress transmission, and it is also one of the important causes of the residual stress coefficient decreasing with the inclination angle. These patterns jointly reveal the internal mechanism by which the structural inclination changes the stress transmission path and the principal stress direction, thereby regulating the residual stress level around the hole. This provides direct numerical simulation support for the theory of stress redistribution in rock masses with through-going structures.

5. Discussion and Limitations

5.1. Discussion

Based on the above research results, the rock mechanical response characteristics obtained from indoor experiments, numerical simulations and theoretical derivations were compared and analyzed. Due to the limitations imposed by the differences in model geometric size and external stress loading methods, the direct comparison of the internal stress fields and each stress component under the two types of conditions has limited reference value. Therefore, this paper selects two key characterization parameters, namely the stress residual coefficient and the stress deflection angle, as research indicators. These two parameters can effectively reflect the control effect of the main controlling structural parameters on the rock mechanical response patterns. Among them, the stress residual coefficient mainly reflects the regulatory characteristics of the stress induced by the main controlling parameters and the weight of the induced stress generated by the tectonic process in the engineering disturbance stress system. The deflection angle, on the other hand, reflects the vector adjustment characteristics of the stress induced in the engineering disturbance stress system by the main controlling variables. Through systematic organization and summary of the relevant calculations and experimental data, the final statistical summary results are formed, as shown in Table 10.
From the data in Table 10, it can be seen that the residual stress coefficient calculated from the measured data of the indoor tests is significantly different from that obtained by the theoretical formula, and its variation pattern with the structural inclination angle is quite different from the numerical simulation results. The response trends of the two are opposite. The fundamental reason for this phenomenon lies in the completely different stress loading paths of the two research methods. The indoor test adopts the method of performing overall direct loading on rock-like specimens containing prefabricated structures and holes while the numerical simulation follows the loading process of first achieving initial ground stress balance and then excavating the holes for unloading. These two methods correspond to two typical working conditions in engineering: the stress state of the surrounding rock with formed voids and the unloading process of excavation. Although the loading methods are different, the sensitivity of the influence of the structural inclination angle on the residual stress coefficient is very significant in both modes. The amplitude increment of the indoor test data is significantly larger, which is mainly due to the size effect of the small-scale model. In the small-scale model, the stress transmission path is shorter and the stress concentration effect is more intense, resulting in stronger data sensitivity. In the large-scale numerical model, the parameters such as the thickness and spacing of the structure have a larger order of magnitude, and the stress concentration phenomenon is significantly weakened.
Based on the results of indoor experiments, numerical simulations and theoretical formula calculations, it can be concluded that as the structural inclination angle increases, the Tectonically-Induced Stress generally shows a decaying trend. Its horizontal component gradually increases while the vertical component continuously decreases. The horizontal stress component around the holes generally shows an upward trend, and the Residual Gravitational Stress also continuously increases with the increase in inclination angle. Under the combined action of these two types of stress, the response of the engineering disturbance stress gradually weakens as the structural inclination angle increases. The stress deflection angle is highly synchronized with the change trend of the structural inclination angle. Although the Residual Gravitational Stress may have certain interference on the deflection angle, the overall impact is limited.

5.2. Limitations

Based on the research results obtained from further exploration and the entire research process, this study has certain limitations.
(1)
In this biaxial compression test, only Vaseline lubrication combined with rolling supports was adopted to reduce tangential end friction between the specimen and loading platens. Calibration of the interfacial friction coefficient and boundary stress monitoring were not performed. The lubricant tends to be squeezed out from specimen edges under high compressive load, meaning that end friction cannot be completely eliminated. Restricted by the original test scheme, this study fails to quantify the disturbance induced by end friction on measured stress data, and the influence of the friction effect on stress distribution around the opening has not been systematically investigated. In follow-up tests, Teflon lubricating sheets together with friction calibration tests can be adopted to further reduce experimental errors caused by end friction.
(2)
In this test, strain monitoring points P1 and P3 are arranged at the top and bottom of the cavity, respectively. Their strain magnitudes are strongly affected by the vertical loading direction, reflecting vertical-dominated mechanical responses. In this manuscript, the discussion mainly focuses on the stress environment on the two lateral sides of the opening based on P2 and P4. Although the P1 and P3 datasets are complete and physically meaningful, dedicated comparative analysis for vertical-direction measuring points is not performed in the current work. All original strain records of P1–P4 are attached in the appendix for subsequent reference and secondary analysis by interested readers. Future work will conduct targeted research on the mechanical characteristics at the top and bottom region of the cavity.
(3)
The numerical simulation in this study adopts the standard Mohr–Coulomb constitutive model. This model is capable of describing the plastic shear yielding behavior of thin persistent structural planes, but it cannot reproduce the pre-peak microcrack compaction phenomenon of rock-like materials observed in laboratory tests. Since the numerical analysis in this paper concentrates on elastic stress redistribution before obvious plastic yielding triggered by persistent structures, the full-range reproduction of stress–strain curves covering microcrack compaction is not pursued in the current simulation. Therefore, the simulation results cannot completely reflect the mechanical characteristics in the microcrack compaction stage. More sophisticated constitutive models will be adopted in follow-up studies to achieve a better match between numerical outputs and full-scale laboratory mechanical responses.
(4)
It should be noted that systematic mesh-sensitivity analysis was not implemented for the stress deflection angle calculation in the FLAC2D numerical model. Pre-defined inclined structural interfaces may potentially produce artificial stress rotation related to mesh discretization. The stress deflection angle of 24.2° obtained under the 25° structural dip condition is the result of the current mesh configuration, and the small deviation from the true structural dip angle may be partly attributed to finite-difference discretization effects. Readers should be aware of this numerical limitation when interpreting the simulation results. Comprehensive mesh-sensitivity parametric studies will be conducted in future work to further exclude potential mesh-induced numerical artifacts.

6. Conclusions

The main conclusions of this paper are as follows:
(1)
Based on the plane strain model, the rock mass stress is divided into Tectonically-induced Stress, Residual Gravitational Stress and Engineering-induced Stress, and the calculation methods for stress residual coefficient and deflection angle are derived. The structural dip angle dominates the surrounding rock stress field. As the dip angle increases, the Tectonically-induced Stress decreases gradually while the Residual Gravitational Stress rises continuously. Gently dipping structures tend to cause shear failure, structures with medium dip angles may lead to combined shear-tensile failure, and the stress field of steeply dipping structures is close to the self-weight stress state of intact rock masses. The stress deflection angle changes synchronously with the structural dip angle, and the Residual Gravitational Stress exerts only a slight influence on it.
(2)
Biaxial compression tests are conducted on specimens with structures of different dip angles. The results show that the peak strength of rock mass increases with the rise of dip angle, and obvious strain concentration occurs around the cavities. The evolution laws of stress residual coefficient and deflection angle calculated from test data are basically consistent with theoretical analysis, which verifies the reliability of the theoretical model. Obvious size effects exist in small-scale specimens with intensified stress concentration and higher data sensitivity.
(3)
FLAC2D is adopted to carry out numerical simulations considering excavation and unloading. With the increase of structural dip angle, the principal stress decreases slightly and the vertical stress remains stable. Due to different loading modes, the variation trend of stress residual coefficient obtained from simulations is opposite to that from indoor tests, while the stress deflection angle still agrees well with the structural dip angle. The numerical results also verify the stress evolution laws concluded by theoretical analysis, and the stress concentration is weakened in the large-scale numerical model.
(4)
Despite the differences in partial parameter laws caused by loading paths and model sizes, the core mechanical characteristics reflected by tests and simulations are consistent with theoretical derivations. Cross verification by multiple methods proves that the established theoretical system can accurately characterize the stress response laws of rock masses containing through-going structures. The theoretical achievements are reasonable, reliable and applicable to practical engineering.

Author Contributions

Conceptualization, H.D. and J.X.; Methodology, H.D. and J.X.; Software, J.X.; Formal analysis, J.X., J.S., Z.C. and J.D.; Resources, J.S.; Data curation, J.X., J.S. and Z.C.; Writing—original draft, Z.C.; Writing—review & editing, J.D.; Supervision, J.D. All authors have read and agreed to the published version of the manuscript.

Funding

This research received no external funding.

Institutional Review Board Statement

Not applicable.

Informed Consent Statement

Not applicable.

Data Availability Statement

The raw data supporting the conclusions of this article will be made available by the authors on request.

Conflicts of Interest

The authors declare no conflict of interest.

References

  1. Shang, J.; West, L.J.; Hencher, S.R.; Zhao, Z. Geological discontinuity persistence: Implications and quantification. Eng. Geol. 2018, 241, 41–54. [Google Scholar] [CrossRef] [Scilit]
  2. Barton, N. Suggested methods for the quantitative description of discontinuities in rock masses: International Society for Rock Mechanics. Int. J. Rock Mech. Min. Sci. Geomech. Abstr. 1978, 15, 319–368. [Google Scholar] [CrossRef] [Scilit]
  3. Barton, N.; Choubey, V. The shear strength of rock joints in theory and practice. Rock Mech. 1977, 10, 1–54. [Google Scholar] [CrossRef] [Scilit]
  4. Barton, N.; Bandis, S.; Bakhtar, K. Strength, deformation and conductivity coupling of rock joints. Int. J. Rock Mech. Min. Sci. Geomech. Abstr. 1985, 22, 121–140. [Google Scholar] [CrossRef] [Scilit]
  5. Hoek, E. Strength of jointed rock masses. Géotechnique 1983, 33, 187–223. [Google Scholar] [CrossRef] [Scilit]
  6. Battulwar, R.; Zare, M.; Emami, E.; Sattarvand, J. A state-of-the-art review of automated extraction of rock mass discontinuity characteristics using three-dimensional surface models. J. Rock Mech. Geotech. Eng. 2021, 13, 920–936. [Google Scholar] [CrossRef] [Scilit]
  7. Tang, M.; Yang, S.; Huang, G.; Xie, X.; Guo, J.; Zhai, J. Automatic Extraction of Rock Discontinuities from the Point Cloud Using Dynamic DBSCAN Algorithm. Adv. Civ. Eng. 2022, 2022, 7754179. [Google Scholar] [CrossRef] [Scilit]
  8. Chen, J.; Fang, Q.; Zhang, D.; Huang, H. A critical review of automated extraction of rock mass parameters using 3D point cloud data. Intell. Transp. Infrastruct. 2023, 2, liad005. [Google Scholar] [CrossRef] [Scilit]
  9. Chen, N.; Wu, X.; Xiao, H.; Yao, C.; Cheng, Y. Semi-automatic recognition of rock mass discontinuity based on 3D point clouds. Discov. Appl. Sci. 2024, 6, 230. [Google Scholar] [CrossRef] [Scilit]
  10. Chen, N.; Hao, Y.; Wang, C.; Zheng, J. Semi-automatic identification of discontinuity parameters in rock masses based on Unmanned Aerial Vehicle photography. Geol. J. 2024, 59, 2401–2415. [Google Scholar] [CrossRef] [Scilit]
  11. Hartwig, M.E.; Santos, G.G.D.S.D. Enhanced discontinuity mapping of rock slopes exhibiting distinct structural frameworks using digital photogrammetry and UAV imagery. Environ. Earth Sci. 2024, 83, 624. [Google Scholar] [CrossRef] [Scilit]
  12. Sun, J.; Zhu, S.; Sun, J.; Zhou, J.; Yao, Y.; Wang, Y.; Zhang, J.; Zhou, B.; Wang, X. A robust deep learning approach for rock discontinuity identification from large scale 3D point clouds. Sci. Rep. 2026, 16, 1654. [Google Scholar] [CrossRef] [Scilit]
  13. Kefayati, S.; Eftekhari, M.; Goshtasbi, K.; Ahmadi, M. Evaluating shear strength and acoustic emission in rock-like materials with non-persistent joint geometries under freeze-thaw conditions. Sci. Rep. 2025, 15, 20488. [Google Scholar] [CrossRef] [Scilit]
  14. Zhang, Q.; Su, B.; Chen, G.; Luo, J.; Zhang, J.; Zhao, Q.; Ni, Y.-Q. Shear Behavior and Acoustic Emission Characteristics of Propped Rough Fractures. Rock Mech. Rock Eng. 2025, 58, 2089–2103. [Google Scholar] [CrossRef] [Scilit]
  15. Pan, H.-L.; Hu, J.; Rong, X.-L.; Shi, S.-S.; He, P.; Xu, Y.-F. Acoustic emission characteristics in tensile-shear failure of non-persistent jointed rocks with different undulation angles. J. Cent. South Univ. 2024, 31, 1687–1699. [Google Scholar] [CrossRef] [Scilit]
  16. He, X.; Yu, P.; Eijsink, A.; Marone, C.; Shokouhi, P.; Rivière, J.; Liu, S.; Elsworth, D. Co-Evolution of Specific Stiffness and Permeability of Rock Fractures Offset in Shear. J. Geophys. Res. Solid Earth 2025, 130, E2024JB030633. [Google Scholar] [CrossRef] [Scilit]
  17. Dong, L.; Zhang, Y.; Bi, S.; Ma, J.; Yan, Y.; Cao, H. Uncertainty investigation for the classification of rock micro-fracture types using acoustic emission parameters. Int. J. Rock Mech. Min. Sci. 2023, 162, 105292. [Google Scholar] [CrossRef] [Scilit]
  18. Du, S.-G.; Saroglou, C.; Chen, Y.; Lin, H.; Yong, R. A new approach for evaluation of slope stability in large open-pit mines: A case study at the Dexing Copper Mine, China. Environ. Earth Sci. 2022, 81, 102. [Google Scholar] [CrossRef] [Scilit]
  19. Wang, J.; Zhou, Z.; Chen, C.; Lin, H.; Yong, R. Failure mechanism and stability analysis of an open-pit slope under excavation unloading conditions. Front. Earth Sci. 2023, 11, 1109316. [Google Scholar] [CrossRef] [Scilit]
  20. Nguyen, P.M.V.; Marciniak, M. Stochastic Rock Slope Stability Analysis: Open Pit Case Study with Adjacent Block Caving. Geotech. Geol. Eng. 2024, 42, 5827–5845. [Google Scholar] [CrossRef] [Scilit]
  21. Qin, C.A.; Wang, J.; Wang, B. Insights from rock bridge experiments about tensile fracture of the locked section in slopes with stepped joints. Sci. Rep. 2025, 15, 9531. [Google Scholar] [CrossRef] [Scilit]
  22. Weir, F.M.; Gazi, J.; Duran, A. To topple or not to topple: Managing failures at a case study site. In SSIM 2025: Fourth International Slope Stability in Mining Conference; Potter, J.J., Wesseloo, J., Eds.; Australian Centre for Geomechanics: Perth, Australia, 2025. [Google Scholar] [CrossRef] [Scilit]
  23. Ng’andu, S.; Von Scheele, A.; Zvarivadza, T.; Masethe, R.; Adoko, A.C.; Onifade, M.; Chikande, T. Pitwall stability enhancement through structural analysis. In MassMin 2024: Proceedings of the 9th International Conference & Exhibition on Mass Mining; Johansson, D., Schunnesson, H., Eds.; Luleå University of Technology: Luleå, Sweden, 2024; pp. 1429–1445. [Google Scholar] [CrossRef] [Scilit]
  24. Luo, F.; Gao, S.; Xu, Z.; Dong, E.; Diao, Y.; Sang, Y. Mechanical behavior and tension-shear failure mechanism of fractured rock mass under uniaxial condition. Bull. Eng. Geol. Environ. 2023, 82, 314. [Google Scholar] [CrossRef] [Scilit]
  25. Chen, Q.; Liu, Y.; Wang, W.; Ou, X.; Zhou, Y.; Teng, Z.; Tian, X. Effects of Normal Stress and Joint Inclination Angle on Rock Failure Characteristics Under Compression–Shear Conditions. Front. Earth Sci. 2022, 10, 950648. [Google Scholar] [CrossRef] [Scilit]
  26. Wang, F.; Xie, H.; Zhou, C.; Wang, Z.; Li, C. Combined effects of fault geometry and roadway cross-section shape on the collapse behaviors of twin roadways: An experimental investigation. Tunn. Undergr. Space Technol. 2023, 137, 105106. [Google Scholar] [CrossRef] [Scilit]
  27. Yuan, C.; Duan, Y.; Long, X.; He, Y. Thermally induced fracture propagation, size effects, and mechanical properties of hot dry rock under various cooling protocols. Eng. Fract. Mech. 2026, 335, 112109. [Google Scholar] [CrossRef] [Scilit]
  28. Zhou, C.; Xu, C.; Karakus, M.; Shen, J. A particle mechanics approach for the dynamic strength model of the jointed rock mass considering the joint orientation. Int. J. Numer. Anal. Methods Geomech. 2019, 43, 2797–2815. [Google Scholar] [CrossRef] [Scilit]
  29. GB/T 50266-2013; Standard for Test Methods of Engineering Rock Mass. China Planning Press: Beijing, China, 2013.
Figure 1. Schematic diagram of the generalized plane strain model for through-going structural rock masses.
Geotechnics 06 00078 g001
Figure 3. Schematic diagram of stress vector synthesis.
Geotechnics 06 00078 g003
Figure 4. Schematic diagram of key parameters and monitoring points of specimen model. (a) Test specimen model and key parameters. (b) Strain monitoring characteristic points. (c) Group without through-going structure.
Geotechnics 06 00078 g004
Figure 5. Schematic diagram of the material strength testing process.
Geotechnics 06 00078 g005
Figure 6. Schematic diagram of the preparation process of the test model.
Geotechnics 06 00078 g006
Figure 7. Test equipment and pressure loading mode.
Geotechnics 06 00078 g007
Figure 8. Stress–strain and monitoring point displacement of intact rock specimen without through-going structure.
Geotechnics 06 00078 g008
Figure 9. Monitoring of displacement at different inclination model monitoring points.
Geotechnics 06 00078 g009
Figure 10. Peak strength comparison of rock specimens with through-going structures of different dip angles.
Geotechnics 06 00078 g010
Figure 11. Numerical model of through-going structural rock mass.
Geotechnics 06 00078 g011
Figure 12. Distribution cloud map of horizontal stress components of through-going structural rock masses under different inclinations.
Geotechnics 06 00078 g012
Figure 13. Distribution cloud map of vertical stress components of through-going structural rock masses under different inclinations.
Geotechnics 06 00078 g013
Table 1. Basic mechanical parameters of red sandstone and cement.
MaterialRock Material (Red Sandstone)Rock-like Material (Cement)
Density (ρ)/kg·m−32.98 × 1031.45 × 103
Compressive Strength/MPa35.477.54
Elastic Modulus (E)/GPa14.373.65
Poisson’s Ratio (μ)0.240.38
Cohesion (c)/MPa16.734.86
Internal Friction Angle (φ)/°38.443.2
Tensile Strength/MPa2.441.02
Table 2. Peak strength statistics.
Dip Angle (α)/°Peak Strength (σ1,max/MPa)Strength Deterioration/%
59.180
1040.7531.14
1542.4128.34
2051.4213.11
Table 3. Circumferential strain at peak strength.
Dip Angle/°P1P2P3P4
0.12 × 10−51.060.32 × 10−51.06
10117.43 × 10−50.767.43 × 10−50.76
15175.71 × 10−50.8114.20 × 10−50.82
20674.30 × 10−52.4870.84 × 10−52.50
Table 4. Circumferential strain under 20 MPa normal stress.
Dip Angle/°P1P2P3P4
0.07 × 10−50.600.18 × 10−50.60
1060.51 × 10−50.393.83 × 10−50.39
15109.28 × 10−50.518.83 × 10−50.51
20506.66 × 10−51.8653.23 × 10−51.88
Table 5. Statistical Table Comparing Theoretical Calculation of Circumferential Strain with Laboratory Test Results.
Dip Angle/°Theoretical Strain Value/10−5Measured Strain Value/10−5Stress Residual Coefficient (η)Deflection Angle/°
10342.5η390011.3910
15322.4η510015.8215
20296.7η18,60062.6920
Table 6. Mechanical parameters for numerical simulation.
Rock TypeDensity (ρ)/kg·m−3Elastic Modulus
(E)/GPa
Poisson’s Ratio (μ)Bulk Modulus
(K)/GPa
Shear Modulus
(G)/GPa
Cohesion (c)/MPaInternal Friction Angle (φ)/°
Intact Rock (Red Sandstone)2.98 × 10314.370.249.215.792.4438.4
Structural Filling (Cement)1.45 × 1033.650.385.071.321.0243.2
Table 7. Stress characteristic parameters from numerical simulation.
Dip Angle (α)/°σ1/MPaσ3/MPaσh,max/MPaσv,max/MPa
1014.0456.3514.2456.35
1513.8056.3513.9756.35
2013.6156.2113.7556.21
2513.4056.2513.5156.25
Table 8. Theoretical calculation table for stress environment of surrounding rock with different dip angles of through-going structures.
Dip Angle/°10152025
Vertical principal stress/MPa0.605 + 18.22η0.617 + 17.85η0.634 + 17.29η0.657 + 16.60η
Horizontal principal stress/MPa3.02η4.78η6.29η7.71η
Deflection angle/°arccot
(0.2003/η + 6.033)
arccot
(0.1291/η + 3.734)
arccot
(0.1008/η + 2.749)
arccot
(0.0852/η + 2.153)
Table 9. Statistical Table Comparing Theoretical Calculation of Circumferential Stress with Numerical Simulation Results.
Dip Angle/°Vertical Principal Stress/MPaHorizontal Principal Stress/MPaStress Residual Coefficient (η)Deflection Angle/°
1057.459.422.53129.9
1535.969.461.983014.7
2026.579.441.502119.5
2521.089.481.231224.2
Table 10. Comparison Table of Laboratory Test Data and Numerical Simulation Data.
Dip Angle/°Laboratory Test DataNumerical Simulation Data
Stress Residual Coefficient (η)Deflection Angle/°Stress Residual Coefficient (η)Deflection Angle/°
1011.39102.53129.9
1515.82151.983014.7
2062.69201.502119.5
251.231224.2
Disclaimer/Publisher’s Note: The statements, opinions and data contained in all publications are solely those of the individual author(s) and contributor(s) and not of MDPI and/or the editor(s). MDPI and/or the editor(s) disclaim responsibility for any injury to people or property resulting from any ideas, methods, instructions or products referred to in the content.