Article

Serviceability-Controlled Uncertainty Bounds for Jet-Grouted Rocking Foundations

by
Ali Ghaffarnezhad Parto
1,
Arya Assadi-Langroudi
2,*,
Emad Maleki Tabrizi
1,
Arash Esmatkhah Irani
2,
Masoud Hajialilue-Bonab
1 and
Meghdad Bagheri
2
1
Department of Civil Engineering, University of Tabriz, Tabriz 51656-16471, Iran
2
Cluster of Engineering, University of East London, London E16 2RD, UK
*
Author to whom correspondence should be addressed.
Geotechnics 2026, 6(3), 67; https://doi.org/10.3390/geotechnics6030067
Submission received: 8 June 2026 / Revised: 10 July 2026 / Accepted: 16 July 2026 / Published: 20 July 2026

Abstract

Rocking foundations reduce seismic force demand through controlled uplift and rotation, but their application remains limited by uncertainty in residual settlement and recentring capacity. Grouting is often employed to reduce these serviceability concerns, yet uncertainty in the geometry of the improvement and seismic demand constrains confident adoption. This paper examines whether strength- and serviceability-related responses of jet-grouted rocking foundations exhibit comparable epistemic uncertainty when motion amplitude and grouting layout are represented by bounded Random Set inputs. A sparse deterministic response database was generated using three-dimensional finite-difference modelling for isolated columns, directional walls, and intersecting walls beneath a 3 × 3 m2 foundation supporting a bridge-pier-type structure. The grouting layout was represented by a directional stiffness isotropy index. Motion demand was represented through bounded peak ground acceleration intervals. The deterministic results indicate that walls aligned with the excitation direction provide greater settlement reduction and energy dissipation than isolated columns or perpendicular walls. Variation in the depth of intersecting walls further reveals a trade-off between settlement reduction and recentring capacity. Random Set propagation was then used to construct uncertainty bounds for maximum moment, residual settlement, and recentring ratio. The results show that moment demand is comparatively well constrained, whereas serviceability indicators exhibit wider epistemic uncertainty.

1. Introduction

Controlled uplift and rotation at the soil–foundation interface can reduce seismic force demand transmitted to the superstructure by shifting part of the deformation demand from the structure to the foundation–soil system [1,2,3]. Widespread adoption of rocking foundations, however, remains limited by less well-understood residual settlement, residual rotation, and incomplete recentring after strong shaking [1].
As uplift develops, the effective contact area contracts and the resultant vertical load is transferred through a smaller bearing region, altering moment capacity, local soil deformation, and hysteretic energy dissipation [4,5,6]. Maximum moment and maximum rotation describe the peak demand imposed on the rocking foundation during shaking. However, the acceptability of the system after shaking depends mainly on residual settlement, residual rotation, and recentring capacity. Centrifuge [5,7] and full-scale shaking table experiments [8] have shown that rocking foundations can provide valuable energy dissipation through the hysteretic area enclosed by the moment-rotation loop. Energy dissipation becomes a serviceability concern when it coincides with residual deformations and reduced recentring after cyclic uplift and re-contact [5,8,9]. To examine this trade-off and establish whether strength and serviceability are bounded with the same level of epistemic uncertainty, this study considers four distinct indicators: maximum moment as a measure of strength-related response; maximum rotation as a measure of deformation demand; and residual settlement and recentring ratio to represent serviceability. Damping ratio and dissipated energy are retained as interpretive variables.
Grouting beneath the footing has been explored as a means of controlling the serviceability demands without suppressing the rocking mechanism entirely. The effectiveness of grouting, however, remains uncertain and dependent on the layout, the depth of grouting, and the evolving contact area beneath the footing. Existing studies show that the retrofit mechanism is strongly geometry-dependent. Shallow grouting can reduce settlement [10], depending on the depth of improvement and cyclic rotation amplitude. Unattached piles [11], diaphragm walls [12], and stone columns [13] can curb permanent deformations caused by the rocking motion. For the latter, severe shaking may still lead to local crushing or excessive settlement in weaker improved configurations. Nevertheless, most available interpretations remain deterministic.
For rocking foundations on grouted subsoil, uncertainty arises from both natural variability and limited knowledge. Soil properties and seismic demand are intrinsically variable. The stiffness of the grouted soil, area replacement ratio, directional stiffness, and motion amplitude are often available only as sparse or interval-based information. In such cases, fully probabilistic analysis becomes strongly dependent on assumed distributions. A Random Set framework is more appropriate since probability mass can be assigned to bounded sets of plausible input values rather than to precise values or prescribed probability density functions.
Random Set Theory originated from lower–upper probability and evidence-theory concepts [14,15] and was later formalised as a set-valued probability framework capable of representing intervals, probability boxes, possibility distributions, and Dempster–Shafer structures [16,17,18,19,20]. In geotechnical engineering, Random Sets have been used to represent sparse or imprecise information in rock, slope, excavation, and tunnel problems [21,22,23,24,25]. In the present study, the deterministic finite-difference simulations are treated as a sparse numerical response database, and Random Set propagation is used to distinguish relatively stable strength responses from serviceability indicators with wider epistemic uncertainty.
The specific contribution of this study is the coupling of a layout-sensitive jet-grouting descriptor with sparse three-dimensional finite-difference simulations and Random Set propagation to compare strength- and serviceability-related uncertainty bounds. The directional stiffness isotropy index is used as a reduced descriptor of plan-view improvement geometry, and the Random Set framework propagates bounded uncertainty in motion amplitude and layout directionality without imposing unsupported probability distributions.

2. Methods

2.1. Deterministic Simulation

A three-phase finite-difference modelling strategy was used for the deterministic analysis. The geometry, material definitions, and static equilibrium were established in the first phase. The second phase introduced the structure and defined the interface, separating the nonlinear soil domain from the elastic structural components. The third phase imposed dynamic loads via harmonic base excitation.
The simulation was performed using FLAC 3D software, version 9.2. The mesh was refined beneath and around the footing, where contact stresses and shear strains were expected to localise, and was gradually coarsened towards the far-field boundaries. The dynamic timestep was controlled to satisfy the numerical stability requirements of the explicit finite-difference scheme. The soil domain consisted of dry, medium-dense sand. The Mohr–Coulomb (M-C) model was adopted as a transparent elastoplastic representation of the dry sand domain, suitable for comparing the influence of alternative grouting layouts under otherwise identical conditions. Although, unlike advanced constitutive models, the M-C model cannot reproduce all element-level cyclic features of sand, processes such as strain-dependent stiffness degradation or cyclic densification fall outside the scope of the present dry sand simulations. The foundation and superstructure were assumed to be linear elastic with a stiffness 100 times that of the soil to eliminate plastic hinging and ensure that the rocking motion was governed by the soil–foundation system. The contact interface was governed by a Coulomb sliding criterion, with zero tensile stiffness to permit uplift and separation. Normal and shear stiffnesses were calculated using the elastic properties of the neighbouring soil zones and the minimum grid size across the interface, following earlier empirical formulations [26].
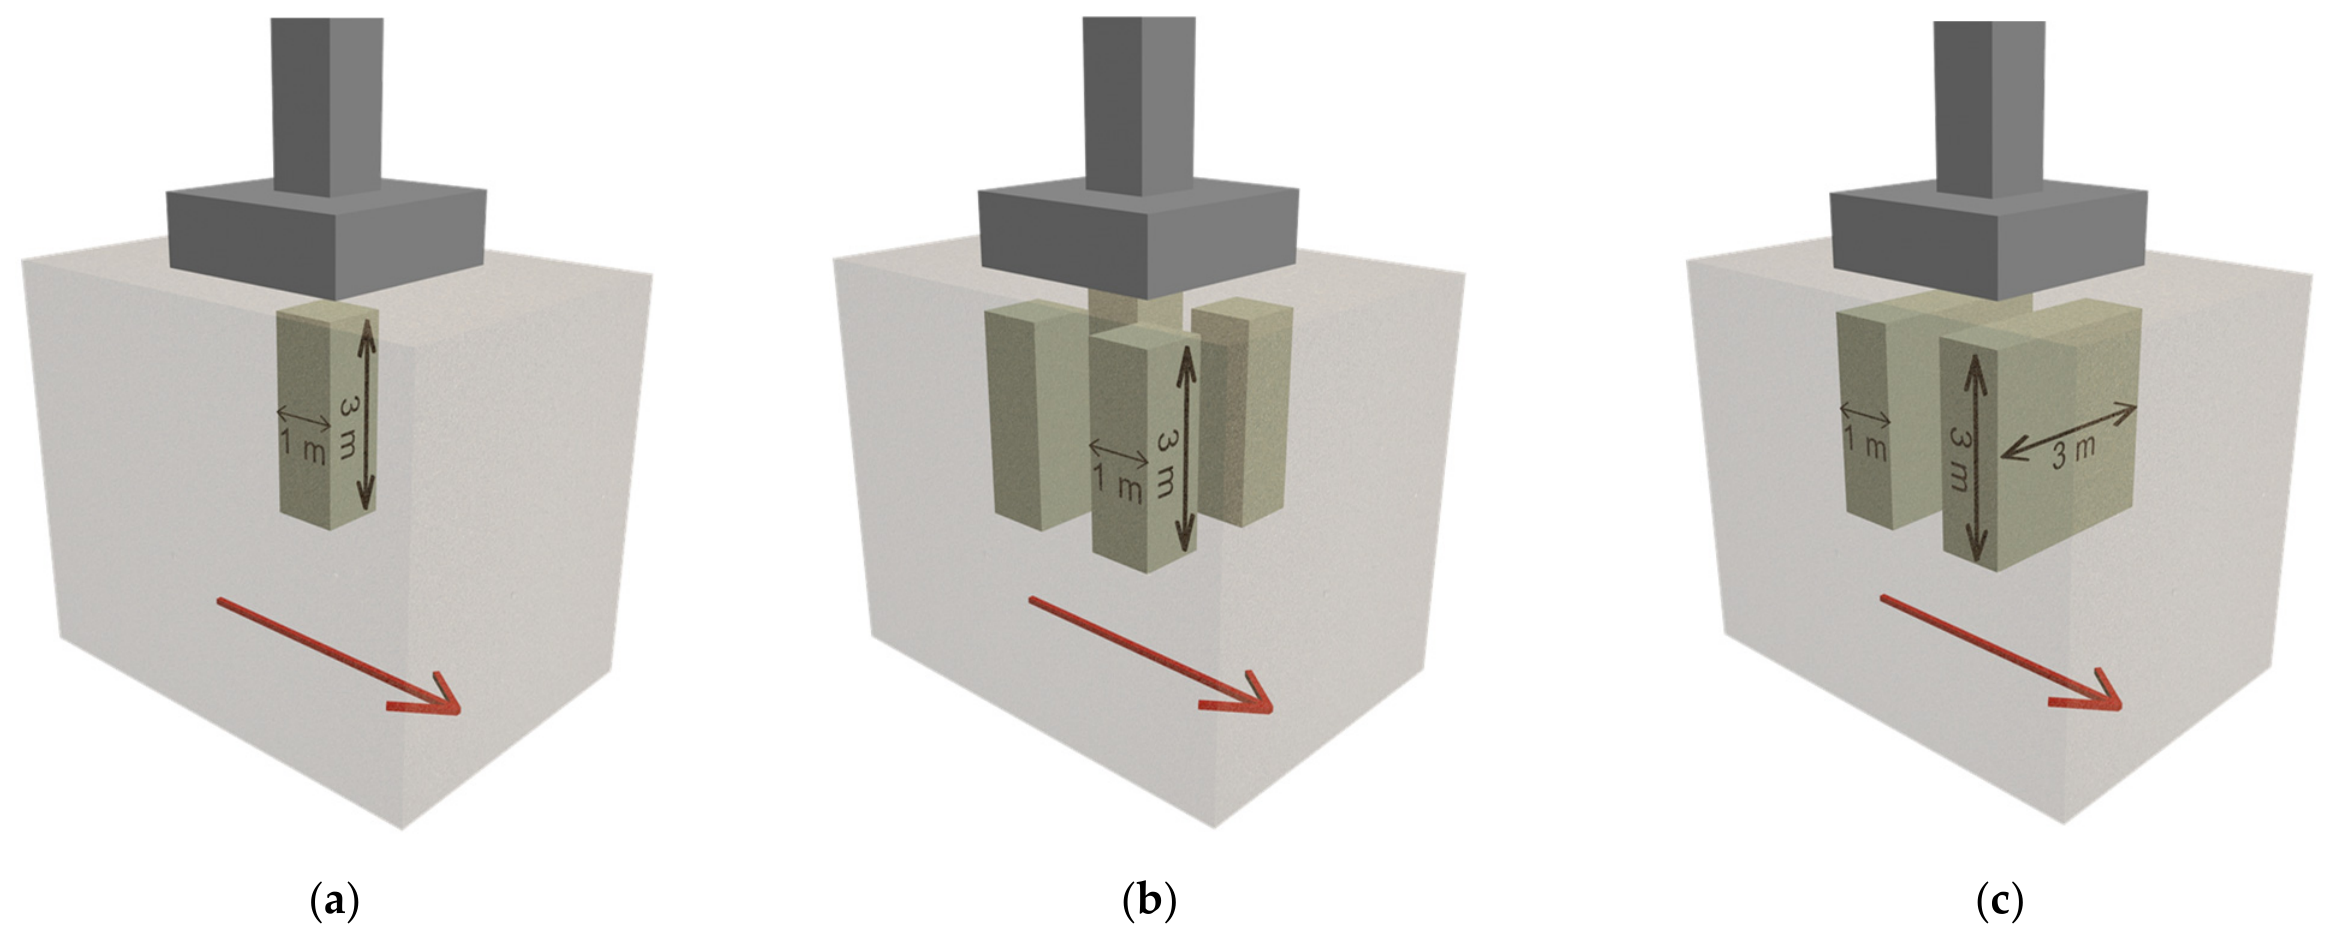
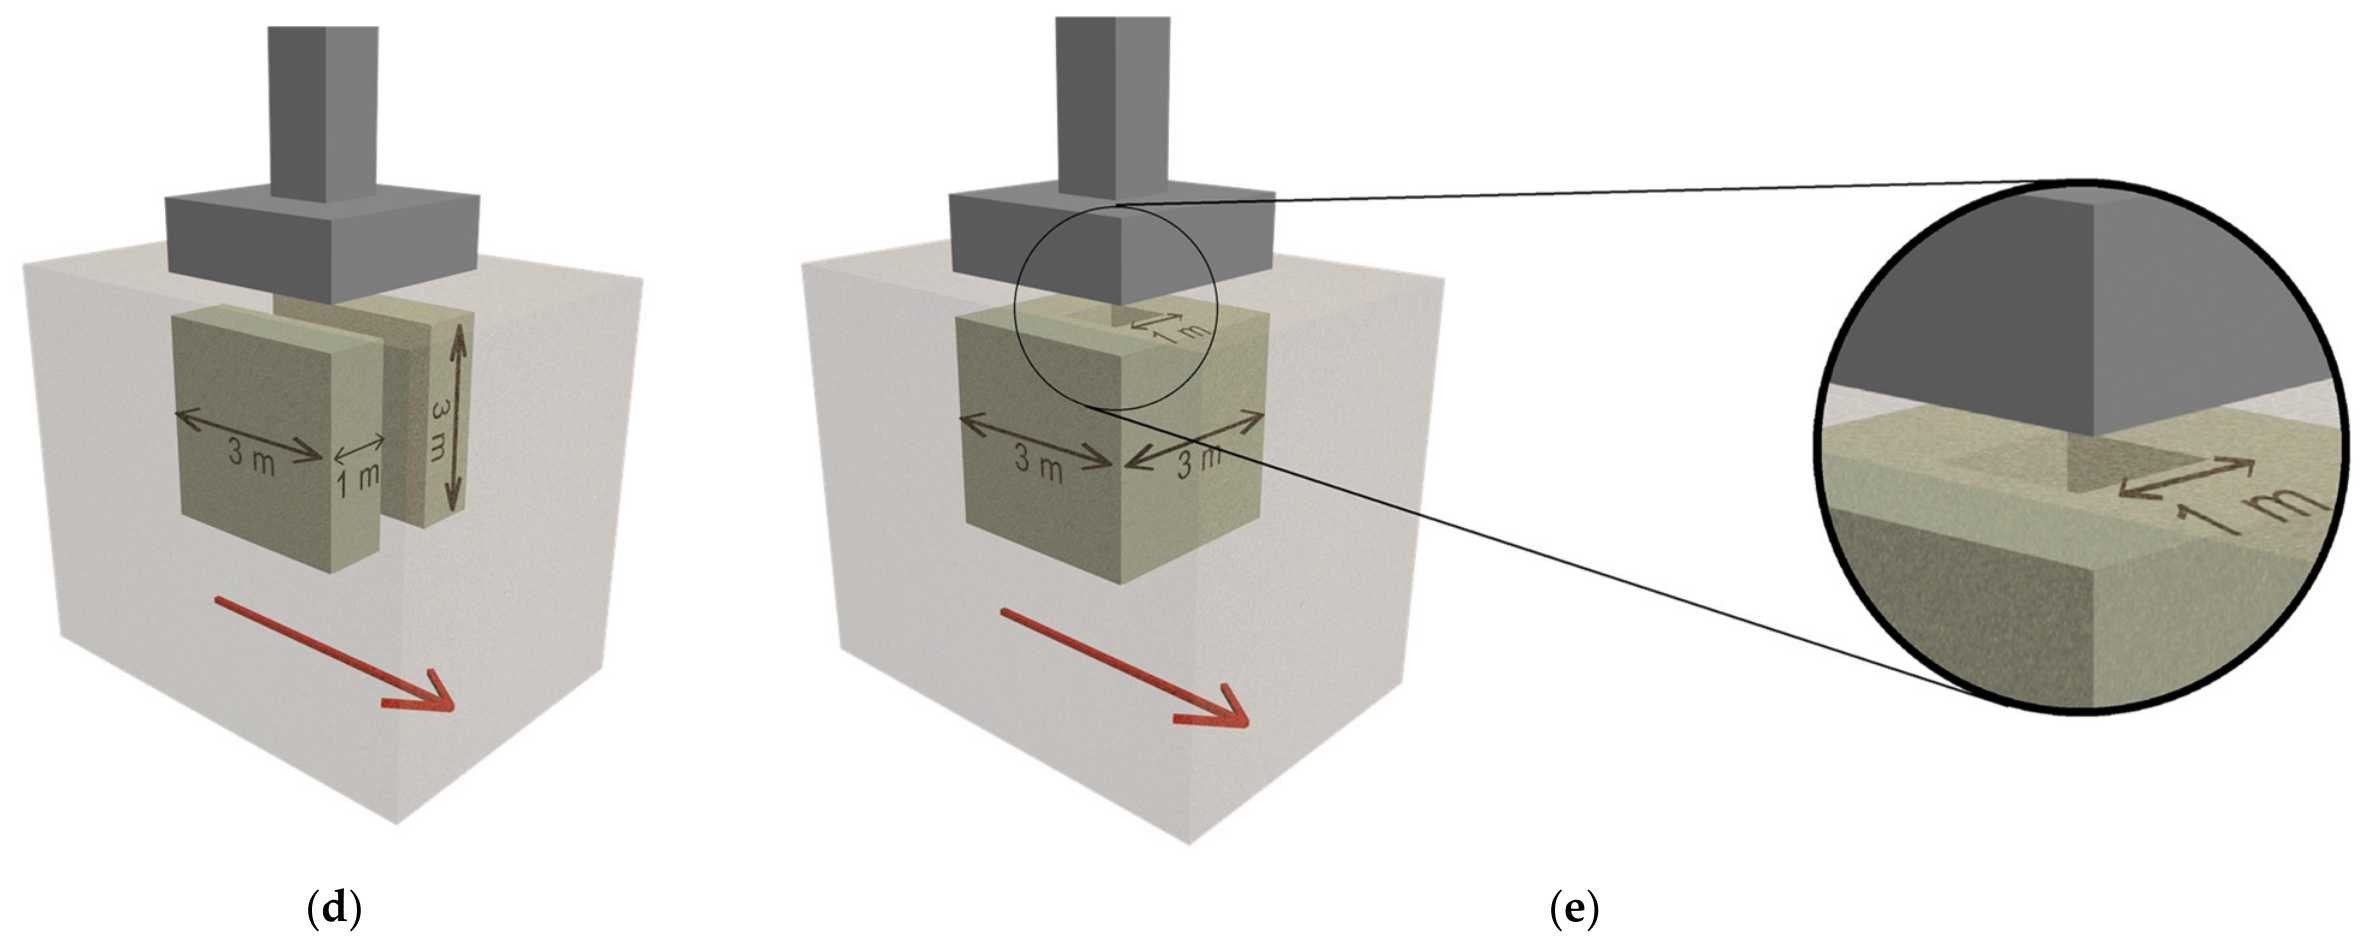
Five jet-grouting layouts (Figure 1) were considered beneath a 3 × 3 m2 shallow foundation: (a) a single 1 × 1 m2 central column (JG-1C), (b) four 1 × 1 m2 columns at the corners (JG-4C), (c) two 1 × 3 m2 diaphragm walls aligned with the X-direction (JG-XR), (d) two 1 × 3 m2 diaphragm walls aligned with the Y-direction (JG-YR), and (e) four intersecting 1 × 3 m2 diaphragm walls along both directions (JG-PR). The ratio of injection depth to foundation width (D/B) was initially fixed at 1.0. For the intersecting wall configuration (JG-PR), this ratio was further varied between 0.5 and 1.5, in increments of 0.5, to examine the influence of improvement depth. In Figure 1, the red arrow indicates the input excitation direction; X and Y denote the plan-view reference directions used to define JG-XR and JG-YR.
To avoid stress concentrations at the grouting element tips and potential crushing during cyclic motion, a 0.6 m-thick buffer layer was considered between the foundation base and the top of the grouting zone. To characterise the directional balance of the different grouting layouts, a directional stiffness isotropy index ( I D S ) was defined as:
I D S = ω v . S v + ω x . S x + ω y . S y + ω t . S t ,
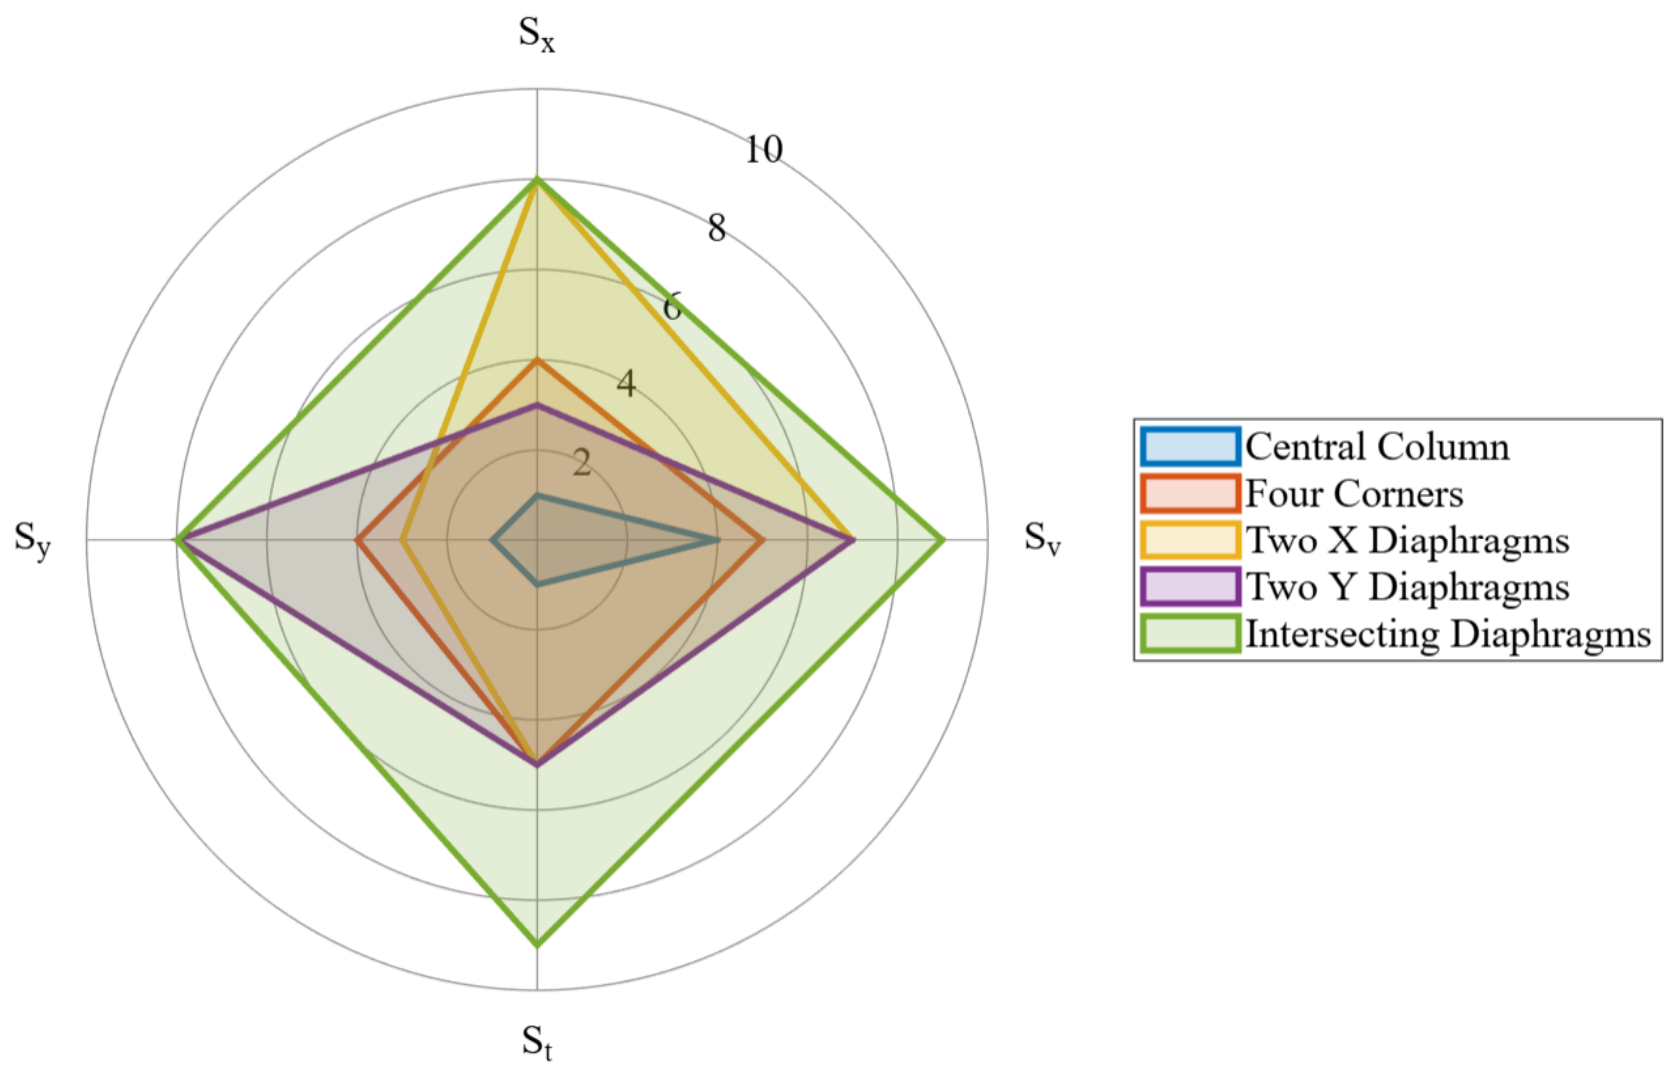
where S v , S x , S y , and S t represent sub-scores (ranging from 0 to 10) corresponding to vertical stiffness, lateral stiffness in the X - and Y -directions, and torsional resistance, respectively, and ω denotes the associated weighting factors. Equal weighting ( ω v = ω x = ω y = ω t = 0.25 ) was adopted to provide a neutral representation of the directional stiffness components in the absence of prior calibration data, thereby enabling an isotropic comparison across layouts. The resulting I D S values ranged from 1.75 for a single central column to 8.50 for the intersecting diaphragm wall system. Figure 2 highlights the progressive increase in directional stiffness isotropy from column-based layouts to intersecting wall systems, with the latter exhibiting a more balanced distribution of stiffness components. The configurations, geometric parameters, and loading conditions considered in the simulations are summarised in Table 1.
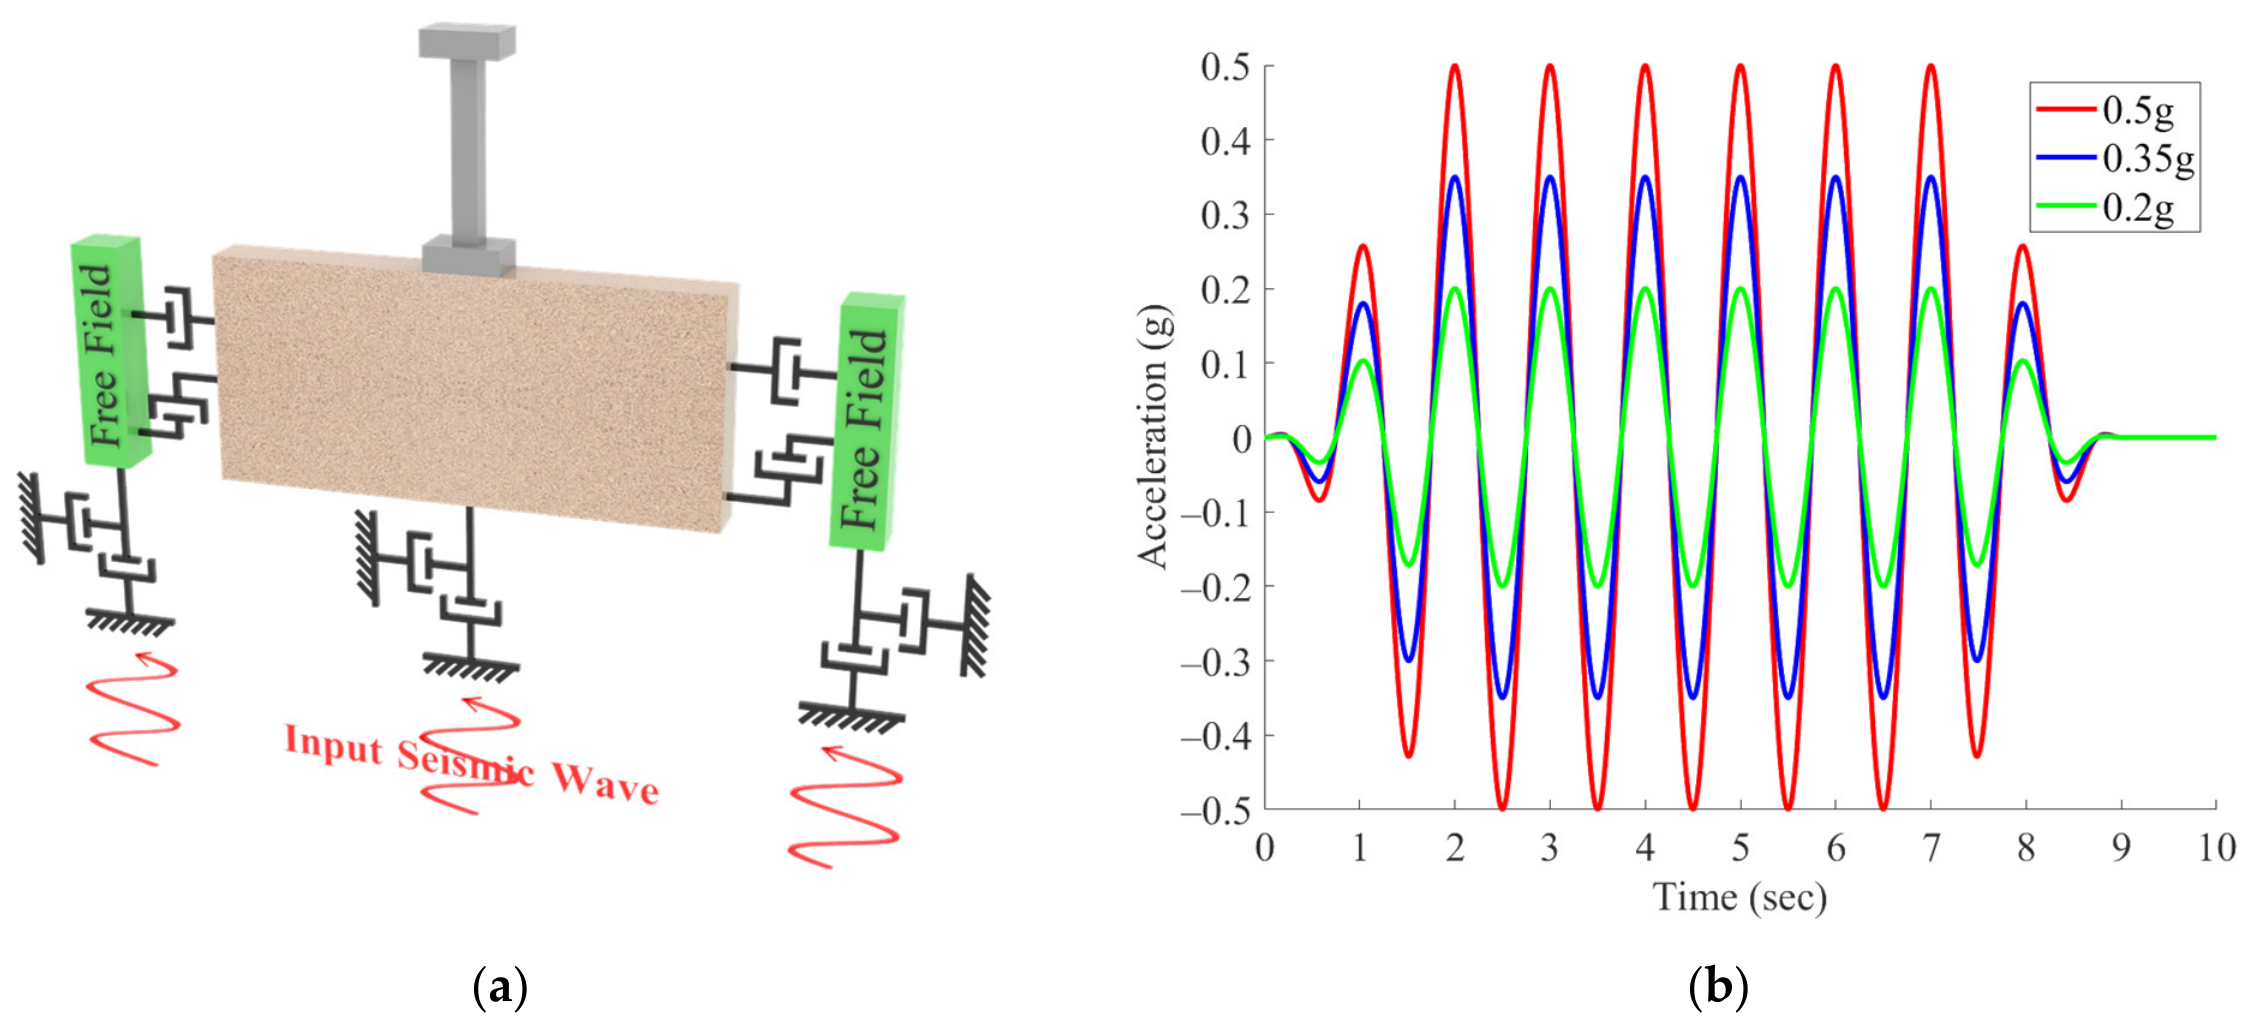
Materials used in the simulations included sand for the soil domain, an idealised linear-elastic material for the foundation and superstructure, and a typical sand–cement mix for the jet-grouting elements. The structural elastic modulus was set to 2100 MPa, approximately 100 times greater than that of the sand, to suppress structural deformation and plastic hinging and to keep the stiffness contrast compatible with the explicit finite-difference contact calculation. The corresponding material properties are summarised in Table 2. For the sand in Table 2 with a typical specific gravity of G s = 2.65 , the γ d = 15.8 kN/m3 corresponds to a void ratio of approximately e = 0.65 . This value, together with the adopted friction angle of 33°, is consistent with dry medium-dense sand. Free-field boundary conditions were applied at the model boundaries to minimise artificial wave reflections. Dynamic loading was applied via artificial harmonic acceleration waves of constant frequency and varying amplitudes (Figure 3), with peak ground accelerations (PGA) of 0.2 g (low), 0.35 g (moderate), and 0.5 g (high). The red arrow in Figure 3a represents the seismic wave input applied to the system from the lower boundary. Each PGA level was applied independently to evaluate the system response under distinct seismic demand conditions. This approach differs from conventional analyses that apply cumulative loading histories within a single simulation and was adopted to isolate the effect of excitation intensity on system behaviour.
Harmonic excitation was used as a controlled cyclic benchmark. This allowed the response of different grouting layouts to be compared under identical amplitude, frequency, and cycle-number conditions, and enabled consistent extraction of moment-rotation loops, residual settlement, equivalent damping, and recentring ratio. Real accelerograms are broadband and non-stationary, and their effects depend on frequency content, duration, pulse characteristics, vertical excitation, and multi-directional loading. The numerical values reported here should therefore not be transferred directly to real earthquake records without further record-based analysis using suites of scaled accelerograms.

2.2. Random Set Formulation and Response Reduction

The deterministic finite-difference simulations were treated as a sparse response database. For this, Random Set theory was used to propagate bounded input uncertainty through this database and to compare the uncertainty widths of strength- and serviceability-related responses. The principal purpose was to determine whether the main response quantities of the jet-grouted rocking foundation were bounded with comparable levels of epistemic uncertainty.
In the present framework, the uncertain input vector is defined as
x = P G A ,   I D S  
where P G A represents the imposed motion amplitude and I D S is the directional stiffness isotropy index used to describe the grouting layout.
Adoption of P G A and I D S defines a two-variable uncertainty-propagation space used to test whether motion amplitude and plan-view improvement-layout directionality produce comparable uncertainty in strength- and serviceability-related responses. Other uncertain quantities, including sand properties, stiffness degradation, grout strength, stiffness, and continuity, were kept deterministic so that the propagated response bounds could be attributed to the P G A I D S interaction. Geometric and contact nonlinearities were not removed from the analysis and were embedded in the finite-difference response mapping through uplift, loss and recovery of contact, Coulomb sliding, local yielding, and settlement accumulation. Grout depth was not included in the Random Set propagation as its influence was examined separately through the deterministic depth study of the intersecting wall layout. The uncertain input space was represented using two bounded focal elements
A 1 = 0.20 g ,   0.35 g × 1.75,4.50  
A 2 = 0.35 g ,   0.50 g × 4.50 ,   5.75  
where A 1 represents lower-to-moderate excitation with lower directional stiffness balance, and A 2 represents moderate-to-high excitation with stronger directional stiffness balance. In the absence of a larger statistical population from which relative frequencies could be inferred, the two focal elements were assigned equal basic probability masses. These masses are non-informative assignments and should not be interpreted as measured occurrence frequencies. Unequal masses or a finer subdivision of focal elements would require supporting statistical or experimental evidence; otherwise, additional subjective weighting would be introduced into the Random Set formulation.
m A 1 = m A 2 = 0.5  
i = 1 2 m A i = 1
Each focal element therefore represents a bounded region of plausible input conditions rather than a single deterministic input value. This is the key distinction between the present Random Set treatment and a conventional probabilistic analysis. Probability mass is assigned to intervals of admissible values, not to exact values or assumed probability distributions.
For a given response quantity Y j , the finite-difference model provides a mapping,
Y j = g j x  
where Y j may represent maximum moment, maximum rotation, residual settlement, damping ratio, recentring ratio, or dissipated energy. For each focal element A i , the corresponding response interval was obtained from the deterministic simulations evaluated at the vertices of the input box:
g j A i = min x V ( A i ) g j x , max x V ( A i ) g j x    
where V ( A i ) is the set of vertex combinations of P G A and I D S . For the two-dimensional input space used here, each focal element has four vertices. These vertex evaluations correspond to available combinations of motion amplitude and grouting layout in the deterministic database. Where two layouts share the same I D S , the orientation-specific deterministic responses were retained in the response interval rather than averaged, so that layout-orientation effects remained embedded in the propagated bounds.
The vertex method was adopted because the objective was to obtain lower and upper response envelopes from a limited set of high-cost three-dimensional simulations. This implementation should be interpreted as bounded propagation of the available deterministic response database, rather than as proof of the global extrema of a fully continuous response surface. This distinction is important because the rocking response can be nonlinear. The resulting p-boxes (i.e., probability boxes) therefore quantify epistemic uncertainty within the simulated input domain.
For each response Y j , the image of each focal element is an output interval
B i j = g j A i = Y i j , Y i j +    
with the same probability mass as the corresponding input focal element. The Y i j and Y i j + are the minimum and maximum response values obtained from the vertex evaluations of focal element A i . The lower and upper cumulative probability bounds for a threshold value y were then computed as
F _ Y j ( y ) = i : Y i j + y m A i  
F ¯ Y j ( y ) = i : Y i j y m A i  
where F _ Y j ( y ) is the belief-based lower cumulative bound and F ¯ Y j ( y ) is the plausibility-based upper cumulative bound. The region between these two curves forms the probability box, or p-box, for the response quantity. A narrow p-box indicates that the deterministic simulations provide a relatively constrained response despite input uncertainty, whereas a wide p-box indicates that the response remains sensitive to the bounded input combinations.
Before constructing the p-boxes, the response set was reduced to avoid propagating strongly dependent quantities as if they were independent indicators. Six response quantities were initially extracted from the deterministic simulations: maximum rotation, maximum moment, residual settlement, damping ratio, recentring ratio, and dissipated energy. Their interdependence was assessed using Spearman’s rank correlation coefficient [27] and distance correlation [28]. Spearman’s coefficient was used to identify monotonic relationships, while distance correlation was used to detect both linear and nonlinear dependence. The two measures were visualised in a merged heatmap, with Spearman correlation in the lower triangle and distance correlation in the upper triangle.
This screening step showed that maximum moment and maximum rotation were strongly related, dissipated energy was strongly linked to the moment-rotation response, and damping ratio was strongly associated with residual settlement. The Random Set propagation was therefore applied to three representative quantities: maximum moment, residual settlement, and recentring ratio. Maximum moment represents the strength-related response; residual settlement represents the permanent serviceability demand; and recentring ratio represents the post-shaking recovery. The comparison of their p-box widths forms the basis for distinguishing relatively stable strength responses from serviceability indicators with wider epistemic uncertainty.

3. Results

3.1. Validation

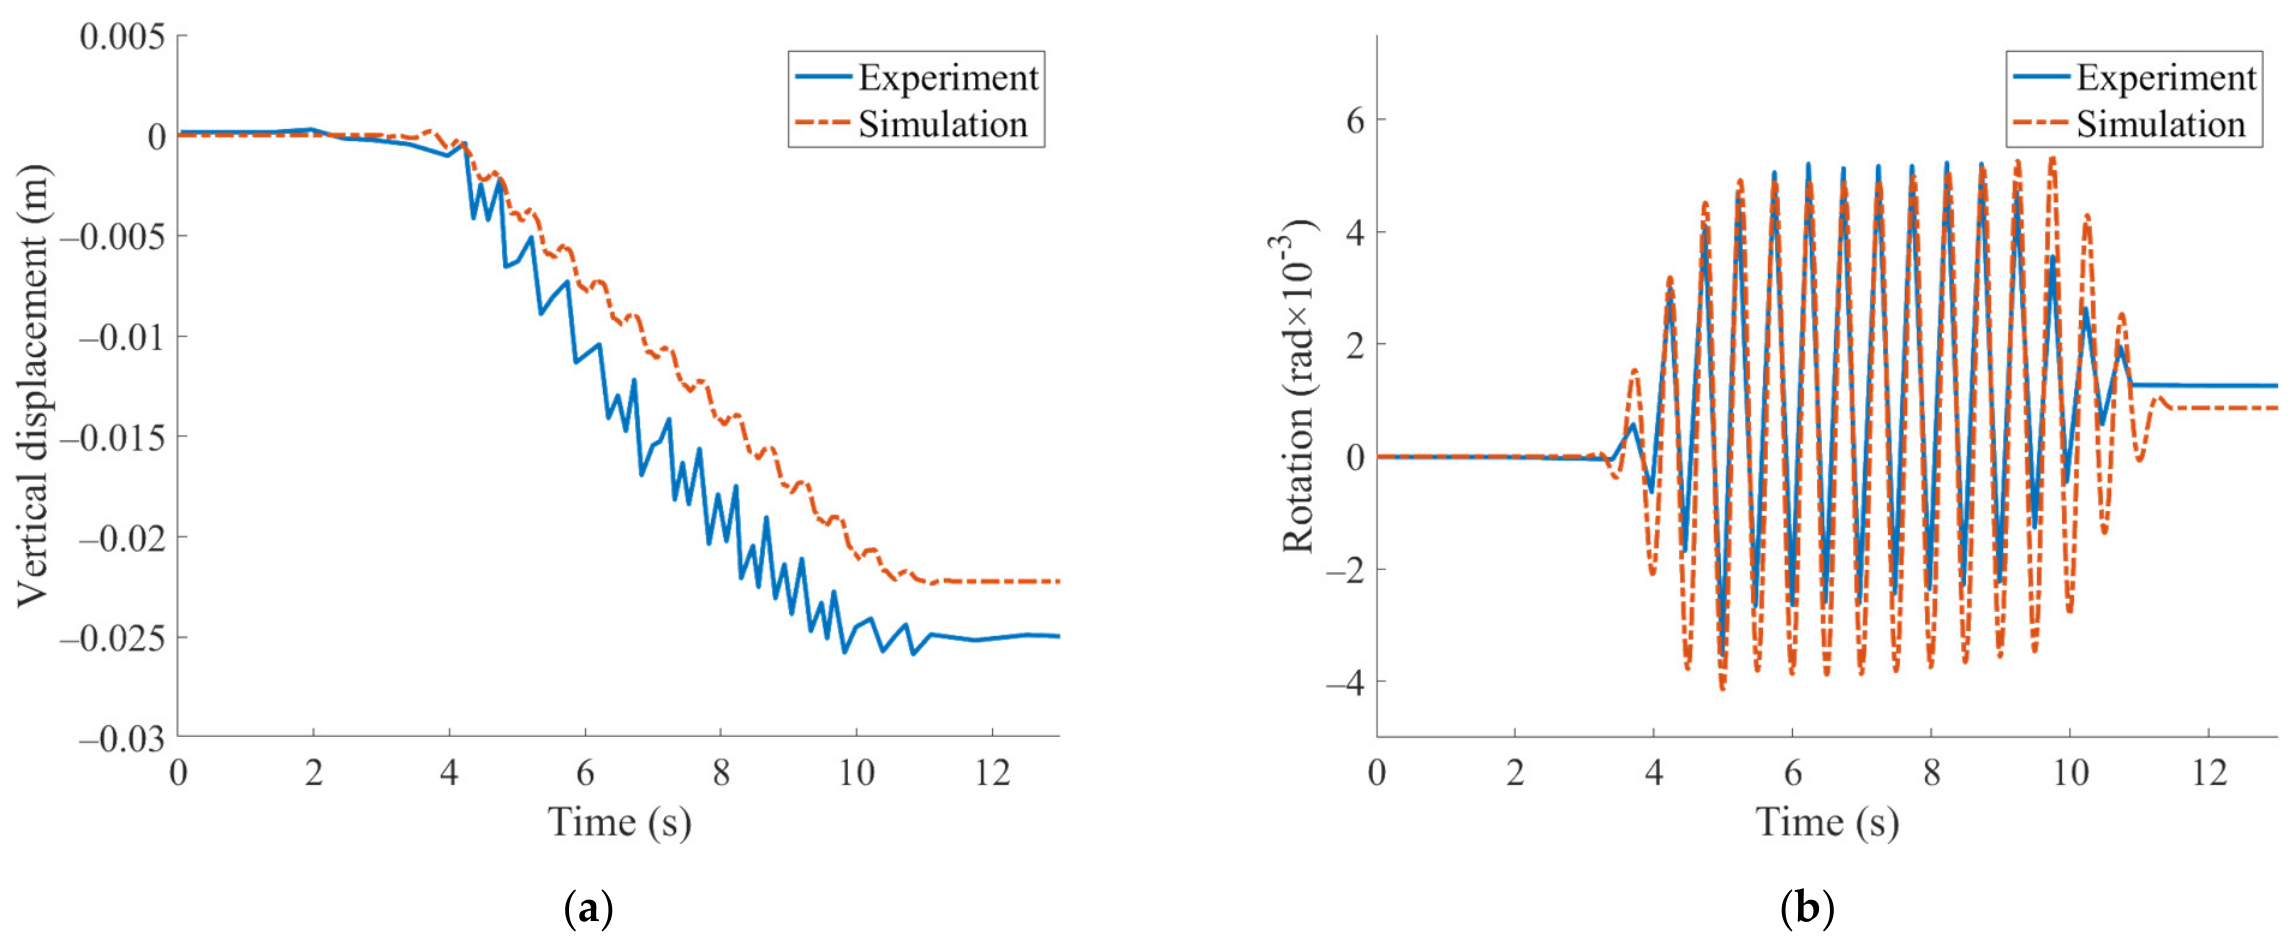
The model was validated against the shaking-table tests of Tsatsis and Anastasopoulos [26] for a square rocking foundation on dry sand. This case was adopted since it reproduces the principal mechanism considered in the retrofitted rocking foundation problem in this study, namely, cyclic uplift and re-contact of a square foundation supporting an idealised slender bridge-pier system. In Figure 4, the model reproduced the main time history features of settlement accumulation and cyclic rotation, with residual settlement slightly underestimated (10–15%) and peak rotation slightly overpredicted (5–10%). These differences are attributed to the simplified soil stiffness profile, idealised boundaries, and the use of a simple elastoplastic sand model. Readings were not corrected by tuning as only one baseline dry sand validation case was available, and applying correction factors from this single case to all grouting layouts would risk overfitting the validation experiment. The validation presented in Figure 4 should be regarded as a baseline rocking-mechanism validation. Direct validation of each jet-grouting configuration was not possible because experimental data for jet-grouted rocking foundations remain scarce. However, the simulated trends are consistent with previous experimental observations that shallow improvement modifies the rocking mechanism by changing the mobilised soil volume, settlement accumulation, and recentring behaviour.

3.2. Baseline

To establish a baseline for comparison, a 45-tonne, 9 m high bridge pier, resting upon a 3 × 3 m foundation on the surface of a 15 × 20 × 9 m soil domain, was simulated through three-dimensional finite-difference analysis. The vertical factor of safety ( F S v ) was fixed at 4.93. A finer mesh was used near the foundation; the mesh was made coarser towards the model base and the far field. The grouted elements were assigned properties based on experimental data reported in [29], including a uniaxial compressive strength of approximately 1.24 MPa and a tensile strength of approximately 0.70 MPa. Given the relatively low sensitivity of rocking-induced stress in grouted soil and the surrounding soil to stiffness variations, the Mohr–Coulomb (M-C) constitutive model was deemed suitable for representing the sand. Note that, rather than cyclic behavioural markers of sand such as strain-dependent stiffness degradation or densification, the main nonlinearities examined here are system-level mechanisms associated with footing uplift, reduction in contact area, re-contact, local yielding, and settlement accumulation. To this end, whilst the M-C model fits the purpose, the results should be interpreted as comparative predictions within the stated modelling assumptions, and not as direct site-specific forecasts.
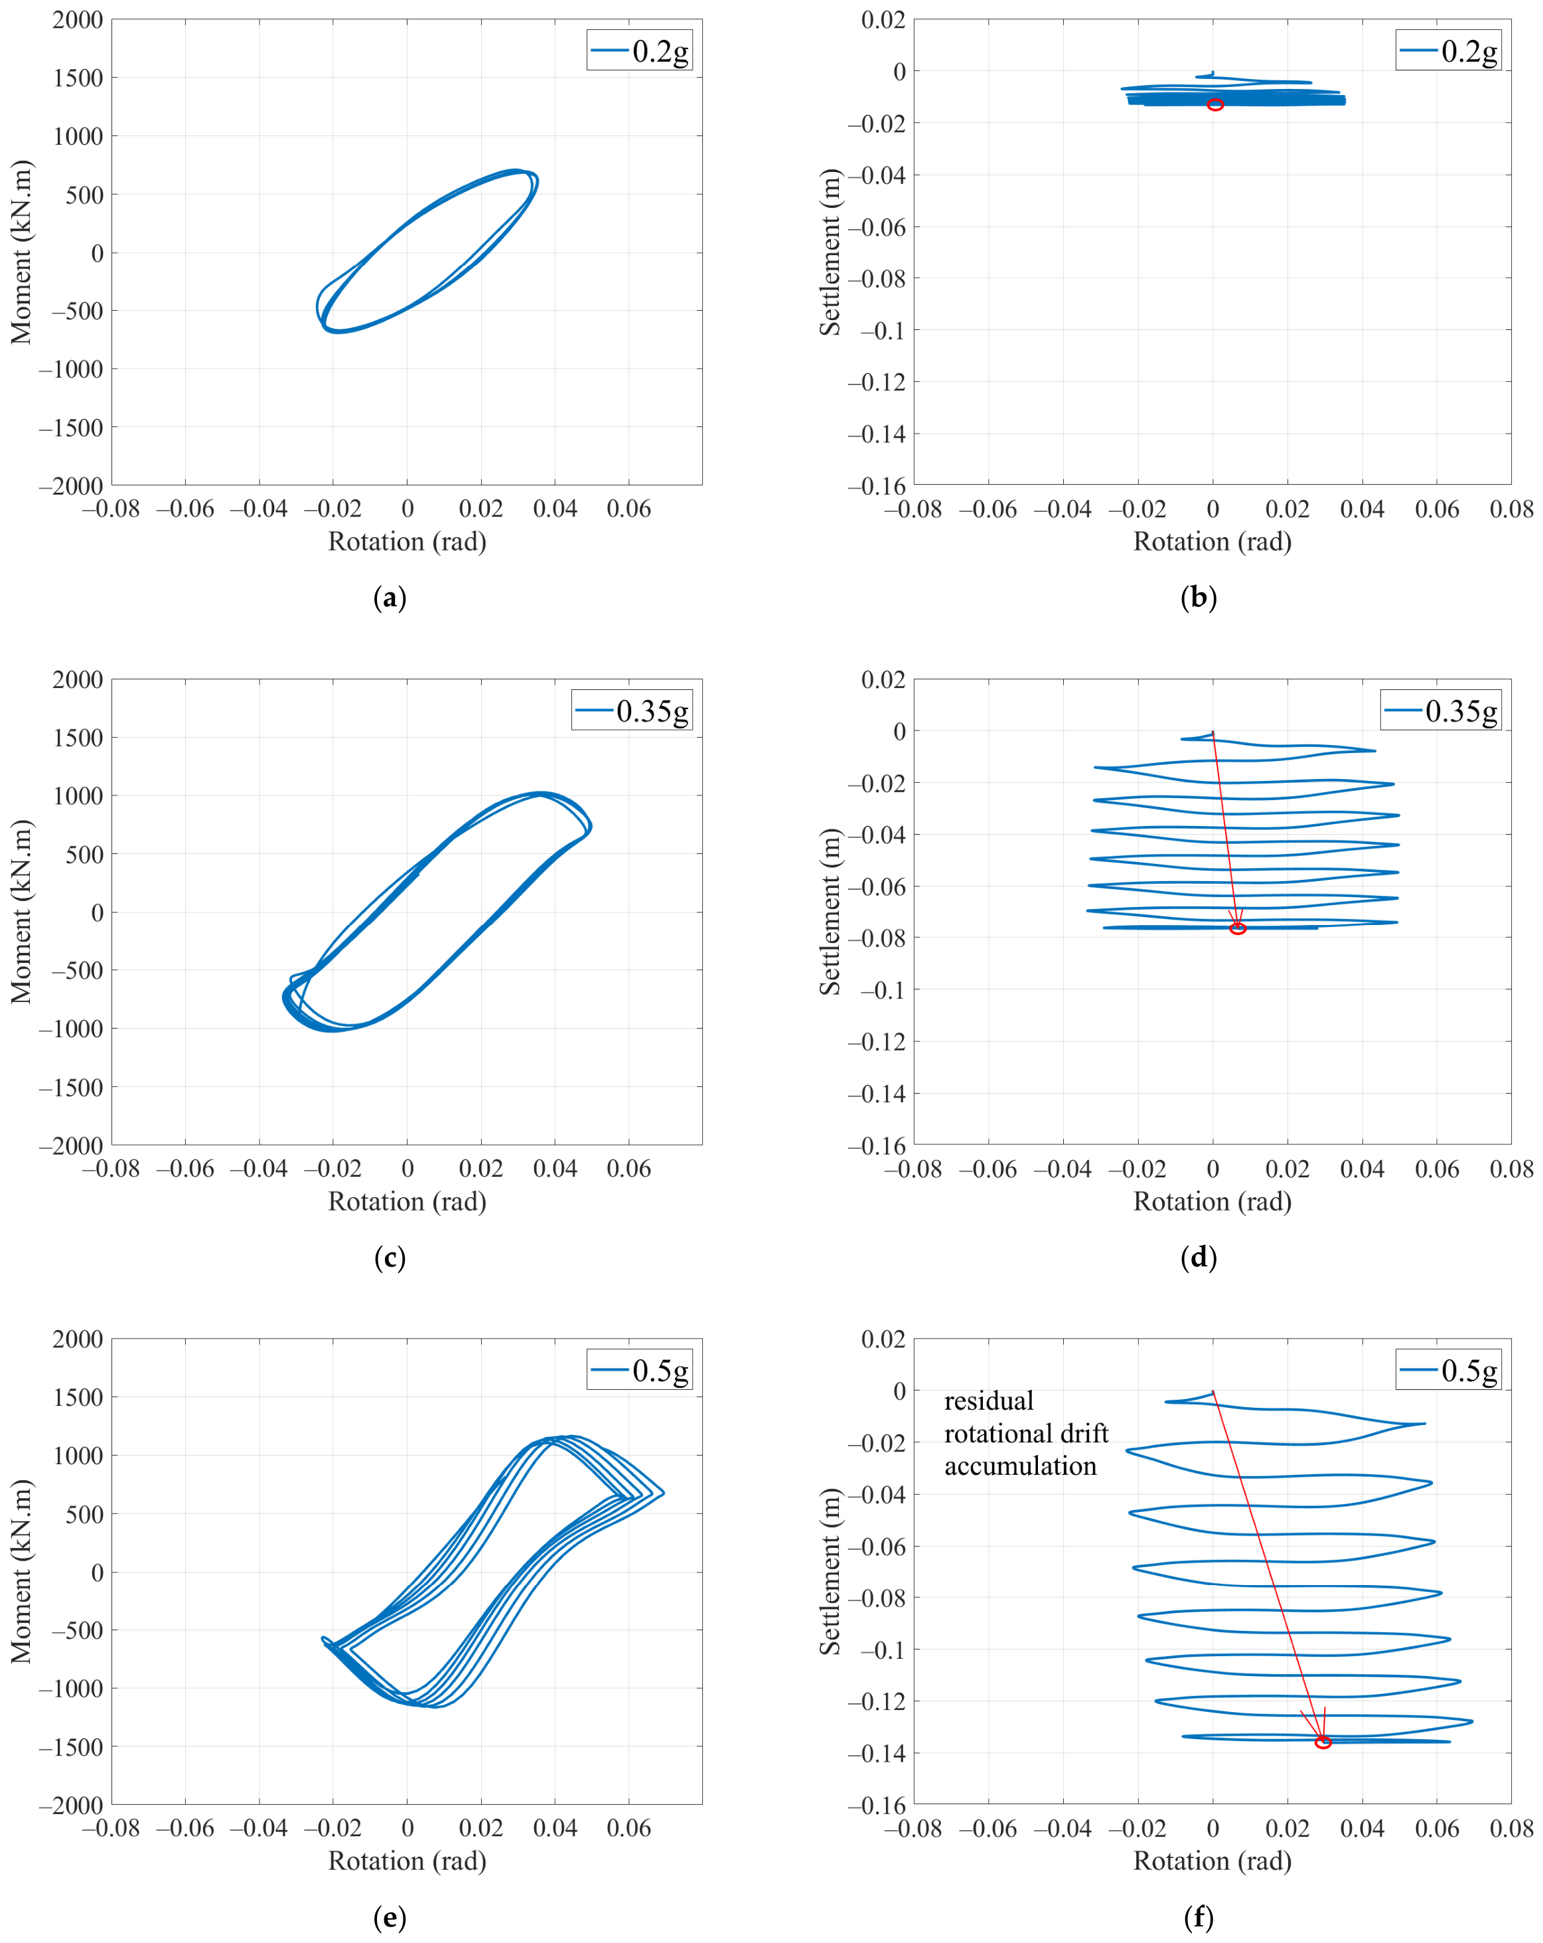
The procedures matched those followed in the model verification phase, except that the dynamic loading was applied only at the model base. Figure 5 compares the hysteretic behaviour of the system under increasing peak ground accelerations.
In Figure 5, the baseline moment-rotation and settlement-rotation loops exhibited increasing nonlinearity as PGA increased from 0.2 g to 0.5 g. The moment-rotation loops expanded in area to indicate enhanced hysteretic energy dissipation. However, this was accompanied by a sharp increase in permanent settlement, from 1.3 cm at 0.2 g to 7.6 cm at 0.35 g and more than 13.6 cm at 0.5 g. At 0.5 g, the baseline model showed a marked deterioration in serviceability. Settlement exceeded 13 cm, and the settlement-rotation loops became progressively biased towards positive rotation. This indicates incomplete recentring and the development of residual rotational drift (see Figure 5d–f). Compared with the 0.2 g and 0.35 g cases, the response no longer remained centred around the initial vertical configuration. This suggests the onset of a serviceability threshold beyond which the rocking mechanism no longer provides reliable self-recentring.

3.3. Effect of Grouting Layout

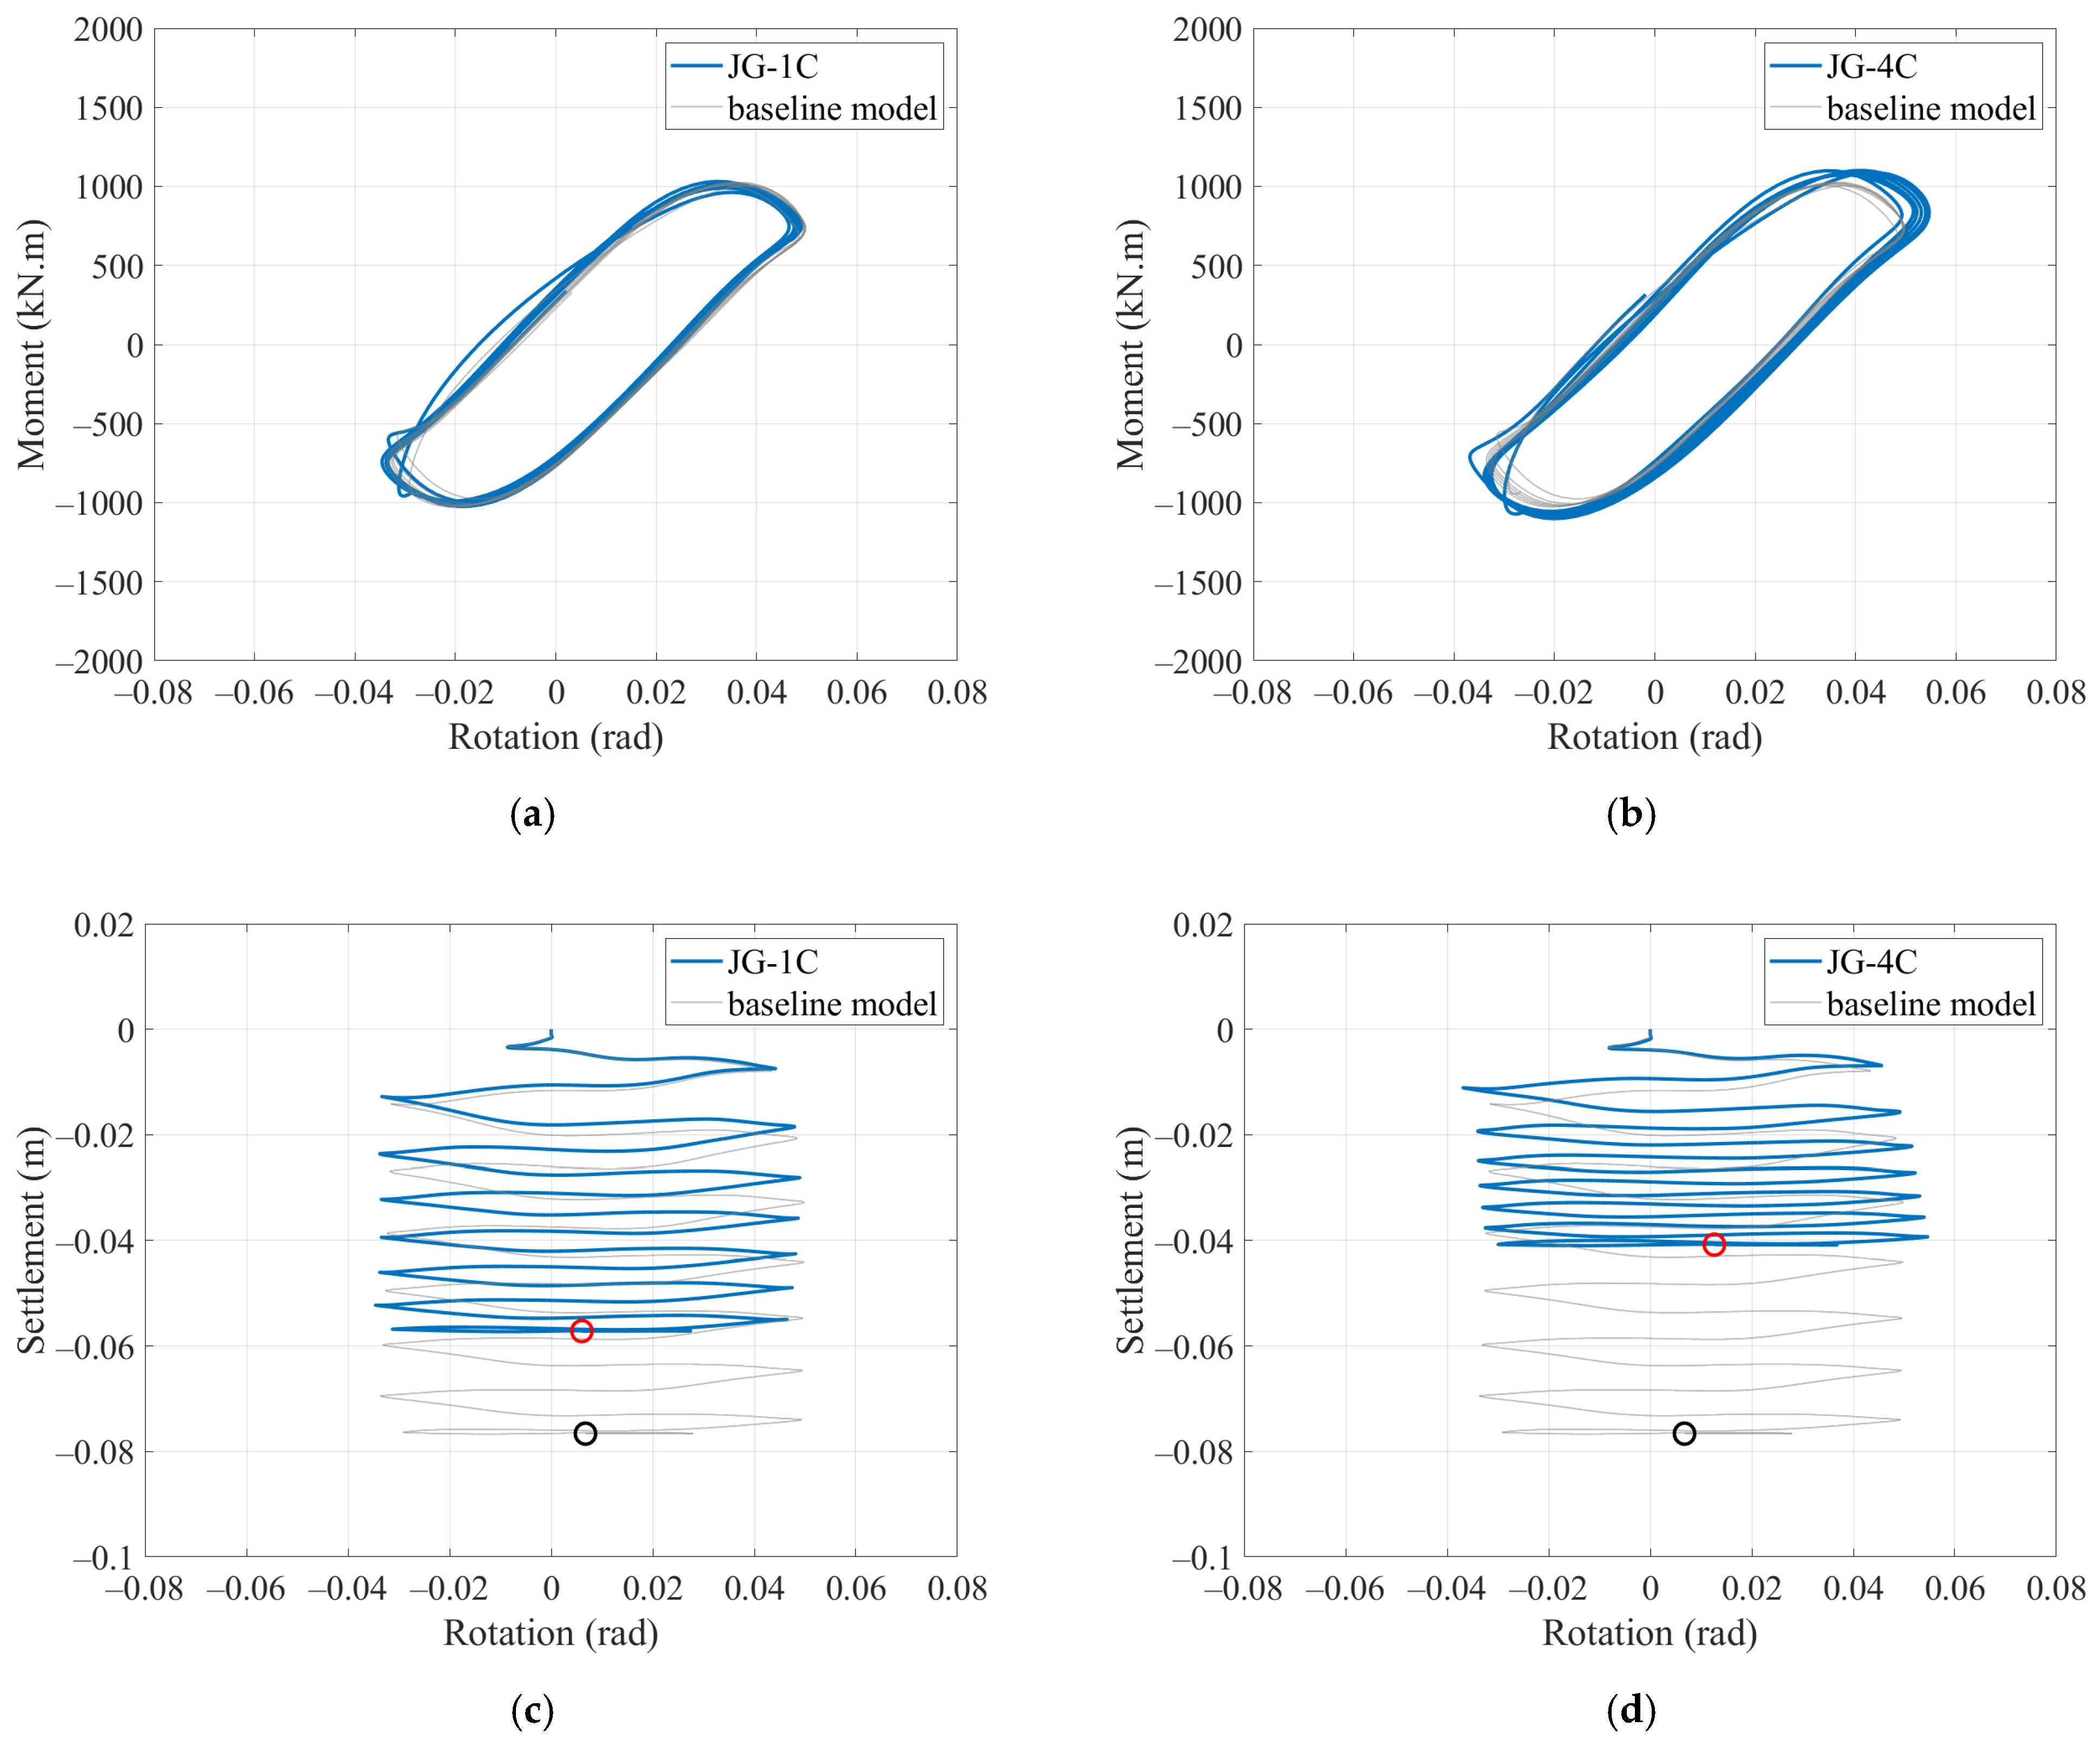
The jet grouting led to marked differences in the rocking behaviour, energy dissipation, and settlement control. The JG-1C and JG-4C schemes primarily reduced settlement, from 7.6 cm (baseline) to 5.7 cm and 4 cm, respectively, and slightly increased ultimate moment capacity ( M u l t ), from 1027 kN·m to 1100 kN·m for the JG-4C scheme. However, the moment-rotation loops (Figure 6a,b) remained similar in shape to the baseline, indicating limited influence on energy dissipation or rotational stiffness. This behaviour can be explained by the reduced critical contact area at larger rocking angles, with up to 7.3 cm uplift observed at the foundation centre in the JG-1C scheme.
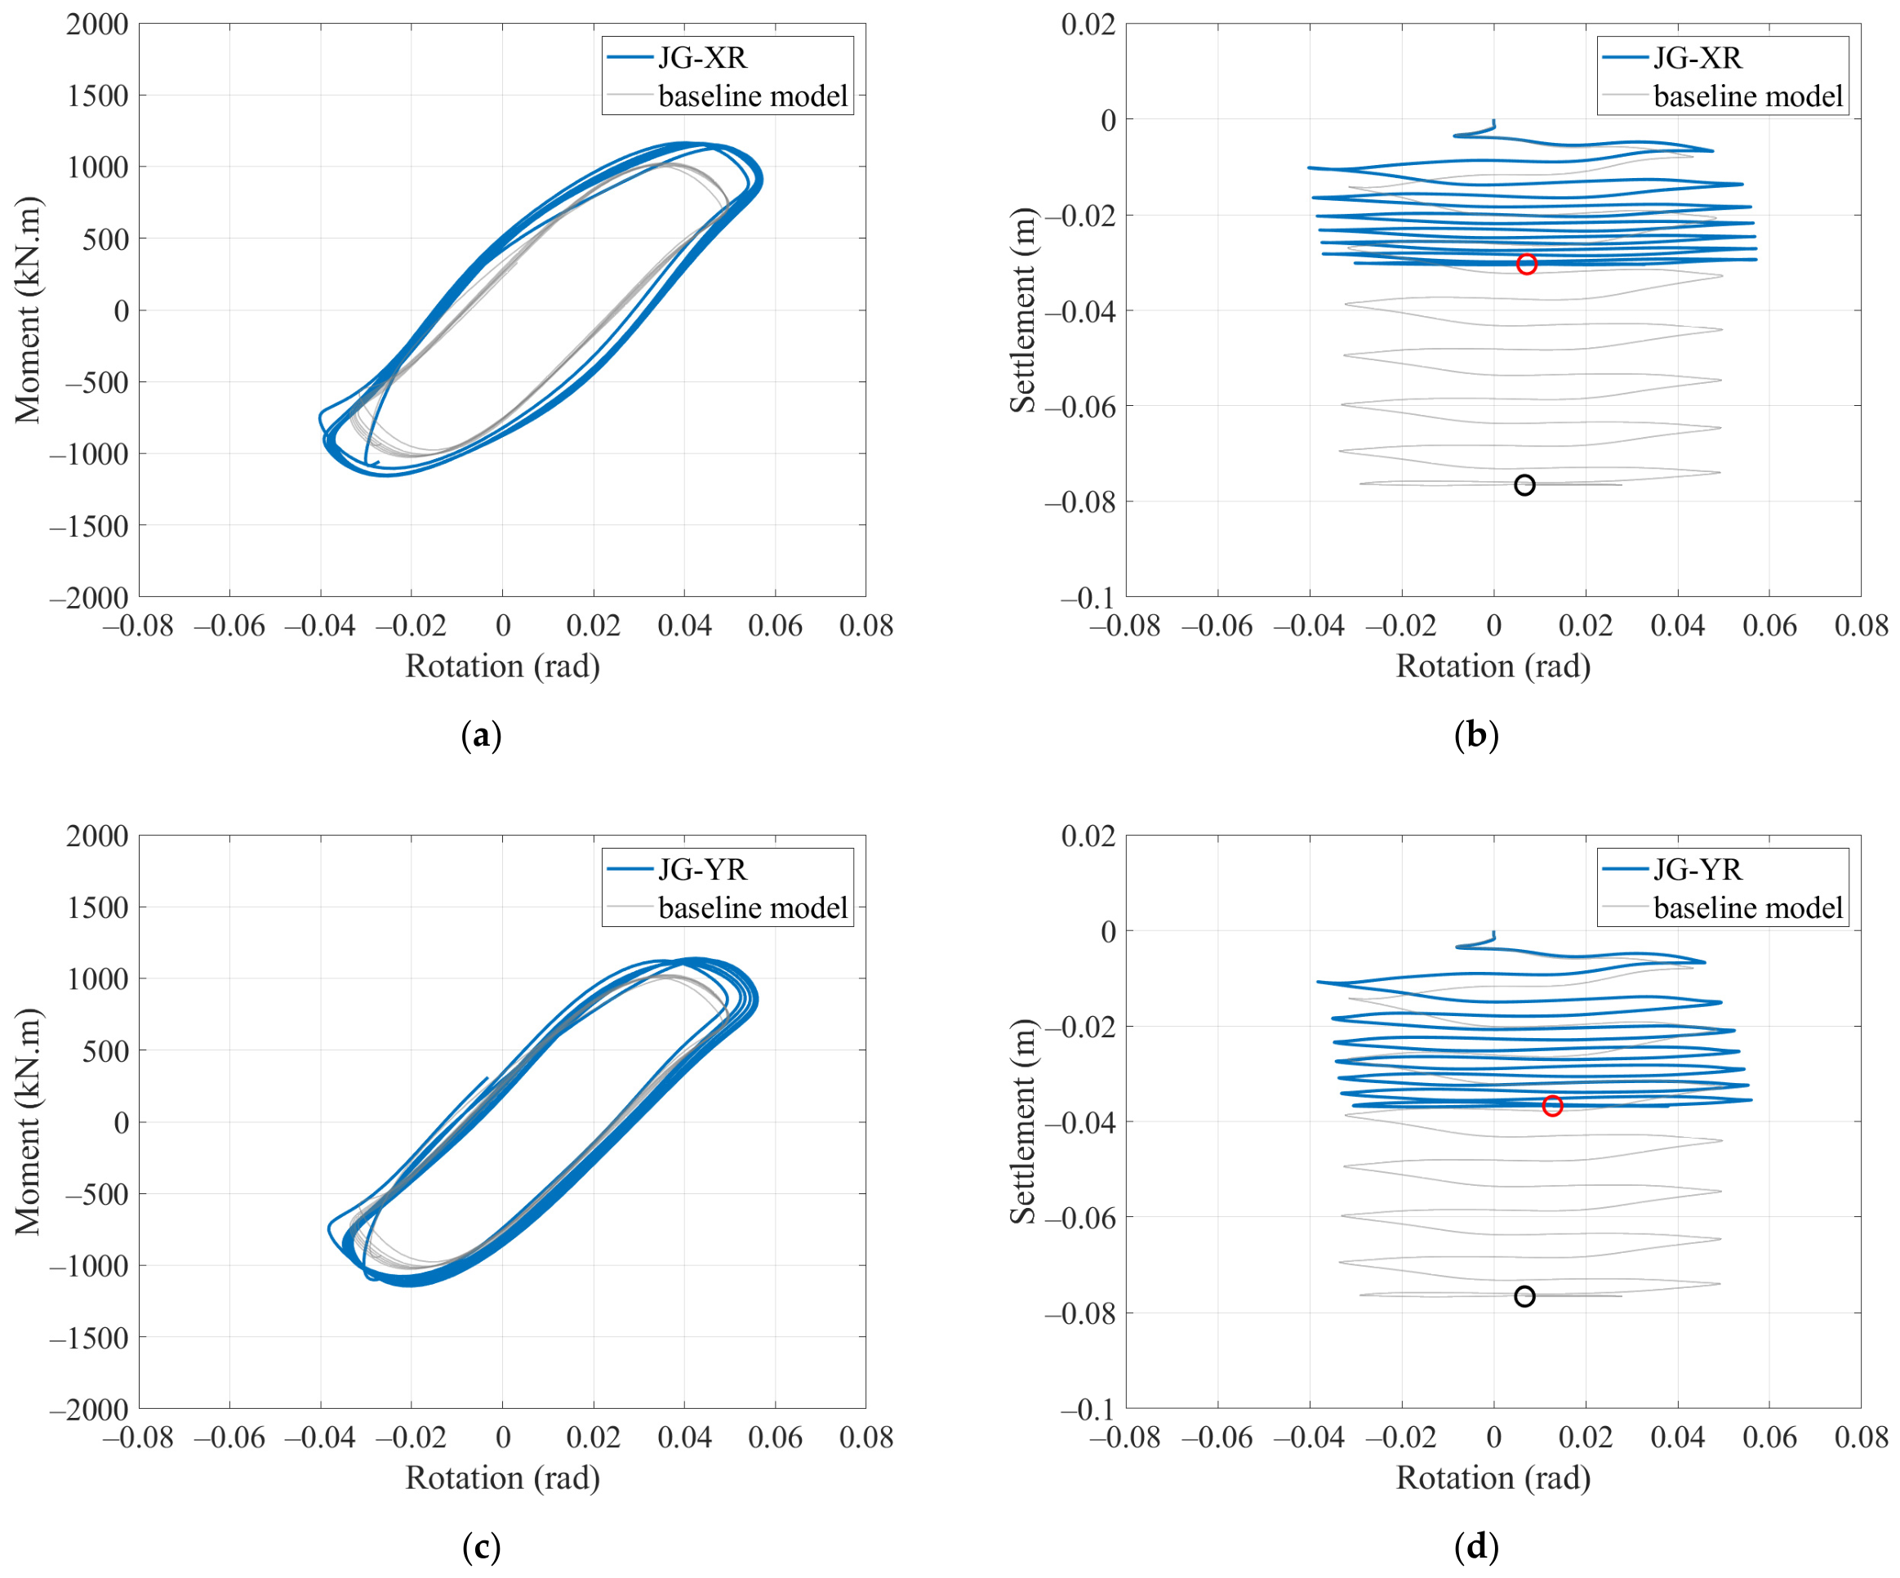
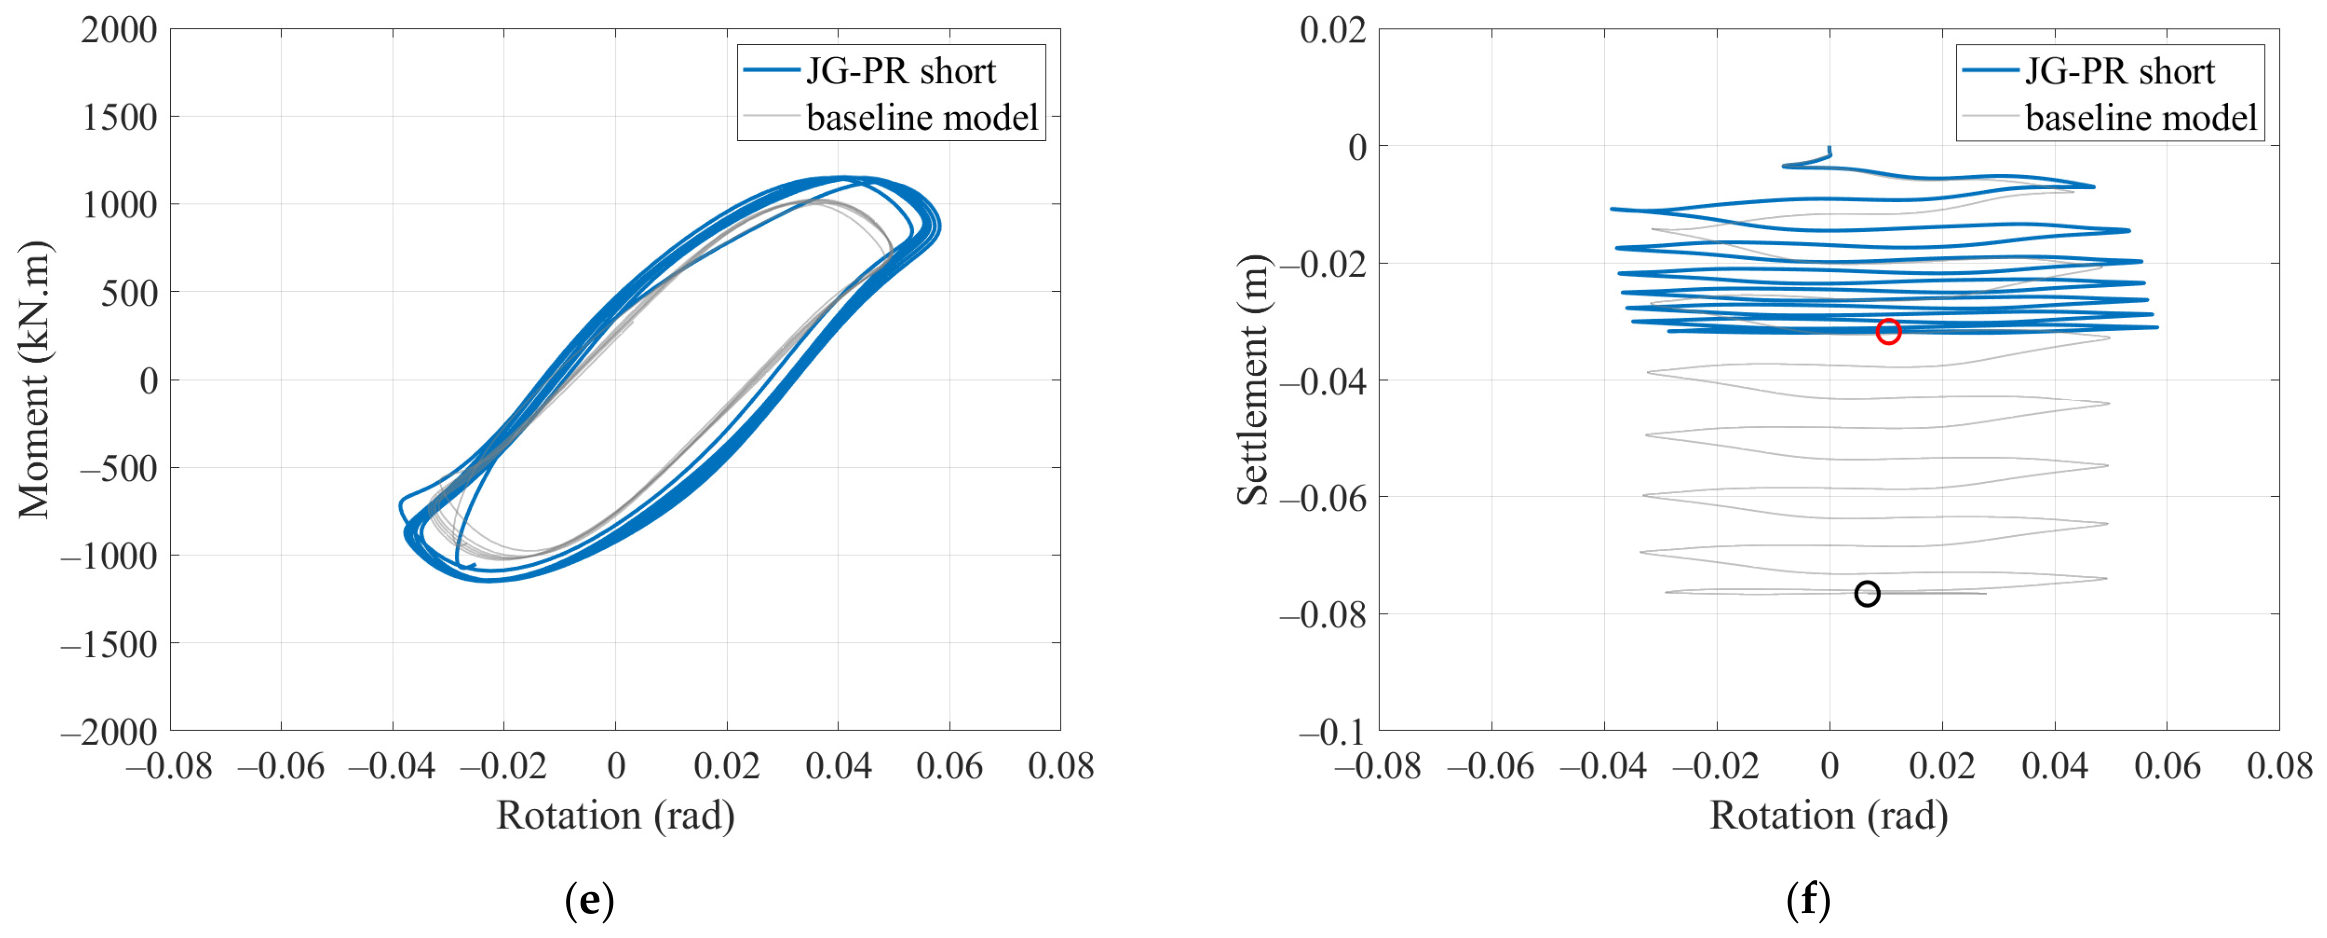
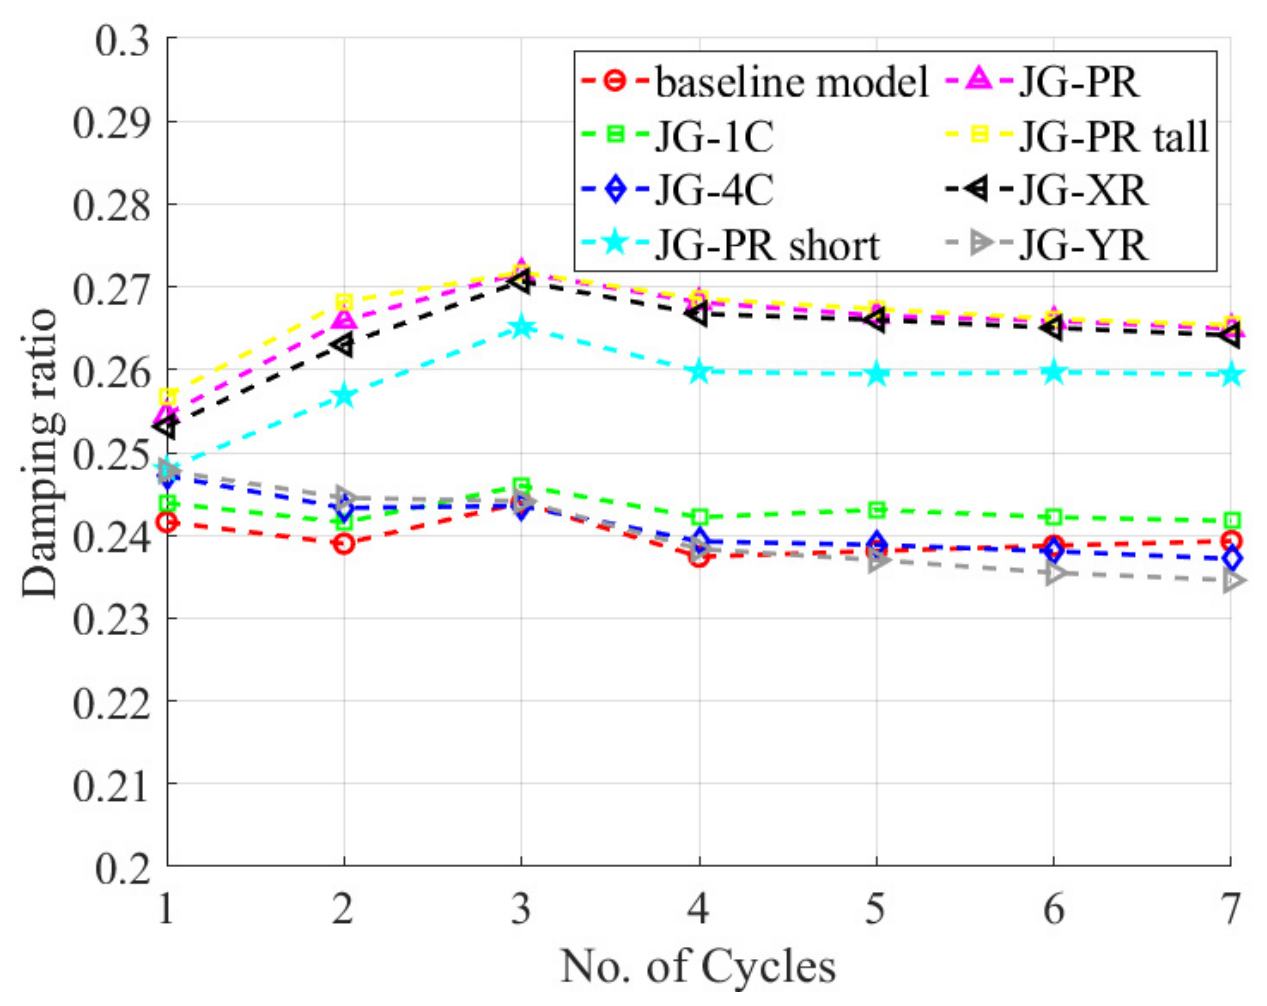
The wall-type layouts reveal two related but distinct mechanisms. In Figure 7, the comparison between JG-XR and JG-YR most directly isolates the effect of wall orientation relative to the excitation direction since both layouts have the same nominal area replacement ratio and injection depth but different alignment. JG-XR mobilised stronger resistance in the plane of rocking, whereas JG-YR produced a more localised deformation mechanism between the walls. Settlement was reduced to 3.0 cm in JG-XR and 3.7 cm in JG-YR, compared with 7.6 cm in the baseline model. The comparison between JG-XR and JG-PR should not be interpreted as a pure orientation comparison. JG-PR introduces intersecting walls and greater plan-view confinement. As such, its response reflects the combined effect of directional stiffness balance, increased plan coverage, and soil confinement. Settlement was reduced to 2.8 cm in JG-PR. These behavioural differences were further evidenced by the damping ratio evolution in Figure 8. Schemes with columns or perpendicular walls (JG-1C, JG-4C, JG-YR) led to relatively stable damping ratios with a modest decline over cycles, whereas JG-XR and JG-PR produced a sharper initial increase in damping ratio, followed by a gradual decline. This indicates enhanced cyclic energy dissipation through soil confinement and more effective mobilisation of soil–structure interaction. The JG-1C, JG-XR, and JG-PR schemes maintained or slightly improved the recentring ratio. The JG-4C and JG-YR schemes reduced it.
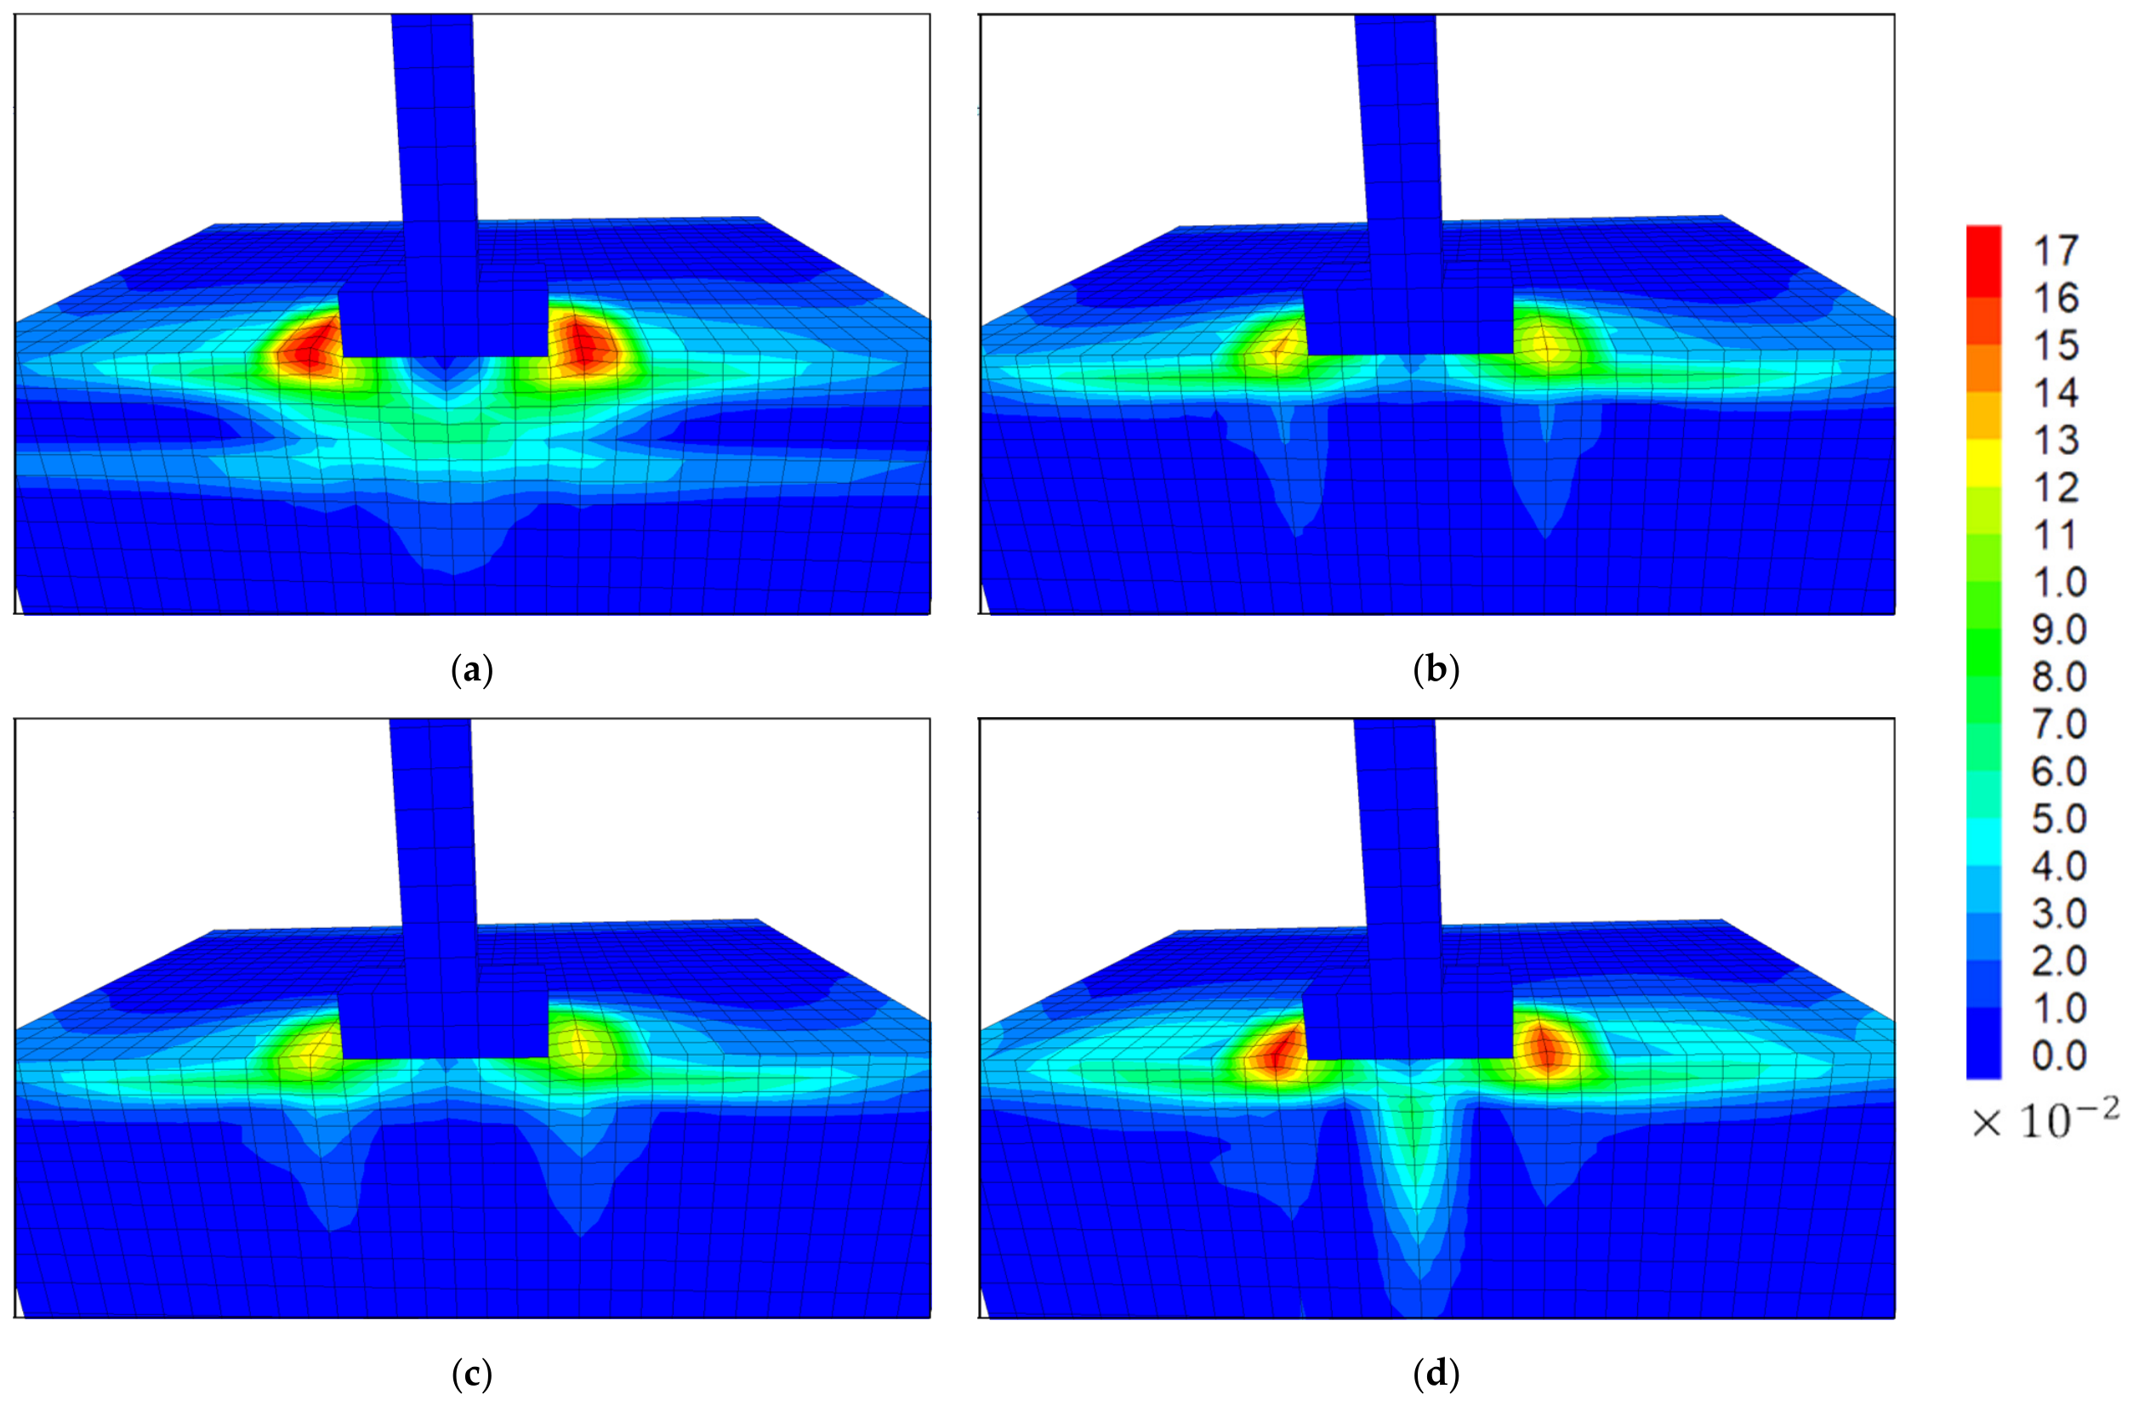
These interpretations are supported by the shear strain contours shown in Figure 9. The baseline model (Figure 9a) showed extensive shear strain beneath and around the foundation, whereas the column/wall-aligned models (JG-XR, JG-PR; Figure 9b,c) exhibited contracted strain profiles, indicating reduced soil deformation and more efficient energy transfer to the structure. Conversely, the JG-YR configuration (Figure 9d) presented an expanded V-shaped strain zone beneath the footing, consistent with localised soil yielding between the walls, increased settlement, and reduced recentring performance. This V-shaped strain concentration indicated that shear deformation localised between the perpendicular walls, creating a soft hinge that limited recovery after uplift. In contrast, the compacted strain contours in JG-XR and JG-PR demonstrated more uniform energy dissipation and stronger kinematic constraint, validating the higher damping and recentring ratios observed in these configurations.

3.4. Depth Effect

Two additional variants of the JG-PR scheme were analysed, with injection depths of 1.5 m (JG-PRs) and 4.5 m (JG-PRt), alongside the standard 3 m depth. Increasing the depth improved both moment capacity and rotational amplitude. The improvement was reflected in the lateral expansion of the hysteresis loops and hence greater energy dissipation. However, this came at the expense of recentring capacity, with deeper inclusions leading to larger residual rotations. This trade-off suggests that while deeper ground improvement increases damping and reduces superstructure demand, it may compromise serviceability by limiting the system’s ability to recover from peak displacements.
Settlement decreased with depth, from 3.2 cm in JG-PRs to 2.6 cm in JG-PRt, confirming the expected relationship between grouting depth and settlement mitigation. However, the rate of improvement diminished with increasing depth, indicating the possibility of an optimal range beyond which performance gains plateau. This behaviour reflects the changing interaction between the diaphragm walls and the surrounding soil. As depth increases, the wall tips experience greater confinement, behaving more like fixed supports, which stiffens the improved zone and alters the rocking mechanism. This improves settlement control but limits the inelastic deformation that contributes to energy dissipation.
The depth study was intentionally kept separate from the Random Set propagation. The p-boxes in Section 3.5 are conditional on the main layout database, generated primarily at D / B = 1 . This separation was necessary as depth was not varied for every grouting configuration. Had depth been included as a Random Set variable, the uncertainty bounds would have been represented for all configurations, whereas depth uncertainty would have been represented only for the JG-PR configuration. The resulting p-boxes would therefore have mixed layout and depth effects in an unbalanced way.

3.5. Epistemic Uncertainty

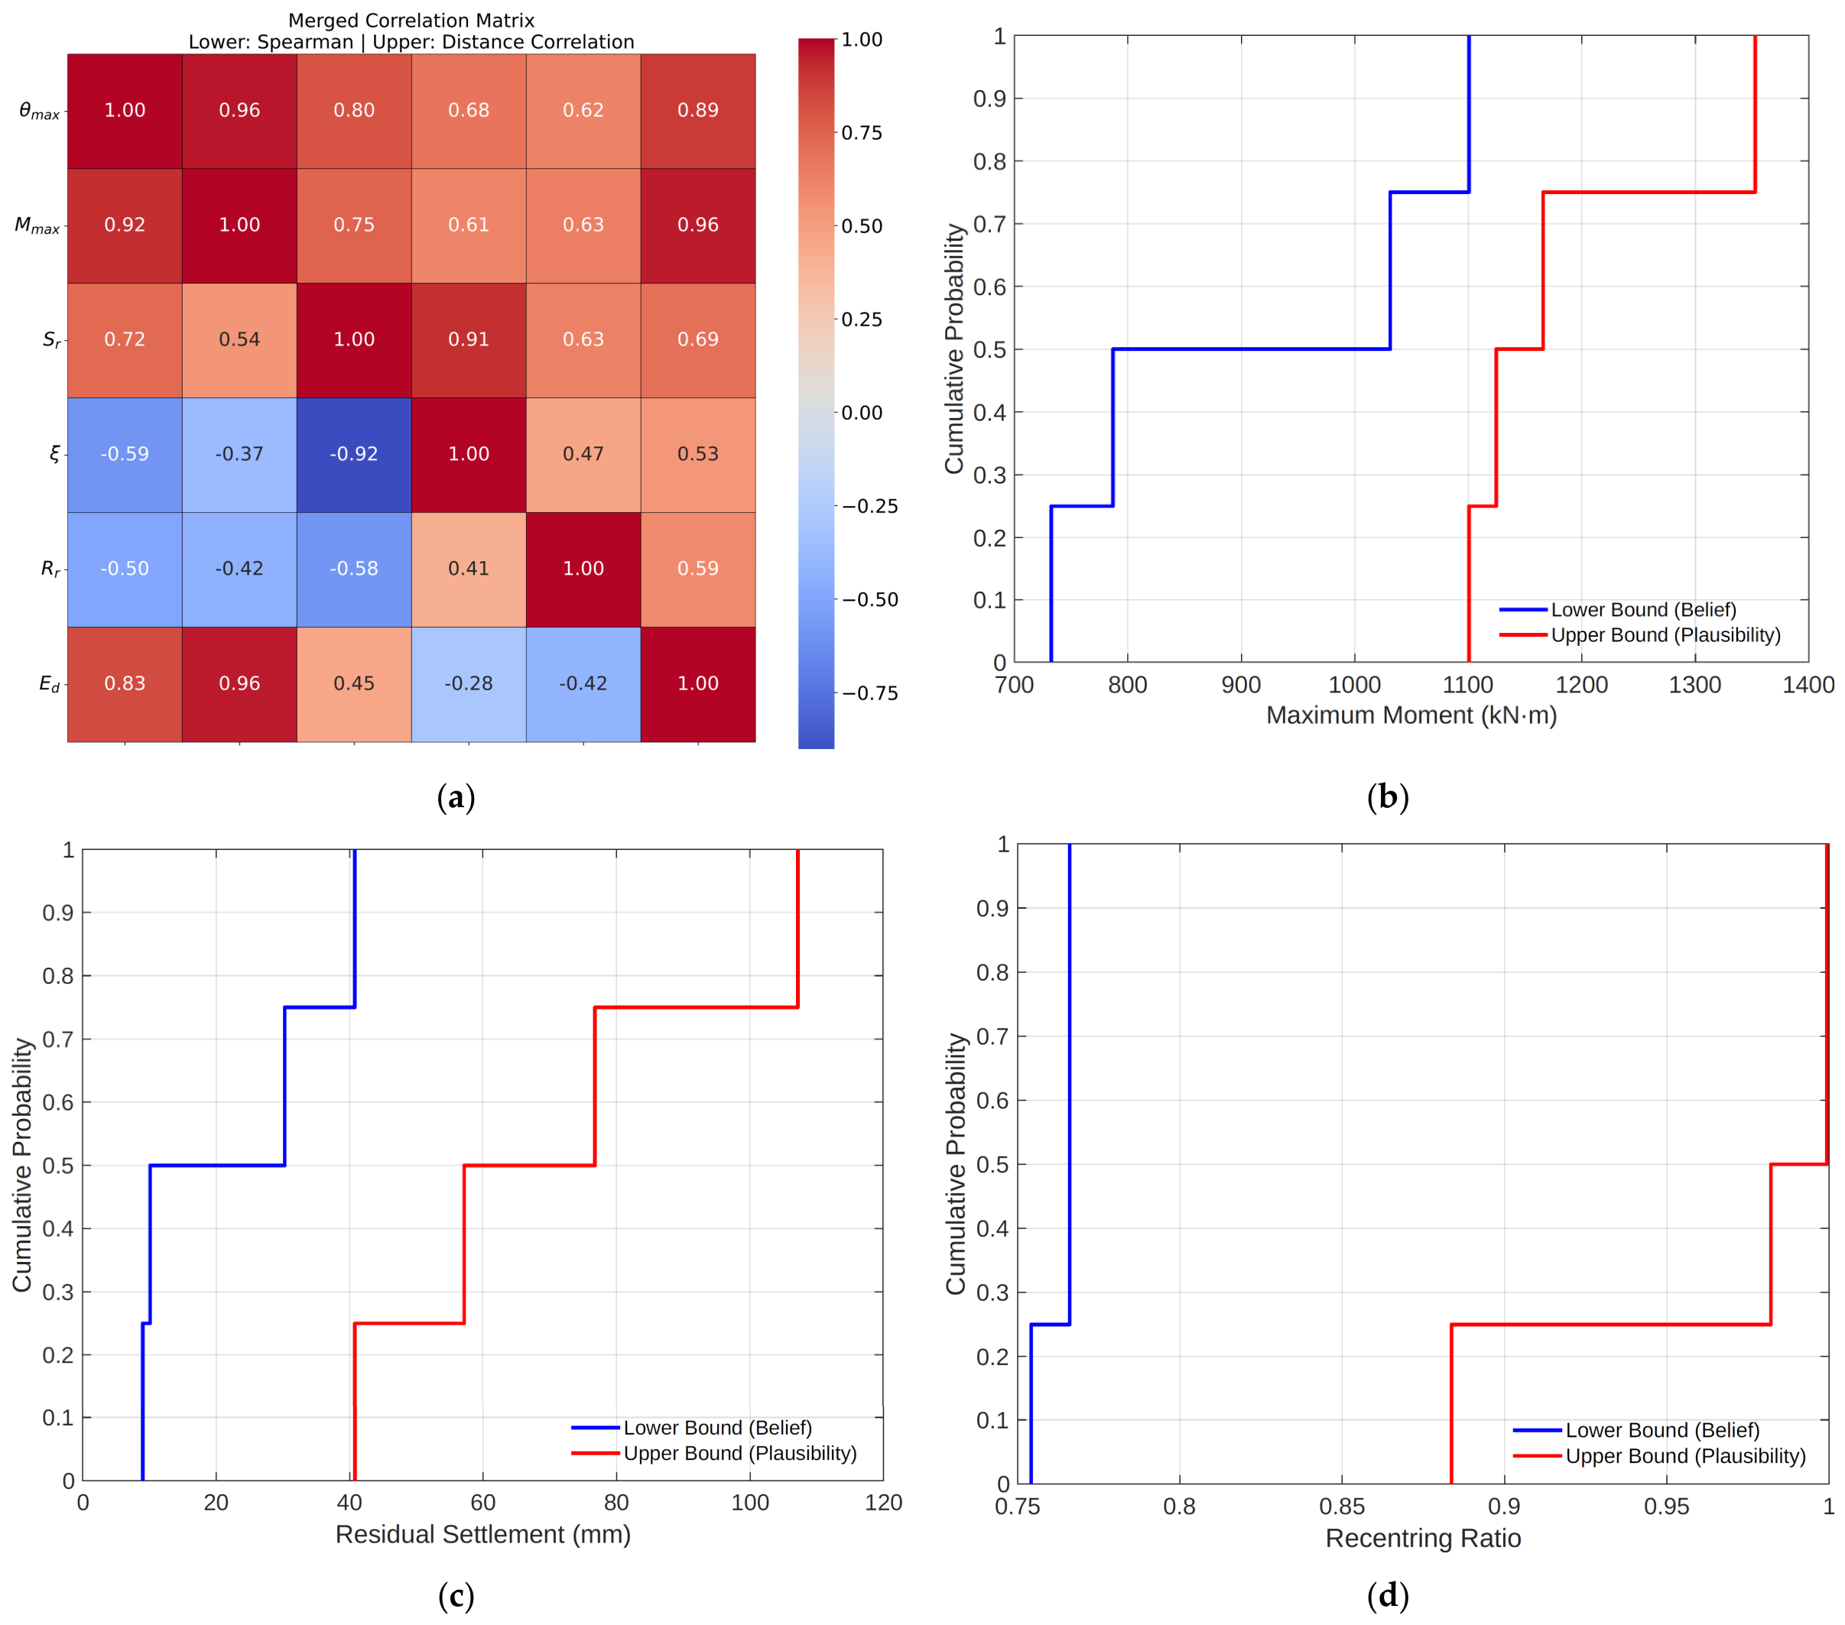
The response set was first reduced using the correlation structure shown in Figure 10a. Maximum rotation ( θ m a x ), maximum moment ( M m a x ), and dissipated energy ( E d ) were strongly correlated, confirming that they describe closely related aspects of the rocking mechanism. Residual settlement ( S r ) and damping ratio ( ξ ) showed a strong negative Spearman correlation. Recentring ratio ( R r ) showed weaker monotonic but stronger nonlinear dependence in distance correlation. The Random Set propagation was therefore applied to three representative quantities: M m a x , S r , and R r . These respectively represent strength demand, permanent serviceability demand, and post-shaking recovery.
The p-boxes in Figure 10b–d were constructed using the bounded PGA– I D S input space defined in Section 2.2. The two equally weighted focal elements represented lower-to-moderate excitation with lower directional stiffness balance, and moderate-to-high excitation with stronger directional stiffness balance. Each focal element was evaluated through its four PGA– I D S vertices. Where layouts had the same I D S , their orientation-specific responses were retained rather than averaged, so that the difference between aligned and perpendicular wall configurations remained embedded in the response bounds.
The resulting p-box for M m a x is narrow compared with the serviceability indicators. At high belief levels, the bounded moment response is concentrated within approximately 1050–1120 kN·m. This indicates that, within the simulated PGA– I D S input space, the peak strength demand remains comparatively stable even when motion amplitude and grouting layout are treated as bounded uncertain inputs. The p-box for S r is wider. At the same belief level, residual settlement spans approximately 2.7–4.2 cm, showing greater sensitivity to the contact-area evolution and local soil deformation mechanisms produced by different grouting layouts. The R r p-box is wider again, indicating that post-shaking recovery is the least constrained of the three propagated responses.
Note that, since the validation comparison (Figure 4) indicated a modest underestimation of residual settlement, the absolute settlement bounds may be biassed slightly low. The slight overestimation of peak rotation (Figure 4) suggests that the rotational demand may be mildly conservative.
The Random Set analysis implies that the same bounded PGA–layout uncertainty that gives a tightly constrained strength response produces much wider bounds for residual settlement and recentring. The deterministic results identified which layouts improve rocking performance; the Random Set results identified which performance indicators remain poorly constrained despite that improvement. In this sense, residual settlement and recentring control the epistemic uncertainty of the jet-grouted rocking system.
The magnitude of these settlement reductions can be compared with previous shallow improvement studies only in a normalised sense. Note that many of the published rocking-foundation studies differ in footing scale, vertical factor of safety, excitation sequence, soil density, improvement method, and structural aspect ratio. In the present simulations at 0.35 g, the unimproved foundation accumulated approximately 7.6 cm of residual settlement. The JG-1C, JG-4C, JG-YR, JG-XR, and JG-PR layouts reduced this to 5.7, 4.0, 3.7, 3.0, and 2.8 cm, respectively, corresponding to settlement reductions of approximately 25%, 47%, 51%, 61%, and 63%. The deeper JG-PRt case reduced the settlement further to approximately 2.6 cm, corresponding to about a 66% reduction. These reductions are of the same order as, and for the wall-type layouts compare favourably with, previously reported shallow improvement approaches in which improvement depths of z / B = 0.5 to z / B = 1.0 were shown to mitigate settlement and residual rotation in rocking systems. The comparison should, however, be interpreted as contextual.

4. Conclusions

This study examined whether strength- and serviceability-related responses of jet-grouted rocking foundations are bounded by comparable levels of epistemic uncertainty. A sparse three-dimensional finite-difference response database was generated for a 3 × 3 m rocking foundation improved with isolated columns, directional walls, and intersecting wall layouts. Motion amplitude and grouting layout were represented as bounded Random Set inputs using PGA and the directional stiffness isotropy index.
The deterministic simulations showed that the benefit of jet grouting is strongly mechanism-dependent. Column-type improvements reduced settlement but produced moment-rotation loops similar to the unimproved baseline, indicating limited modification of the rocking mechanism. Hysteretic loops and damping mobilisation were larger for wall-type layouts. For walls, the orientation relative to the excitation plays a critical role even where layouts have comparable directional stiffness descriptors. Greater improvement can increase damping and settlement control at the cost of weakening the post-uplift recovery mechanism.
The Random Set analysis provided the main uncertainty-based insight. After response reduction, maximum moment, residual settlement, and recentring ratio were propagated through the bounded PGA–layout input space.
The results show that, within the dry sand and controlled-excitation domain considered here, maximum moment is more tightly bounded than residual settlement and recentring ratio. This indicates that strength-related response may appear robust even when serviceability response remains uncertain. The main implication is that jet-grouted rocking foundations should not be selected using moment capacity or settlement reduction alone. The Random Set analysis showed that, although certain layouts may appear robust in terms of strength demand, they may still exhibit substantial uncertainty in residual settlement and recentring behaviour. The finding should not be generalised directly to layered, saturated or liquefiable deposits, nor to broadband earthquake records. The applicability of the numerical bounds is limited to the model class examined here.
A practical design criterion should therefore be selected according to the governing serviceability mode of the supported structure. For slender bridge-pier-type systems, such as the structure considered here, recentring should be treated as the primary screening criterion, as residual rotation may lead to permanent drift and secondary P Δ effects. Residual settlement should then be minimised within the range of layouts that satisfy this recentring requirement. For squat, low-rise, or heavy systems where overturning instability is less critical, residual and differential settlement may become the governing design criteria. The preferred grouting layout is therefore not necessarily the layout that gives the smallest settlement.

Author Contributions

Conceptualization, A.G.P., M.B. and A.A.-L.; methodology, A.G.P. and A.A.-L.; software, A.G.P., A.E.I. and A.A.-L.; validation, E.M.T., A.E.I. and M.H.-B.; formal analysis, A.A.-L., A.G.P. and E.M.T.; investigation, A.G.P. and A.A.-L.; resources, M.H.-B.; data curation, E.M.T.; writing—original draft preparation, A.G.P.; writing—review and editing, A.A.-L. and M.B.; visualisation, A.G.P., E.M.T. and A.A.-L.; supervision, M.H.-B.; project administration, A.E.I. and M.B. All authors have read and agreed to the published version of the manuscript.

Funding

This research received no external funding.

Institutional Review Board Statement

Not applicable.

Informed Consent Statement

Not applicable.

Data Availability Statement

The raw data supporting the conclusions of this article will be made available by the authors on request.

Conflicts of Interest

The authors declare no conflicts of interest.

Abbreviations

The following abbreviations are used in this manuscript:
PGAPeak ground acceleration
I D S Directional stiffness isotropy index
JGJet grouting
JG-1COne central jet-grout column
JG-4CFour corner jet-grout columns
JG-XRJet-grout walls in the X-direction
JG-YRJet-grout walls in the Y-direction
JG-PRIntersecting jet-grout walls in both directions
JG-PRsShallow JG-PR layout
JG-PRtDeep JG-PR layout
p-boxProbability box

References

  1. Anastasopoulos, I.; Gazetas, G.; Kaynia, A.M. Rocking-induced seismic performance of footings supported by shallow soil layers. J. Earthq. Eng. 2010, 14, 1001–1038. [Google Scholar]
  2. Gazetas, G. 4th Ishihara Lecture: Soil–foundation–structure systems beyond conventional seismic failure thresholds. Soil Dyn. Earthq. Eng. 2015, 68, 23–39. [Google Scholar] [CrossRef]
  3. Irani, A.E.; Hajialilue-Bonab, M.; Assadi-Langroudi, A.; Tabrizi, E.M. Pore-pressure-dependent performance of rocking foundations. Soil Dyn. Earthq. Eng. 2024, 183, 108772. [Google Scholar] [CrossRef]
  4. Gajan, S.; Kutter, B.L.; Phalen, J.D.; Hutchinson, T.C.; Martin, G.R. Centrifuge modeling of load-deformation behavior of rocking shallow foundations. Soil Dyn. Earthq. Eng. 2005, 25, 773–783. [Google Scholar] [CrossRef]
  5. Gajan, S.; Kutter, B.L. Capacity, settlement, and energy dissipation of shallow footings subjected to rocking. J. Geotech. Geoenviron. Eng. 2008, 134, 1129–1141. [Google Scholar] [CrossRef]
  6. Esmatkhah Irani, A.; Bonab, M.H.; Sarand, F.B.; Katebi, H. Overall improvement of seismic resilience by rocking foundation and trade-off implications. Int. J. Geosynth. Ground Eng. 2023, 9, 40. [Google Scholar] [CrossRef]
  7. Deng, L.; Kutter, B.L. Effects of cyclic motion on shallow rocking foundations. J. Geotech. Geoenviron. Eng. 2012, 138, 93–103. [Google Scholar] [CrossRef]
  8. Antonellis, G.; Gavras, A.G.; Panagiotou, M.; Kutter, B.L.; Guerrini, G.; Fox, P.J. Shake table test of large-scale bridge columns supported on rocking shallow foundations. J. Geotech. Geoenviron. Eng. 2015, 141, 04015009. [Google Scholar] [CrossRef]
  9. Hakhamaneshi, M.; Kutter, B.L. Effect of footing shape and embedment on the settlement, recentering, and energy dissipation of shallow footings subjected to rocking. J. Geotech. Geoenviron. Eng. 2016, 142, 04016070. [Google Scholar] [CrossRef]
  10. Anastasopoulos, I.; Kourkoulis, R.; Gelagoti, F.; Papadopoulos, E. Rocking response of SDOF systems on shallow improved sand: An experimental study. Soil Dyn. Earthq. Eng. 2012, 40, 15–33. [Google Scholar] [CrossRef]
  11. Allmond, J.D.; Kutter, B.L. Design considerations for rocking foundations on unattached piles. J. Geotech. Geoenviron. Eng. 2014, 140, 04014058. [Google Scholar] [CrossRef]
  12. Sadjadi, M.; Fadaee, M.; Ghannad, M.A.; Jahankhah, H. Numerical study of stiff diaphragm walls used to improve the performance of rocking foundation systems. J. Earthq. Eng. 2021, 25, 2628–2650. [Google Scholar]
  13. Liu, Z.; Hutchinson, T.C. Energy dissipation mechanisms of rocking foundations. J. Earthq. Eng. 2018, 22, 1226–1247. [Google Scholar]
  14. Dempster, A.P. Upper and lower probabilities induced by a multivalued mapping. Ann. Math. Stat. 1967, 38, 325–339. [Google Scholar] [CrossRef]
  15. Shafer, G. A Mathematical Theory of Evidence; Princeton University Press: Princeton, NJ, USA, 1976. [Google Scholar]
  16. Kendall, D.G. Foundations of a theory of random sets. In Stochastic Geometry; Harding, E.F., Kendall, D.G., Eds.; Wiley: London, UK, 1974; pp. 322–376. [Google Scholar]
  17. Matheron, G. Random Sets and Integral Geometry; Wiley: New York, NY, USA, 1974. [Google Scholar]
  18. Dubois, D.; Prade, H. Random sets and fuzzy interval analysis. Fuzzy Sets Syst. 1991, 42, 87–101. [Google Scholar] [CrossRef]
  19. Nguyen, H.T. An Introduction to Random Sets; Chapman and Hall/CRC: Boca Raton, FL, USA, 2006. [Google Scholar]
  20. Molchanov, I. Theory of Random Sets; Springer: London, UK, 2005. [Google Scholar]
  21. Tonon, F.; Bernardini, A.; Mammino, A. Determination of parameters range in rock engineering by means of random set theory. Reliab. Eng. Syst. Saf. 2000, 70, 241–261. [Google Scholar] [CrossRef]
  22. Peschl, G.M. Reliability Analyses in Geotechnics with the Random Set Finite Element Method. Ph.D. Thesis, Graz University of Technology, Graz, Austria, 2004. [Google Scholar]
  23. Hall, J.W.; Rubio, E.; Anderson, M.G. Random sets of probability measures in slope hydrology and stability analysis. ZAMM J. Appl. Math. Mech. 2004, 84, 710–720. [Google Scholar] [CrossRef]
  24. Schweiger, H.F.; Peschl, G.M.; Pöttler, R. Application of the random set finite element method for analysing tunnel excavation. Georisk 2007, 1, 43–56. [Google Scholar] [CrossRef]
  25. Herridge, J.B.; Tsiminis, K.; Winzen, J.; Assadi-Langroudi, A.; McHugh, M.; Ghadr, S.; Donyavi, S. A probabilistic approach to the spatial variability of ground properties in the design of urban deep excavation. Infrastructures 2019, 4, 51. [Google Scholar] [CrossRef]
  26. Tsatsis, A.; Anastasopoulos, I. Performance of rocking systems on shallow improved sand: Shaking table testing. Front. Built Environ. 2015, 1, 9. [Google Scholar] [CrossRef]
  27. Spearman, C. The proof and measurement of association between two things. Am. J. Psychol. 1904, 15, 72–101. [Google Scholar] [CrossRef]
  28. Székely, G.J.; Rizzo, M.L.; Bakirov, N.K. Measuring statistical dependence via distance correlation. Ann. Stat. 2007, 35, 2769–2794. [Google Scholar] [CrossRef]
  29. Nikbakhtan, B.; Osanloo, M. Effect of grout pressure and grout flow on soil physical and mechanical properties in jet grouting operations. Int. J. Rock Mech. Min. Sci. 2009, 46, 498–505. [Google Scholar] [CrossRef]
Figure 1. Schematic diagram of the rocking foundation system on jet grouting elements: (a) JG-1C, (b) JG-4C, (c) JG-YR, (d) JG-XR, (e) JG-PR.
Geotechnics 06 00067 g001aGeotechnics 06 00067 g001b
Figure 2. Radar chart illustrating the I D S distribution across layouts.
Geotechnics 06 00067 g002
Figure 3. Motion input, (a) free field boundary condition, (b) acceleration time history.
Geotechnics 06 00067 g003
Figure 4. Validation of the numerical model against experimental results, showing time history comparisons of (a) settlement, (b) rotation.
Geotechnics 06 00067 g004
Figure 5. Moment-rotation and settlement-rotation loops for baseline model, (a,b) 0.2 g, (c,d) 0.35 g, (e,f) 0.5 g.
Geotechnics 06 00067 g005
Figure 6. Moment-rotation and settlement-rotation loops for 0.35 g, (a,c) JG-1C, (b,d) JG-4C.
Geotechnics 06 00067 g006
Figure 7. Moment-rotation and settlement-rotation loops for 0.35 g, (a,b) JG-XR, (c,d) JG-YR, (e,f) JG-PR.
Geotechnics 06 00067 g007aGeotechnics 06 00067 g007b
Figure 8. Evolution of damping ratio (ξ) with loading cycles for different jet-grouting configurations under 0.35 g excitation.
Geotechnics 06 00067 g008
Figure 9. Shear strain contours beneath the footing under 0.35 g excitation for different configurations: (a) baseline, (b) JG-PR, (c) JG-XR, (d) JG-YR.
Geotechnics 06 00067 g009
Figure 10. Probabilistic analysis, (a) heatmap (maximum rotation θ m a x , maximum moment M m a x , residual settlement S r , damping ratio ξ , recentring ratio R r , dissipated energy E d ), (b) p-box for maximum moment, (c) p-box for residual settlement, (d) p-box for recentring ratio.
Geotechnics 06 00067 g010
Table 1. Summary of jet-grouting configurations, geometric parameters, directional stiffness indices ( I D S ), and seismic loading conditions (PGA) considered in the deterministic simulations.
SchemesDescription I D S Injection Depth: mPGA (g)Area Replacement Ratio: %
JG-1CSingle central column1.753 (=B)0.2
0.35
0.5
11.1
JG-4CFour corner columns4.503 (=B)0.2
0.35
0.5
44.4
JG-XRWalls in X-direction5.753 (=B)0.2
0.35
0.5
66.7
JG-YRWalls in Y-direction5.753 (=B)0.2
0.35
0.5
66.7
JG-PRIntersecting walls (D/B = 1.0)8.503 (=B)0.2
0.35
0.5
88.9
JG-PRsIntersecting walls (D/B = 0.5)8.501.5 (=0.5 B)0.2
0.35
0.5
88.9
JG-PRtIntersecting walls (D/B = 1.5)8.504.5 (=1.5 B)0.2
0.35
0.5
88.9
Table 2. Material properties used in the numerical simulations for soil, jet-grouting elements, and structural components.
CharacteristicSandGroutIdealised Structure
γ d , dry unit weight (kN/ m 3 )15.819.429.4
E, elasticity modulus (MPa)20.0156.02100.0
K, bulk modulus (MPa)13.3104.01750.0
G, shear modulus (MPa)8.062.4807.7
C, cohesion (kPa)080-
φ , friction angle (◦)3341-
The structural modulus is a scaled numerical stiffness used to model near-rigid elastic behaviour relative to the soil; it is not the Young’s modulus of structural steel.
Disclaimer/Publisher’s Note: The statements, opinions and data contained in all publications are solely those of the individual author(s) and contributor(s) and not of MDPI and/or the editor(s). MDPI and/or the editor(s) disclaim responsibility for any injury to people or property resulting from any ideas, methods, instructions or products referred to in the content.