
Article

Microstructural Evolution of Expansive Soils Under Suction Hysteresis Using Environmental Scanning Electron Microscopy (ESEM)

1
Geosyntec Consultants, 1255 Roberts Blvd., NW, Suite 200, Kennesaw, GA 30144, USA
2
School of Civil Engineering and Environmental Science, University of Oklahoma, Norman, OK 73019, USA
3
Samuel Roberts Noble Microscopy Laboratory, University of Oklahoma, Norman, OK 73019, USA
*
Author to whom correspondence should be addressed.
Geotechnics 2026, 6(2), 56; https://doi.org/10.3390/geotechnics6020056
Submission received: 8 April 2026 / Revised: 14 May 2026 / Accepted: 23 May 2026 / Published: 5 June 2026

Abstract

Expansive soils undergo structural changes in response to moisture fluctuations, often governed by suction hysteresis. This study investigates the microstructural evolution of three expansive soils using Environmental Scanning Electron Microscopy (ESEM) under controlled drying and wetting cycles across a broad suction range. Soils were prepared with varying compaction states, equilibration times, and physicochemical properties—including specific surface area (SA) and cation exchange capacity (CEC). Images captured at multiple magnifications revealed key trends in water film behavior, cracking, and fabric rearrangement. Image-derived pore-area ratios were used as comparative indicators of microstructural deformation during drying and wetting. High-activity clays (as defined by SA and CEC) displayed pronounced hysteresis and cracking, while low-activity soils exhibited minimal structural change. These findings highlight the role of microscale behavior in expansive soil performance and provide a foundation for improved predictive modeling. In addition, the study provides a framework for future quantitative microstructural characterization using fractal descriptors, enabling future analyses to capture pore complexity and scale-dependent fabric evolution during suction hysteresis.

1. Introduction

Expansive soils are those soils, most commonly clays, that experience large volumetric strains as the soil skeleton expands and contracts in response to cycles of wetting and drying [1]). Volumetric swelling occurs when the soil adsorbs fluid, and volumetric shrinkage is associated with the desorption of pore fluid. This behavior is beneficial when used as a barrier material for waste containment or impervious liners [2,3,4,5]. However, the shrinking and swelling of the underlying soil can damage infrastructure if not constructed with adequate foundation systems, and the associated mitigation costs exceed that of floods, hurricanes, and earthquakes combined [6,7], in the range of $9–15 billion in the United States alone [8,9,10].
There is considerable evidence demonstrating the macroscopic engineering behavior of these expansive clays is controlled by microscopic, physicochemical forces, i.e., the double-layer repulsive, van der Waals attractive, and interlayer forces, in addition to mechanical forces [11,12,13]. As water content fluctuates within the pore networks of the soil, the microlevel forces also change, and suction between particles increases and decreases inversely to the volumetric water content. This relationship is characterized by the Soil Water Characteristic Curve (SWCC), which is a constitutive relationship between suction and soil moisture. As suction evolves, fluctuations in the soil fabric occur, which impact the strength, permeability, and other macroscale properties of the soil.
However, the relationship between the water content of the soil and matric suction is not unique [14,15,16,17,18,19] and is largely dependent on the moisture history of the soil, i.e., the cycles of wetting and drying experienced by the soil. Due to the change in pore size and shape between wetting and drying, as well as changes in contact angle and the amount of trapped air, more water is retained by the soil on drying than on wetting for the same range of suction [16,18,19]. This cyclic relationship between suction and moisture stored within the soil is described by the Hysteretic Soil Water Characteristic Curve (HSWCC). Recent hydro-mechanical coupling studies have further demonstrated that suction-dependent deformation and hysteretic retention behavior strongly influence stiffness, collapse potential, and volume change response in unsaturated soils [17,20,21].
While expansive soils in the unsaturated state have been studied extensively, they remain a costly challenge for engineers who seek to accurately predict and mitigate swelling and shrinking movements under various conditions. Understanding the microscale properties and particle interaction at various suction levels is vital in order to better predict their behavior at the engineering scale. High-quality experimental work studying structural complexity and orientation at the microscale is essential to developing a solution [22]. As technology improves, it is becoming possible to study these microscale clay particles in more detail and present both qualitative and quantitative methods in which to understand surface phenomena and particle interactions under various conditions that explain factors that influence soil behavior.
Electron microscopy and porosimetry are commonly used to characterize the fabric of clays, providing information on pore networks, particle geometry and orientation, and particle and pore size distributions. However, porosimetry methods such as Mercury Intrusion Porosimetry (MIP) are limited, as MIP can only describe the pore volume accessible by mercury and is bounded by a minimum pore size able to be detected [23]. Scanning Electron Microscopy (SEM) can image the microscale structure (i.e., <10 μm) of the soil fabric, providing high-resolution images of the specimen at larger magnifications. However, the SEM chamber operates under a vacuum and requires a completely dried specimen. Due to this critical limitation, SEM is not able to capture the unsaturated state of the soil, particularly at high relative humidity (i.e., low suction and high degree of saturation) [22,24]. Environmental Scanning Electron Microscopy (ESEM) overcomes this limitation either via a separate dedicated vacuum pump to control chamber vapor pressure or one scroll pump for roughing and backing with a valve allowing water vapor into the chamber (e.g., ThermoFisher Scientific Quattro S used in this study). To prevent charging on the specimen, the ESEM uses gas pressure to allow positively charged ions to be produced by secondary electron scattering. A secondary electron detector (e.g., GSED gaseous secondary electron detector) allows functioning in the environmental mode where a conventional secondary electron detector (ETD) cannot function due to high voltage elements, which would cause arcing at higher pressures. Chamber pressure is controlled by a Peltier cooling stage [24]. Moreover, ESEM does not require desiccation or coating, which have been shown to affect the microstructure [22,23,25].
Historically, ESEM required coupling with SEM because at high chamber humidity (low suction), a film of adsorbed water develops around the specimen, which interferes with image quality. Lin and Cerato (2014) [24] noted that for natural expansive soils, structural information (e.g., particle alignment) was accessible from ESEM micrographs, but broader analysis was not possible due to image quality. Koliji et al. (2010) [22] related microscale and mesoscale to macroscale structure using ESEM by coupling ESEM with MIP and neutron computed tomography (CT) for a Bioley soil. Significant changes in soil fabric were not apparent with ESEM alone through wetting and drying cycles and required additional MIP analysis. Recently, Sun et al. (2019) [23] paired ESEM with MIP for samples of B75 Ca-Mg bentonite. Initial compacted dry density was shown to affect the ability of macropores to retain water even with decreasing suction. Similar results were reported by Lloret et al. (2003) [26] and Villar (2007) [27], where bentonite compacted at lower dry density retained more water at lower suctions (less than 10 MPa) than samples compacted at higher dry densities. This was attributed to the ability of the macropores to store water at a lower void ratio.
Recent advances in fractal image analysis have enhanced quantitative interpretation of soil microstructure from ESEM and SEM images, linking pore morphology to hysteretic suction behavior and mechanical response [28,29,30]. These studies demonstrate that fractal descriptors such as pore fractal dimension (Df) can capture the complexity of soil structure evolution during wetting–drying cycles, motivating the semi-quantitative approach adopted in this work.
Although microstructural studies of expansive clay minerals have been performed utilizing ESEM, a large majority of these studies focus only on MX80 bentonite [4,31,32,33]. While this body of work provided valuable insight into swelling behavior at the aggregate-level [4], the impact of compaction on surface textures along wetting and drying cycles [31], and the formation of hydration gels during swelling [33], they are largely single mineral and from a single source. To truly understand the mechanism of expansive clay behavior, a diverse body of high-quality (i.e., high-resolution) natural soil images at the microscale are needed.
In this study, Environmental Scanning Electron Microscopy (ESEM) was used to capture images of expansive soils under varying conditions, including magnification levels (350X, 800X, and 3500X), physicochemical properties—specifically specific surface area (SA) and cation exchange capacity (CEC)—initial compaction states (at optimum moisture content and wet of optimum), and equilibration times (15 min and no equilibration). These images were analyzed to better understand how soil fabric evolves under suction hysteresis.
Both qualitative and quantitative comparisons were made between the drying and wetting cycles to evaluate structural changes and the influence of physicochemical properties on soil activity. Activity (A) quantifies the clay’s tendency to chemically interact with pore fluid per unit clay fraction. SA, which represents the total surface area of clay particles available to interact with pore fluid, and CEC, which reflects the soil’s capacity to exchange cations, are critical parameters affecting microstructure and moisture response. These metrics were applied alongside alternative definitions of soil activity proposed by Cerato and Lutenegger (2005) [34] to more accurately interpret fabric changes along the Soil Water Characteristic Curve (SWCC).
Accordingly, this study aims to:
(i)
Visualize microstructural evolution of multiple natural expansive soils during drying–wetting cycles using ESEM.
(ii)
Evaluate the influence of compaction state, equilibration time, and physicochemical properties (SA and CEC) on fabric behavior under suction hysteresis.
(iii)
Quantify void-ratio and strain variations to relate microscale mechanisms to macroscale behavior.
This study extends prior ESEM investigations of expansive soils by comparatively evaluating three natural expansive soils with differing physicochemical properties under controlled suction hysteresis paths. Unlike many previous ESEM studies focused primarily on bentonite or single-soil systems, this work evaluates the influence of compaction state, equilibration protocol, and activity-related physicochemical indices (SA and CEC) on observed fabric evolution. In addition, image-derived pore-area ratios are explored as comparative indicators of microstructural deformation during drying and wetting cycles. The intent is not to establish a fully predictive quantitative framework, but rather to demonstrate how ESEM imaging can be used to comparatively relate microscale fabric evolution to engineering-scale expansive soil behavior.

2. Materials and Methods

2.1. Materials

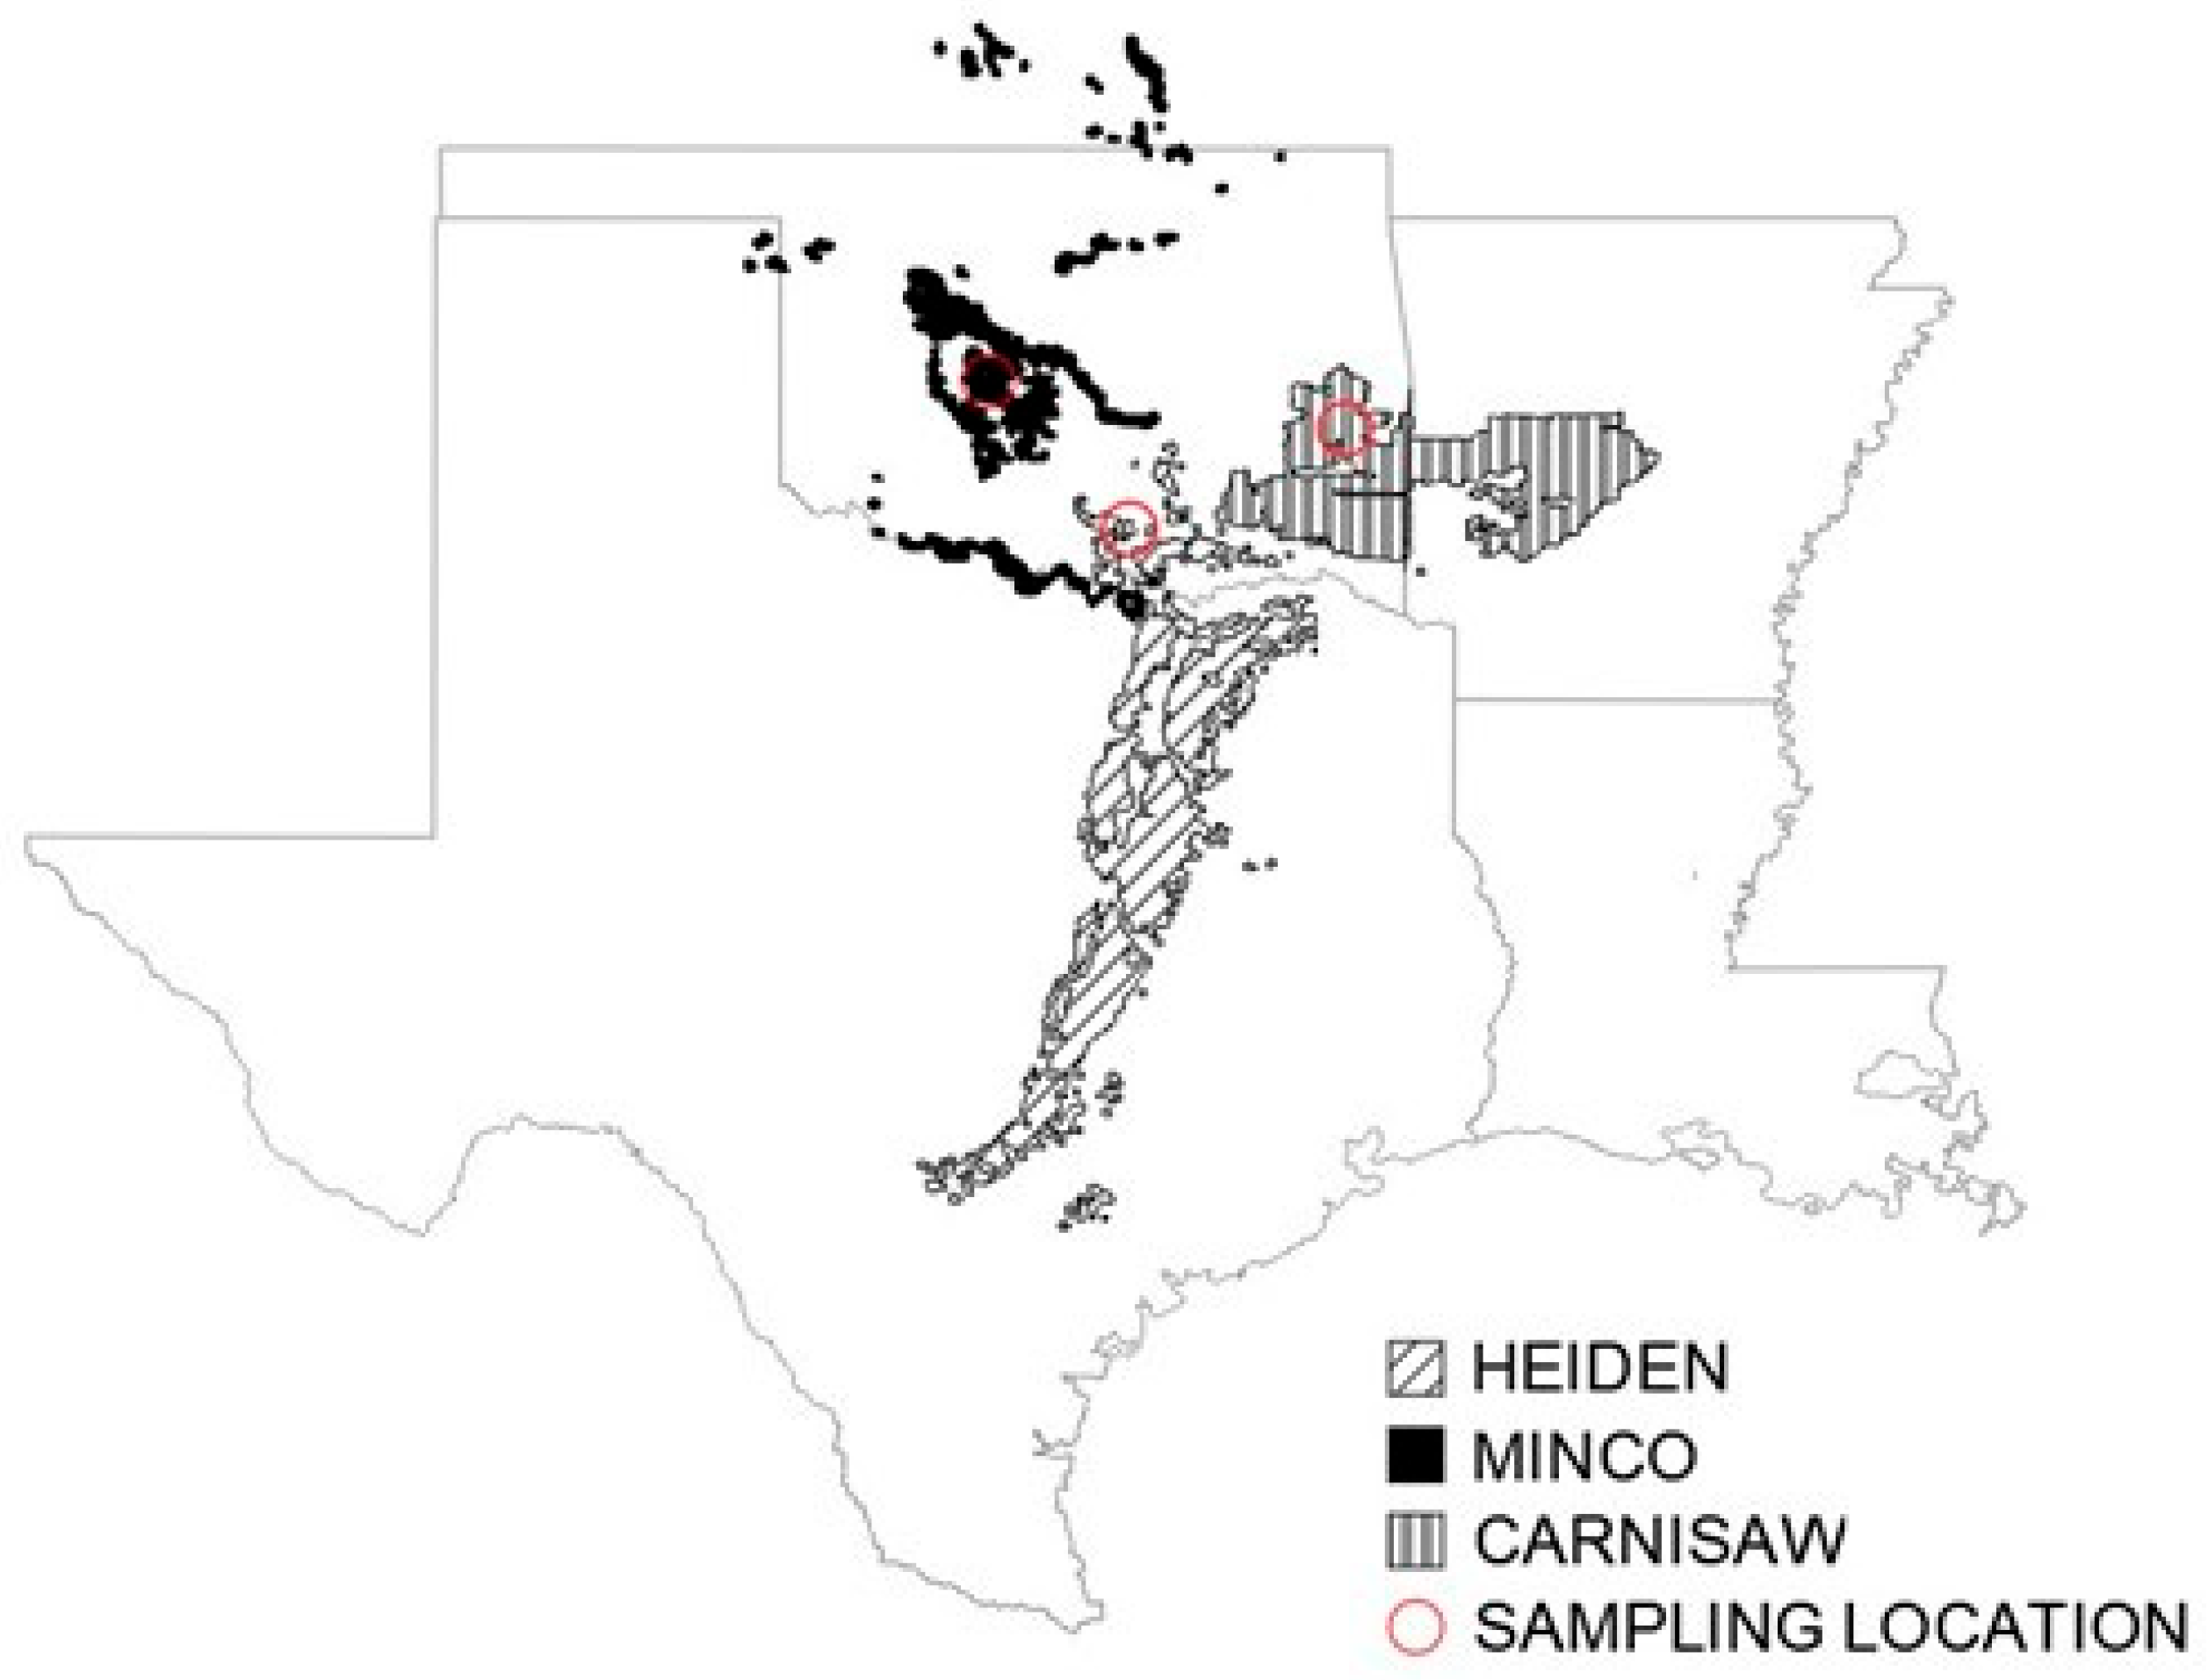
Three natural clays of varying morphology and activity were imaged via ESEM in order to analyze particle structure under suction hysteresis. The clays included (1) Carnisaw, a fine, semiactive, thermic Typic Hapludult, weathered from Pennsylvanian shale, (2) Minco, a coarse-silty, superactive, thermic Udic Haplustoll that formed in material weathered from loamy eolian deposits of Pleistocene age, and (3) Heiden, a fine, smectitic, thermic Udic Haplustert, weathered from mudstone. The clays were obtained from locations in Central, Southeastern, and Southern Oklahoma (Figure 1).
The soils were selected so that a range of physicochemical properties, namely specific surface area (SA) and cation exchange capacity (CEC), were represented (Table 1). SA and CEC correspond to the fraction passing the No. 200 sieve. The specific surface area describes the available geometry of the clay surface able to interact with pore fluid, obtained via the Ethylene glycol monomethyl ether (EGME) method by Lin (2012) [35] and the cation exchange capacity describes the quantity of exchangeable cations required to balance the net negative charge along this surface and was obtained via a 1 N ammonium acetate extraction method by Harris Laboratory, Inc via Lin (2012) [35]. Soils with similar SA and CEC are expected to behave similarly with respect to internal geometry and porosity, interactions with fluids and solutes, compressibility, and strength [34].
Figure 1. Sampling location within the United States of America (USA) and geographic distribution of the studied soils (geologic data obtained from California Soil Resource Lab, 2019 [36]).
Geotechnics 06 00056 g001
Table 1. Physicochemical properties of the tested soils.
Soil IDTotal Sa a (m2/g)External Sa (m2/g)Internal Sa (m2/g)CEC b (meq/100 g)pHClay Size Minerals (%)
Heiden g22951.5177.550.78.7M c (37) I d (5) K e (8)
Carnisaw g107.547.56027.34.4V f (12) I (25) K (14)
Minco h40.51.5398.28.0
a Specific surface area; b Cation exchange capacity, c Montmorillonite; d Illite; e Kaolinite; f Vermiculite; g after Lin 2012 [35]; h after Hamid and Miller 2009 [37] and Miller et al. 2011 [38]).
Table 2 presents common Geotechnical engineering properties of the studied soils. Clay size fractions were obtained via hydrometer analysis according to ASTM D7928 [39]. Additionally, Atterberg limits, i.e., plastic limit (wP), liquid limit (wL), and plasticity index (PI) were obtained according to ASTM D4318-17 [40]. Optimum moisture content (wopt) and maximum dry unit weight (γdmax) were determined from the Harvard miniature compaction instead of standard compaction proctor tests. Each soil was compacted in a Harvard Miniature compaction mold using a 30.48 cm (12 in) drop and 392.3 g (0.863 lb) hammer in five equal layers with six blows performed on each layer. This compaction process was designed and calibrated by Khoury and Khoury (2005) [41] on two CH soils, one CL and one ML soil, with the results closely matching the compaction characteristics of a standard proctor test. Additional standard proctor compaction tests were conducted on Carnisaw according to ASTM D-698 (2011), with the findings closely matching those from the calibrated Harvard miniature compaction tests (both types of compaction generate similar compaction energy [41]. The soil was initially compacted in five equal lifts to wopt and γdmax (the optimum state) using volume-based (impact) compaction. Notice that in common engineering practice, the compaction state of wopt − 2% is frequently encountered in roadway construction or slope stabilization due to moisture loss, while the state of wopt + 2% is more likely desired in landfill clay liners for permeability concerns.
Although Carnisaw is classified as MH according to the USCS plasticity chart criteria, the soil still exhibits expansive behavior due to its clay mineralogy, measurable swell pressure, and physicochemical activity. This highlights that expansive behavior is not always captured solely by USCS classification.
The swell potential was assessed by following method A of the one-dimensional swell test of cohesive soils ([42]). Each soil specimen was compacted at the optimum state directly in an oedometer ring of 63.5 mm in diameter and 10 mm in height. The specimen was then submerged in de-ionized water in an oedometer cell and allowed to swell under a seating load of 1 kPa. After complete expansion, the samples were consolidated to their original height so that the swell pressure could be retrieved. The unconfined compressive strength (qu) was determined on the specimens compacted to the optimum state from a Harvard miniature mold.

2.2. Activity Characterization

Activity has been used to explain the tendency of soil to chemically interact with the environment, specifically regarding the inclination of the soil to retain water. The greater the activity, the more likely the soil is to chemically interact with pore fluid. Soil activity was first defined by Skempton (1953) [43] to describe the influence of mineralogical and physical characteristics on soil plasticity. That is, the range of moisture contents at which fluids can be adsorbed to the clay surface is dependent on the type of clay minerals contained in the soil as well as the fraction of the deposit containing those minerals. Skempton’s activity is given by:
A = P I C F
where A is the Skempton activity, PI is the plasticity index (wLwP), and CF is the fraction of the soil finer than 2 μm [43].
However, soils with the same plasticity index can vary in behavior if the mineralogy varies [34], and plasticity alone has been shown to be inadequate to characterize soil shrinking and swelling on the macroscale, e.g., [44]. Instead, physicochemical parameters intrinsic to each soil better describe how soil will interact with the pore fluid. The relative activity (AR) uses the specific surface area of the clay fraction to normalize the PI, better defining the impact of the clay fraction on plasticity [45]:
A R = P I S A
The SA activity (AS) utilizes the influence of the clay specific surface area on the plasticity, replacing PI with SA to calculate activity [46].
A S = S A C F
The clay fraction is useful to describe activity because of the net negative charge along the clay surface, which is not present in nonplastic soils. A more direct measurement of the activity due to the clay fraction, then, is to account for the net negative charge along the surface, quantified by the CEC. The CEC activity (ACEC) is given by Cerato and Lutenegger (2005) [34]:
A C E C = C E C C F
where CEC is the cation exchange capacity in milliequivalents/gram (meq/g). The calculated activity values of the tested soils are presented in Table 3.
Skempton (1953) [43] described kaolinitic clays as nearly inactive and Na-montmorillonite clays as the most highly active (i.e., activity greater than 2.0). Therefore, clays less likely to shrink and swell would behave more like a kaolinite with changing suction, while those with higher activity are expected to exhibit the greatest amount of shrinking and swelling.

2.3. Interpretation of Activity Indices Relative to Observed Fabric Behavior

The calculated activity indices provide a useful framework for interpreting the differences in microstructural response observed in the ESEM images. While the Skempton Activity index (PI/CF) offers a traditional measure of a soil’s reactivity, alternative indices based on specific surface area (SA) and cation exchange capacity (CEC) capture the physicochemical drivers of fabric change more directly.
The Heiden soil, which exhibited the most pronounced desiccation cracking and water film hysteresis, had the highest SA and CEC activity values (4.16 and 3.23, respectively), consistent with strong clay–fluid interactions. These observations suggest that SA and CEC may better reflect the physicochemical environment influencing water retention and fabric rearrangement at the particle scale.
In contrast, the Minco soil, with very low CEC (8.2 meq/100 g) and SA (40.5 m2/g), showed almost no visible structural change during drying and wetting. Its activity indices (all ≤ 2.1) suggest that mechanical effects due to silt content dominate its response, rather than physicochemical interactions.
Carnisaw soil exhibited moderate behavior: while it had lower SA and CEC than Heiden, it still demonstrated some minor film formation and aggregate texture variation under ESEM. This supports the intermediate nature of its activity profile (SA Activity = 1.89, CEC Activity = 1.05).
These trends underscore the importance of considering multiple activity parameters, particularly those based on intrinsic soil surface properties, when assessing the potential for structural changes under hysteretic moisture conditions. They also support prior findings by Cerato and Lutenegger (2005) [34], who emphasized that plasticity alone is not a sufficient predictor of swell-shrink behavior.
Because only three natural soils were evaluated, the relationships between activity indices and observed microstructural response should be interpreted qualitatively rather than as statistically validated correlations.

2.4. Methodology

2.4.1. Soil Sample Preparation

Specimens compacted at target maximum dry density and optimal moisture content via Harvard miniature mold (71 mm height, 35.6 mm diameter), and additional specimens of Heiden soil were compacted wet of optimum (Table 4). Each specimen was first sieved through the No. 200 sieve, then mixed with distilled water to the desired water content. Thus, the ESEM observations correspond to the same fine-grained fraction used for SA and CEC characterization. Compaction consisted of 5 equal lifts with 10 blows per lift via a 30-cm drop hammer, detailed in Hussey (2010) [47]. As-compacted dry density was verified by weighing the compacted sample in the mold, removing a portion from the top and bottom of the sample, and averaging the gravimetric water content. To compare differences due to initial compaction states, Heiden was compacted at optimum moisture content (Heiden opt) and wet of optimum (Heiden w1). Additionally, to compare differences in equilibration times, specimens of Heiden clay compacted wet of optimum were equilibrated at different intervals during imaging. Heiden w1 was equilibrated for 15 min at each suction, while Heiden w2 was not equilibrated between suction points; instead, micrographs were continuously collected along the drying and wetting paths.
The specimens were extruded from the Harvard miniature mold and trimmed to dimensions 10 mm × 10 mm × 5 mm with the thin axis perpendicular to the direction of compaction, similar to the preparation procedure detailed in Lin and Cerato (2014) [24]. Trimmed specimens were wrapped in plastic to avoid moisture loss and placed in a humid room until being transported to the ESEM chamber for imaging.

2.4.2. Environmental Scanning Electron Microscopy

A ThermoFisher Scientific Quattro S Field-Emission Environmental Scanning Electron Microscope (FE-SEM, Westford, MA, USA) was used to obtain micrographs of the studied soils. The device has a voltage range of 0.2 to 30 kV for high vacuum imaging and a low vacuum capability of up to 4000 Pa. In this particular case, images were collected with the gaseous secondary electron detector (GSED) at 20 kV accelerating voltage in the environmental mode. Relative humidity was controlled ±2%; pressure 100–4000 Pa; resolution 3 nm at 30 kV.
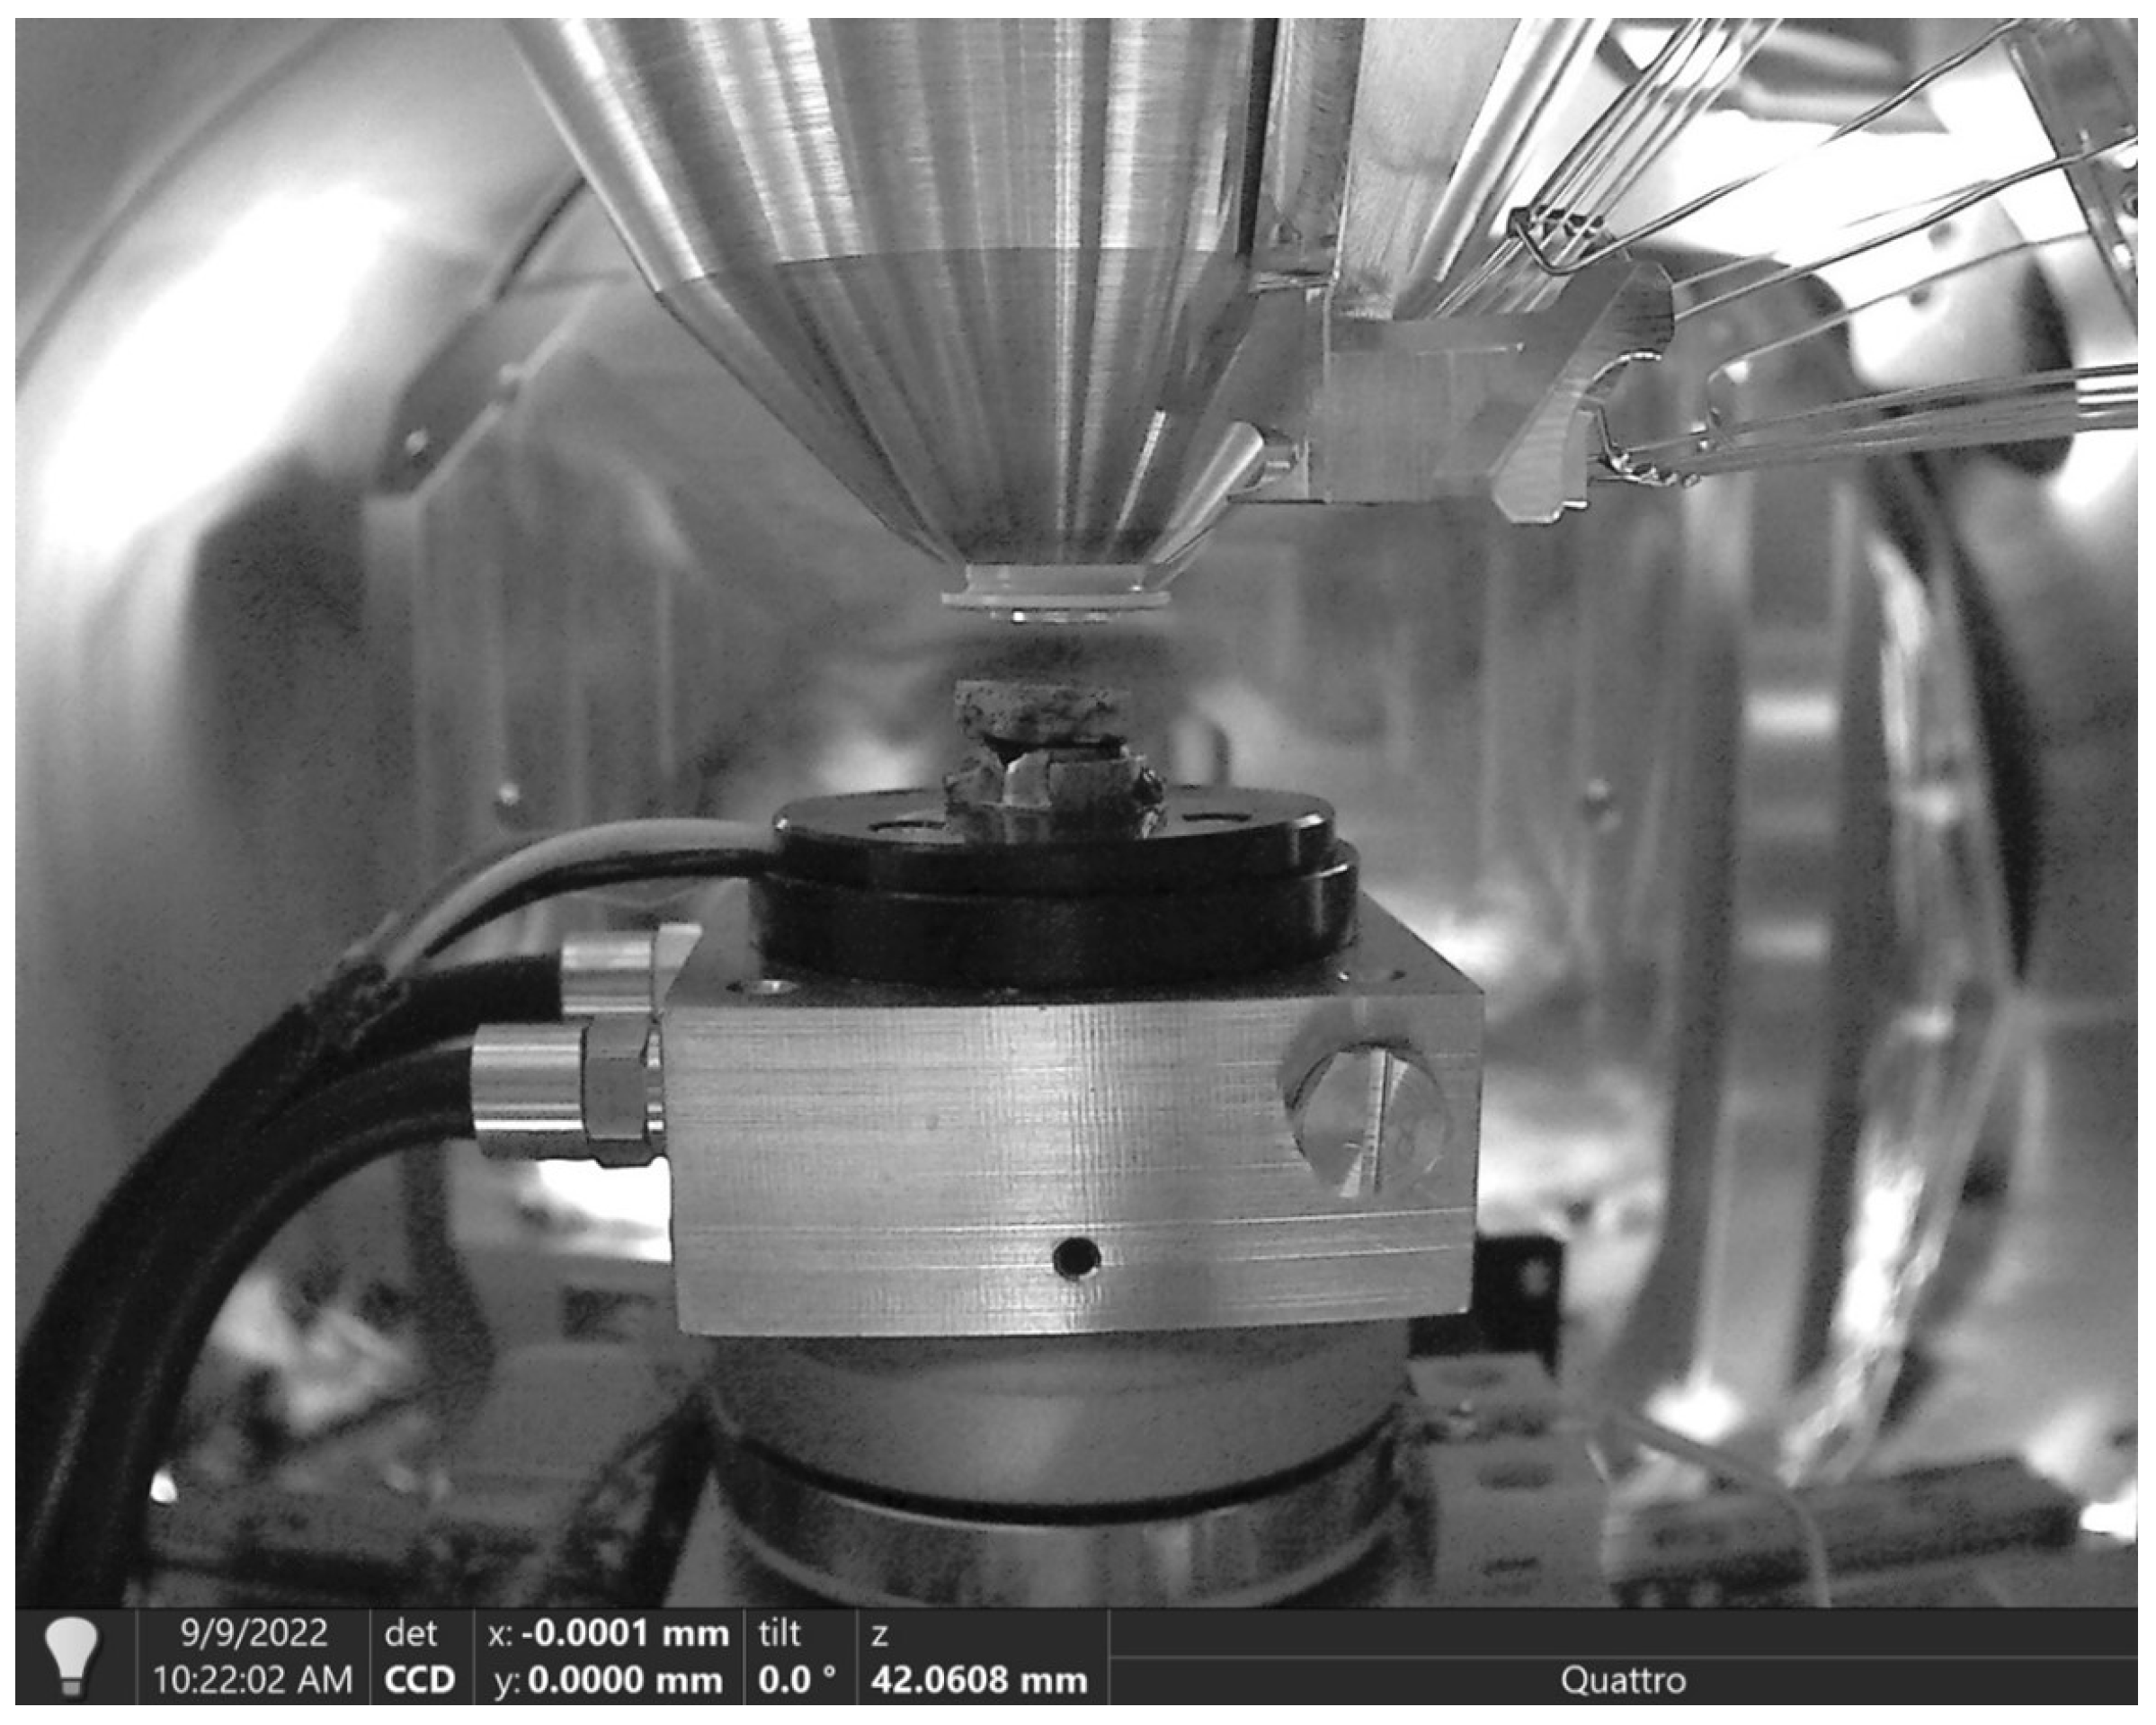
Each specimen was trimmed with a small groove along the long axis, perpendicular to the compaction plane. This was to allow better visualization of the internal composition of the soil. Specimens were then mounted to the Peltier cooling stage of the ESEM using carbon tape (Figure 2). Once mounted in the chamber, specimens were initially saturated by adjusting relative humidity (RH) to 100% with a 740 Pa chamber pressure at a constant 2 °C and allowed to equilibrate for 15 min.
Equilibration times of 20–30 min [24], 15 min [23], and 10 min [22] have been used, but 15 min equilibration was deemed sufficient to obtain moisture equilibrium between pore fluid and chamber humidity by Sun et al. (2019) [23]. A 15-min equilibration corresponds to 95% vapor equilibrium based on Lin (2012) [35]. Sensitivity checks at 5 and 30 min showed <3% difference in image-derived pore-area ratio, confirming sufficiency. The lack of equilibration (Heiden w2) reproduced hysteresis suppression, consistent with incomplete vapor equilibrium.
To assess differences in equilibration times, specimens of Heiden clay compacted wet of optimum were equilibrated at different intervals during imaging. Heiden w1 was equilibrated for 15 min at each suction interval, while Heiden w2 was not equilibrated; instead, micrographs were continuously collected along the drying and wetting paths.
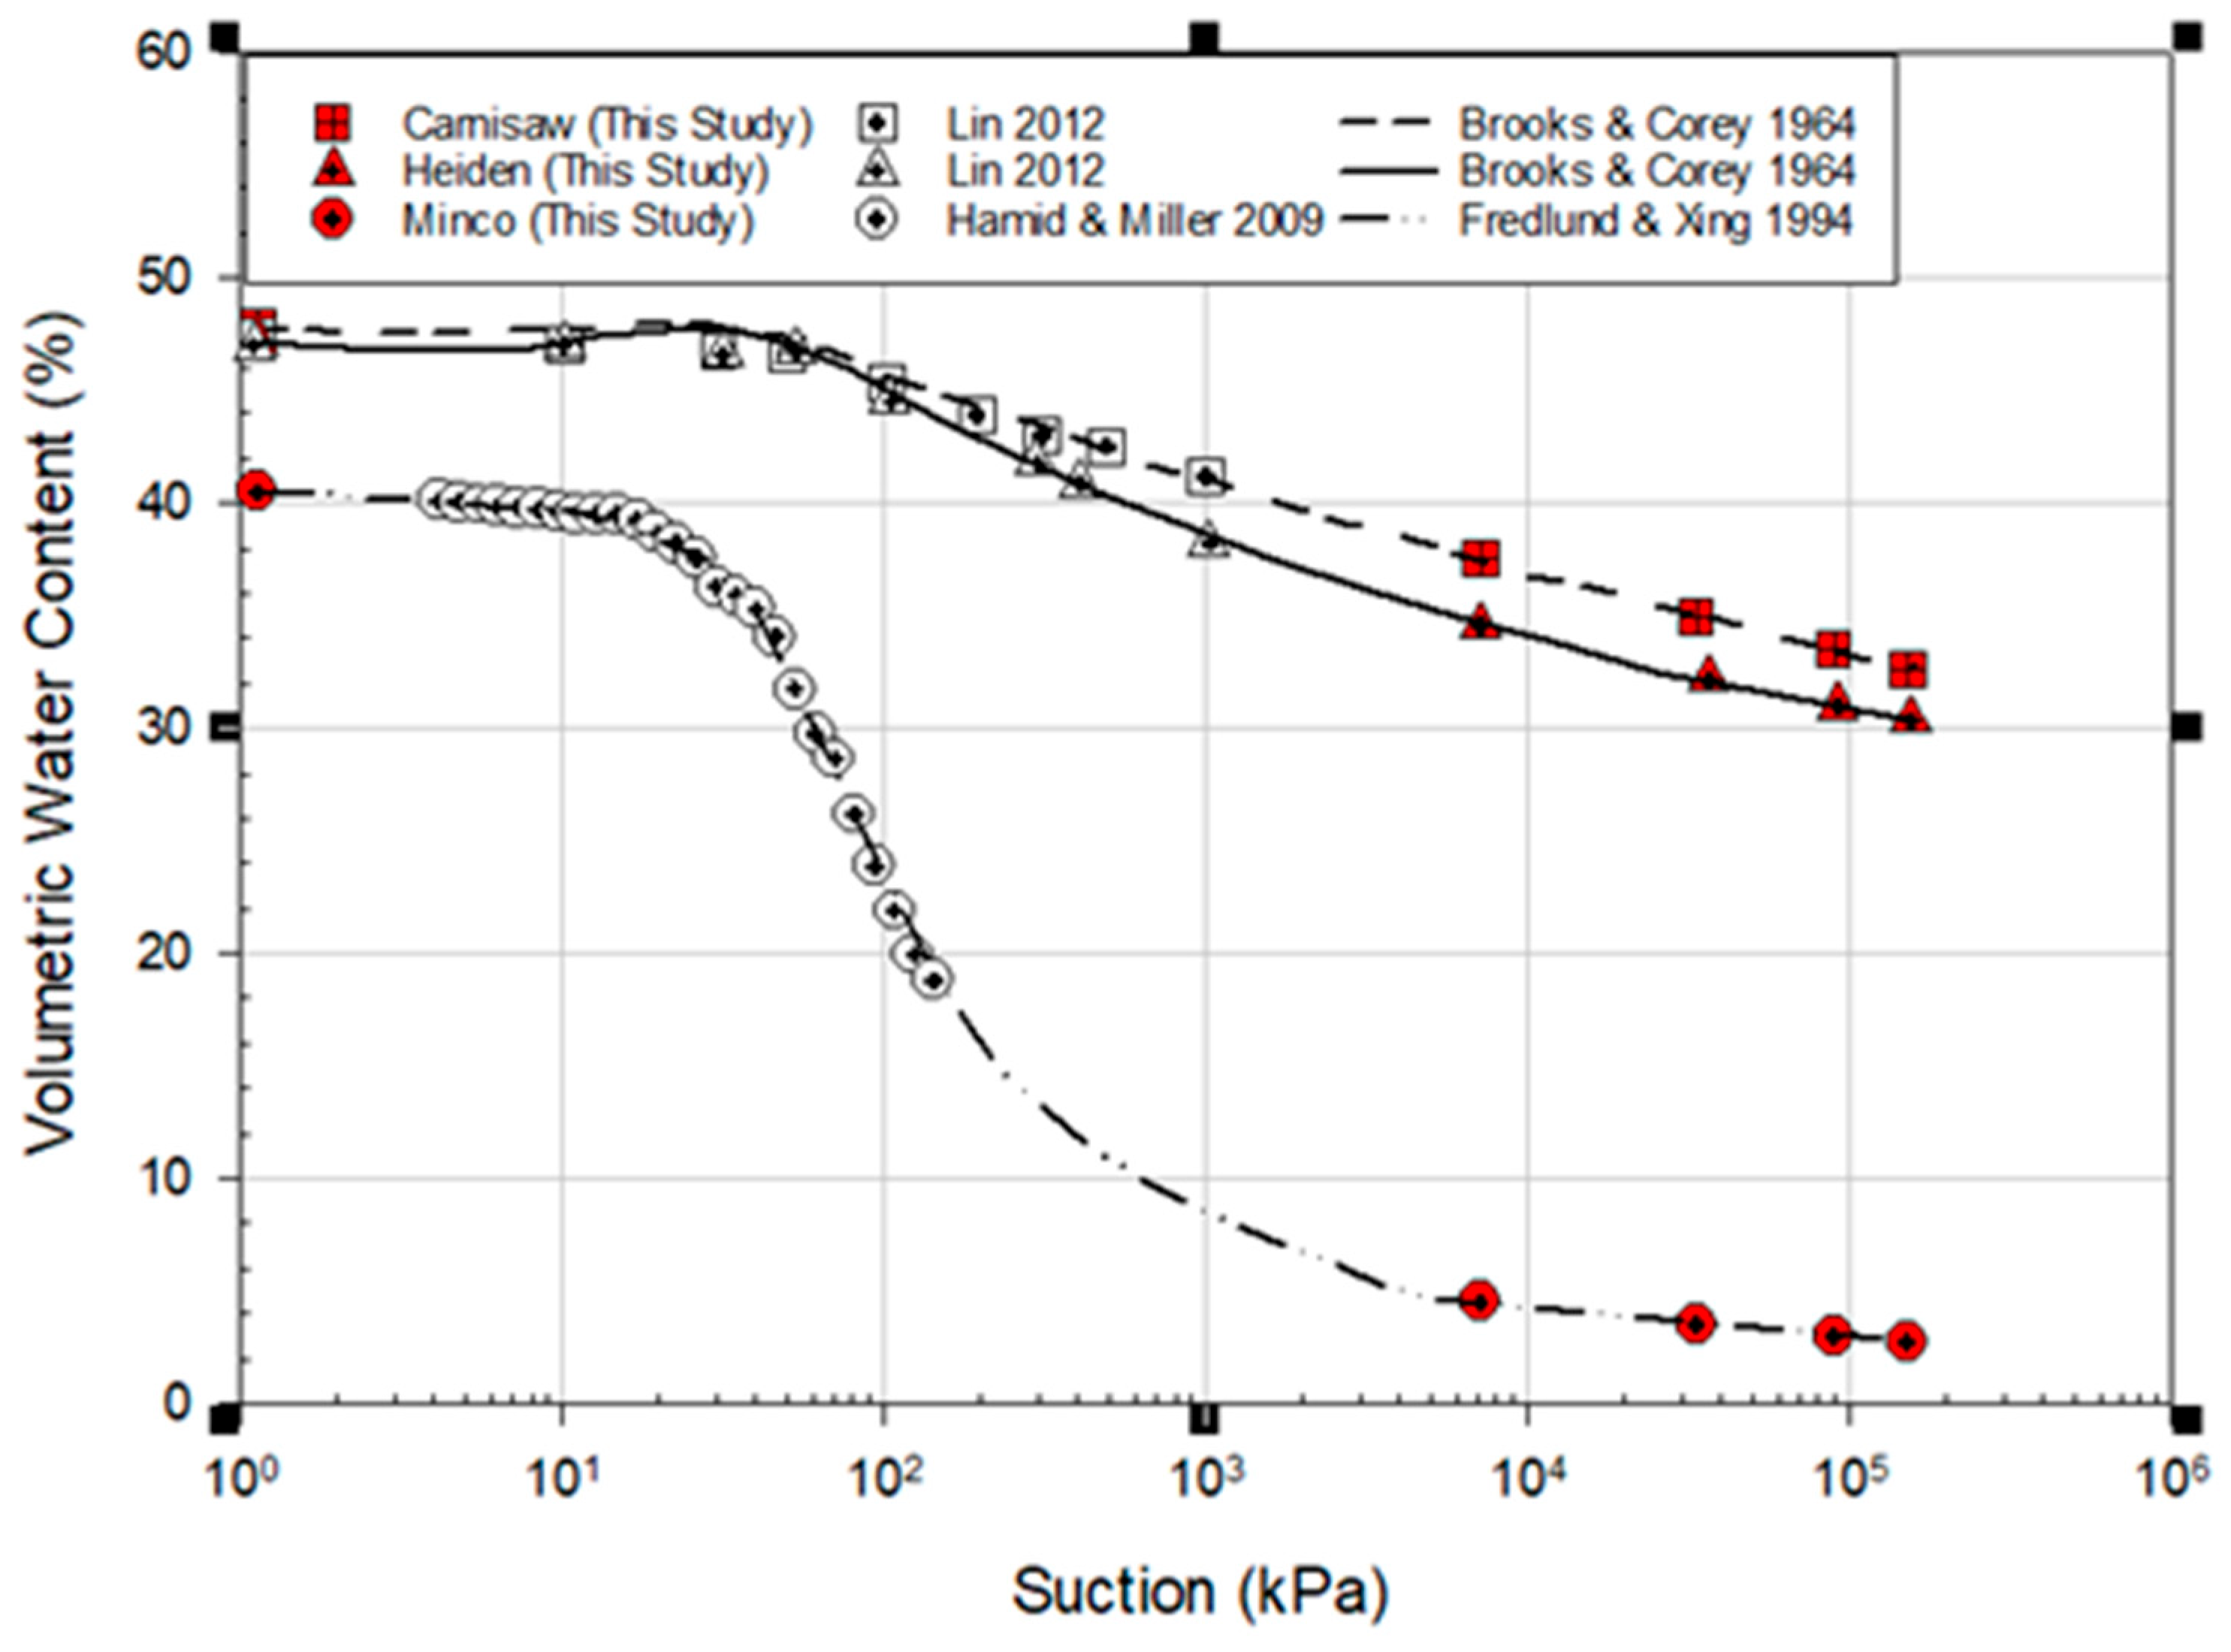
Previously measured SWCCs of Carnisaw and Heiden obtained by Lin (2012) [35], and Minco obtained by Hamid and Miller (2009) [37], were used as reference curves to guide suction-stage selection for ESEM imaging (Figure 3). Closed-form solutions for Carnisaw and Heiden were obtained using the Brooks and Corey (1964) [48] model. The Fredlund and Xing (1994) [49] equation was used to model the resulting behavior of Minco Silt. Approximate suction states corresponding to the imposed ESEM chamber conditions were compared with previously measured SWCC data of Hamid and Miller’s (2009) [37] and Lin’s (2012) [34] studies to contextualize the selected suction regimes (Figure 3) and are detailed in Table 5.
SWCCs were not directly measured for this study due to the small sample size and moisture control protocol constraints. Instead, established SWCCs from Hamid and Miller (2009) [37] and Lin (2012) [35] for identically prepared soils under similar compaction conditions were used to inform suction stages, as direct SWCC measurement within the ESEM protocol was not feasible. Because SWCCs were not directly measured on the imaged specimens, the curves shown in Figure 3 should be interpreted as representative reference behavior for similarly prepared soils rather than specimen-specific water retention relationships.
The range of suction states a soil specimen experiences can be divided into three regimes: (1) the tightly adsorbed regime where pore water is retained via molecular bonding mechanisms, generally occurring between 10 to 1000 MPa, (2) the adsorbed film regime where water is retained in the form of thin films on the particle surfaces due to solid-liquid interaction mechanisms, generally occurring between 0.1 to 10 MPa, and (3) the capillary regime where the amount of water adsorbed to the soil surface is a function of the particle size distribution and the air-entry pressure, generally occurring between saturation and 0.1 MPa [16]. Because it was important to observe microscale behavior along all three regimes, spanning from saturation to very dry conditions (high suctions), the soils were subjected to suctions beginning at zero and progressively increasing to 148 MPa, which is well beyond the range of suctions obtained by Hamid and Miller (2009) [37] using an oedometer cell equipped with pore-air and pore-water pressure control and Lin (2012) [35] using the pressure plate apparatus (i.e., 0.01 to 1 MPa).
To capture the hysteretic nature of the studied soils, micrographs were collected at the same suctions through the primary drying and secondary wetting portions of the HSWCC. Near-saturation was simulated by equilibrating at 100% RH, although complete saturation cannot be ensured without submersion. The primary drying portion of the HSWCC occurred as the specimen was dried from near 100% RH to 31% RH, and the secondary wetting portion occurred as the specimen was rewetted from 31% RH to near 100% RH.
An advantage of the ESEM device is that chamber humidity is controlled by altering chamber pressure and allowing the moisture conditions to equilibrate. Therefore, the sample is subjected to hysteretic moisture cycles at a broad range of suction states without the adverse effects of changes in suction associated with experimental procedures such as the pressure plate and Dewpoint Potentiometer (WP4). For instance, the wetting and rewetting cycles are difficult to obtain with clays due to diffused air blocking moisture from returning to the sample through the pressure plate [34,50], and other methods, such as the WP4, can only measure suctions up to 80 MPa [51]. Furthermore, due to the issues associated with obtaining the rewetting portion of the HSWCC, most studies only perform a single drying–wetting cycle, and there is little experimental information for multiple drying or rewetting cycles [5].
To progress along the primary drying curve, several discrete suctions were chosen from the SWCC (Table 5). These suctions within the sample were achieved by adjusting the chamber pressure at a constant temperature (2 °C) and equilibrated for 15 min at each point. A lower limit of 31% RH was encountered, as it was difficult to maintain image quality below this humidity (148 MPa suction) due to constraints regarding image contrast. When the soil dried beyond 31% RH, there was no observation of a water phase, and the gaseous secondary electron detector could not differentiate the pore versus soil phases, returning an image with no contrasting grey scale, i.e., the image was solid black. This is because at 31% RH, the chamber pressure in the SEM is at a lower value, where the gaseous secondary electron detector does not perform well due to low signal amplification.
Soils were imaged along the secondary wetting portion of the HSWCC for the same discrete points and equilibrated for 15 min at each pressure until returning to 100% RH. Suction was calculated from the relative humidity according to:
ψ = R · T υ w 0 · ω v ln ( R H )
where RH is the relative humidity, R is the universal gas constant (8.314 J/mol), T is the temperature (K), υw0 is the specific volume of water (m3/kg), and ωv is the molecular mass of water vapor (kg/mol) [16].
While the 0–148 MPa range used in this study covered all three suction regimes, there were two major challenges encountered within the adsorbed film regime (e.g., 0.1–10 MPa). First, it was difficult to obtain discrete RH values between 90 and 100% RH (suctions between 10 and 0.1 MPa) because the change in chamber pressure to achieve a small change in RH is small, e.g., at a temperature of 2 °C to achieve 90% RH the chamber pressure should be approximately 625 kPa, whereas at 95% RH the chamber pressure only increased by 40 kPa to 665 kPa. At 100% RH, the chamber pressure would equal 740 kPa. Likos and Lu (2003) [52] reported that it is typical to increase RH in 10% intervals for a humidity-controlled chamber. In this study, RH values were imaged at roughly every 20–25% interval, excluding the first 5% interval.
The second challenge was that even when RH values between 90 and 100% were achieved, adsorbed water often completely obscured the image, and discerning differences in structural features was impossible. Fortunately, in this study, an adequate image quality was achieved at 7 MPa (95% RH). Because of these testing difficulties, the majority of suction values obtained in the ESEM are within the tightly adsorbed regime: 35 MPa (76% RH), 89 MPa (50% RH), and 148 MPa (31% RH) and the study focuses on the differences in features observed at 100% RH (saturation) within the capillary regime and 7 MPa (95% RH) within the adsorbed film regime with the higher suction values representing the tightly adsorbed regime.
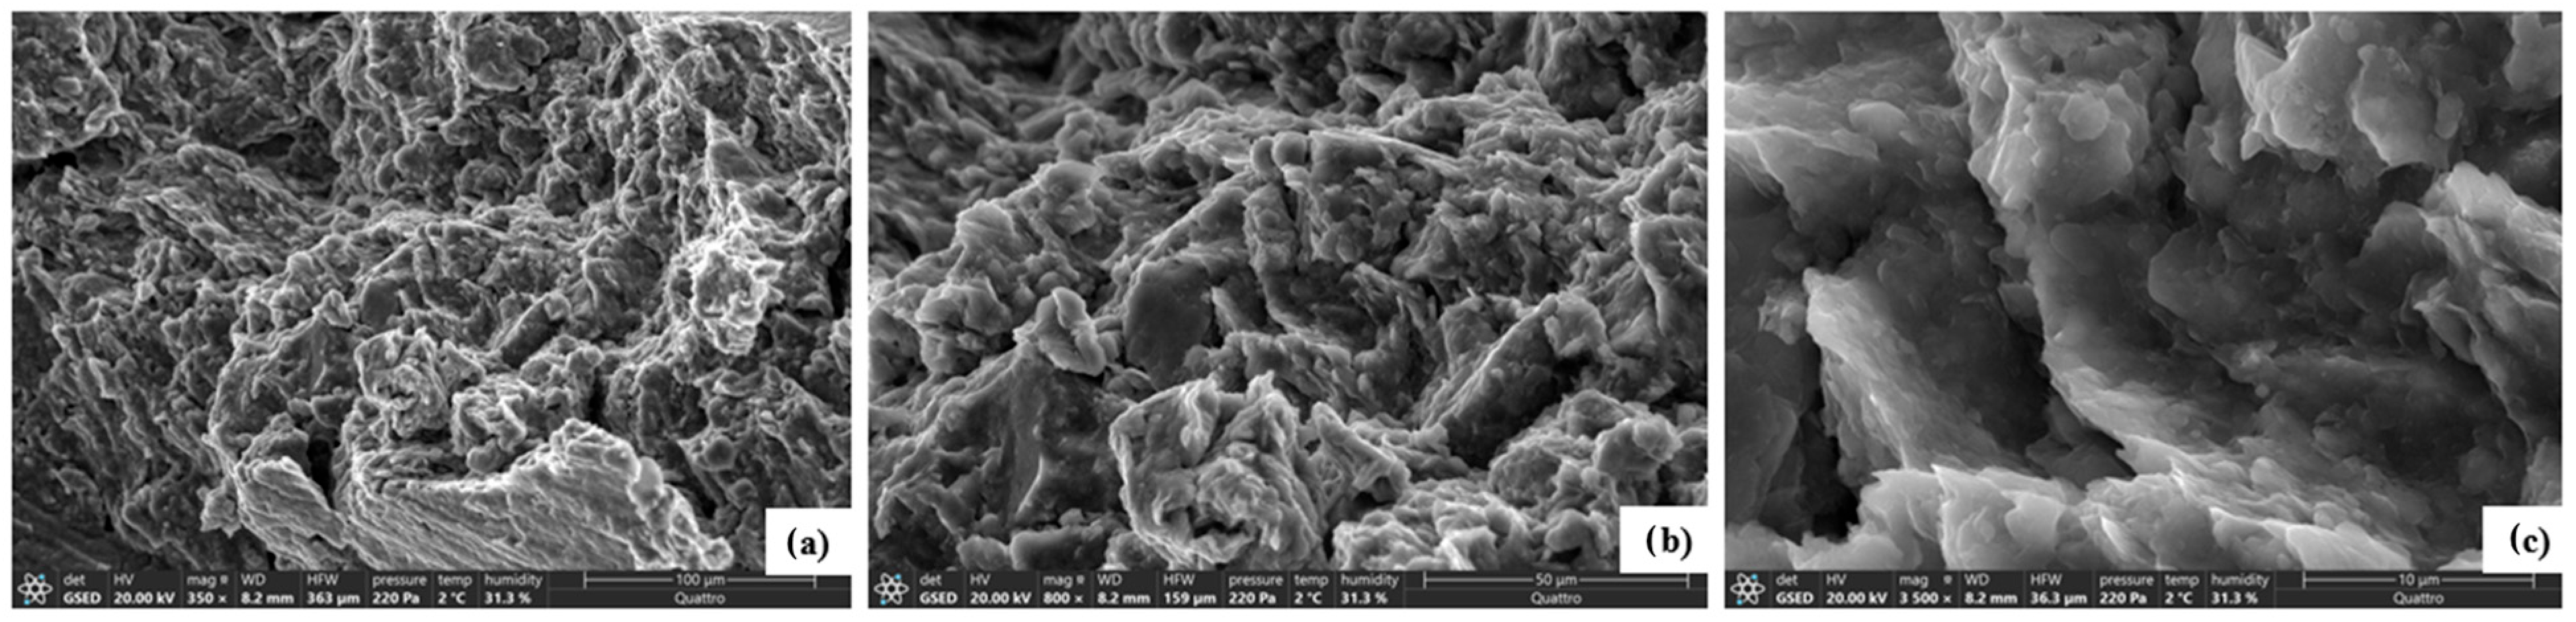
Micrographs were collected at magnifications of 350X, 800X, and 3500X corresponding to horizontal field widths of 592 μm, 259 μm, and 59.2 μm, respectively, along both the drying and wetting cycles (e.g., Figure 4). The 350X magnification provided a broad view at the aggregate level, while the 3500X magnification allowed a better visualization of the interparticle level. The 800X magnification provided an intermediate view between the aggregate and particle separation.

2.4.3. Semi-Quantitative Analysis of ESEM Micrographs

Semi-quantitative analysis of the ESEM micrographs was performed using FIJI/ImageJ v. 1.54f. ImageJ is an image analysis software developed by the National Institute of Health (NIH). FIJI [53] is an open-source release of ImageJ that allows for processing and analysis of large datasets.
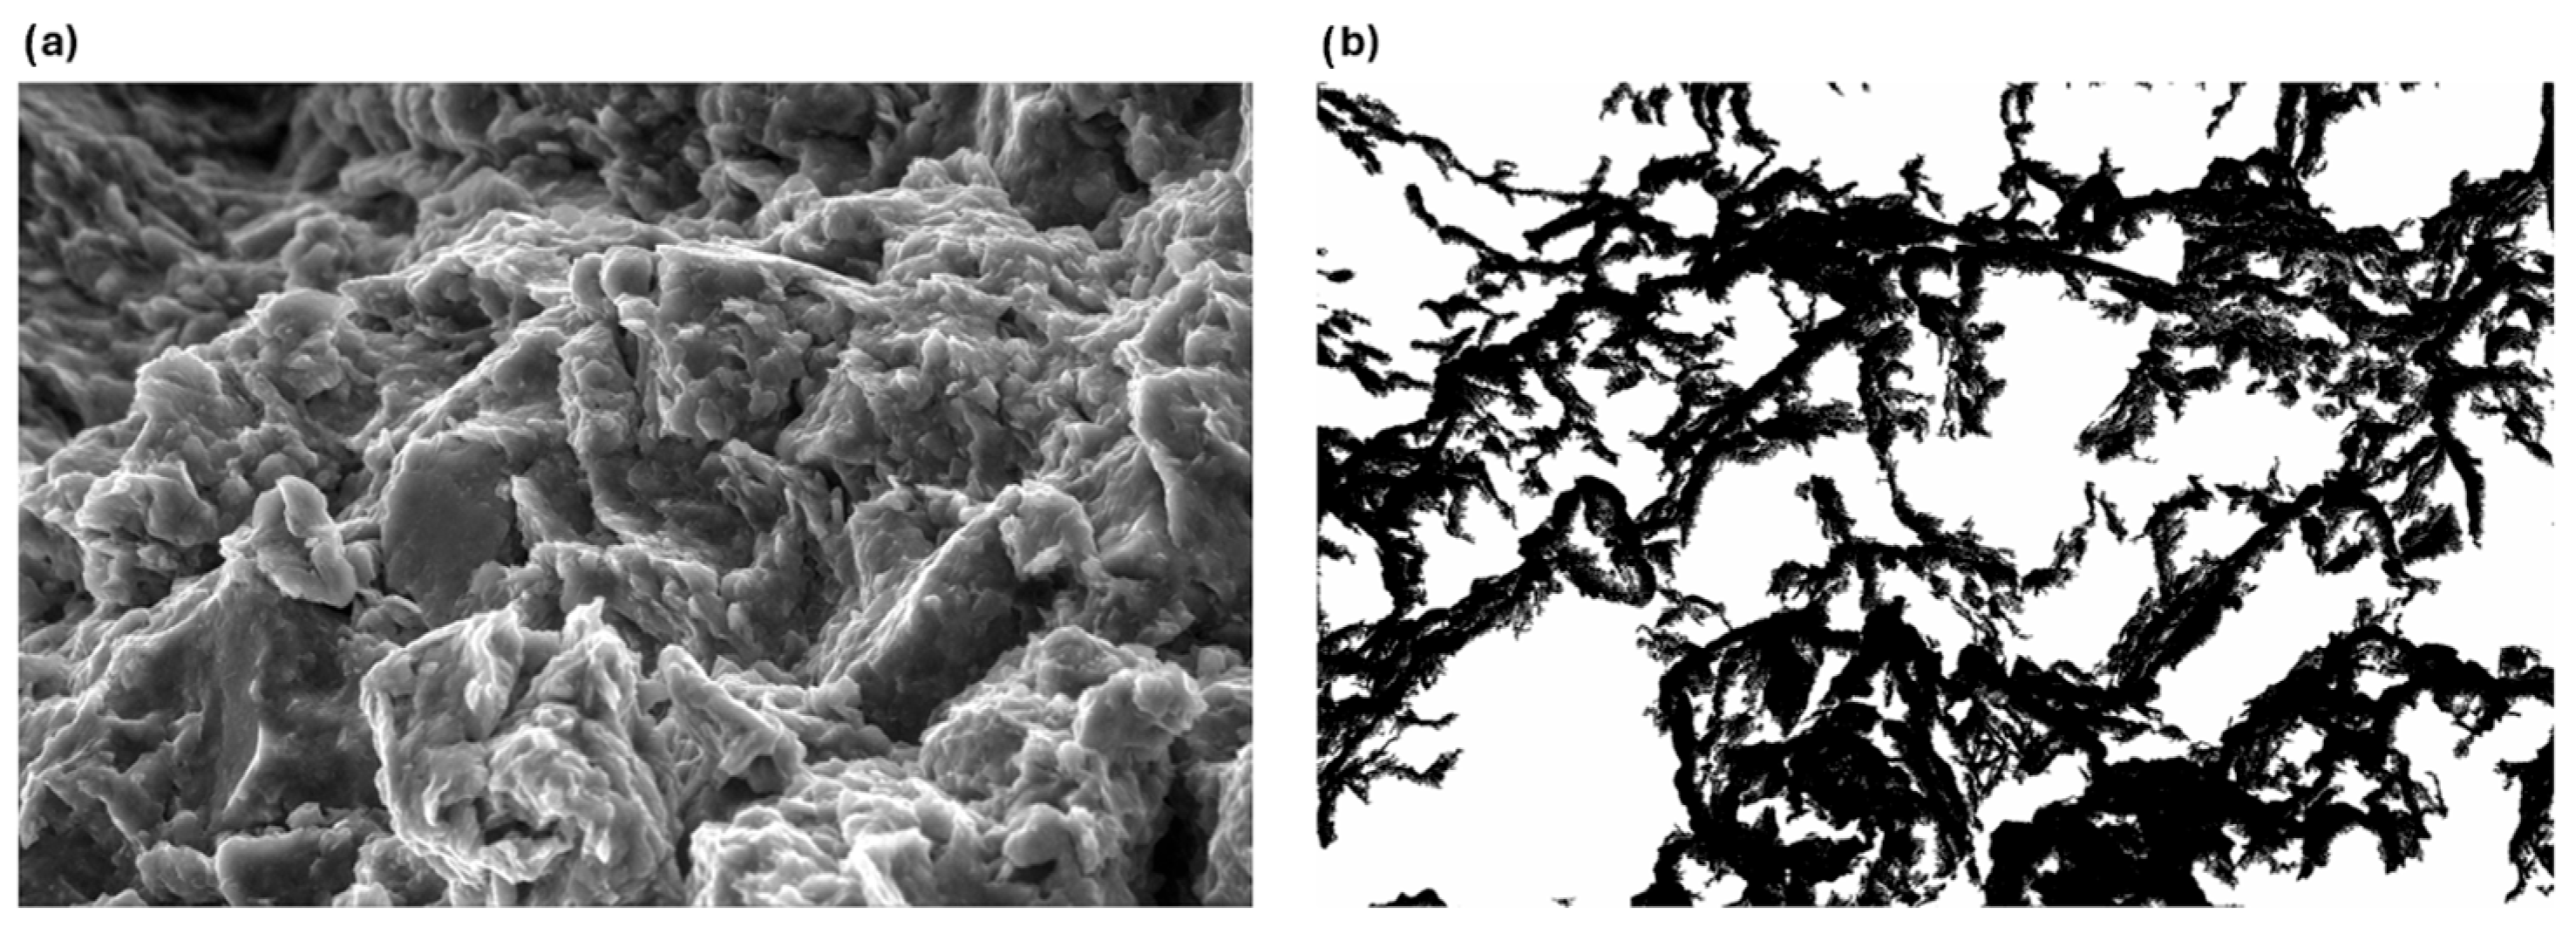
Micrographs were processed by first sharpening and then filtering to remove background noise (Figure 5a). Next, the images were converted to binary using a greyscale threshold, which separated the pore spaces from the soil phase. Thresholding was performed in FIJI/ImageJ using a consistent grayscale threshold range selected to maximize phase contrast between pore and soil regions across all specimens. Sensitivity checks performed on representative images showed that modest threshold adjustments produced only minor variations in calculated pore-area ratios and did not alter the observed comparative trends between soils and suction states. The soil phase was represented by black pixels, and the pore phase was represented by white pixels (e.g., Figure 5b). An apparent two-dimensional pore-area ratio was interpreted from the ratio of white pixels (pore phase) to black pixels (soil phase) in each image. Because ESEM images represent two-dimensional fields of view, these values should not be interpreted as direct measurements of three-dimensional void ratio. Instead, they are used herein as comparative indicators of relative microstructural change during drying and wetting paths.
Because the image analysis captures only changes in the two-dimensional pore phase, apparent volumetric strain indicators were estimated from changes in the image-derived pore-area ratio according to:
ε a = 100 · e a 1 + e a 0
where ε a is the apparent volumetric strain indicator, Δ e a is the change in image-derived pore-area ratio between RH = 100% and subsequent drying/rewetting states, and e a 0 is the image-derived pore-area ratio at RH = 100%.
The apparent volumetric strain was estimated from changes in image-derived pore-area ratio between suction states, assuming constant particle volume. These strain estimates are intended only for comparative interpretation of microstructural evolution and do not represent direct measurements of bulk specimen deformation. The strain was calculated using Equation 3, with changes measured relative to RH = 100% (saturation). This method aligns with micrograph-based deformation estimation used by Montes-H (2005) [4] and Sun et al. (2019) [23].

2.5. Image Analysis and Potential for Fractal Characterization

Although this study used binary thresholding to estimate void ratios and strain, recent advances have demonstrated the value of fractal geometry for characterizing soil microstructure from ESEM and SEM images. For example, Sun et al. (2024) [29], Basham and Cerato (2025) [54], and Huang et al. (2025) [55] successfully applied box-counting and pore fractal models to quantify self-similarity in pore networks and link them to soil-water retention and strength parameters. These approaches allow differentiation between micro- and macro-pore complexity and could enhance the interpretation of suction hysteresis and cracking behavior observed here. Incorporating fractal descriptors in future analyses may provide a more nuanced measure of fabric evolution in expansive soils.
Fractal analysis has proven effective in quantifying pore self-similarity and scale-dependent fabric complexity in unsaturated soils [26,27,30]. The fractal dimension (Df) provides a compact measure of structure irregularity and can be correlated with SWCC hysteresis and strength evolution [30,54]. The binary-thresholding approach applied here may provide a useful basis for future quantitative microstructural characterization.

3. Results and Discussion

This section presents the observed microstructural changes in expansive soils imaged via Environmental Scanning Electron Microscopy (ESEM) along drying and wetting cycles. Images were analyzed at varying magnifications and suction levels. Volumetric strain estimates were derived from image analysis using binary processing of grayscale micrographs. The observed fabric changes were then interpreted in the context of soil physicochemical properties, compaction conditions, and suction hysteresis.
A summary of the ESEM results by soil type is given in Table 6.

3.1. Fabric Evolution During Drying and Wetting

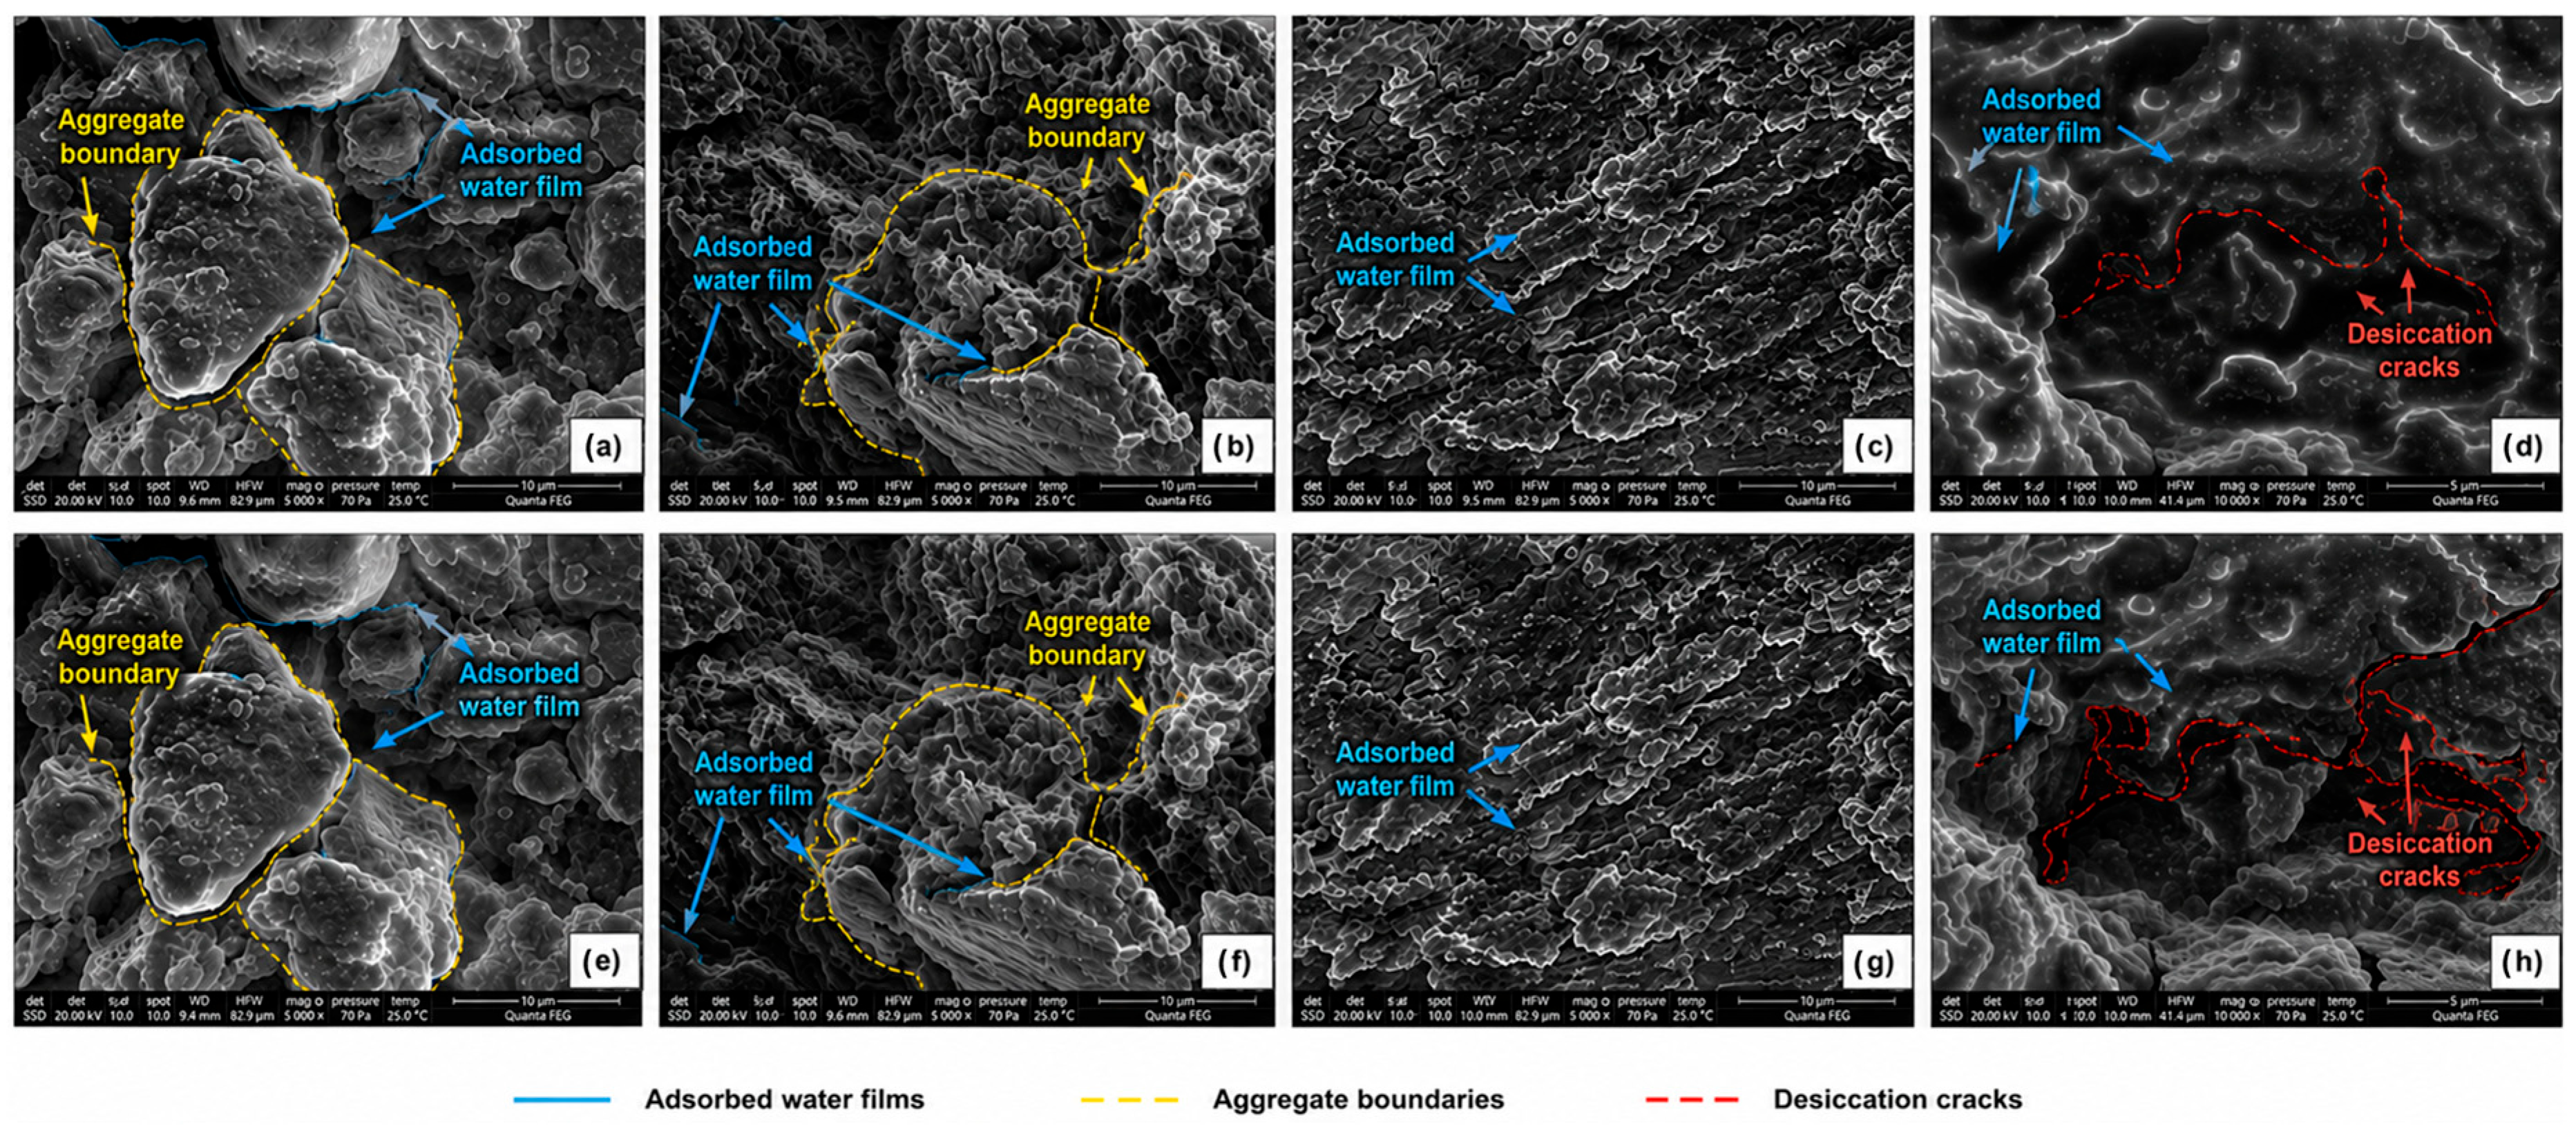
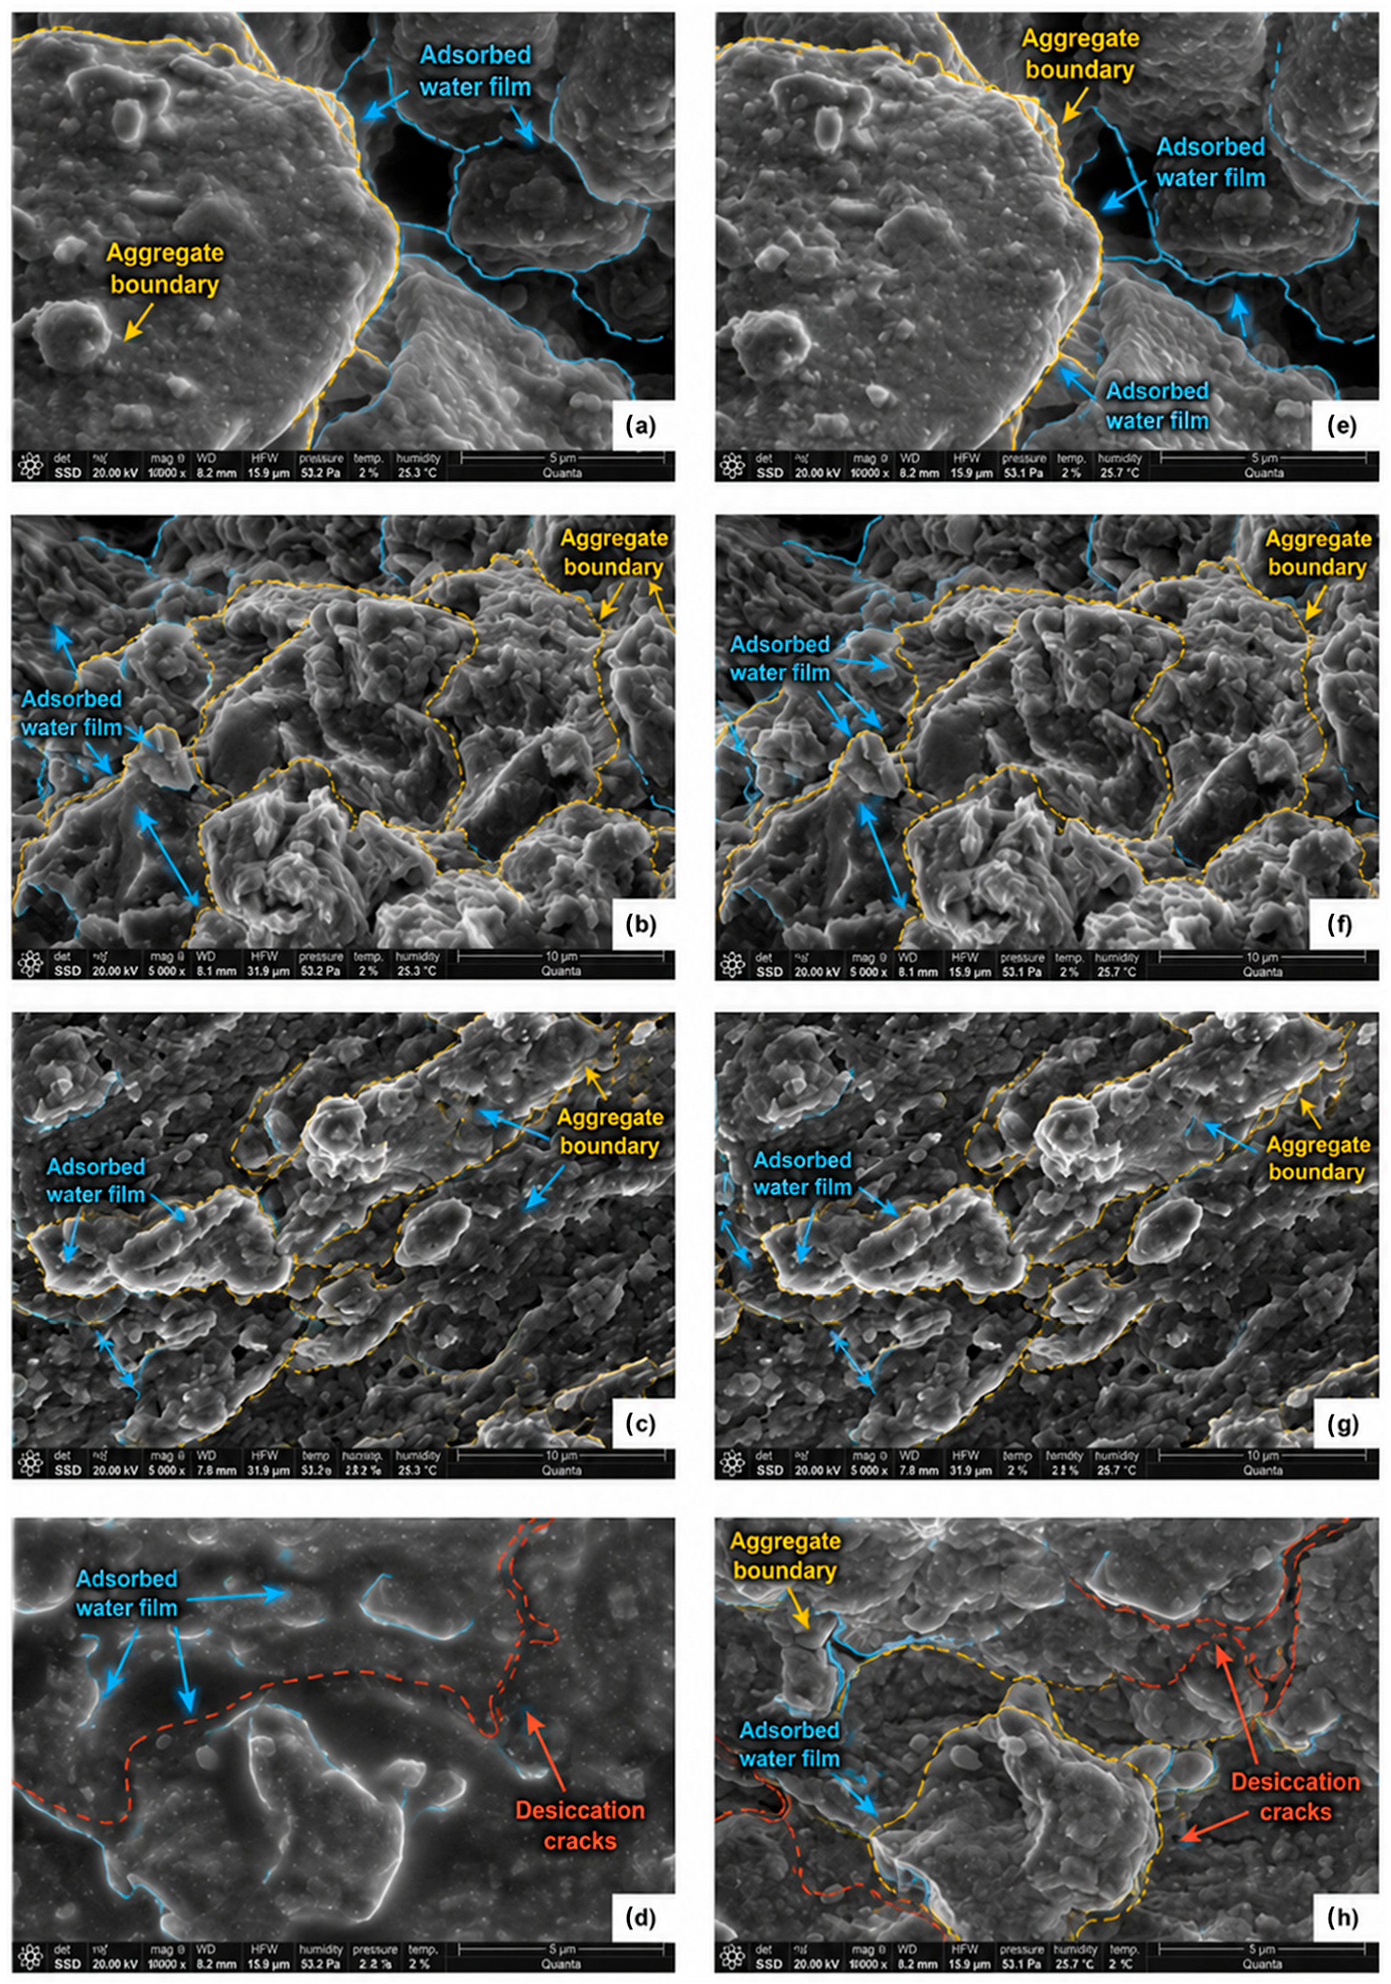
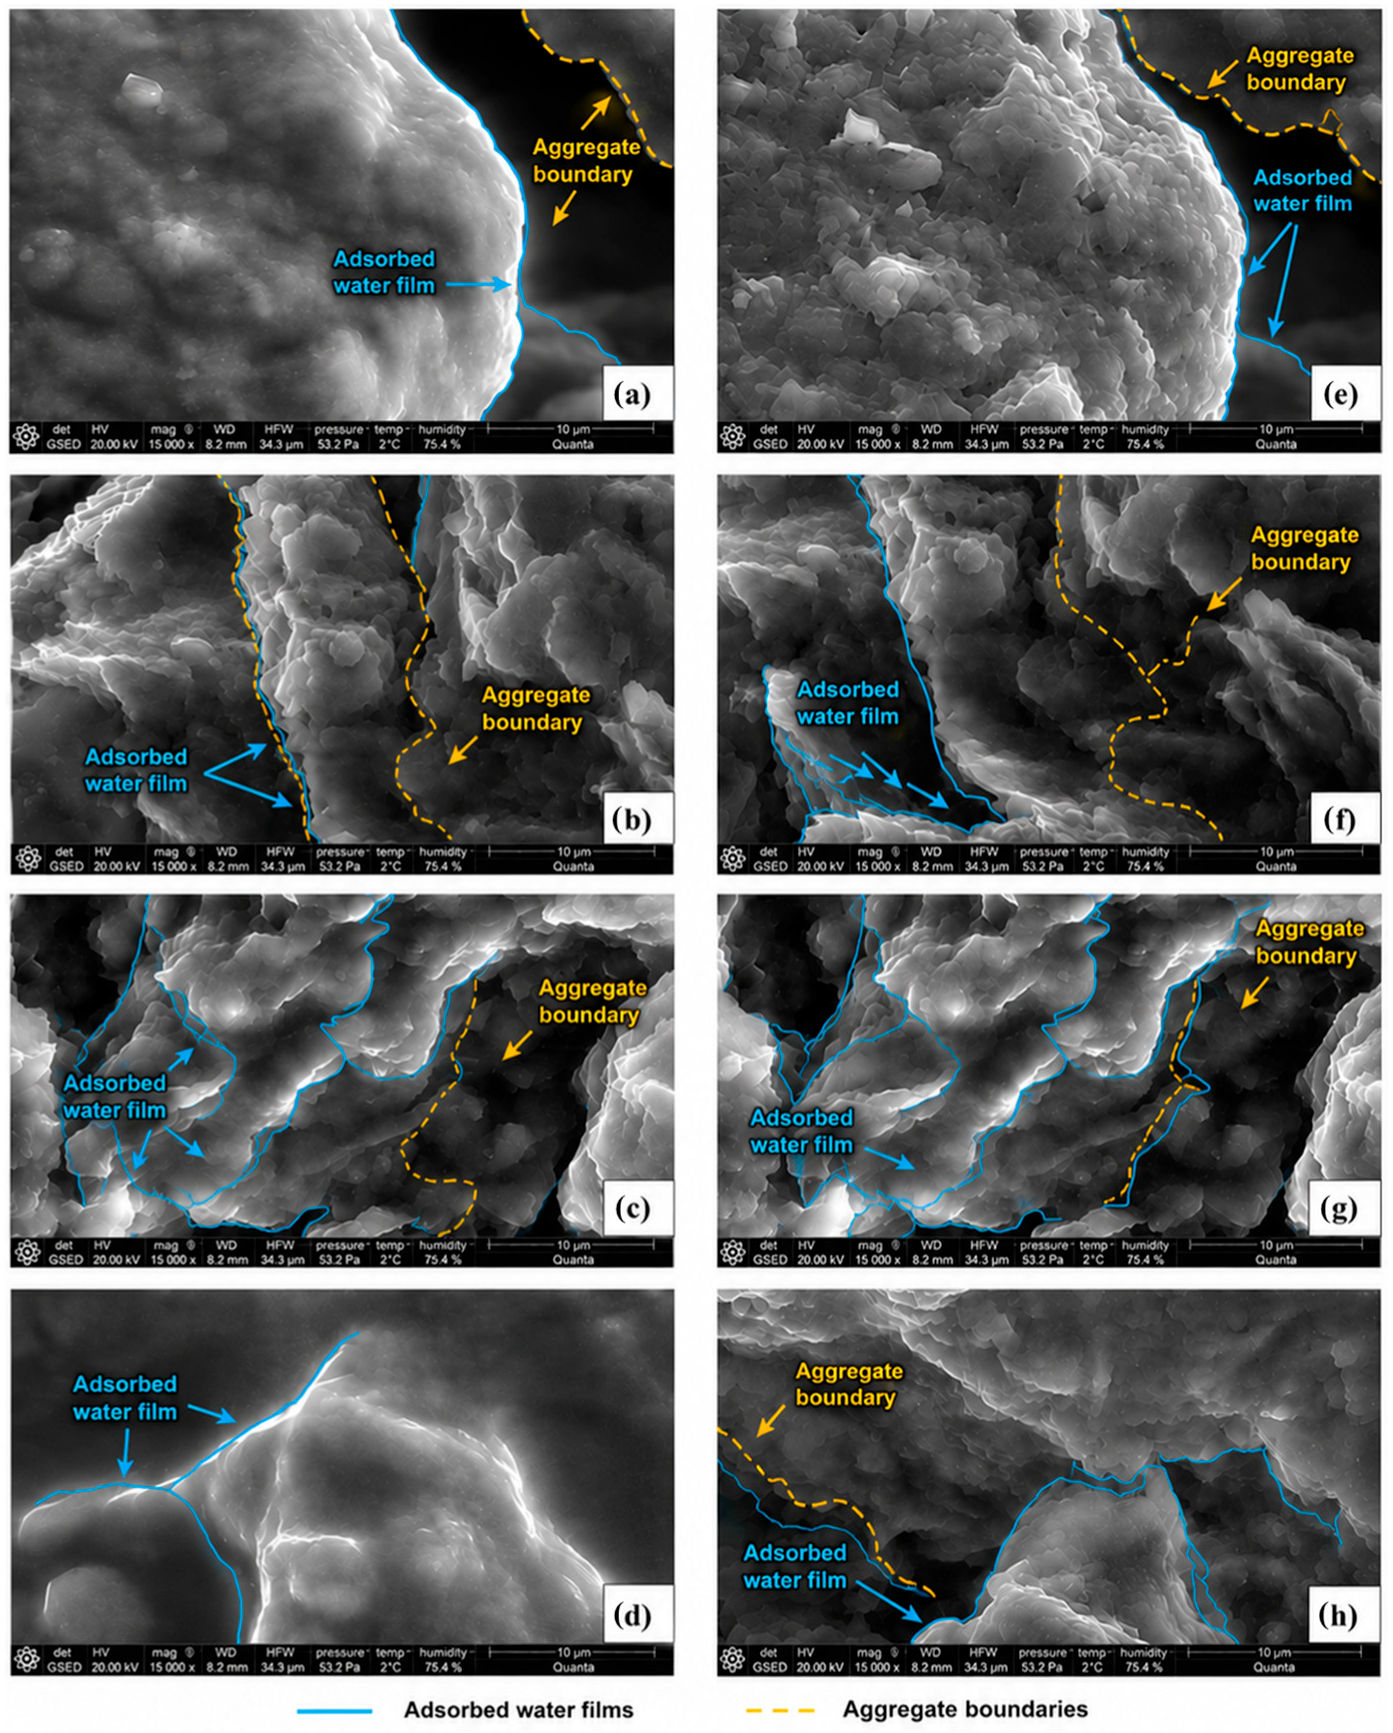
Figure 6, Figure 7 and Figure 8 show micrographs at 35 MPa suction for Minco, Carnisaw, Heiden opt, and Heiden w1 soils. At 350X, 800X, and 3500X magnifications, differences between primary drying and secondary wetting cycles were evident. Notably:
  • Heiden w1 showed significant changes in water film thickness and desiccation cracking.
  • Minco showed film formation at low suction but limited structural change at higher suctions.
  • Carnisaw and Heiden opt showed relatively stable fabric with no visible cracking.
Figures were captured under consistent conditions, though image contrast varied slightly at different RH levels.

3.2. Effect of Compaction State

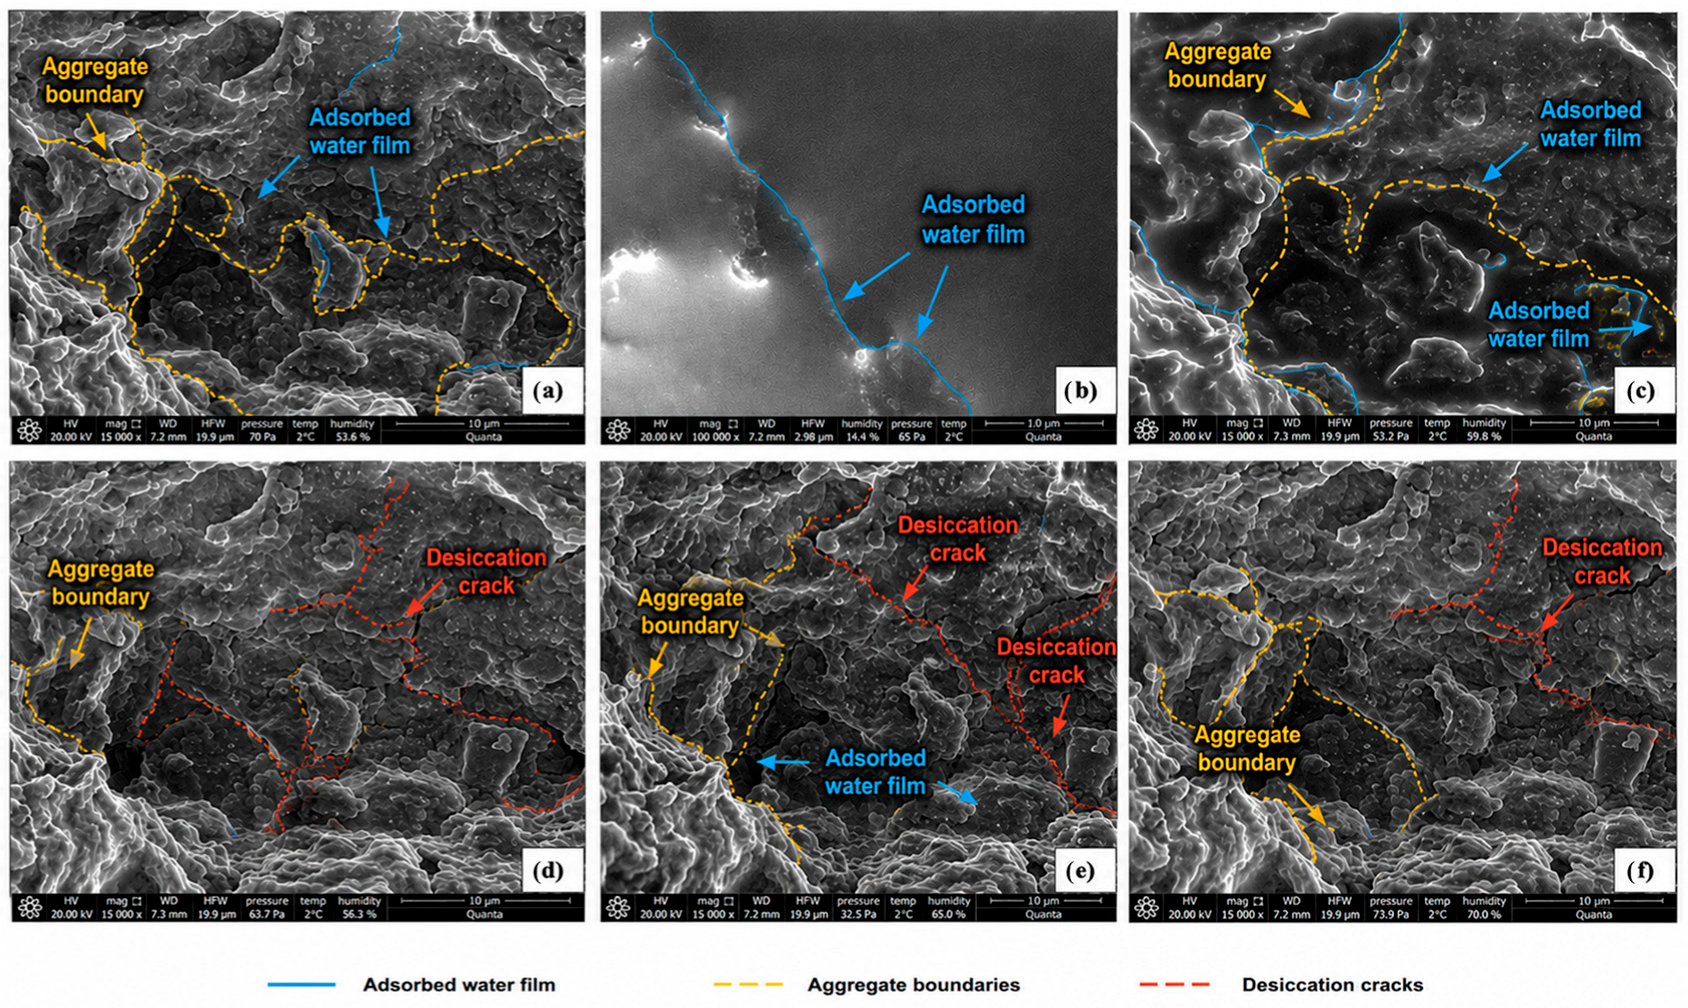
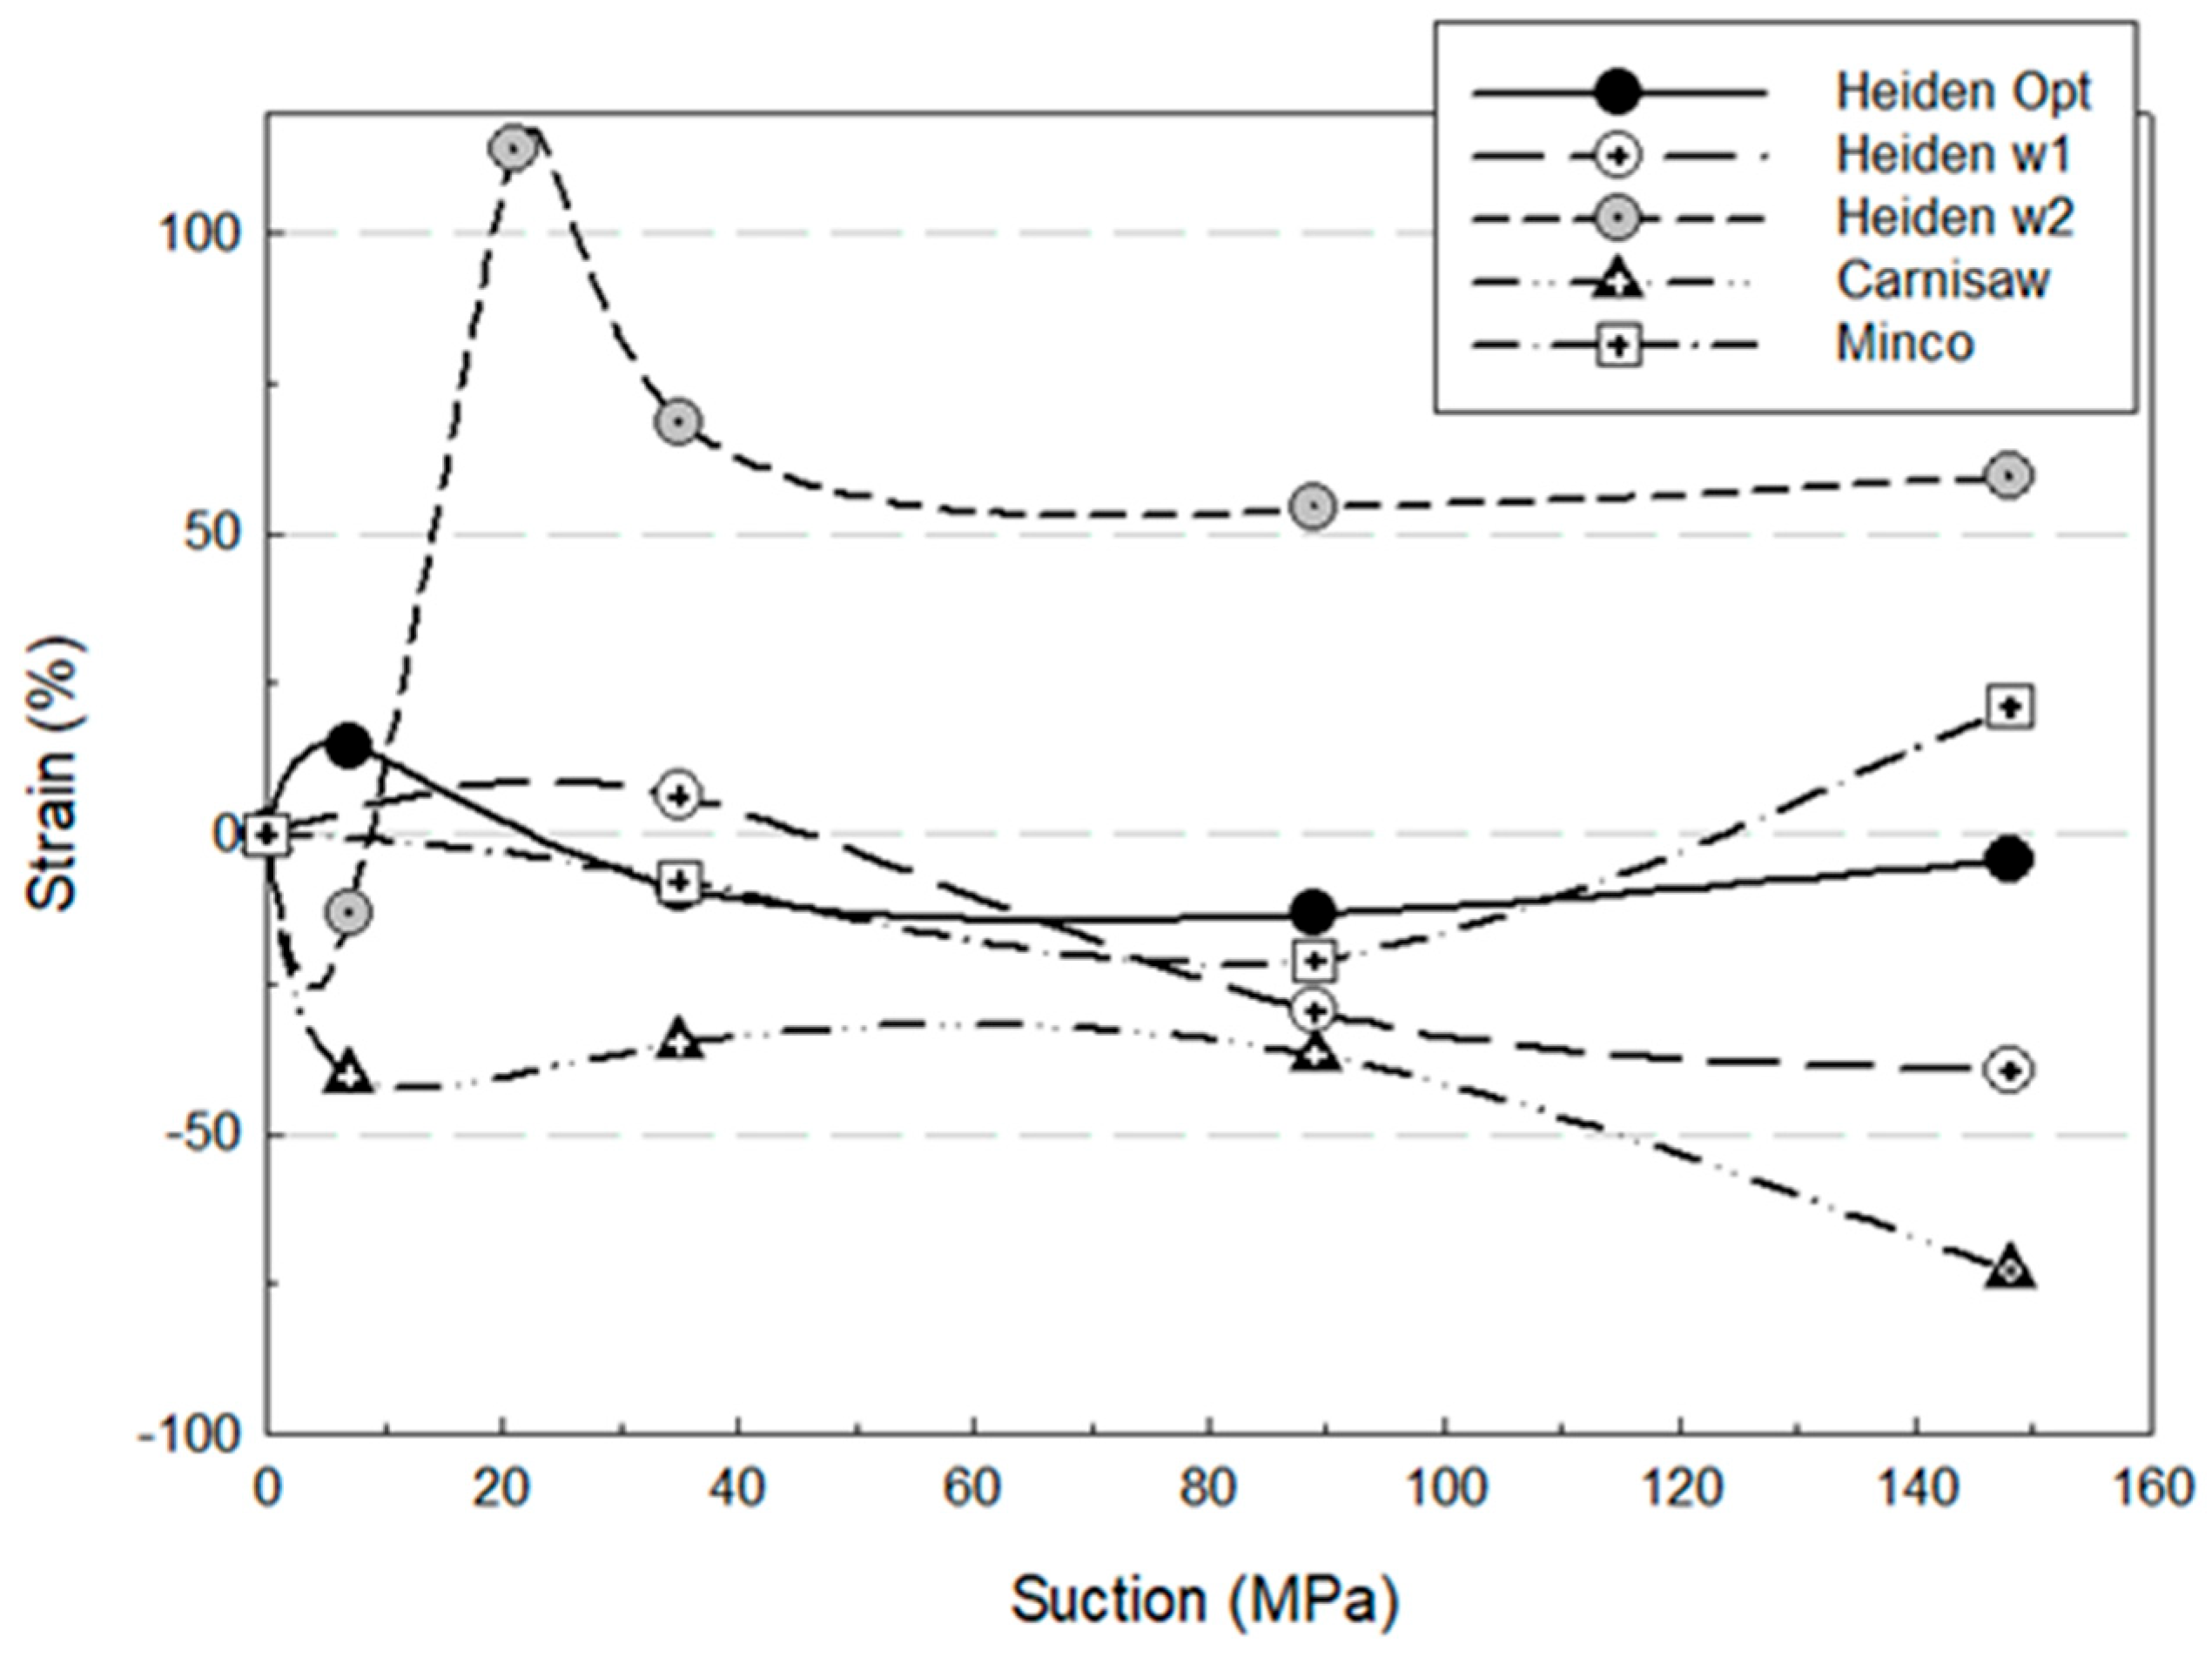
Figure 9 illustrates the evolution of Heiden w1 under drying and rewetting. At high RH, a thick adsorbed water layer is visible. As suction increases, this layer recedes, and desiccation cracks form. No such features were observed in the Heiden opt specimen, indicating that initial water content and dry density influence cracking potential. These trends were reinforced by quantitative strain data shown in Figure 10, where Heiden w1 exhibited significantly greater strain than Heiden opt.
Wet-of-optimum specimens (e.g., Heiden w1; see Figure 6, Figure 7, Figure 8 and Figure 9) showed pronounced structural changes due to greater initial image-derived pore areas and free water availability. These soils exhibited desiccation cracking and stronger hysteresis. Densely compacted soils (e.g., Heiden opt; see Figure 6, Figure 7 and Figure 8) remained stable and resisted visible cracking, aligning with known collapse potential behavior.

3.3. Effect of Equilibration Time

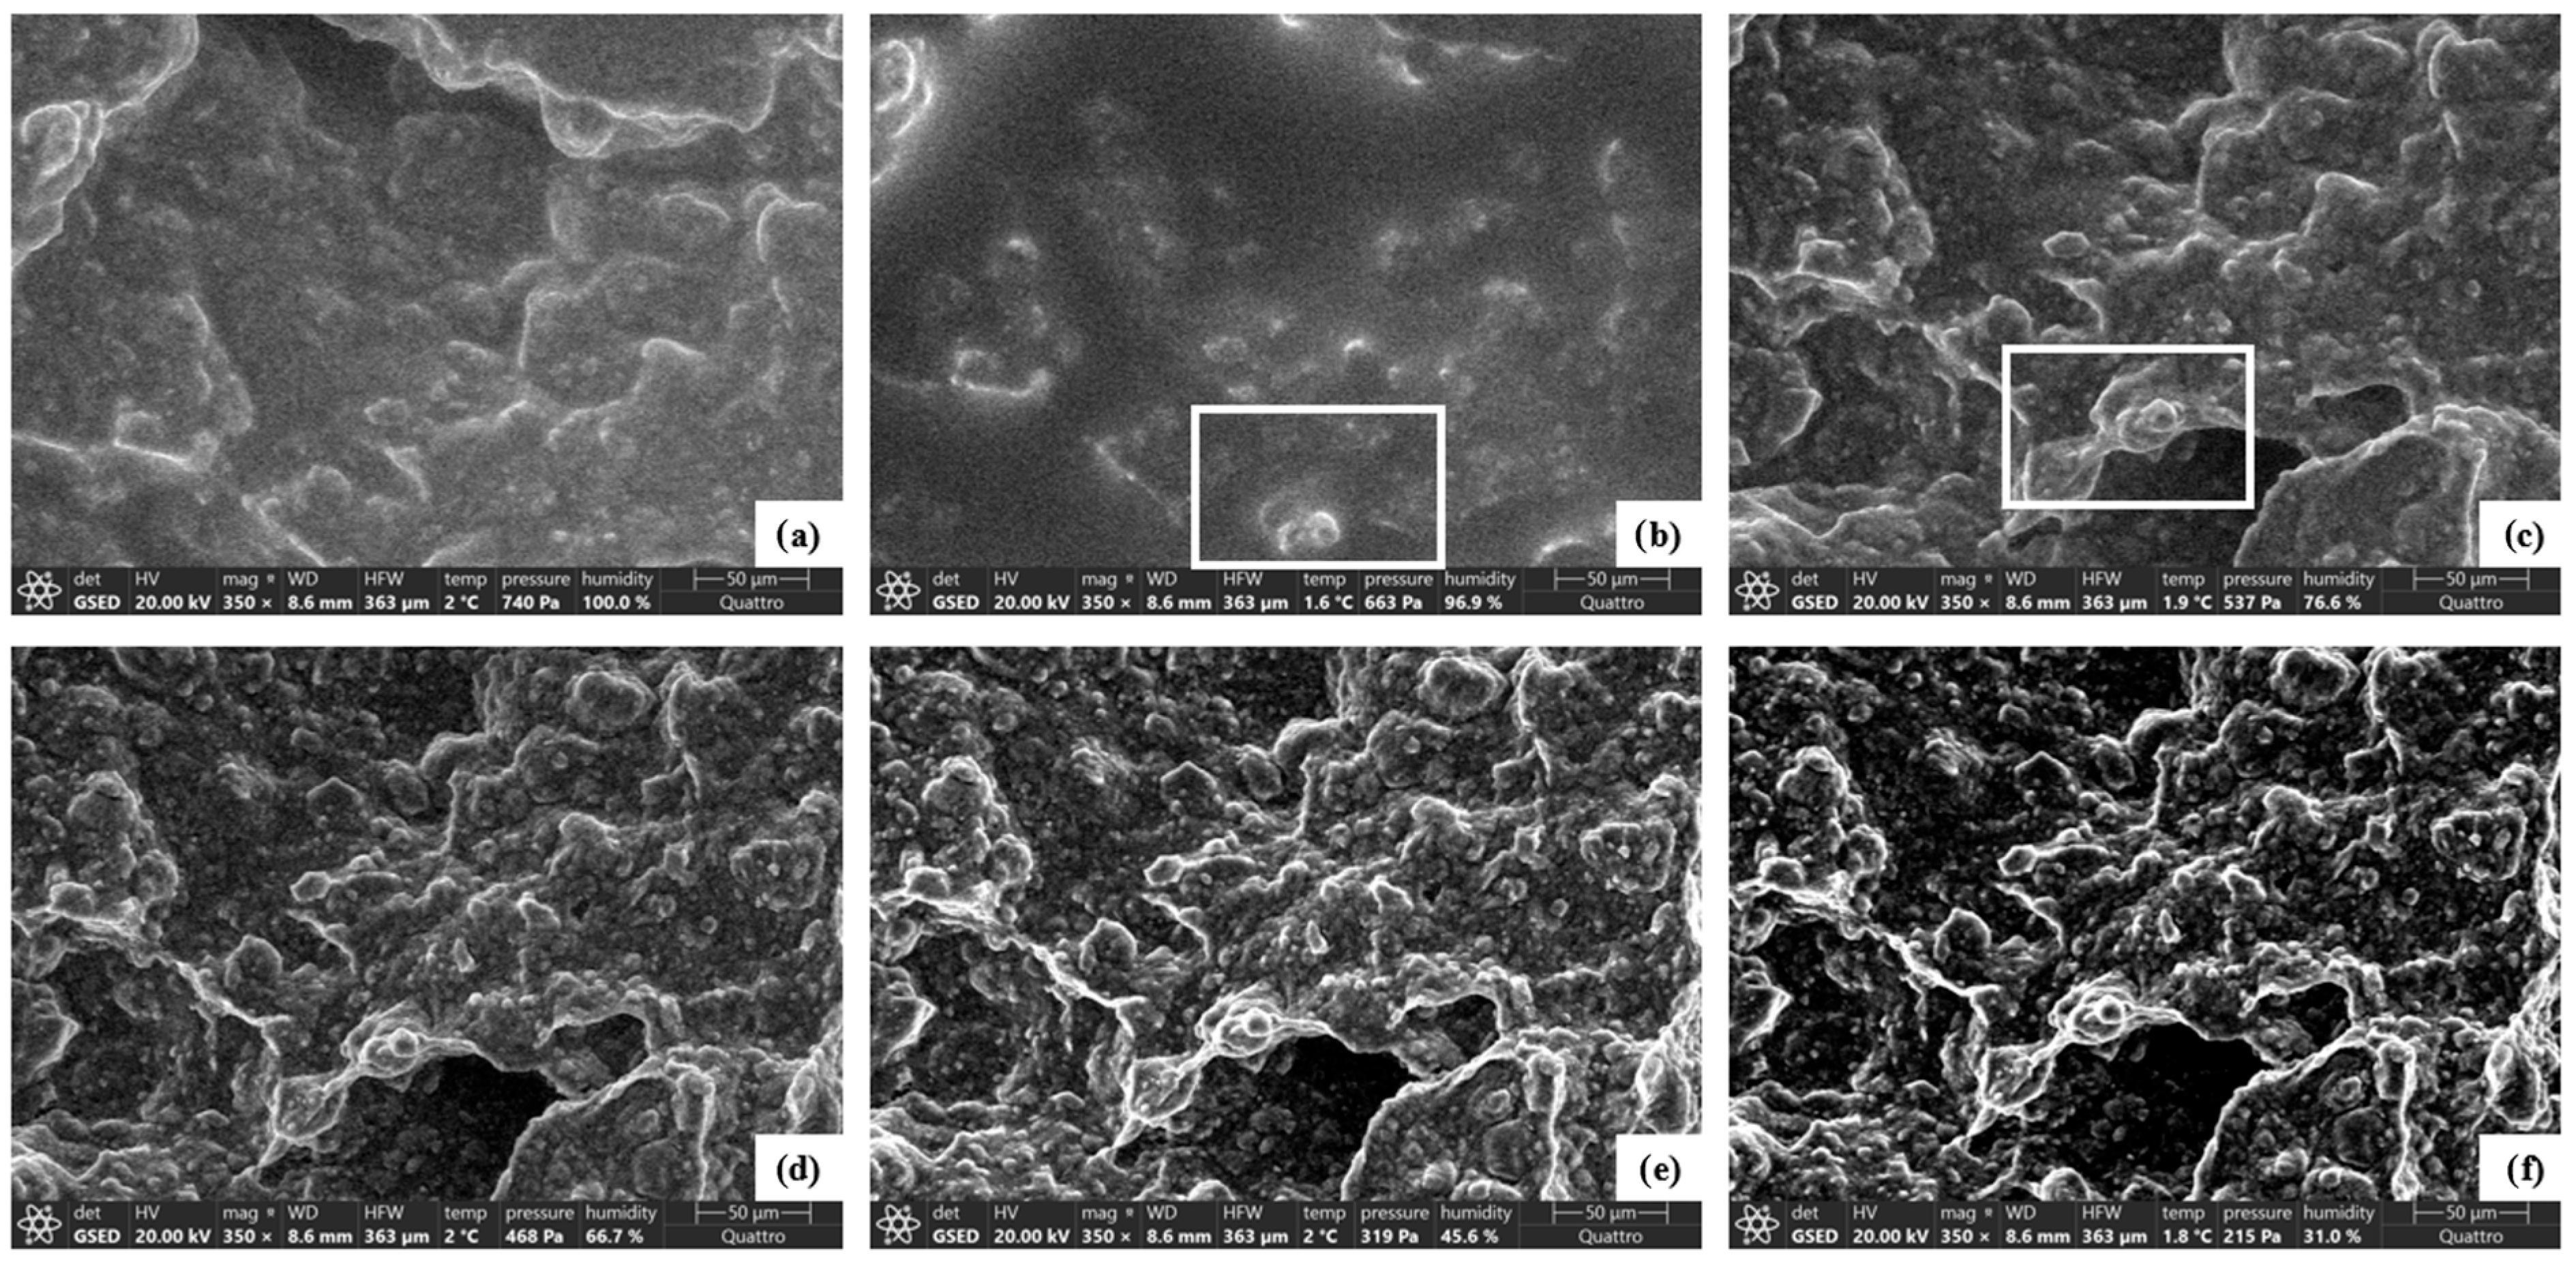
Heiden w2, imaged without equilibration, showed thinner water films and no cracking (Figure 11). Structural features remained visible throughout, contrasting with the Heiden w1 behavior.
The contrast between Heiden w1 and w2 (Figure 9 and Figure 11) suggested that equilibration allows time for bound water to stabilize and exert forces contributing to fabric deformation. Without equilibration, structural evolution is more gradual and less disruptive.
When equilibration time is allowed, unbound water in the sample dissipates to the chamber atmosphere and stabilizes at an equilibrium point [24]. When this time is not allowed, the unbound water continues extending/receding and never stabilizes. While the fluid front did progress in the case of the Heiden w2, water molecules bonded with the soil surface but continued to flow, resulting in a thinner bound water layer. Desiccation cracking was not observed in Heiden w2 likely because the forces associated with bonded fluid evaporating were not given time to develop. Because the initial water contents of Heiden w1 and Heiden w2 also differed slightly, these observations should be interpreted as indicative rather than strictly causal. Lin (2012) [35] provides a clear experimental rationale for the chosen equilibration periods in humidity-controlled testing and explains how incomplete equilibration influences hysteresis in expansive soils. Lin observed that during suction cycling, water redistribution between macropores and micropores requires sufficient time for vapor–liquid equilibrium to be established. When equilibration is achieved, unbound pore water dissipates to the surrounding atmosphere until the adsorbed and capillary films stabilize, allowing interparticle forces to reach mechanical balance. If this stage is shortened or skipped, residual gradients in vapor pressure persist, preventing full pore-scale equilibration and causing the adsorbed films to continue evolving during imaging. This dynamic, non-equilibrium condition results in suppressed or incomplete hysteresis—manifested as smaller differences between drying and wetting curves—because the inter-aggregate structure has not fully adjusted to the imposed suction state. Lin therefore justified equilibration times of approximately 15–30 min as sufficient for near-equilibrium moisture conditions in fine-grained soils, noting that inadequate equilibration may underestimate microstructural rearrangement and hysteretic behavior. The observations suggest that equilibration allows redistribution of adsorbed water and interparticle stress relaxation. Without it, the rapid suction change produces elastic contraction but prevents tensile cracking.

3.4. Influence of Silt Content

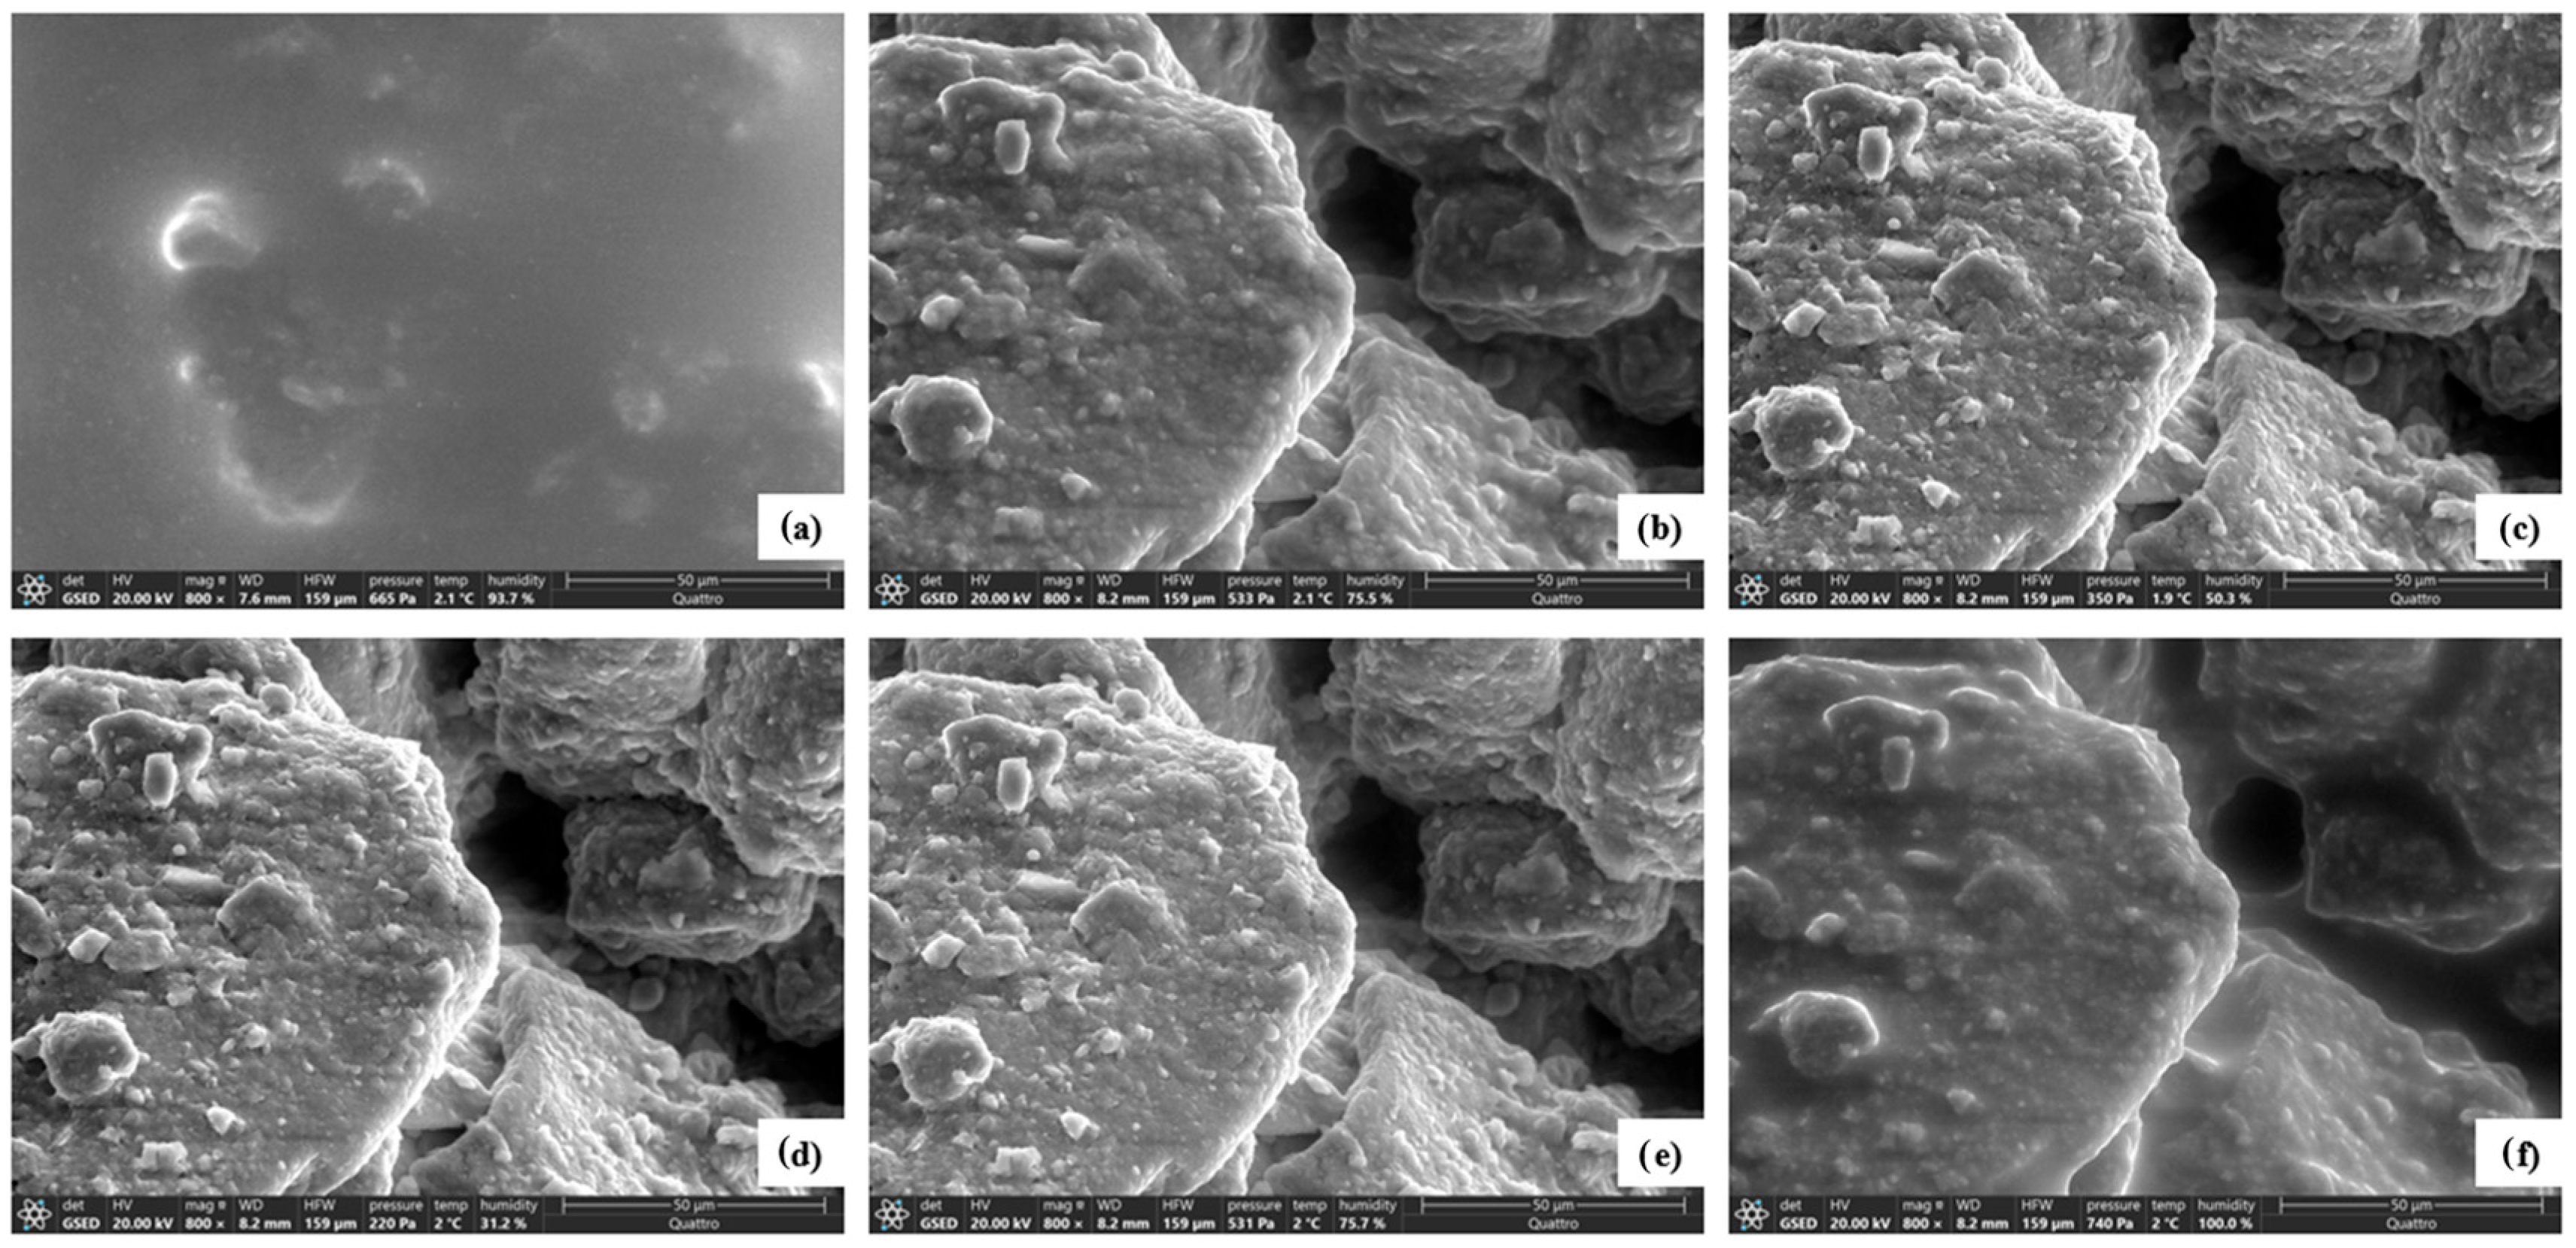
The Minco specimen (Figure 12), with high silt content, developed a water film at low suction but no persistent adsorption or structural change. This indicates a mechanically driven moisture response rather than one dominated by physicochemical forces.
The pore fluid observed in the Minco micrographs is likely due to dilation because of the high silt content in response to the induced force arising from the increase in suction. As the specimen was saturated to 100% RH, pore water rushed to the surface, lending a sheen of water the microscope was unable to penetrate. Instead of adsorbing to the soil surface, the water formed an unbonded layer above the soil.
Minco’s structural behavior—absence of cracking and lack of a stable water film (Figure 6, Figure 7, Figure 8 and Figure 11)—suggested a response governed by particle rearrangement rather than electrochemical interactions. This aligns with its low clay content and low activity values.

3.5. Image-Derived Pore-Area Trends Across Magnifications and Volumetric Strain-Changes

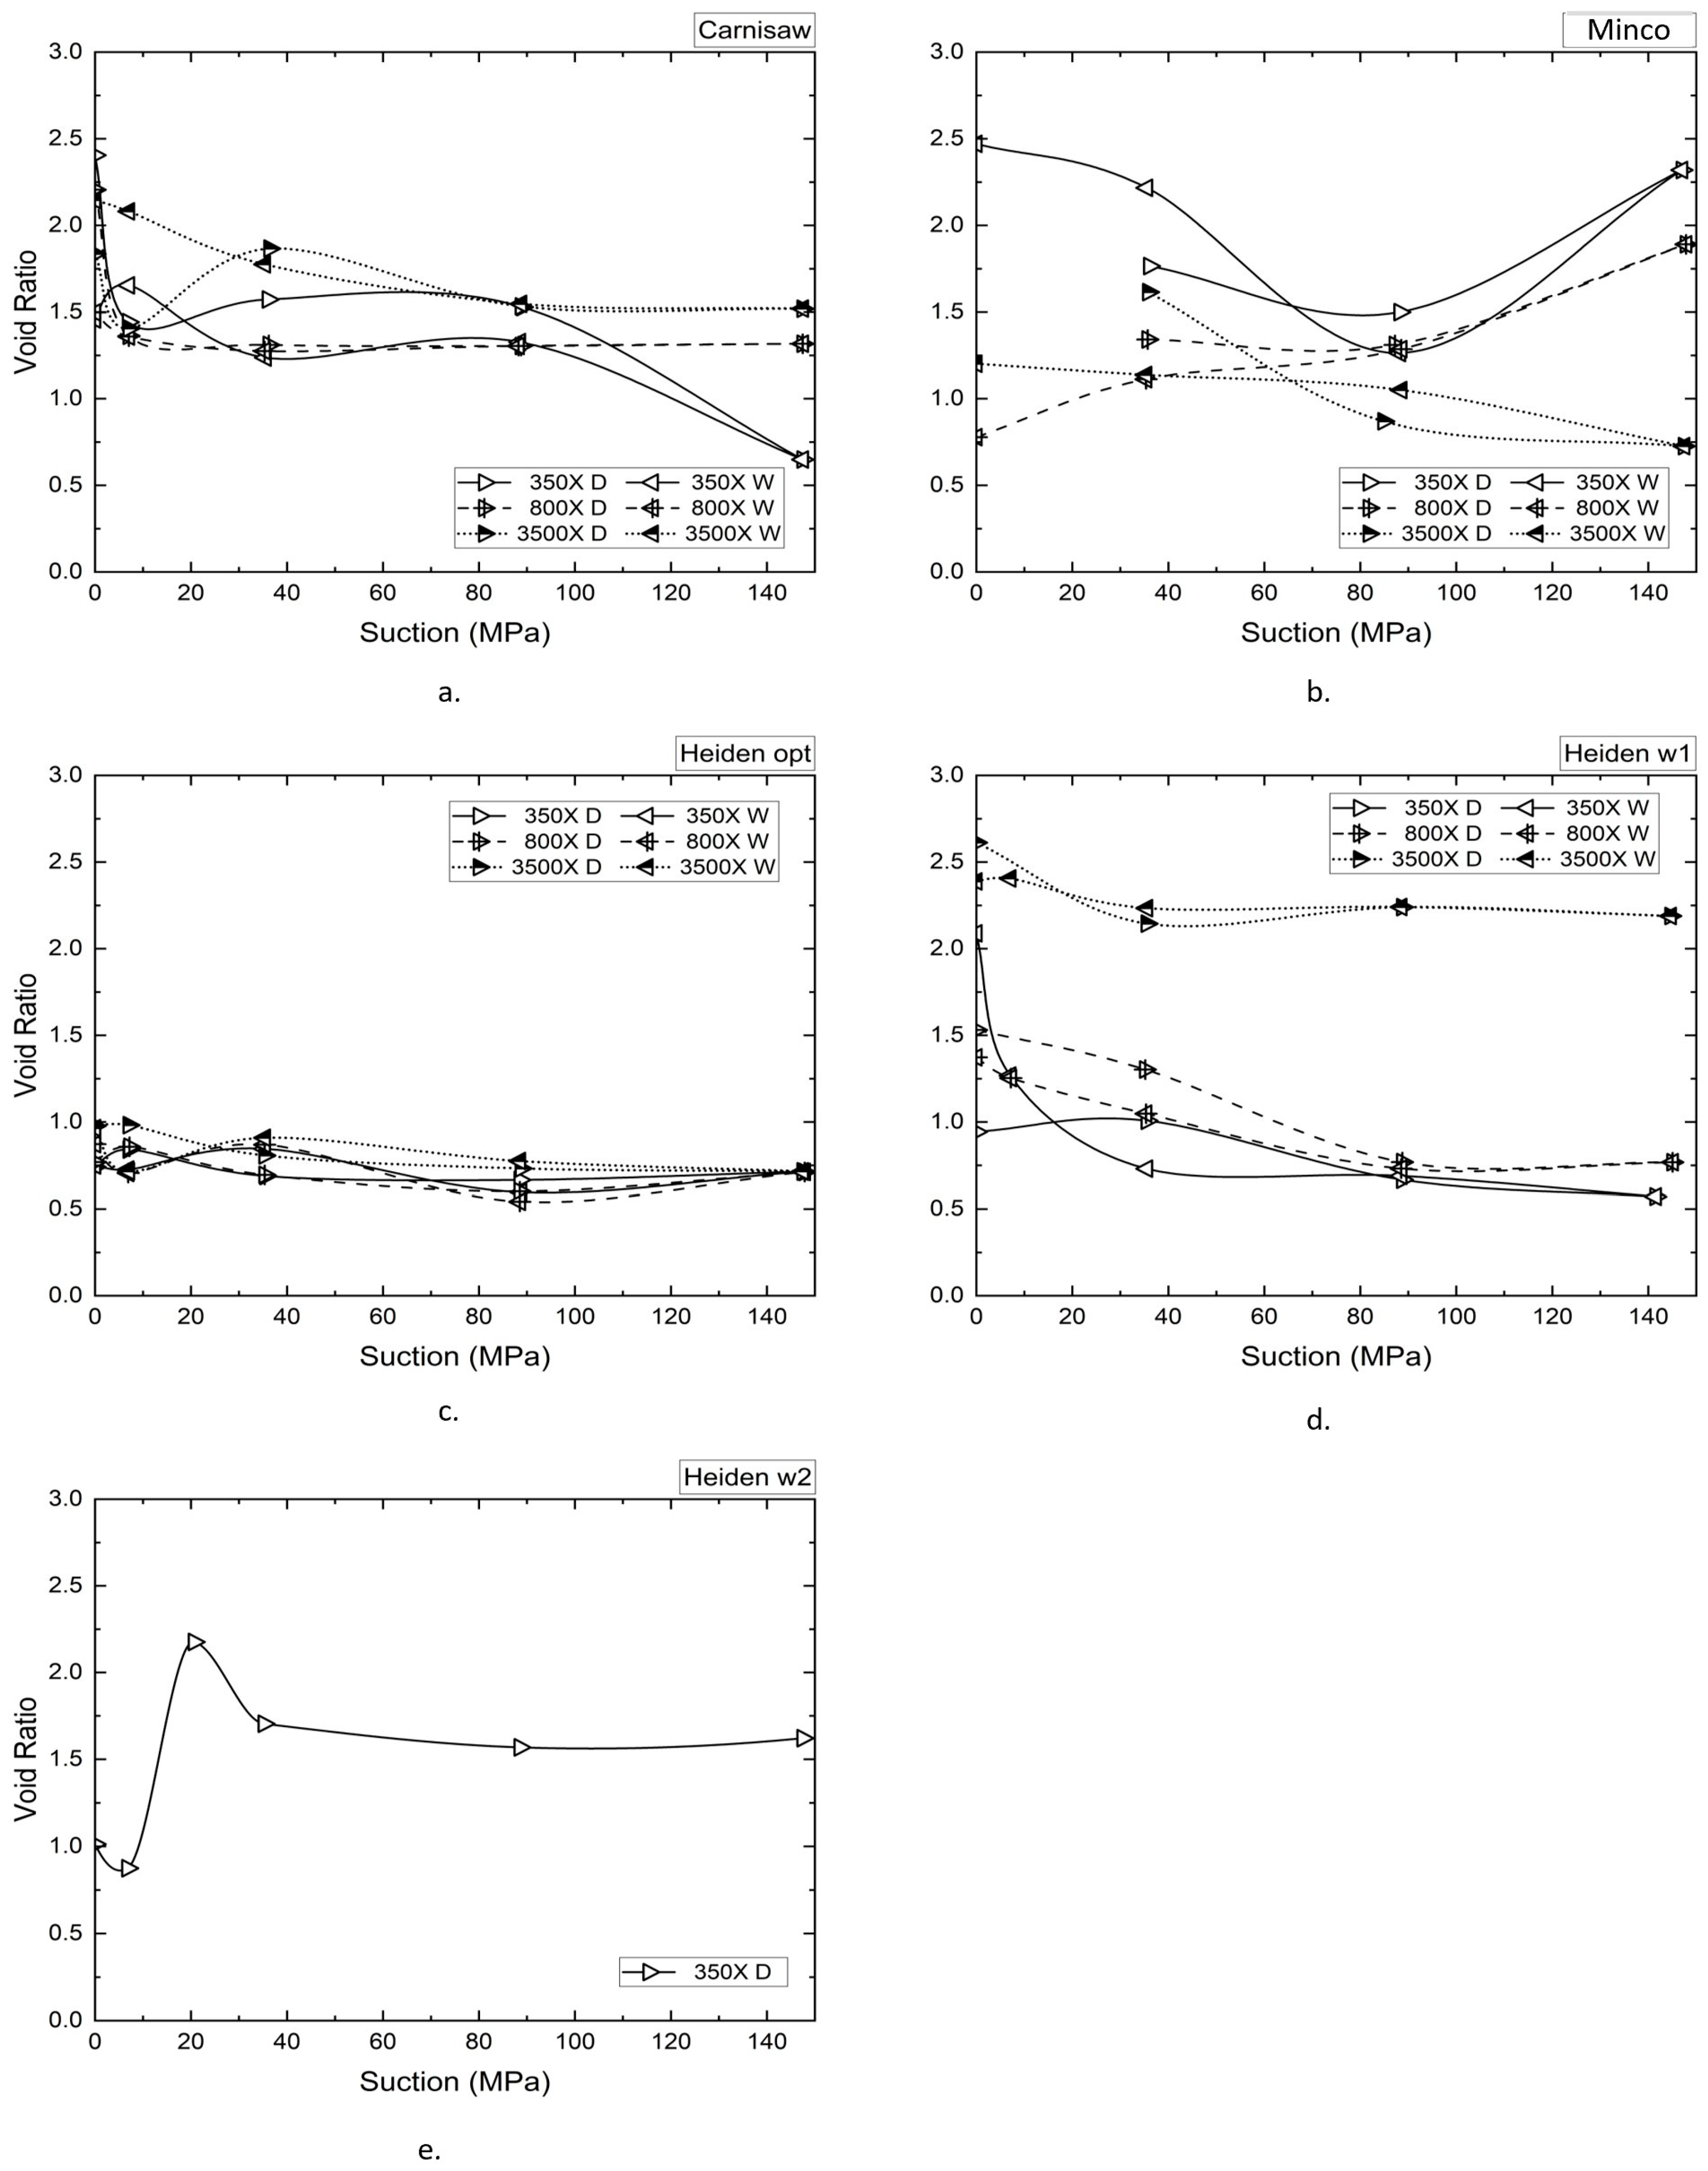
Figure 13 compares image-derived pore-area ratio changes along primary drying (D) and secondary wetting (W) suction paths for magnifications of 350X, 800X, and 3500X. Image-derived pore-area ratios were computed from binary images and used to estimate volumetric strains shown in Figure 10. Heiden w1 showed the greatest hysteresis in void ratio, followed by Carnisaw. Heiden opt displayed nearly no hysteresis. Heiden w2 showed higher strain magnitudes than Heiden w1 and Carnisaw. Heiden opt and Minco showed moderate changes across suction steps. Heiden w1, compacted wet of optimum, experienced significantly higher apparent volumetric strain during drying compared with Heiden opt. This suggested that higher initial water content and lower dry density amplify structural collapse under increasing suction, consistent with known macroscopic swelling-shrinkage behavior.
Quantitative analysis (Figure 12 and Figure 13) confirms qualitative findings: greater hysteresis and volumetric strain occurred in active clays (Heiden and Carnisaw) under primary drying. Lower-strain soils (e.g., Minco) exhibited more reversible structural behavior under hysteresis. These findings suggest that microstructural changes are associated with intrinsic soil properties and may contribute to the development of a more predictive framework for expansive soil behavior in unsaturated conditions.
The observed image-derived pore-area hysteresis trends (Figure 13) are consistent with recent fractal analyses showing that increasing suction or consolidation elevates the pore fractal dimension, reflecting denser, more tortuous microstructures [26,27,30]. For instance, Basham et al. (2024) [56] and Su et al. (2022) [28] showed that fractal dimensions increase under suction or consolidation, corresponding to denser or more tortuous pore networks. Previous fractal analyses performed on representative ESEM images from these soils by Basham (2023) [57] reported fractal dimensions ranging from approximately 1.67 for Minco to 1.92 for Heiden w1, supporting greater pore complexity in the more active clays. These prior findings are consistent with the pore rearrangement and hysteretic behavior qualitatively observed in the present study. The observed cracking and pore rearrangement in Heiden soils (Figure 6, Figure 7, Figure 8, Figure 9 and Figure 13) likely reflect similar self-similar pore behavior. These results suggest that fractal analysis could serve as a complementary tool for quantifying suction-driven microstructural change.

3.6. Physicochemical Properties and Activity

Activity indices support the interpretation that SA and CEC provide additional physicochemical context of soil response under suction. Heiden, with the highest SA and CEC, showed the strongest hysteresis and cracking (Figure 6, Figure 7, Figure 8, Figure 9 and Figure 13). Minco, with minimal SA and CEC, showed an inert structural response (Figure 6, Figure 7, Figure 8 and Figure 11). Carnisaw fell in between. In addition to intrinsic mineralogical and physicochemical properties, external surface modifiers such as organic amendments and zeolitic additives can also influence microstructural evolution by altering the surface charge environment, cation exchange dynamics, and carbon fractionation behavior. Mirzaei Aminiyan et al. [58,59,60] demonstrated that nanozeolite and plant-residue amendments enhance soil aggregation stability and redistribute organic carbon among particulate, mineral-associated, and soluble fractions. These modifications affect the double-layer structure and interparticle bonding forces that control pore connectivity and microfabric rearrangement during wetting–drying cycles. Such findings underscore that microstructural evolution under suction hysteresis may be further modulated by carbon–mineral interactions, suggesting a potential avenue for extending the present ESEM-based framework to evaluate the coupled effects of organic–mineral processes on expansive soil behavior.

4. Conclusions

This study investigated the microscale structural evolution of naturally occurring expansive soils subjected to drying and wetting cycles, using Environmental Scanning Electron Microscopy (ESEM) across a broad suction range (0–148 MPa). By integrating image-based pore area analysis with physicochemical properties and varying specimen preparation conditions, the research provided new insights into how expansive soils behave under hysteretic moisture regimes.
Key conclusions are as follows:
  • ESEM is a valuable tool for capturing microstructural hysteresis
The ESEM technique allowed visualization of key fabric changes—such as desiccation cracking, adsorbed water layer thickness, and particle realignment—through both primary drying and secondary wetting. These observations provide qualitative support for known macroscale hysteretic responses in expansive soils.
2.
Initial compaction conditions strongly influence fabric response
Soils compacted wet of optimum exhibited significant structural changes under increasing suction, including desiccation cracking and persistent water films. In contrast, specimens compacted at optimum showed more stable microstructures and less evidence of hysteretic behavior, suggesting lower collapse potential and more predictable shrink-swell responses.
3.
Equilibration time impacts observed microstructural behavior
Differences between equilibrated and non-equilibrated Heiden specimens suggest that equilibration protocol may influence observed water-film behavior and fabric rearrangement; however, the comparison is partially confounded by differences in initial water content and should be interpreted cautiously.
4.
Physicochemical properties (SA and CEC) provided useful physicochemical context
SA- and CEC-based activity indices provided useful physicochemical context for interpreting observed fabric evolution under suction hysteresis, although the relationships identified herein remain qualitative.
5.
Silt content influences moisture response via mechanical effects
The Minco soil, characterized by high silt content and low clay activity, displayed minimal adsorbed water interaction and no cracking. Its moisture response appears governed by dilation and physical rearrangement rather than physicochemical mechanisms.
Observed microstructural cracking and pore-area hysteresis may help explain mechanisms contributing to unpredictable heave and settlement of foundations built on overactive clays. The observed image-derived pore-area trends may provide qualitative insight into suction-related fabric evolution relevant to expansive soil design of slabs-on-grade, embankments, and slope stabilization, particularly in estimating suction cycles leading to irreversible volume change.
Although soils were sourced from Oklahoma, the physicochemical–microstructural relationships identified may have broader relevance to other expansive clay systems subjected to suction cycling. The proposed framework can be extended to tropical vertisols, Mediterranean bentonites, and other high-activity soils subjected to climatic suction cycling.
Limitations and Future Work: The image-derived void ratio values reported herein represent apparent two-dimensional pore-area ratios measured from selected ESEM fields of view and are not direct measurements of three-dimensional void ratio or bulk volumetric strain. Accordingly, the calculated strain values should be interpreted as comparative indicators of microstructural change along drying and wetting paths rather than absolute volumetric deformation measurements. In addition, the SWCCs used in this study were adopted from prior testing on similarly prepared soils and were used primarily to guide suction-stage selection, rather than to establish specimen-specific water retention behavior for the imaged samples.
This study focused primarily on microstructural imaging and qualitative-to-semiquantitative interpretation and did not incorporate concurrent macroscopic measurements such as swell pressure, hydraulic conductivity, or direct moisture-retention testing on the same specimens during suction cycling. Future work should integrate ESEM observations with coupled hydraulic and mechanical testing under identical suction regimes to establish stronger microscale-to-macroscale relationships and develop a more predictive framework for expansive soil behavior.
In addition, future studies could incorporate fractal analysis of ESEM images to quantitatively characterize pore complexity, aggregation, and scale-dependent fabric evolution during wetting–drying cycles [26,27,55]. Such approaches would complement the current binary image analysis by providing quantitative descriptors of self-similar pore behavior and hysteretic structural evolution. Future work may also investigate the role of organic–mineral interactions, including the influence of plant-residue or zeolitic amendments on aggregation stability, carbon fractionation, double-layer dynamics, and microscale fabric evolution under suction cycling [58,59,60]. These extensions would broaden the current physicochemical framework to include biogeochemical factors that may further influence expansive soil behavior at the microscale.

Author Contributions

All authors contributed to the study conception and design. Material preparation, data collection, and analysis were performed by M.R.B. The first draft of the manuscript was written by M.R.B., and all authors commented on previous versions of the manuscript. All authors have read and agreed to the published version of the manuscript.

Funding

This research received no external funding.

Institutional Review Board Statement

Not applicable.

Informed Consent Statement

Not applicable.

Data Availability Statement

The raw data supporting the conclusions of this article will be made available by the authors on request.

Acknowledgments

The authors would like to thank the Samuel Roberts Noble Microscopy Laboratory at the University of Oklahoma for use of the ESEM.

Conflicts of Interest

Author Michelle R. Basham was employed by the company Geosyntec Consultants. The remaining authors declare that the research was conducted in the absence of any commercial or financial relationships that could be construed as a potential conflict of interest.

References

  1. Borchardt, G. Smectites. In Minerals in Soil Environments; Dixon, J.B., Weed, S.B., Eds.; SSSA: Madison, WI, USA, 1989. [Google Scholar]
  2. Cui, Y.; Yahia-Aissa, M.; Delage, P. A model for the volume change behavior of heavily compacted swelling clays. Eng. Geol. 2002, 64, 233–250. [Google Scholar] [CrossRef]
  3. Miller, C.; Yesiller, N.; Yaldo, K.; Merayyan, S. Impact of Soil Type and Compaction Conditions on Soil Water Characteristic. J. Geotech. Geoenviron. Eng. 2002, 128, 733–742. [Google Scholar] [CrossRef]
  4. Montes, H.G. Swelling-shrinkage measurements of bentonite using coupled environmetnal scanning electron microscopy and digital image analysis. J. Colloid Interface Sci. 2005, 284, 271–277. [Google Scholar] [CrossRef]
  5. Al-Mahbashi, A.; Elkady, T.; Al-Shamrani, M. The Role of Stress States on the Hysteretic Behavior of Expansive Soil under Multiple Drying-Wetting Cycles. Buildings 2023, 13, 1619. [Google Scholar] [CrossRef]
  6. Wray, W.; Meyer, K. Expansive Clay Soil: A Widespread and Costly GeoHazard. Geo-Strat.—Geo Inst. ASCE 2004, 5, 24–28. [Google Scholar]
  7. Zamin, B.; Nasir, H.; Mehmood, K.; Iqbal, Q.; Farooq, A.; Tufail, M. An Experimental Study on the Geotechnical, Mineralogical, and Swelling Behavior of KPK Expansive Soils. Adv. Civ. Eng. 2021, 2021, 8493091. [Google Scholar] [CrossRef]
  8. Jones, L.; Jefferson, I. Expansive Soils. ICE Man. Geotech. Eng. 2012, 1, 413–441. [Google Scholar]
  9. Amakye, S.; Abbey, S.; Booth, C.; Mahamadu, A. Enhancing the Engineering Properties of Subgrade Materials Using Processed Waste: A Review. Geotechnics 2021, 1, 307–329. [Google Scholar] [CrossRef]
  10. Devkota, B.; Karim, M.; Rahman, M.; Nguyen, H. Accounting for Expansive Soil Movement in Geotechnical Design—A State-of-the-Art Review. Sustainability 2022, 14, 15662. [Google Scholar] [CrossRef]
  11. Likos, W.; Lu, N. Hysteresis of Capillary Stress in Unsaturated Granual Soil. J. Eng. Mech. 2004, 130, 646–655. [Google Scholar]
  12. Mitchell, J.; Soga, K. Fundamentals of Soil Behavior, 3rd ed.; John Wiley Sons: Hoboken, NJ, USA, 2005. [Google Scholar]
  13. Anandarajah, A.; Amarasinghe, P. Influence of fabric variables on clay-water-air capillary meniscus. Can. Geotech. J. 2011, 48, 987–995. [Google Scholar]
  14. Hillel, D. Fundamentals of Soil Physics; Academic Press: New York, NY, USA, 1980. [Google Scholar]
  15. Fredlund, D.R. Soil Mechanics for Unsaturated Soils; Wiley: New York, NY, USA, 1993. [Google Scholar]
  16. Lu, N.; Likos, W. Unsaturated Soil Mechanics; Wiley: Hoboken, NJ, USA, 2004. [Google Scholar]
  17. Miller, G.; Khoury, C.; Kanthasamy, K.; Liu, C.; Kibbey, T. Effects of soil skeleton deformations on hysteretic soil water characteristic curves: Experiments and simulations. Water Resour. Res. 2008, 44, 1–10. [Google Scholar] [CrossRef]
  18. Fu, Y.; Liao, H.; Chai, X.; Lv, L. A Hysteretic Model Considering Contact Angle Hysteresis for Fitting Soil-Water Characteristic Curves. Water Resour. Res. 2021, 57, 1–46. [Google Scholar] [CrossRef]
  19. Yang, Y.; Yeh, H. Effects of hysteretic soil water characteristic curves on the hydromechanical behaviour. J. Earth Syst. Sci. 2023, 132, 136. [Google Scholar] [CrossRef]
  20. Ng, C.W.W.; Zhang, Q.; Zhang, S.; Lau, S.Y.; Guo, H.; Li, Z. A new state-dependent constitutive model for cyclic thermo mechanical behavior of unsaturated vegetated soil. Can. Geotech. J. 2024, 61, 2155–2179. [Google Scholar] [CrossRef]
  21. Ng, C.W.W.; Zhou, Q.; Zhang, Q. A novel surrogate model for hydro-mechanical coupling in unsaturated soil with incomplete physical constraints. Comput. Geotech. 2025, 180, 107091. [Google Scholar] [CrossRef]
  22. Koliji, A.; Vulliet, L.; Laloui, L. Structural Characterization of Unsaturated Aggregated Soil. Can. Geotech. J. 2010, 47, 297–311. [Google Scholar] [CrossRef]
  23. Sun, H.; Masin, D.; Najser, J.; Nedela, V.; Navratilova, E. Bentonite microstructure and saturation evolution in wetting-drying cycles evaluated using ESEM, MIP and WRC measurements. Geotechnique 2019, 69, 713–726. [Google Scholar] [CrossRef]
  24. Lin, B.; Cerato, A. Applications of SEM and ESEM in microstuctural investigation of shale-weathered expansive soils along swelling-shrinkage cycles. Eng. Geol. 2014, 177, 66–74. [Google Scholar] [CrossRef]
  25. Romero, E.; Simms, S. Microstructural Investigation in Unsaturated Soils: A Review with Special Attention to Contribution of Mercury Intrusion Porosimetry and Environmental Scanning Electron Microscopy. Geotech. Geol. Eng. 2008, 26, 705–727. [Google Scholar] [CrossRef]
  26. Lloret, A.; Villar, M.; Sanchez, M.; Gens, A.; Pintado, X.; Alonso, E. Mechanical behavior of heavily compacted bentonite under high suction changes. Geotechnique 2003, 53, 27–40. [Google Scholar] [CrossRef]
  27. Villar, M. Water retention of two natural compacted bentonites. Clays Clay Mater. 2007, 55, 311–322. [Google Scholar] [CrossRef]
  28. Su, Y.; Zhang, Q.; Zhao, X. Fractal theory-based analysis of microstructure evolution in MICP-treated expansive clay under consolidation. Constr. Build. Mater. 2022, 340, 127827. [Google Scholar] [CrossRef]
  29. Sun, D.; Liu, X.; Cui, Y.J. Fractal analysis of soil microstructure and its implications for the soil–water retention curve. Geotech. Lett. 2024, 14, 108–115. [Google Scholar] [CrossRef]
  30. Wang, Y.; Li, Y. Wetting-induced collapse of loess: Tracing Microstructural evolution. Eng. Geol. 2024, 340, 107673. [Google Scholar] [CrossRef]
  31. Montes, H.G.; Geraud, Y.; Duplay, J.; Reuschle, T. ESEM observations of compacted bentonite submitted to hydration/dehydration conditions. Colloids Surf. 2005, 262, 14–22. [Google Scholar] [CrossRef]
  32. Seiphoori, A.; Ferrari, A.; Laloui, L. Water retention behavior and microstructural evolution of MX-80 bentonite during wetting and drying cycles. Geotechnique 2014, 64, 721–734. [Google Scholar] [CrossRef]
  33. Daniels, K.; Harrington, J.; Milodowski, A.; Kemp, S.; Mounteney, I.; Sellin, P. Gel Formation at the Front of Expanding Calcium Bentonites. Minerals 2021, 11, 215. [Google Scholar] [CrossRef]
  34. Cerato, A.; Lutenegger, A. Activity, relative activity and specific surface area of fine-grained soils. In Proceedings of the 16th International Conference on Soil Mechanics and Foundation Engineering, Osaka, Japan, 12–16 September 2005. [Google Scholar]
  35. Lin, B. A Comprehensive Investigation on Microscale Properties and Macroscopic Behavior of Natural Expansive Soils. Ph.D. Thesis, University of Oklahoma, Norman, OK, USA, 2012. [Google Scholar]
  36. University of California, Davis, California Soil Resource Lab; University Of California, Division of Agriculture and Natural Resources; Natural Resources Conservation Service. 2019. SoilWeb. University of California; USDA-NCRS. Available online: https://agdatacommons.nal.usda.gov/articles/dataset/SoilWeb/24853287?file=43729095 (accessed on 2 December 2023).
  37. Hamid, T.B.; Miller, G.A. Shear strength of unsaturated soil interfaces. Can. Geotech. J. 2009, 46, 595–606. [Google Scholar] [CrossRef]
  38. Miller, G.; Cerato, A.B.; Snethen, D.; Holderby, E.; Boodagh, P. Validation and Refinement of Chemical Stabilization Procedures for Pavement Subgrade Soils in Oklahoma—Volume 1. Final Report; FHWA-OK-11-02 2007; United States Department of Transportation: Washington, DC, USA, 2011.
  39. ASTM D7928; Standard Test Method for Particle-Size Distribution (Gradation) of Fine-Grained Soils Using the Sedimentation (Hydrometer) Analysis. ASTM: West Conshohocken, PA, USA, 2023.
  40. ASTM D4318-17; Standard Test Methods for Liquid Limit, Plastic Limit, and Plasticity Index of Soils. ASTM: West Conshohocken, PA, USA, 2018.
  41. Khoury, N.; Khoury, C. New Laboratory Methods for Characterization of Compaction in Fine-Grained Soils; Internal Report; School of Civil Engineering and Environmental Science, The University of Oklahoma: Norman, OK, USA, 2005. [Google Scholar]
  42. ASTM D4536; Standard Test Method for High-Volume Sampling for Solid Particulate Matter and Determination of Particulate Emissions. ASTM: West Conshohocken, PA, USA, 1999.
  43. Skempton, A. The colloidal activity of clays. In Proceedings of the Third International Conference on Soil Mechanics and Foundation Engineering, Zurich, Switzerland, 16–27 August 1953; pp. 57–61. [Google Scholar]
  44. Buhler, R.; Cerato, A. Stabilization of Oklahoma Expansive Soils using Lime and Class C Fly Ash. In GSP 162: Problematic Soils and Rocks and In Situ Characterization, Proceedings of the GeoDenver: New Peaks in Geotechnics, Denver, CO, USA, 18–21 February 2007; ASCE: Washington, DC, USA, 2007. [Google Scholar]
  45. Quigley, R.; Sethis, A.; Boonsinsuk, P.; Sheeren, D.; Yong, R. Geologic controls on soil composition and properties, Lake Ojibway Clay Plain, Matagami, Quebec. Can. Geotech. J. 1985, 22, 491–500. [Google Scholar] [CrossRef]
  46. Locat, J.; Tanaka, H.; Tan, T.; Desari, G.; Lee, H. Natural soils: Geotechnical behavior and geologic knowledge. In Characterization and Engineering Properties of Natural Soils; Tan, T.S., Ed.; Swets and Zeitlinger: Amsterdam, The Netherlands, 2003; Volume 1, pp. 3–28. [Google Scholar]
  47. Hussey, N. A Comparison of Soil Stabilization Additives to Determine Parameters Affecting Soil Strenght Values. Master’s Thesis, University of Oklahoma, Norman, OK, USA, 2010. [Google Scholar]
  48. Brooks, R.H.; Corey, A.T. Hydraulic Properties of Porous Media; Hydrology Paper; Colorado State University: Fort Collins, CO, USA, 1964; Volume 3. [Google Scholar]
  49. Fredlund, D.G.; Xing, A. Equations for the soil-water characteristic curve. Can. Geotech. J. 1994, 31, 521–532. [Google Scholar] [CrossRef]
  50. Tinjum, J.; Benson, C.; Blotz, L. Soil-Water Characteristic Curves for Compacted Clays. J. Geotech. Geoenviron. Eng. 1997, 123, 1060–1069. [Google Scholar] [CrossRef]
  51. Thakur, V.K.; Sreedeep, S.; Singh, D.N. Laboratory investigations on extremely high suction measurements for fine-grained soils. Geotech. Geoenviron. Eng. 2006, 24, 565–578. [Google Scholar] [CrossRef]
  52. Likos, W.; Lu, N. Automated Humidity System for Measuring Total Suction Characteristics of Clay. Geotech. Test. J. 2003, 26, 179–190. [Google Scholar] [CrossRef]
  53. Schindelin, J.; Arganda-Carreras, I.; Frise, E.; Kaynig, V.; Longair, M.; Pietzsch, T.; Preibisch, S.; Rueden, C.; Saalfeld, S.; Schmid, B.; et al. Fiji: An open-source platform for biological image analysis. Nat. Methods 2012, 9, 676–682. [Google Scholar] [CrossRef]
  54. Basham, M.R.; Cerato, A.B. Fractal Approach to Analysis of Expansive Soil Microstructure along Hysteretic Moisture Cycles. Geotechnics 2025. submitted. [Google Scholar]
  55. Huang, X.; Wang, L.; Li, T. Fractal characterization of lime-stabilized sandy soils using SEM and MIP. Soils Found. 2025, 65, 85–97. [Google Scholar]
  56. Basham, M.R.; Cerato, A.B.; Tabet, W.E. Using Fractal Geometry Theory to Quantify Pore Structure Evolution and Particle Morphology of Stabilized Kaolinite. J. Mater. Civ. Eng. 2024, 36, 04024005. [Google Scholar] [CrossRef]
  57. Basham, M.R. Using Physicochemical Properties Within a Discrete Element Modeling Framework and Fractal Geometry Theory to Understand Behavior of Unsaturated Expansive Clays. Ph.D. Thesis, University of Oklahoma, Norman, OK, USA, 2023. [Google Scholar]
  58. Mirzaei Aminiyan, M.; Safari Sinegani, A.A.; Sheklabadi, M. Aggregation stability and organic carbon fraction in a soil amended with some plant residues, nanozeolite, and natural zeolite. Int. J. Recycl. Org. Waste Agric. 2014, 4, 11–22. [Google Scholar] [CrossRef]
  59. Mirzaei Aminiyan, M.; Safari Sinegani, A.A.; Sheklabadi, M. Assessment of changes in different fractions of the organic carbon in a soil amended by nanozeolite and some plant residues: Incubation study. Int. J. Recycl. Org. Waste Agric. 2015, 4, 239–247. [Google Scholar] [CrossRef]
  60. Mirzaei Aminiyan, M.; Safari Sinegani, A.A.; Sheklabadi, M. The effect of zeolite and some plant residues on soil organic carbon changes in density and soluble fractions: Incubation study. Eurasian J. Soil Sci. 2016, 5, 74–83. [Google Scholar]
Figure 2. Initial seating of specimen in the ESEM chamber.
Geotechnics 06 00056 g002
Figure 3. SWCCs of studied soils [27,34,48,49].
Geotechnics 06 00056 g003
Figure 4. Magnification variation of Carnisaw specimen, 158 MPa, 1.52 Mg/m3: (a) 350X; (b) 800X; (c) 3500X.
Geotechnics 06 00056 g004
Figure 5. Image analysis procedure: (a) Initial ESEM micrograph; (b) Binary image.
Geotechnics 06 00056 g005
Figure 6. Primary drying of tested soils, 350X magnification, 35 MPa suction: (a) Minco, (b) Carnisaw, (c) Heiden opt, (d) Heiden w1. Secondary wetting of tested soils, 350X magnification, 35 MPa suction: (e) Minco, (f) Carnisaw, (g) Heiden opt, (h) Heiden w1. Representative features, including desiccation cracks, adsorbed water films, and aggregate boundaries, are annotated for clarity. Adsorbed water film shown in blue, aggregate boundaries shown in yellow and desiccation cracks shown in red.
Geotechnics 06 00056 g006
Figure 7. Primary drying of tested soils, 800X magnification, 35 MPa suction: (a) Minco, (b) Carnisaw, (c) Heiden opt, (d) Heiden w1. Secondary wetting of tested soils, 800X magnification, 35 MPa suction: (e) Minco, (f) Carnisaw, (g) Heiden opt, (h) Heiden w1. Representative features, including desiccation cracks, adsorbed water films, and aggregate boundaries, are annotated for clarity. Adsorbed water film shown in blue, aggregate boundaries shown in yellow and desiccation cracks shown in red.
Geotechnics 06 00056 g007
Figure 8. Primary drying of tested soils, 3500X magnification, 35 MPa suction: (a) Minco, (b) Carnisaw, (c) Heiden opt, (d) Heiden w1. Secondary wetting of tested soils, 3500X magnification, 35 MPa suction: (e) Minco, (f) Carnisaw, (g) Heiden opt, (h) Heiden w1. Representative features, including desiccation cracks, adsorbed water films, and aggregate boundaries, are annotated for clarity. Adsorbed water film shown in blue, aggregate boundaries shown in yellow and desiccation cracks shown in red.
Geotechnics 06 00056 g008
Figure 9. Primary drying and secondary wetting of Heiden w1, 350X Magnification, 1.22 Mg/m3: (a) 0 MPa, (b) 7 MPa, (c) 35 MPa, (d) 89 MPa, (e) 148 MPa, (f) 0 MPa. Representative features, including desiccation cracks, adsorbed water films, and aggregate boundaries, are annotated for clarity. Adsorbed water film shown in blue, aggregate boundaries shown in yellow and desiccation cracks shown in red.
Geotechnics 06 00056 g009
Figure 10. Image-derived apparent strain indicators for specimens along primary drying portion of HSWCC (Magnification = 350X).
Geotechnics 06 00056 g010
Figure 11. Primary drying of Heiden w2, 350X Magnification, 1.25 Mg/m3: (a) 0 MPa, (b) 4 MPa, (c) 35 MPa, (d) 51 MPa, (e) 100 MPa, (f) 148 MPa. White box shows the same structural features at varying suctions.
Geotechnics 06 00056 g011
Figure 12. Primary drying and secondary wetting of Minco specimen, 800X magnification, 1.67 Mg/m3: (a) 8 MPa, (b) 35 MPa, (c) 87 MPa, (d) 148 MPa, (e) 35 MPa, (f) 0 MPa.
Geotechnics 06 00056 g012
Figure 13. Variation in image-derived pore areas of tested soils along primary drying (D) and secondary wetting (W) suction paths for magnifications of 350X, 800X, and 3500X: (a) Carnisaw, (b) Minco, (c) Heiden opt, (d) Heiden w1, (e) Heiden w2.
Geotechnics 06 00056 g013
Table 2. Common geotechnical engineering properties of the studied soils.
Soil IDLiquid Limit (%)Plastic Limit (%)Plasticity Index (PI)Clay Fraction/Silt Fractiongdmax
kN/m3
wopt (%)qu (kPa)ps (kPa)USCS
Heiden61223955/4515.423.4313230CH
Carnisaw58292957/4314.927.057875MH
Minco2820819/8116.412.81440CL
Table 3. Activity values of the studied soils.
Soil IDSkempton ActivityRelative ActivitySA ActivityCEC Activity
(PI/CF)(PI/Sa)(SA/CF)(CEC/CF)
Heiden0.800.194.163.23
Carnisaw0.470.251.891.05
Minco0.420.202.10.43
Table 4. Compaction states for ESEM specimens.
SoilTargetExperimental
ρdmax (Mg/m3)wopt (%)ρd (Mg/m3)wc (%)
Minco1.7020.601.6720.25
Carnisaw1.6526.201.5226.95
Heiden opt1.5824.201.5723.38
Heiden w11.2241.15
Heiden w21.2537.48
Table 5. Suction paths used with ESEM for all specimens.
Chamber Pressure (Pa)RH (%)Suction (MPa)
7401000
665957
5327635
3505089
22031148
Table 6. Summary of ESEM Results by Soil Type.
SoilCompaction StateEquilibration TimeObserved CrackingWater Film BehaviorStructural ChangeVoid Ratio HysteresisActivity Level
Heiden w1Wet of Optimum15 minYesThick; recedes with suctionPronouncedHighHigh
Heiden w2Wet of OptimumNoneNoThin; less definedModerateModerateHigh
Heiden optOptimum15 minNoMinimalStableModerateHigh
CarnisawOptimum15 minNoMinimalStableLowModerate
MincoOptimum15 minNoSheen onlyMinimalLowLow
Disclaimer/Publisher’s Note: The statements, opinions and data contained in all publications are solely those of the individual author(s) and contributor(s) and not of MDPI and/or the editor(s). MDPI and/or the editor(s) disclaim responsibility for any injury to people or property resulting from any ideas, methods, instructions or products referred to in the content.