
Article

Numerical Simulation of the Effects of Rockfall Impact on the Dynamic Response of a Sandbag Protection System

by
Nabeela Maheen
1,*,
Kazuhide Sawada
1,
Daisuke Ueda
2,
Hayashi Motoyuki
3 and
Takahiro Yoshikawa
1,*
1
Department of Civil Engineering, Gifu University, 1-1 Yanagido, Gifu 501-1193, Japan
2
Raiteku Co., Ltd., Osaka 564-0051, Japan
3
OYO Corporation, Nagoya 463-8541, Japan
*
Authors to whom correspondence should be addressed.
Geotechnics 2026, 6(2), 51; https://doi.org/10.3390/geotechnics6020051
Submission received: 12 April 2026 / Revised: 15 May 2026 / Accepted: 20 May 2026 / Published: 22 May 2026

Abstract

Rockfall is one of the most dangerous and unpredictable natural disasters that can seriously damage infrastructure. In traditional protection systems, sand is commonly used as a buffer material; however, the use of large sandbags as temporary protective structures has still not been investigated, and there are no established design guidelines available. This study aims to reveal the effect of rockfall impact on the dynamic response of a sandbag protection system for temporary restoration work in the event of a natural disaster. Initially, a numerical model based on finite element calculation was adopted to simulate the large sandbags under rockfall impact, which was verified by the full-scale experimental test data. The parameters identified were impactor velocity, acceleration, penetration depth, and sandbag displacement. After validation, the model was used for prediction analysis to examine the dynamic response and energy absorption characteristics of sandbags under different conditions, such as the influence of sand density, impactor velocity, impact height and the number of sandbags in the impact direction. The results propose an analytical basis for the establishment of performance-based guidelines for the design of sandbag walls as a temporary rockfall protection system.

1. Introduction

Rockfalls are a serious hazard in mountainous regions causing damage to highways and infrastructure [1,2,3]. Due to recent changes in climate, the risk of these hazards has increased [4,5]. To mitigate these disasters, protective structures are needed [6,7,8,9]. Most commonly used protection structures are broadly categorized as rigid (rock sheds, rigid barriers, reinforced concrete retaining walls) [10,11,12] and flexible (steel wire mesh nets supported by posts and cables) [13,14,15,16]. So far, these structures have proved fruitful in mitigating the said problem and many researchers have contributed to improving the existing protection structures by taking into consideration other materials (sand, gravel, tires, geosynthetics) that can be used in conjunction with flexible and rigid structures.
Among various buffering materials, sand cushions have been widely used for mitigating rockfall impact due to their energy-absorption capacity [17,18,19]. Previous studies have investigated the buffering performance of sand under different impact conditions. For example, Ho et al. [20] examined the impact characteristics of a weight colliding with a sand cushion placed over a steel beam and demonstrated the shock-absorbing capability of sand as well as the associated energy-transfer mechanisms during impact. Sand layers have also been employed as impact-absorbing components on the top of rockfall protection galleries in full-scale experiments [21,22,23]. In addition, several researchers have investigated the mechanical behavior of sand-filled systems through experimental studies. Static compression tests on geocells filled with sand and other materials were conducted to evaluate their strength and deformation characteristics [24,25,26]. Kawahara and Muro [27] investigated the influence of sand cushion thickness and dry density on impact force through rockfall impact experiments. Similarly, Zhu et al. [28] studied the energy-dissipation capacity of sand cushions and reported improved impact energy absorption performance. Furthermore, Shellenberg [29] and Li et al. [3] analyzed the effect of sand cushions on the dynamic response and damage behavior of reinforced concrete (RC) shed roofs subjected to rockfall impact. Yan et al. [30] also conducted a series of impact tests to evaluate the penetration behavior of spherical-conical and flat-shaped rockfalls in sand and gravel cushions.
Although previous studies demonstrated the effectiveness of sand cushions and sand-filled systems in dissipating impact energy, these materials have primarily been used as supplementary components in conventional rigid or flexible protection structures. Studies focusing on standalone sandbag structures for rockfall protection remain limited. However, adopting a specific protection structure, either rigid or flexible, requires site-specific research by experts that is time-consuming. Moreover, the implementation of these structures is costly and labor-intensive. Also, due to the increasing frequency of rockfall hazards, there is a need for emergency restoration using temporary measures. Installing sandbags does not require foundation drilling or steel erection like temporary protective fencing, and allows flexible construction according to site conditions. However, the installation of wall structures entirely made of sandbags as a protection measure is very limited. Our research group [31] has investigated the behavior and damage patterns of large sandbags under varying collision energies through slope-falling impactor tests using three-layer large sandbags. It was concluded that large sandbags captured rockfall with collision energies up to 1300 kJ. To further study the behavior pattern of sandbags after impact, experimental tests were conducted on a single large sandbag. Due to the limitations, two sets of experimental tests (a total of four cases) were conducted by varying two factors only (velocity and sand density).
Although the deformation behavior of the sandbag, such as penetration and displacement, is identified through experiments, there is a need to understand the relationship between different factors affecting the behavior of the sandbag after impact. According to the literature, numerical modeling techniques are considered useful to understand complex behaviors and have been employed by researchers [32]. This study aims to employ a finite element method (FEM) code to simulate the response of sandbags under rockfall impact. A numerical model of the impactor hitting the sandbag horizontally was established, replicating the experimental test. The constitutive material models and contact algorithms were experimentally calculated and calibrated through a parametric study. The rationality of the selected parameters was validated by comparing numerical and experimental results. The dynamic behavior of sandbags under different impact conditions was analyzed. The results provide insights into a dynamic response analysis of sandbags that serve as a benchmark for their implementation as a protective structure.

2. Experimental Program

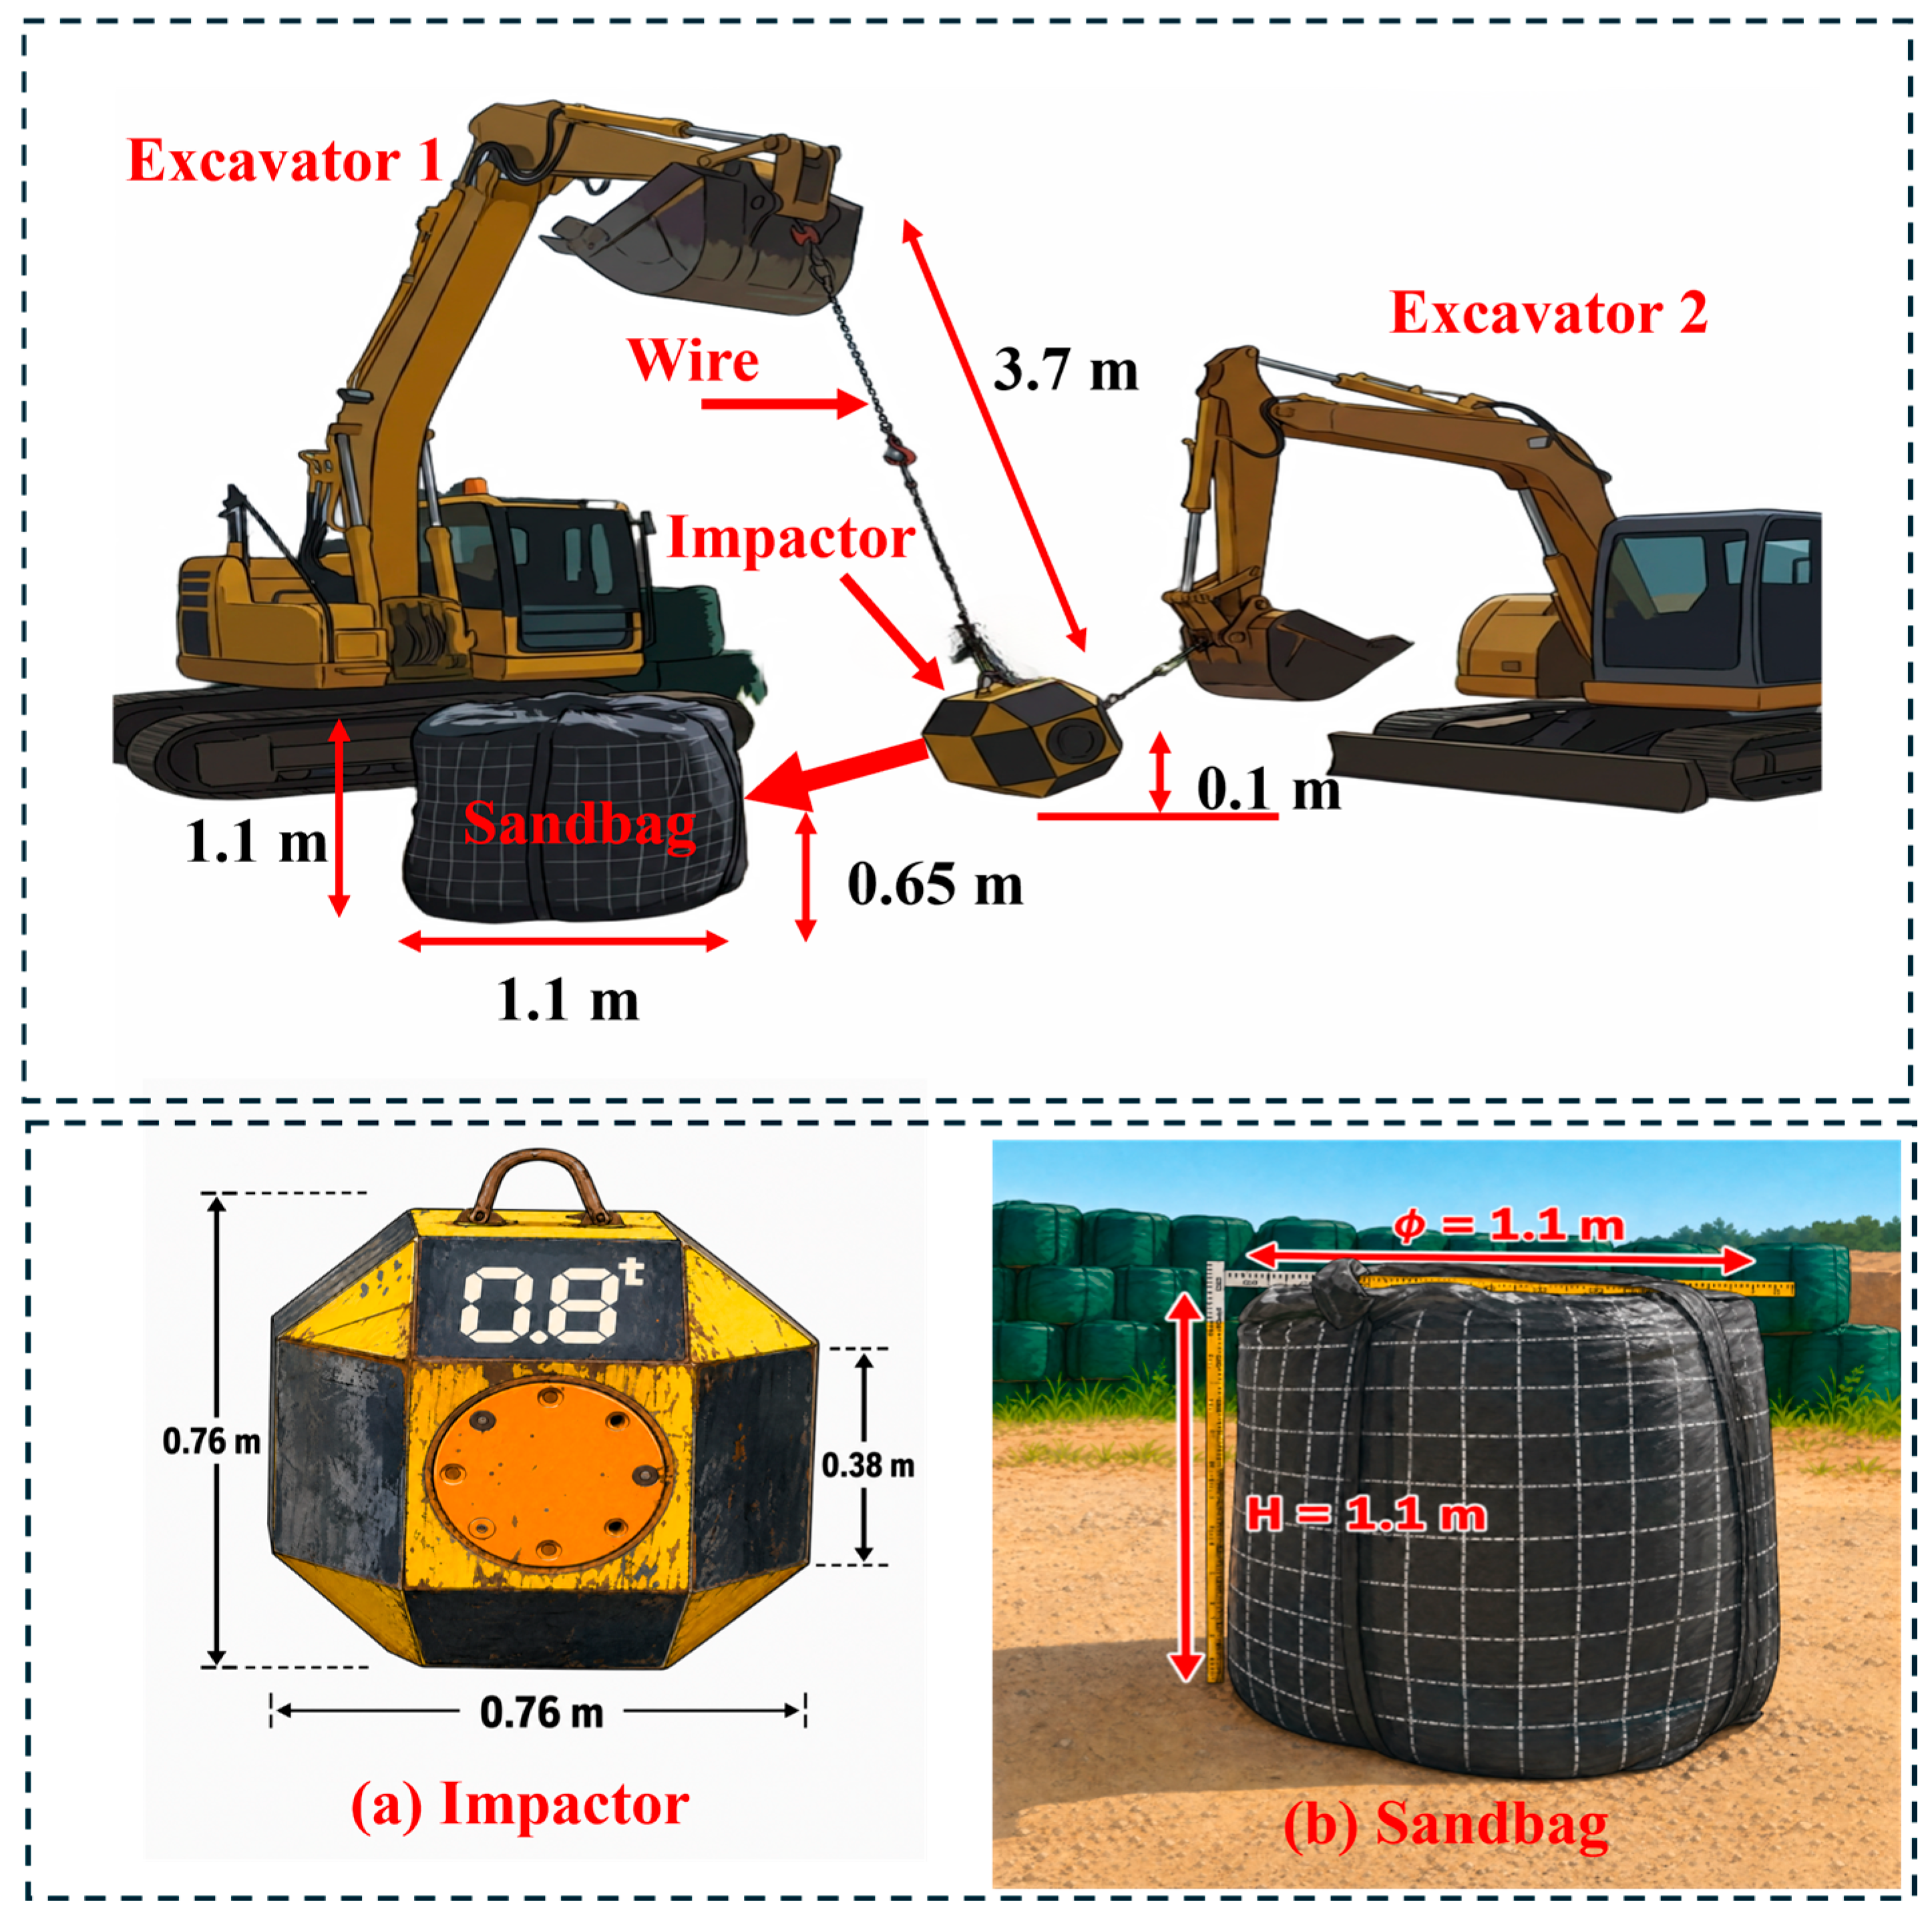
Figure 1 illustrates the experimental setup used in this study. The experimental method involves using an impactor hanging from excavator-1 while excavator-2 lifts the impactor to a predetermined height, enabling it to be dropped from any desired height. The position of the impactor suspended from excavator 1 was adjusted so that it would strike the large sandbag from a height of 0.65 m above the ground. Subsequently, the sling belt connecting excavator 2 and the impactor is cut, causing the impactor to fall and collide with the large sandbag. Fall height was set to two patterns of 0.1 m and 1.0 m to vary the impact velocity of an impactor on the sandbag. The experimental program employed a standard-sized sandbag (Figure 1a) filled with in situ soil. The sandbag is subjected to impacts from an impactor of mass 800 kg and density 2572 kg/m3 (Figure 1b). Four experimental cases systematically varied the drop height (0.1 m and 1.0 m) and sandbag density by compaction, with impact velocities, accelerations, penetration depths, and sandbag displacements measured using high-speed cameras (300 fps) manufactured by Sony Corporation, Japan and triaxial accelerometers manufactured by Tokyo Sokki Kenkyujo Co., Ltd., Japan. The details of the cases are shown in Table 1.

3. Numerical Analysis Approach

3.1. FEM Model Geometry

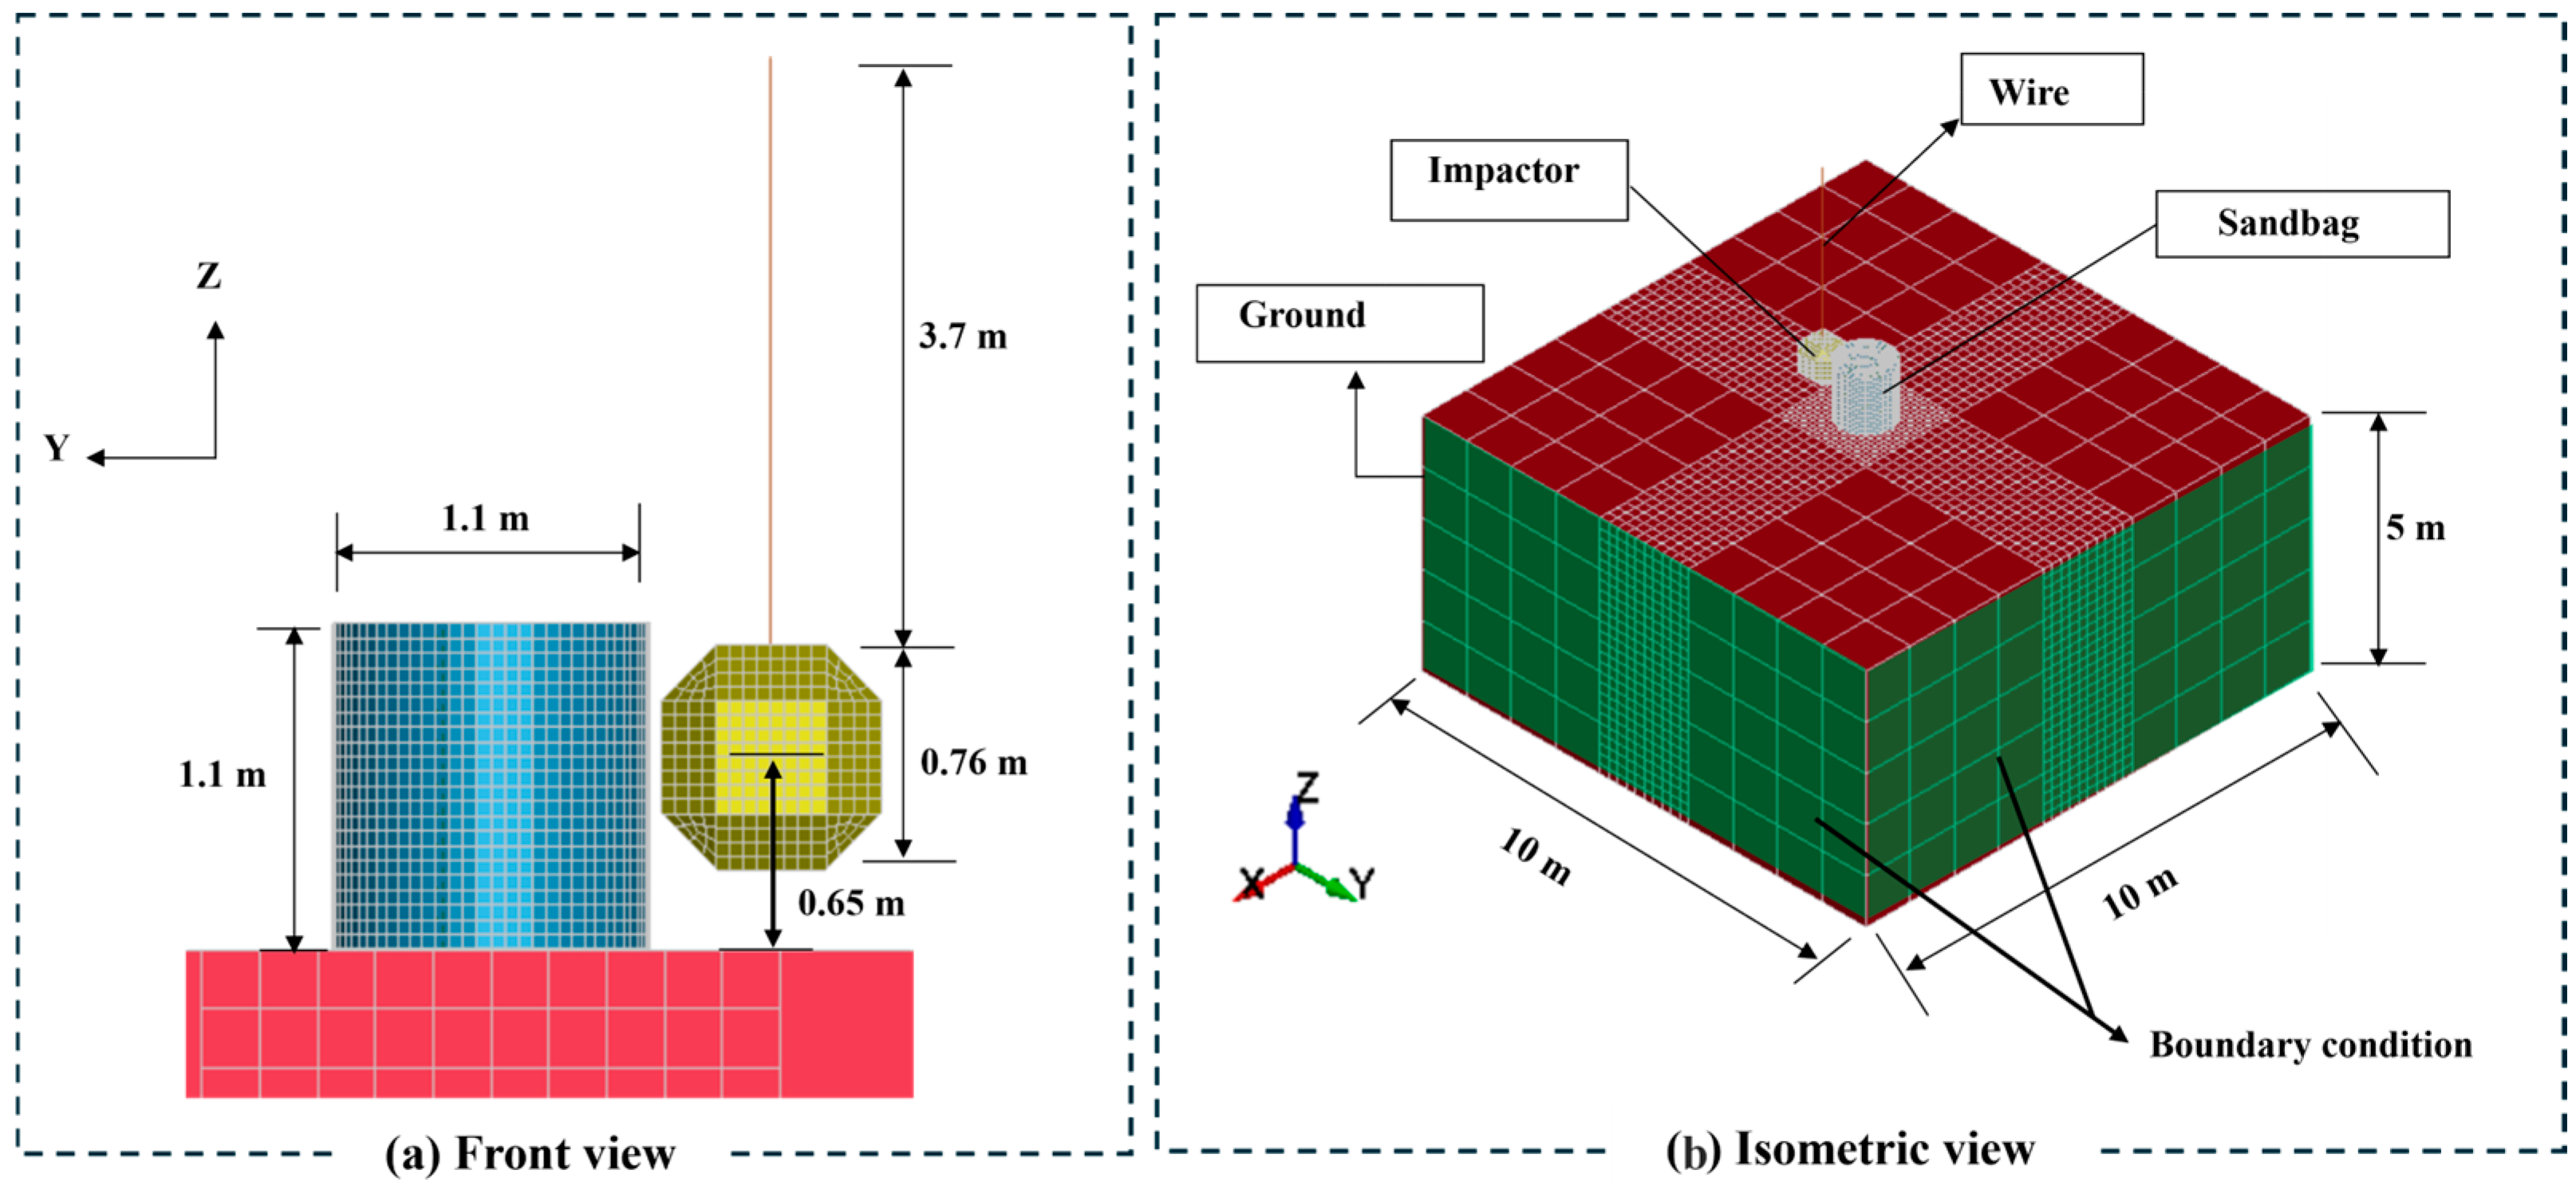
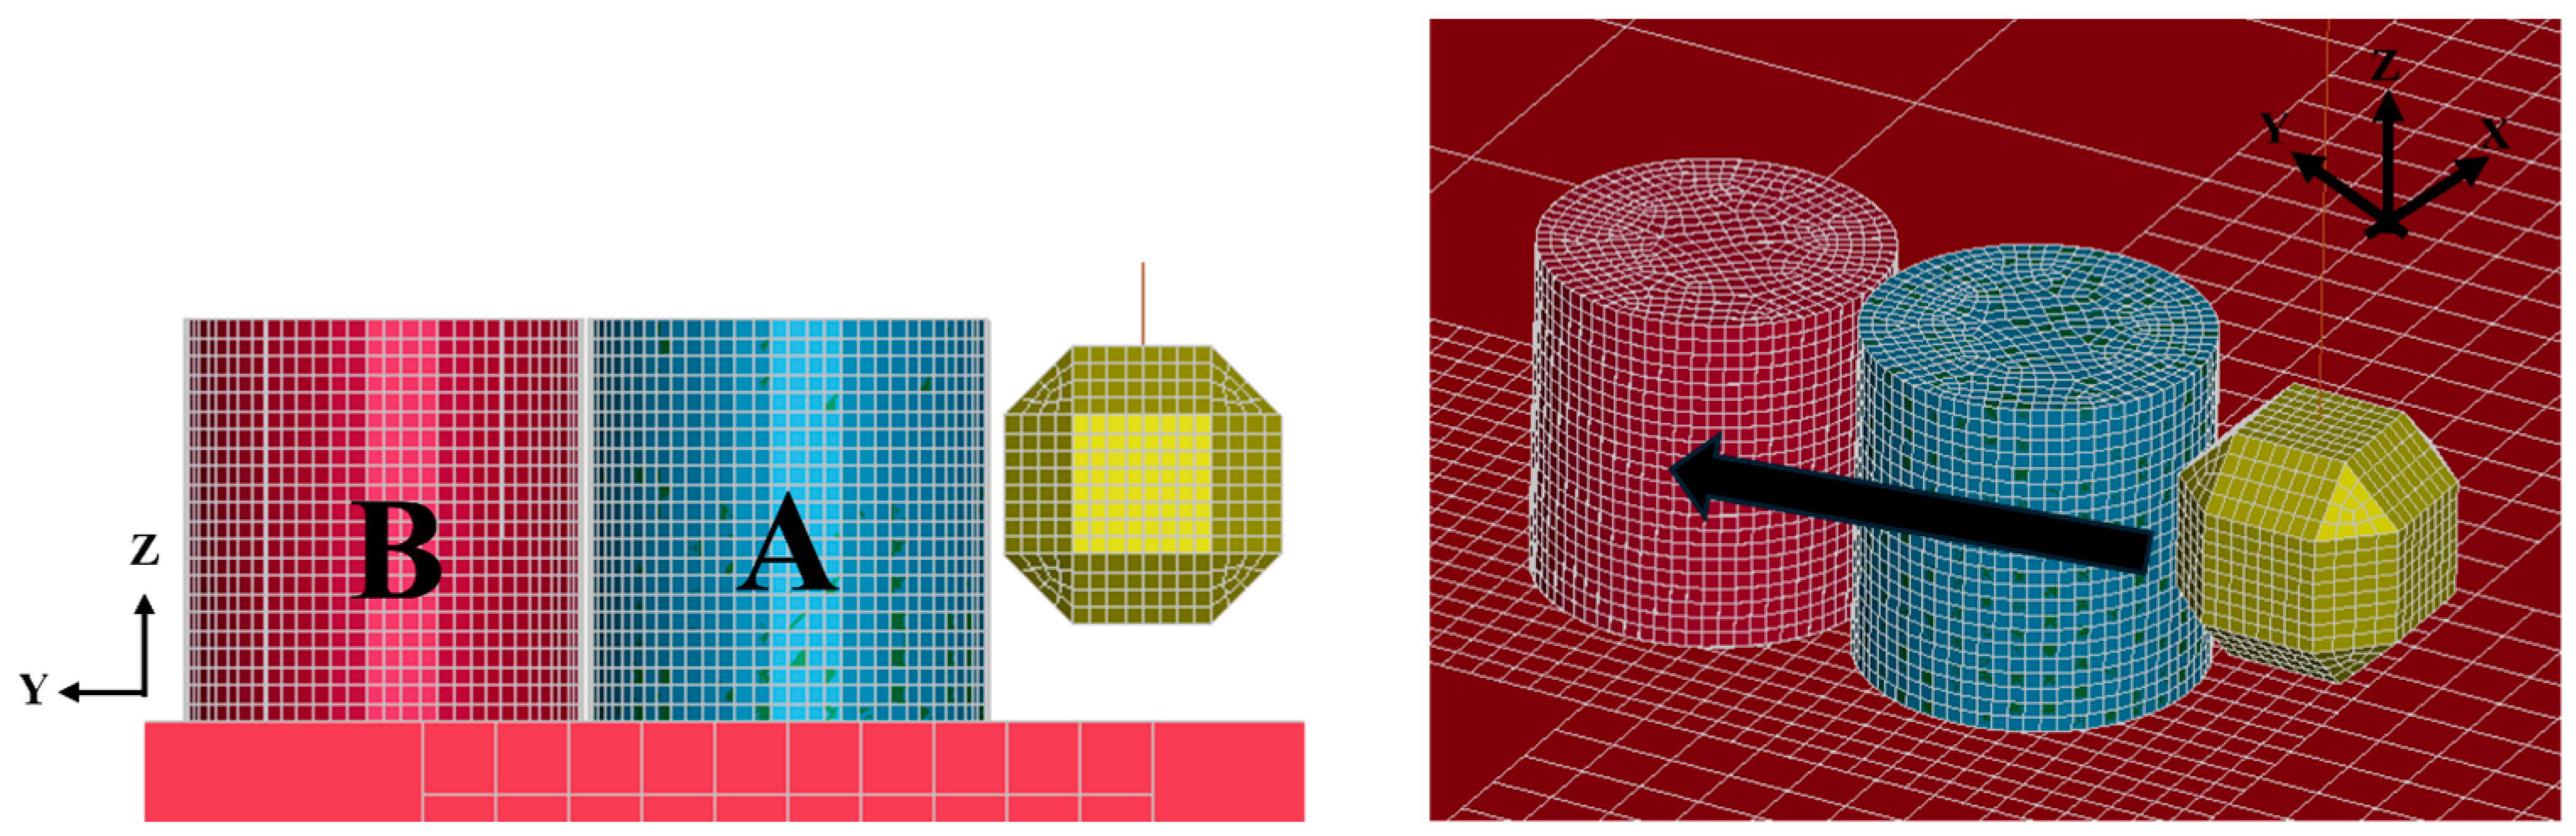
The FEM model of the impact test shown in Figure 2 was established in the LS-DYNA R16 software (LS-PrePost V4.8.31) and replicated case no. 3 of the experiment. The simulation model includes a wire pendulum, an impactor attached to the wire, a sandbag, and the ground. The dimensions and shape of all parts of the numerical model were the same as those of the experiment. The large sandbag was modeled as a cylinder measuring (1.1 m × 1.1 m × 1.1 m), with hexahedral solid elements representing the sand and tetrahedral shell elements representing the bag material. The ground was made sufficiently large to ensure that neither the sandbag nor the impactor would be influenced by boundary effects from the bottom or sides during impact.

3.2. Constitutive Models

LS-DYNA provides various constitutive models to simulate a wide range of material behaviors [33]. Since sand was the most critical component of the model, the MAT_SOIL_AND_FOAM_FAILURE material model was employed to accurately capture its impact behavior. This model was originally developed by Krieg [34] based on the Drucker–Prager yield criterion. This criterion was adopted as a continuum-level approximation due to its computational efficiency and numerical stability in dynamic simulations. The Drucker–Prager yield criterion has the form expressed in Equation (1) as follows:
α I 1 + J 2 = k ,
where I1 is the first invariant of the Cauchy stress tensor, and J2 is the second invariant of the deviatoric part of the Cauchy stress tensor. The constants α and k are determined by experiments. In LS-DYNA, I1 = 3p, where p is the pressure. J2 is expressed as follows:
J 2 = ( α I 1 + k ) 2 = ( 3 α p + k ) 2
J 2 = 9 α 2 p 2 6 α k p + k 2
The Drucker–Prager yield surface represents a smooth approximation of the Mohr-Coulomb yield surface. Therefore, it can be defined using the same parameters as cohesion (C) and internal friction angle (ϕ). When the Drucker–Prager yield surface is constructed to circumscribe the Mohr-Coulomb yield surface, the parameters α and k can be expressed in Equations (4) and (5) as follows:
α = 2 s i n φ 3 ( 3 s i n φ )
k = 6 C   c o s φ 3 ( 3 s i n φ )
Therefore, the required parameters for the LS-DYNA FEM code can be calculated using the following equations:
a 0 = k 2
a 1 = 6 α k
a 2 = 9 α 2
In these equations, a0, a1, and a2 are user-defined material constants. The required input characteristics of sand for the simulation model include the density (ρ), Poisson ratio (ν), shear modulus (G), bulk modulus (K), friction parameters (ϕ) and (c), and stress-volumetric strain relationships. Density was experimentally measured, Poisson’s ratio was taken from published data for sand [35], and the remaining parameters were calibrated through a parametric study. The parametric study shows that Mohr-Coulomb constants are the sensitive parameters. The MAT_FABRIC model was used to simulate the mechanical behavior of the textile bag used in sandbags. This model applies to membrane elements with three or four nodes and is a variation in layered orthotropic composite materials [33]. The ground and the wire were assigned the MAT_ELASTIC constitutive model of LS-DYNA to incorporate linear elastic material properties. During impact, these components showed minimal deformation, which supported this assumption. It enables stress to be computed directly from strains using Hooke’s law. For impactor, a rigid material model MAT_RIGID was used to improve computational efficiency. Table 2 displays the material model values.

3.3. Boundary and Contact Conditions

The boundary and contact conditions were applied to the model to ensure numerical stability and avoid boundary effects of the ground during the simulation process. BOUNDARY_SPC was used to fully constrain the ground at its bottom and lateral sides, fixing all translational and rotational degrees of freedom in the impacted nodes. This arrangement makes the bottom and sides of the ground fixed by freezing those nodes. Moreover, it also removes the numerical robustness, i.e., if the nodes are set free in all directions, then to achieve model stability, the software must run iterations that will increase computational costs as well as unnecessary data. Thus, avoiding the reflections from the ground to affect the sandbag reaction during impact. However, the top of the ground is made elastic so that stress transfer to the ground from the sandbag can be visualized. To replicate the swinging impactor as in the case of a physical experiment, the top node of the wire was constrained (translational motion) in a numerical model (Figure 2). Gravitational acceleration (g = 9.81 m/s2) was globally applied to the model to accurately reflect real-world behavior. The impactor was given an initial velocity in the direction of the negative Y-axis, which matched an experimentally determined value of 4.34 m/s from physical experiments. The contact interactions between different components (bag, sand, ground and impactor) were defined using the penalty-based algorithms of LS-DYNA. The CONTACT_AUTOMATIC_SURFACE_TO_SURFACE algorithm was used to model the interface between the sandbag and the ground as well as between the textile bag and the sand particles. Because this contact type employs a non-oriented formulation that can detect penetration from either side of shell elements, it is especially suitable for impact scenarios with significant deformations. Friction coefficient values are given in Table 3. After a parametric study, the friction coefficients between bag, sand and impactor show less effect on the results. The same values for dynamic and static friction coefficients have been selected for the sake of simplicity. The CONTACT_AUTOMATIC_NODES_TO_SURFACE_SMOOTH algorithm was used for the impactor and sandbag interaction. This formulation treats the sandbag surface as the slave surface and the impactor nodes as master surfaces with a smoothed contact surface representation that improves numerical robustness during high-velocity impact. The SMOOTH option reduces numerical noise and enhances contact force calculations during the impact event by automatically fitting a smooth surface from the mesh.

3.4. Reproducibility Analysis

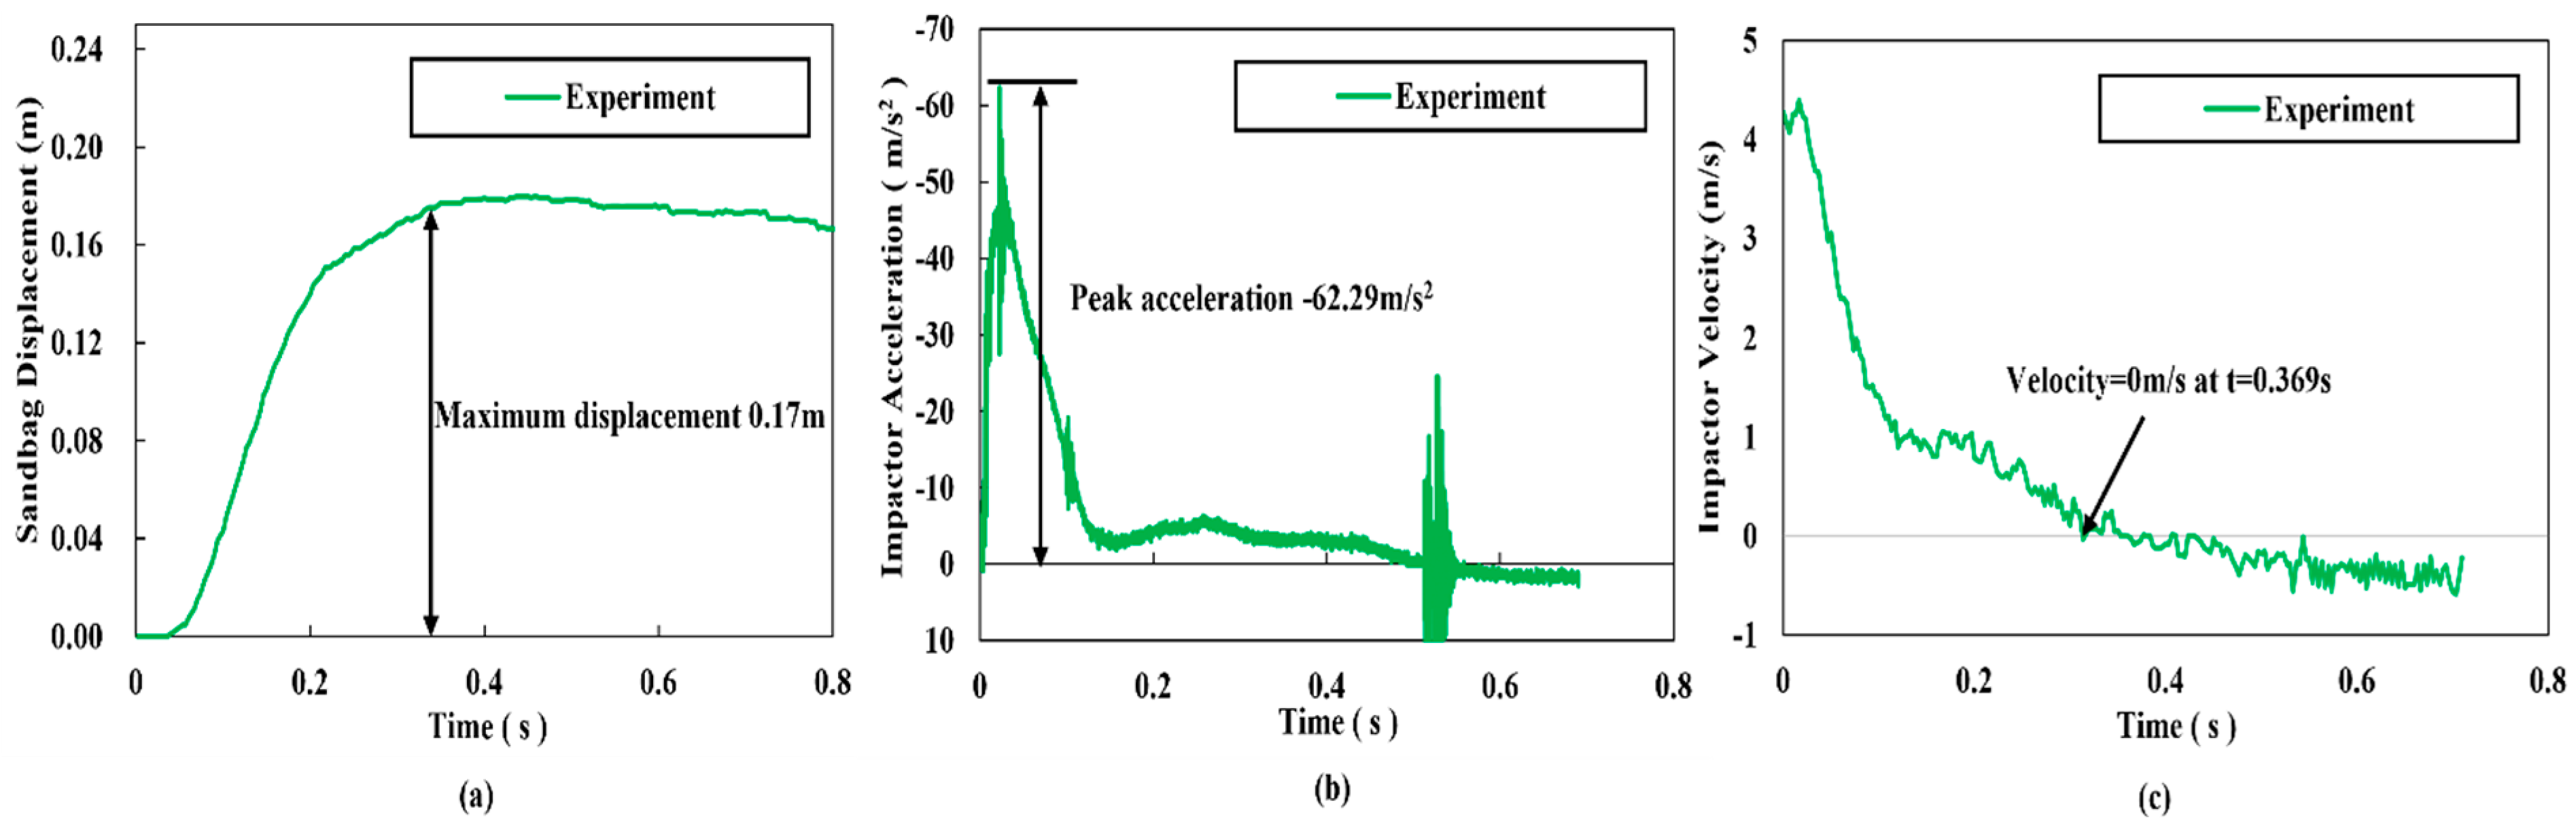
The reproducibility analysis validated experimental findings (Figure 3) by examining the impactor’s time-velocity and time-acceleration relationships and the displacement of large sandbags. The analysis targeted the following three characteristics to reproduce experimental results:
  • Impactor acceleration profile: the ascending slope to peak acceleration and the descending curve until full penetration and maximum displacement of the sandbag are achieved, and velocity reaches zero.
  • Impactor velocity characteristics: the initial slope immediately after contact with the large sandbag and the time required for velocity to reach zero.
  • Maximum displacement of the large sandbag.

4. Numerical Analysis Results

4.1. Comparison of Numerical and Experimental Results

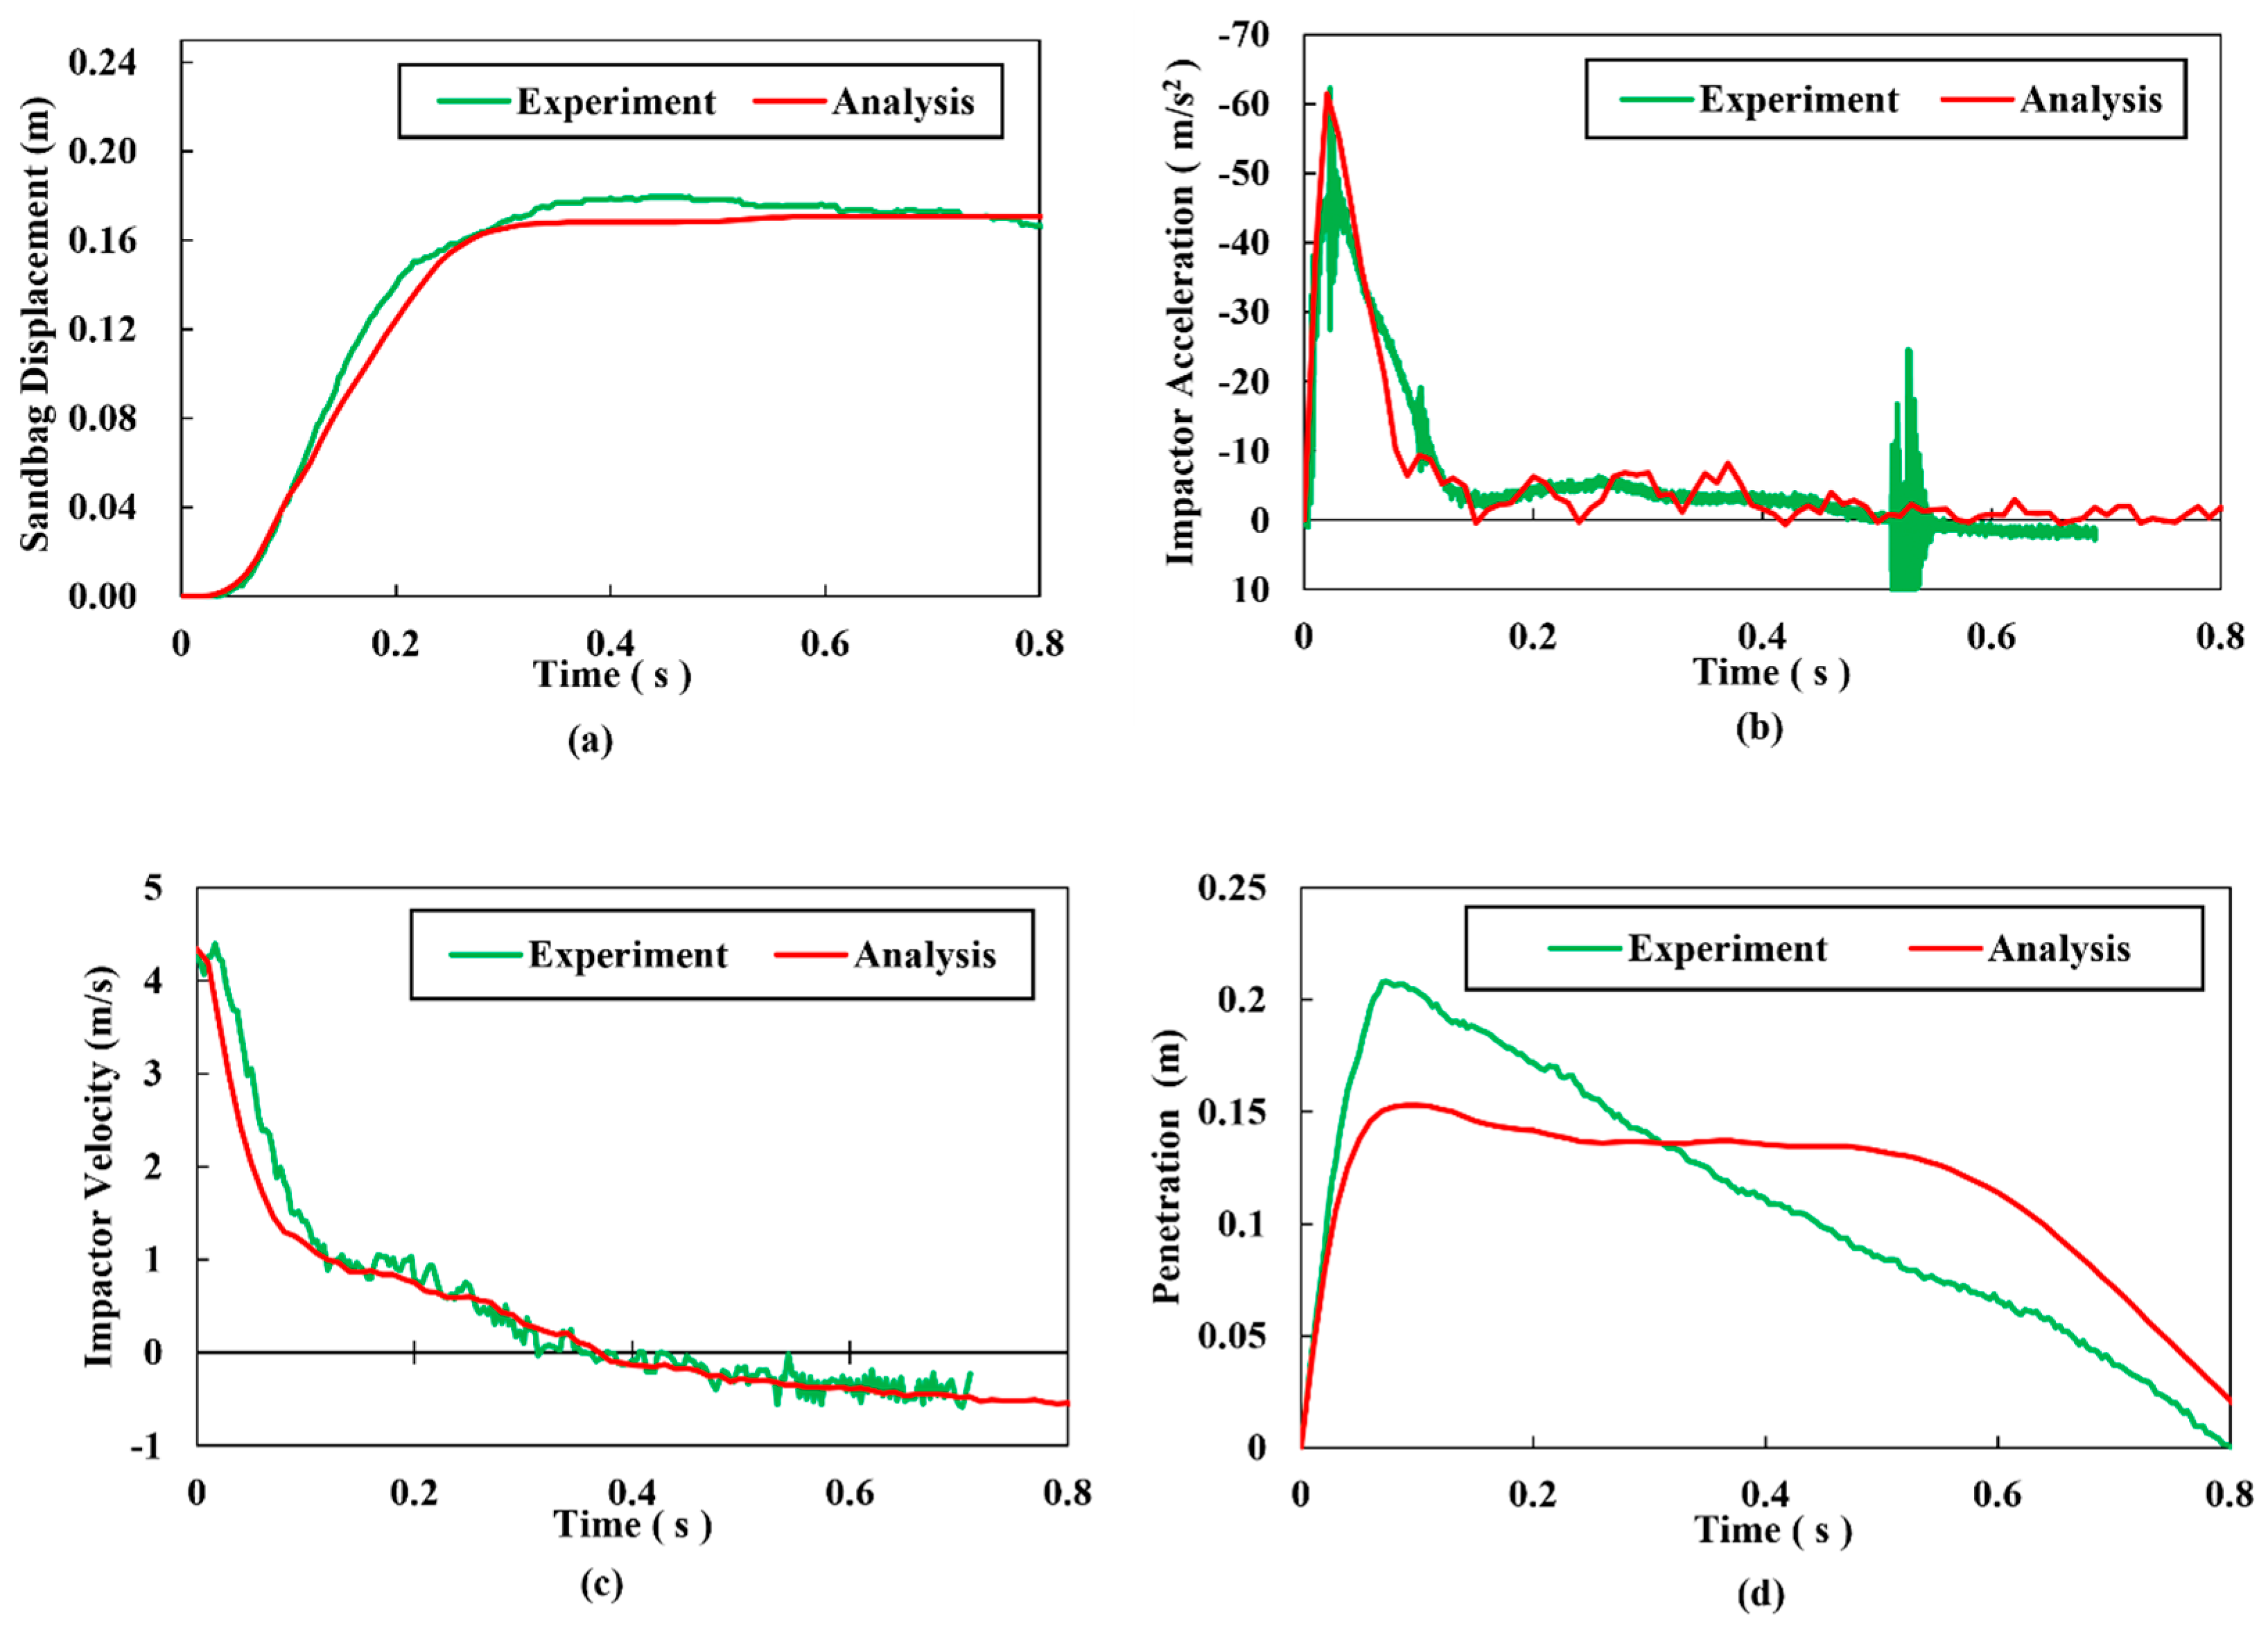
Numerical results of the simulation model and experimental tests are compared in Figure 4. The red line shows the results of numerical analysis, and the green line shows the results of experimental tests. The results of numerical simulations were compared with experimental measurements of impactor velocity and acceleration histories, as well as sandbag penetration and displacement responses. The sandbag moves quickly at first (0–0.29 s) and then reaches peak at about 0.17 m between 0.4 and 0.8 s. Both the experimental and numerical curves show very little difference over the whole-time history. The steep slope at the beginning shows that the sandbag was quickly compressed during the impact, and the flat part shows the final shape of the sandbag after it was deformed. The simulation shows consistent results of the displacement changes over time with experimental values. The acceleration-time history shows a sudden drop of about −61 m/s2 right after the impact, at 0.019 s, which is the sudden deceleration force. After this initial peak, the acceleration values begin to oscillate with lower amplitude before attaining values close to zero at 0.4 s. The numerical simulation model accurately predicted the peak values of the acceleration as well as the oscillations that followed the initial peak. However, there are some small variations in the patterns of the oscillations between the two models at 0.05 and 0.1 s. The impactor velocity-time diagram shows a rapid reduction in the impactor's velocity from its initial velocity of 4.34 m/s at t = 0 (s) to 0 m/s at t = 0.369 s. The experiment and the numerical simulation are consistent with each other as the impactor velocity reduces over the simulation period. The simulation model accurately predicted the reduction in the velocity-time diagram of the impactor. The negative values of the impactor indicate the recovery of the impactor from the experiment simulation. In the experiment, the penetration depth reached its peak at t = 0.099 s at a depth of 0.21 m before rapidly reducing to almost zero at t = 0.8 s. This action by the sandbag demonstrates its capacity to recover even when fully compressed. The simulated model shows the smooth recovery of the impactor as compared to the experiment, which indicated a sudden change in the recovery of the impactor. The simulation yielded a peak penetration of 0.15 m, while the experimental value was 0.21 m; the numerical peak penetration is thus 28.5% lower than the experimental peak. This discrepancy may be due to the rotation of the impactor during impact (as the suspension wire is free to move) and variations in the contact area resulting from the impactor’s polyhedral geometry. These effects are difficult to control experimentally, thereby contributing to the observed difference. Moreover, the sand was modeled using the MAT_SOIL_AND_FOAM_FAILURE material model. This model does not explicitly capture granular rearrangement, inter-particle friction, or micromechanical dissipation. Nevertheless, the numerical model demonstrated satisfactory predictive capacity, which is acceptable for an engineering-oriented numerical study.

4.2. Stress-State Inside Sandbag

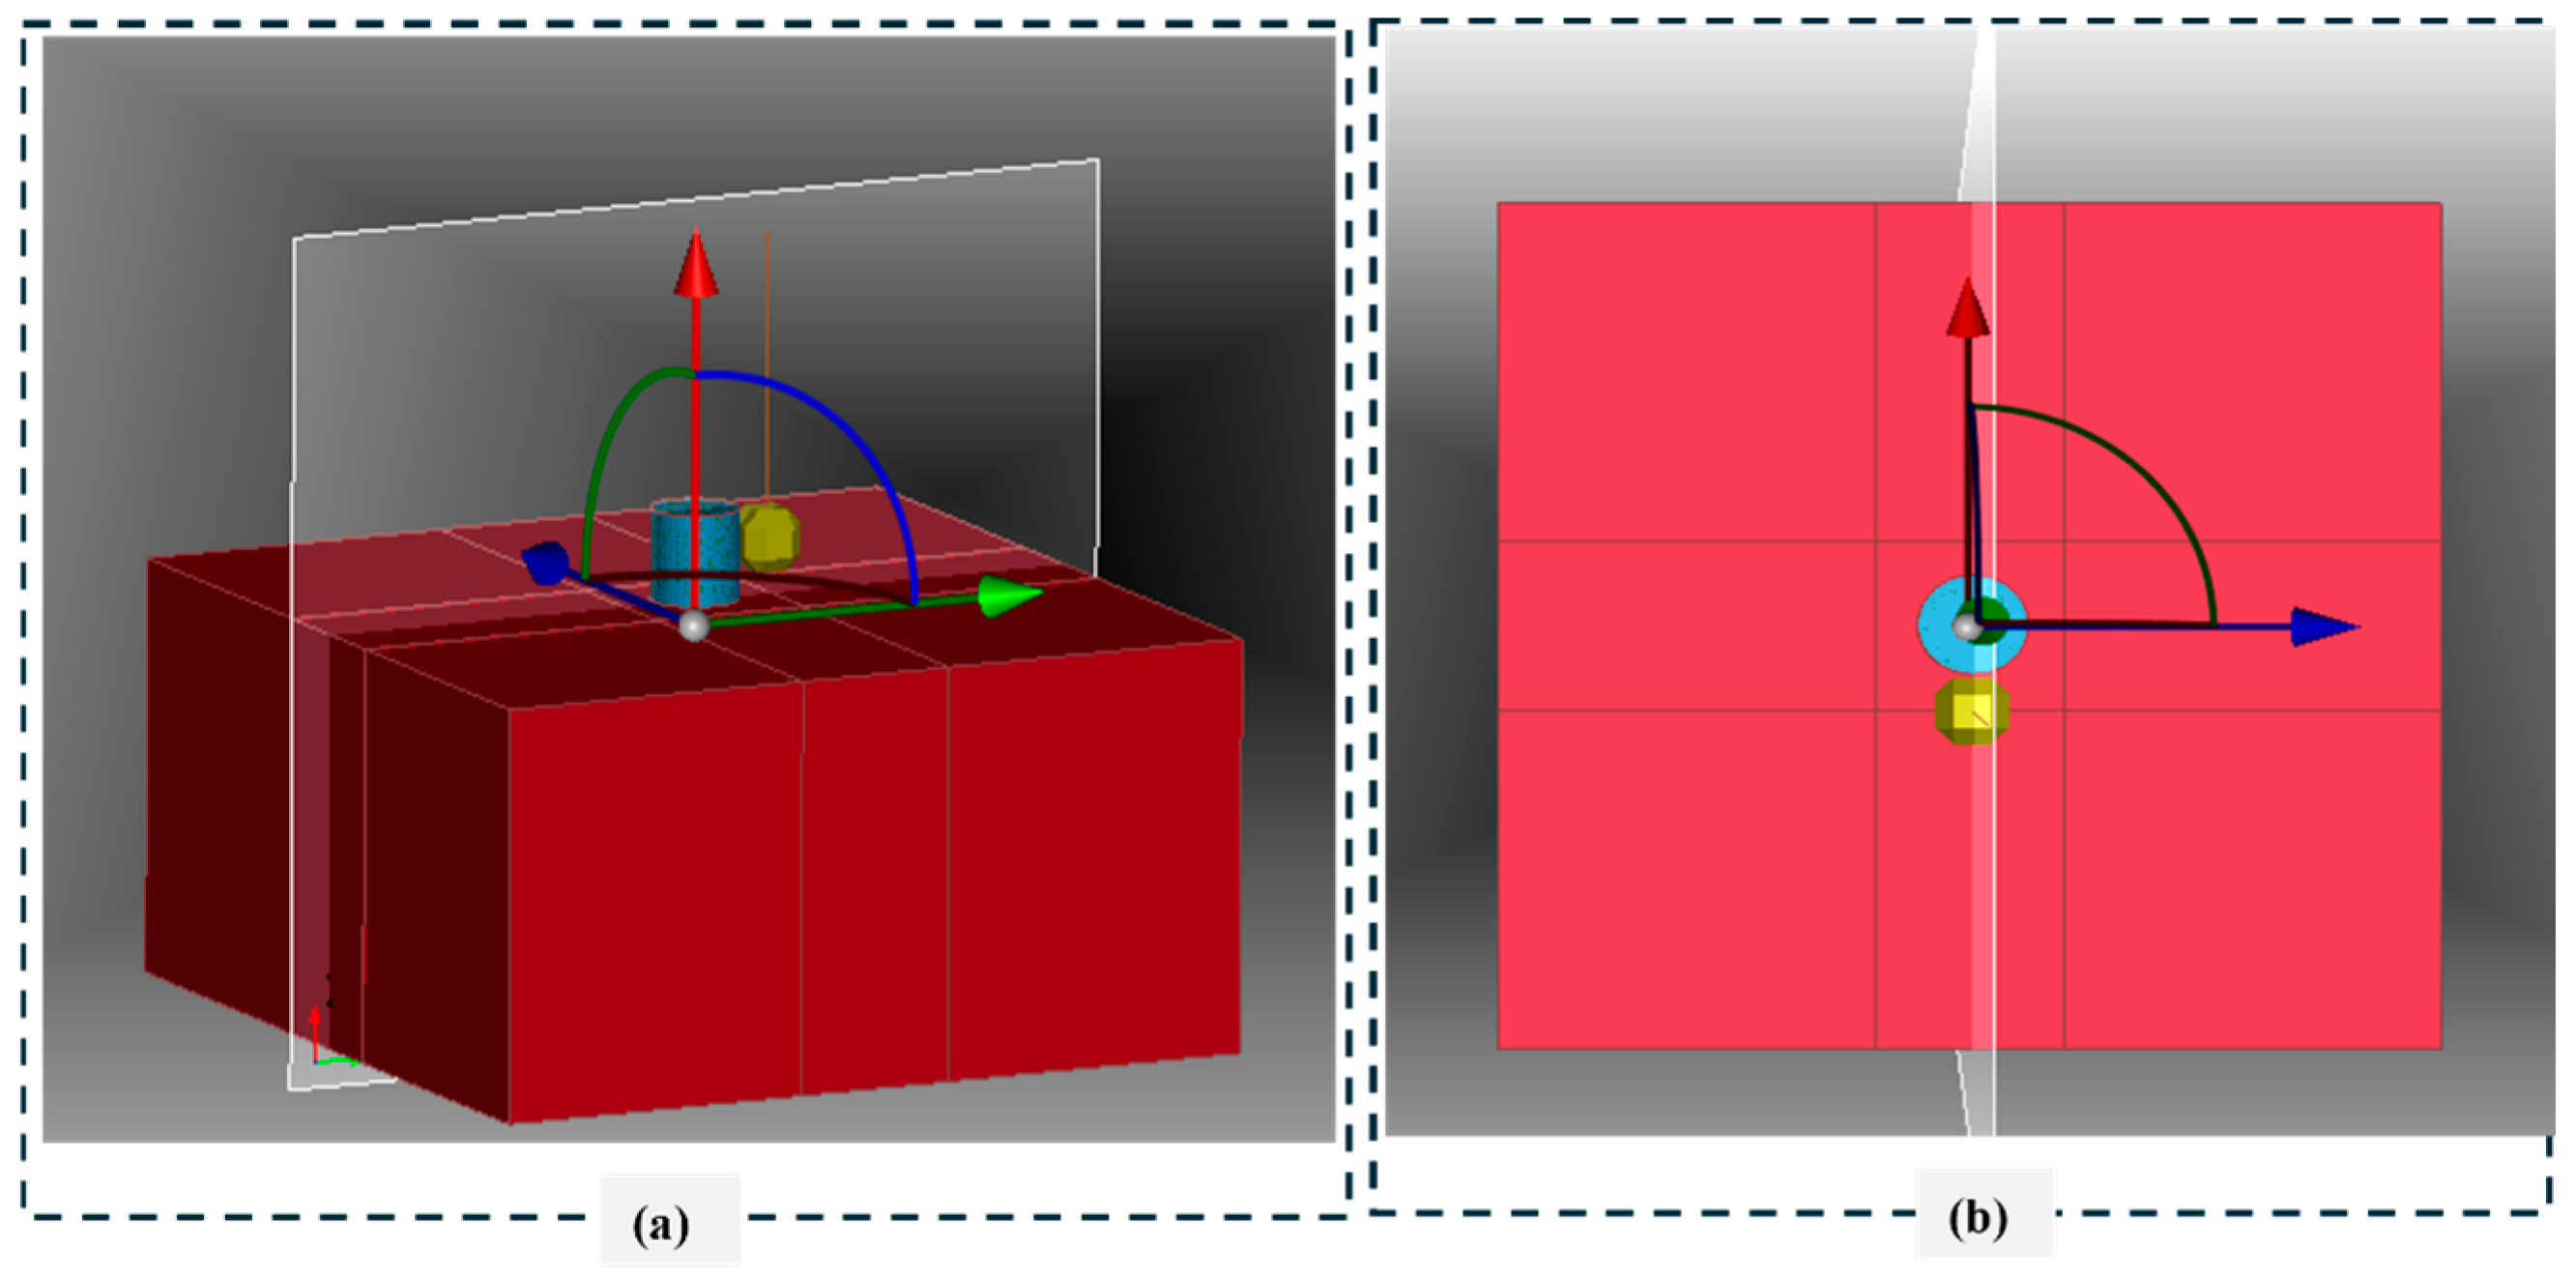
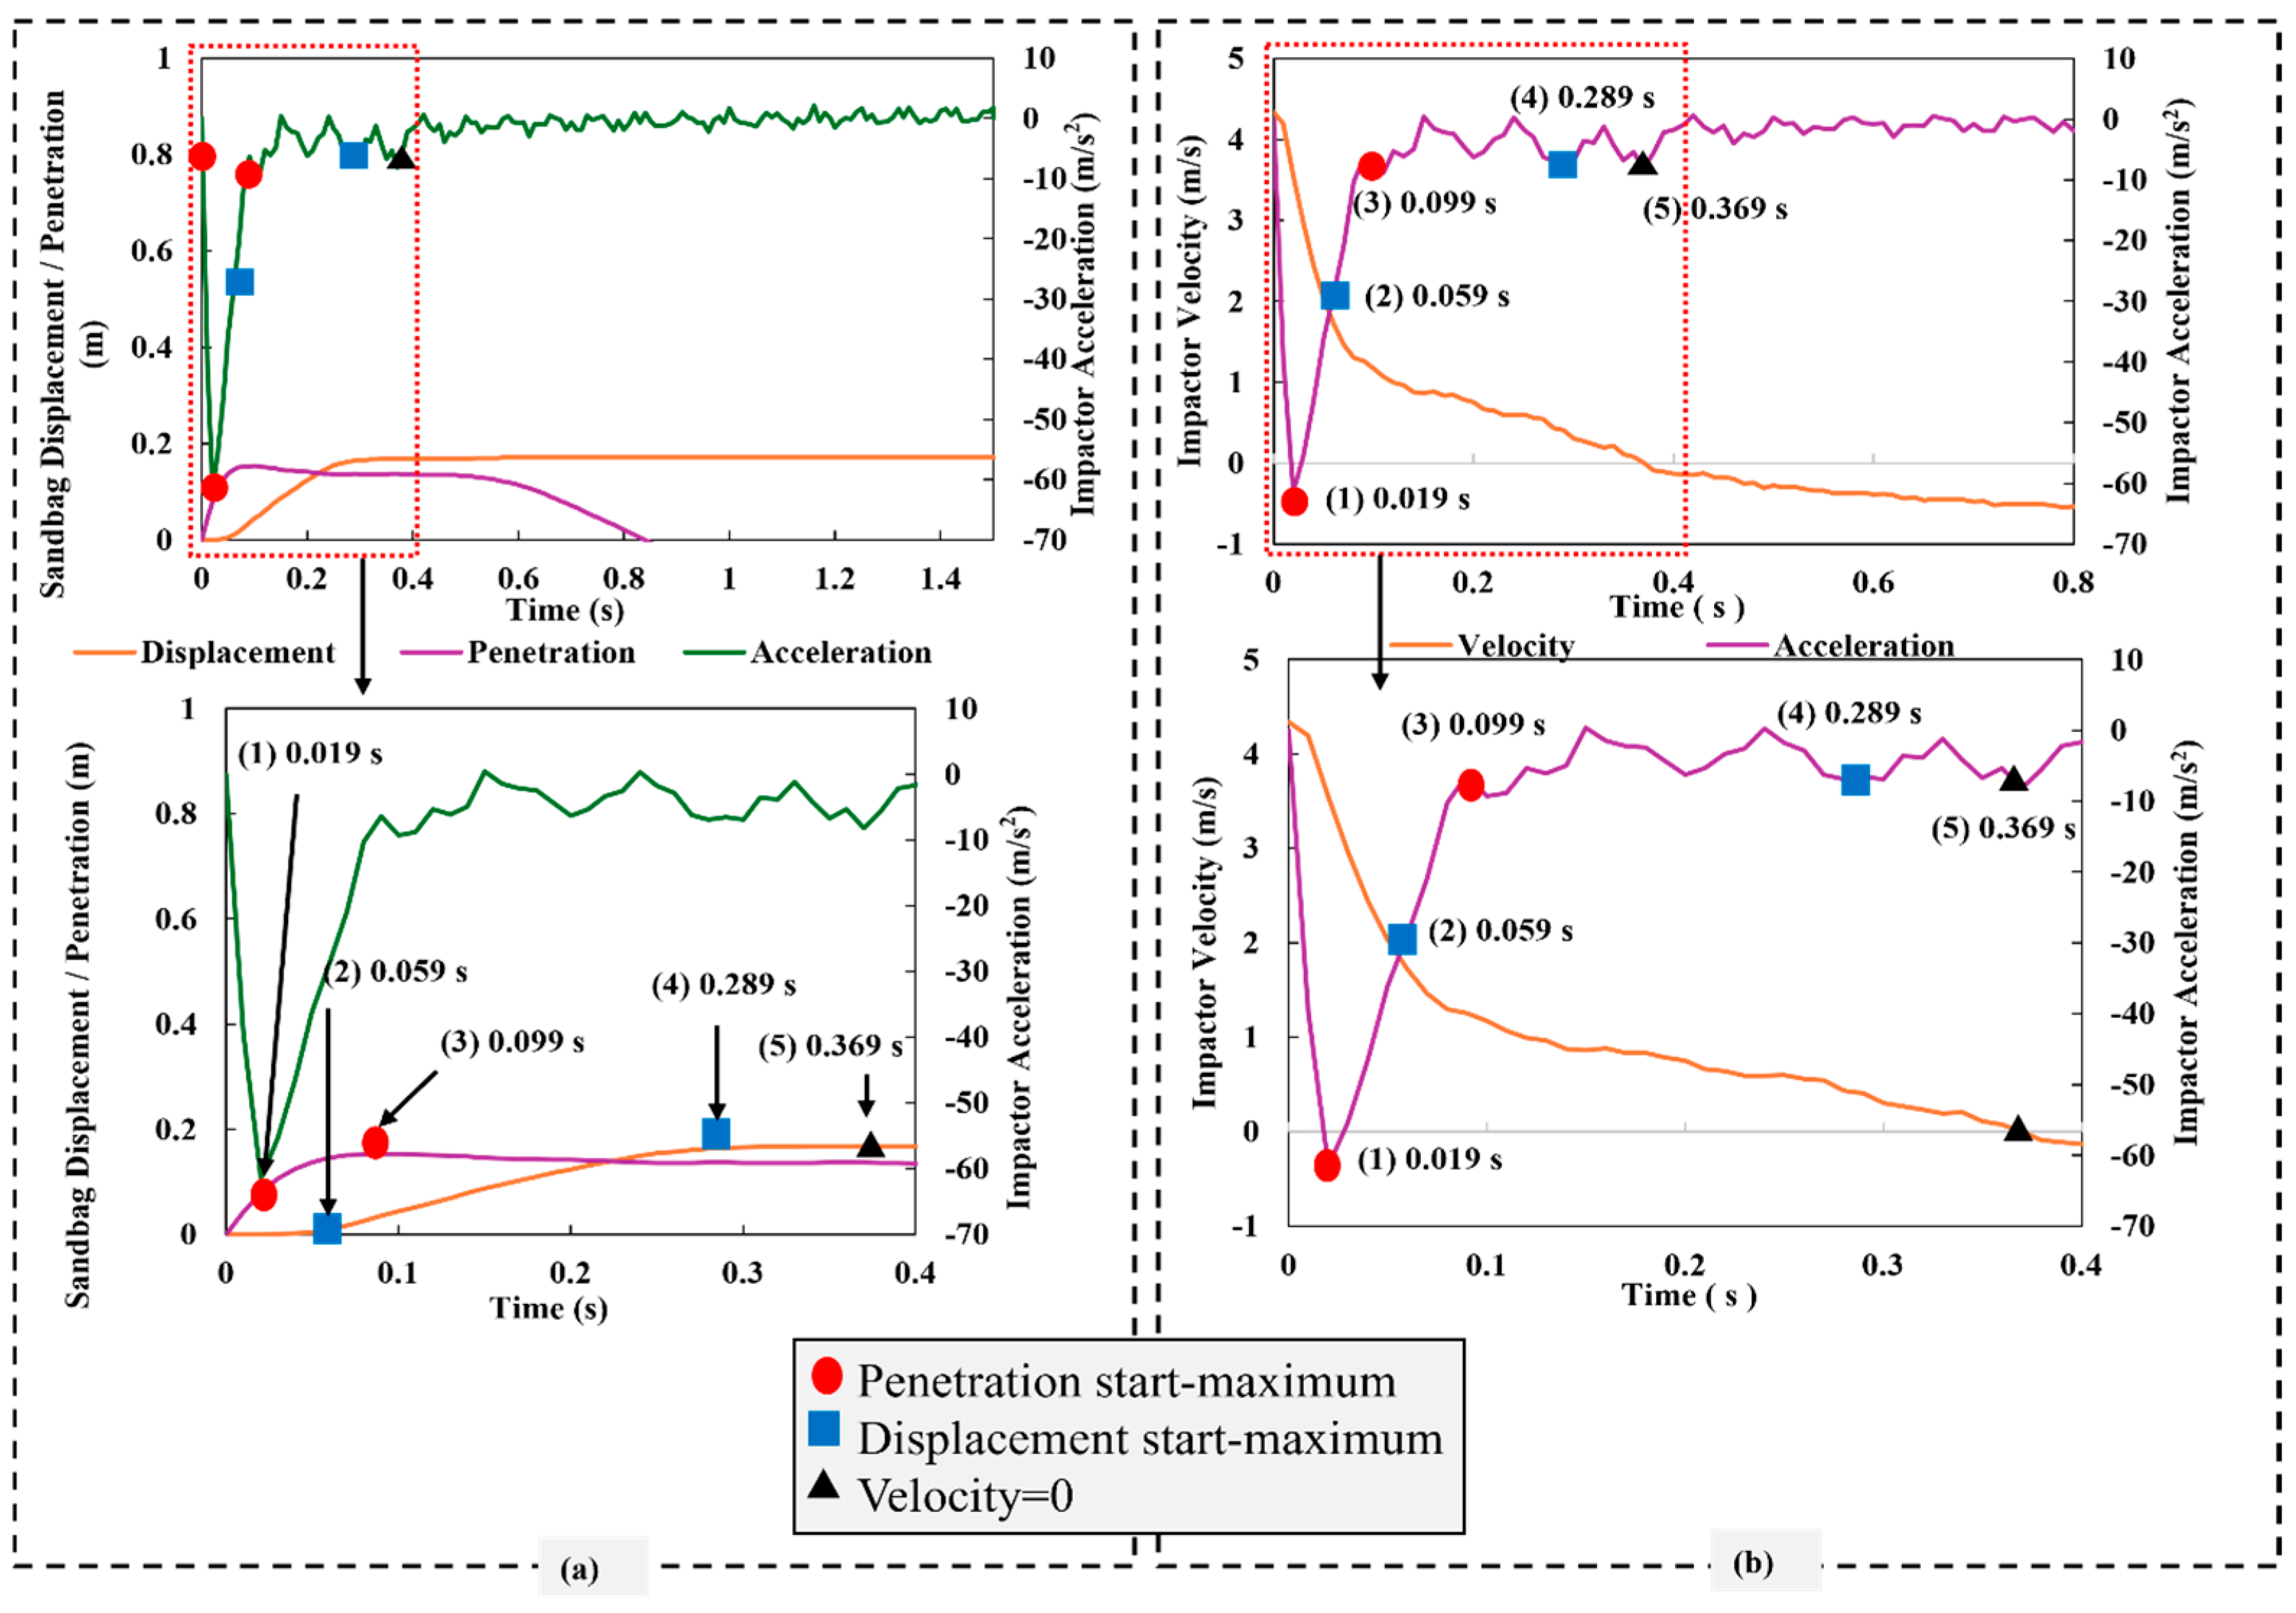
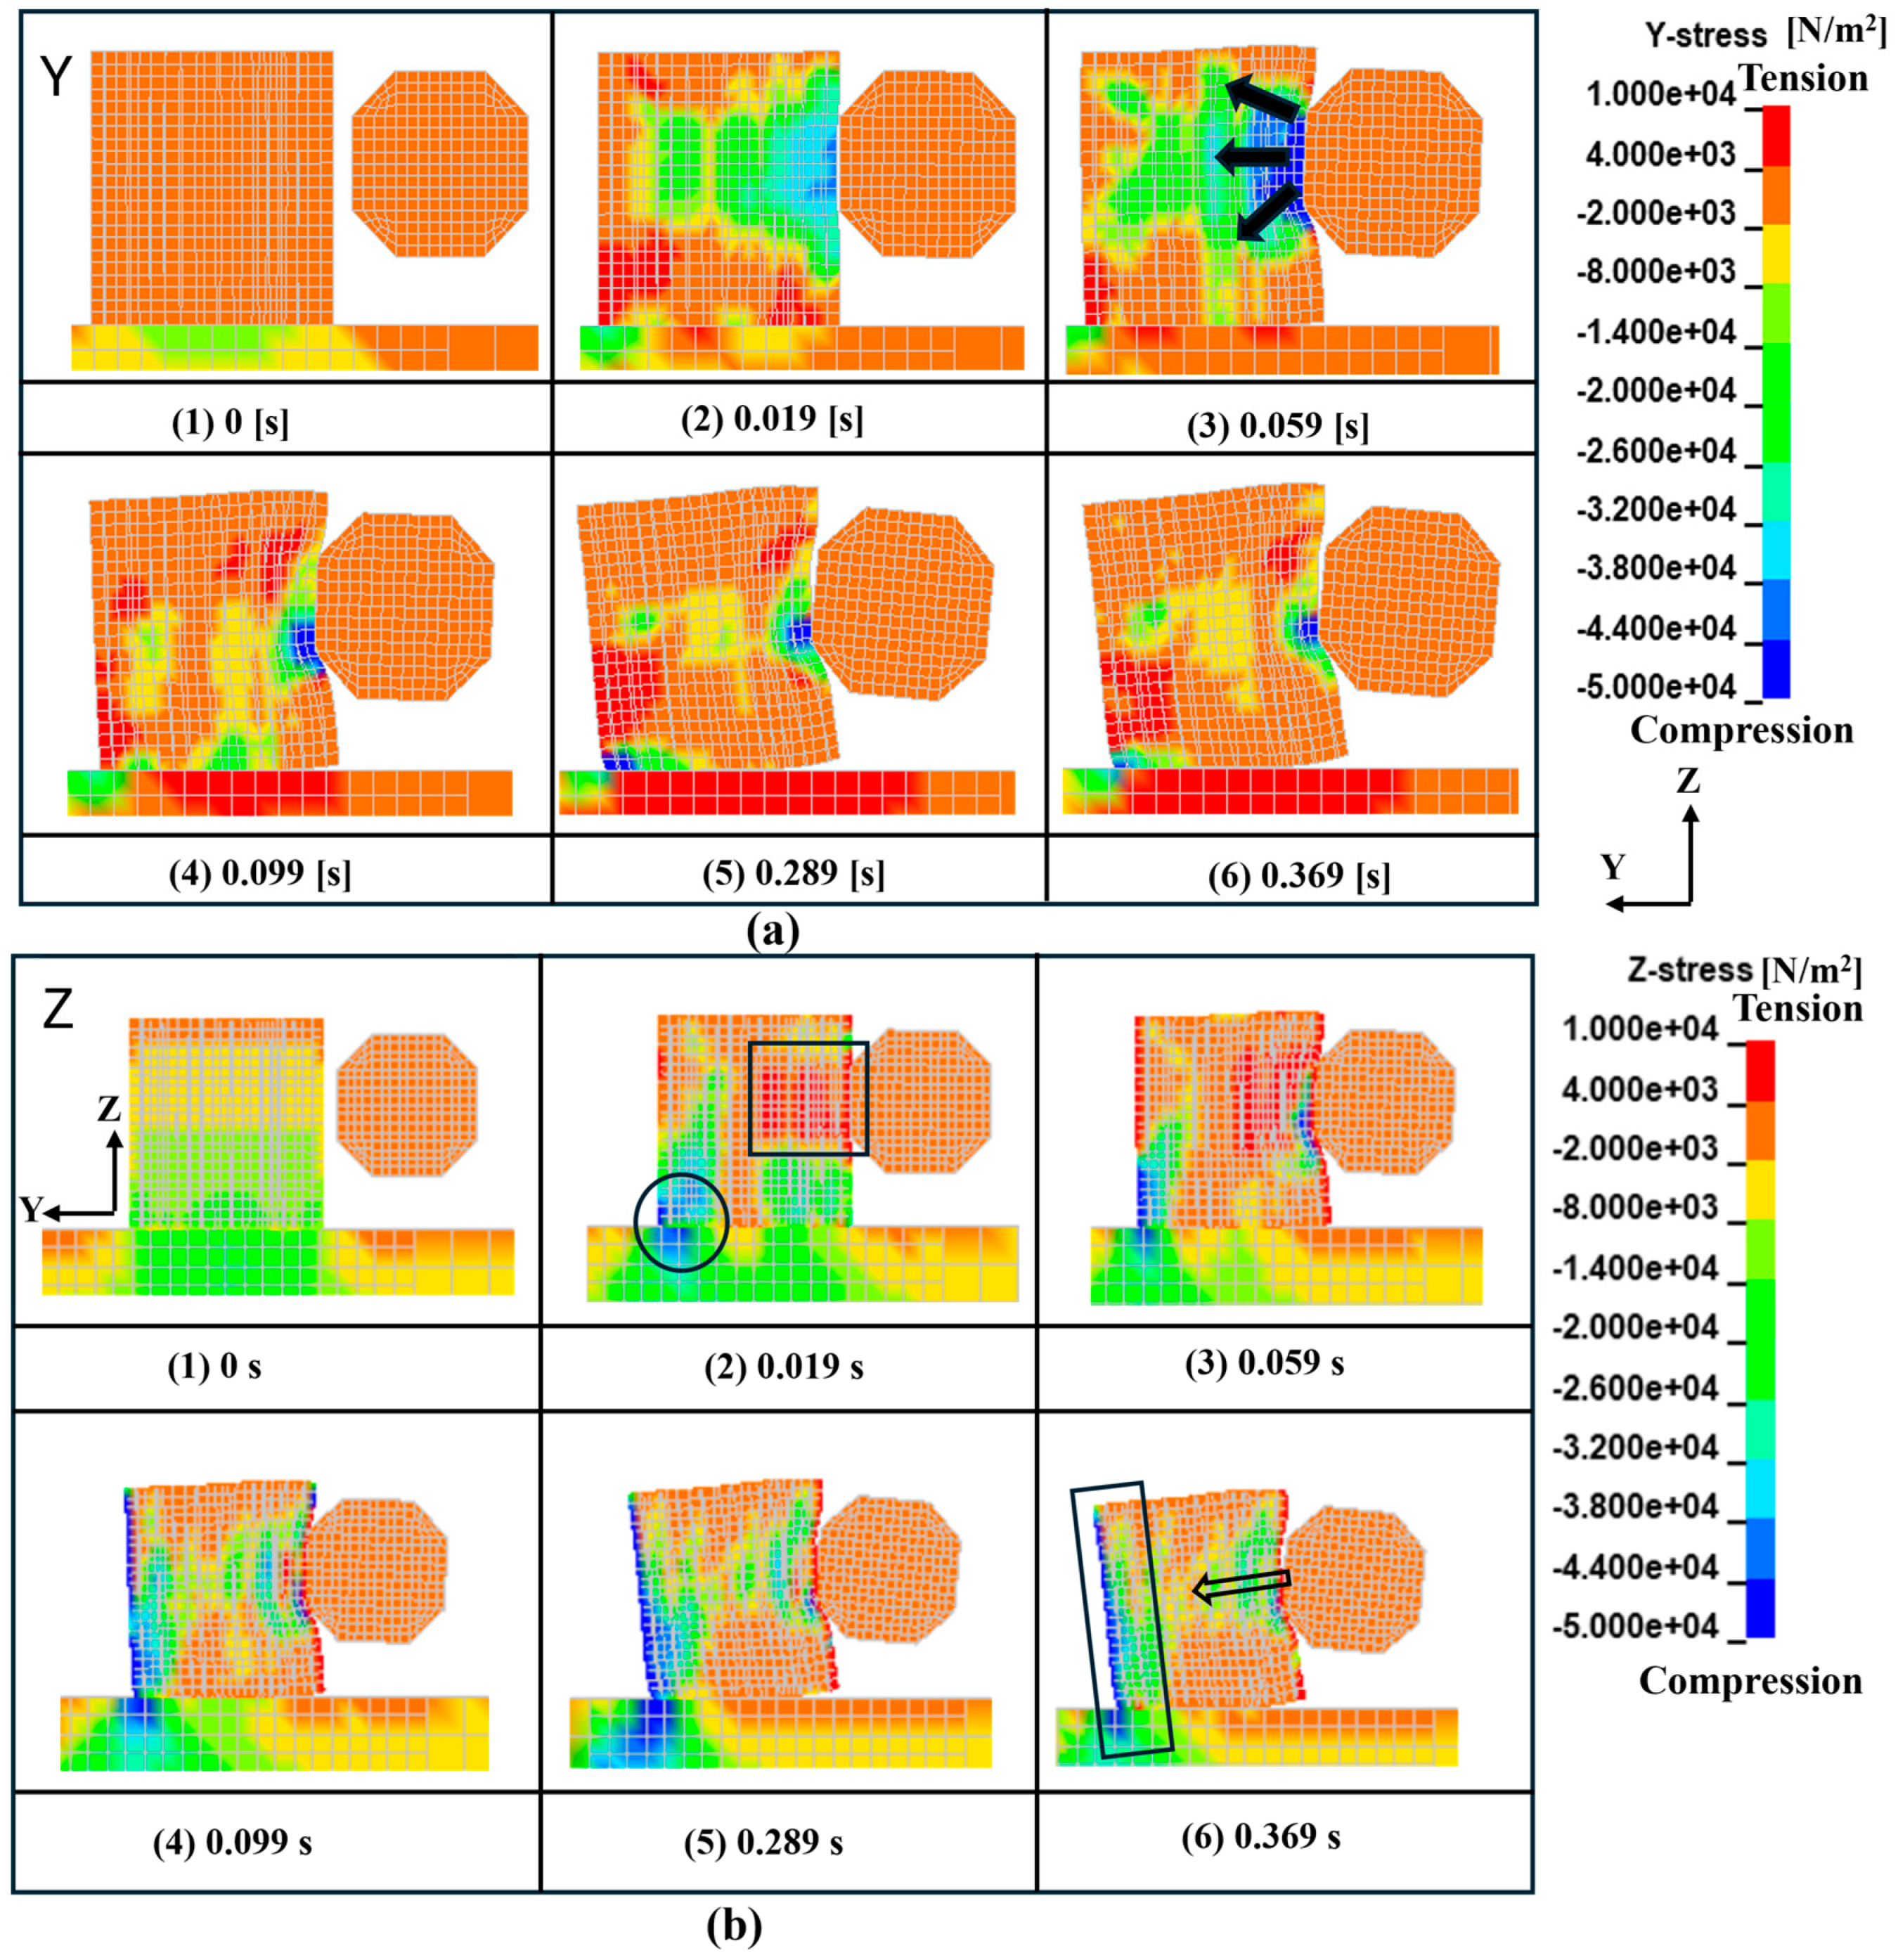
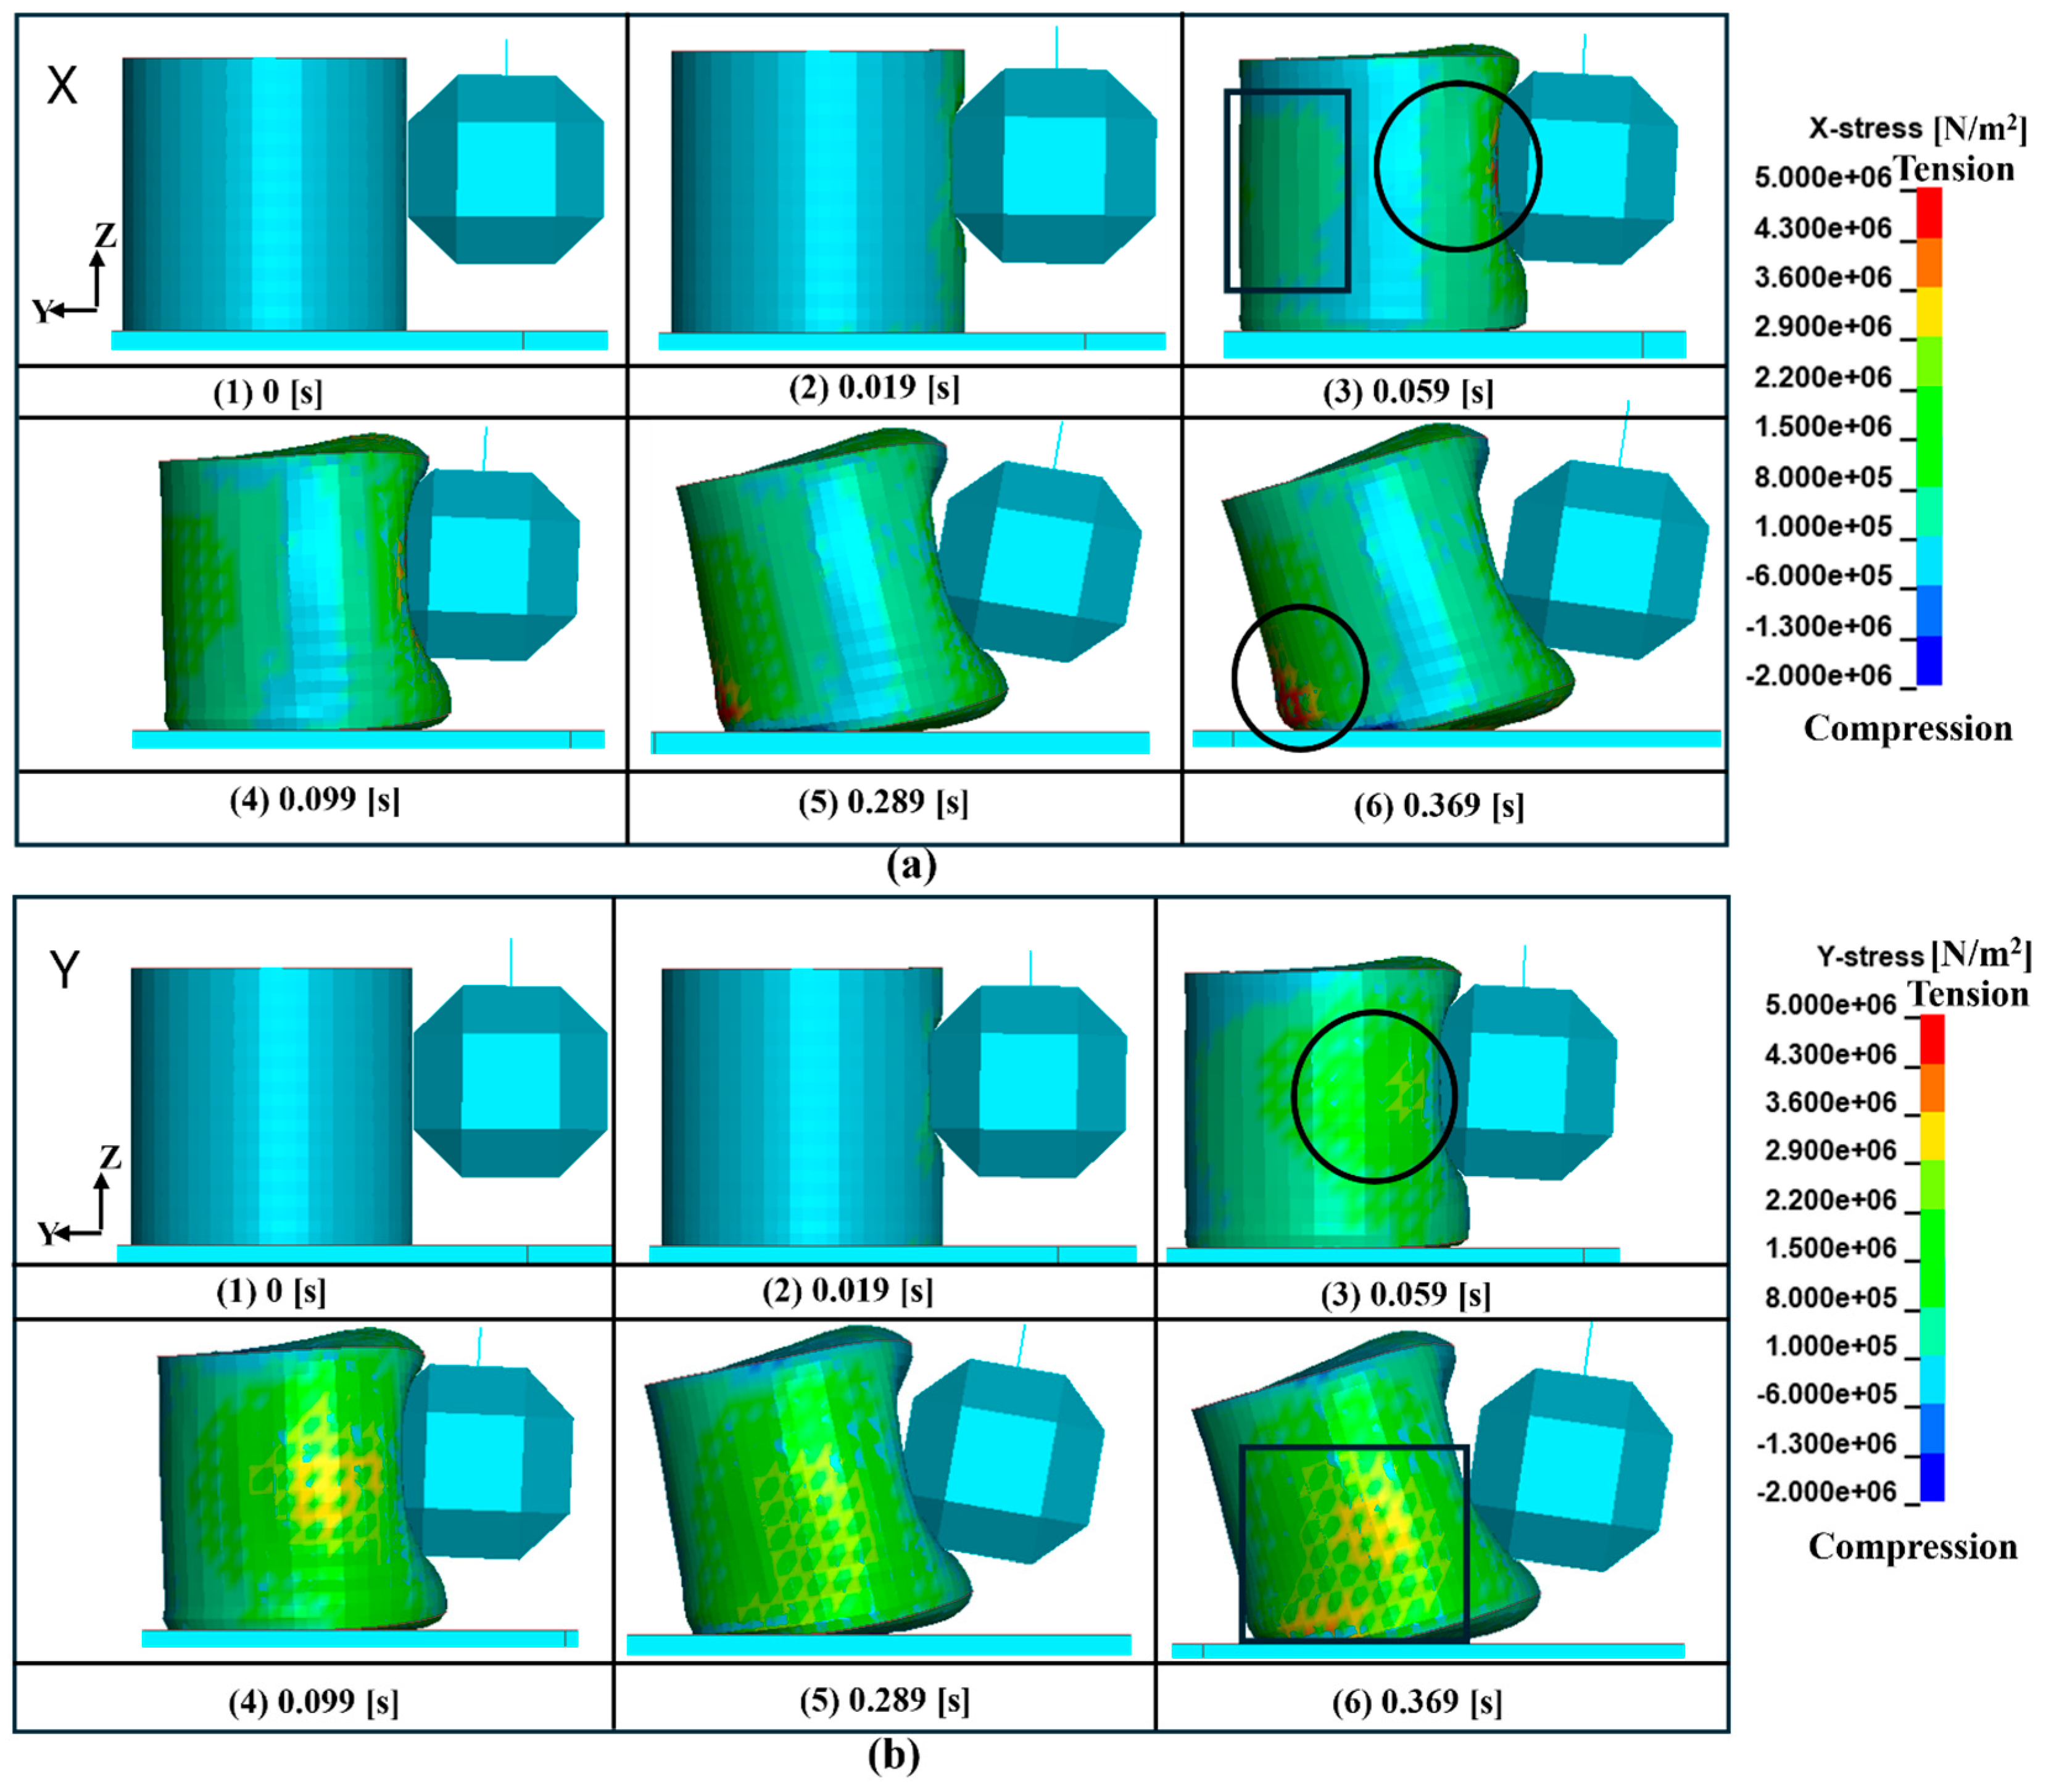
A full simulation of the impact process was carried out numerically using the LS-DYNA code to see how a single large sandbag would absorb the impact of a rockfall. The stress distribution of the sandbag’s infill material was examined by calculating the Y-direction (horizontal) and Z-direction (vertical) stresses. Figure 5 shows the sandbag sectioned along the Y-Z plane at the center of impact. Figure 6 discusses the detailed analyses of stress concentration during five distinct time phases described below. Figure 7 shows the fringe diagram visualizing the stress distribution. Moreover, the distribution of stress acting on the sandbag material (shell elements), in the X and Y directions, was examined as shown in Figure 8. The simulation process is divided into five important time steps, each of which marks an important phase of the impact absorption process. These phases are as follows:
  • Impact phase [t = 0.019 s];
  • Transition phase [t = 0.059 s];
  • Maximum penetration phase [t = 0.099 s];
  • Maximum displacement phase [t = 0.289 s];
  • Impact completion phase [t = 0.369 s].
The Y-direction stresses clearly explain the load-carrying characteristics of the sandbag in the impact direction. The Z-direction stresses, on the other hand, represent the secondary stresses in the sandbag, which act vertically due to gravity. After impact, the impactor acceleration reached its maximum at t = 0.019 s, and compressive stress was generated in the sandbag region underneath the impactor. At this stage, the impactor had just struck the sandbag, and the stresses were localized at the impact point, marking the beginning of the penetration process into the sandbag. The sandbag started moving along the y-axis direction when the impactor’s acceleration started reducing from its peak value towards the end, reaching t = 0.059 s. Consequently, the stress distribution changed from the concentrated form at the surface of impact to the diffuse form at the heel of the sandbag. The change in the stress distribution indicates the redistribution of load in the sand material, which occurs because of inter-particle forces. The maximum penetration of the impactor into the sandbag occurred at t = 0.099 s. From the fringe diagram at this point, it was noted that the compressive stresses were much more pronounced, with the stress distribution shifting mostly towards the heel of the sandbag. At the same time, the compressive stresses were noted at the subsoil at the heel side of the sandbag base, showing the gradual shift in the load from the surface of the impacted sandbag through the sand fill and into the ground.
The acceleration of the impactor continued to decrease steadily from 0.099 s to 0.289 s, during which the sandbag continued moving, reaching the maximum distance at 0.289 s. The compressive stress in the sandbag propagates at this time, dispersing in the ground at the heel of the sandbag. The above observation shows the reduction in the kinetic energy, which is expected because of the gradual compaction of the sand, creating pressure on the ground.
The velocity of the impactor became zero at t = 0.369 (s), which indicated that the impact was complete. The stress contours at this point indicated that the level of stress was generally lower throughout the sandbag, which was consistent with the depletion of the impactor’s kinetic energy. The stress state in the ground continued with its residual distribution, which indicated that the substrate was permanently deformed.
In the case of the bag material, when the impactor’s acceleration reached its peak at t = 0.019 (s), the stresses in the X and Y directions are still very small. At t = 0.059 (s), the sandbag started moving with the development of tensile stresses on the impact face and sides of the bag due to the moving filling material. At t = 0.099 (s), which is the time when the penetration was at its peak, the stress started moving slowly towards the heel side of the bag. At t = 0.289 (s), when the sandbag was at its maximum displacement due to the impact, the tensile stresses were at their peak at the heel area of the bag due to the bag being held in place by ground friction. This remained the same until t = 0.369 (s), when the speed of the impactor was getting close to zero. This indicated that the bag material at the heel was the key factor that restricted the movement of the sandbag by the mobilization of the ground and the bag itself by frictional forces.

4.3. Energy Absorption Mechanism of Sandbag

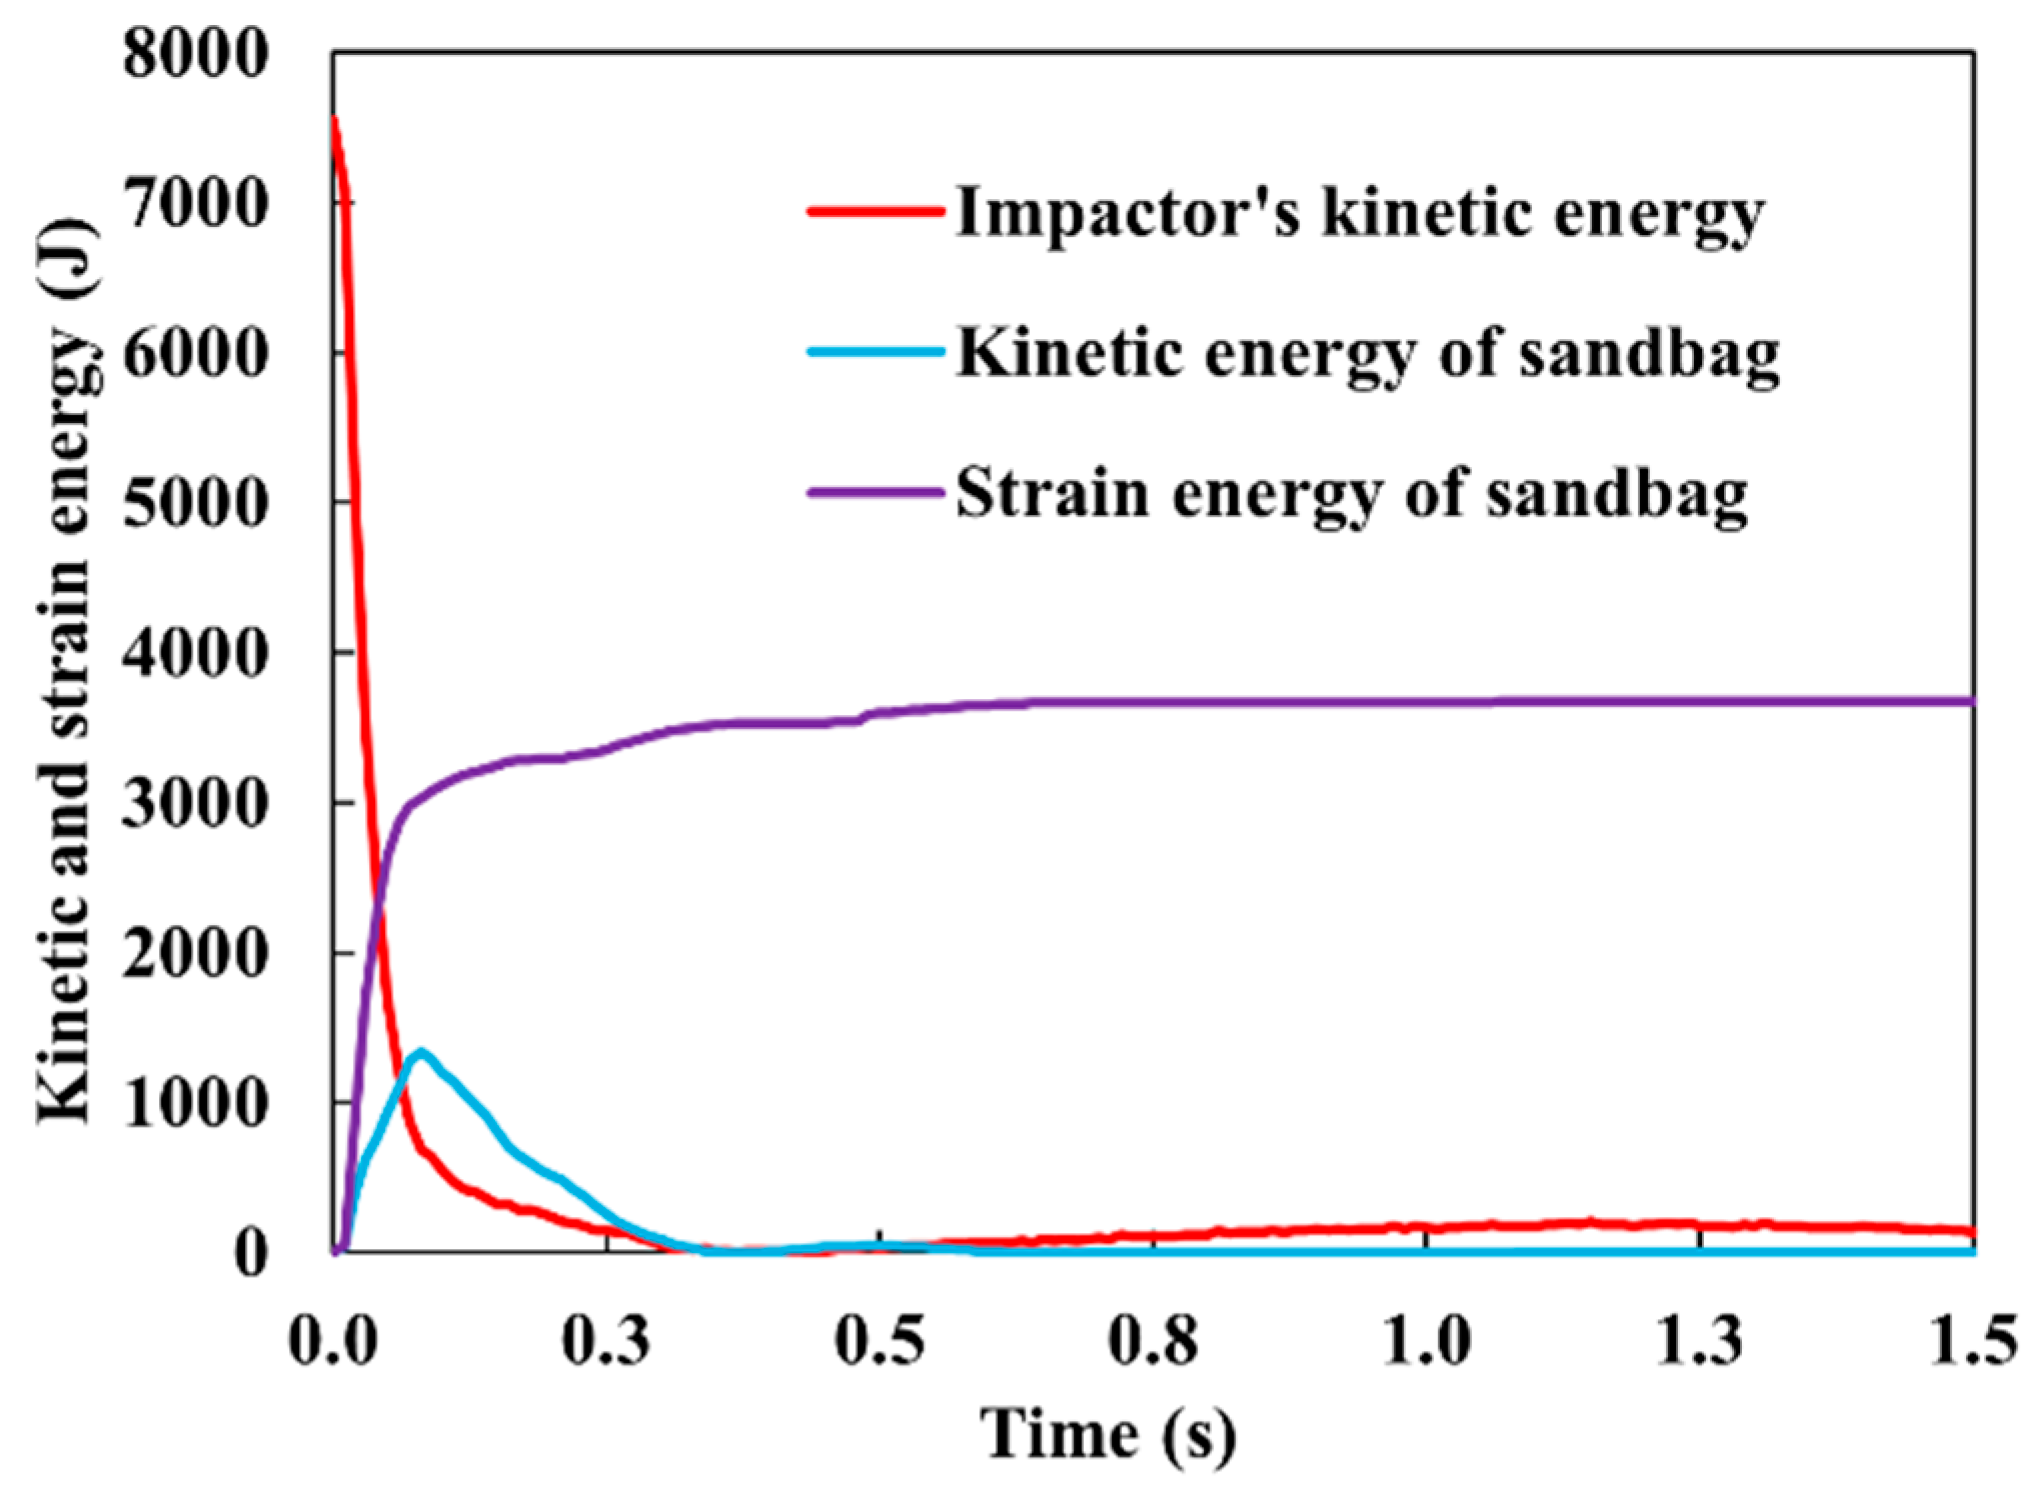
To confirm the energy balance of the sandbag during impact, the impactor’s kinetic energy, the sandbag’s strain energy, and the sandbag’s kinetic energy, all derived from the simulation results, were evaluated. The results are presented in Figure 9 and Table 4. The kinetic energy (E) of the impactor at an impact velocity of 4.34 m/s was calculated as 7553.52 (J). As shown in Figure 9, when the impactor hits the sandbag, it then undergoes deformation and strain energy (Eε) increases rapidly. The sandbag’s kinetic energy (Ev) is maximum near the end of the penetration, and then it decreases as energy is converted into strain energy (Eε) and lost through contact with the ground.
From Table 4, the sandbag’s energy absorption rate at the time when penetration ended was approximately 57.80%, while the absorption rate when the impactor velocity first reached zero decreased to approximately 46.7%. This reduction is attributed to the fact that a portion of the sandbag’s kinetic energy (Ev) was not dissipated through its own internal deformation, but rather transferred to surrounding objects such as the ground, resulting in a lower net energy absorption rate compared to that recorded at the end of penetration.

5. Prediction Analysis Through Validated Model

After the numerical model is validated based on the experimental results, the model is then employed for the study of the effect of sand density, drop height, and velocity of impactor, and the increased number of sandbags. These parameters were selected to investigate the mechanical response and efficiency of sandbags subjected to impact loading. The influence of each parameter is discussed in detail in the following subsections.

5.1. Influence of Sand Density

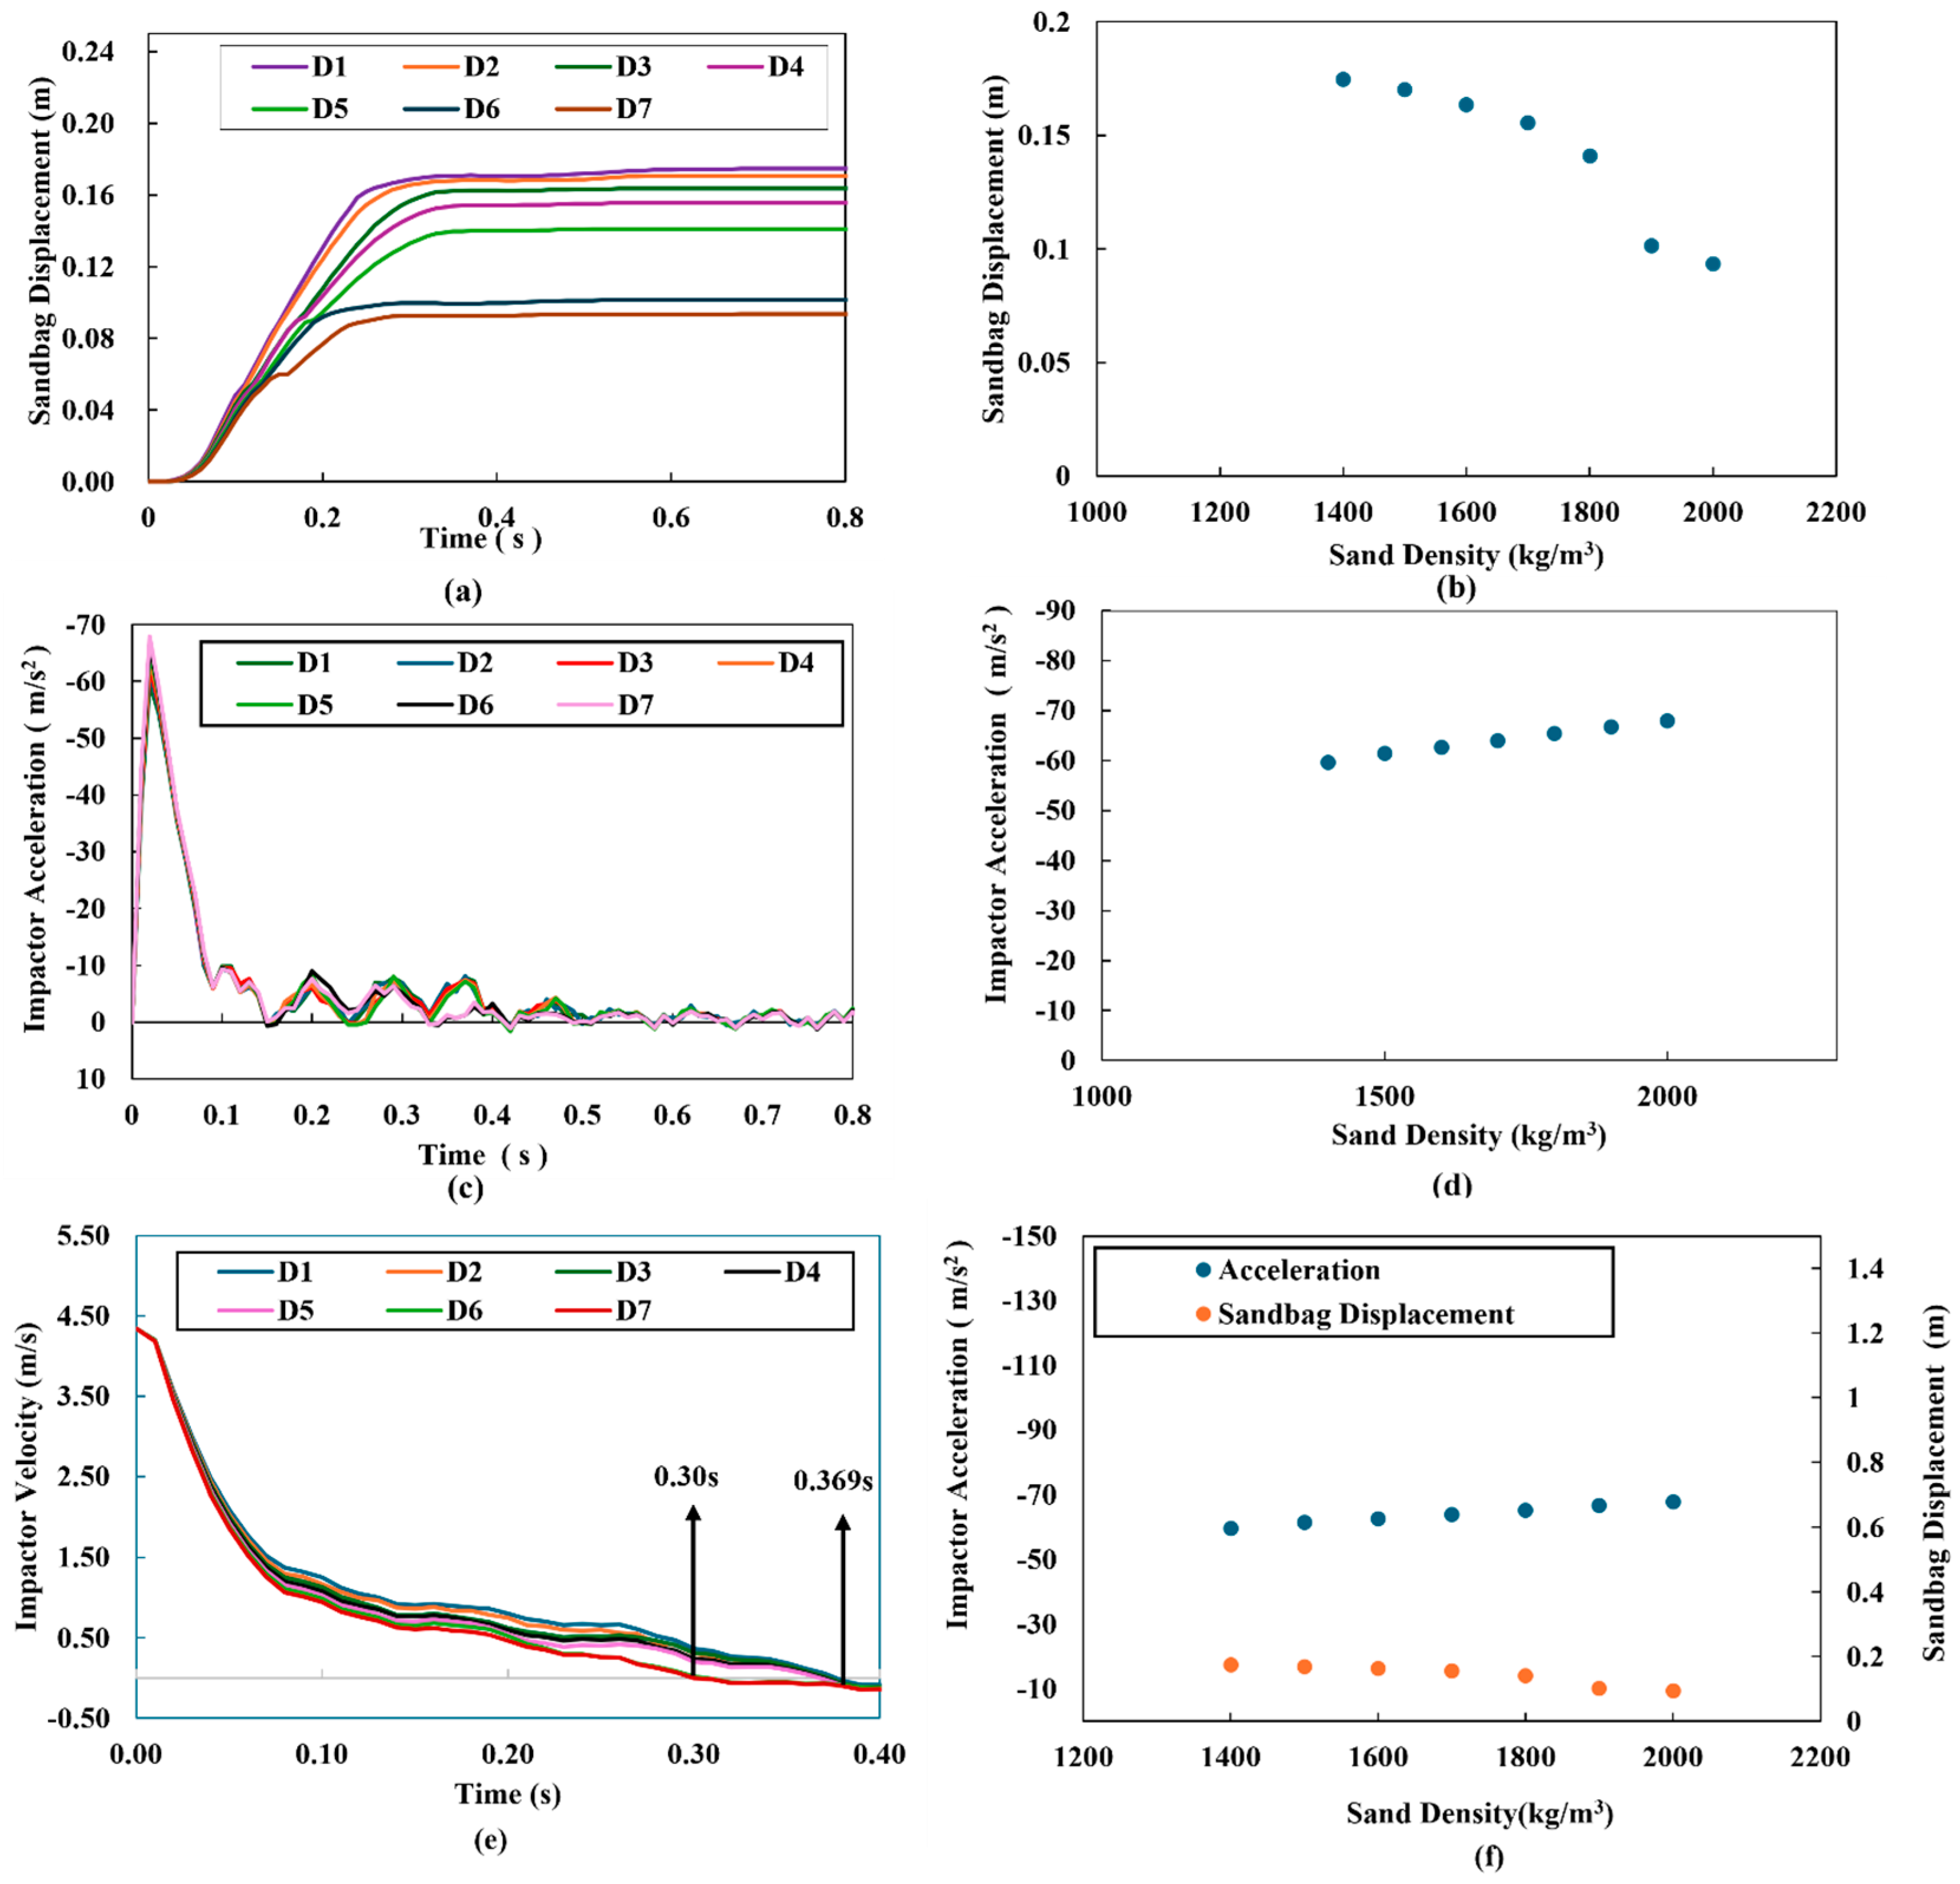
During high-velocity impacts, the sandbag’s ability to resist deformation and absorb energy is largely controlled by the inertial mass of the granular fill (sand). Based on Newton’s second law, for the given constant volume of the sand and constant velocity, if the density changes, it would affect the amount of momentum that the sandbag would be able to absorb. In the real world, the density may vary greatly depending on the amount of moisture content, compaction, and the size of the grains. Therefore, it is necessary to investigate the effect of varying density during impact. A parametric study was, therefore, carried out by varying the density of sand from 1400 kg/m3 to 2000 kg/m3, incrementing the values for each case by 100 kg/m3, while all other material parameters were kept constant. Case D2 (ρ = 1500 kg/m3) is the same as the reproduced model; therefore, it was selected as the reference. The details of these cases are summarized in Table 5.
To comprehend the complete response of the sandbag to the impact, the key parameters of the response were considered in the simulation as follows: (i) the lateral displacement of the sandbag over time, (ii) the acceleration of the impactor over time, and (iii) the velocity of the impactor over time. It can be seen from the simulation results that as the density of the sand increases, the lateral displacement of the sandbag decreases. This is due to the increased inertial resistance and stiffness of the sand as the density increases. On the other hand, with the increase in sand density, the acceleration is also increased. The velocity versus time responses further confirm that higher-density sandbags stop the impactor more quickly, leading to a shorter and more abrupt energy absorption process (as shown in Figure 10). In contrast, lower-density sandbags absorb energy more gradually over a longer period and larger deformation.

Energy Absorption Mechanism

In all seven density cases, the initial kinetic energy of the impactor remains constant at 7553.52 J, since the impact velocity is the same in every case. The calculated energy absorption rate based on the sandbag’s strain and kinetic energy relative to the initial impact energy ranges from 65.15% to 67.00%. Examining the energy components like strain energy (Eε) and kinetic energy (Ev), the data shows a slight increase in strain energy and a decrease in kinetic energy as density increases. As shown in Table 6, the strain energy (Eε) increases from 3672.78 J at D2 to 3861.92 J at D7. This suggests that denser sand undergoes more internal deformation. However, the data show a decrease in kinetic energy of the sandbag (Ev) with increasing density. The kinetic energy decreases from 1380.38 J at D1 to 1146.79 J at D7, which reflects the less displacement of the stiffer, denser sandbag.

5.2. Influence of Drop Height of Impactor

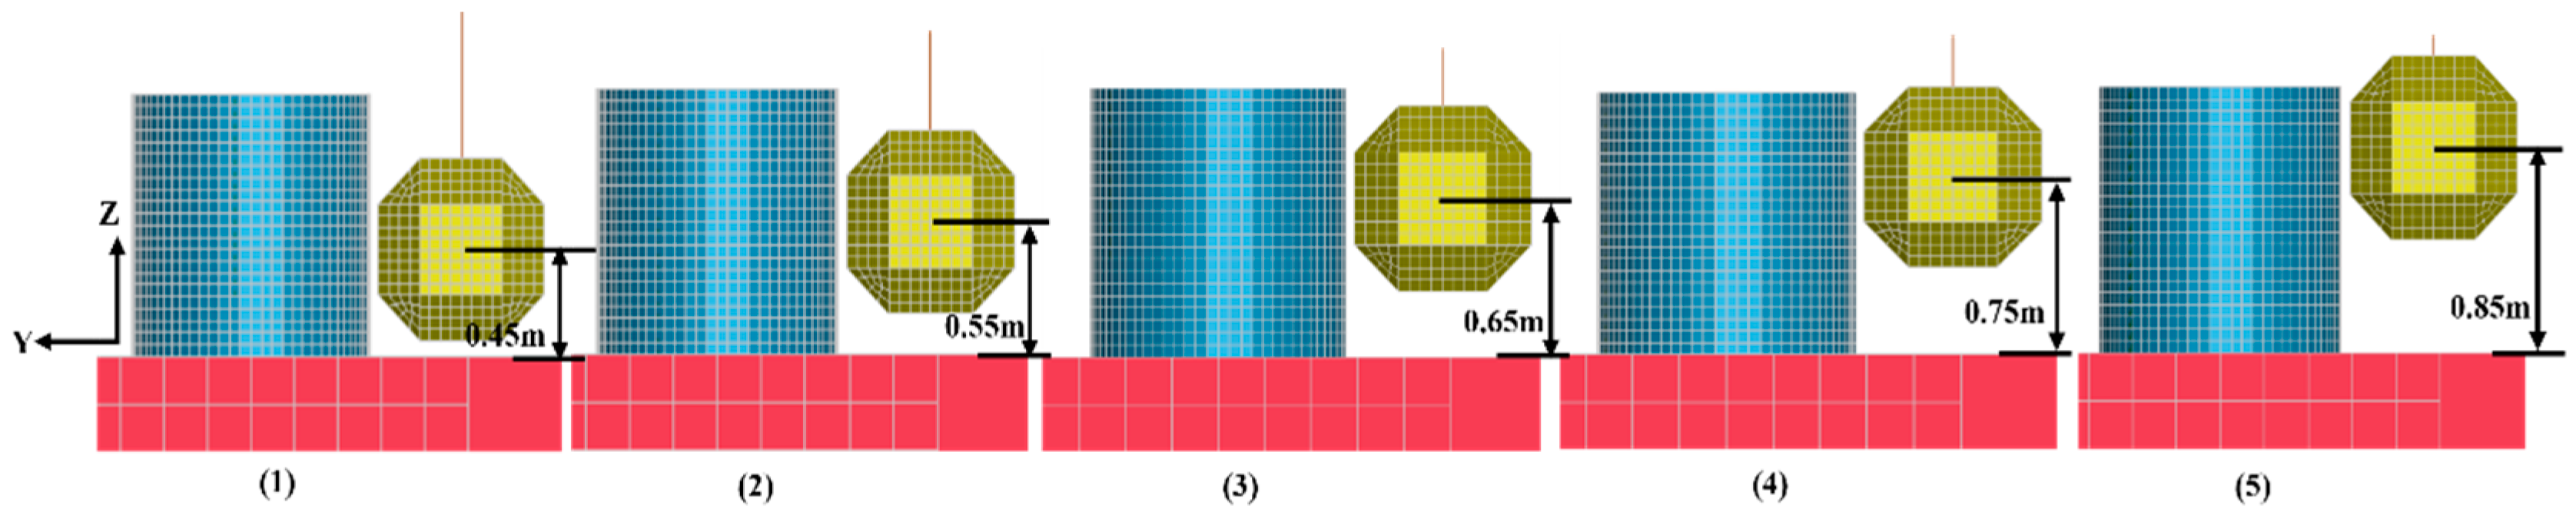
In the real-world scenario, the exact impact point on the barrier is not known. For this reason, the effect of varying drop heights has been analyzed using five cases. The drop heights ranged from 0.45 m to 0.85 m, increasing each value by 0.1 m as shown in Figure 11. The details of the cases are described in Table 7. Case H3 = 0.65 m, same as the reproduced model discussed in the previous section; therefore, it is considered the reference case.
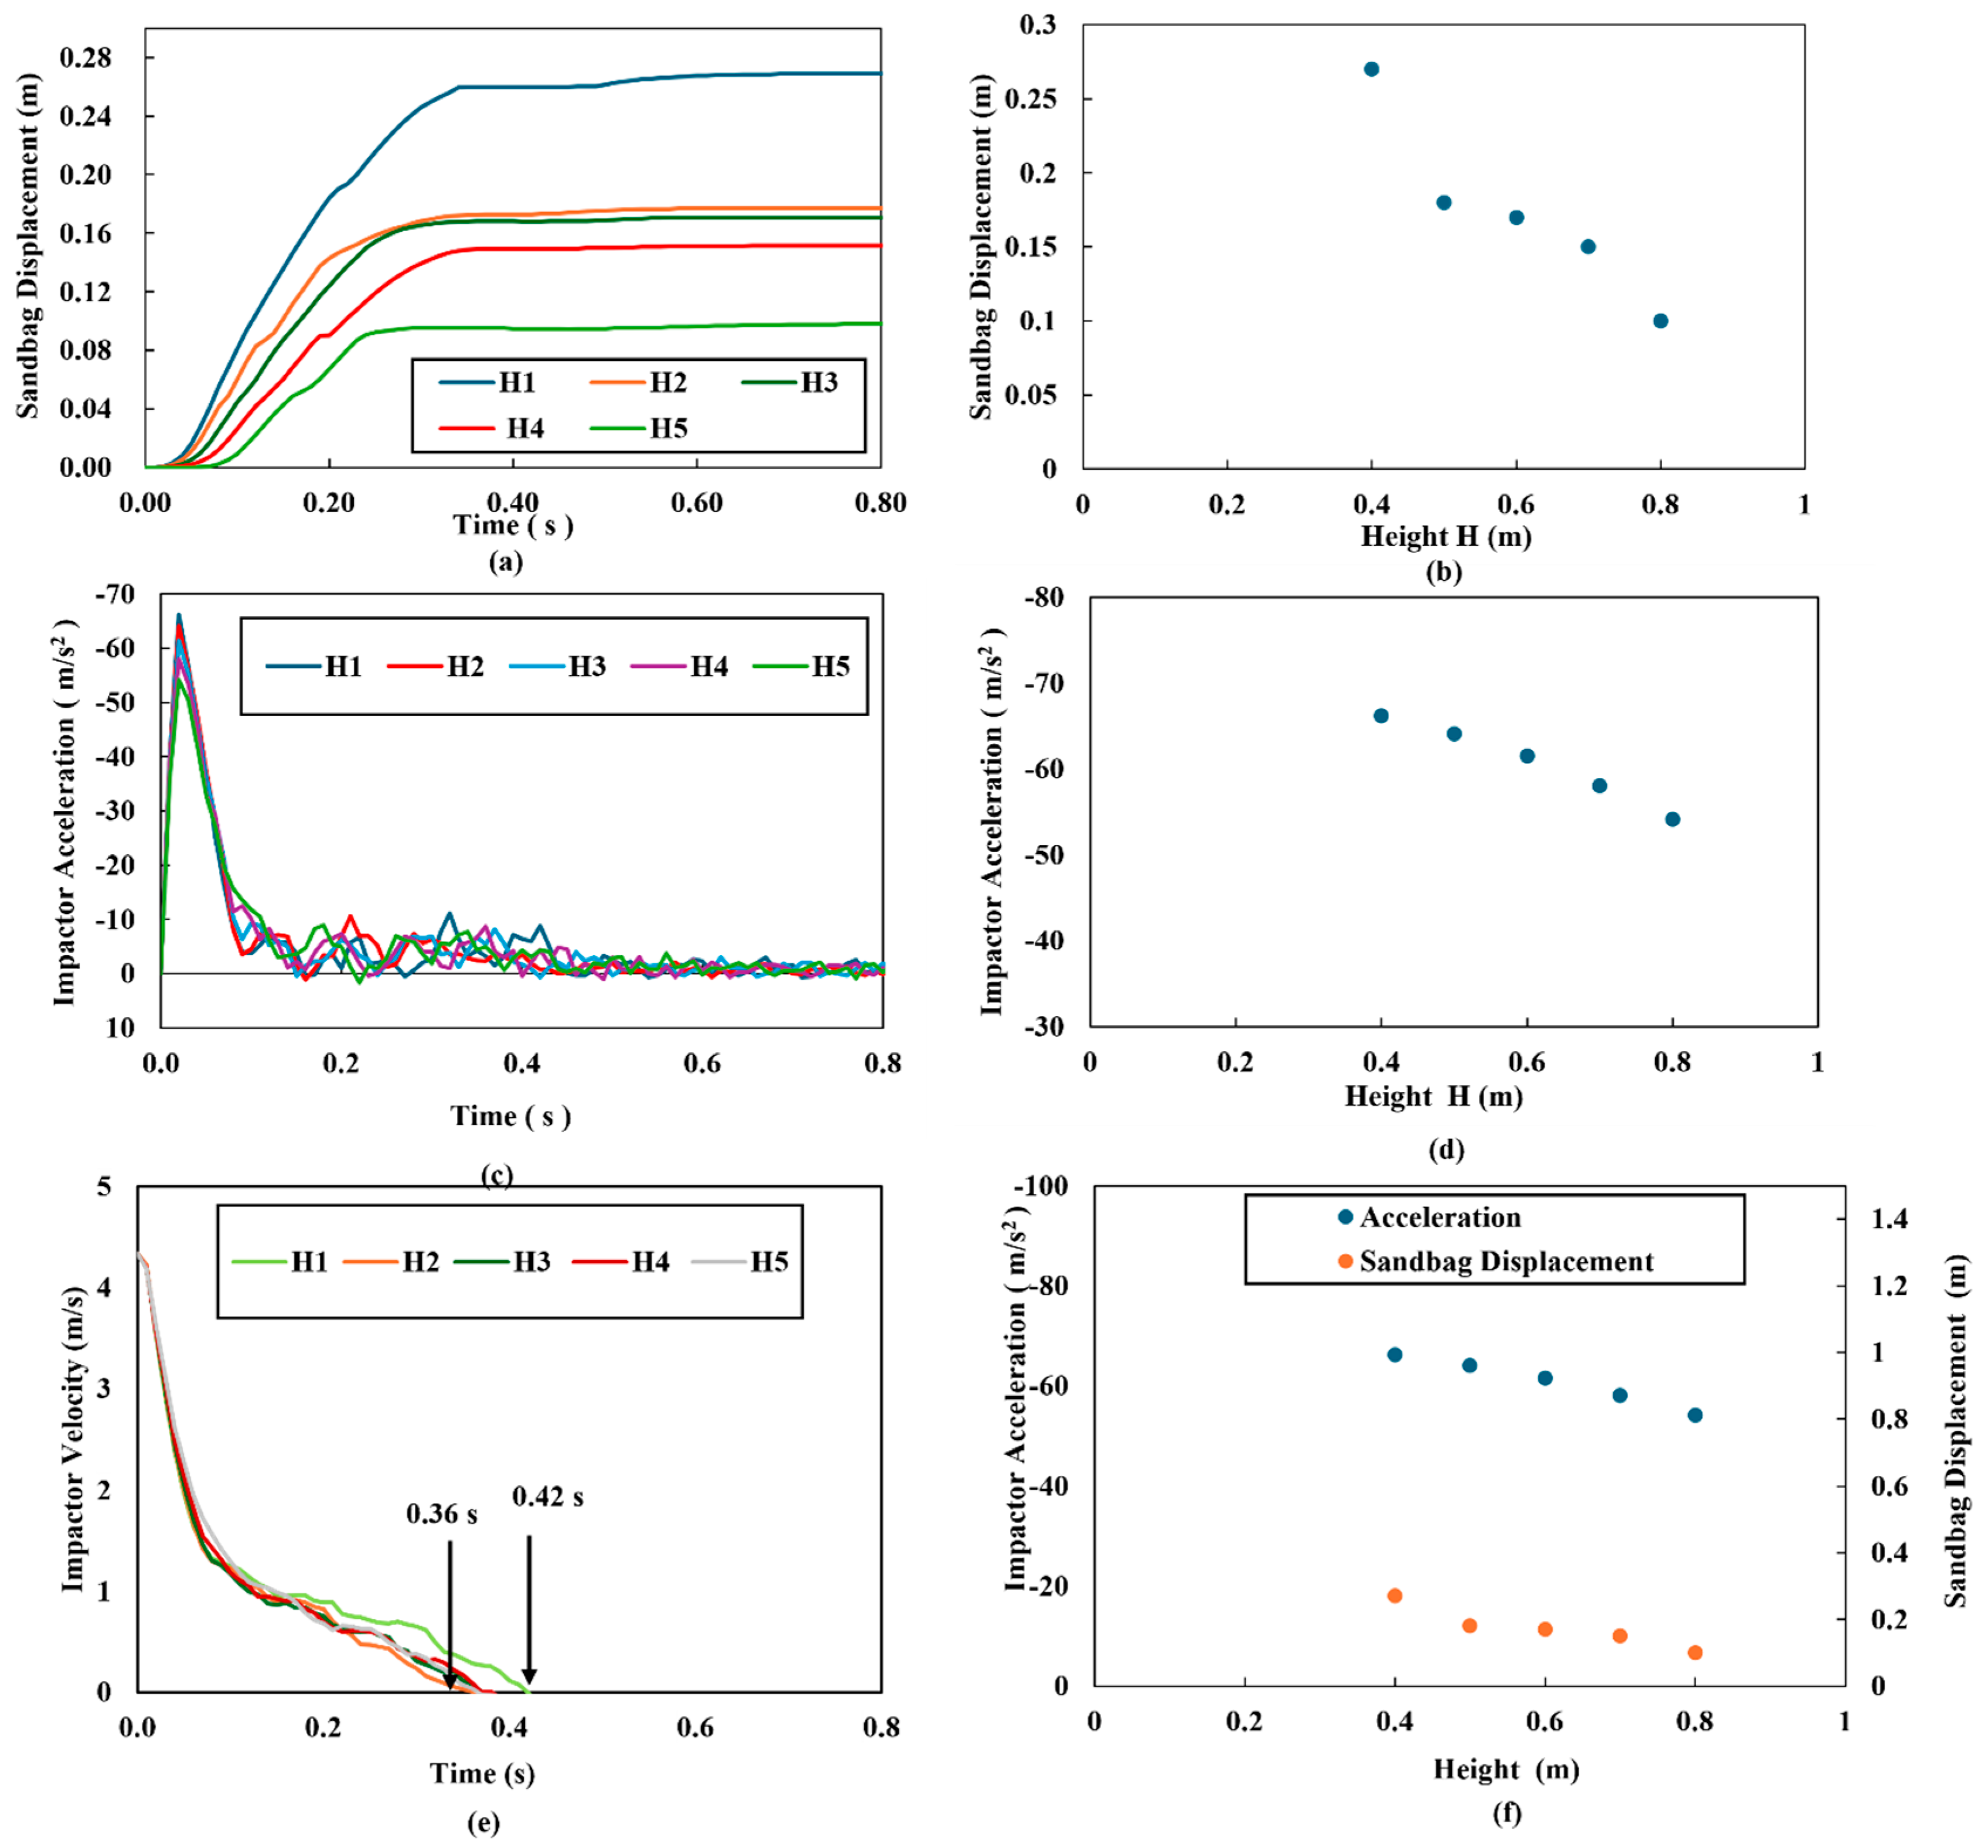
The results presented in Figure 12 show that the behavior of the sandbag is strongly affected by varying drop heights. Impacts closer to the top portion of the sandbag generally lead to smaller displacement and acceleration compared to impacts near the lower section of the sandbag. This is due to the reason that when the impactor hits the sandbag at the lower section, its ability to rotate reduces, and the stress is concentrated inside the sandbag near the base that is ground (constrained). Moreover, energy dissipation in sand occurs via particle-particle interaction, their friction, and compaction. In case of impact near the lower section of the sandbag, the surrounding sand is more confined by ground pressure and lateral soil resistance, making the sand locally stiffer, which results in large values of displacement and acceleration.
However, when the impactor hits the top portion of the sandbag horizontally, the sandbag acts like a cantilever beam. The stress wave must traverse a greater depth of sand before reaching the immovable ground. Hence, its travel distance is increased; therefore, energy is absorbed gradually by the sandbag. It then lowers the values of displacement and acceleration during impact.
In addition, the velocity-time response of the impactor is also influenced by the drop height. Lower impact heights lead to greater velocity retention and a longer interaction period with the sandbag. Overall, these findings highlight that the location of impact plays a significant role in the performance of the sandbag.

Energy Absorption Mechanism

The energy dissipation mechanism of the sandbag when subjected to varying impact positions is studied. The initial kinetic energy (E) of the impactor shows minor fluctuations, ranging from 7538.96 J at H5 = 0.85 m to 7568.08 J at H = 0.45 m. The strain energy (Eε) is dissipated by internal deformation of the filling material (sand), and kinetic energy (Ev) is dissipated through the displacement of the sandbag. As illustrated in Table 8, the strain energy (Eε) exhibits a consistent increase as the drop height increases, starting at 3485.74 J when H1 = 0.45 m and reaching 3955.33 J at H5 = 0.85 m. This shows that higher impact points result in more significant internal deformation as the stress wave must travel across the filling material (sand). On the other hand, the kinetic energy of the sandbag (Ev) decreases continuously, from 1404 J at H1 = 0.45 m to 1280.78 J at H5 = 0.85 m. This decrease indicates that at higher impact points, the overall displacement of the sandbag is reduced. This result is consistent with the trends discussed in the previous section.

5.3. Influence of Velocity of Impactor

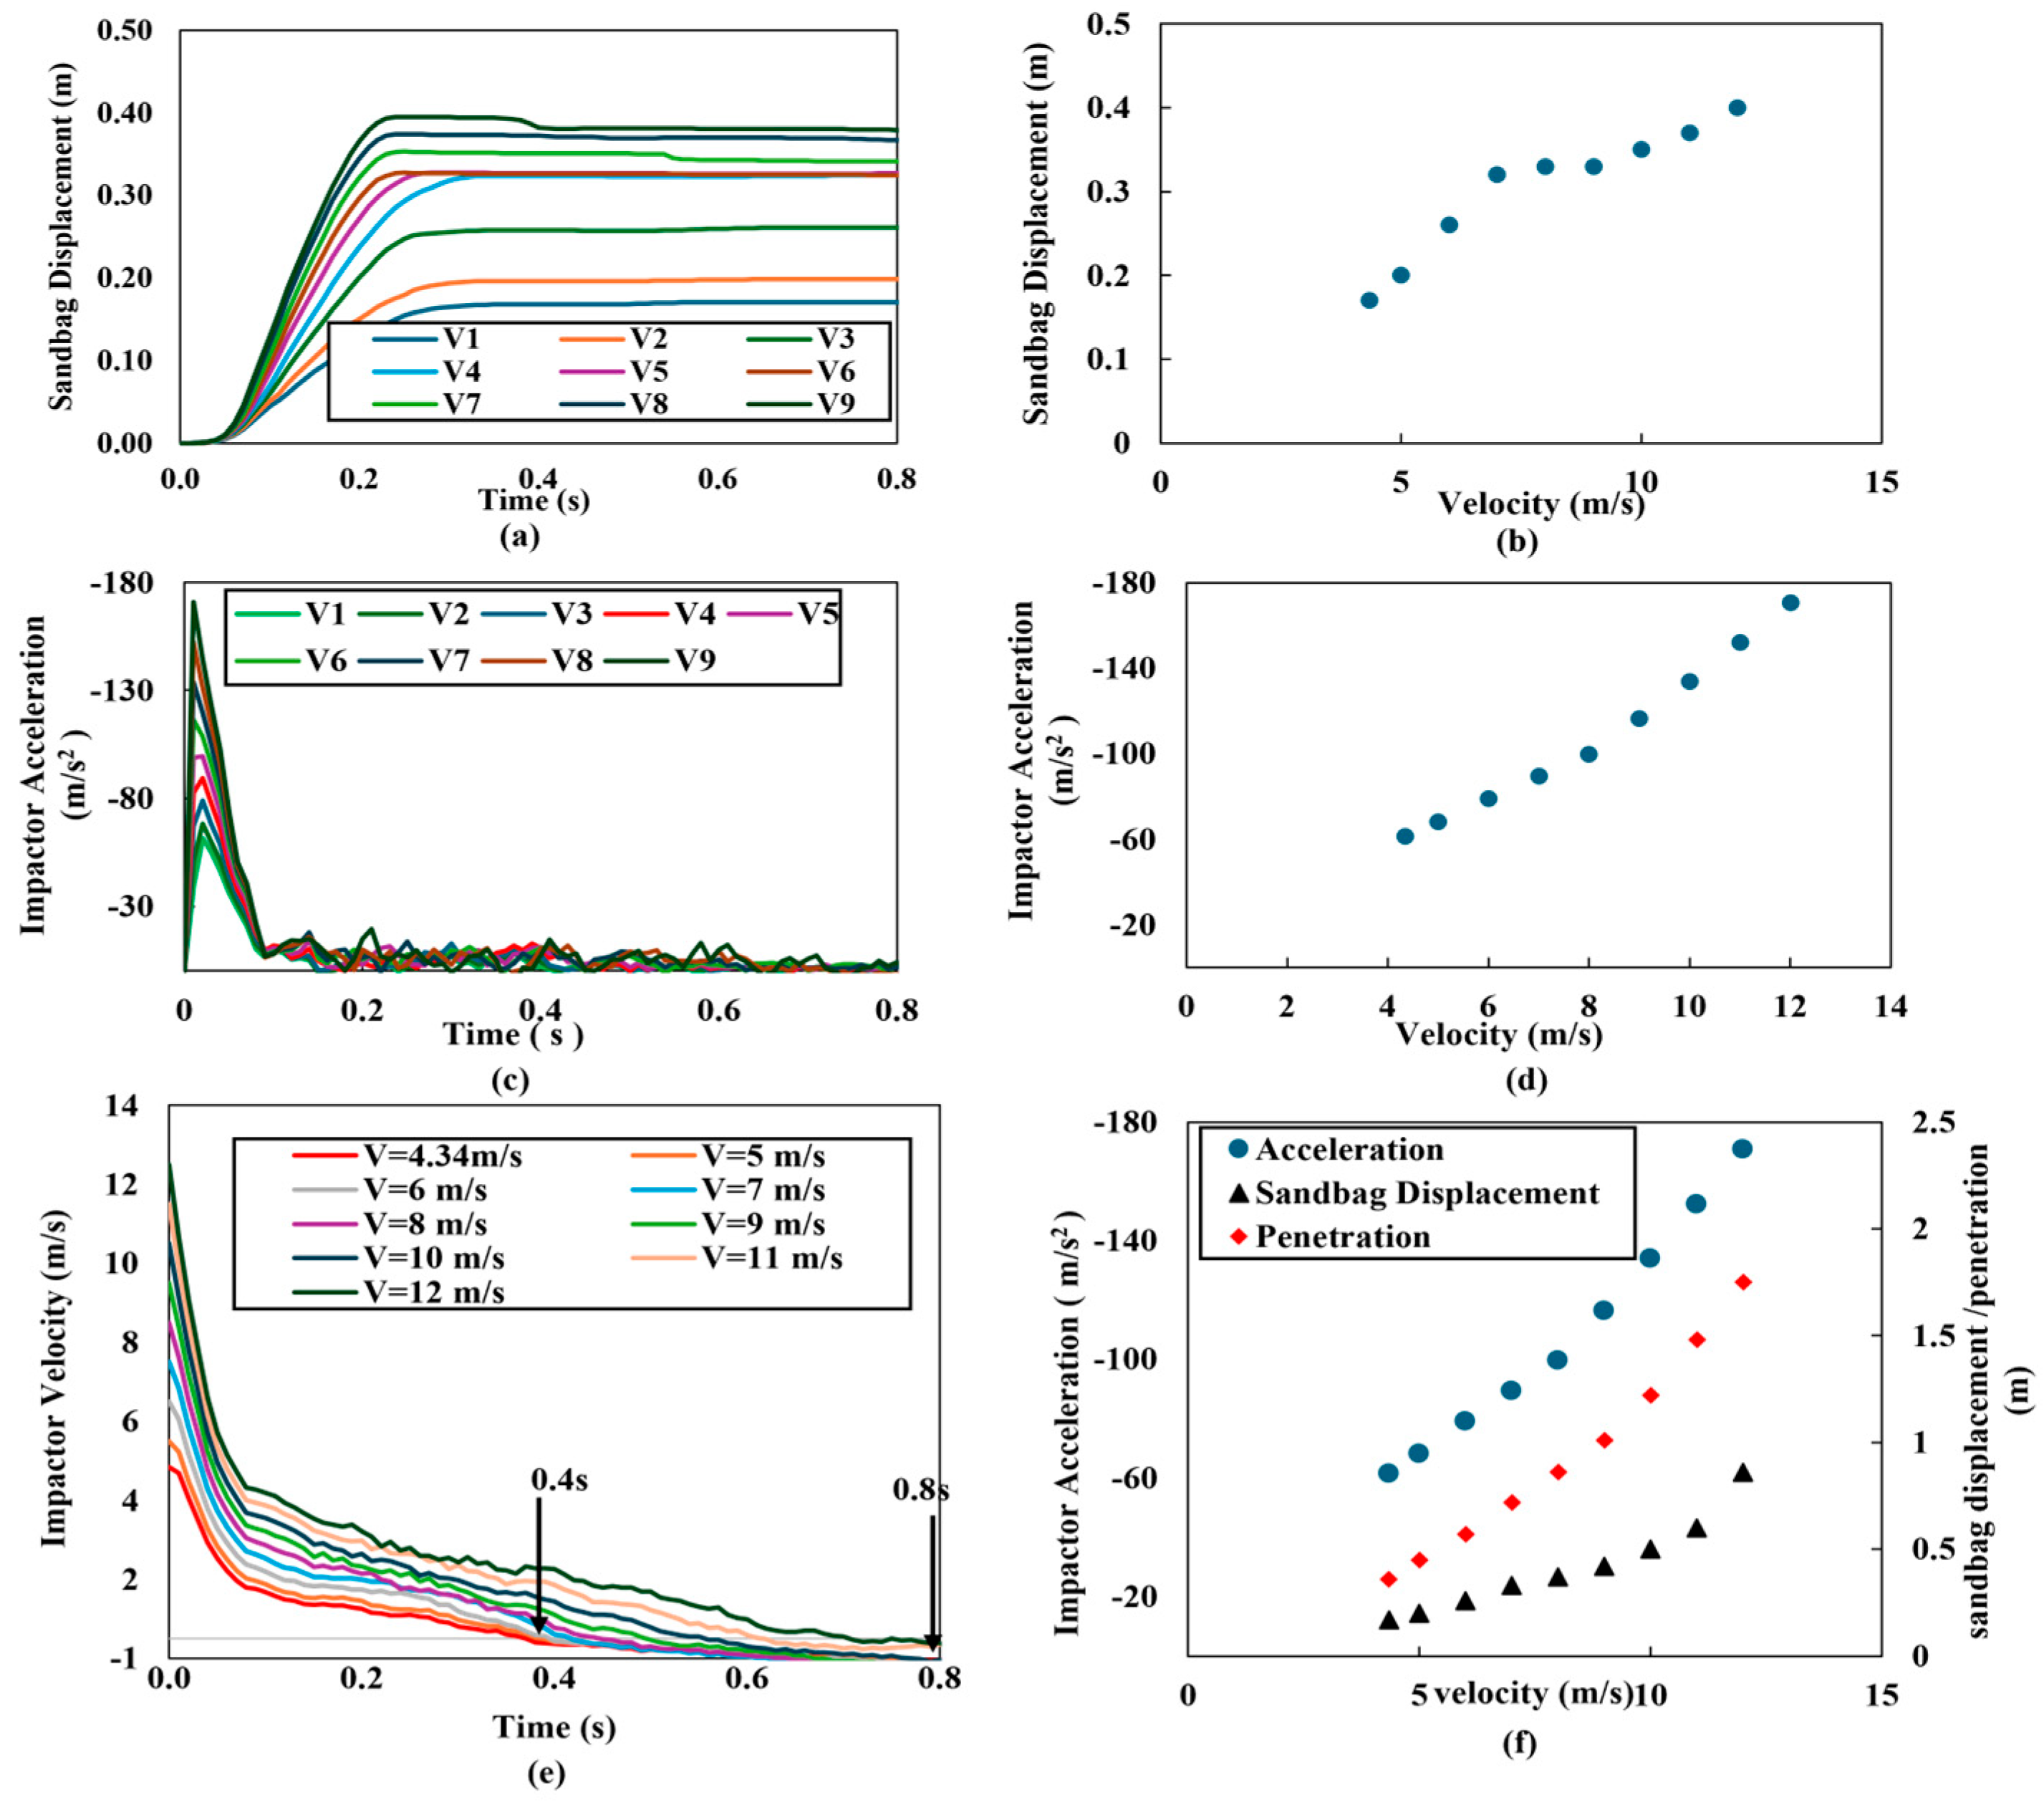
The initial velocity of the impactor plays a critical role in quantifying the behavior of the sandbag barrier when it is subject to rockfall impact force. In this study, the analysis was carried out to examine the effect of different impact velocities, ranging from 4.34 m/s to 12 m/s, on the sandbag’s displacement, the impactor’s acceleration, and its velocity over time during the impact event. The details of the cases are presented in Table 9. The results presented in Figure 13 show a clear trend, as the initial velocity increases, both the maximum displacement of the sandbag and the peak acceleration of the impactor increase. Since an increase in impact velocity leads to higher inter-particle rearrangement and friction between the grains, generating stronger stress waves within the material. Moreover, upon high velocity impact, instead of collapsing, the sand absorbs energy through plastic deformation and granular flow. In addition, the velocity versus time curves indicate that higher initial velocities lead to longer impact durations. The impactor motion slows down before coming to rest, suggesting that the sandbag is absorbing a greater amount of energy. These findings emphasize that impactor velocity is a critical factor in design. As a result, sandbag barriers should be designed with sufficient mass and thickness to safely withstand the range of rockfall velocities expected in the field.

Energy Absorption Mechanism

The energy absorption process of the sandbag is examined with respect to increasing velocities, varying from 4.34 m/s to 12 m/s. The sandbag dissipates the impactor’s kinetic energy through strain and kinetic energy. The strain energy () is dissipated by internal deformation of the filling material (sand), and kinetic energy (Ev) is dissipated through the displacement of the sandbag. As shown in Table 10, the increase in impactor velocity causes a progressive increase in strain and kinetic energy of the sandbag. Despite the significant increase in impactor kinetic energy, from 7553.52 J to 57,747.42 J, the sandbag shows a stable energy absorption rate between 64.51% and 67.60% across all velocities examined. However, the sandbag collapses between velocities 10 and 11 m/s, suggesting a threshold value for the single sandbag. Consequently, indicating the significance of velocity as a key determinant, influencing not only the extent of energy absorption but also the failure limit of the sandbag.

6. Influence of Number of Sandbags

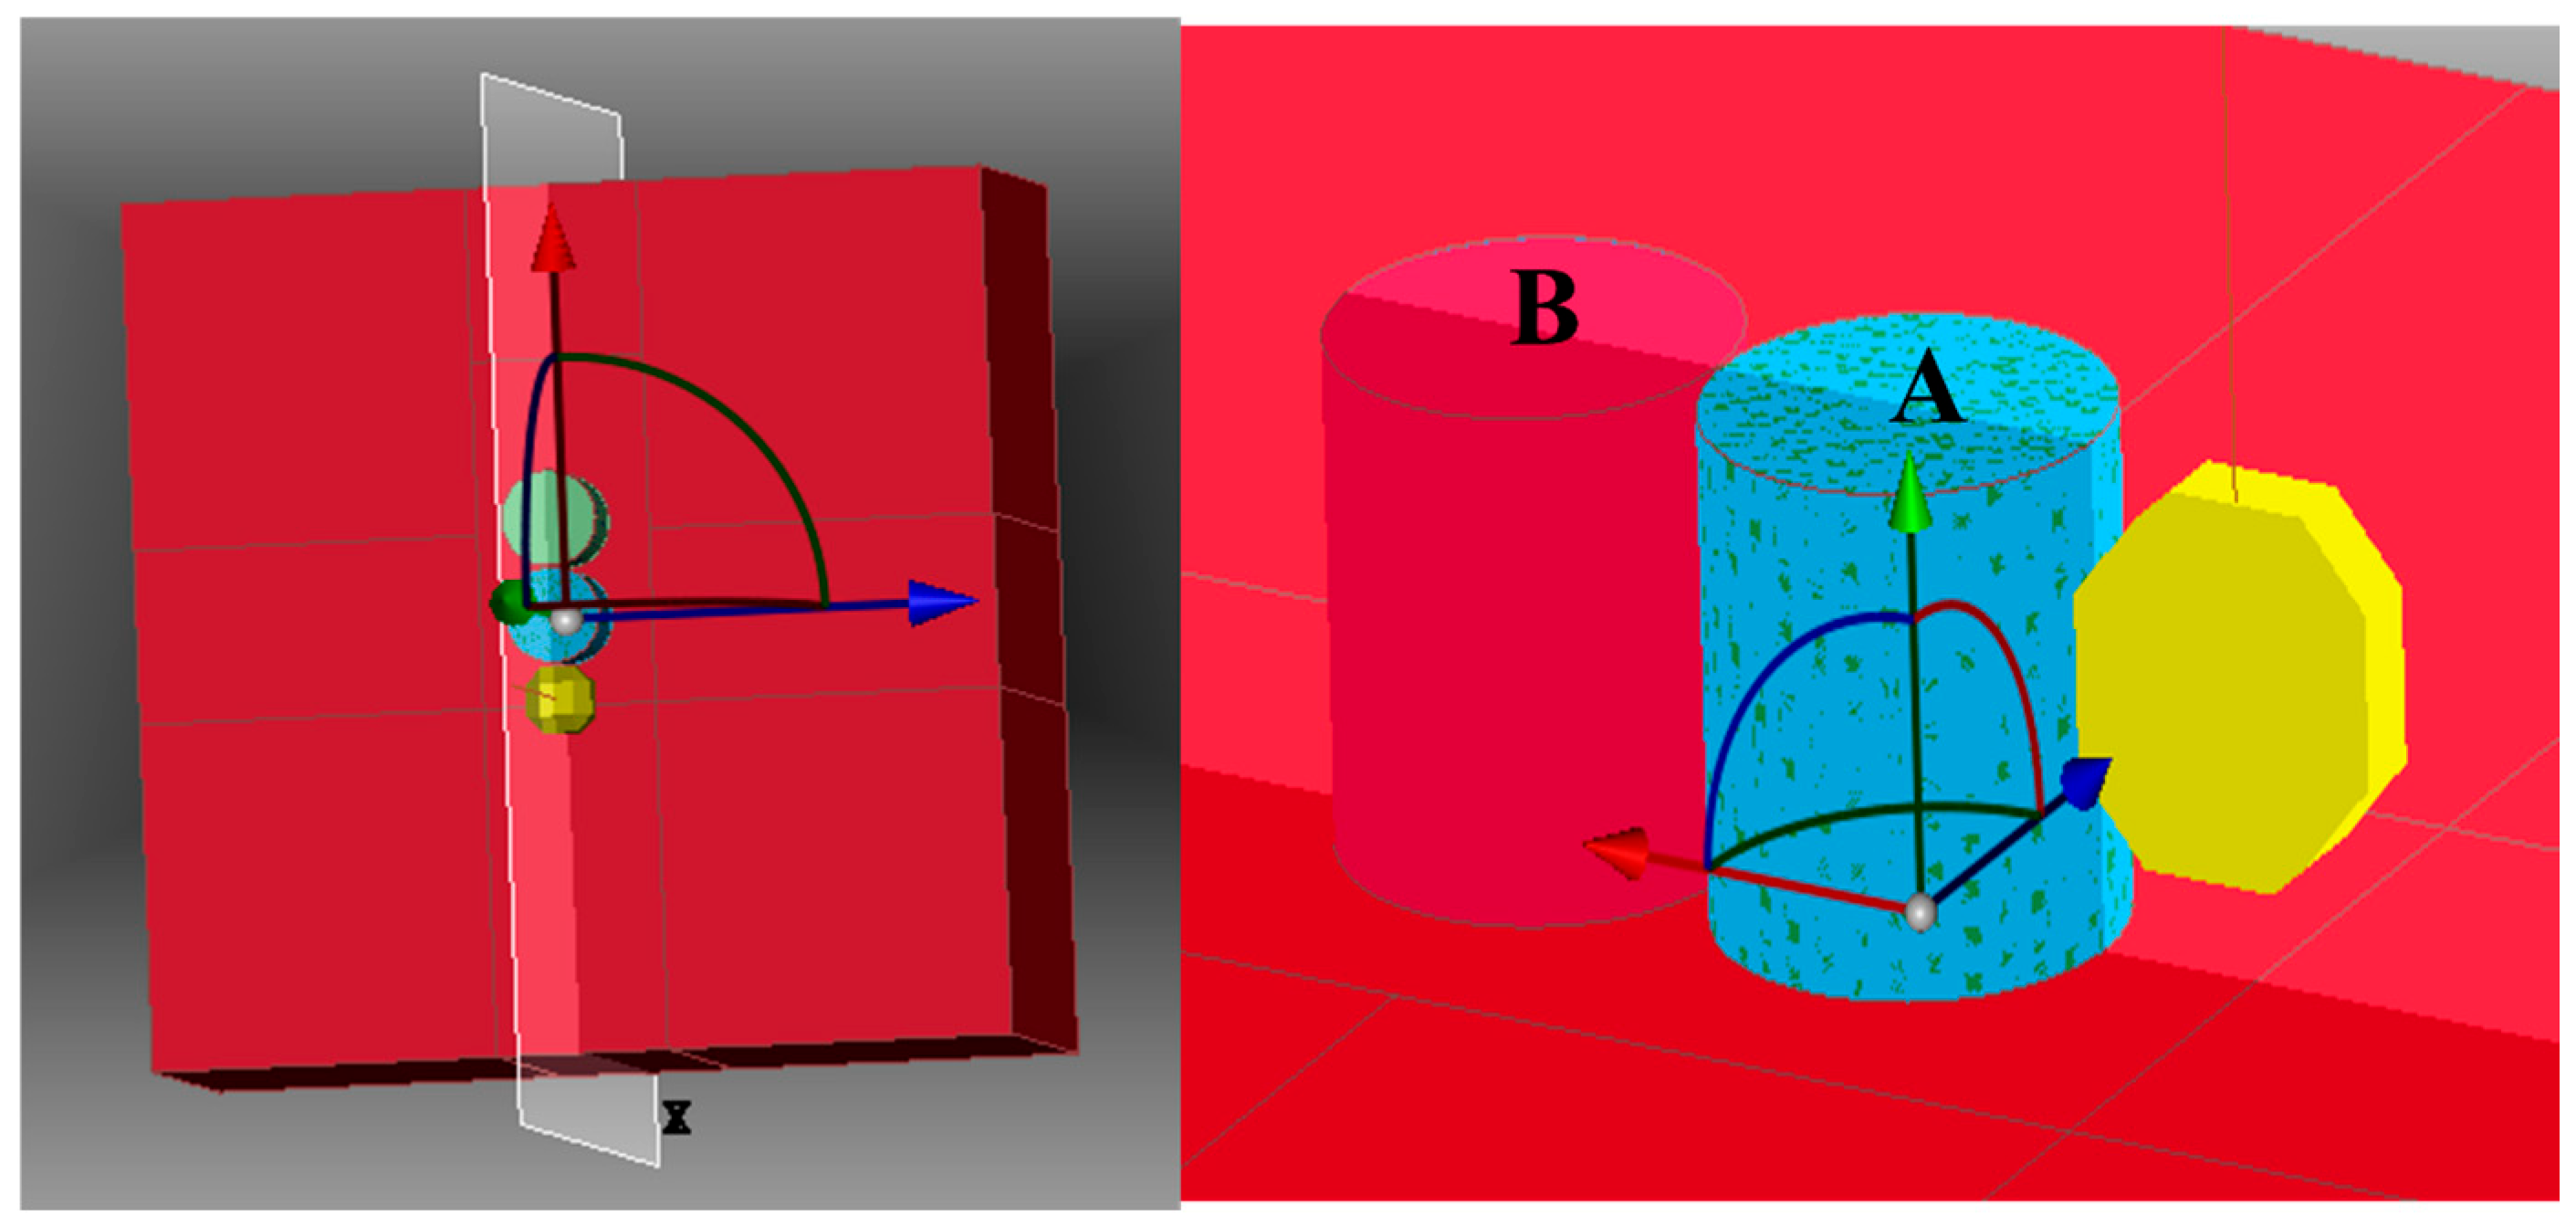
To investigate the influence of the number of sandbags during impact, two sandbags were considered in this section. The second Sandbag modeled in this case is identical to the single large sandbag model discussed previously. The friction coefficient between large sandbags was set to 0.5. All the other parameters for the numerical model remain unchanged. The numerical analysis model is presented in Figure 14.
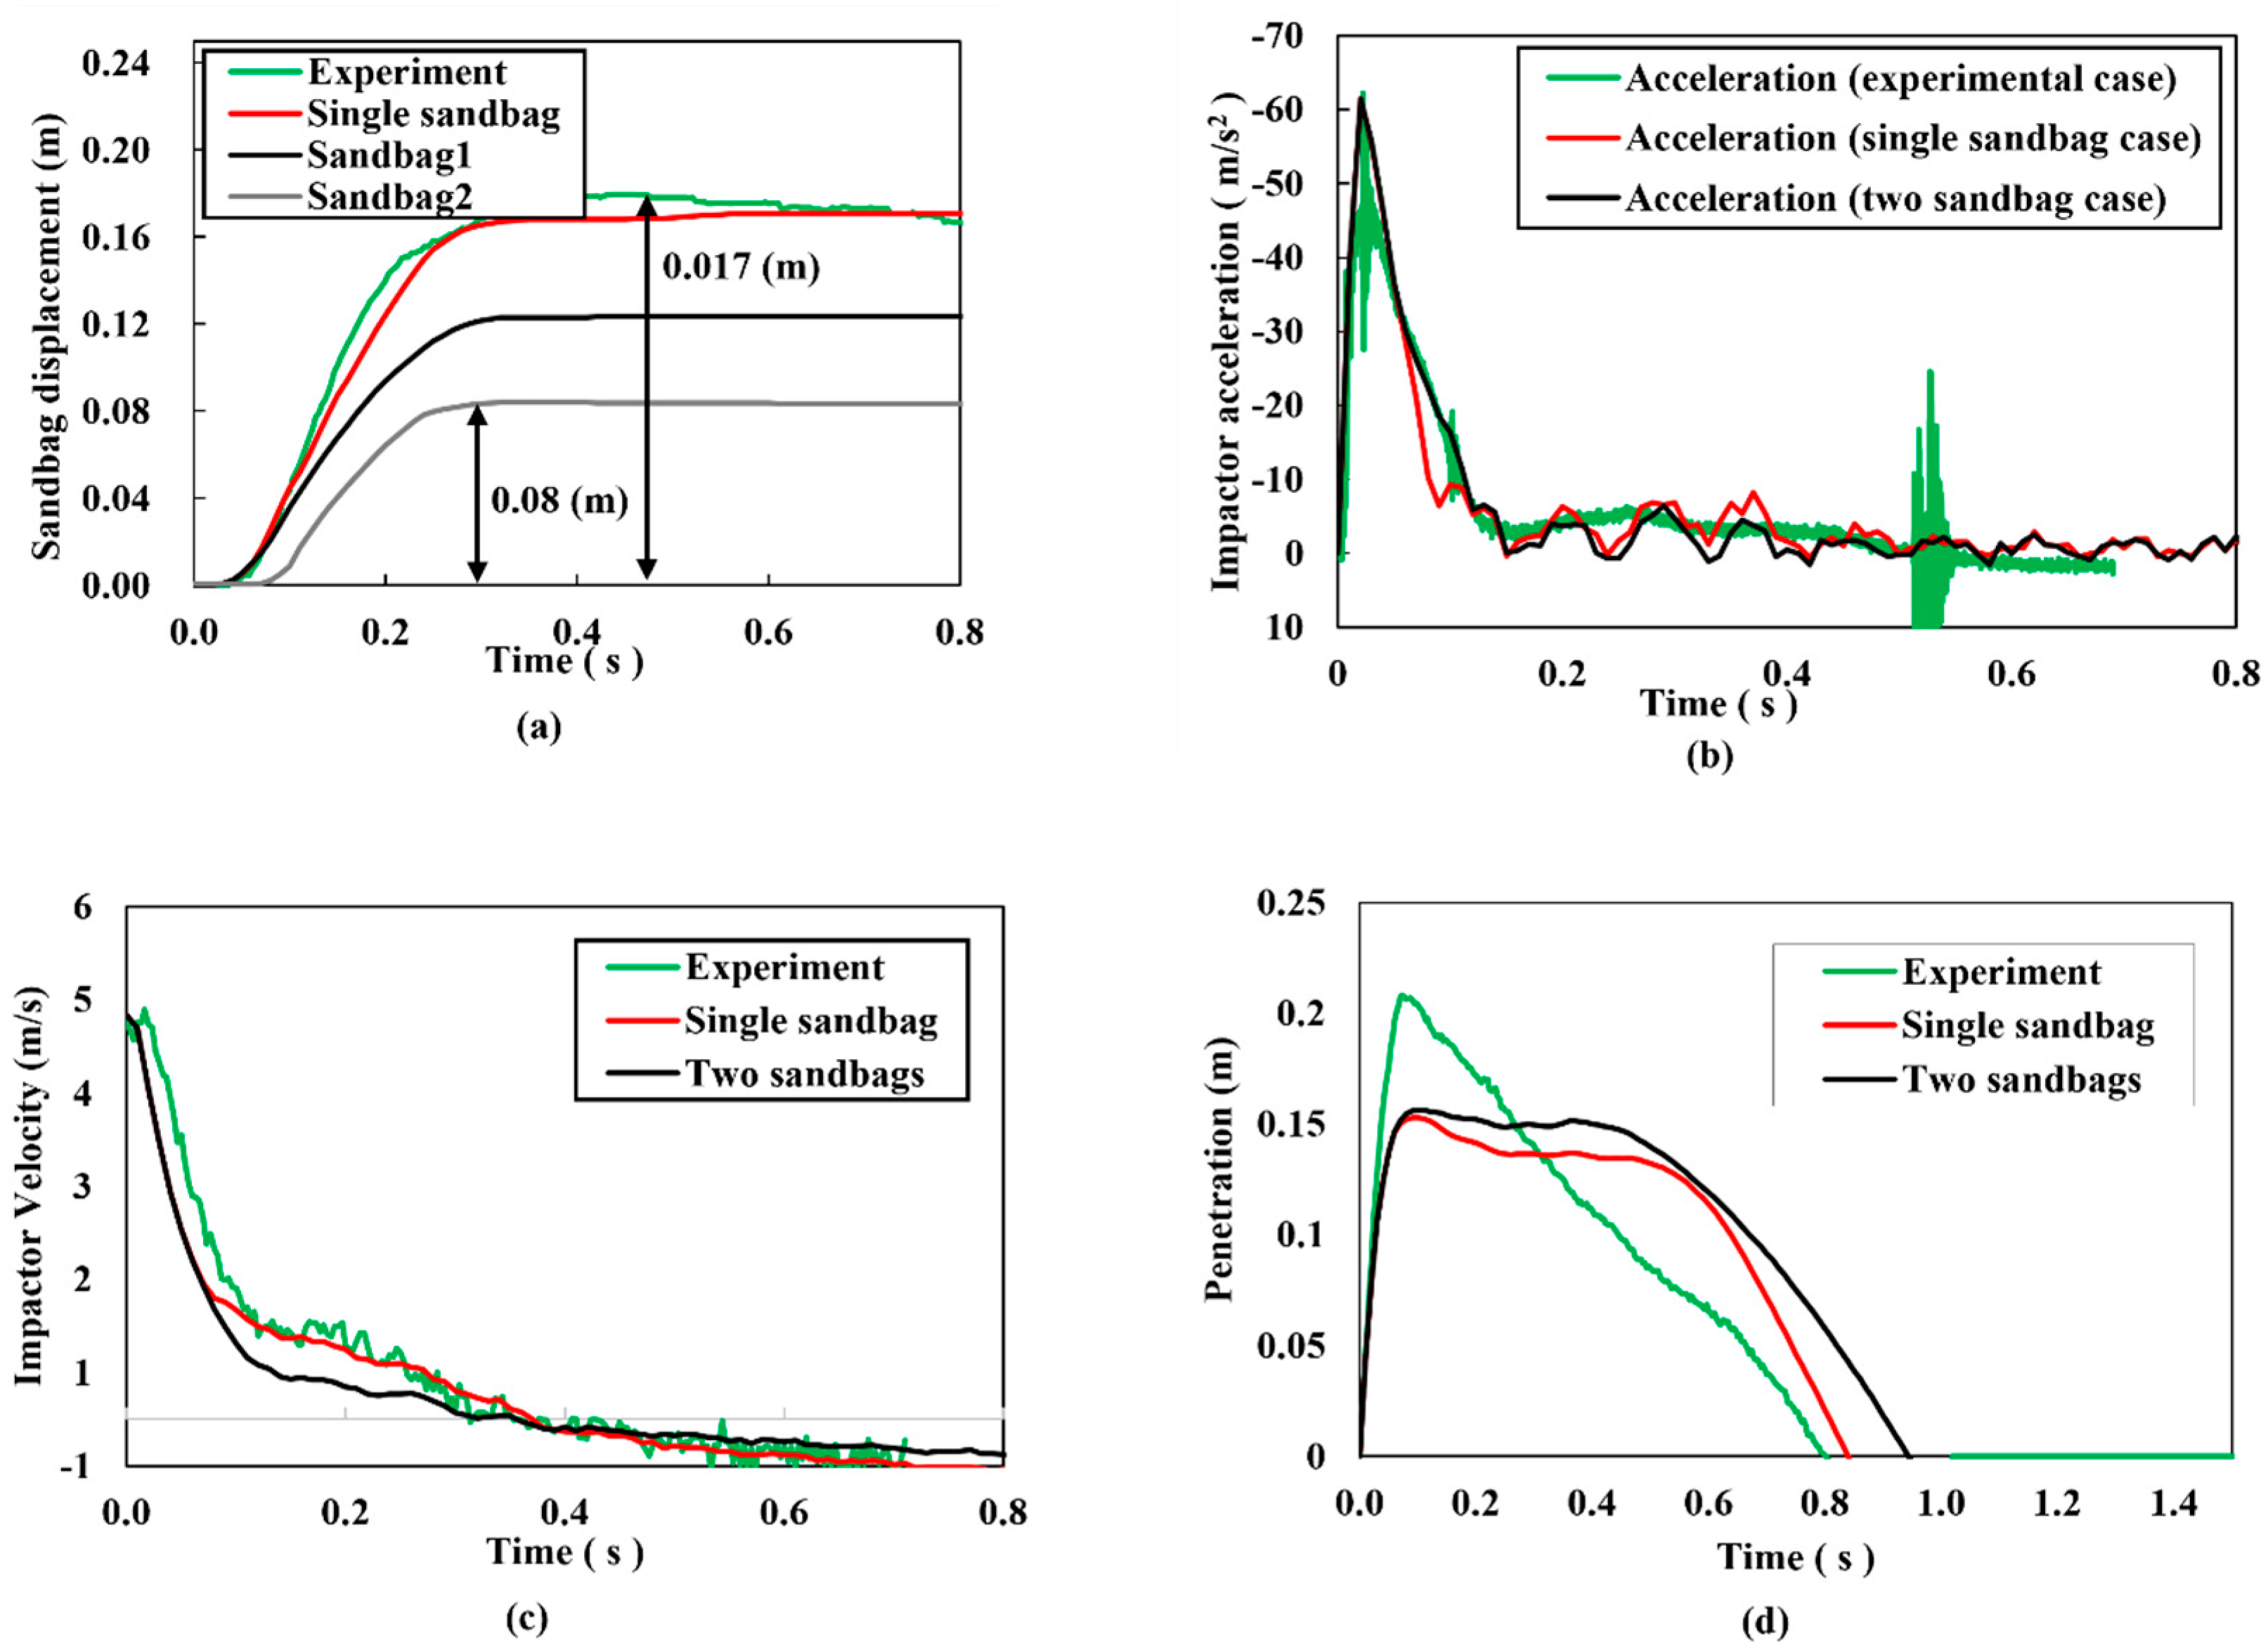
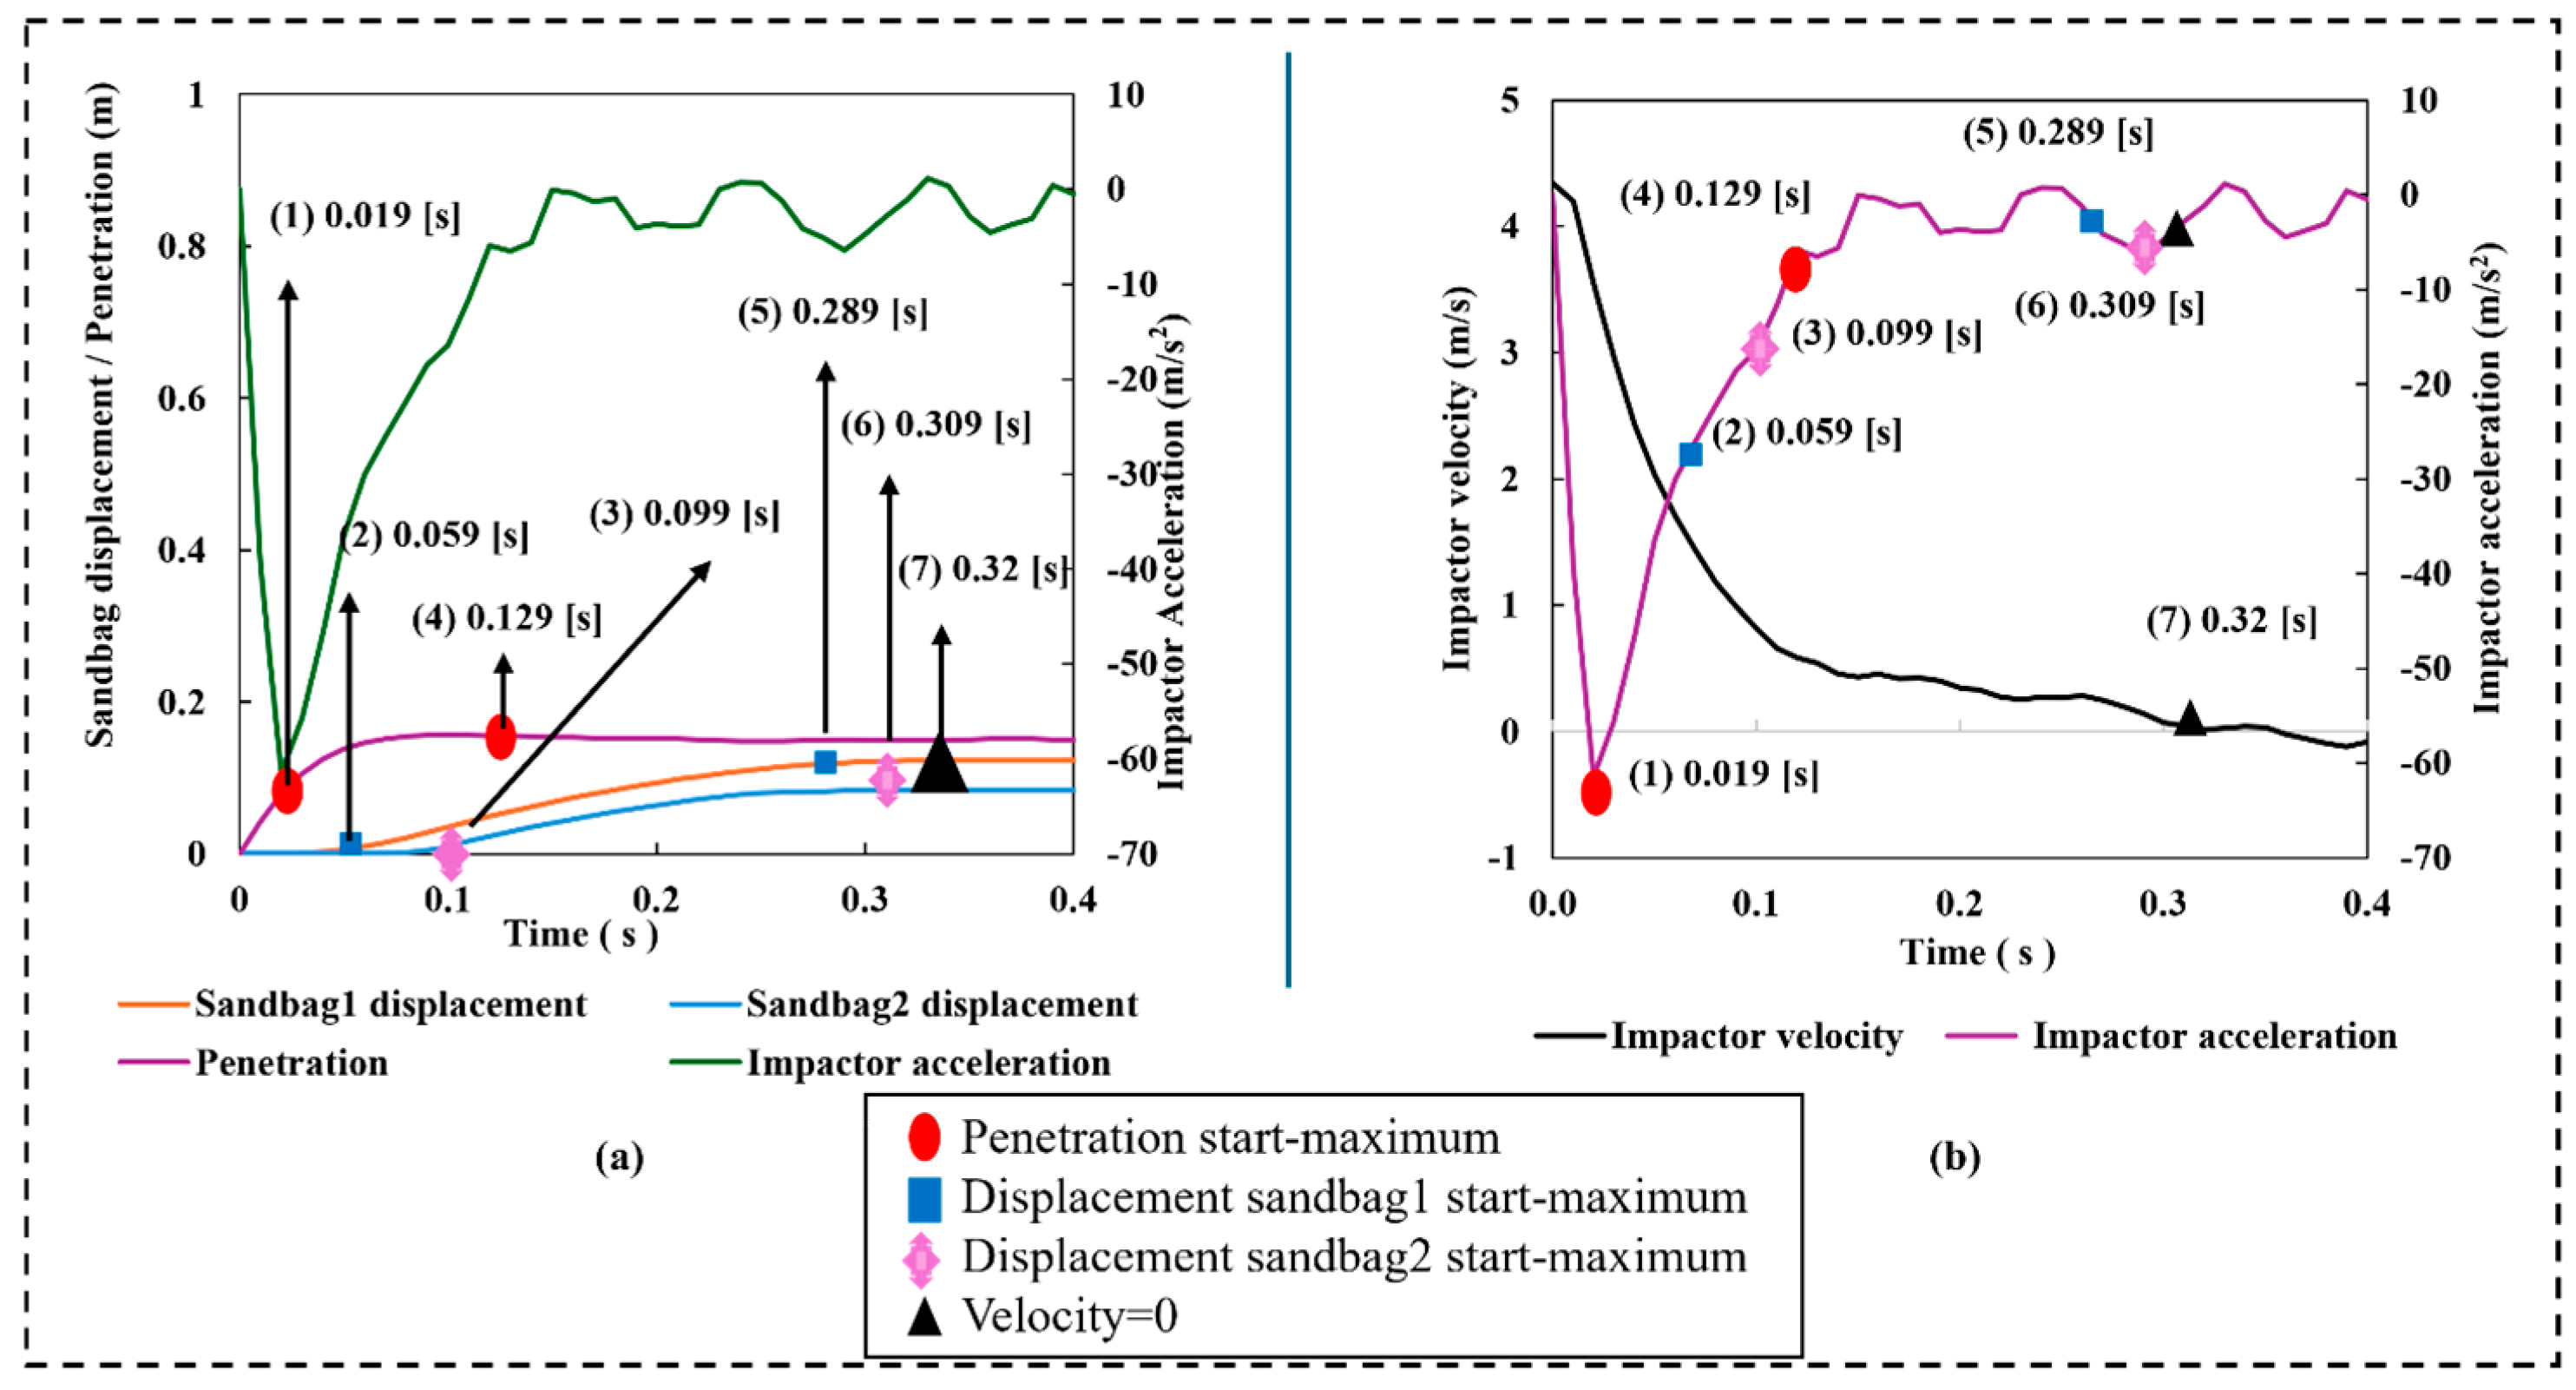
The behavior of the impactor and large sandbags is compared between the case of a single large sandbag, the case where two large sandbags are arranged, and the experimental tests at an initial impact velocity of 4.34 m/s. Figure 15 shows the comparison results for sandbag displacement, impactor acceleration, and impactor velocity. For the displacement response, the experiment records a noticeably larger sandbag displacement of approximately 0.017 m, whereas the numerical two-sandbags case shows a smaller overall displacement. In the two-sandbag arrangement, sandbag (A), which is directly in the path of the impactor, begins displacing at t = 0.059 (s) and reaches its maximum displacement of approximately 0.12 m at t = 0.289 (s). Sandbag (B) started displacement later, at t = 0.099 s, and reaches its maximum displacement of approximately 0.08 m at t = 0.309 s. This pattern illustrates the progressive load transfer from the sandbag (A) to the sandbag (B). The acceleration versus time profiles demonstrate almost similar peak negative acceleration of approximately −61.5 m/s2 in all three cases (experiment, single sandbag, double sandbag). This observation indicates that the sandbag (A) offers a comparable initial resistance across both configurations.
In the case of impactor velocity, all three cases initiate at an identical initial value of 4.34 m/s. The experimental impactor velocity displays a gradual decrease, reflecting the physical testing parameters. Specifically, the impactor’s motion stopped at approximately t = 0.369 s in the experimental and single sandbag scenario. However, the two-sandbag configuration brought the impactor to a stop more quickly, at t = 0.32 s. The shortened stopping time suggests that the two-sandbag configuration is better at dissipating the impactor’s kinetic energy as compared to a single sandbag and the experimental case.
Moreover, the penetration depth data of the two-sandbag configuration demonstrates a similar pattern to that of the single sandbag case. Particularly, in the two-sandbag arrangement, the peak penetration is observed at t = 0.129 s, a minor delay relative to the 0.099 s recorded with a single sandbag case. This observation suggests that the sandbag (B) creates more resistance, which then speeds up the acceleration of the penetration process.

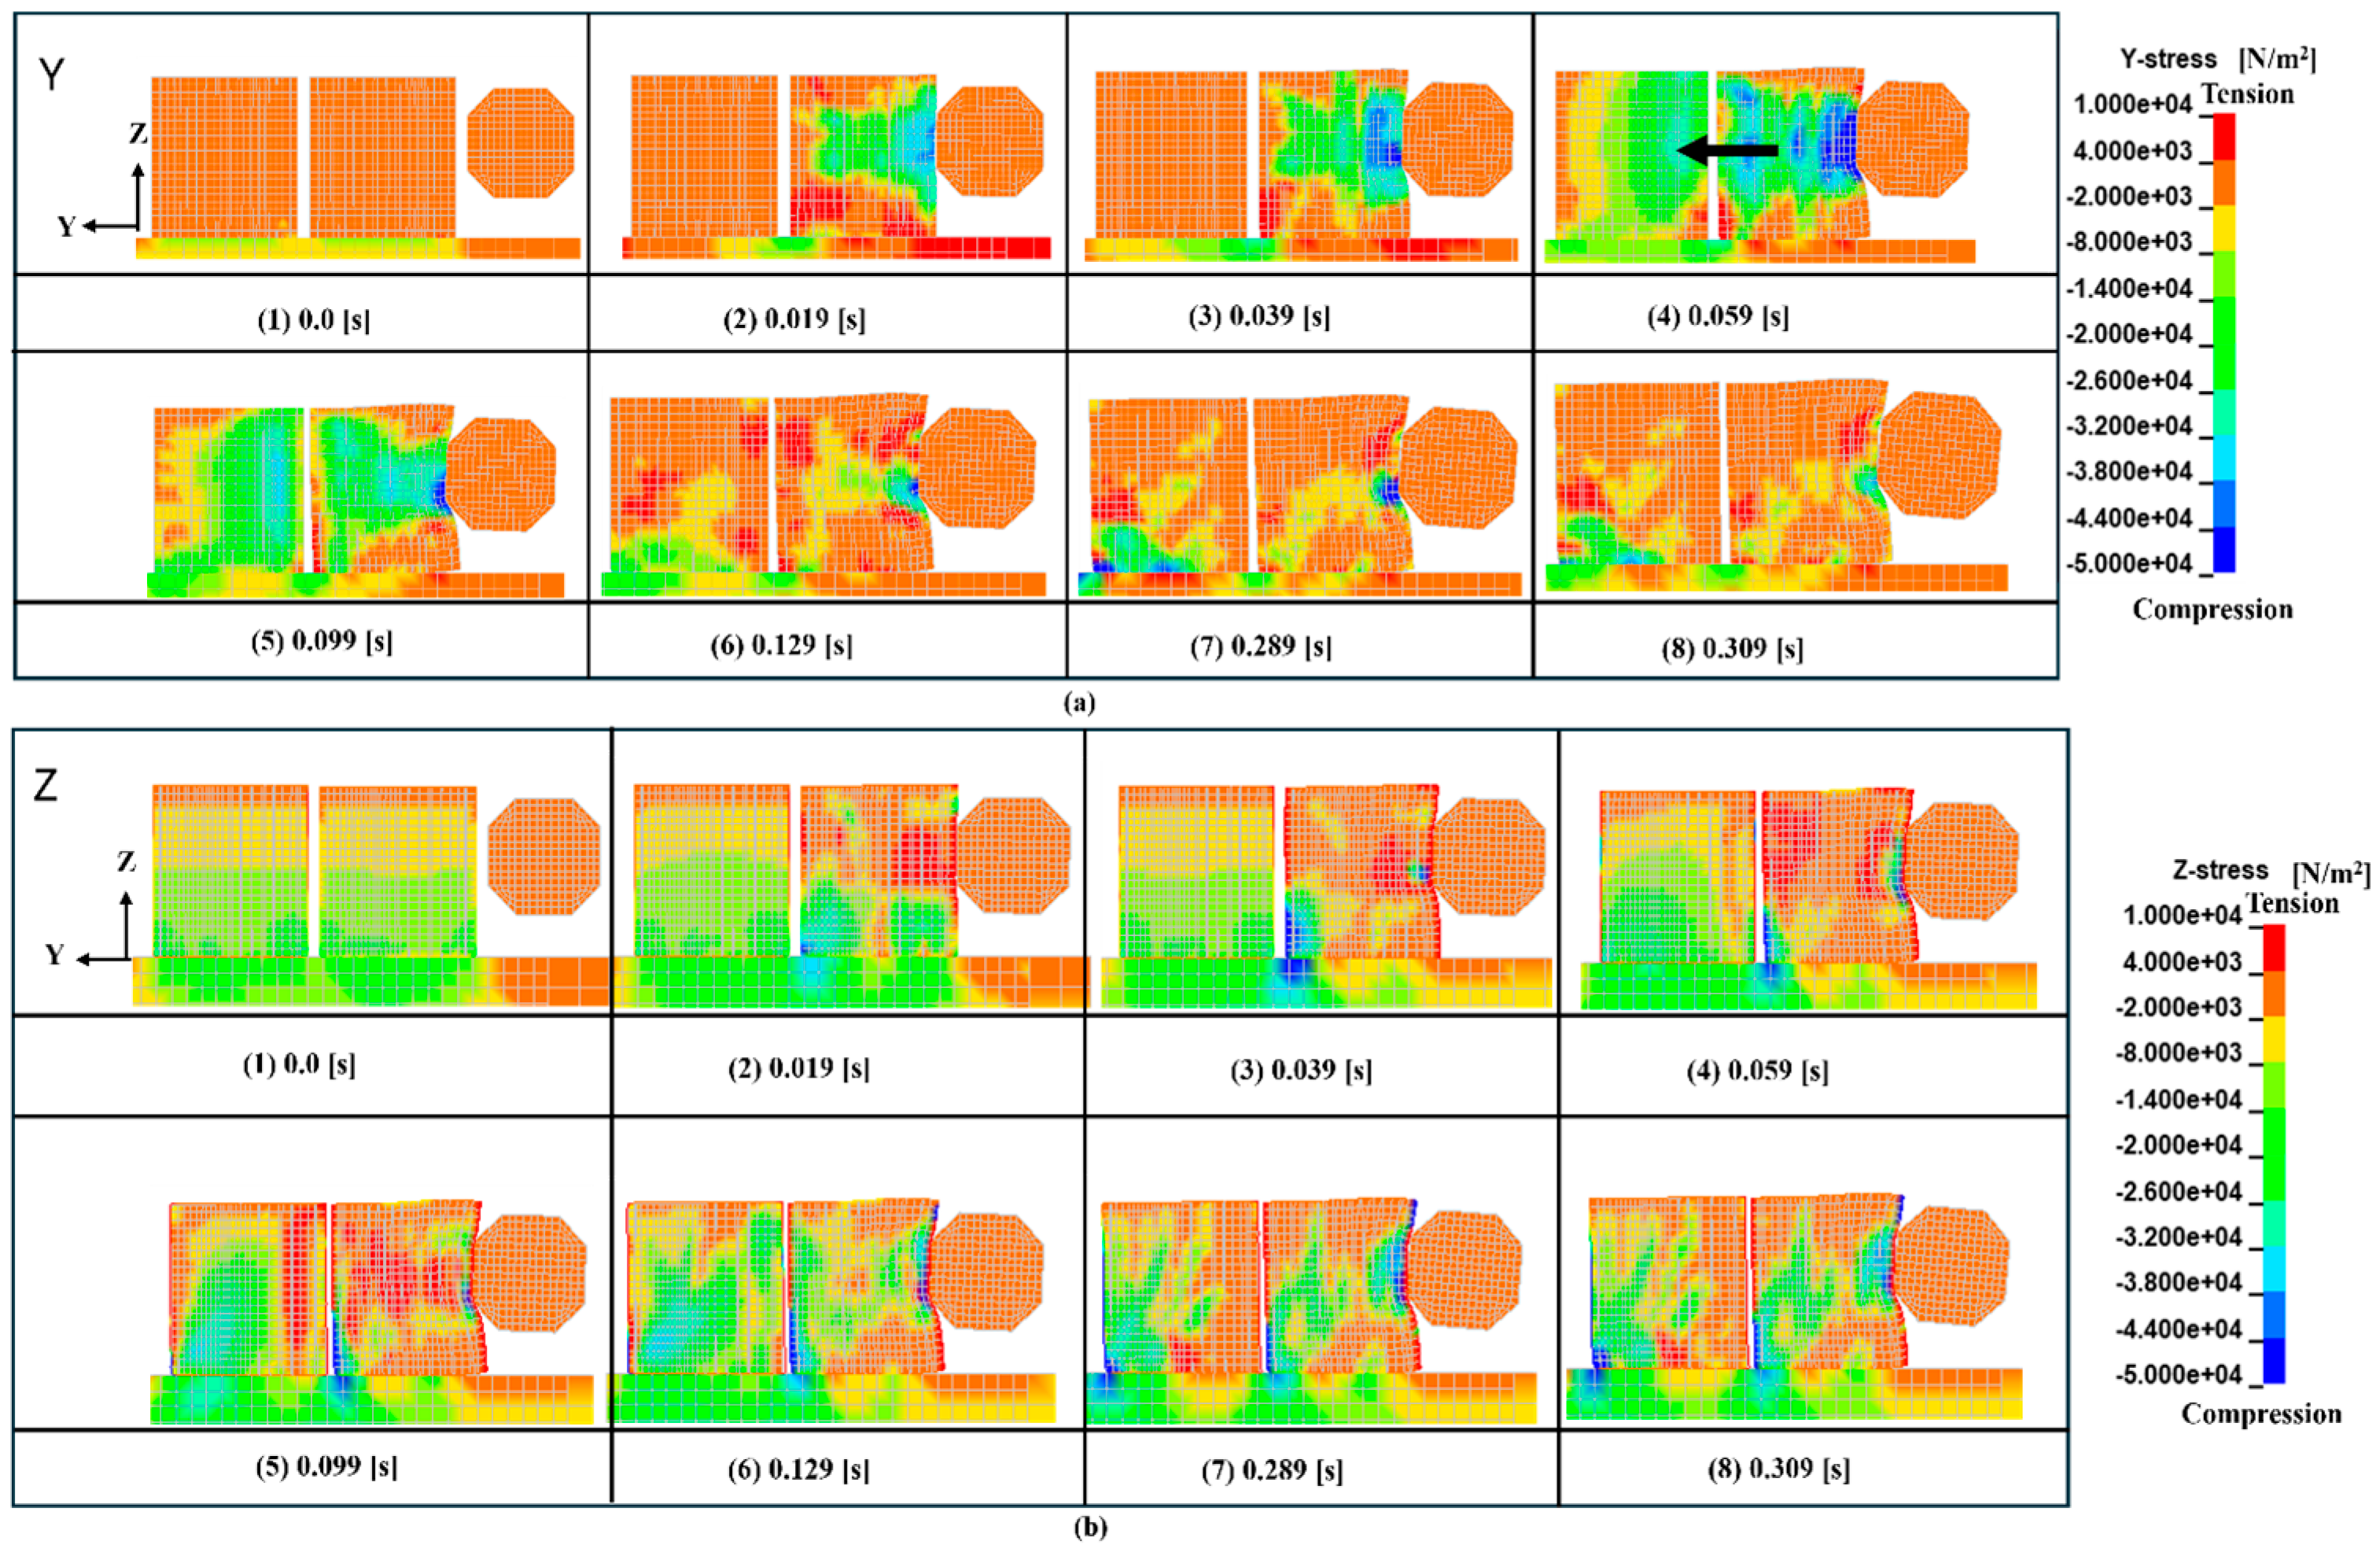
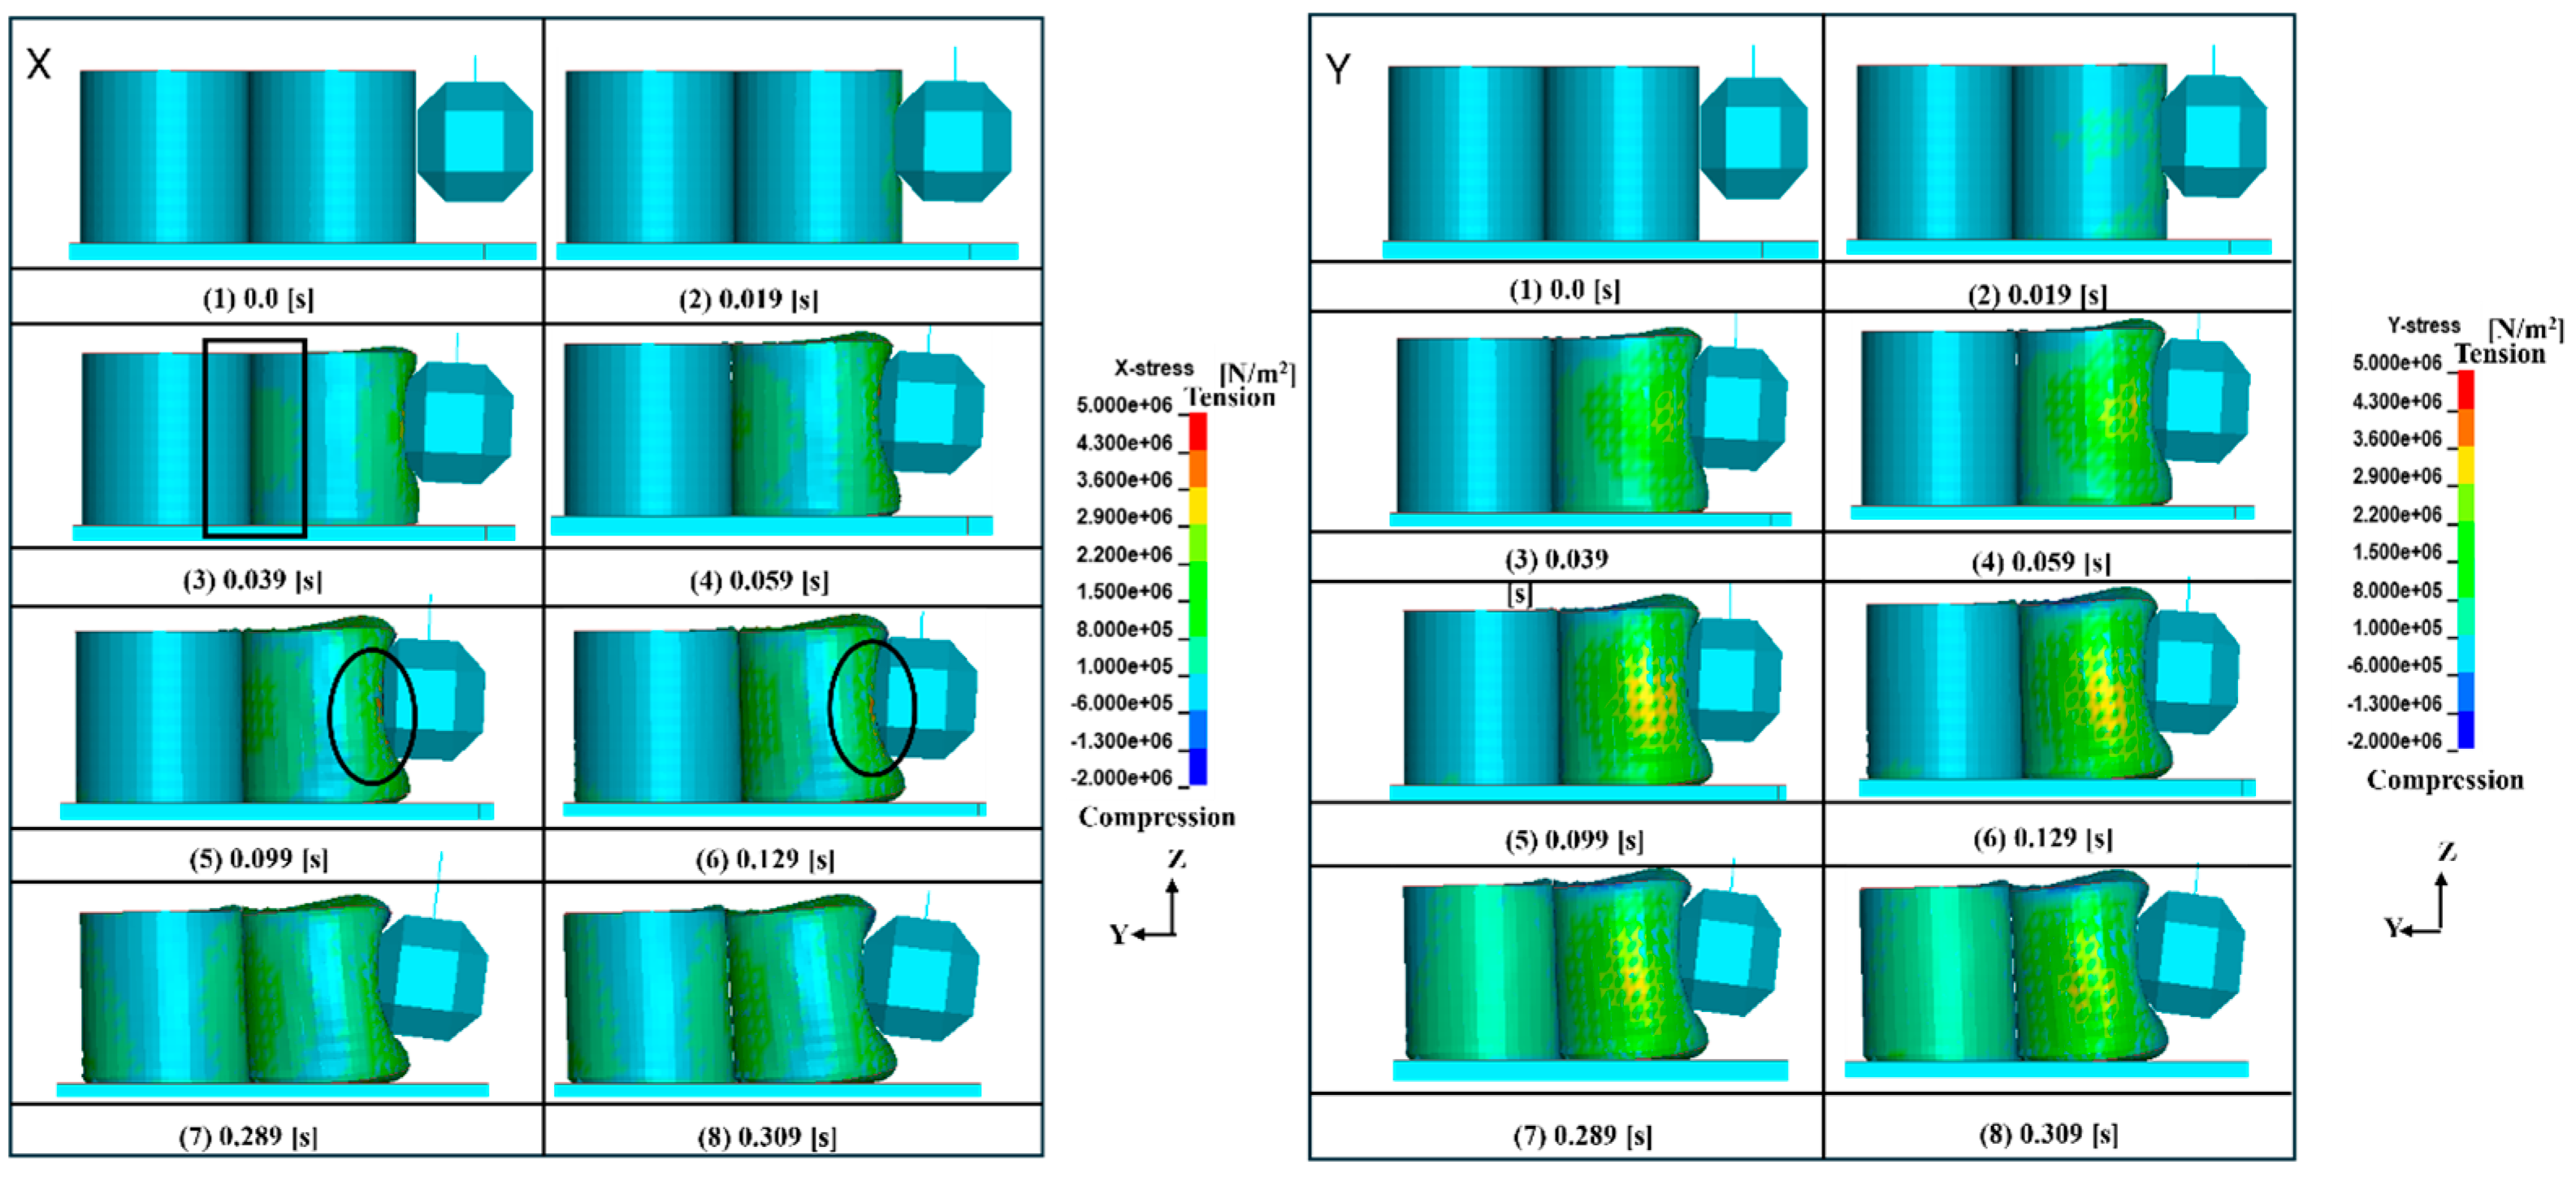
6.1. Stress State Inside Sandbags and Bag

The section was cut at the center of the sandbag and impactor along the Y-Z plane, as shown in Figure 16. Figure 17 illustrates the detailed analysis at different time phases. The stress distribution was examined across eight phases of time, covering both the filling material (sand) of the sandbags in the Y and Z-axis directions, and the bag material (shell) in the X and Y-axis directions, as illustrated in Figure 18 and Figure 19. Figure 17 shows that immediately after impact at t = 0.019 (s), the moment the impactor’s acceleration peaks, compressive stresses initiate within the filling material of the sandbag (A), particularly in the Y and Z directions, and are localized around the impact zone. However, the filling material of the sandbag (B) exhibits negligible stress at this point. Progressing to t = 0.039 s and t = 0.059 s, the compressive stress within sandbag (A) expands outward from the impact point, extending into the sandbag’s interior, whereas sandbag (B) continues to demonstrate a minimal stress response, thereby showing that sandbag (A) alone is absorbing the impactor’s force during this period. At t = 0.099 s, when the sandbag (B) starts to displace, compressive stress begins to transfer from the filling material of sandbag (A) to sandbag (B), in the Y and Z directions. At t = 0.129 s, which is when the maximum penetration of the impactor in the sandbag (A) occurs, the compressive stress between the two sandbags becomes more noticeable, confirming that stress is actively transferring between them. As both sandbags continue to displace through t = 0.289 s and t = 0.309 s, the Y-direction stress gradually decreases throughout the system. In contrast, Z-direction compressive stress remains concentrated at the ground and the heel of both sandbags, maintained by contact and friction.
For the bag material, stresses are calculated in X and Y directions (Figure 19). At t = 0 s, the bag material of both sandbags is entirely stress-free. At t = 0.019 s, the sandbag (A) starts to experience tensile stress on the impact face in the X direction. This stress occurs because the filling material is beginning to deform outward. In contrast, the sandbag (B) does not show any stress at this point. Between t = 0.039 (s) and t = 0.059 (s), tensile stresses increase on the impact face and the lateral sides of the sandbag (A) in both X and Y directions as the outward expansion of the filling material stretches the bag skin. The bag of the sandbag (B) shows negligible stress during these stages, as the sandbag (A) continues to absorb the maximum share of the load. At t = 0.099 s and t = 0.129 s, the tensile stresses in the sandbag (A) become more concentrated and start to move toward the heel area as the bag shifts position. The bag material of the sandbag (B) shows only a minor stress response at these stages. At t = 0.289 (s) and t = 0.309 (s), when both sandbags reach their respective maximum displacements, tensile stress in the bag of sandbag (A) is clearly concentrated at the heel in both X and Y directions, and sandbag (B) shows tensile stresses spread out at the sides of the bag in X and Y directions, constrained by ground friction.

6.2. Energy Absorption Mechanism

In the case of multiple sandbags, the energy absorption process followed a specific sequence. The sandbag (A), immediately in front of the impactor, absorbed most of the kinetic energy during impact. At the initial stage of the impact process, the sandbag (A) resists the impact through penetration and internal deformation. The compressive stress was then transferred from sandbag (A) to sandbag (B) in the later stage of the impact process. There is not much difference in total energy absorption in the case of single and double sandbags, as illustrated in Table 11. Conversely, in the case of two sandbags, the impactor came to rest in a shorter time than in the single sandbag case. This signifies that the sandbags showed a quicker rate of energy absorption in a short time. This setup improves the kinetic energy distribution and absorption through sandbags. Therefore, its ability to diminish the effects of high-velocity collisions is improved.

7. Conclusions

This study numerically reproduced the experimental impact test to investigate the behavior of the sandbag and its energy dissipation capacity during impact. Then, based on the validated FE model, the influence of different physical conditions was analyzed. The main findings are as follows:
  • The numerical model analyzed stress distribution and energy dissipation during the impact process. The analysis showed approximately 50% of energy was dissipated during the penetration phase. In addition, stress concentration and transfer patterns were also observed. Compressive stress initially concentrated near the impact zone and progressed towards the heel region of the sandbag, which is diagonally opposite to the impactor. In the final phase, the heel portion of the sandbag acts as the primary resistance element through frictional mobilization at the base.
  • A parametric study using the validated numerical model showed that increasing sand density led to a reduction in lateral displacement and an increase in impactor deceleration. These results suggest that more compacted, high-density sandbags perform better in resisting rockfall impact forces.
  • The drop height of the impactor on the sandbag significantly influenced the dynamic response. Impacts near the base produced greater lateral displacement and higher deceleration due to increased ground confinement, while impacts at greater heights engaged a larger volume of filling material, resulting in higher strain energy absorption and an energy absorption rate of up to 69.45%. Hence, the numerical results suggest that the base of the sandbag structure is more critical to the impact of rockfall.
  • The parametric study indicated that impactor velocity is a governing parameter for both dynamic response magnitude and structural integrity. Beyond a critical threshold of 10–11 m/s, structural failure occurred, defining the upper performance limit for a single sandbag. Furthermore, higher impactor velocities resulted in a proportional increase in sandbag displacement, penetration, and impactor acceleration.
  • The effect of an increasing number of sandbags in the direction of impact was also investigated. The two-sandbag arrangement demonstrated improved performance compared to the single sandbag configuration. While the combined energy absorption rate (68.28%) was comparable, the impactor was brought to rest in a shorter time, indicating a higher rate of energy dissipation. The rear sandbag contributed to energy dissipation of impact through sequential load transfer. Sandbag 2 started taking load from sandbag 1 during the later stages of impact, indicating the practical advantage of multi-layer sandbag arrangements for rockfall protection.
  • For the performance-based design, the lower part (row) of the sandbag wall should be stiffer by compacting the sand (increasing density), as the lower part is more vulnerable to deformation during the impact process. Moreover, adding sandbags in both horizontal and vertical directions improves the overall resistance of the protective system against rockfall impacts.
The numerical model proposed in this study successfully reproduced the dynamic behavior of the sandbag, including displacement, velocity, and acceleration, although a discrepancy was observed in the peak penetration values. The simulation yielded a peak penetration of 0.15 m, while the experimental value was 0.21 m; the numerical peak penetration is thus 28.5% lower than the experimental peak. This discrepancy might be due to the motion of the hanging wire and the impactor. Moreover, for the filling material (sand), the Drucker–Prager model was used that cannot replicate the micromechanical energy transfer mechanism of sand after deformation. However, it visualizes the stress transfer from impact point to the heel side of sandbag and then to the ground. Also, the impact process includes impactor hitting the sandbag once and then rebounds. Therefore, future studies should be conducted to propose more refined models for sand material.
In addition, the current study focuses on sandbag deformation under a single impact; therefore, future research should evaluate the post-impact resilience of sandbags subjected to multiple impacts.

Author Contributions

Conceptualization, N.M., T.Y. and K.S.; methodology, N.M., K.S. and D.U.; software, N.M. and T.Y.; validation, N.M., K.S., H.M. and D.U.; formal analysis, N.M.; investigation, N.M., H.M. and D.U.; resources, K.S. and T.Y.; data curation, N.M. and H.M.; writing—original draft preparation, N.M.; writing—review and editing, K.S., T.Y. and D.U.; visualization, N.M. and H.M.; supervision, K.S. and T.Y.; project administration, K.S. and T.Y.; funding acquisition, K.S. All authors have read and agreed to the published version of the manuscript.

Funding

This research received no external funding.

Institutional Review Board Statement

Not applicable.

Informed Consent Statement

Not applicable.

Data Availability Statement

The original contributions presented in this study are included in the article. Further inquiries can be directed to the corresponding author.

Conflicts of Interest

Author Daisuke Ueda was employed by the Raiteku Co., Ltd. Author Hayashi Motoyuki was employed by the OYO Corporation (Japan). The remaining authors declare that the research was conducted in the absence of any commercial or financial relationships that could be construed as a potential conflict of interest.

References

  1. Ma, S.-W.; Lu, L.; Wang, Z.-J.; Shi, T.-H.; Xiao, L.; Arai, K. Deformation resistance of prestressed geosynthetics-reinforced soil wall with a buffer layer subjected to impact of rockfall. Int. J. Struct. Stab. Dyn. 2023, 23, 2350059. [Google Scholar] [CrossRef]
  2. Meree, H.; Wang, D.; Yan, S. Numerical and theoretical study of rockfall impact on shed with composite sand-airbag cushion materials. Environ. Earth Sci. 2023, 82, 432. [Google Scholar] [CrossRef]
  3. Li, R.; Meng, S.; Chen, Y.; Wu, H.; Zhou, Y. Influence of sand cushion on rockfall-impact resistance of RC sheds. Eng. Struct. 2025, 331, 119992. [Google Scholar] [CrossRef]
  4. Shanmugam, G.K.; Jeeva, S.; Godson, M.; Madhiyarasu, P.; Abishek, R. Experimental evaluation of geotextile in-filled sand cushioning system against rock fall impact using 2D digital image correlation technique. Measurement 2024, 237, 115181. [Google Scholar] [CrossRef]
  5. Marchelli, M.; De Biagi, V.; Chiaia, B. A fully probabilistic framework to compute the residual rockfall risk in presence of mitigation measures. Landslides 2025, 22, 2961–2968. [Google Scholar] [CrossRef]
  6. Ji, Z.-M.; Chen, T.-L.; Wu, F.-Q.; Li, Z.-H.; Niu, Q.-H.; Wang, K.-Y. Assessment and prevention on the potential rockfall hazard of high-steep rock slope: A case study of Zhongyuntai mountain in Lianyungang, China. Nat. Hazards 2023, 115, 2117–2139. [Google Scholar] [CrossRef]
  7. Asteriou, P.; Zekkos, D.; Manousakis, J. Fully remote assessment of rockfall incidents based on crowdsourced imagery. Bull. Eng. Geol. Environ. 2025, 84, 204. [Google Scholar] [CrossRef]
  8. Tong, B.; Zhang, Y.; Qi, G.; Shi, J.; Wan, Y.; He, J.; Yang, X. The corresponding countermeasures of landslide risk control under influence of climate change in China. Geomat. Nat. Hazards Risk 2024, 15, 2421387. [Google Scholar] [CrossRef]
  9. Marchelli, M.; Coltrinari, G.; Degan, G.A.; Peila, D. Towards a procedure to manage safety on construction sites of rockfall protective measures. Saf. Sci. 2023, 168, 106307. [Google Scholar] [CrossRef]
  10. Kumar, R.; Alam, M.M.; Sadique, M. Influence of foundation shape and thickness on the performance of rigid rockfall protective structures. Int. J. Prot. Struct. 2025, 17, 312–338. [Google Scholar] [CrossRef]
  11. Jaiswal, A.; Verma, A.; Pandit, B.; Taloor, A.K.; Singh, T. Rockfall analysis and optimized barrier design for slope protection. Transp. Infrastruct. Geotechnol. 2025, 12, 224. [Google Scholar] [CrossRef]
  12. Carriero, M.; Migliazza, M.; Vagnon, F.; Ferrero, A.; Nadalini, M.; Gobbin, L. Towards reliability-based design of rockfall hybrid barriers and attenuators: A focus on the resistances. In New Challenges in Rock Mechanics and Rock Engineering; CRC Press: Boca Raton, FL, USA, 2024; pp. 381–387. [Google Scholar]
  13. Ma, L.; Wu, Y.; Wu, H. Analysis and design of passive flexible barrier against 1000–8000 kJ rockfall impact. Eng. Struct. 2026, 349, 121840. [Google Scholar] [CrossRef]
  14. Ge, Z.; Liu, H. Numerical investigation on the dynamic response of rockfall impacts on flexible barrier under seismic loading. Nat. Hazards 2023, 115, 1213–1234. [Google Scholar] [CrossRef]
  15. Coulibaly, J.B.; Chanut, M.-A.; Lambert, S.; Nicot, F. Toward a generic computational approach for flexible rockfall barrier modeling. Rock. Mech. Rock. Eng. 2019, 52, 4475–4496. [Google Scholar] [CrossRef]
  16. Ge, Z. Towards Sustainable Rockfall Protection: An Interaction Matrix Method for Assessing Flexible Barrier Siting Adaptability. Sustainability 2025, 17, 8675. [Google Scholar] [CrossRef]
  17. Berger, S.M.; Hofmann, R.; Preh, A. Impacts on embankments, rigid and flexible barriers against rockslides: Model experiments vs. DEM simulations. Rock. Mech. Rock. Eng. 2024, 57, 2793–2808. [Google Scholar] [CrossRef]
  18. Maegawa, K.; Yokota, T.; Van, P.T. Experiments on Rockfall Protection Embankments with Geogrids and Cushions. GEOMATE J. 2011, 1, 19–24. [Google Scholar] [CrossRef]
  19. Zhao, P.; Yuan, S.; Li, L.; Ge, Q.; Liu, J.; Du, L. Experimental study on the multi-impact resistance of a composite cushion composed of sand and geofoam. Geotext. Geomembr. 2021, 49, 45–56. [Google Scholar] [CrossRef]
  20. Ho, T.S.; Masuya, H.; Takashita, N. Experimental study concerning impact characteristics by collision of weight on sand cushion over steel beam. GEOMATE J. 2013, 4, 471–476. [Google Scholar] [CrossRef]
  21. Ghadimi Khasraghy, S. Numerical Simulation of Rockfall Protection Galleries. Ph.D. Thesis, Swiss Federal Institute of Technology, Zurich, Switzerland, 2012; p. 334. [Google Scholar]
  22. Bhatti, A.Q. Falling-weight impact response for prototype RC type rock-shed with sand cushion. Mater. Struct. 2015, 48, 3367–3375. [Google Scholar] [CrossRef]
  23. Naito, N.; Maeda, K.; Konno, H.; Ushiwatari, Y.; Suzuki, K.; Kawase, R. Rockfall impacts on sand cushions with different soil mechanical characteristics using discrete element method. Soils Found. 2020, 60, 384–397. [Google Scholar] [CrossRef]
  24. Pokharel, S.K.; Han, J.; Leshchinsky, D.; Parsons, R.L.; Halahmi, I. Investigation of factors influencing behavior of single geocell-reinforced bases under static loading. Geotext. Geomembr. 2010, 28, 570–578. [Google Scholar] [CrossRef]
  25. Moghaddas Tafreshi, S.N.; Kheiri, S.; Azizian, M.; Dawson, A.R. Geocell-reinforced bed under static and cyclic loads: Soil density and grain size effects. Geosynth. Int. 2022, 31, 126–139. [Google Scholar] [CrossRef]
  26. Lambert, S.; Nicot, F.; Gotteland, P. Uniaxial compressive behavior of scrapped tire and sand-filled wire netted geocell with a geotextile envelope. Geotext. Geomembr. 2011, 29, 483–490. [Google Scholar] [CrossRef]
  27. Kawahara, S.; Muro, T. Effects of dry density and thickness of sandy soil on impact response due to rockfall. J. Terramech. 2006, 43, 329–340. [Google Scholar] [CrossRef]
  28. Zhu, X.; Chen, W.; Liu, L.; Luo, G.; Zhao, Z. Experimental and numerical investigation on the compression after high-velocity impact behavior of composite laminates. Eng. Fail. Anal. 2024, 159, 108125. [Google Scholar] [CrossRef]
  29. Schellenberg, K.; Röthlin, C.; Ghadimi-Khasraghy, S.; Vogel, T. A review on the design of rock sheds with a cushion layer. In Proceedings of the 11th International & 2nd North American Symopsium on Landslides ISL/NASL 2012, Banff, AB, Canada, 3–8 June 2012. [Google Scholar]
  30. Yan, P.; Zhang, J.; Fang, Q.; Zhang, Y. Numerical simulation of the effects of falling rock’s shape and impact pose on impact force and response of RC slabs. Constr. Build. Mater. 2018, 160, 497–504. [Google Scholar] [CrossRef]
  31. Ueda, D.; Sawada, K.; Namba, M.; Yashima, A. Full scale experiments for rockfall protection wall using large-size soil-bags. Jpn. Geotech. J. 2023, 18, 285–297. (In Japanese) [Google Scholar] [CrossRef]
  32. Oggeri, C.; Ronco, C.; Vinai, R. Validation of numerical D.E.M. modelling of geogrid reinforced embankments for rockfall protection. Geoing. Ambient. Mineraria 2022, 15, 36–45. [Google Scholar]
  33. ANSYS, Inc. LS-DYNA R16; ANSYS: Canonsburg, PA, USA, 2025; Available online: https://lsdyna.ansys.com/wp-content/uploads/2025/04/LS-DYNA_Manual_Theory_R16.pdf (accessed on 18 May 2026).
  34. Neilsen, M.; Krieg, R.; Schreyer, H. A constitutive theory for rigid polyurethane foam. Polym. Eng. Sci. 1995, 35, 387–394. [Google Scholar] [CrossRef]
  35. Suwal, L.P.; Kuwano, R. Statically and Dynamically Measured Poisson’s Ratio of Granular Soils on Triaxial Laboratory Specimens. Geotech. Test. J. 2013, 36, 493–505. [Google Scholar] [CrossRef]
Figure 1. Experimental setup.
Geotechnics 06 00051 g001
Figure 2. Numerical models of sandbag and rockfall impactor; (a) front view and (b) isometric view.
Geotechnics 06 00051 g002
Figure 3. Experimental results of a large sandbag under rockfall impact: (a) sandbag displacement vs. time relationship, (b) impactor acceleration vs. time relationship, (c) impactor velocity vs. time relationship.
Geotechnics 06 00051 g003
Figure 4. Comparison of numerical and experimental results: (a) sandbag displacement vs. time, (b) impactor acceleration vs. time, (c) impactor velocity vs. time, (d) penetration vs. time.
Geotechnics 06 00051 g004
Figure 5. Numerical model section across the Y-Z plane. (a) Isometric view, (b) top view.
Geotechnics 06 00051 g005
Figure 6. Detailed analysis of five phases: (a) sandbag displacement or penetration vs. time vs. impactor acceleration, (b) impactor acceleration vs. velocity vs. time.
Geotechnics 06 00051 g006
Figure 7. Fringe diagram showing stresses inside sand. (a) Stresses in Y direction, (b) stresses in Z direction.
Geotechnics 06 00051 g007
Figure 8. Fringe diagram showing stresses in the bag material. (a) Stresses in X direction, (b) stresses in Y direction.
Geotechnics 06 00051 g008
Figure 9. Kinetic energy and strain energy of the impactor and sandbag.
Geotechnics 06 00051 g009
Figure 10. Influence of sand density: (a) sandbag displacement vs. time, (b) sandbag displacement vs. sand density, (c) impactor acceleration vs. time, (d) impactor acceleration vs. sand density, (e) Impactor velocity vs. time, (f) impactor acceleration vs. sandbag displacement vs. sand density.
Geotechnics 06 00051 g010
Figure 11. Impact the position of the impactor. (1) H1, (2) H2, (3) H3, (4) H4, (5) H5.
Geotechnics 06 00051 g011
Figure 12. Effect of position of impactor: (a) sandbag displacement vs. time, (b) sandbag displacement vs. impactor height, (c) impactor acceleration vs. time, (d) impactor acceleration vs. impactor height, (e) impactor velocity vs. time, (f) impactor acceleration vs. sandbag displacement vs. impactor height.
Geotechnics 06 00051 g012
Figure 13. Effect of velocity of impactor: (a) sandbag displacement vs. time, (b) sandbag displacement vs. impactor velocity, (c) impactor acceleration vs. time, (d) impactor acceleration vs. impactor velocity, (e) impactor velocity vs. time, (f) impactor acceleration vs. sandbag displacement/penetration vs. impactor velocity.
Geotechnics 06 00051 g013
Figure 14. Numerical analysis model of two sandbags.
Geotechnics 06 00051 g014
Figure 15. Comparison of two sandbag configurations with single sandbag case and experimental case: (a) sandbag displacement vs. time, (b) impactor acceleration vs. time, (c) impactor velocity vs. time, (d) penetration vs. time.
Geotechnics 06 00051 g015
Figure 16. Numerical model section across the Y-Z plane.
Geotechnics 06 00051 g016
Figure 17. Detailed analyses of different time phases: (a) sandbag displacement or penetration vs. time vs. impactor acceleration, (b) impactor acceleration vs. velocity vs. time.
Geotechnics 06 00051 g017
Figure 18. Fringe diagram showing stresses inside sand: (a) stresses in Y direction, (b) stresses in Z direction.
Geotechnics 06 00051 g018
Figure 19. Fringe diagram showing stresses in the bag material.
Geotechnics 06 00051 g019
Table 1. Details of experimental cases.
Case No.Impactor
Velocity (m/s)
Sand Mass (kg)Sand Volume (m3)Sand Density (kg/m3)Drop Height of Impactor (m)
Case 11.3817101.1315130.1
Case 21.4115801.1214110.1
Case 34.3417101.1315131.0
Case 44.2715401.1313631.0
Table 2. Material model parameters used in this study.
Material NameMaterial ModelDensity ρ (kg/m3)Young Modulus E (kPa)Poisson Ratio υInternal Friction Angle ϕCohesion c (kPa)
ImpactorRigid25722.8 × 1070.28--
WireElastic78741.0 × 10110.30--
GroundElastic18002.0 × 1070.30--
BagFabric12006.0 × 1040.30--
SandSoil15134.0 × 1050.303825
Table 3. Friction coefficient values of the numerical model.
Contact MemberContact TypeDynamic Friction Coefficient µdStatic Friction Coefficient µs
Bag and sandAUTOMATIC_SURFACE_TO_SURFACE0.100.10
Sandbag and groundAUTOMATIC_SURFACE_TO_SURFACE0.350.35
Sandbag and impactorAUTOMATIC_NODE_TO_SURFACE_SMOOTH0.50.5
Table 4. Energy absorption rate of a large sandbag.
Time When Penetration EndsTime When Velocity = 0
Velocity (m/s)Kinetic Energy of Impactor E (J)Strain Energy of Sandbag Eε (J)Kinetic Energy of Sandbag Ev (J)Energy Absorption Rate of Sandbag
E ε   +   E v E 100
(%)
Strain Energy of Sandbag Eε (J)Kinetic Energy of Sandbag Ev (J)Energy Absorption Rate of Sandbag
E ε   +   E v E 100
(%)
4.34755430781287583526247
Table 5. Details of the cases studied.
CasesD1D2D3D4D5D6D7
Sand density (kg/m3)1400150016001700180019002000
Table 6. Energy absorption rate of sandbag by varying sand density.
CasesKinetic Energy of Impactor E (J)Strain Energy of Sandbag Eε (J)Kinetic Energy of Sandbag Ev (J)Energy Absorption Rate
E ε   +   E v E 100 (%)
D175543681138067
D275543673133666
D375543682130266
D475543658126465
D575543697122665
D675543853118767
D775543862114766
Table 7. Details of the cases studied.
CasesH1H2H3H4H5
Position of impactor (m)0.450.550.650.750.85
Table 8. Energy absorption rate of the sandbag by varying position of the impactor.
CasesKinetic Energy of Impactor E (J)Strain Energy of Sandbag (J)Kinetic Energy of Sandbag Ev (J)Energy Absorption Rate
E ε   +   E v E 100 (%)
175683486140465
275613719138468
375543673133666
475463690130066
575393955128170
Table 9. Details of the cases studied.
CasesV1V2V3V4V5V6V7V8V9
Impactor’s velocity (m/s)4.3556789101112
Table 10. Energy absorption rate of the sandbag by varying impactor velocity.
CasesVelocity of Impactor V (m/s)Kinetic Energy of Impactor E (J)Strain Energy of Sandbag (J)Kinetic Energy of Sandbag Ev (J)Energy Absorption Rate
E ε   +   E v E 100 (%)
Failure
Observation
14.3475543673133666Intact
2510,0264865178566Intact
3614,4276880259766Intact
4719,6509126355065Intact
5825,66612,033478966Intact
6932,48315,404617566Intact
71040,10219,210772667Intact
81148,52423,173955467collapsed
91257,74727,57411,46468collapsed
Table 11. Energy absorption rate of two sandbags.
Velocity (m/s)Kinetic Energy of Impactor E (J)Strain Energy of Sandbag 1 (J)Kinetic Energy of Sandbag Ev1 (J)Energy Absorption Rate
E ε 1   +   E v 1 E 100 (%)
Strain Energy of Sandbag 2 (J)Kinetic Energy of Sandbag Ev2 (J)Energy Absorption Rate
E ε 2   +   E v 2 E 100
E1 + E2
4.347554360792560248379868
Disclaimer/Publisher’s Note: The statements, opinions and data contained in all publications are solely those of the individual author(s) and contributor(s) and not of MDPI and/or the editor(s). MDPI and/or the editor(s) disclaim responsibility for any injury to people or property resulting from any ideas, methods, instructions or products referred to in the content.