Article

Integrated Empirical–Analytical–Numerical Assessment of Tunnel Stability in Flysch: A Case Study of the Zenica Tunnel


1
Faculty of Mining, Geology and Civil Engineering, University of Tuzla, Urfeta Vejzagića No. 2, 75000 Tuzla, Bosnia and Herzegovina
2
Faculty of Mining and Geology, University of Belgrade, Djusina 7, 11180 Belgrade, Serbia
3
Faculty of Natural and Technical Sciences, University “Goce Delchev”, Krste Misirkov Street, No. 10-a, 2000 Stip, North Macedonia
4
Public Company Motorways of the Federation of Bosnia and Herzegovina Ltd. Mostar, Adema Buća 20, 88000 Mostar, Bosnia and Herzegovina
*
Author to whom correspondence should be addressed.
Geotechnics 2026, 6(2), 36; https://doi.org/10.3390/geotechnics6020036
Submission received: 17 March 2026 / Revised: 7 April 2026 / Accepted: 8 April 2026 / Published: 10 April 2026
(This article belongs to the Special Issue Recent Advances in Geotechnical Engineering (3rd Edition))

Abstract

This study investigates road tunnel stability in heterogeneous flysch formations using the Zenica Tunnel as a case study. A hybrid research framework integrating empirical classification, analytical modeling, and numerical simulation was applied. The approach combines the Rock Mass Rating (RMR) system, the Convergence–Confinement Method (CCM), and nonlinear two-dimensional finite element (FEM) analyses. Statistical evaluation of the results reveals a strong exponential relationship between the stability factor Ns and measured tunnel convergence, with coefficients of determination (R2) between 0.89 and 0.96. Particular attention was given to sections classified as Category V rock mass. The analysis indicates that when RMR values fall below 25, the stability factor Ns exceeds the critical value of 5, marking the onset of pronounced squeezing behavior. The results show that analytical methods provide conservative estimates of tunnel stability, while numerical modeling enables improved calibration of support system stiffness. The proposed integrated methodology contributes to more reliable stability assessment and support design in road tunnels excavated in complex flysch formations.

1. Introduction

Tunnel construction under complex geological conditions represents one of the most challenging areas of modern engineering practice. Tunnel stability depends on the interaction between the rock mass, excavation geometry, and the support system, where parameters such as rock mass strength, the stability factor, and deformation characteristics must be carefully analyzed [1]. In recent decades, the development of classification systems and empirical methods has significantly improved the ability to predict rock mass behavior during excavation [2].
One of the most commonly used parameters in stability assessment is the Rock Mass Rating (RMR), which enables the quantification of rock mass quality and its correlation with the required support measures [3]. However, numerous authors emphasize that traditional classification systems must be adapted to the specific conditions of deeply excavated tunnels, where high stress levels and complex discontinuous structures may lead to sudden deformations and local failures [4].
Contemporary research indicates that the relationship between rock mass strength (σcm) and the initial stress (p0) is crucial for understanding the deformation behavior of tunnels [5]. Empirical diagrams showing the relationship between deformation ε and the stability coefficient Ns are used as didactic tools for assessing the risk of squeezing and for designing optimal support systems [6]. These diagrams allow engineers to visually estimate stability limits and identify tunnel sections that require special support measures [7].
The literature emphasizes that tunnel lining deformations are not solely a function of stress conditions but also of the structural characteristics of the rock mass, including the orientation and spacing of discontinuities [8]. Mao et al. [9] demonstrated that weak structural planes in stratified rocks may cause significant deformations even when the RMR classification suggests relatively favorable conditions. Similarly, Shen [10] points out that conventional classification systems often underestimate the risk of rockburst phenomena in deeply excavated tunnels.
In addition to empirical methods, numerical modeling has become increasingly important in predicting tunnel behavior. Models based on the Hoek–Brown failure criterion enable a more detailed understanding of the reduction in strength from intact rock (σci) to rock mass strength (σcm) [11]. However, empirical validation of these models remains essential, as actual geological conditions frequently differ from idealized assumptions [12].
The Zenica road Tunnel, which is the subject of this research, represents a section of Corridor Vc with a total length of approximately 3.3 km. The structure passes through complex geological formations characterized by significant variations in RMR values and overburden height. Due to the pronounced geological heterogeneity, previous studies at this site have highlighted the crucial importance of selecting an optimal excavation method in order to minimize damage to the surrounding rock mass, particularly in sections of lower rock quality [13]. In addition to mechanical damage, analyses of groundwater influence along this route have shown that hydrogeological conditions significantly affect the accurate categorization of the rock mass and the appropriate selection of the support type [14].
These parameters directly affect the calculation of σcm, Ns, and λcr, making this tunnel a suitable case study for analyzing a methodology based on the combination of empirical and analytical approaches [15]. The analysis of tunnel deformation behavior under such conditions is not only of local importance but also contributes to the broader body of literature on tunnel stability in complex geological environments [16].
A particular challenge involves supplementing missing data on elevation and overburden height, since reliable stability assessments can only be performed once the dataset is complete [17]. In this context, the methodology of this study is based on the systematic collection and completion of missing data, followed by their processing through empirical formulas and stability diagrams [18].
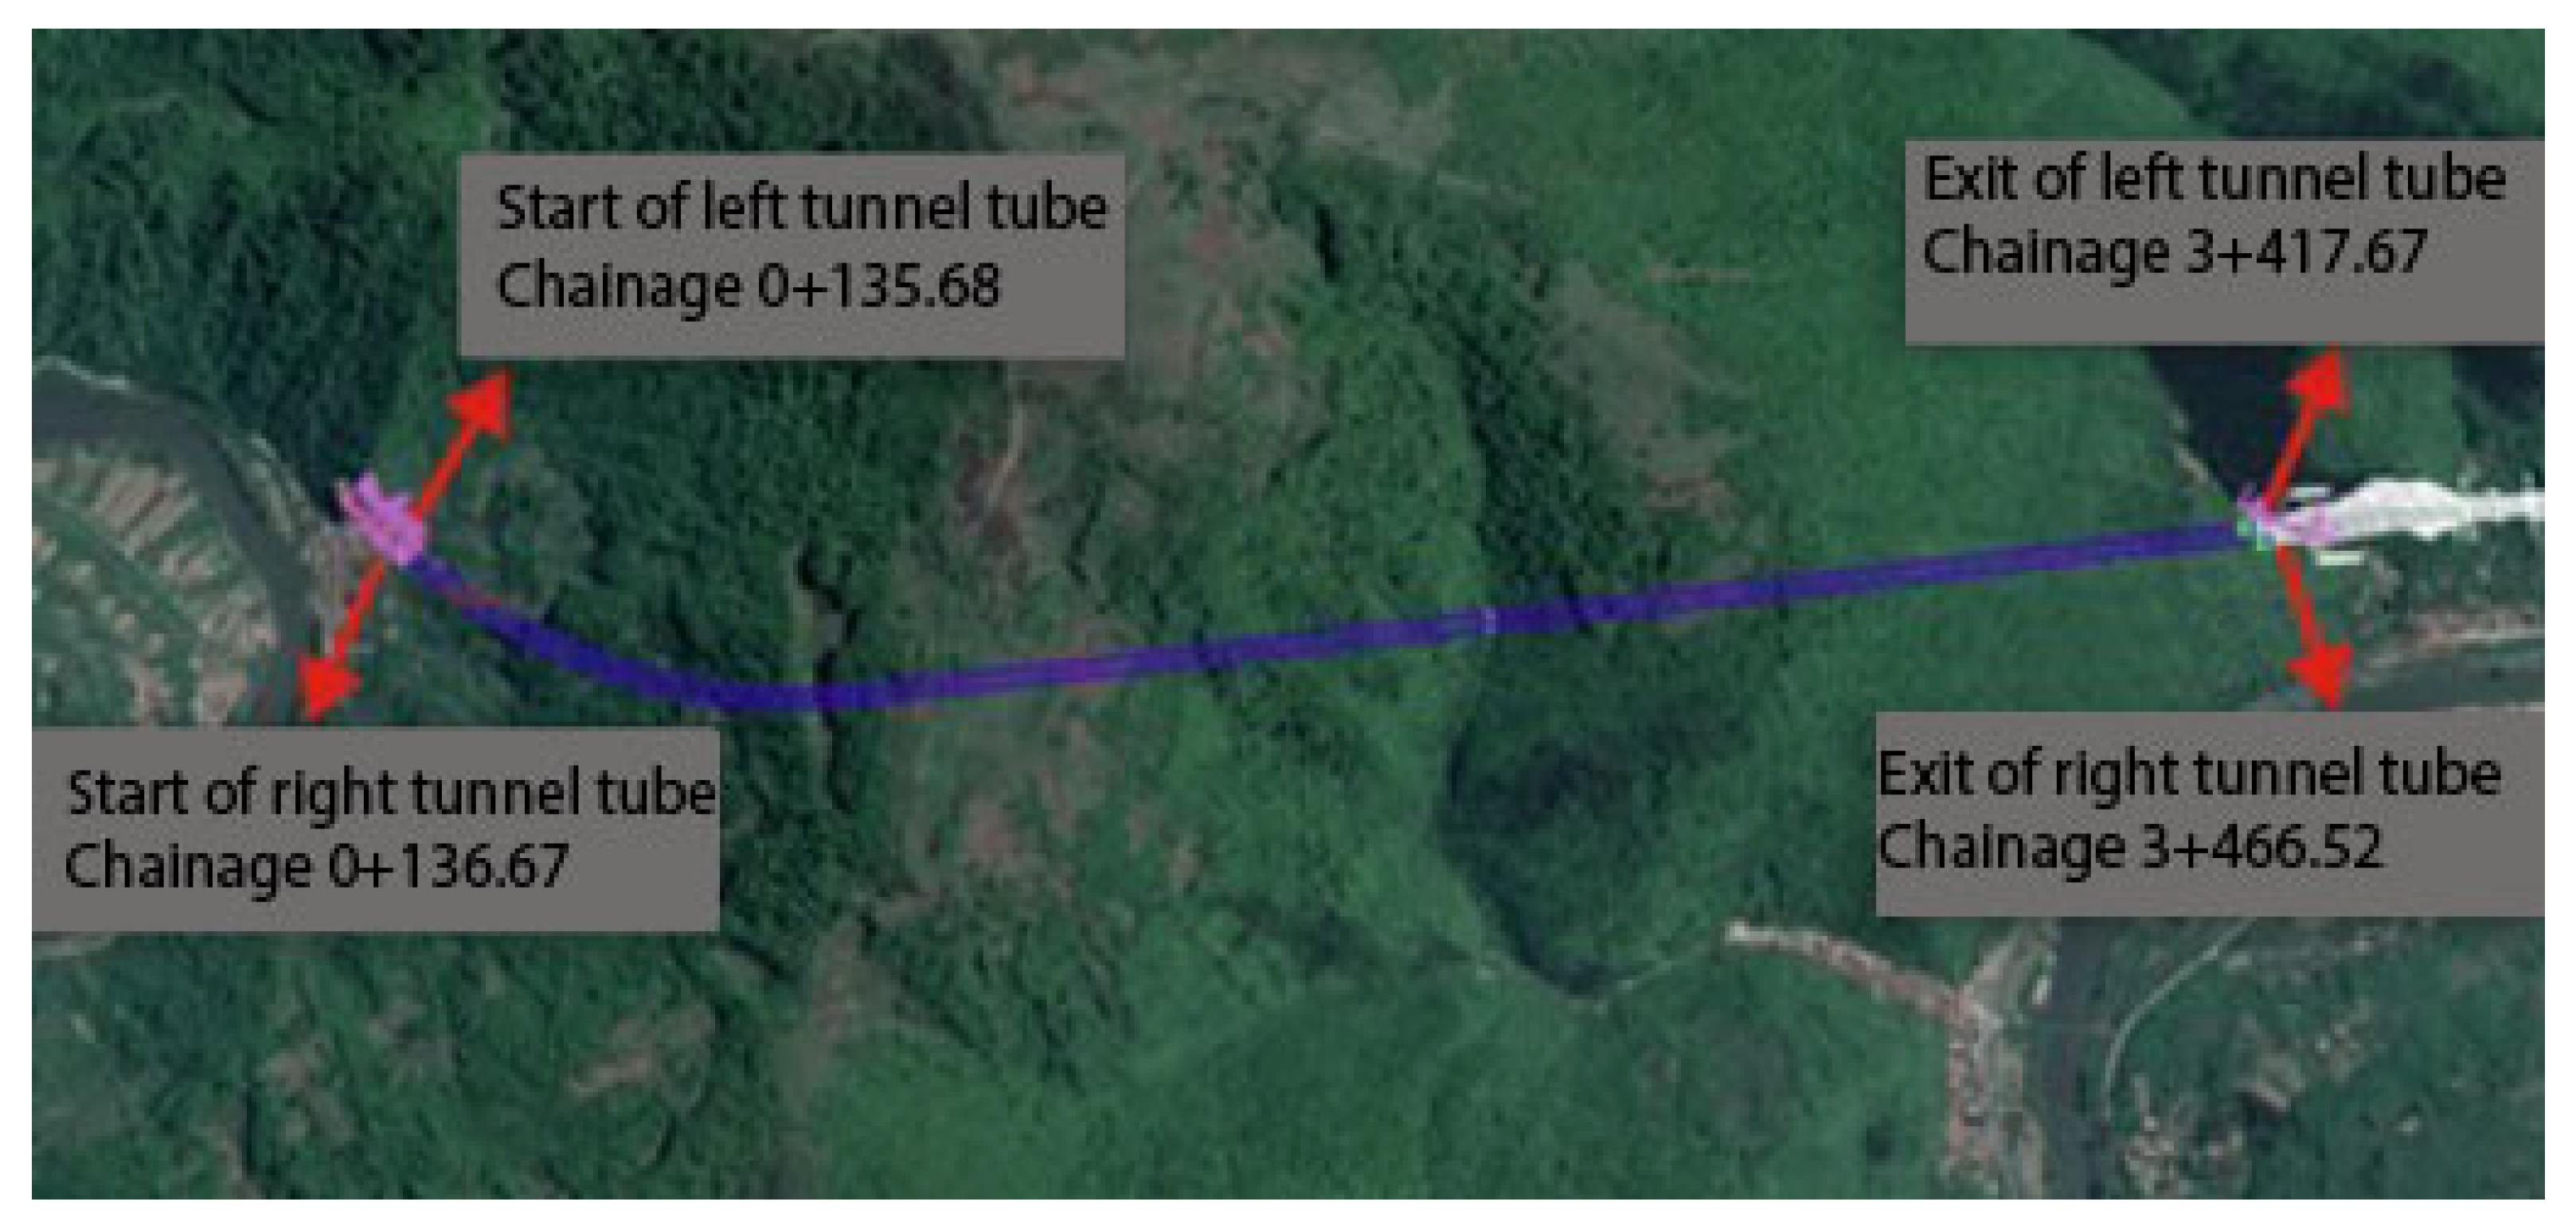
Numerous studies confirm that the combination of empirical classification systems and numerical modeling yields the most reliable predictions of tunnel behavior [19]. For example, Zhu et al. [20], through numerical simulations, demonstrated that integrating data on complex geological structures, such as fault zones, significantly improves the accuracy of deformation predictions and enables optimization of the primary support system. Niu et al. [21] emphasize the need for developing new classification systems that account for the specific challenges of deeply excavated tunnels. The systematic processing of key parameters—such as chainage, RMR values, and overburden height—forms the backbone of the methodological approach, within which calculations of rock mass uniaxial compressive strength, the stability factor, and the critical degree of stress relief are performed for representative tunnel sections. Such an approach ensures a high level of transparency and reproducibility of results, fully aligned with contemporary requirements of the scientific community. In order to provide a complete spatial context and highlight the significance of the structure, Figure 1 presents the geographical location of the Zenica road Tunnel along Corridor Vc, which is essential for understanding the logistical and environmental aspects associated with its construction [22]. Midpoints of the road tunnel tubes (center to center spacing between the tubes is 25 m) have following coordinates (WGS84): 44°16′42.0″ N, 17°54′52.7″ E (Start) and 44°15′00.2″ N, 17°54′13.8″ E (Exit).
The scientific contribution of this study lies in the quantified integration of the analytical convergence–confinement model with numerical FEM analysis through the direct correlation of the stability coefficient Ns, the critical degree of stress relief λcr, and the rock mass classification parameters (RMR). A unified methodological framework is established for identifying stability thresholds and deformation behavior of tunnels as a function of rock mass quality, thereby improving the reliability of critical zone assessment and the optimization of support measures.

2. Materials and Methods

2.1. Methodological Framework for Tunnel Stability Analysis

The stability analysis of the Zenica road Tunnel is based on an analytical approach within the framework of the Convergence–Confinement Method (CCM), combined with the interpretation of geomechanical parameters of the rock mass obtained from field and laboratory investigations. The methodology is focused on quantifying the relationship between initial stresses, rock mass strength, and the degree of stress relief during excavation, through the application of the dimensionless stability coefficient Ns and the critical degree of stress relief λcr.
The Zenica road Tunnel is a key infrastructure object on Corridor Vc, with a length of approximately 3.3 km, passing through the mountain massif between Ponirak and Donja Gračanica. The tunnel route traverses a complex geological setting belonging to the Late Miocene clastic deposits, characterized as a flysch sequence. Engineering geological mapping during excavation revealed a rhythmic alternation of several key lithological units: sandstones, marls, and claystones, with localized occurrences of breccias and conglomerates. A significant portion of the tunnel face consists of marls and claystones, which have been heavily degraded by tectonic activity, often reaching the state of tectonized breccias with clayey matrix. Sandstones act as more competent layers but are frequently intersected by multiple joint systems in folded zones. This pronounced heterogeneity and anisotropy of the flysch sequence directly dictate the variations in rock mass quality, ranging from competent, thick-bedded sandstone units to very weak, friable zones of marls and claystones, as quantified by the RMR classification in this study.
The analysis was conducted on selected sections of the right tunnel tube (RTT) of the Zenica road Tunnel, covering more than two-thirds of the total tunnel length and characterized by a significant range of overburden depth and rock mass quality. Geological monitoring during the excavation of the right tunnel tube showed that, out of a total length of 2440.14 m, 44.28% of the alignment was excavated through Category III rock mass, 48.44% through Category IV, and 7.28% through Category V rock mass. This distribution allows the stability parameters Ns and λcr to be directly correlated with the actual rock mass classifications and their proportional occurrence along the alignment. Such coverage enables a representative and comprehensive parametric analysis of tunnel stability under varying geomechanical conditions.

2.2. Problem Geometry and In Situ Stresses

The tunnel profile was idealized as an equivalent circular cross-section, enabling the application of standard analytical solutions within the framework of the Convergence–Confinement Method (CCM) approach [12]. The initial stress state in the rock mass was assumed to be approximately hydrostatic, which represents a common approximation in the analysis of deep tunnels.
While the assumption of a hydrostatic stress state (k = 1) facilitates the application of classical CCM solutions, it is important to acknowledge that flysch formations, characterized by significant lithological heterogeneity and tectonic disturbance in the Zenica region, may exhibit degree of stress anisotropy. In such geostructural environments, the lateral stress coefficient can vary due to folding, faulting, or persistent discontinuities. However, due to the absence of site-specific in situ stress measurements, the hydrostatic model was adopted as a robust and standard baseline for this assessment, with potential anisotropic effects being indirectly reflected through the observed deformation patterns and stability factor analyses. The initial vertical stress at the tunnel axis was determined using the following expression [23]:
σ 0 = γ · H ,
where γ is the unit weight of the rock mass and H is the overburden height above the tunnel axis. For the analyzed sections of the Zenica Tunnel, a value of γ = 26 kN/m3 was adopted, determined based on laboratory testing of representative rock mass samples, in accordance with the dominant lithological characteristics of the area.

2.3. Assessment of Rock Mass Strength

The mean uniaxial compressive strength of the rock mass, σcm, was determined based on the intact rock strength σci and the rock mass quality expressed through the RMR classification. However, in zones of pronounced tectonic disturbance, where RQD < 25% and where three dominant joint families have been identified, the reduction of intact rock strength becomes significantly more pronounced. Such discontinuities result in a highly fractured rock mass structure and the formation of blocks of varying dimensions, which further compromises the stability of the tunnel profile. In such cases, empirical calculations of σcm must be complemented by numerical modeling in order to realistically capture the complex behavior of the rock mass. For the calculation of σcm, the following empirical relationship was used [3]:
σ c m = σ c i · exp R M R 100 24 ,
This approach enables a realistic reduction in intact rock strength in accordance with the degree of fragmentation, structural characteristics, and the condition of discontinuities within the rock mass.

2.4. Stability Number Ns

For the assessment of tunnel stability, the dimensionless stability coefficient Ns was used, defined as the ratio between the initial rock mass stress and the mean uniaxial compressive strength of the rock mass (Panet, 1995; Hoek, 2007) [24,25]:
N s = σ 0 σ c m ,
The value of the Ns coefficient enables a unified assessment of the influence of overburden depth and the mechanical characteristics of the rock mass, independently of the tunnel profile geometry. An increase in Ns is directly associated with an increase in tunnel convergence, expansion of the plastic zone, and a reduction in the stability of the tunnel profile. According to the available literature, Ns < 1 indicates elastic behavior of the rock mass, whereas Ns ≥ 1 denotes elasto-plastic behavior with the development of a plastic zone around the tunnel [6,7,26].

2.5. Evolution of the Degree of Stress Relief with Respect to the Excavation Face Position

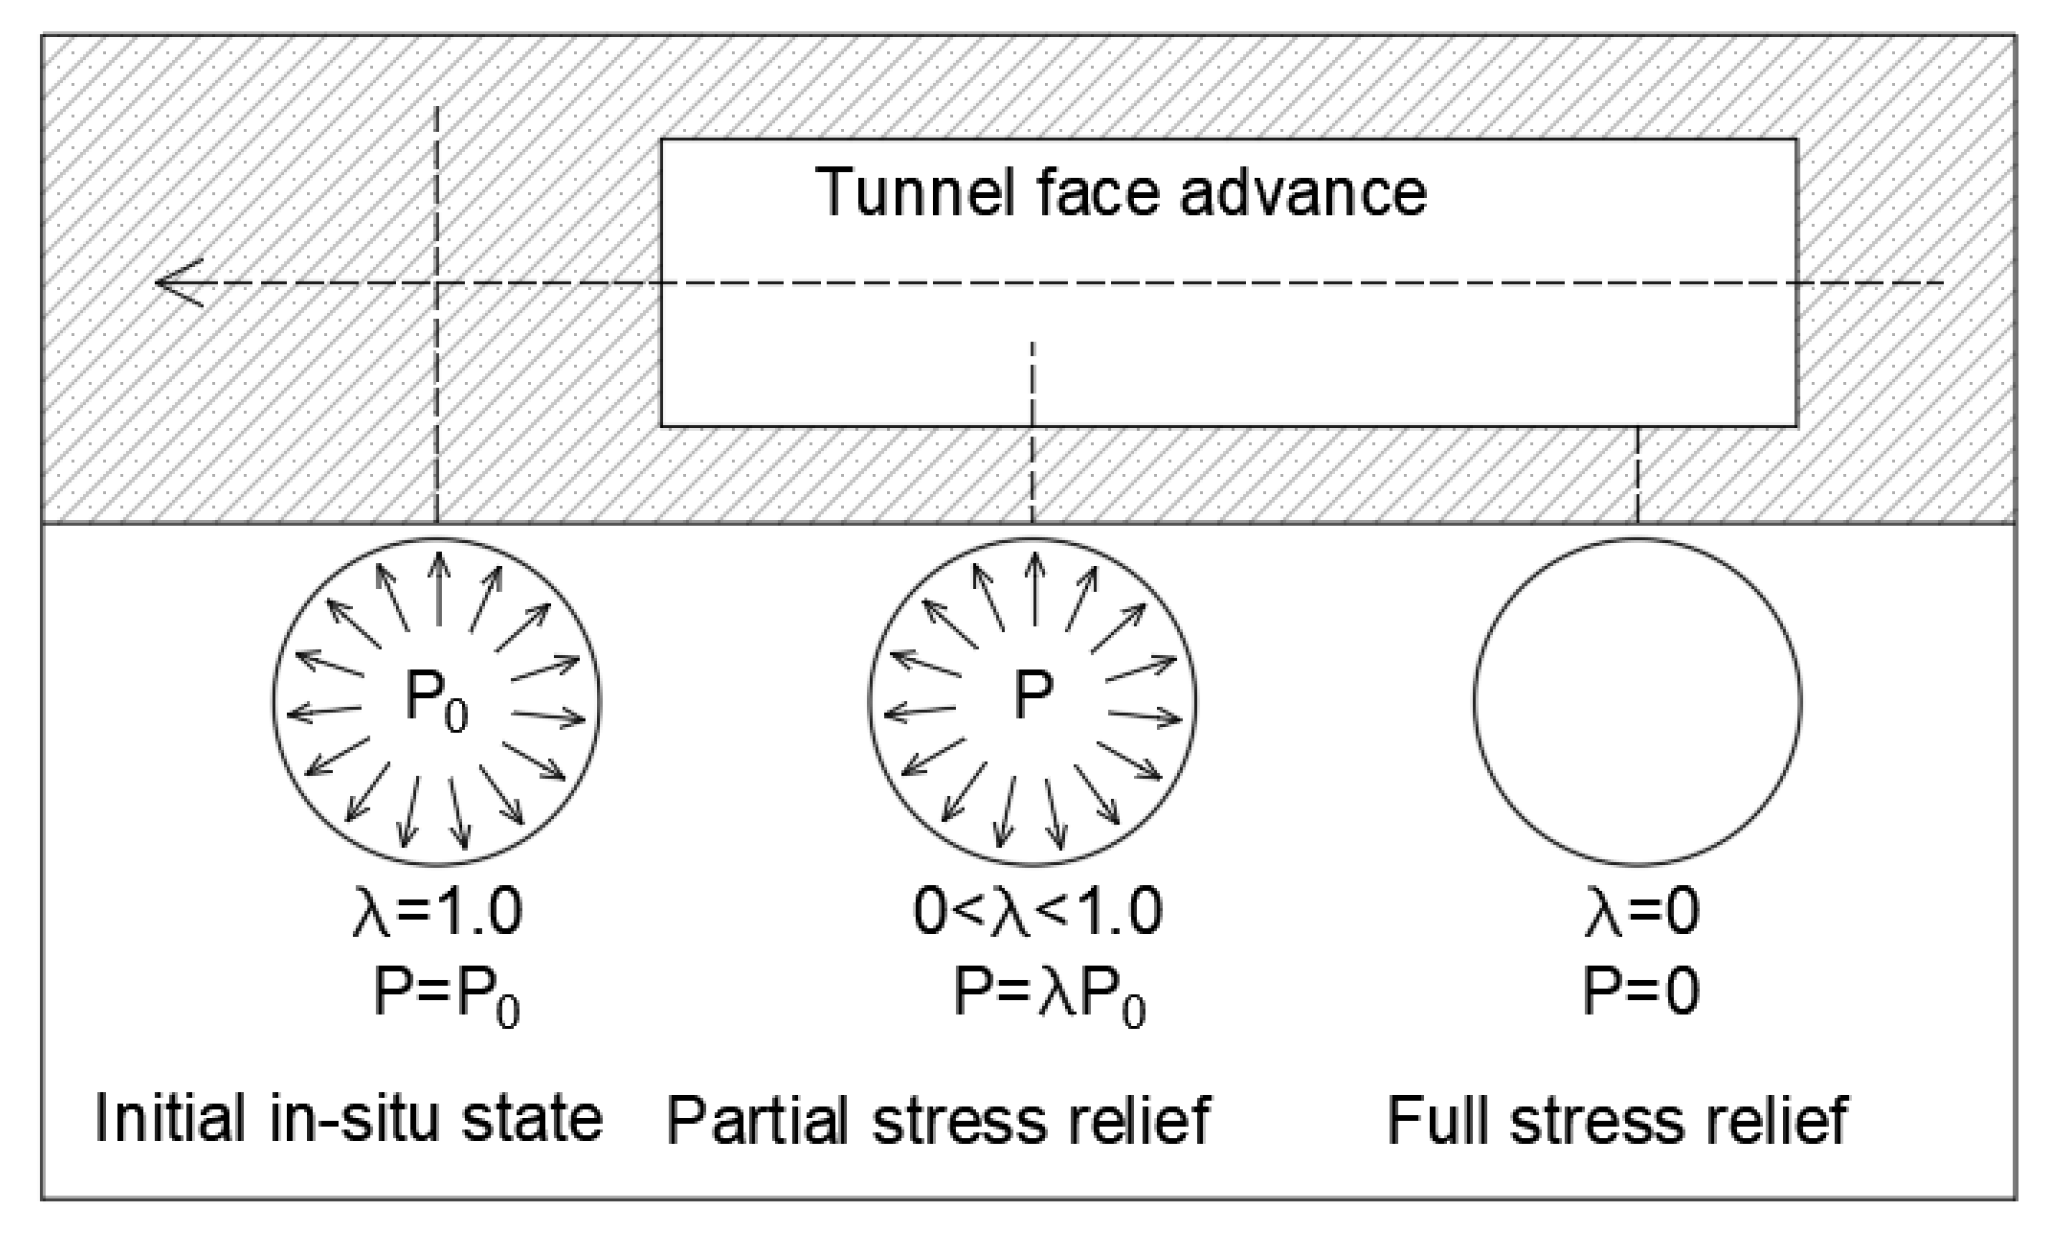
The degree of stress relief of the rock mass does not represent a constant value but depends on the position of the excavation face relative to the observed tunnel cross-section. As the excavation face advances, a gradual release of the initial stresses occurs, with the majority of tunnel convergences already developing several tunnel diameters behind the excavation face. This behavior is a consequence of the three-dimensional stress state in the face zone, where the rock mass retains partial confinement.
The development of the degree of stress relief λ as a function of the longitudinal distance from the excavation face is shown in Figure 2, where it can be observed that the value of λ increases with distance from the face and asymptotically approaches a unit value in the zone behind the face where deformations have stabilized. In the immediate vicinity of the excavation face, λ values are relatively small, whereas the critical stability condition is reached when the limiting value λcr is attained, after which a rapid increase in deformations and the development of a plastic zone around the tunnel profile occur.
The presented concept of the development of the degree of stress relief (Figure 2) is used in this study as the theoretical basis for defining the critical degree of stress relief λcr and for establishing its relationship with the dimensionless stability coefficient Ns.
For the purpose of a more accurate assessment of the development of the degree of stress relief in the excavation face zone, a correction factor was introduced in the analysis to partially compensate for the three-dimensional nature of the stress state. Although the convergence–confinement concept is based on the idealization of the tunnel profile in a two-dimensional plane, the longitudinal effects of excavation advance have a significant influence on the distribution of deformations and the stabilization of stresses behind the excavation face. The application of a correction factor, following the recommendations of Vlachopoulos and Diederichs (2009) [27], enables a more consistent linkage between the analytical model and the actual behavior of the rock mass, thereby ensuring a more reliable interpretation of the critical degree of stress relief λcr in relation to the dimensionless stability coefficient Ns.

2.6. Definition of the Critical Degree of Stress Relief

The degree of stress relief λ is defined as the ratio between the initial rock mass stress and the radial stress taken by the support system [28]:
λ = σ 0 σ r σ 0 ,
where σr is the radial stress acting on the tunnel contour. The critical value λcr represents the stability threshold at which a transition occurs from stable to unstable rock mass behavior, accompanied by a rapid increase in deformations.

2.7. Deformation Analysis and Stability Charts

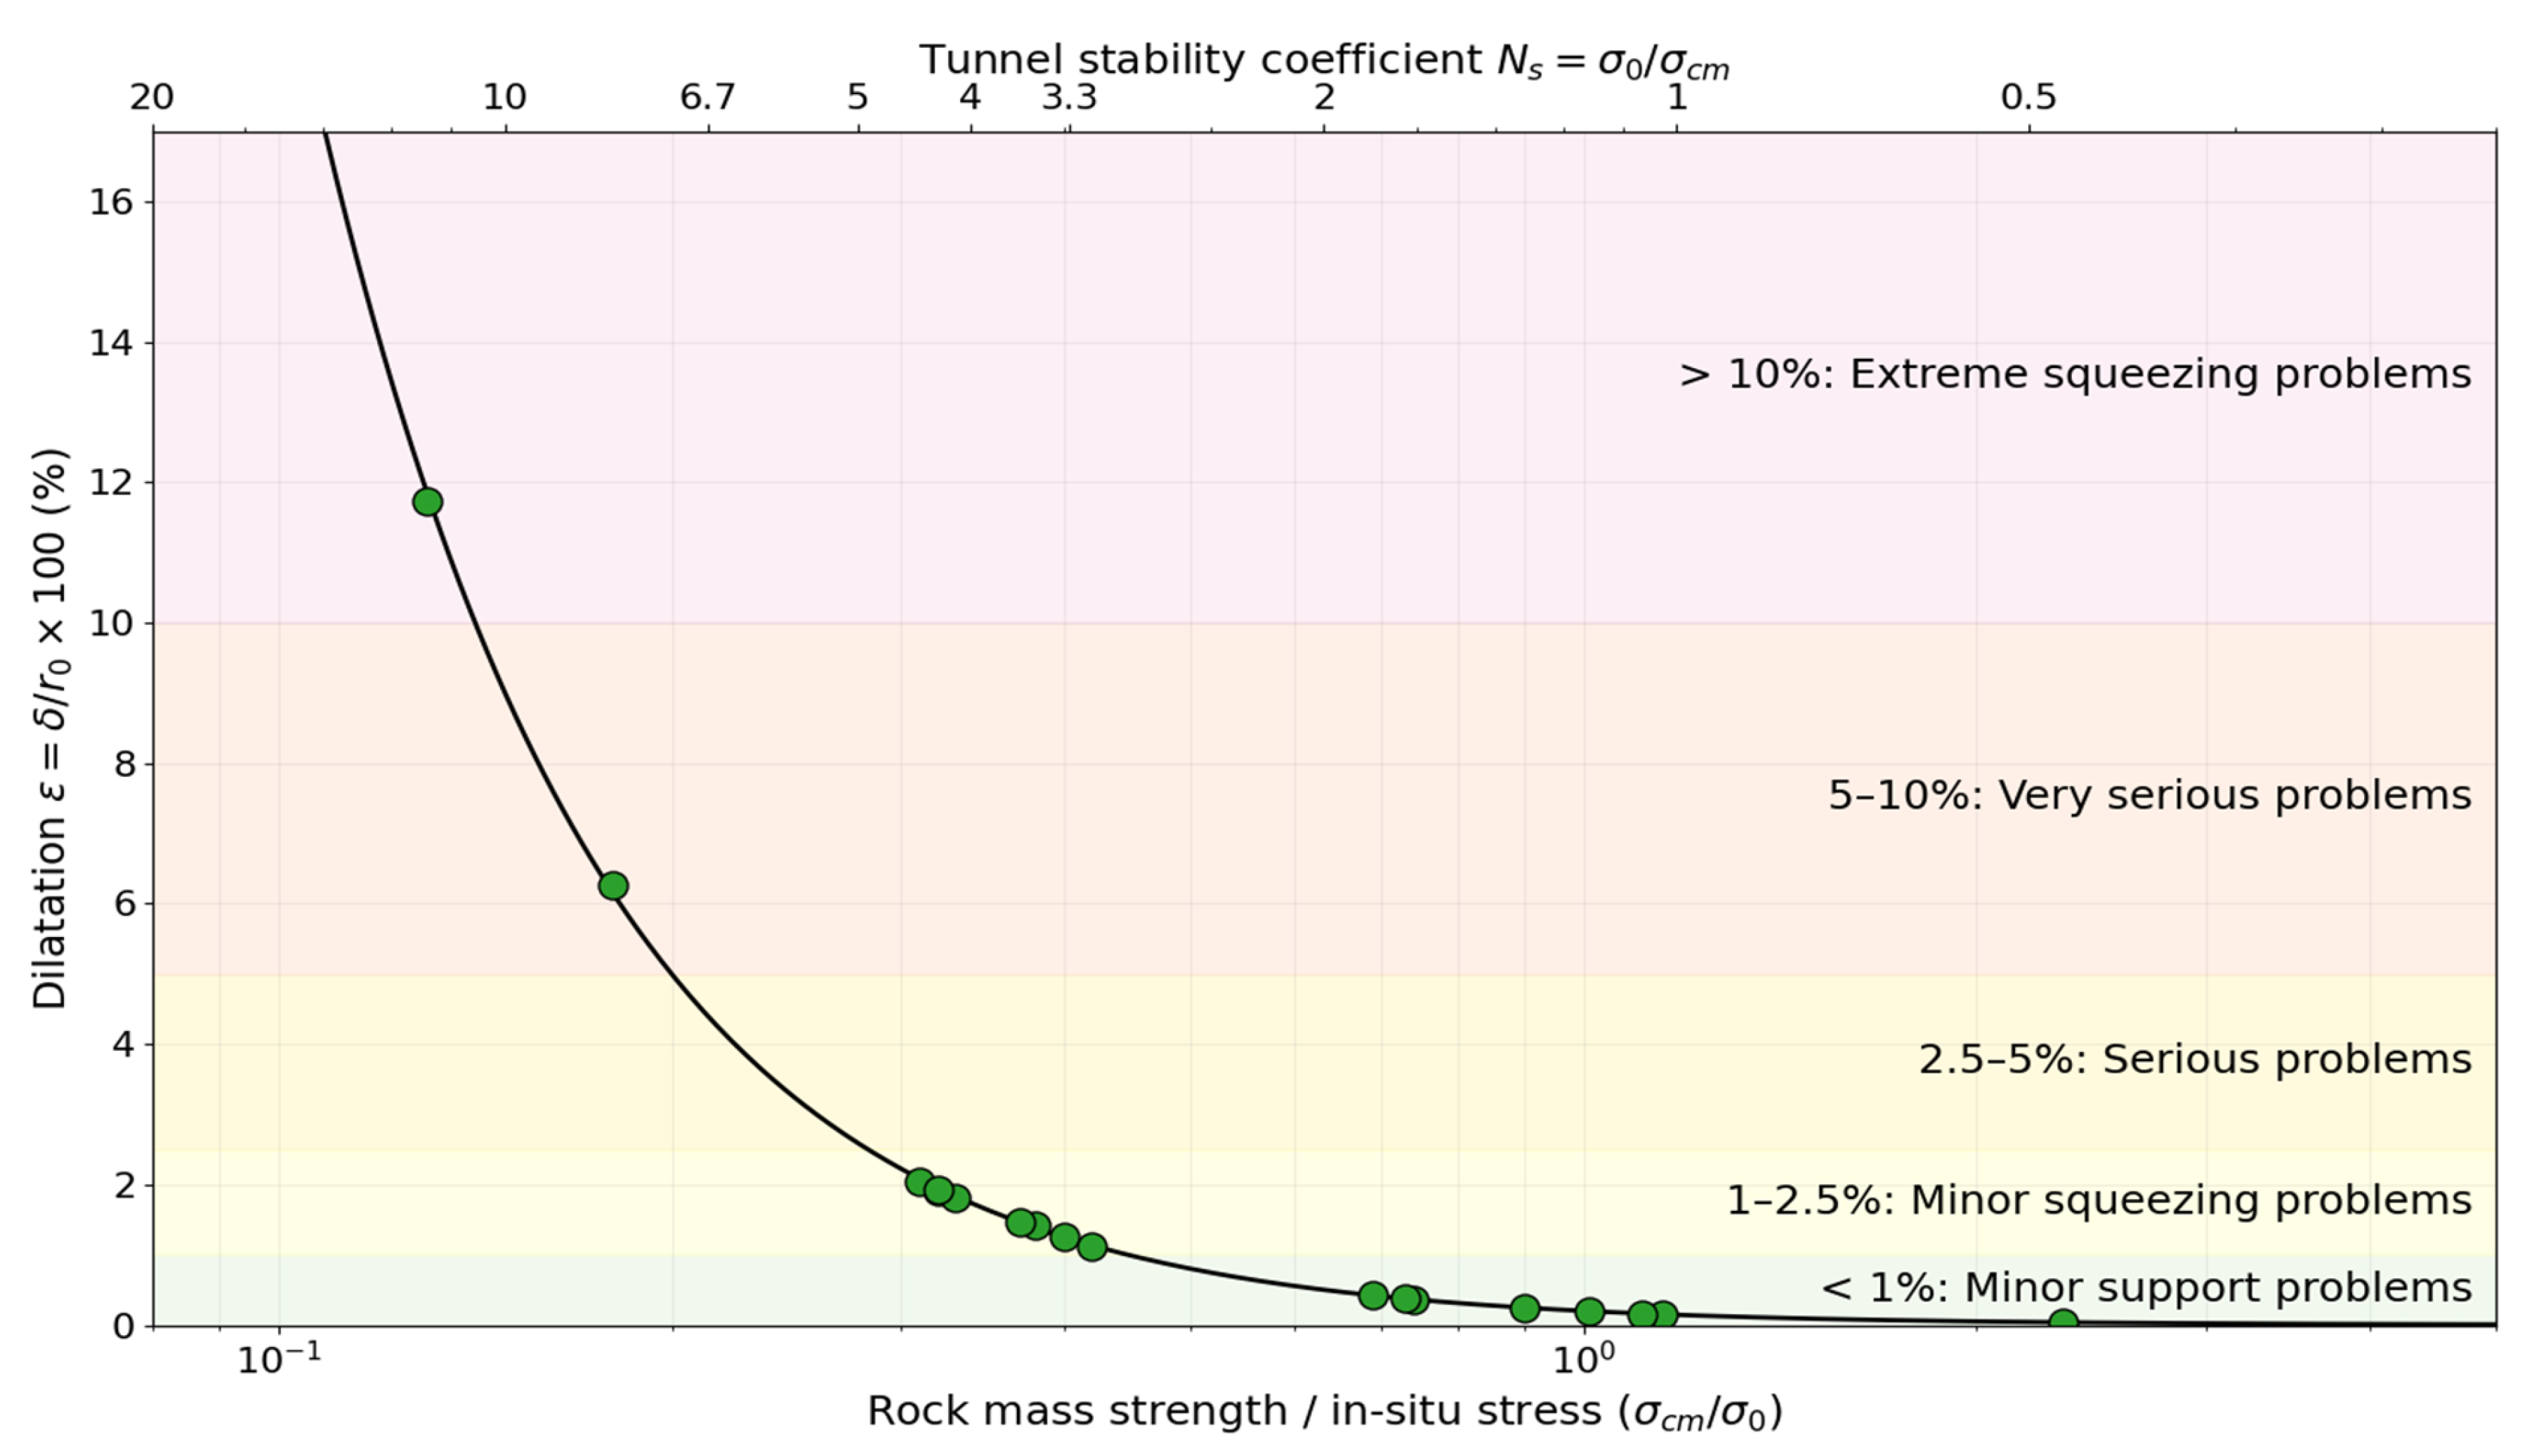
Based on the calculated values of σcm, σ0, and Ns, diagrams were constructed in the subsequent phase of the study to illustrate the relationship between the relative deformation of the tunnel profile and the ratio σcm0, that is, the value of the stability coefficient Ns.
The relative deformation of the tunnel contour ε (%) is defined as the ratio between the radial displacement of the tunnel wall δ and the radius of the equivalent circular opening r0. For the purpose of analytically predicting the maximum dilation at the tunnel contour, the empirical relationship proposed by Hoek (2007) [25] was used, which establishes a nonlinear dependence of deformation on the stability coefficient Ns [29]:
ε % = δ r 0 · 100 ,
This expression enables the consistent positioning of the analyzed tunnel sections on stability diagrams, transforming the calculated geomechanical relationships into relevant stability indicators. The application of this relationship provides a theoretical basis for categorizing the behavioral regimes of the rock mass depending on the intensity of the predicted tunnel convergences. These diagrams allow a clear distinction between elastic, elasto-plastic, and unstable regimes of rock mass behavior.
The analyzed sections of the Zenica Tunnel were positioned on reference stability diagrams, enabling the assessment of their stability conditions relative to theoretical threshold values and the identification of zones with an increased risk of excessive deformations.
For the interpretation of the stability diagrams, thresholds of relative tunnel profile deformation were introduced, expressed through the ratio δ/r0. Deformations less than 1% are considered acceptable and indicate an elastic behavior regime of the rock mass, i.e., “minor support problems.” Deformations between 1% and 2.5% indicate “minor squeezing problems,” while values from 2.5% to 5% correspond to “serious problems.” A further increase in deformation, within the range of 5% to 10%, represents “very serious squeezing problems,” whereas deformations exceeding 10% indicate “extreme squeezing problems” and a high risk of loss of support system integrity [6,29]. The application of these thresholds enables the classification of the analyzed tunnel sections in terms of design acceptability, thereby operationalizing stability diagrams as a tool for engineering decision-making.

2.8. Numerical Validation of the Analytical Model of Tunnel Stability

Finite element method (FEM) numerical modeling was applied as a complementary step in the validation of the analytical approach based on the convergence–confinement concept. The model was developed in the software package PLAXIS 2D, with the tunnel profile idealized as an equivalent circular cross-section and with the introduction of a layered rock mass structure.
The geomechanical parameters of the rock mass were defined based on the interpretation of field and laboratory investigations, including the uniaxial compressive strength of intact rock, rock mass classification according to the RMR and GSI systems, and the corresponding parameters of the nonlinear Hoek–Brown constitutive model.
In order to ensure full transparency and reproducibility of the numerical analysis, Table 1 presents the key geomechanical parameters used in the FEM model for the characteristic tunnel cross-sections.
The numerical model enables the simulation of stress and deformation distribution in the vicinity of the tunnel profile, as well as the interaction between the rock mass and the support elements during staged excavation advancement. The particular significance of the FEM analysis lies in its ability to identify local zones of stress concentration and the development of plastic deformations that are not captured by simplified empirical calculations. In this way, the analytical calculations of the stability coefficient Ns and the critical degree of stress relief λcr are complemented by numerical simulations that more realistically reflect actual geological conditions and the complex behavior of the rock mass.
The back-analysis using the FEM approach was performed on a representative cross-section located approximately at the midpoint of the analyzed length of the right tunnel tube, which, based on its geological and geomechanical characteristics, is considered typical for the observed tunnel section. This approach enables a reliable correlation between numerical results, analytical stability indicators, and available deformation measurements, allowing their interpretation within the framework of reference stability diagrams.
The numerical discretization of the model was carried out using 15-node triangular elements, ensuring high accuracy in the calculation of displacement fields and stress gradients. A high-density mesh was generated with approximately 3000 elements on average, with additional refinement in the immediate vicinity of the tunnel contour where the highest gradients of plastic deformation are expected.
Boundary conditions were defined at a distance of at least five tunnel diameters from the excavation axis, thereby eliminating boundary effects on the results. The simulation of the construction process was conducted through three key stages:
  • Establishment of the initial geostatic stress state (K0 procedure);
  • Simulation of excavation with gradual contour unloading using the β-method (deconfinement method);
  • Installation of the primary support (shotcrete and rock bolts) and calculation of the final tunnel convergences until equilibrium conditions were achieved.

2.9. Methodological Significance of the Applied Methodology

The applied methodology enables a systematic and transparent analysis of tunnel stability under complex geomechanical conditions, with clearly defined physical assumptions and limitations. The particular value of this approach lies in the ability to directly link dimensionless analytical parameters with the real tunnel structure, thereby providing a reliable basis for interpreting measured deformations and improving both design and construction solutions under similar geotechnical conditions.

3. Results and Discussion

The analysis of the obtained results indicates that the deformation behavior of the Zenica Tunnel within flysch deposits largely corresponds with the theoretical concepts proposed by Hoek (2001) and Carranza-Torres (2004) [5,30]. However, while these authors suggest a linear relationship between strength and stress for homogeneous rock masses, the present study shows that the presence of marl and sandstone interlayers within the flysch leads to a nonlinear increase in deformation when the Ns value exceeds 5. In comparison with similar projects reported in NATM literature, where deformations of 1–2% are generally considered critical, the values exceeding 5% recorded in sections with RMR < 25 confirm that the flysch formation at the Zenica site is highly sensitive to excavation staging and the rate of support activation.
The stability analysis of the Zenica Tunnel was conducted using an integrated approach that combines analytical assessment based on the Convergence–Confinement Method (CCM) with numerical validation using the Finite Element Method (FEM). This approach enabled the correlation of theoretical stability indicators, expressed through the stability coefficient Ns and the critical degree of stress relief λcr, with the actual stress–deformation state of the rock mass.

3.1. Analytical Evaluation of the Stability Coefficient Ns

The values of the stability coefficient Ns along the tunnel alignment range from 0.13 to 7.66, clearly indicating a pronounced heterogeneity of the geomechanical conditions. An overview of the calculated Ns values, together with the corresponding geometric and geomechanical parameters for individual chainages, is presented in Table 2.
In sections with lower overburden depth, the values of the stability coefficient Ns remain below unity (Ns < 1), indicating predominantly elastic behavior of the rock mass, where deformations are limited and remain within acceptable limits for stable tunnel construction. With increasing overburden depth, the Ns coefficient exceeds the threshold value of one, entering the zone of elasto–plastic behavior characterized by the development of controlled plastic zones around the excavation profile. The most unfavorable stability conditions were identified in sections where Ns values exceed 5, indicating significantly reduced stability of the rock mass [31]. A particularly critical section is located at chainage 0+689.21–0+707.78, where the stability coefficient reaches a maximum value of 7.66 (Table 2), representing an extreme case of unstable rock mass behavior. The obtained results confirm that the Ns coefficient reliably reflects the combined influence of overburden depth and rock mass quality. The critical Ns values clearly coincide with zones of low RMR index values, indicating good consistency between the analytical model and the actual lithological and geomechanical conditions along the tunnel alignment.

3.2. Relative Deformation Analysis and Stability Thresholds

Based on the calculated values of the stability coefficient Ns and the ratio σcm0, an assessment of the relative radial deformations of the tunnel profile ε (%) was performed, the values of which for each section are presented in Table 2. The results indicate that the predicted deformations span a very wide range, from a minimum of 0.04% to a maximum of 11.73%. Such variability enables a precise categorization of tunnel sections according to the intensity of potential squeezing, which is of crucial importance for the design of appropriate support system types.
Sections with shallow overburden H < 100 m (e.g., chainage 0+155.76 to 0+329.30) maintain deformations well below the threshold of 1%, confirming an elastic regime in which support-related problems are negligible. In contrast, the section at chainage 0+689.21–0+707.78 shows an extreme dilation of 11.73%, which according to the adopted criteria indicates a high risk of loss of support system integrity. For the visual identification of rock mass behavior regimes and their direct correlation with the adopted theoretical stability limits, Figure 3 presents the reference stability diagram with the analyzed sections positioned accordingly.

3.3. Relationship Between the Critical Degree of Stress Relief (λcr) and Tunnel Stability

Within the applied Convergence–Confinement Method (CCM) framework, the critical degree of stress relief λcr represents the threshold at which a transition occurs from stable to unstable behavior, accompanied by the rapid development of a plastic zone. An analysis of the data presented in Table 2 indicates that in sections characterized by pronounced instability (Ns > 5), the values of λcr reach high levels, as observed at chainage km 0+689.21 where λcr equals 0.87. This implies that most of the potential deformation is mobilized in the immediate vicinity of the excavation face, requiring the rapid installation of the primary support.
In contrast, in more stable sections classified as Category III, such as the chainage 1+150.00–1+183.12, the λcr value is significantly lower and amounts to 0.26, allowing gradual stress relief with minimal loading on the support elements.
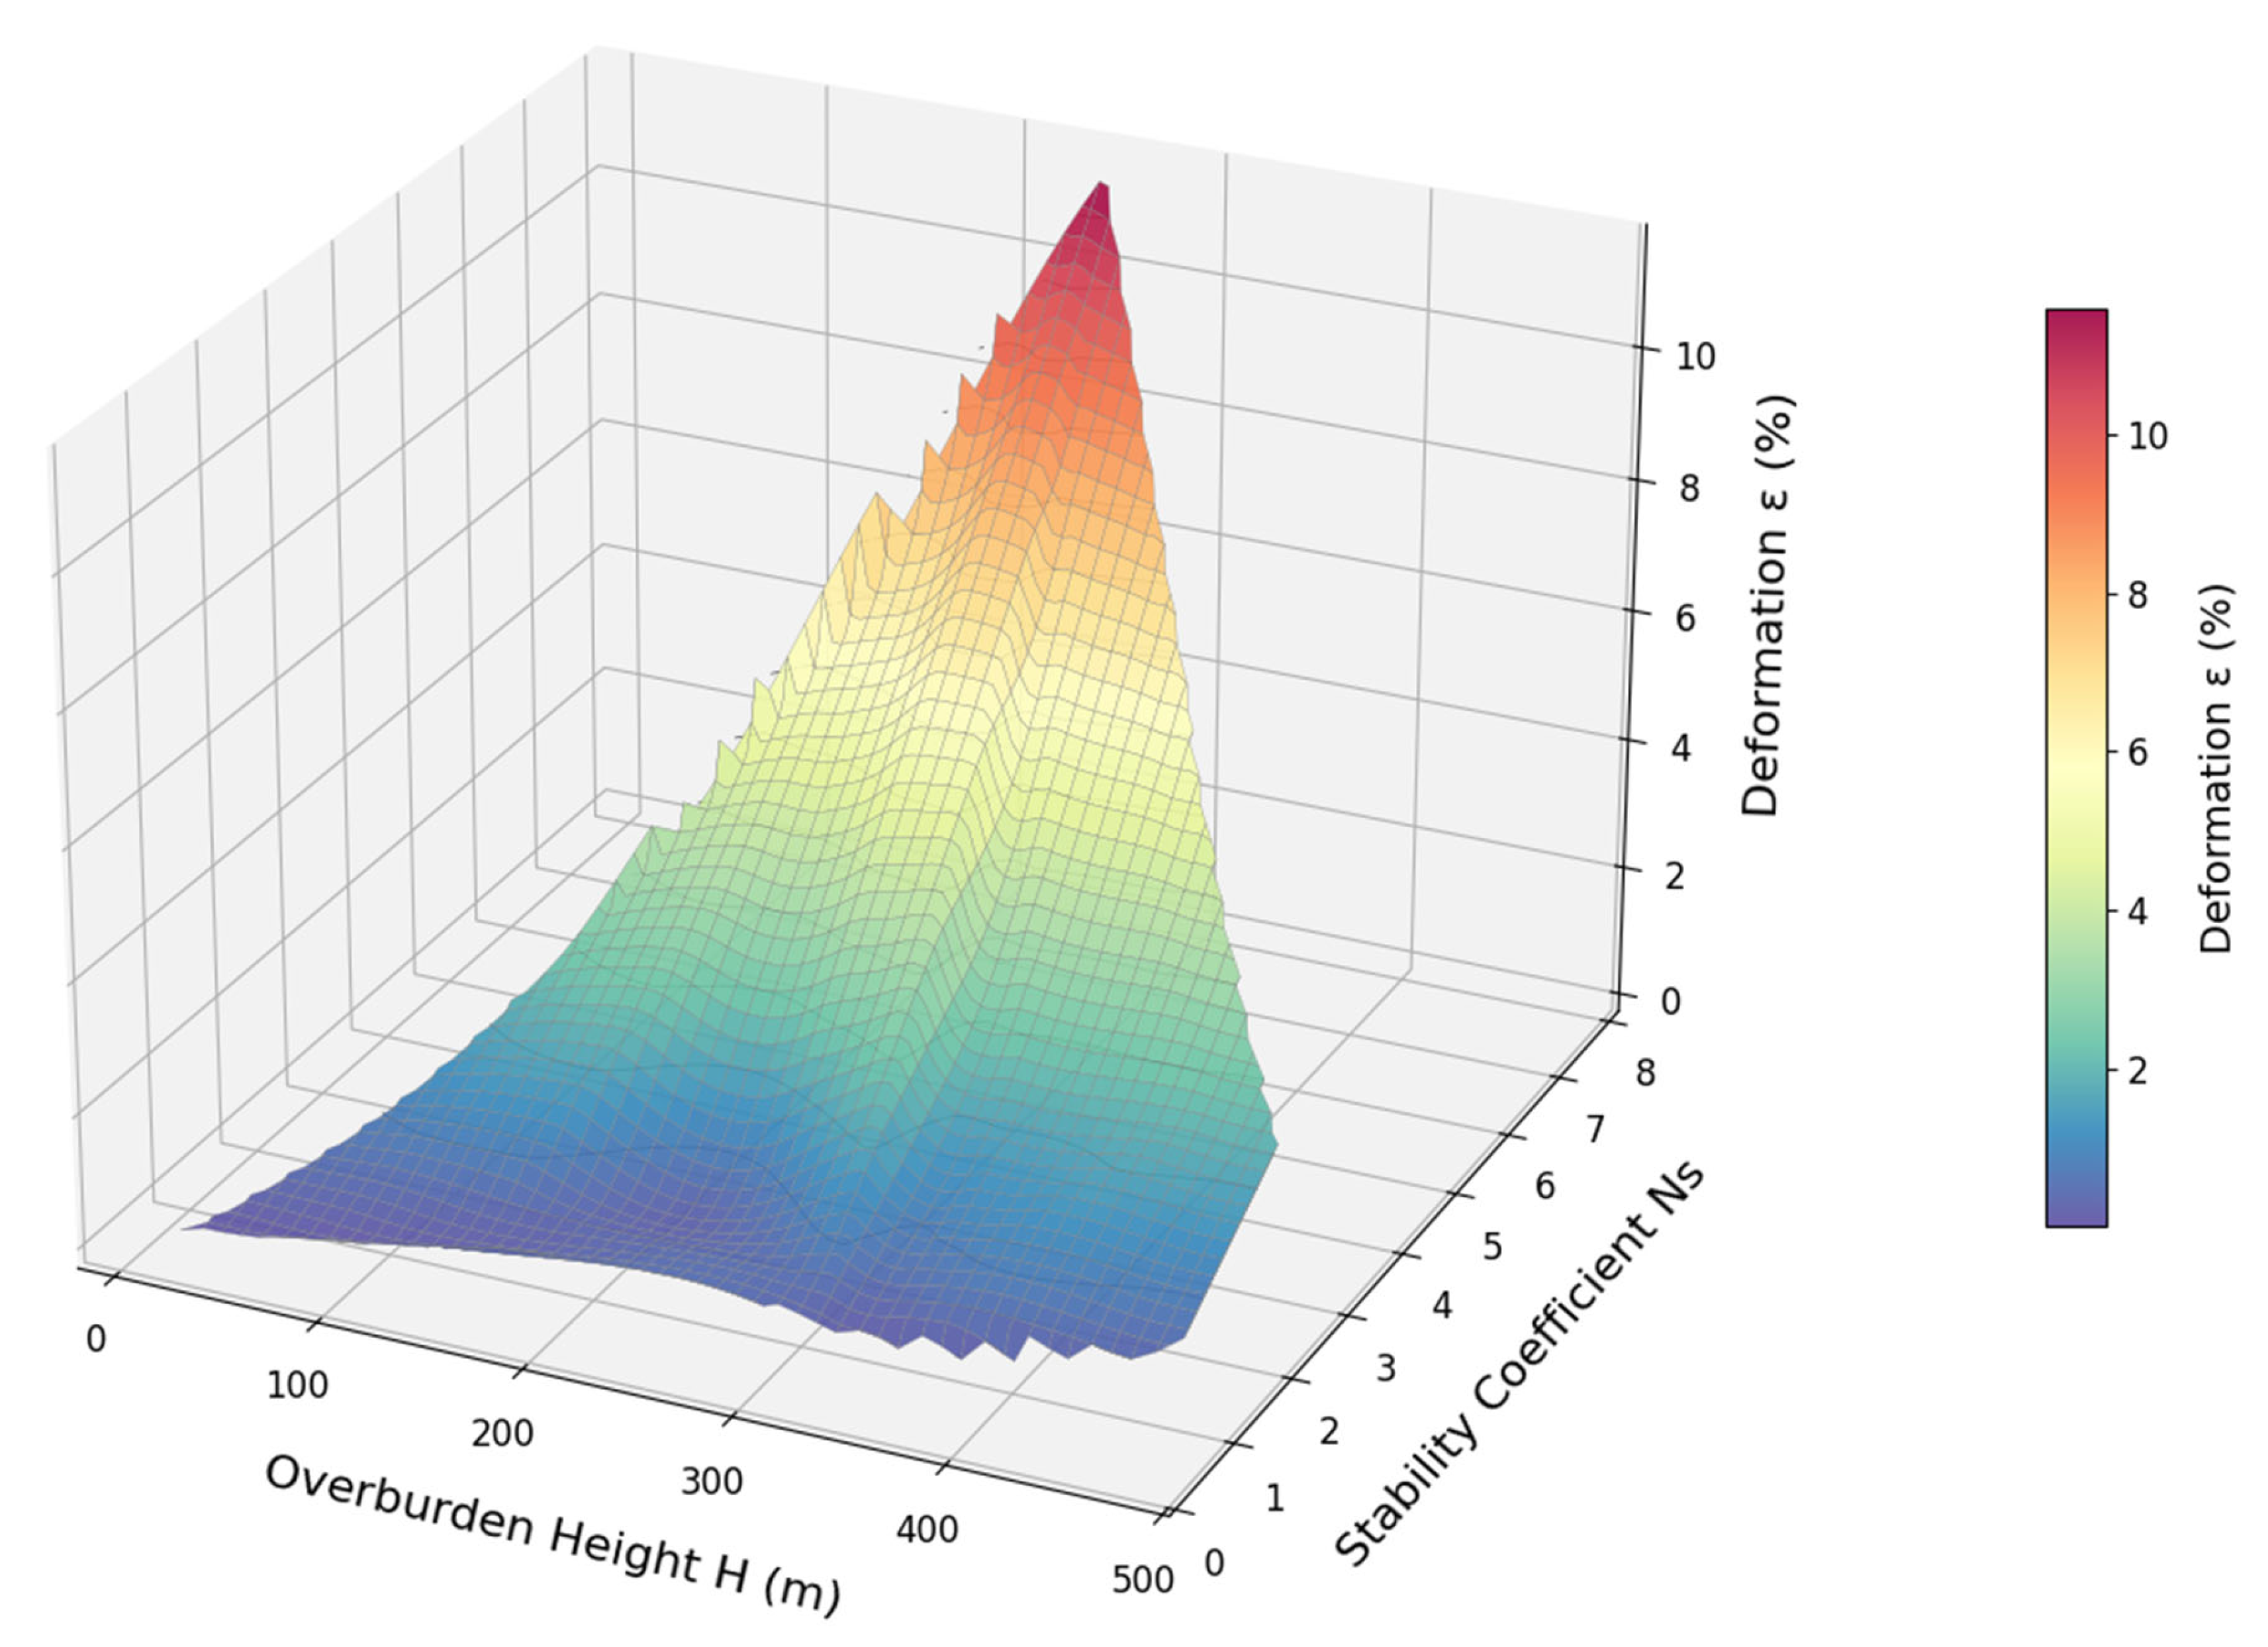
A comprehensive representation of the interaction between the overburden height H, the stability coefficient Ns, and the relative deformation ε is provided through a three-dimensional model shown in Figure 4.

3.4. Numerical Validation and Spatial Analysis of Tunnel Stability

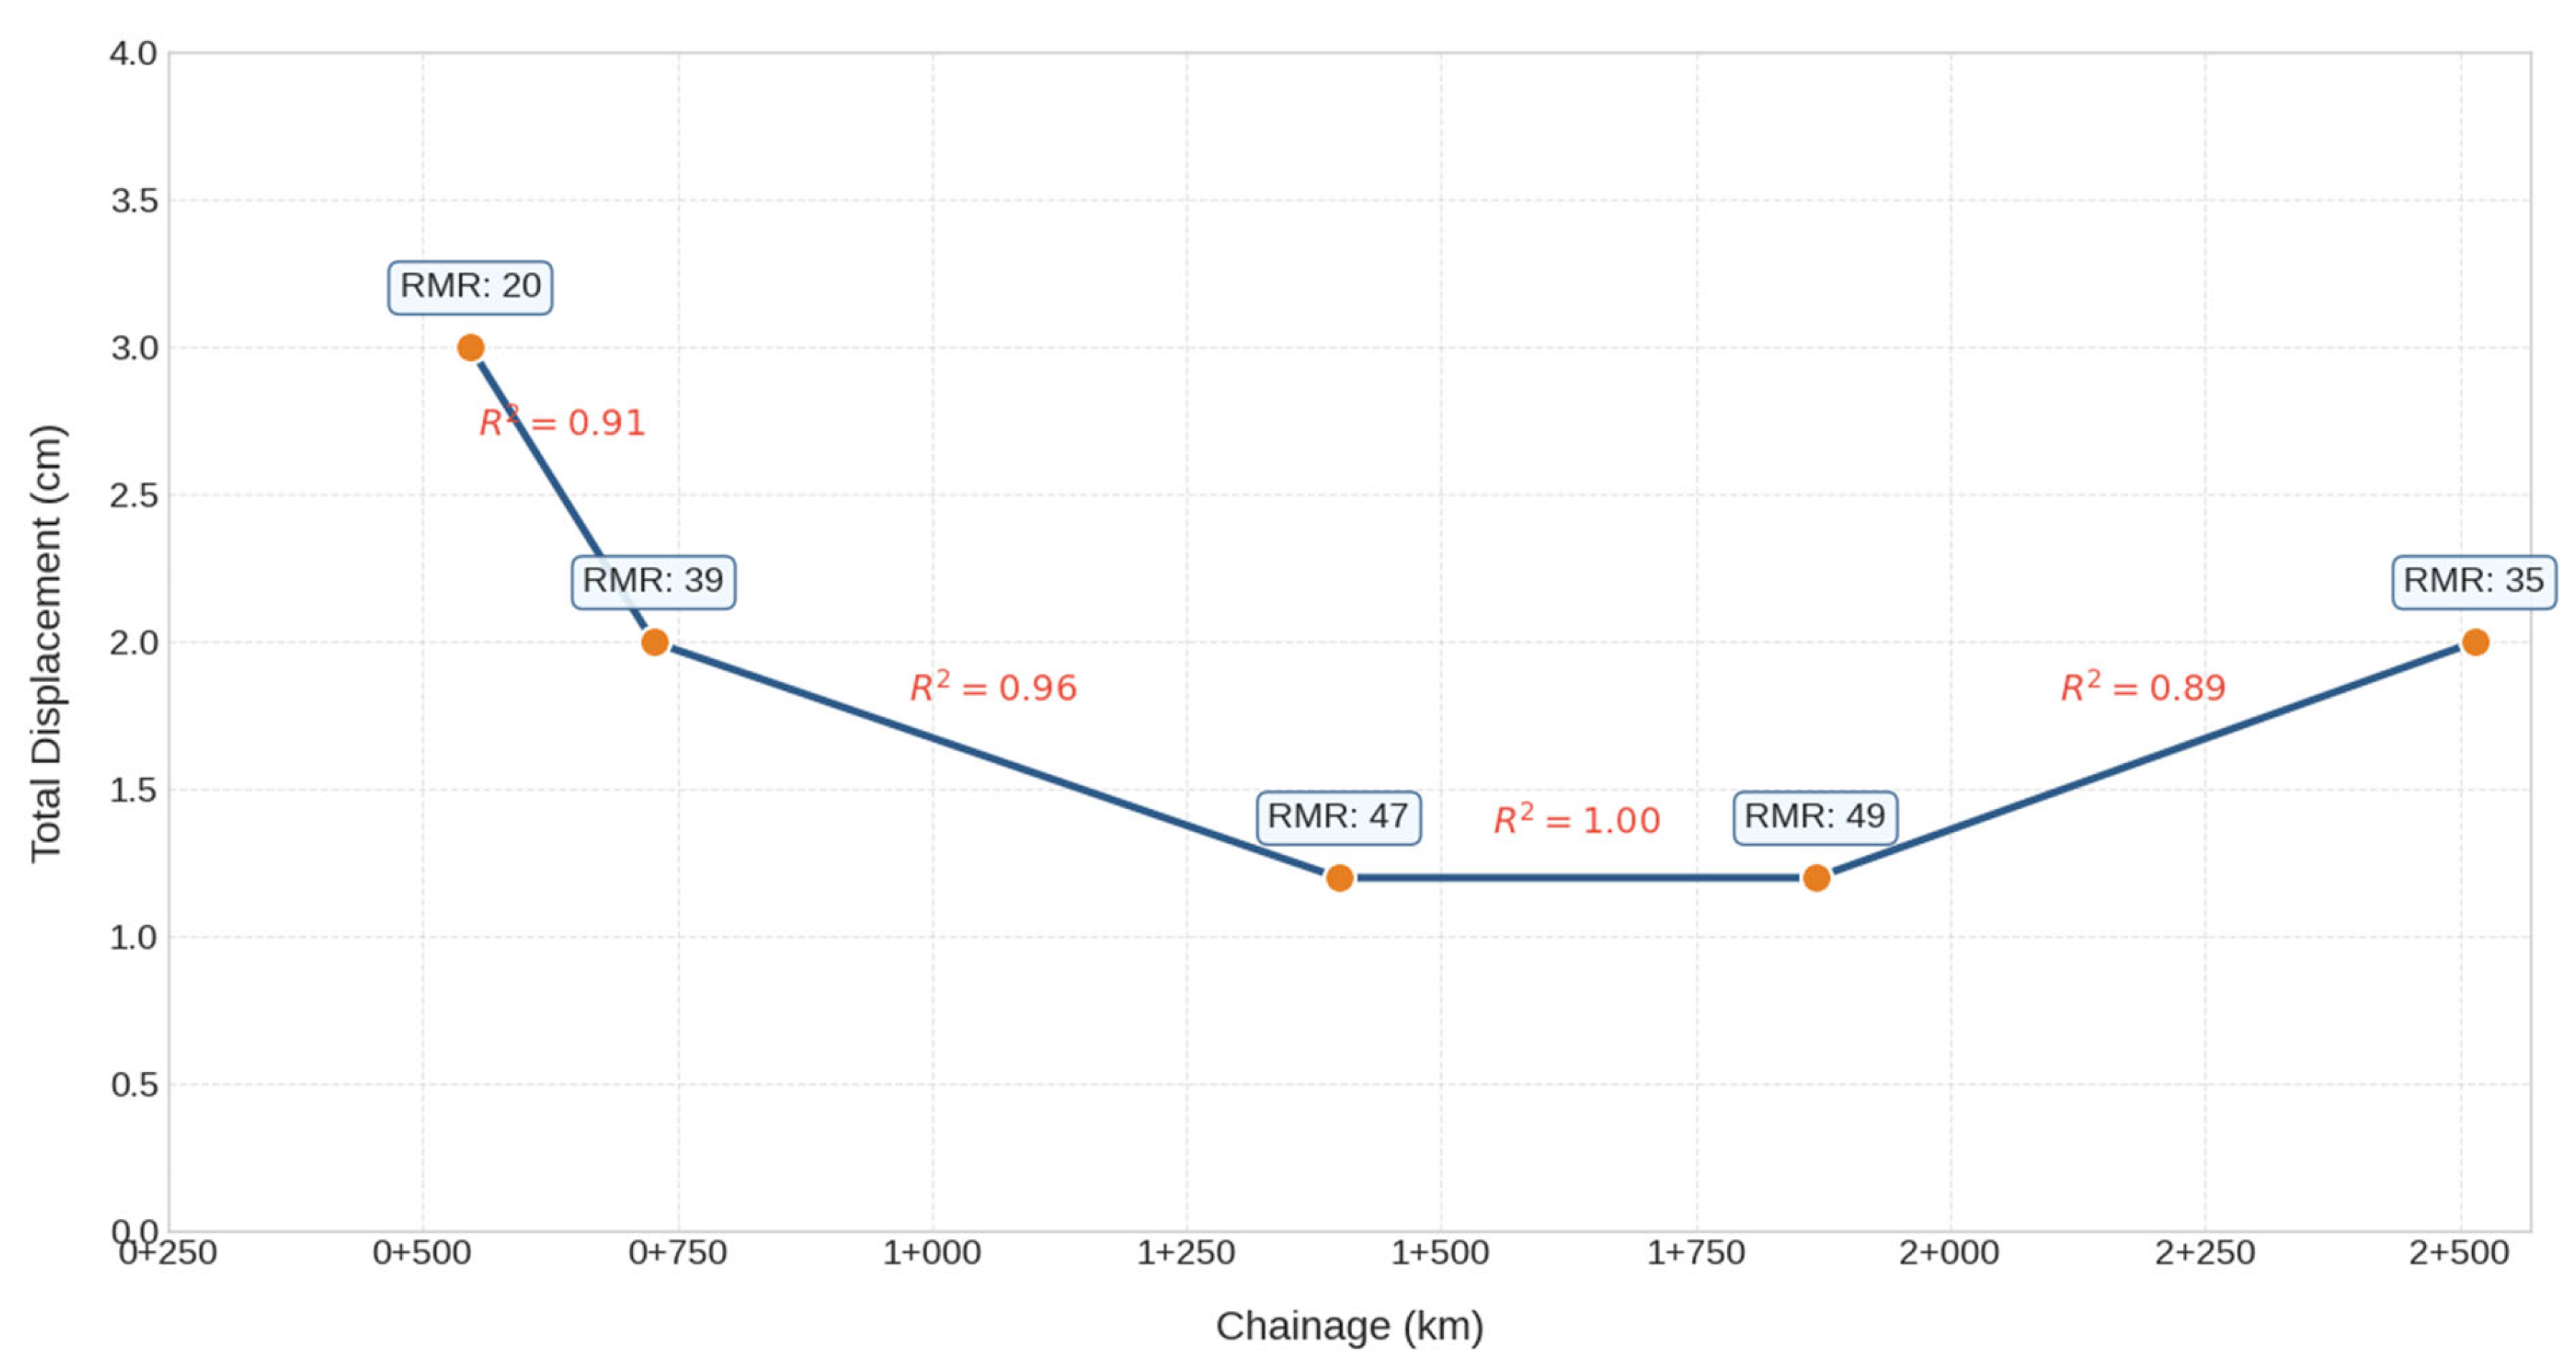
The numerical validation of the analytical model, carried out through back-analyses in the software package PLAXIS 2D CONNECT Edition V20 (version 20.4.0.790), confirmed the trends identified by the Convergence–Confinement Method (CCM) [32]. Simulation results obtained for five representative cross-sections show that maximum displacements ranging from 29.0 to 35.2 mm directly correlate with sections classified as Category V rock mass (RMR ≤ 20), where the highest values of the stability coefficient Ns were also recorded. Statistical validation of these results, presented through local correlation coefficients in Figure 5, confirms the high reliability of the model (R2 ranging from 0.89 to 0.96).
It should be clarified that the high coefficient of determination values (R2 = 0.89 to 0.96) primarily validate the internal consistency between the analytical (CCM) and numerical (FEM) models. While these results confirm that both methodological approaches yield aligned trends in identifying critical stability zones, they do not inherently imply absolute predictive capability for in situ conditions without direct verification against field monitoring data. Given the absence of in situ measurements in this stage of the study, the achieved correlation serves as a confirmation that the theoretical stability frameworks for flysch rock masses have been reliably translated into the numerical environment.
By comparing the analytical and numerical results, it was observed that the CCM methodology provides conservative estimates of deformations, particularly in zones classified as Category V rock mass, where the analytical model predicts significantly higher values compared to the FEM simulations. Nevertheless, both approaches consistently identify the same critical zones along the tunnel alignment, confirming the reliability of the analytical model for global stability assessment, while FEM allows a more realistic interpretation of local displacements and the distribution of plastic zones.
This enhanced realism in the FEM model stems partly from the ability to incorporate the actual horseshoe-shaped geometry of the tunnel cross-section, in contrast to the analytical CCM model, which necessitates the idealization of an equivalent circular profile. Although the circular approximation may introduce localized discrepancies in stress distribution, particularly within the tunnel invert and corners, a comparative analysis of the results confirms that it does not compromise the overall stability assessment trends. Minor deviations in the extent of the plastic zone between the two methods remain within engineering-acceptable tolerances, thereby justifying the application of this integrated approach in heterogeneous flysch formations.
The analysis indicates that for RMR values below 30, nonlinear rock mass effects become dominant, which is clearly reflected in the change in slope of the curve shown in Figure 5. This complementarity of methods ensures that design decisions are based on conservative analytical indicators, supplemented by numerical verification that refines the estimation of deformation intensity. The application of reinforced support systems in these sections ensured safety factors ranging from 1.38 to 1.45, thereby confirming the adequacy of the construction solutions in critical zones [33].
Figure 5 presents the analytical profile of the expected contour displacements of the right tunnel tube (RTT) obtained through numerical modeling, correlated with the corresponding RMR values and local coefficients of determination (R2).
The analysis shown in Figure 5 clearly identifies a critical point at km 0+547, where low rock mass strength and low RMR values result in maximum contour displacements, while the cross-section at km 1+400 represents a zone of high stability. This agreement between analytical and numerical findings confirms the reliability of the applied methodology for assessing tunnel stability in complex geological environments.
The obtained displacement magnitudes (up to 35.2 mm) and their correlation with RMR values (Figure 5) are fully consistent with contemporary global trends in the behavior of tunnels in heterogeneous flysch formations. By comparison with the fundamental studies conducted by Hoek and Marinos [6], it can be observed that the section at km 0+547, with a stability factor Ns > 5, clearly falls within the squeezing behavior zone, which is also confirmed by more recent studies that refine the Hoek–Marinos curve [34]. This is consistent with the work of Vlachopoulos and Diederichs [35], who emphasize that in weak rock masses the installation of primary support must be precisely timed in order to control the development of plastic zones around the excavation.
Experience from the Zenica Tunnel confirms the findings of more recent research on the behavior of weak and heterogeneous rock masses in flysch deposits [36], where low rock mass strength (RMR < 25) leads to a nonlinear increase in deformations that often exceed 1% of the tunnel diameter. A similar relationship was identified by Vitali [37], who noted that in complex geological environments the anisotropy of stratified layers directly governs the asymmetry of the stress state, which in our model was validated through FEM analysis under conditions of anisotropy and variable overburden depth [38].
While the CCM methodology, based on the work of Carranza-Torres and Fairhurst [39], provides more conservative estimates by predicting larger displacements, our numerical validation shows that the actual stiffness of the support system significantly limits the development of plastic zones. This observation is consistent with contemporary analyses that highlight the limitations of the CCM method under three-dimensional conditions and during partial mobilization of rock mass strength [28], as well as with generalized ground response and longitudinal deformation curve models that extend the classical CCM approach [40].
Furthermore, recent review studies on the integration of empirical classifications (RMR, Q, GSI) with numerical models emphasize that a combined approach represents the most reliable framework for the design of tunnel support systems [41], which is also confirmed by applied numerical studies of support systems in complex geological conditions [42]. Such complementarity of methods ensures the optimization of support systems in critical zones, balancing conservative analytical limits with realistic numerical predictions.

3.5. Limitations of the Research

Despite the achieved high correlation (R2 > 0.89), the study has certain limitations that define the scope of applicability of the proposed model. First, the applied 2D FEM model using the β-method approximates the three-dimensional effect of the excavation face, which in zones of pronounced flysch anisotropy may lead to minor deviations in the distribution of plastic zones.
To quantitatively justify this approach, the stress relief factor (β or λ) was calibrated by aligning the 2D boundary conditions with the analytical convergence predictions from the CCM, ensuring that the mobilized strength of the rock mass reflects the longitudinal deformation profiles. Comparative assessments indicate that for deep tunnels in weak rock masses, the β-method captures the primary elasto-plastic response with a high degree of correlation (R2 > 0.90) to theoretical 3D solutions. While the 2D simplification cannot explicitly model the non-axisymmetric face effects, the close agreement between the calculated displacements and the stability trends suggests that the approximation remains within a 10–15% margin of error, which is considered acceptable for evaluating global stability in complex flysch sequences.
Second, the analysis focuses on the primary elasto-plastic response and does not account for long-term creep effects and time-dependent degradation of strength parameters, which are particularly relevant in weak rock masses under high overburden conditions.
Furthermore, the influence of groundwater was treated through a static reduction of effective stresses. Future research should incorporate fully coupled hydro-mechanical modeling and 3D simulations in order to more precisely define the interaction between flysch layering and asymmetric contour displacements. Such improvements would further enhance the reliability of predictions in critical zones where RMR < 25.
Finally, although a formal stochastic sensitivity analysis was not performed, the influence of key parameter variability (RMR, σci and H) was quantitatively evaluated across the wide range of analyzed cross-sections presented in Table 2. The trends illustrated in Figure 3 and Figure 4 directly serve as a deterministic sensitivity assessment, demonstrating how nonlinear deformation increases become dominant when the RMR drops below 25 and the stability coefficient Ns exceeds 5. This approach confirms that overburden depth (H) and rock mass strength (σci) are the critical drivers for the transition from elastic to plastic behavior, thereby ensuring the robustness of the study’s conclusions regarding tunnel stability in heterogeneous flysch sequences.

4. Conclusions

The conducted research on the Zenica Tunnel demonstrates the critical importance of an integrated approach in predicting the stability of underground structures within heterogeneous flysch formations. Rather than relying on isolated methods, the synthesis of empirical classification, analytical calculations, and numerical validation provides comprehensive insights into rock mass mechanics, showing that the reliability of design solutions lies precisely in their mutual correlation, which significantly reduces the inherent risks associated with flysch environments.
The key scientific contribution of this study lies in the quantification of a clear boundary between controlled response and nonlinear squeezing behavior. The analysis indicates that RMR index values below 25, accompanied by a stability factor Ns greater than 5, represent the critical threshold at which deformations cease to be predictable within linear frameworks. Although traditional CCM methods tend to be conservative, predicting larger theoretical displacements, in engineering practice, they serve as an essential safety buffer. On the other hand, the numerical models used in this research confirm that the timely activation of the support system effectively transforms a theoretically unstable rock mass into a controlled geotechnical framework, maintaining safety factors within a stable range between 1.38 and 1.45.
The high statistical reliability of the identified correlations suggests that the presented model goes beyond the local characteristics of the analyzed tunnel section and offers a broader framework for design in similar geological environments of the Dinarides. Instead of a reactive approach that often relies solely on ad hoc measurements during construction, this study promotes a proactive methodology based on early predictive parameters. Such an approach not only ensures excavation stability in the most challenging rock mass categories but also creates opportunities for scientifically grounded resource optimization, making tunnel construction in flysch formations more predictable, economical, and, above all, a safer engineering undertaking.

Author Contributions

Conceptualization, E.B. and L.C.; methodology, E.B. and L.C.; software, K.G. and A.M.; validation, K.G., R.T. and V.A.; formal analysis, E.B. and A.M.; investigation, L.C. and A.M.; data curation, K.G. and R.T.; writing—original draft preparation, E.B. and L.C.; writing—review and editing, V.A.; visualization, E.B., L.C. and V.A.; supervision, K.G. and R.T. All authors have read and agreed to the published version of the manuscript.

Funding

This research received no external funding.

Institutional Review Board Statement

Not applicable.

Informed Consent Statement

Not applicable.

Data Availability Statement

The data presented in this study are available on request from the corresponding author due to privacy.

Acknowledgments

The authors from the University of Belgrade, Faculty of Mining and Geology would like to express their sincere gratitude for the support provided by the Ministry of Science, Technological Development, and Innovation of the Republic of Serbia, within the framework of support for scientific research at the University of Belgrade, Faculty of Mining and Geology in Belgrade, under contract number 451-03-34/2026-03/200126.

Conflicts of Interest

Ahmed Mušija was employed by the Public Company Motorways of the Federation of Bosnia and Herzegovina Ltd. Mostar. The remaining authors declare that the research was conducted in the absence of any commercial or financial relationships that could be construed as a potential conflict of interest.

References

  1. Elrawy, W.R.; Abdelhaffez, G.S.; Saleem, H.A. Procjena Stabilnosti Podzemnih Iskopa Uporabom Različitih Potpornih Stijenskih Sustava. Rud.-Geološko-Naft. Zb. 2020, 35, 49–63. [Google Scholar] [CrossRef]
  2. Erharter, G.H.; Bar, N.; Hansen, T.F.; Jain, S.; Marcher, T. International distribution and development of rock mass classification: A review. Rock Mech. Rock Eng. 2025, 58, 11169–11180. [Google Scholar] [CrossRef]
  3. Bieniawski, Z.T. Engineering Rock Mass Classifications: A Complete Manual for Engineers and Geologists in Mining, Civil, and Petroleum Engineering; John Wiley & Sons: Hoboken, NJ, USA, 1989. [Google Scholar]
  4. Wu, Z.; Wu, L.; Lin, T.; Niu, W.J. An engineering rock mass quality classification system for deep-buried hard rock tunnels. Front. Earth Sci. 2024, 12, 1453912. [Google Scholar] [CrossRef]
  5. Hoek, E. Big tunnels in bad rock. J. Geotech. Geoenviron. Eng. 2001, 127, 726–740. [Google Scholar] [CrossRef]
  6. Hoek, E.; Marinos, P. Predicting tunnel squeezing problems in weak heterogeneous rock masses. Tunn. Tunn. Int. 2000, 32, 45–51. [Google Scholar]
  7. Barton, N.; Lien, R.; Lunde, J.J. Engineering classification of rock masses for the design of tunnel support. Rock Mech. 1974, 6, 189–236. [Google Scholar] [CrossRef]
  8. Kayabasi, A.; Gokceoglu, C.A.; Ercanoglu, M.U. Estimating the deformation modulus of rock masses: A comparative study. Int. J. Rock Mech. Min. Sci. 2003, 40, 55–63. [Google Scholar] [CrossRef]
  9. Mao, J.; Song, Z.; Fan, S.; Xie, J.; Sun, Y.; Liu, L. Exploration and verification of tunnel stability evolution law under jointed rock mass with various attitudes. Int. J. Civ. Eng. 2024, 22, 689–703. [Google Scholar] [CrossRef]
  10. Chen, Y. Experimental study and stress analysis of rock bolt anchorage performance. J. Rock Mech. Geotech. Eng. 2014, 6, 428–437. [Google Scholar] [CrossRef]
  11. Hoek, E.; Brown, E.T. Practical estimates of rock mass strength. Int. J. Rock Mech. Min. Sci. 1997, 34, 1165–1186. [Google Scholar] [CrossRef]
  12. Hoek, E.; Kaiser, P.K.; Bawden, W.F. Support of Underground Excavations in Hard Rock; CRC Press: Boca Raton, FL, USA, 2000. [Google Scholar]
  13. Bektašević, E.; Antičević, H.; Kadrić, R.; Kadrić, S.; Šehagić, N.; Zukan, S. Određivanje optimalne metode iskopa tunela Zenica u funkciji minimalnih oštećenja stijenske mase lošijeg kvaliteta izvan profila iskopa. E-Zb. Elektron. Zb. Rad. Građevinskog Fak. 2022, 12, 45–60. [Google Scholar]
  14. Bektašević, E.; Mušija, A.; Gutić, K.; Beganović, S.; Čehajić, D. Analysis of the groundwater influence on the categorization of the rock mass and support type of the Zenica tunnel on the route of the Vc corridor. J. Fac. Civ. Eng. 2023, 44, 5–19. [Google Scholar] [CrossRef]
  15. Ismayilov, S.; Fuławka, K.; Adach-Pawelus, K.; Valiyev, A. Comparative Evaluation of Empirical and Numerical Approaches for Ground Support Design: A Case Study from the Gilar Underground Mine. Geosciences 2025, 16, 19. [Google Scholar] [CrossRef]
  16. Singh, B.; Goel, R.K. Engineering Rock Mass Classification; Butterworth-Heinemann: Boston, MA, USA, 2011. [Google Scholar]
  17. Cai, M.; Kaiser, P.K.; Uno, H.; Tasaka, Y.; Minami, M. Estimation of rock mass deformation modulus and strength of jointed hard rock masses using the GSI system. Int. J. Rock Mech. Min. Sci. 2004, 41, 3–19. [Google Scholar] [CrossRef]
  18. Li, C.; Stillborg, B. Analytical models for rock bolts. Int. J. Rock Mech. Min. Sci. 1999, 36, 1013–1029. [Google Scholar] [CrossRef]
  19. Akram, M.S.; Ahmed, L.; Ullah, M.F.; Rehman, F.; Ali, M. Numerical verification of empirically designed support for a headrace tunnel. Civ. Eng. J. 2018, 4, 2575–2587. [Google Scholar] [CrossRef]
  20. Zhu, D.; Zhu, Z.; Zhang, C.; Dai, L.; Wang, B. Numerical simulation of surrounding rock deformation and grouting reinforcement of cross-fault tunnel under different excavation methods. Comput. Model. Eng. Sci. 2024, 138, 2445. [Google Scholar] [CrossRef]
  21. Niu, G.; He, X.; Xu, H.; Dai, S. Development of rock classification systems: A comprehensive review with emphasis on artificial intelligence techniques. Eng 2024, 5, 217–245. [Google Scholar] [CrossRef]
  22. Bektašević, E.; Kadrić, R. Estimate Primary Impacts on the Environment During the Construction of the Tunnel Zenica on the Corrodor Vc. Eng. Technol. J. 2022, 7, 1734–1739. Available online: http://everant.org/index.php/etj/article/view/752 (accessed on 16 March 2026).
  23. Kramer, S.L. Geotechnical Earthquake Engineering Prentice Hall; CRC Press: New York, NY, USA, 1996; p. 794. [Google Scholar]
  24. Panet, M. Le Calcul des Tunnels Par la Méthode Convergence-Confinement; Presses des Ponts et Chaussées: Paris, France, 1995. [Google Scholar]
  25. Hoek, E. Practical Rock Engineering: RocScience. 2007. Available online: http://www.rocscience.com/hoek/PracticalRockEngineering.asp (accessed on 20 February 2026).
  26. Jovčlć, V.; Bučo, J.; Šehagić, N.; Husić, A. Useful concepts for application of new Austrian tunnelling method in tunnel construction (NATM). Građevinski Mater. I Konstr. 2015, 58, 21–36. [Google Scholar] [CrossRef]
  27. Vlachopoulos, N.; Diederichs, M.S. Improved longitudinal displacement profiles for convergence confinement analysis of deep tunnels. Rock Mech. Rock Eng. 2009, 42, 131–146. [Google Scholar] [CrossRef]
  28. Chang, L.; Alejano, L.R.; Cui, L.; Sheng, Q.; Xie, M. Limitation of convergence-confinement method on three-dimensional tunnelling effect. Sci. Rep. 2023, 13, 1988. [Google Scholar] [CrossRef] [PubMed]
  29. Singh, M.; Singh, B.; Choudhari, J. Critical strain and squeezing of rock mass in tunnels. Tunn. Undergr. Space Technol. 2007, 22, 343–350. [Google Scholar] [CrossRef]
  30. Carranza-Torres, C. Elasto-plastic solution of tunnel problems using the generalized form of the Hoek-Brown failure criterion. Int. J. Rock Mech. Min. Sci. 2004, 41, 629–639. [Google Scholar] [CrossRef]
  31. Tandarić, T.; Tadić, M.; Dragčević, V. Rehabilitation of the road-installation of the Bailey military launch bridge. In Proceedings of the 8th International Conference on Road and Rail Infrastructure, Cavtat, Croatia, 15–17 May 2024. [Google Scholar]
  32. Kadrić, S.; Bektašević, E.; Gutić, K.; Sikira, D. Numeričke analize stabilnosti iskopa tunela ibarac i stabilizacija urušenog dijela, parking niše. Nauka+ Praksa 2023, 26, 1–9. [Google Scholar] [CrossRef]
  33. Bektašević, E.; Filipović, S.; Crnogorac, L.; Gutić, K.; Požegić, Z.; Tokalić, R. Challenges of Tunnel Support in Low Overburden Zones in Urban Areas—Case Study. Appl. Sci. 2025, 15, 12094. [Google Scholar] [CrossRef]
  34. Fenneteau, B.; Deck, O.; Mehdizadeh, R.; Laigle, F. Improved Squeezing Prediction of Deep Tunnels Within Highly Fractured Rock Mass: Update of the Hoek & Marinos Curve Under Uncertainties. Rock Mech. Rock Eng. 2025, 58, 8557–8574. [Google Scholar]
  35. Vlachopoulos, N.; Diederichs, M.S. Appropriate uses and practical limitations of 2D numerical analysis of tunnels and tunnel support response. Geotech. Geol. Eng. 2014, 32, 469–488. [Google Scholar] [CrossRef]
  36. Terron-Almenara, J.; Panthi, K.K. Analysis of Plastic Deformations for Tunnel Support Design in Weak Flysch Rock Mass of a Hydropower Tunnel in Central Albania: J. Terron-Almenara, K. Kanta Panthi. Rock Mech. Rock Eng. 2025, 58, 8111–8143. [Google Scholar] [CrossRef]
  37. Vitali, O.P. Tunnel Behavior Under Complex Anisotropic Conditions. Ph.D. Thesis, Purdue University, West Lafayette, IN, USA, 2020. [Google Scholar]
  38. Lee, Y.L.; Zhu, M.L.; Ma, C.H.; Chen, C.S.; Lee, C.M. Effect of overburden depth and stress anisotropy on a ground reaction caused by advancing excavation of a circular tunnel. Mathematics 2023, 11, 243. [Google Scholar] [CrossRef]
  39. Carranza-Torres, C.; Fairhurst, C. Application of the convergence-confinement method of tunnel design to rock masses that satisfy the Hoek-Brown failure criterion. Tunn. Undergr. Space Technol. 2000, 15, 187–213. [Google Scholar] [CrossRef]
  40. Adhikari, A.; Roy, N. Generalized ground reaction and longitudinal deformation curves for circular tunnels in rock mass. Transp. Infrastruct. Geotechnol. 2024, 11, 2046–2068. [Google Scholar] [CrossRef]
  41. Sabri, M.S.; Jaiswal, A.; Verma, A.K.; Singh, T.N. Systematic Review of RMR, Q-System, and GSI in Tunnel Classification: Origin, Advancement, and Limitations. Indian Geotech. J. 2025, 23, 1–23. [Google Scholar] [CrossRef]
  42. Joshi, D.R.; Panthee, S.; Ghimire, B.N.S. Numerical modeling for engineering analysis and designing of rock support for headrace tunnel. Int. Res. J. Eng. Technol. 2021, 8, 3554–3562. Available online: https://www.irjet.net/archives/V8/i7/IRJET-V8I7614.pdf (accessed on 23 February 2026).
Figure 1. Geographical location of the Zenica road Tunnel along Corridor Vc [22].
Geotechnics 06 00036 g001
Figure 2. Development of the Degree of Stress Relief λ as a Function of the Longitudinal Distance from the Excavation Face within the Convergence–Confinement Concept.
Geotechnics 06 00036 g002
Figure 3. Diagram of the Relationship Between Relative Deformation ε and the Ratio σ(cm)/σ0 with Defined Stability Zones for the Right Tunnel Tube Sections of the Zenica Tunnel.
Geotechnics 06 00036 g003
Figure 4. 3D Diagram Showing the Dependence of Relative Deformation ε on Overburden Height H and the Stability Coefficient Ns for the Right Tunnel Tube of the Zenica Tunnel.
Geotechnics 06 00036 g004
Figure 5. Analytical Profile of Tunnel Convergences as a Function of Chainage and Rock Mass Quality (RMR) with Local Correlation Coefficients (R2).
Geotechnics 06 00036 g005
Table 1. Geomechanical Parameters Applied in the FEM Analysis.
Chainage
(km)
RMRσci
(MPa)
GSImimbsaEcm
(MPa)
ν
0+54720502070.4020.00010.544799.250.23
0+72739753370.5750.00040.5222258.380.20
1+400477042121.4080.00130.5118381.740.20
1+868496044101.1730.00130.5116705.390.20
2+515355030100.8820.00050.5203941.130.23
Table 2. Overview of Geomechanical Parameters and Stability Indicators of the Right Tunnel Tube of the Zenica Tunnel.
Start Chainage
(km)
End Chainage
(km)
ɣ
(kN/m3)
RMRH
(m)
σci
(MPa)
σcm
(MPa)
Nsλcrνσcm0ε (%)
0+155.760+164.9526.002015250.910.43(elastic)0.392.330.04
0+164.950+329.3026.002780502.390.87(elastic)2.081.150.15
0+329.300+346.4126.001881250.842.510.602.110.401.26
0+346.410+482.8426.0028140502.501.460.323.640.690.43
0+482.840+608.5026.0020196250.915.600.825.100.186.27
0+608.500+689.2126.0027245502.392.670.636.370.381.43
0+689.210+707.7826.0019256250.877.660.876.660.1311.73
0+707.781+150.0026.0039470503.963.090.6812.220.321.91
1+150.001+183.1226.0049465758.961.350.2612.090.740.36
1+183.121+217.0026.0039460503.963.020.6711.960.331.82
1+217.001+265.0626.0048450758.591.360.2611.700.730.37
1+265.061+399.1026.0036430503.503.190.6911.180.312.04
1+399.101+814.5026.0047313758.240.99(elastic)8.141.010.20
1+814.501+834.0026.0029311502.603.110.688.090.321.93
1+834.002+322.5026.0049310758.960.90(elastic)8.061.110.16
2+322.502+362.0626.0036320503.502.380.588.320.421.13
2+362.062+470.9626.0046339757.911.110.108.810.900.25
2+470.962+605.0926.0035348503.352.700.639.050.371.46
Disclaimer/Publisher’s Note: The statements, opinions and data contained in all publications are solely those of the individual author(s) and contributor(s) and not of MDPI and/or the editor(s). MDPI and/or the editor(s) disclaim responsibility for any injury to people or property resulting from any ideas, methods, instructions or products referred to in the content.