Article

Scale and Rock Type Dependency of Mórágy Granite Formation in the Aspect of Fracture Density

by
Gábor Somodi
* and
Balázs Vásárhelyi
Department of Engineering Geology & Geotechnics, Faculty of Civil Engineering, Budapest University of Technology and Economics, 1111 Budapest, Hungary
*
Author to whom correspondence should be addressed.
Geotechnics 2025, 5(2), 34; https://doi.org/10.3390/geotechnics5020034
Submission received: 12 December 2024 / Revised: 23 May 2025 / Accepted: 25 May 2025 / Published: 29 May 2025

Abstract

The geometry of rock mass fractures is typically characterized through geological and geotechnical investigations. Detailed descriptions of granitic host rock can yield valuable data for constructing fracture network models. However, significant discrepancies often arise between data representing the mechanical and hydraulic properties of rocks. At the study site, fracture geometry data were gathered through surface and underground surveying, borehole logging, and underground mapping. Three-dimensional photogrammetry was utilized alongside traditional rock mass classification methods (Q-system, RMR, GSI) to derive key parameters of fracture networks, such as orientation, size, and intensity. This study focuses on Rock Quality Designation (RQD), a measure of fracture density derived from tunnel face mapping. Findings indicate that variations in fracture frequency are significantly affected by how fracture sets are defined and by the orientation distribution of fractures. Furthermore, using the D parameter (the 2D fractal dimension of fracture frequency) as a validation measure for RQD may lead to misleading interpretations if it aggregates fracture sets on the tunnel scale.

1. Introduction

Over the past decade, significant advances have been made in the characterization of fractured rock masses, with a particular emphasis on quantifying fracture intensity and understanding its role in managing rock mass behavior. Emerging technologies (e.g., UAV-based photogrammetry, AI-assisted fracture mapping, and machine learning techniques) have improved fracture intensity measurement, and the adoption of stochastic approaches for rock structure characterization has been on an upward trajectory over the past decade, but even more so recently [1,2,3,4]. Traditional methods such as Rock Quality Designation (RQD) [5,6] have served as an adequate tool for assessing rock quality in engineering projects for a long time. However, RQD, based on the recovery and measurement of core samples, offers only a limited, indirect view of the complex three-dimensional fracture networks that control mechanical and hydraulic properties.
Recent research has increasingly shifted toward data-driven approaches. The strongest trend demonstrated that the simulated Pij system for fracture intensity—typically quantified through parameters such as P10 (linear fracture intensity), P21 (areal fracture intensity), and P32 (volumetric fracture intensity)—provides a more comprehensive and scalable framework for characterizing rock masses than, for example, traditional rock mass classification [3,4,7]. Stochastic discrete fracture networks led to the generation of a 3D fracture system for coping with discontinuity-related uncertainty in the rock mass [8]. Moreover, the development and application of Discrete Fracture Network (DFN) modeling make it possible to simulate realistic fracture patterns and to predict rock mass behavior under varying stress conditions and rock strength [8,9,10,11].
In addition, Erharter [12] applied DFN models to show that parameters based on subjective estimations, such as fracture spacing, number of fracture sets, and RQD, are inadequate for characterizing the rock mass structure in complex geological settings. The limitation of the DFN arises with the availability and accuracy of the required dataset. Traditional empirical classification systems, including RQD, often fail to capture critical aspects of fracture systems, such as connectivity, persistence, and orientation variability. In contrast, DFN-based methods allow for direct modeling of these properties, offering a more sophisticated understanding of rock mass strength, deformability, and failure mechanisms.
Two principal conclusions emerge from these analyses. Foremost, there is a recognized need to advance current rock mass classification methodologies by integrating parameters that capture the connectivity of fracture networks, particularly within complex rock masses [4,11,12]. Furthermore, although engineering geological characterizations offer a valuable basis for generating fracture network models, their application must be approached with methodological rigor and caution [7,11,13]. This research addresses this second finding.
The limitations of the RQD method are well studied [14]. Current research focuses on the scale problems of the method of Palmström’s [14,15] for rock surface mapping. One interpretation concerns the inherent subjectivity associated with the classification of rock surfaces in rock mass characterization, whereas rock core logging, which adheres to a strict guideline requiring that only core segments with a minimum length of 10 cm be considered. In rock surfaces, the engineering judgement is the guide, whose fracture sets should be emphasized. Moreover, RQD is critically dependent on the relative orientation of the borehole (or scanline) with respect to the orientation of the fractures, while tunnel faces show a bigger part of the rock masses; therefore, the two investigation scales belong to different fracture patterns. Furthermore, the orientation bias enhanced the rock masses’ anisotropy [14,15,16,17].
The traditional procedure of acquiring RQD does not adequately represent the anisotropy of the rock mass, and thus, it is insufficient in capturing the reliable conditions [18]. It is also true that RQD, as defined by digital 3D photogrammetry, hardly fulfills this either.
The basic feature for creating discrete fracture network (DFN) models is generating input parameters. In most cases, a comprehensible and objective documentation of the encountered geological and geotechnical conditions during excavation is a fundamental element for answering any ground-related question [19], and applying solely site-specific parameters enhances the accuracy of fracture network modelling [20].
Numerous discrete fracture network (DFN) modelling techniques have been developed based on the assumption that fluid flows particularly in the connected transmissive fractures with very low rock matrix permeability [21,22,23]. Since the fracture network is geometrically complex, several parameters are involved in the description of fracture geometries in rock masses (e.g., length, aperture, dip angle). Different mechanical properties of the individual fracture sets can be accounted for, e.g., differences in fracture stiffness depending on the applied stress field, fracture filling, and fracture alteration [24,25]. Fractures provide preferential flow paths that define the rock mass transmissivity, especially in low-matrix-permeability rocks. Therefore, the rock mass hydraulic response arises from the fracture density, orientation, and the stress-sensitive fracture transmissivity, which means transmissivity cannot be fully described without the mechanical properties of rock behavior [25,26]. Given the difficulty of accurately obtaining the geometric information of individual fractures under field conditions, rock mass classifications typically attribute these properties to fracture sets [23]. This study focuses on the problems that empirical rock mass classification methods do not use all fracture orientations in general, while DFN modeling tends to characterize a rock structure based on the most available fracture data, treating every fracture as a single fracture set. The difference can be a limit in the comparability of the two approaches.
This paper explores the evolving relationship between RQD and fracture intensity by comparing traditional core-based RQD measurements with DFN-derived estimates.

2. Geological Settings

The research location is in the Carboniferous Mórágy Granite Formation (MGF), which was selected as the host rock of low- and intermediate-level radioactive wastes originating from the Hungarian nuclear power plant [27]. It is situated in the southern part of Hungary (see Figure 1). The igneous host rock is composed of various granitoid subtypes, such as monzonite and monzogranite (see Figure 2), formed by the mixing of felsic and mafic magmas [28]. During several subsequent deformation events, a complex fracture network developed from the Paleozoic time. Alpine orogeny generated reverse faults, strike slips and intrusion of trachyte dykes due to the Cretaceous transpression and extensional deformation events. Transpressional displacement occurred due to the regional rotation of the regional tectonic unit in the Miocene period. The last tectonic phase was the transpression elevation, reactivation of former structures from the Late Miocene-Pliocene up to the present [29,30].
The deformation events are reflected by brittle deformation structures, such as open fractures, fractures with slicken lines, and cataclasites [20,32]. Most veins are filled in by a complex sequence of common hydrothermal minerals [33].
The fracture network of the MGF is discussed in [34,35,36] from the viewpoint of the fractured aquifer. This approach is primarily based on hydrogeologic data (transmissivity measurements, Lugeon test) and is supported by geological data from borehole investigation and field mapping (BHTV data, tunnel face mapping, subsurface mapping). Therefore, it has a very detailed and complex model that adequately describes the whole rock mass. In this model, according to BHTV data analysis, stereo plots of orientation indicate that more transmissive zones (MTZ) have one dominant fracture orientation, which is NE–SW, or N–S and NW–SE, respectively, and it is generally subparallel to the orientation of the zone itself. In contrast to MTZ, the lower transmissive blocks (LTB) at the site can never be represented by a single characteristic orientation. The length distribution of the fractures is described by a power function [34]. Still, it is suggested that fracture density analysis depends on the scale of the analysis, and according to detailed documentation, the monzogranite compartment (LTB) and the boundaries of the repository area (MTZ) are characterized by different fracture orientations [34,36]. In the middle, or the edge of wide tectonic zones (MTZ), thick clay gauges can cause very weak rock conditions and different water heads (1–5 m) and hydraulic jumps (5–25 m). This sealed fault zone separates two hydrodynamic regimes, becoming a natural hydrological barrier [36].

3. Data and Methods

3.1. Source of Data

Detailed geotechnical and rock-mechanical in situ and laboratory research, testing, and geotechnical surveying were performed between 2004 and 2016. Approximately two thousand tunnel faces were evaluated in the inclined shafts, the loop tunnel system, the four repository chambers, and other short tunnels (Figure 3). The cross-sectional areas of the tunnels and chambers vary between 21 m2 and 110 m2 [37]. Data originates from geological-tectonic and hydrogeological mapping and was evaluated for geotechnical characterization of tunnel advances during the construction of the Hungarian National Radioactive Waste Repository (NRWR). Construction of tunnels and repositories was carried out by conventional (drilling and blasting) excavation. Surveying the excavation faces was the primary tool of geological assessment, using the JointMetrix and ShapeMetrix tools from 3GSM GmbH [38]. The various rock mass characteristics were provided by defining RMR, Q, and GSI values [31,37,39]. The empirical methods based on RQD provide a convenient way for estimating the deformation modulus and unconfined compressive strength of rock masses but, whenever possible, it should be used together with other empirical methods based on RMR, Q and GSI because RQD is only one of the many factors that affect the deformation and strength of jointed rock masses [40]. A two-phase geotechnical classification procedure was developed for the excavation. As a first phase, 50–130 m horizontal boreholes were drilled and analyzed. Based on the quality of the rock cores, an applicable length of advance was proposed, and the predicted tunnel drive could be scheduled. The second phase of the systematic geotechnical classification was carried out in the tunnel face after each blast. This study focuses exclusively on the tunnel face mapping result introduced in [31,37,39] and the image analysis results of [20,41].

3.2. Rock Mass Classification Methods (Q, RMR, GSI)

The Q-system, developed by Barton and his colleagues [42,43], is one of the most widely applied rock mass classification methods in rock engineering. It is used extensively to characterize rock exposures, drill cores, and underground excavations. As an empirical system, the Q-method provides a framework for estimating the support requirements of tunnels and other underground structures. This is achieved through the evaluation of rock mass quality based on six parameters:
RQD: Rock Quality Designation (5–100%)
Jn: number of joint sets (0.5–20, dimensionless)
Jr: Roughness of the most unfavorable joint or discontinuity (0.5–4, dimensionless)
Ja: Degree of alteration or filling along the weakest joint (0.75–20, dimensionless)
Jw: water inflow
SRF: stress reduction factor
The listed six parameters are grouped into three ratios to give the comprehensive rock mass quality (Q):
Q = R Q D J n × J r J a × J w S R F ,
The ratio of RQD to Jn characterizes the general structural condition of the rock mass, serving as a relative indicator of block size. The second ratio, Jr to Ja, reflects the shear strength along block boundaries. The third ratio, Jw to SRF, represents the influence of active stress conditions within the rock mass.
The Rock Mass Rating (RMR) system, based on Bieniawski [44,45,46] publications, shall apply in the classification, documentation, and evaluation of rock cores and underground spaces. The RMR method, despite its relative simplicity, allows the production of objective geotechnical classifications of sufficient quality.
The RMR method characterizes the expected behavior of a rock mass based on the following six parameters, which are fundamental but relatively easy to determine:
-
uniaxial compressive strength of intact rock;
-
the average spacing of natural joints;
-
the joint condition, the nature of their filling;
-
water flow, water ingress conditions;
-
direction, orientation of joints in relation to the direction of tunnel drive
The Geological Strength Index (GSI) [47] is a widely adopted rock mass classification system used extensively in numerical modeling and rock engineering design, particularly for isotropic rock masses. Developed with the Hoek–Brown failure criterion, GSI provides a framework for estimating rock mass strength and stiffness parameters, including deformation modulus and Poisson’s ratio. Using standardized charts or monographs, GSI values are typically derived from field-based assessments of rock mass blockiness and the surface conditions of discontinuities. The index is quantified along a diagonal scale ranging from 10 to 100, with increments of 5. Rock mass quality was initially classified into five quality categories and six structural domains.
Early efforts to characterize rock mass conditions Hoek et al. [47] employed Bieniawski’s RMR1989 [46] within the Hoek–Brown failure criterion [48], leading to a simplified relationship expressed as follows:
GSI = RMR1989 − 5
Since then, numerous independent quantitative methods have been developed to calculate GSI, building upon classical empirical rock mass classification systems [31].

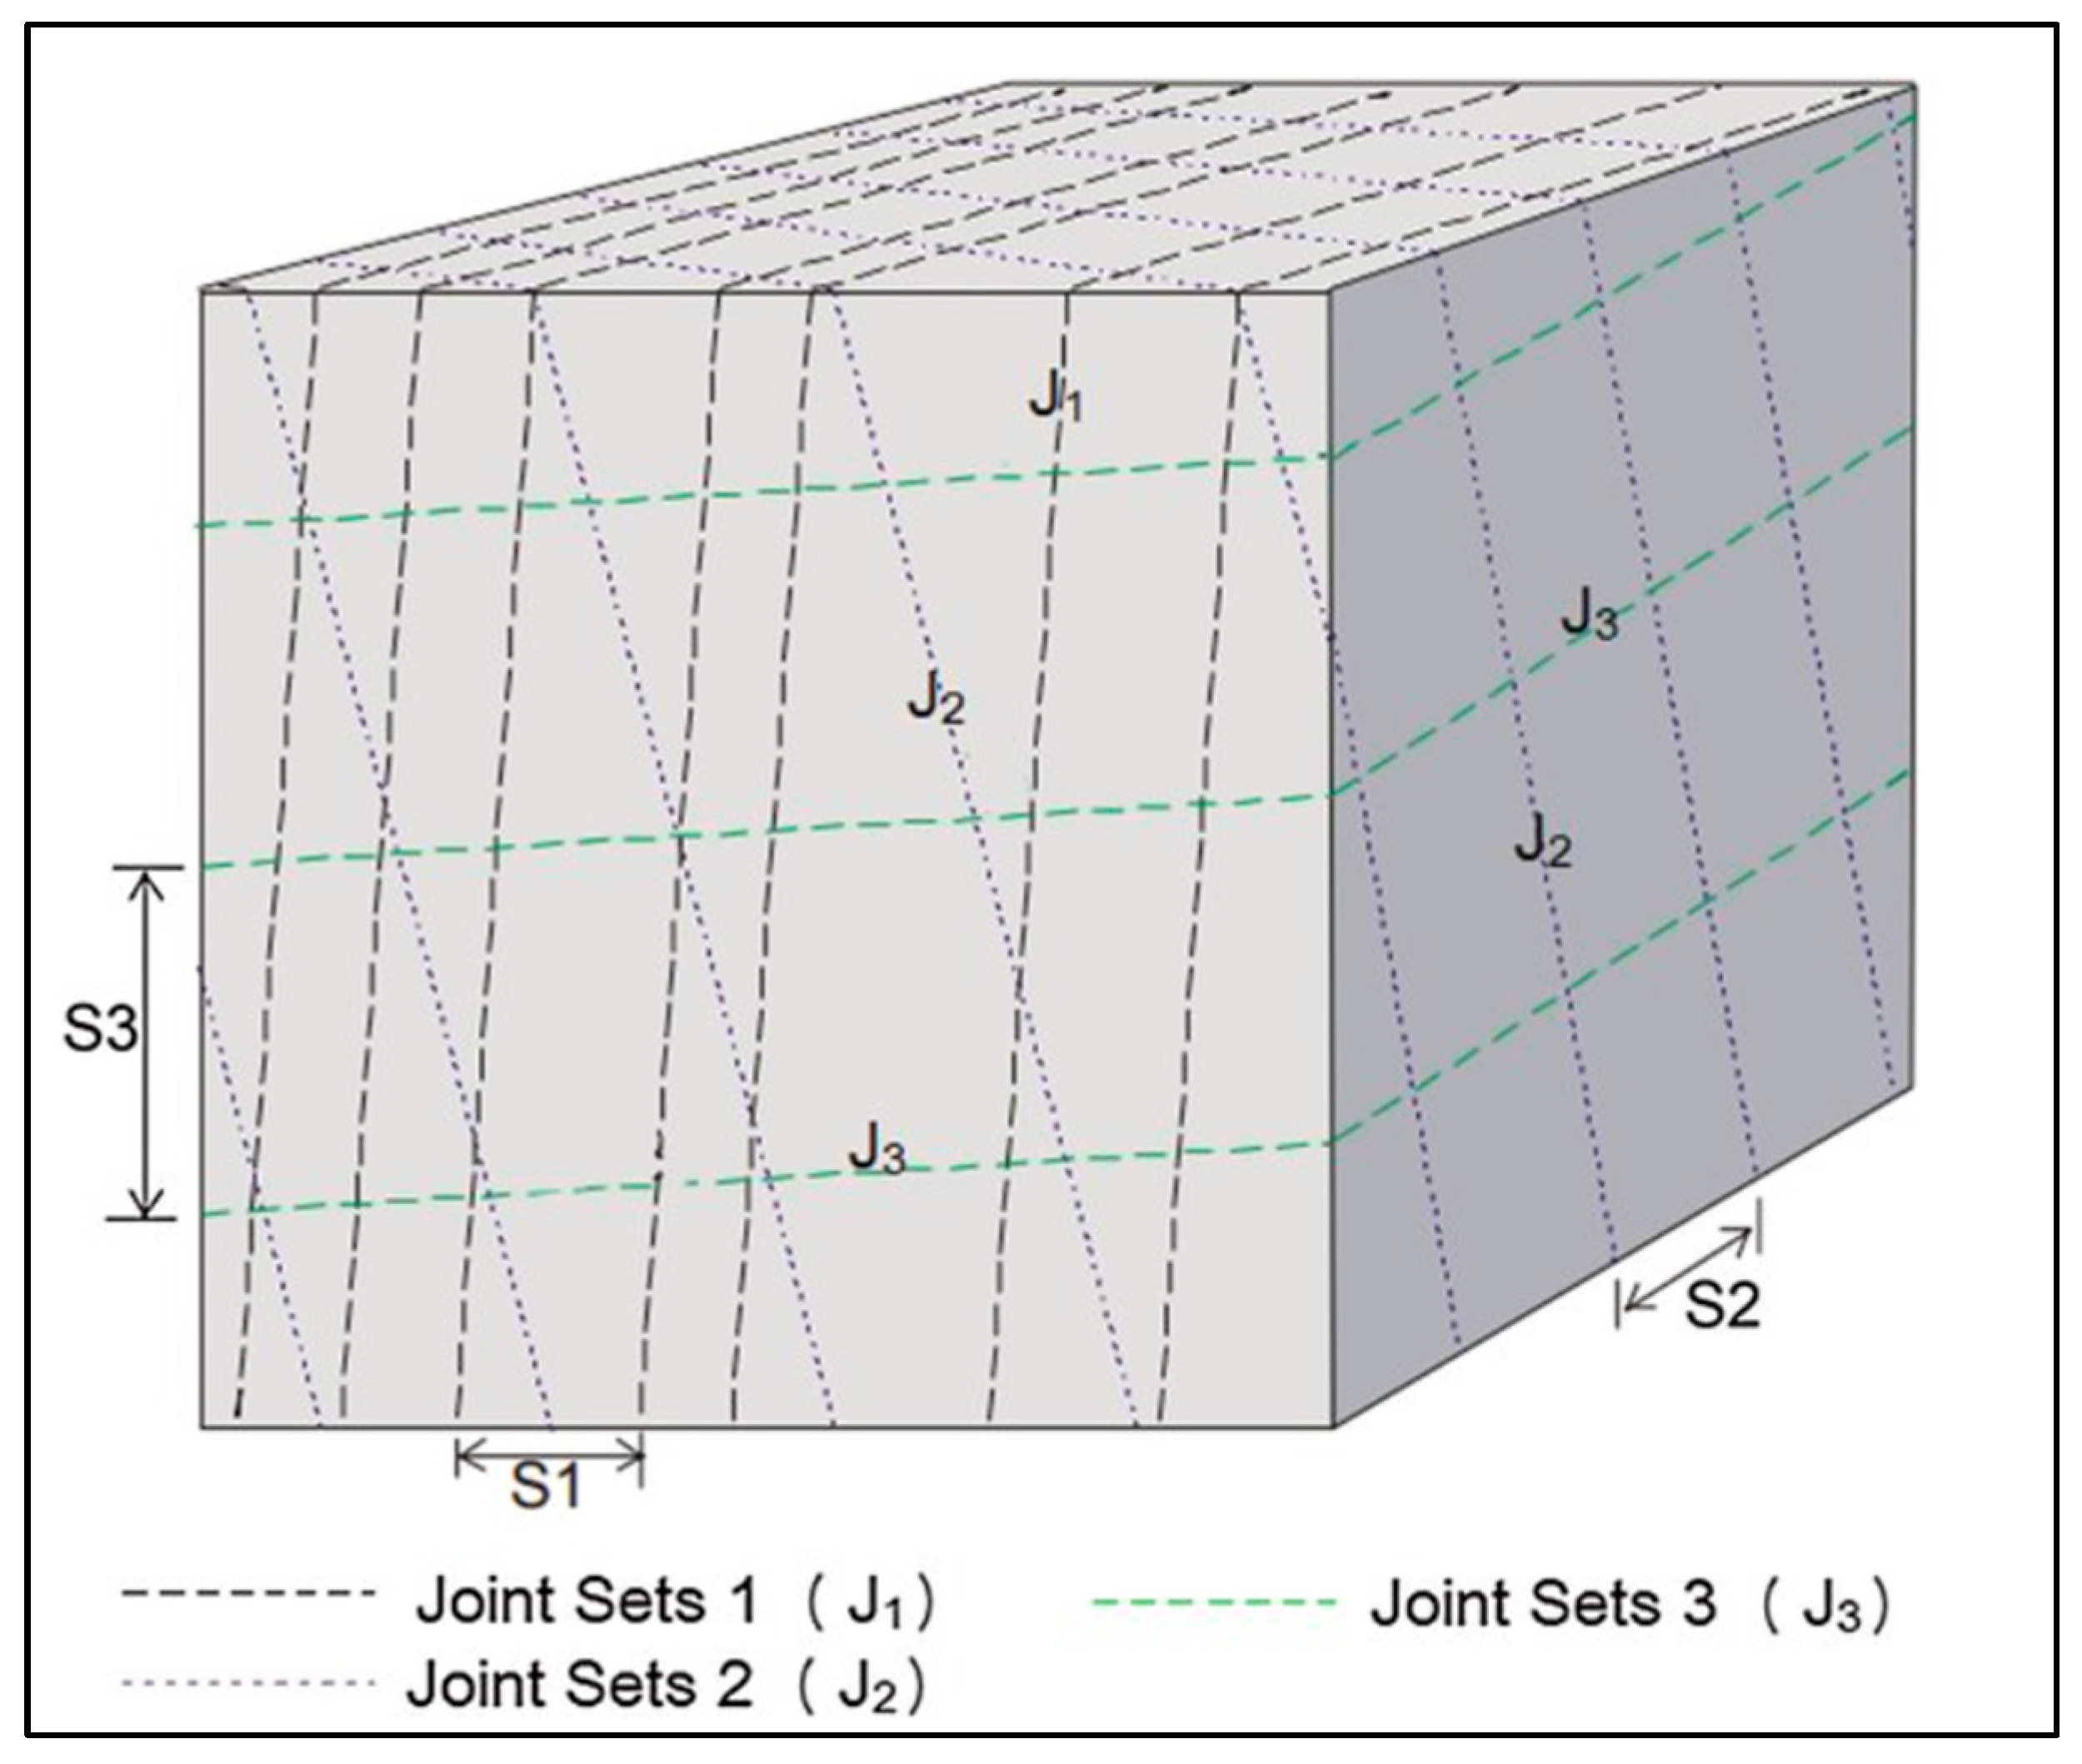
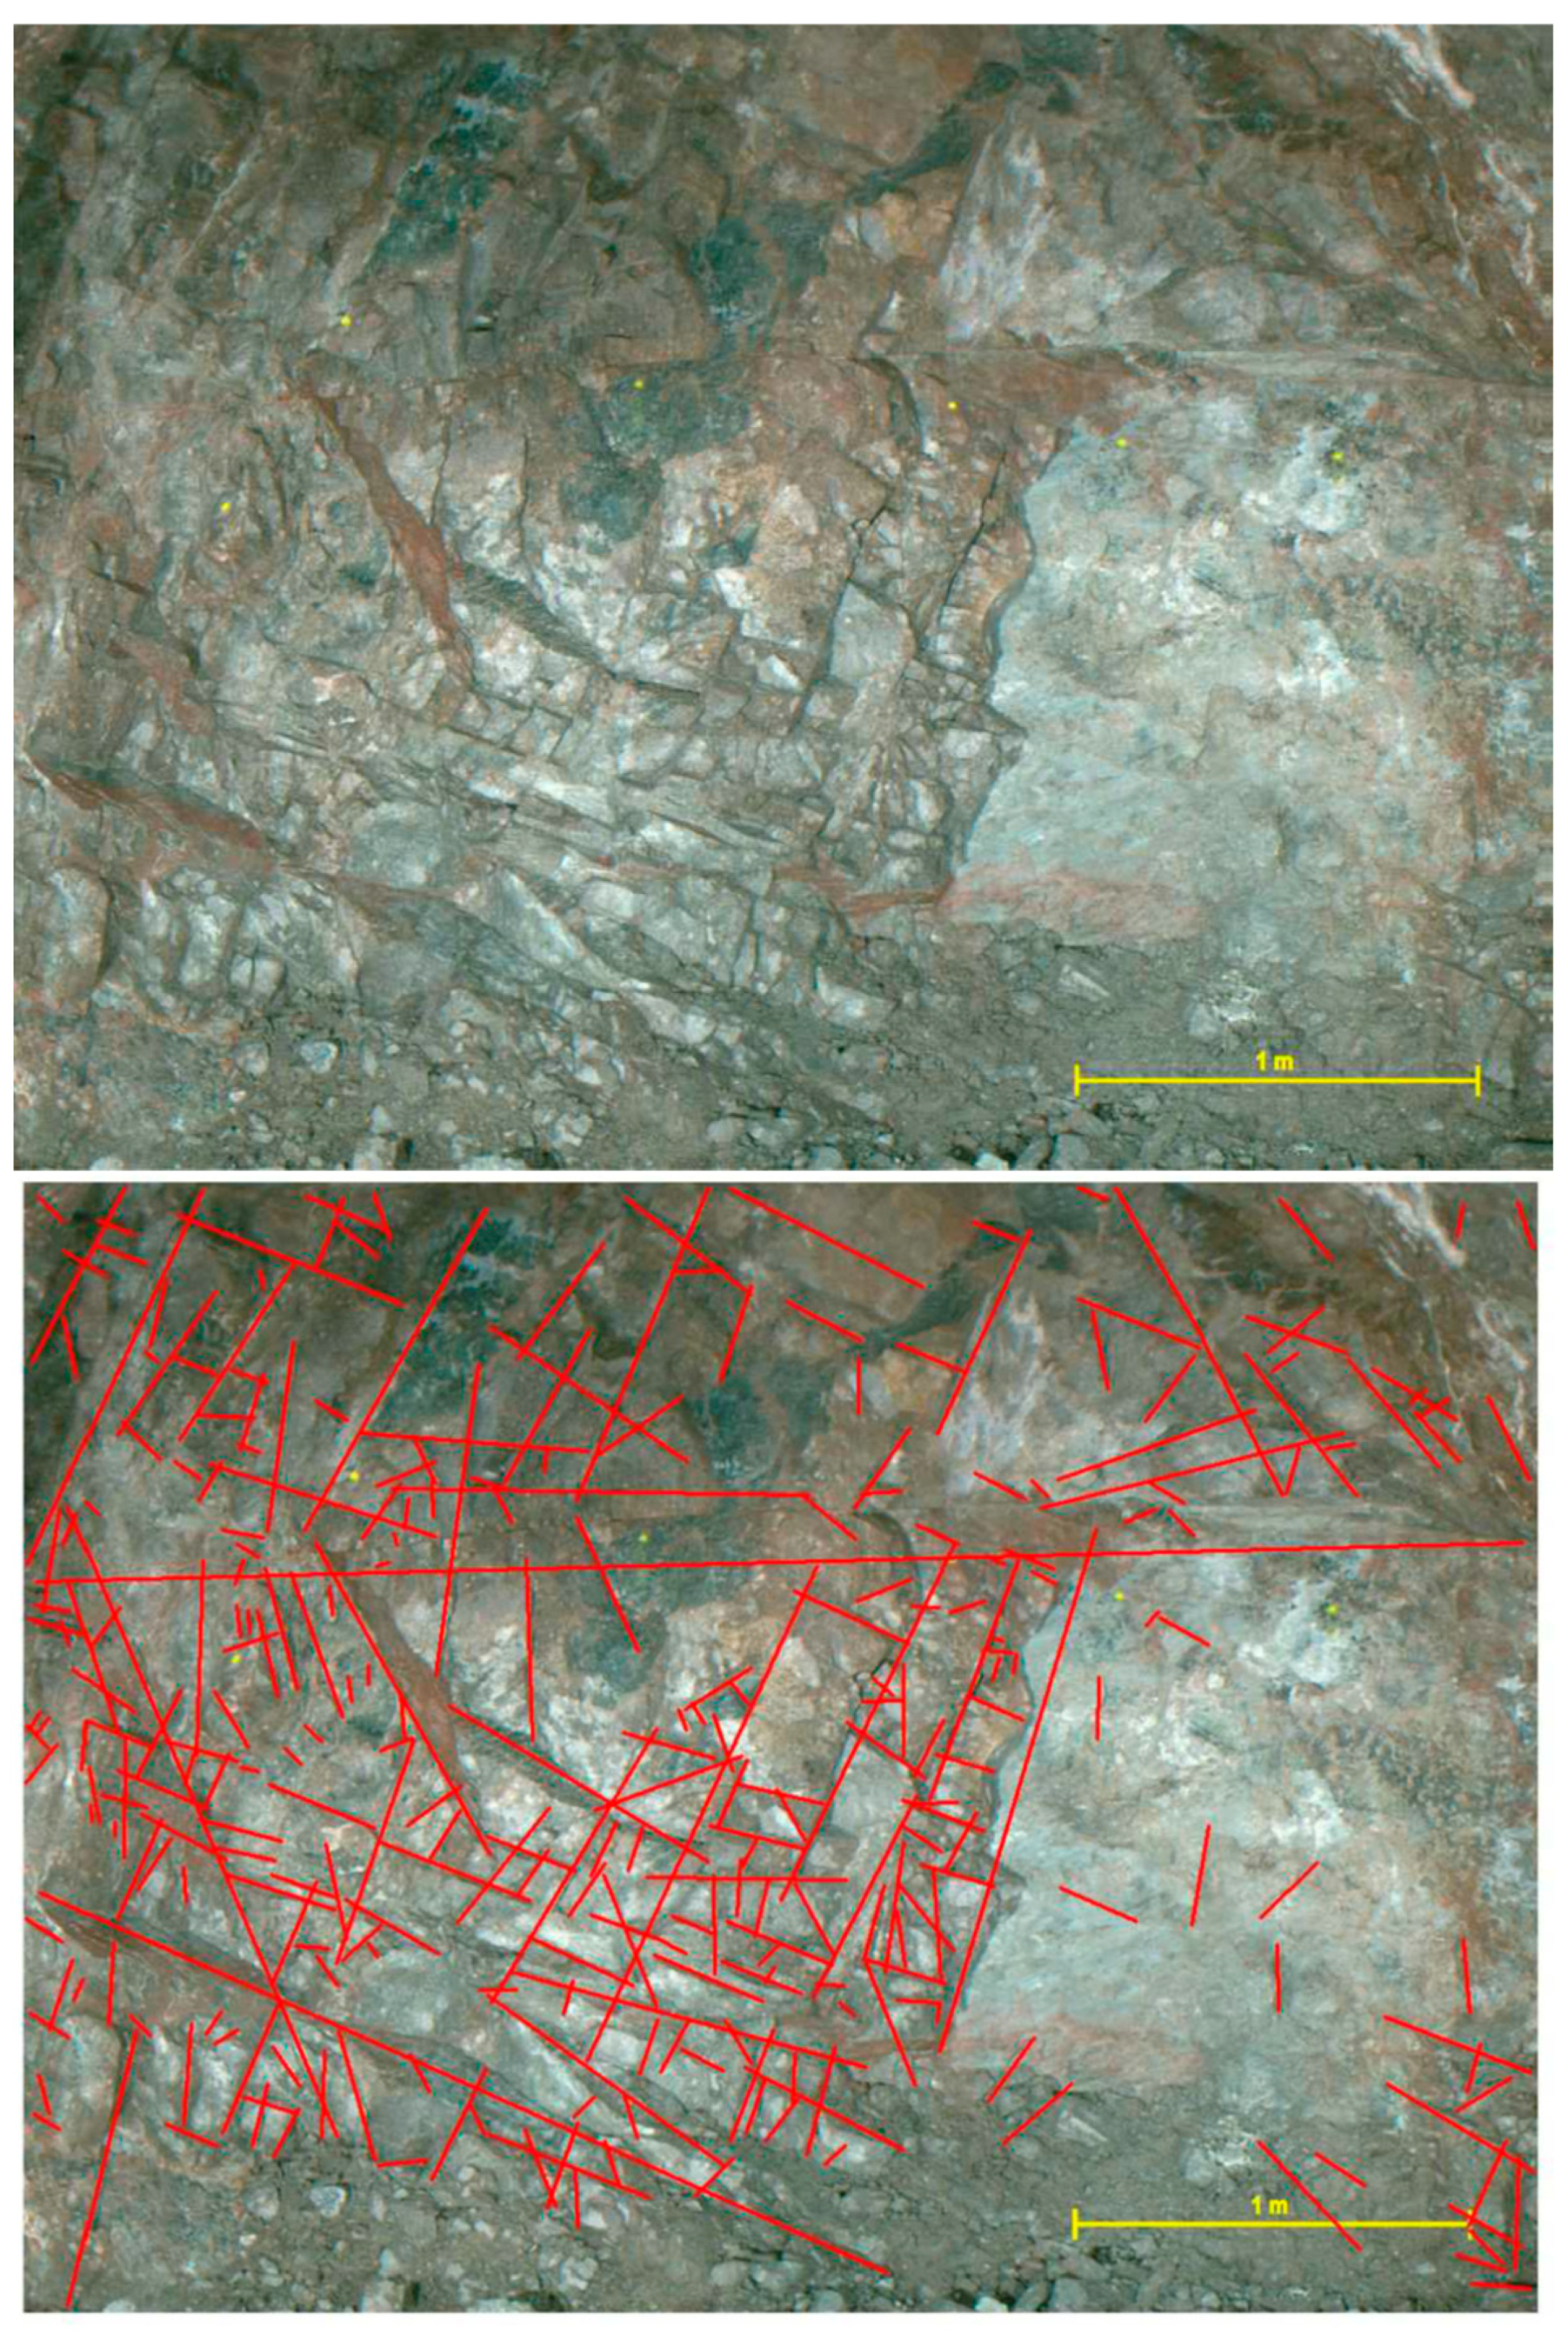
3.3. Defining Fracture Sets

Geotechnical mapping of tunnel faces begins with defining and separating fracture sets. Based on a long-term practice in this site, fractures that were only 10–15 degrees apart in direction were classified into a fracture set. In some cases, the thickness of infilling or roughness (according to RMR) was also a guide in field mapping for characterizing a unique fracture set according to [49,50]. These methods were used in rock mass classification and geological mapping.

3.4. Calculation of Fracture Densities

All characterizations and calculations of RQD had been performed by creating 3D models with JointMetriX/ShapeMetriX software (3GSM, [38]), to properly define the spacing within the same fracture set and length (visible 2D fracture traces) distribution of fractures. RQD was determined using different methods in tunnel and rock core evaluation. Rock core evaluation followed the method described in Deere’s publications [5,6], and tunnel face mapping uses fracture density determination published in Palmstrom [14]:
RQD = 110 − 2.5Jv,
Jv is the volumetric joint count, defined as the sum of the number of joints per meter of each fracture set (ISRM 1978), or the number of joints that intersect the area of one square meter [14]. Jv can be determined from the discontinuity set spacings within a volume of rock mass as [17]:
J v = 1 s 1 + 1 s 2 + 1 s 3 + ,
where s1, s2, and s3 are the mean fracture set spacings (see Figure 3).
In addition to fracture groups that define systematic fracture sets, less frequent, randomly oriented discontinuities exist within the rock mass. These random fractures can be accounted for by assigning representative fracture spacing, denoted as sr to each. As suggested by Palmstrom et al. [51], a typical value of sr = 5 m can be assumed. Consequently, the volumetric discontinuity frequency Jv can be generally expressed as follows:
J v = 1 s 1 + 1 s 2 + 1 s 3 + + N r 5 ,
where Nr is the number of random discontinuities. After calculating Jv according to Equation (5) and RQD according to Equation (3), the obtained values were applied to determine RMR, Q, and GSI classifications, which were the basis of design and further investigation.
In rock engineering, various methods have been developed to characterize the spatial density of fracture networks. These include measures such as fracture intensity, fracture density, fracture index, fracture surface area, fracture intersection density, and fracture spacing. Numerous detailed studies by various authors [52,53,54,55] have confirmed that fracture networks often exhibit fractal-like geometries, regardless of lithology or structural history. This suggests that the spatial distribution of fracture frequency is scale-dependent.
One of the most commonly employed techniques for calculating fractal dimension is the box-counting method [52,56,57,58], in which
N(r) ~ r D,
The number of boxes N(r) necessary to cover the fracture pattern is proportional to the size of these boxes (r), and the D fractal parameter reflects the fracture density.
In the work of M. Tóth [20], supplementary two-dimensional fracture network data were obtained from tunnel face mappings corresponding to the ground level of the underground repository site.
A total of 117 JointMetriX3D images were analyzed, with a consistent 20 m spacing between adjacent sampling locations. Each image contained a minimum of 300 individual fractures (see Figure 4). The spatial distribution of these individual fractures was characterized using the fractal dimension of their midpoints [59]. For deriving midpoints, the apparent length was determined using tunnel face photos. Fractures were identified in a digitization process. During this detailed characterization, some well-known digitalization problems occurred, especially the identification of the fractures, because the fracture pattern is a combination of several recognizable elements, as breccia zone, fracture wall, sheared fracture, unfinished and covered fracture [41]. The fractal D parameter is defined by observing and counting every fracture in the scale of the tunnel face, e.g., from 0.1 m up to 7 m in a 33 m2 section. It also means that it has its limitations in the field. However, by acknowledging the fractal nature of fracture networks, it becomes possible to integrate tunnel-scale fracture distributions with BHTV data, large-scale surface mapping, and the results of satellite image analysis.

4. Results

Fractal dimension (D) derived from the 33 m2 tunnel section can demonstrate the whole host rock well. In the tunnel scale observation of a 33 m2 section, the tunnel faces cannot show correlation with RQD determination based on [14] (Figure 5).
Figure 6 shows the RQD distribution of tunnel faces involved in fractal analysis and other RQD distributions. This leads to the conclusion that the distribution of all documented RQD values fits well with the analyzed tunnel faces; thus, the fractal geometry parameters derived from a 33 m2 tunnel section can effectively represent the characteristics of the entire host rock.
Based on the results of detailed geological investigations [61], four principal rock domains within the Mórágy Granite Formation can be classified as distinct geotechnical types: monzogranite, monzonite, hybrid which is the mixtures of these two and vein-type, dyke rocks as aplitic rock and alkaline volcanic rocks. The first three form the large-scale structure of the site, with rock domains stretching in NE-SW directions, with sharp or transient boundaries, and the borders are frequently wide shear zones. Because of similar rock behavior, leucocratic granite samples were regarded as monzogranite. RQD measurements do not show an extreme value by rock type. This suggests that RQD values are of a limited distribution nature and that a fractured zone is an expected phenomenon in all rock types. However, the fourth type occurred as a restricted phenomenon in tunnel faces with all three other types of rocks. Therefore, it cannot be regarded as a separate group during the analysis of the RQD of tunnel faces.
According to the results of Table 1, the statistical values of fracture frequency are almost the same for all rock types; monzonite has lower RQD values, although these data do not show fundamental differences. Based on the results in Table 2, fractal D also shows similarities between rock types.

5. Discussion

Certain overlooked aspects of the fracture network in the Mórágy Granite Formation—specifically the roles of fracture sets, tectonic features, and rock types—have been investigated by analyzing RQD data.
The source of the difference can be derived from two main problems. As described in Palmstrom’s RQD determination [14], it originated from the philosophy of fracture sets. It means that in some directions, the fracture behavior due to tunneling is the same; for this reason, they can be considered as one fracture set. Consequently, following Palmström’s recommendations, although all fractures are observed and recorded, not all can be utilized in the calculation of RQD. Only the average spacing between fractures within each set is considered. This implies that the fractures accounted for in tunnel stability assessments are not strictly identical to the fracture population used for the determination of fractal D, which incorporates all fractures. Although a certain degree of correlation between RQD and fractal D can be expected, it is not evident through a simple comparison. According to the rock type dependent results, fracture density parameters of rock types do not show fundamental differences. It can be explained that the Mórágy Granite Formation is a fractured rock mass where mechanical behaviors can be connected to discontinuities, and classic rock mass classification can be applied to understand it. However, statistical analysis of RQD originating from borehole evaluation shows non-identical results. In [62], homogeneity test and confidence intervals show that dyke and vein-type appearance rocks (aplite and trachyandesite) differ significantly from mass appearance rocks (monzogranite, monzonite, hybrid and other granitic rocks). Additionally, the averages of the hybrid monzonite, hybrid monzogranite, and other granitic rock type groups do not differ significantly, i.e., the core sections of this rock type cannot be separated by the fracture density. The main result of this analysis that rocks can be divided into four groups based on the fracture density pattern: monzonite and monzogranite separated by distributions, hybrid-type rocks that form another group and dykes and veins makes the fourth group with very low RQD values. The highest average and confidence interval related to monzonite rocks.
There is a significant difference between the results of the RQD determination of the tunnel face and the drill core, because confidence intervals of monzonite and monzogranite samples based on the RQD values determined on the drill cores show a class difference in Figure 7. However, no significant differences are observed in the tunnel face documentation in Table 1. The results highlight the fundamental problems between the two RQD definitions and emphasize the scale effect on RQD.

6. Conclusions

The limitations in correlating fracture data obtained from traditional rock mass classification systems with advanced modeling techniques have been studied. A key gap in the literature is the inconsistent relationship between empirical parameters such as Rock Quality Designation (RQD) and the actual hydraulic or structural behavior of fractured rock masses. This research aimed to assess the effectiveness of various fracture density indicators—including RQD and fractal dimension (D)—in characterizing the Mórágy Granite Formation, a host candidate for radioactive waste repositories. The methodology combined borehole-based RQD measurements with tunnel face mapping, supplemented by 3D digital photogrammetry and fractal analysis, to evaluate spatial variability and methodological reliability. This setup was critical to integrating data from different investigation phases while considering the effects of multi-phase tunneling and subjectivity in data interpretation.
RQD from the borehole investigation can be a good support because it can divide the fracture density between the two major hydraulic patterns. However, tunnel face mapping data hardly correlate with other geophysical or fractal geometry approaches because of Palmström’s RQD definition.
The main findings of the study are as follows:
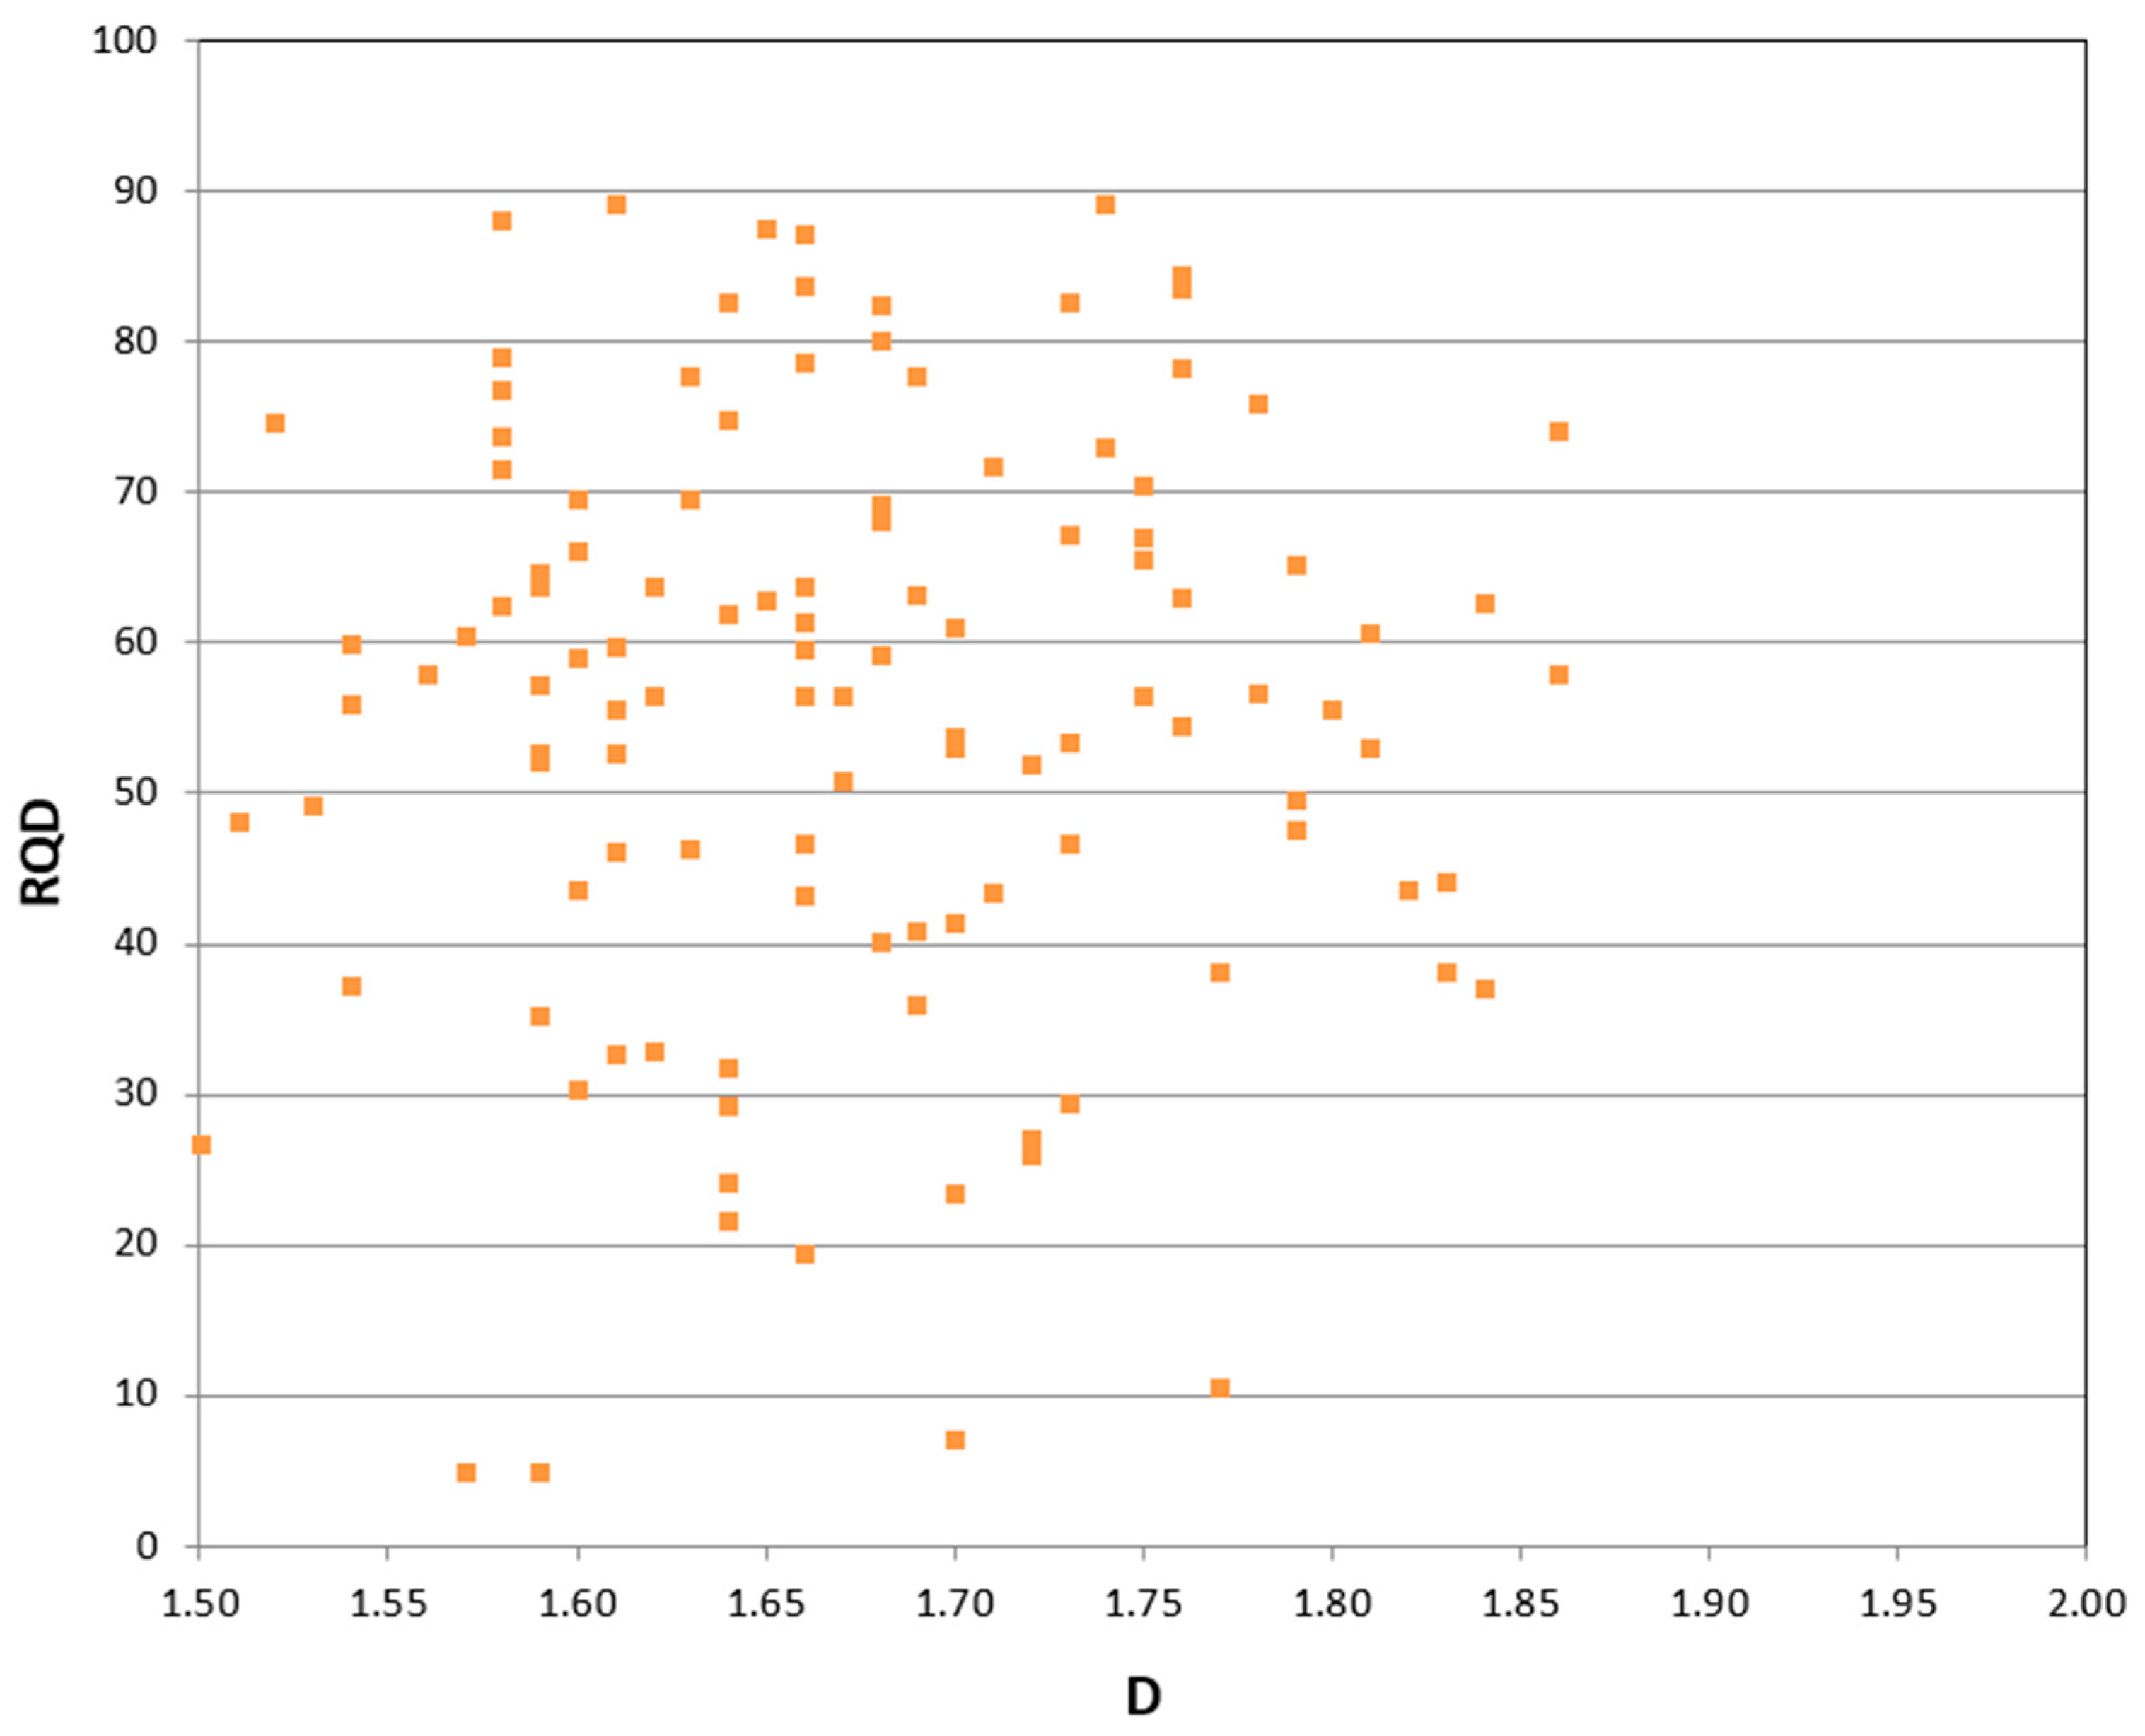
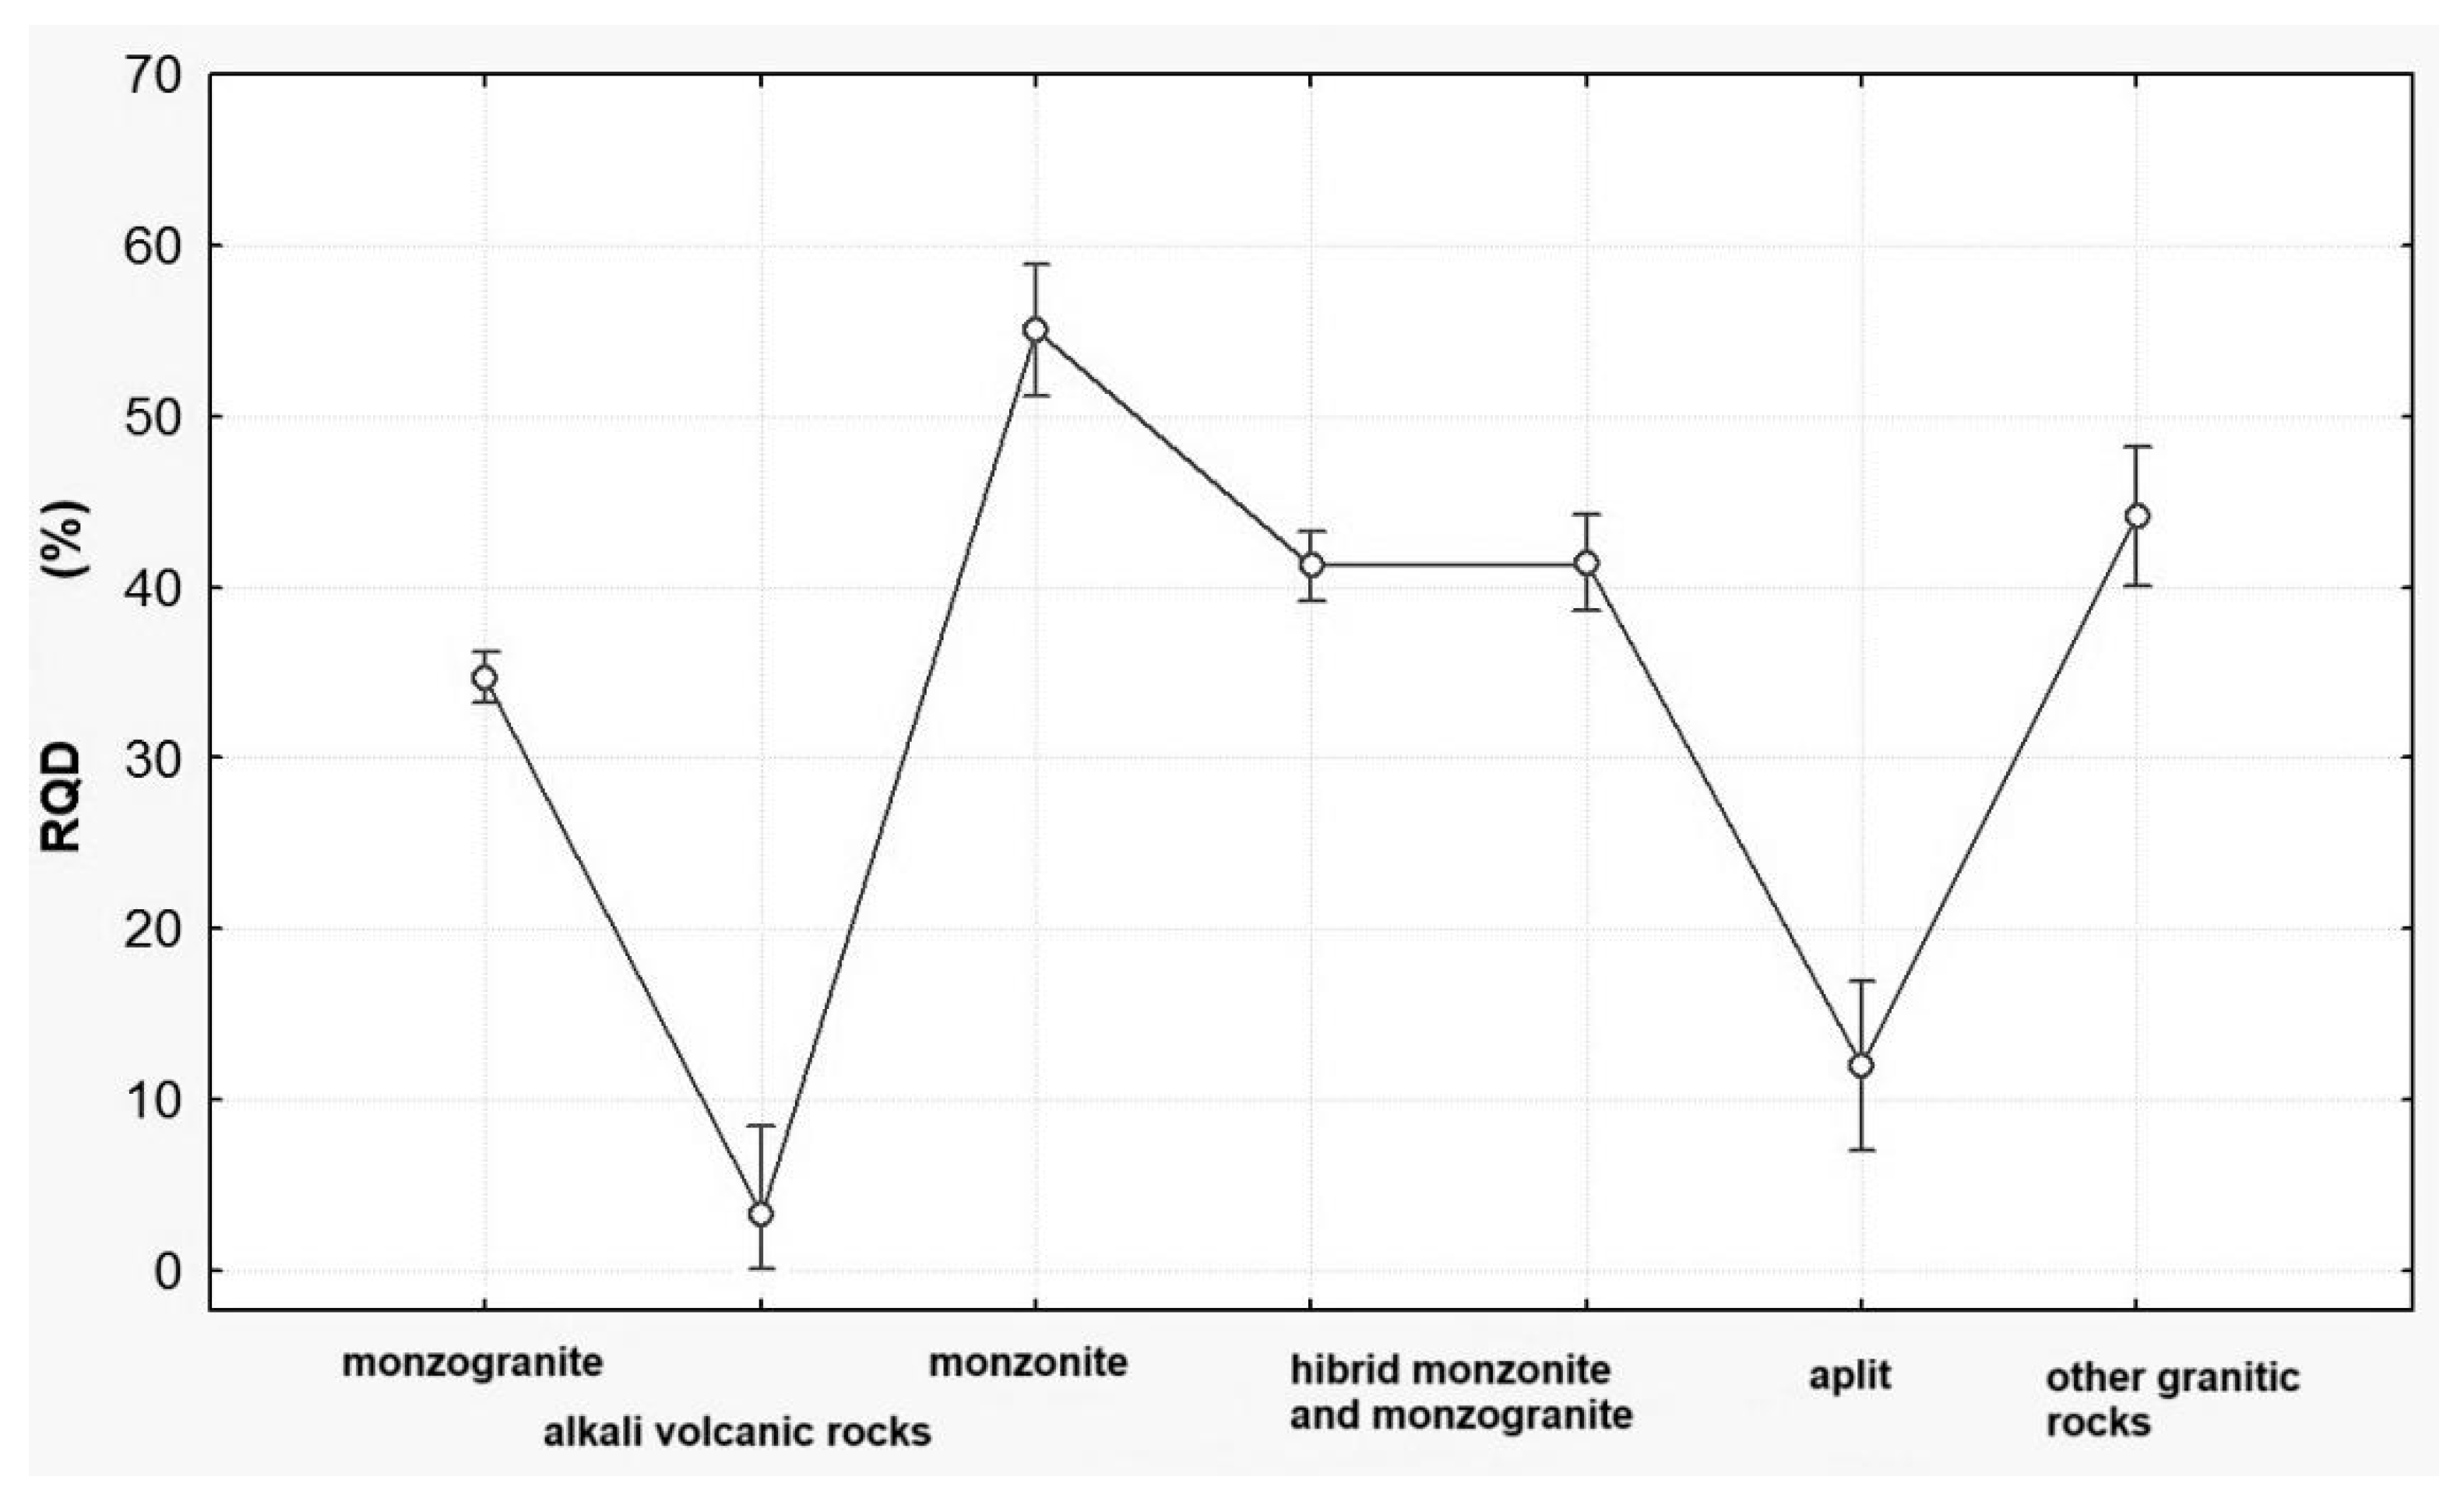
  • The parameters of fracture frequency (RQD and fractal D) do not exhibit strong correlations with rock types; however, distinctions can still be observed. It suggests that due to several deformation events, tectonic deformations controlled the fracture patterns in the Mórágy Granite Formation more than rock types, and the differences between unique fracture patterns of rock types vanished in terms of the fracture network.
  • During tunnel face mapping, RQD is calculated after a conventional clustering made by a field geologist or a 3D digital photogrammetry approach. It is affected by subjectivity or generated bias. In most cases, multi-phase tunneling processes can cause duplication in mapping results. Therefore, they can enhance fracture sets by overweighting some of them for tunnel stability.
While the study provides valuable insights into the spatial variability and control of fracture patterns, it does not fully assess how these differences influence critical modeling parameters for discrete fracture network (DFN) construction. This represents a significant limitation and will form the next phase of ongoing research. The reflection drawn from this work is that although conventional rock mass classification offers decades of empirical data, its direct application in advanced stochastic modeling remains problematic without methodological refinement.
The significance of this research lies in its attempt to bridge empirical classification and numerical modeling within a geotechnical context. It underscores the necessity of integrated, multi-method approaches for characterizing complex rock masses, particularly in high-stakes engineering applications such as radioactive waste disposal. Notably, the study concludes that constructing a reliable DFN for the Mórágy Granite Formation remains contentious under current data limitations, reaffirming the need for continued interdisciplinary research to achieve more accurate and defensible geological models.

Author Contributions

Conceptualization, G.S. and B.V.; methodology, G.S. and B.V.; writing—original draft preparation, G.S.; writing—review and editing, G.S. and B.V.; supervision and B.V.; project administration, G.S.; funding acquisition, G.S. and B.V. All authors have read and agreed to the published version of the manuscript.

Funding

This research was funded by Budapesti Műszaki és Gazdaságtudományi Egyetem (BME), “Doktoranduszi Kiválósági Ösztöndíj Program”(DKÖP) grant number 2020-2.1.1-ED2023-00239.

Data Availability Statement

The original contributions presented in this study are included in the article. Further inquiries can be directed to the corresponding author.

Acknowledgments

All the data and Figure 4, Figure 6 and Figure 7 belong to PURAM, and this paper has been published with the permission of the Public Limited Company for Radioactive Waste Management (PURAM). We would like to thank all current and former employees of RockStudy Ltd. for their joint field work.

Conflicts of Interest

The authors declare no conflict of interest.

References

  1. Niu, G.; He, X.; Xu, H.; Dai, S. Development of Rock Classification Systems: A Comprehensive Review with Emphasis on Artificial Intelligence Techniques. Eng 2024, 5, 217–245. [Google Scholar] [CrossRef]
  2. Saadati, G.; Javankhoshdel, S.; Abad, J.M.N.; Mett, M.; Kontrus, H.; Schneider-Muntau, B. AI-Powered Geotechnics: Enhancing Rock Mass Classification for Safer Engineering Practices. In Rock Mechanics and Rock Engineering; Springer: Berlin/Heidelberg, Germany, 2024; pp. 1–31. [Google Scholar] [CrossRef]
  3. Chudasama, B.; Ovaskainen, N.; Tamminen, J.; Nordbäck, N.; Engström, J.; Aaltonen, I. Automated mapping of bedrock-fracture traces from UAV-acquired images using U-Net convolutional neural networks. Comput. Geosci. 2024, 182, 105463. [Google Scholar] [CrossRef]
  4. Li, Y.; Elmo, D. A Critical Discussion on the Use of Discrete Fracture Network Models in Rock Engineering Practice: Why Rock Mass Characterisation Methods can Benefit from Considering Fracture Connectivity. In Rock Mechanics and Rock Engineering; Springer: Berlin/Heidelberg, Germany, 2024. [Google Scholar] [CrossRef]
  5. Deere, D.U. Technical description of rock cores for engineering purposes. Rock Mech. Engng. Geol. 1964, 1, 17–22. [Google Scholar]
  6. Deere, D.U.; Deere, D.W. Rock Quality Designation (RQD) After 20 Years; Technical Report; U.S. Army Engineer Waterways Experiment Station: Washington, DC, USA, 1989. [Google Scholar]
  7. Wang, R.; Elmo, D. Discrete Fracture Network (DFN) as an Effective Tool to Study the Scale Effects of Rock Quality Designation Measurements. Appl. Sci. 2024, 14, 7101. [Google Scholar] [CrossRef]
  8. Ojeda, P.; Elmo, D.; Rogers, S.; Brzovic, A. Discrete Fracture Network (DFN) Analysis to Quantify the Reliability of Borehole-Derived Volumetric Fracture Intensity. Geosciences 2023, 13, 187. [Google Scholar] [CrossRef]
  9. Singh, J.; Pradhan, S.P.; Vishal, V.; Singh, M. Characterization of a fractured rock mass using geological strength index: A discrete fracture network approach. Transp. Geotech. 2023, 40, 100984. [Google Scholar] [CrossRef]
  10. Morelli, G.L. Estimating the Volumetric Fracture Intensity P32 Through a New Analytical Approach. Rock Mech. Rock Eng. 2024, 57, 6085–6103. [Google Scholar] [CrossRef]
  11. Miyoshi, T.; Elmo, D.; Rogers, S. Influence of data analysis when exploiting DFN model representation in the application of rock mass classification systems. J. Rock Mech. Geotech. Eng. 2018, 10, 1046–1062. [Google Scholar] [CrossRef]
  12. Erharter, G.H. Rock Mass Structure Characterization Considering Finite and Folded Discontinuities: A Parametric Study. Rock Mech. Rock Eng. 2024, 57, 5229–5249. [Google Scholar] [CrossRef]
  13. Elmo, D.; Stead, D. The Role of Behavioural Factors and Cognitive Biases in Rock Engineering. Rock Mech. Rock Eng. 2021, 54, 2109–2128. [Google Scholar] [CrossRef]
  14. Palmstrom, A. Measurements of and correlations between block size and rock quality designation (RQD). Tunn. Undergr. Space Technol. 2005, 20, 362–377. [Google Scholar] [CrossRef]
  15. Palmström, A. The volumetric joint count—A valuable and simple measure of the degree of rock mass jointing. In Proceedings of 4th International Congress International Association of Engineering Geology; Oxford and IBH Publishing Co.: New Delhi, India, 1982; pp. 221–228. [Google Scholar]
  16. Rusydy, I.; Al-Huda, N.; Fahmi, M.; Effendi, N. Kinematic Analysis and Rock Mass Classifications for Rock Slope Failure at USAID Highways. Struct. Durab. Health Monit. 2019, 13, 379–398. [Google Scholar] [CrossRef]
  17. Grenon, M.; Hadjigeorgiou, J. Open Stope Stability Using 3D Joint Networks. Rock Mech. Rock Eng. 2003, 36, 183–208. [Google Scholar] [CrossRef]
  18. Ding, Q.; Wang, F.; Chen, J.; Wang, M.; Zhang, X. Research on Generalized RQD of Rock Mass Based on 3D Slope Model Established by Digital Close-Range Photogrammetry. Remote Sens. 2022, 14, 2275. [Google Scholar] [CrossRef]
  19. Plinninger, R.J.; Sommer, P.; Poscher, G. On the role of the Engineering Geologist in the Construction Phase of Challenging Tunnel Projects. In Proceeding of World Tunnel Congress 2017; Pål, J., Bjørn, N., Karl, N., Eds.; Norwegian Tunnelling Society: Oslo, Norway, 2017; ISBN 978-82-92641-40-8. [Google Scholar]
  20. MTóth, T. Determination of geometric parameters of fracture networks using 1D data. J. Struct. Geol. 2010, 32, 878–885. [Google Scholar]
  21. Min, K.-B.; Jing, L. Numerical determination of the equivalent elastic compliance tensor for fractured rock masses using the distinct element method. Int. J. Rock Mech. Min. Sci. Géoméch. Abstr. 2003, 40, 795–816. [Google Scholar] [CrossRef]
  22. Baghbanan, A.; Jing, L. Hydraulic properties of fractured rock masses with correlated fracture length and aperture. Int. J. Rock Mech. Min. Sci. Géoméch. Abstr. 2007, 44, 704–719. [Google Scholar] [CrossRef]
  23. Zhu, J. Effective aperture and orientation of fractal fracture network. Phys. A Stat. Mech. Its Appl. 2018, 512, 27–37. [Google Scholar] [CrossRef]
  24. Gottron, D.; Henk, A. Upscaling of fractured rock mass properties—An example comparing Discrete Fracture Network (DFN) modeling and empirical relations based on engineering rock mass classifications. Eng. Geol. 2021, 294, 106382. [Google Scholar] [CrossRef]
  25. Zoback, M.D. Reservoir Geomechanics; Cambridge University Press: Cambridge, UK, 2010. [Google Scholar]
  26. Liu, B.; Yan, G.; Ma, Y.; Scheuermann, A. Measurement of In-Situ Flow Rate in Borehole by Heat Pulse Flowmeter: Field-Case Study and Reflection. Geosciences 2023, 13, 146. [Google Scholar] [CrossRef]
  27. Balla, Z. (Ed.) Annual Report of the Geological Institute of Hungary; Magyar Állami Földtani Intézet (Geological Institute of Hungary): Budapest, Hungary, 2004. [Google Scholar]
  28. Király, E.; Koroknai, B. The magmatic and metamorphic evolution of the north-eastern part of the Mórágy Block. In Annual Report of the Geological Institute of Hungary; Geological Institute of Hungary: Budapest, Hungary, 2004; pp. 299–310. [Google Scholar]
  29. Maros, G.; Koroknai, B.; Palotás, K.; Musitz, B.; Füri, J.; Borsody, J.; Kovács-Pálfy, P.; Kónya, P.; Viczián, I.; Balogh, K.; et al. Brittle Fault Zones in the Mórágy Granite (South Transdanubia): New Structural and K-ar Data. In Annual Report of the Geological Institute of Hungary; Magyar Állami Földtani Intézet (Geological Institute of Hungary): Budapest, Hungary, 2009; pp. 91–112. [Google Scholar]
  30. Maros, G.; Koroknai, B.; Palotás, K.; Fodor, L.; Dudko, A.; Forián-Szabó, M.; Zilahi-Sebess, L.; Bán-Győry, E. Tectonic Analysis and Structural Evolution of the north-eastern Mórágy Block. In Annual Report of the Geological Institute of Hungary; Magyar Állami Földtani Intézet (Geological Institute of Hungary): Budapest, Hungary, 2004; pp. 370–386. [Google Scholar]
  31. Vásárhelyi, B.; Somodi, G.; Krupa, Á.; Kovács, L. Determining the Geological Strength Index (GSI) using different methods. In Proceedings of the ISRM International Symposium—EUROCK 2016, Ürgüp, Turkey, 29–31 August 2016; pp. 1049–1054. [Google Scholar]
  32. Maros, G.; Borsody, J.; Füri, J.; Koroknai, B.; Palotás, K.; Rálischné Felgenhauer, E. A Mórágyi-rög ÉK-I Részének Szerkezet-Földtani Értékelése a Töréses Szerkezetekre; Magyar Állami Földtani Intézet (Geological Institute of Hungary): Budapest, Hungary, 2012; p. 121. [Google Scholar]
  33. Kovács-Pálffy, P.; Földvári, M. Hydrothermal minerals and phenomena in the Mórágy Granite Formation. In Annual Report of the Geological Institute of Hungary 2003; Magyar Állami Földtani Intézet (Geological Institute of Hungary): Budapest, Hungary, 2004; pp. 327–338. [Google Scholar]
  34. Benedek, K.; Molnár, P. Combining structural and hydrogeological data: Conceptualization of a fracture system. Eng. Geol. 2013, 163, 1–10. [Google Scholar] [CrossRef]
  35. Bíró, L.; Benedek, K. A Repedések Hosszeloszlásának Vizsgálata; RHK-K-092/10; Radioaktív Hulladékokat Kezelő (RHK) Kft: Paks, Hungar, 2010. [Google Scholar]
  36. Benedek, K.; Bőthi, Z.; Mező, G.; Molnár, P. Compartmented flow at the Bátaapáti site in Hungary. Hydrogeol. J. 2009, 17, 1219–1232. [Google Scholar] [CrossRef]
  37. Kovács, L.; Kádár, B.; Krupa, Á.; Mészáros, E.; Pöszmet, T.; Rátkai, O.; Somodi, G.; Amigyáné dr Reisz, K.; Vásárhelyi, B. The revision and upgrade of Geotechnical Interpretative Report; RHKK-028/16; Radioaktív Hulladékokat Kezelő (RHK) Kft: Paks, Hungar, 2016. (In Hungarian) [Google Scholar]
  38. Pötsch, M.; Schubert, W.; Gaich, A. Application of metric 3D images of rock faces for the determination of the response of rock slopes to excavation. In Proceedings of the ISRM International Symposium—EUROCK 2005, Brno, Czech Republic, 18–20 May 2005; pp. 489–497. [Google Scholar]
  39. Deák, F.; Kovács, L.; Vásárhelyi, B. Geotechnical rock mass documentation in the Bátaapáti radioactive waste repository. Cent. Eur. Geol. 2014, 57, 197–211. [Google Scholar] [CrossRef]
  40. Zhang, L. Determination and applications ofrock quality designation (RQD). J. Rock Mech. Geotech. Eng. 2016, 8, 389–397. [Google Scholar] [CrossRef]
  41. Kamera, R.; Vásárhelyi, B.; Kovács, L.; M Tóth, T. Relationship Between the Fractal Dimension and the Rock Mass Classification Parameters in the Bátaapáti Radioactive Waste Repository. In Engineering Geology for Society and Territory—Volume 6; Springer: Berlin/Heidelberg, Germany, 2015. [Google Scholar] [CrossRef]
  42. Barton, N.; Lien, R.; Lunde, J. Engineering classification of rock masses for the design of tunnel support. Rock Mech. Rock Eng. 1974, 6, 189–236. [Google Scholar] [CrossRef]
  43. Barton, N.; Grimstad, E. Forty Years with the Q-System in Norway and Abroad; Norsk Fjellteknisk Forening (NFTF): Oslo, Norway, 2014; pp. 4.1–4.25. [Google Scholar]
  44. Bieniawski, Z. Engineering classification of jointed rock masses. Civ. Eng. S. Afr. 1973, 15, 333–343. [Google Scholar]
  45. Bieniawski, Z.T. Rock mass classification in rock engineering. In Proceedings of the Symposium Proceedings of Exploration for Rock Engineering, Cape Town, South Africa, 1–5 November 1976; Bieniawski, Z.T., Ed.; Volume 1, pp. 97–106. [Google Scholar]
  46. Bieniawski, Z.T. Engineering Rock Mass Classifications: A Complete Manual for Engineers and Geologists in Mining, Civil, and Petroleum Engineering; Wiley: New York, NY, USA, 1989; 251p. [Google Scholar]
  47. Hoek, E.; Kaiser, P.K.; Bawden, W.F. Support of Underground Excavations in Hard Rock, 1st ed.; AA Balkema Publishers: Rotterdam, The Netherlands, 1995; 215p. [Google Scholar]
  48. Hoek, E.; Carranza-Torres, C.; Corkum, B. Hoek-Brown Failure Criterion—2002 Edition. In Proceedings of the 5th North American Rock Mechanics Symposium, Toronto, ON, Canada, 7–10 July 2002; pp. 267–271. [Google Scholar]
  49. Barton, N.; Choubey, V. The shear strength of rock joints in theory and practice. Rock Mech. Rock Eng. 1977, 10, 1–54. [Google Scholar] [CrossRef]
  50. Barton, N. Shear strength criteria for rock, rock joints, rockfill and rock masses: Problems and some solutions. J. Rock Mech. Geotech. Eng. 2013, 5, 249–261. [Google Scholar] [CrossRef]
  51. Palmström, A.; Blindheim, O.T.; Broch, E. The Q system—Possibilities and limitations. In Proceedings of the Norwegian Annual Tunnelling Conference on Fjellsprengningsteknikk/Bergmekanikk/Geoteknikk, Oslo, Norway, November 2002; pp. 41.1–41.38. (In Norwegian). [Google Scholar]
  52. Barton, C.C.; Larsen, E. Fractal Geometry of Two-Dimensional Fracture Networks at Yucca Mountain, Southwest Nevada. In Fundamentals of Rock Joints: Proceedings of the International Symposium on Fundamentals of Rock Joints; Stephannson, O., Ed.; Centek Publishers: Lulea, Sweden, 1985; pp. 74–84. [Google Scholar]
  53. La Pointe, P. A method to characterize fracture density and connectivity through fractal geometry. Int. J. Rock Mech. Min. Sci. Géoméch. Abstr. 1988, 25, 421–429. [Google Scholar] [CrossRef]
  54. Tsuchiya, N.; Nakatsuka, K. A two-dimensional mono-fractal approach to natural fracture networks in rock. Geotherm. Sci. Tech. 1995, 6, 63–82. [Google Scholar]
  55. Roberts, S.; Sanderson, D.J.; Gumiel, P. Fractal analysis of Sn-W mineralization from central Iberia; insights into the role of fracture connectivity in the formation of an ore deposit. Econ. Geol. 1998, 93, 360–365. [Google Scholar] [CrossRef]
  56. Mandelbrot, B.B. The Fractal Geometry of Nature; W.H. Freeman and Company: New York, NY, USA, 1983. [Google Scholar]
  57. Mandelbrot, B.B. Self-affine fractal dimension. Phys. Scr. 1985, 32, 257–260. [Google Scholar] [CrossRef]
  58. Barton, C.C. Fractal analysis of scaling and spatial clustering of fractures. In Fractals in the Earth Sciences; Barton, C.C., La Pointe, P.R., Eds.; Plenum Press: New York, NY, USA, 1995; p. 168. [Google Scholar]
  59. Tóth, T.M. Fracture network characterization using 1D and 2D data of the Mórágy Granite body, southern Hungary. J. Struct. Geol. 2018, 113, 176–187. [Google Scholar] [CrossRef]
  60. Tóth, M.; Kamera, R. 2010: Repedésrendszer Tulajdonságainak Elemzésére és a Vizsgált Paraméterek Térbeli Kiterjesztésére Alkalmazható Eljárás Kidolgozása, Ellenőrzése és Optimalizálása; RHK−K−103/10; Kőmérő Kft & RHK Kft: Paks, Hungary, 2009. [Google Scholar]
  61. Szebényi, G.; Török, P.; Hámos, G.; András, E.; Szamos, I.; Miskolczi, R.; Gulácsi, Z.; Maros Gy Mező Gy Korpai, F.; Kovács, L. Földtani Összefoglaló Jelentés. NRHT Létesítés 2008–2012; RHK-K-020/12; Kőmérő Kft & RHK Kft: Paks, Hungary, 2012. [Google Scholar]
  62. Geiger, J.; Kovács, L.; Deák, F.; Somodi, G. A Bátaapáti Kőzetmechanikai Mérések Matematikai Statisztikai Feldolgozása; RHK−K−077/09; Kőmérő Kft & RHK Kft: Paks, Hungary, 2009. [Google Scholar]
Figure 1. (a) Schematic view of the National Radioactive Waste Repository (NRWR) at Bátaapáti, Hungary; (b) Tunnels reviewed in this paper (A: Access tunnels, B: Research tunnel 3, C: Fault zone, D: Repository chambers); (c) Repository chambers with the year of construction. Green: Monzonite and hybrid rocks. Purple: Monzogranite rock. Red lines: Main shear zones with clay gauges. Green line: Basaltic dyke [31].
Geotechnics 05 00034 g001
Figure 2. Tunnel face with blocky monzogranite rock. (photo by the author with permission from PURAM).
Geotechnics 05 00034 g002
Figure 3. Joint Sets and the Joint Sets spacing (S) from Rusydy [16] in 3D after modification from Palmstrom [14].
Geotechnics 05 00034 g003
Figure 4. The obtained fracture population for the discrete fracture network model from a tunnel face [60].
Geotechnics 05 00034 g004
Figure 5. RQD and fractal D parameter of the investigated tunnel faces.
Geotechnics 05 00034 g005
Figure 6. RQD distributions from tunnel mapping, (a) In the analyzed 33 m2-sized tunnel face and (b) interpretations of three different tunnel sections from Kovács et al. (2016) [37].
Geotechnics 05 00034 g006
Figure 7. Confidence intervals of RQD values from borehole evaluation in the surroundings of the repository area [62].
Geotechnics 05 00034 g007
Table 1. RQD of different rock types.
MonzograniteMonzoniteHybrid Rocks
Number of samples591741
Average575455
Std deviation1920.7518.65
Var. Coefficient343834.1
Minimum5117
Maximum988989
Table 2. Fractal D parameter of different rock types.
MonzograniteMonzoniteHybrid Rocks
Number of samples591355
Average1.681.731.66
Std deviation0.070.100.08
Var. Coefficient4.55.64.9
Minimum1.531.511.50
Maximum1.861.861.84
Disclaimer/Publisher’s Note: The statements, opinions and data contained in all publications are solely those of the individual author(s) and contributor(s) and not of MDPI and/or the editor(s). MDPI and/or the editor(s) disclaim responsibility for any injury to people or property resulting from any ideas, methods, instructions or products referred to in the content.

