Article

Experimental Investigation of the Relationship Between Vibration Acceleration and Bearing Capacity for Space Exploration Legged Rovers

by
Tomohiro Watanabe
1,*,†,
Yutaka Fukura
2,†,
Kazuhiko Hiramoto
1,† and
Kojiro Iizuka
3,†
1
Mechanical Engineering Program, Niigata University, 8050 Ikarashi 2-no-cho, Nishi-ku, Niigata 950-2181, Japan
2
Advanced Materials Science and Technology, Graduate School of Science and Technology, Niigata University, 8050 Ikarashi 2-no-cho, Nishi-ku, Niigata 950-2181, Japan
3
Department of Systems and Engineering and Science, Shibaura Institute of Technology, 307, Fukasaku, Minuma-ku, Saitama 337-8570, Japan
*
Author to whom correspondence should be addressed.
These authors contributed equally to this work.
Geotechnics 2025, 5(1), 21; https://doi.org/10.3390/geotechnics5010021
Submission received: 29 December 2024 / Revised: 21 February 2025 / Accepted: 7 March 2025 / Published: 18 March 2025
(This article belongs to the Special Issue Recent Advances in Geotechnical Engineering (2nd Edition))

Abstract

:
In the exploration missions for Mars and the Moon, rovers with legs as mobility mechanisms are necessitated owing to their high mobility. However, the surface of Mars and the Moon is loose, leading the rovers to slip by virtue of the ground easily deforming due to the leg movements of the rover. A walking method aimed at preventing slippage was proposed to address this issue. Prior studies have confirmed that applying vibrations increases the shear strength of the ground and sinkage of the rover legs, thereby enhancing bearing capacity, that is, the resistance force exerted on the legs of the rover by the ground. Identifying the optimal vibration is crucial for maximizing performance. This study investigated the relationship between bearing capacity and vibration acceleration, revealing a correlation between the peak bearing capacity and the main vibration acceleration spectra. This finding provides insight into determining the optimal time for imparting vibrations to the ground, thereby improving the performance of space exploration rovers.

Graphical Abstract

1. Introduction

1.1. Importance of Extraterrestrial Body Exploration

In recent years, the development of extraterrestrial bodies has enhanced our understanding of planetary origins and disseminated valuable scientific knowledge. The National Aeronautics and Space Administration (NASA) plans to construct the base on the Moon to broaden space exploration horizons and long-term extraterrestrial missions, including access to Mars. To this end, the Artemis program is progressing to enable astronauts to conduct the mission easily on the Moon [1]. Concurrently, the Gateway, a space station in lunar orbit, will be constructed to access the Moon easily [2]. In its Mars exploration efforts, NASA’s Perseverance rover successfully landed on Mars in 2021 and conducted extensive research on the Martian environment and potential life forms [3]. This rover experimentally demonstrated that oxygen can be artificially generated from the Martian atmosphere and that a drone can fly on Mars. China’s Zhurong rover, which also landed on Mars in 2021, has investigated the relationship between the Martian terrain shape and traces of water activity [4], contributing to our understanding of Mars geology.

1.2. Locomotion Methods of Rovers for Extraterrestrial Body Exploration

Robots called rovers were used in space exploration of the Moon and Mars; they moved and conducted the mission on these surfaces. The wheeled rovers were used in conventional missions owing to their straightforward control and durability. Furthermore, the wheeled rovers have a proven track record of successful missions. For instance, the detection of water traces by the Mars exploration rover suggested its potential to have harbored life [5]. The Pathfinder mission delivered the micro rover called Sojourner to Mars [6]. Sojourner ran on Mars and investigated Martian rocks and soils. Lunokhod 2, developed by the Soviet Union, ran long distances and took extensive photographic and television imagery on the Moon [7]. However, the wheeled rovers risk becoming immobile because rotating wheels dig into the ground, thereby sinking the wheels into the ground. For example, Spirit, the rover that ran on Mars, became stuck on the loose ground and could not move forward [8]. There are many risks that the wheeled rovers get stuck on the terrain, such as slopes, craters, and holes. Therefore, rovers equipped with higher mobility are required to explore the uncharted area.
Legged rovers are robots with exceptional mobility on rough terrains. The Jet Propulsion Laboratory developed ATHLETE, a hexapod robot for space exploration [9]. ATHLETE is good at overcoming rugged terrain because it can select the ground contact points with each leg. Furthermore, this allows the legged rover to sink its legs because it can separate feet and the ground. Yeomans et al. compared the legged and wheeled rovers regarding the effect of sinkage during movement on their mobility [10]. In their locomotion, the legs of the legged rover have a specific role: supporting leg and swing leg. The supporting leg touches the ground and supports the body, while the swing leg separates from the ground to propel the body forward. During walking, the leg mechanism switches, with the supporting leg becoming the swing leg and vice versa. Hence, the leg mechanism is the locomotion in that the contact with the ground is discrete because the leg separates from the ground when the rover walks. Compared to wheeled rovers, the effect of sinkage during movement on legged rover mobility is relatively small. Consequently, legged rovers have superior mobility on loose ground. However, the legged robots consume more energy than the wheeled rovers because the moving mechanism of the legged robots is complex and uses actuators. To address this issue, a hybrid mission strategy pairing a rover for extended travel distances with a legged robot to explore particularly rough terrain [11,12] is proposed. This approach significantly expands the accessible exploration areas. As lunar and Martian exploration ventures further into the unknown, the demand for legged rovers with superior mobility on challenging surfaces is expected to increase.
Kato et al. proposed a gripper for the legged rovers to move efficiently on volcanoes and celestial bodies [13]. Rovers struggle to maintain their stability in environments like cliffs and caves. The developed gripper comprises several fingers. Spines are attached to the tip of the fingers. When the gripper presses against the object, the spines hook onto the object. This operation makes it possible to grasp the object. The legged rovers can climb and move on cliffs and rocky terrain by gripping the ground using the developed gripper.
The legged robot is also essential for outdoor work on Earth. Komizunai et al. developed a simulator about a humanoid walking on loose ground. Humanoid robots have been expected to replace humans in civil engineering, construction, and disaster relief work [14]. To perform these tasks, humanoid robots must capable of walking on uneven terrain, such as rough terrain and loose ground. The simulator estimated the amount of leg subsidence when walking. By estimating the amount of leg subsidence, a humanoid’s posture can be changed before it falls. This study is in common with one about the space exploration legged rover in that they study the terra mechanics between the leg mechanism and the loose ground.

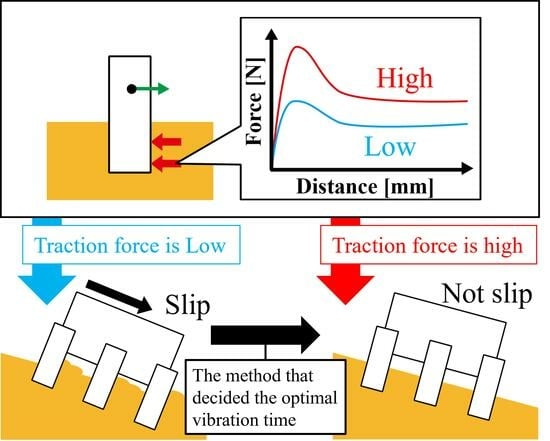
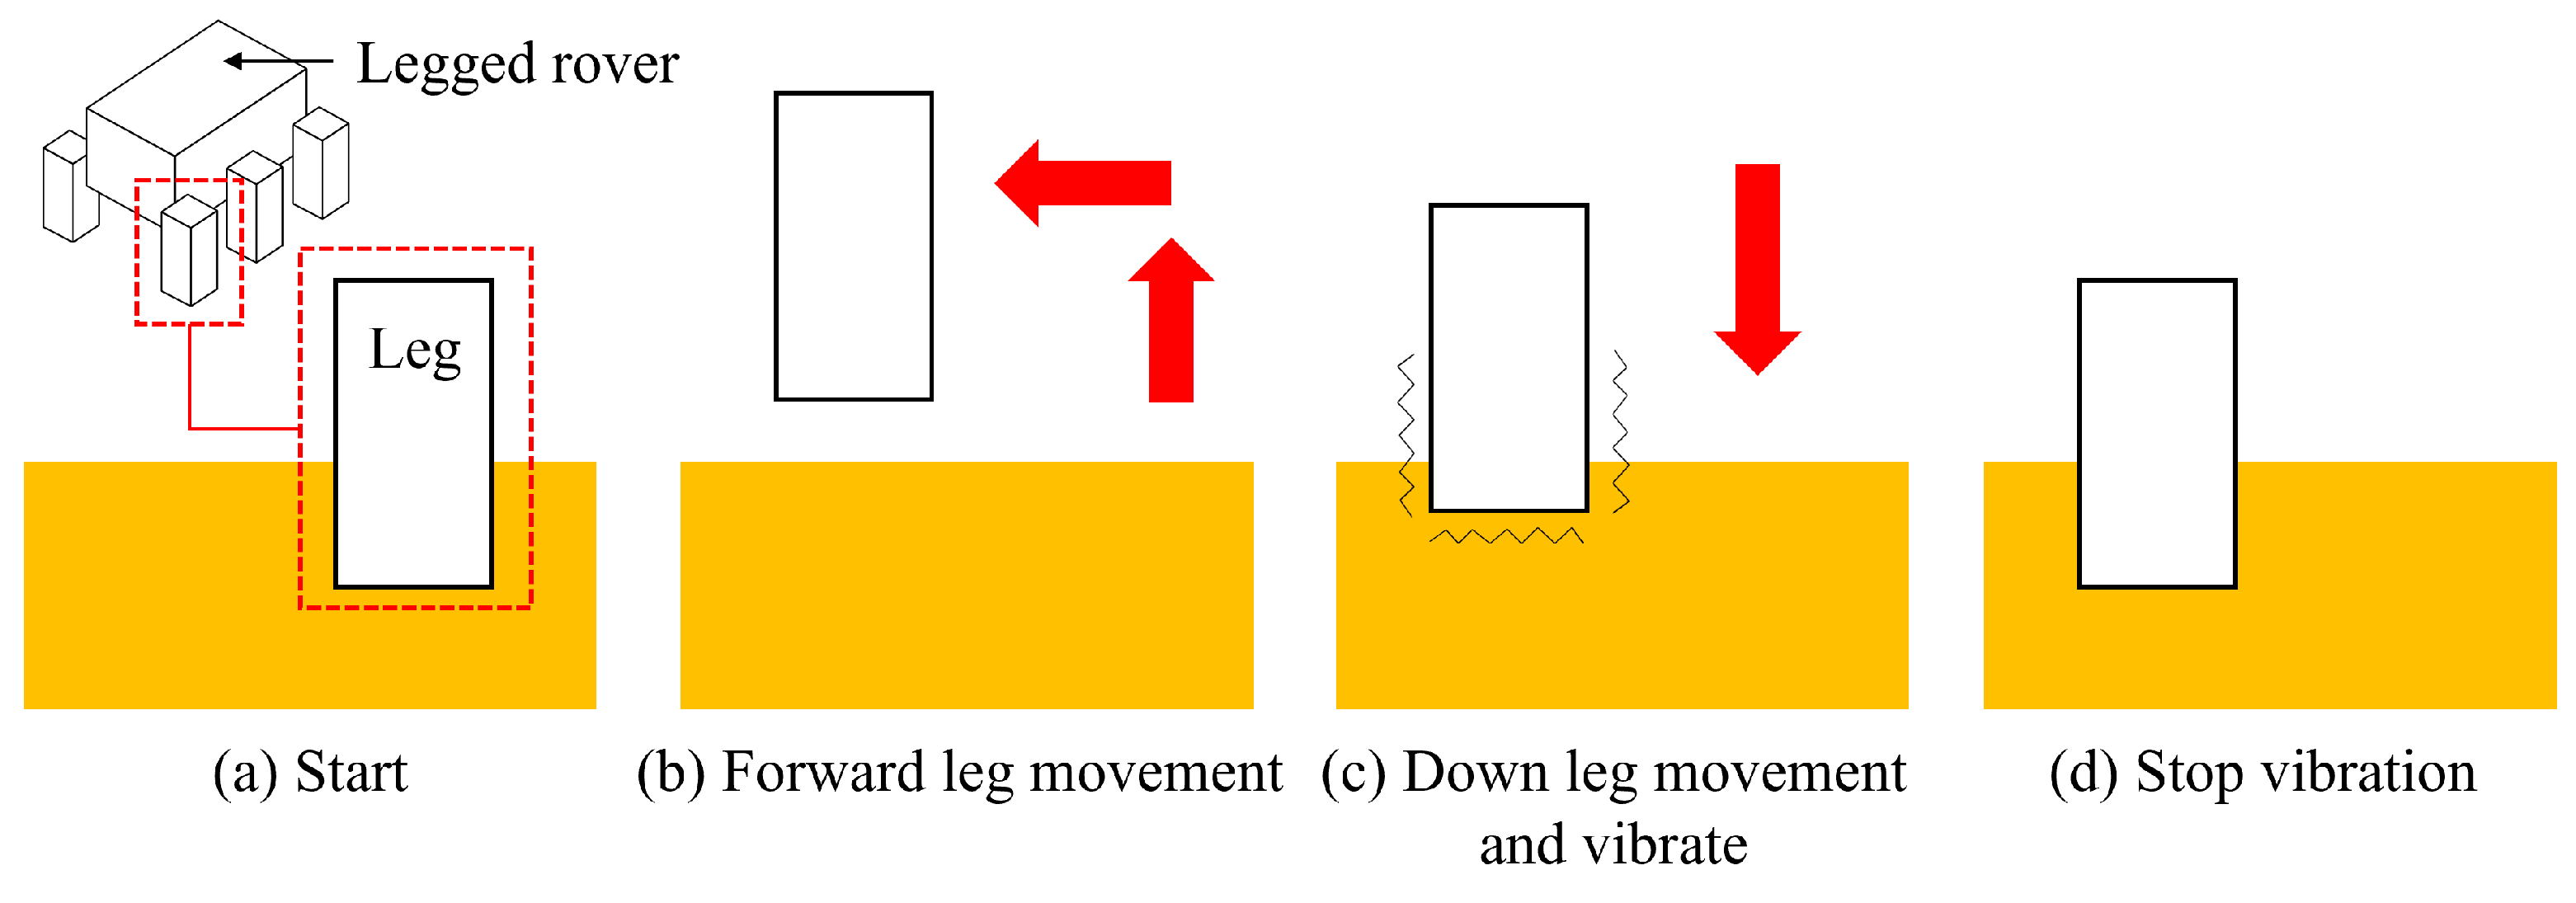
1.3. Introduction to Our Previous Research

Legged rovers can effectively overcome obstacles like rocks because their legs have much freedom and can select the touch point between the feet and the ground. However, they are not good at moving on loose ground with loose soil because they slip and cannot move forward due to the deformation of the terrain. The surface of the Moon and Mars is covered with loose soil, called regolith, and rough terrain. Therefore, the legged rovers should have high mobility on the loose ground. In a previous study, we proposed a walking method that changed the ground conditions through vibrations to prevent the rover from slipping on the loose ground [15].
The previous study investigated the ground density and shear strength in each imparting vibrations condition [15]. In the previous study, the relationship between the shear strength of the ground measured by the hand vane and the ground density was confirmed. Using this relationship, the hand vane measured the ground density and shear strength before, during, and after vibrations. Consequently, these measurements were smaller during vibrations than before vibrations. Furthermore, these measurements were larger after vibrations than before vibrations. These results suggest that the ground condition changes depending on how vibrations are imparted. Figure 1 illustrates the movement of ground particles, which was considered from these results. Before imparting vibrations, spaces are considered to exist between particles (Figure 1a). When imparting vibrations, the particles are considered to flow, and the contact between the particles is considered to be solved (Figure 1b). Therefore, the friction between the particles decreases, and the ground’s shear strength becomes low. After ceasing vibrations, the ground is considered to be compact, and spaces between particles are considered to almost disappear (Figure 1c). Therefore, the ground’s shear strength and density increase.
We proposed a walking sequence that combines leg movement and vibration timing and increases the force received by the rover’s leg from the ground to reduce slippage. Figure 2 depicts the proposed walking sequence. First, the leg moves forward (Figure 2b). Second, the leg touches the ground and starts vibrating (Figure 2c). This sequence decreases the ground’s shear strength and sinks the leg easily. Subsequently, vibrations cease for compacting the ground and increasing the ground density (Figure 2d). The force received by the rover’s leg from the ground increases by increasing leg sinkage and ground density because the slip line becomes large. The slip line is the border between ground particles that move with the leg and the stopped one (Figure 3a). The longer the slip line, the larger the force received by the rover’s leg from the ground (Figure 3b,c). Related studies have confirmed that the slip line increases with greater leg sinkage and higher ground density [17,18]. We evaluated the mobility of the proposed walking sequence through an experiment. In the experiment, a legged testbed walks on the sloped loose ground. By comparing the movement distance using the proposed walking sequence and one without vibration, the results demonstrated significant enhancements in mobility.
The mobility of a legged rover depends on the force received by the rover’s leg from the ground. This force is called the ground’s bearing capacity. Enhancing this capacity through vibrations is crucial for improving the rover’s mobility when using the proposed walking method. The vibration effect on increasing bearing capacity can be confirmed from the bearing capacity model. Reece’s model elucidates this effect [19]. Figure 4a depicts the slip line in Reece’s model. In Reece’s model, the bearing capacity P is calculated from the equilibrium of moments around the point A in Figure 4a, as shown in Equation (1). l 1 is the vertical length from the point A to one, which is caused by P. V is the volume of the ground block ABCE, γ is the ground density, and g is gravitational acceleration, respectively. l 2 is the horizontal length from the point A to the center of gravity of the ground block ABCE. P R is the force caused by the ground triangle area CDE in Figure 4a. l 3 is the vertical length from the point A to one, which is caused by P R .
P = 1 l 1 ( V γ g l 2 + P R l 3 )
V is calculated using Equation (2). W is the width of the rod. S 1 is area ABO, S 2 is area OBC, and S 3 is area ACE, as shown in Figure 4b. These areas are calculated using Equations (3), (4), and (5), respectively.
V = W ( S 1 + S 2 + S 3 )
S 1 = 1 2 H γ ζ sin α
S 2 = 1 4 tan ψ r 0 2 ( e 2 θ c tan ψ 1 )
S 3 = 1 2 sin α cos α ( r 0 e θ c tan ψ + ζ ) 2
H is the sinkage of the rod. ζ is the length from the point A to O. The point O exists on the line AC. ψ is the angle of internal friction and a unique parameter of sand. α is calculated from ψ , as shown in Equation (6).
α = π 4 ψ 2
The line from B to C is curved in accordance with r, which is the length from the point O to R; it is calculated using Equation (7). The point R moves on the line from B to C, and the BOR is changed by the position of the point R. BOR expresses θ . θ becomes maximum when the point R reaches the point C. The maximum θ is defined as θ c .
r = r 0 e θ tan ψ
r 0 is the length from the point O to R when θ is zero and calculated using Equation (8).
r 0 = H 2 + ζ 2 2 H ζ cos ( π 2 α )
P R is calculated from Rankine’s earth pressure theory, as shown in Equation (9). H R is the length from the point E to C and calculated from Equation (10).
P R = 1 2 γ H R tan 2 α
H R = sin α ( r 0 e θ c tan ψ + ζ )
The rover slips because the force exerted by its leg exceeds the ground’s bearing capacity, causing the ground to collapse. The model equation of the bearing capacity proposed by Reece et al. includes the sinkage of the rod and the ground density in all terms. The larger these parameters, the larger the bearing capacity. Because the bearing capacity increases these parameters by imparting vibration, the ground becomes hard to collapse, and the legged rover prevents slippage.
Understanding the relationship between bearing capacity and vibration parameters is indispensable for improving our method. Moving forward, a method that judges the optimal vibration parameters to increase the bearing capacity efficiently is needed. One of the vibration parameters is vibration time. We should select an optimal time for imparting vibration to the ground to reduce energy consumption.

1.4. Research Overview

In a previous study, the walking sequence that prevents the rovers from slipping using vibration was proposed for space exploration legged rovers. The subsequent step investigates the relationship between bearing capacity and vibration acceleration to determine the optimal vibration time. This study focused on using vibration acceleration as an input to determine the optimal vibration time by referencing related studies. In the experiment, we measured the acceleration of a rod mimicking the rover’s leg as it vibrated on the ground, while the bearing capacity was measured when the rod was dragged on the ground. The vibration acceleration was analyzed using the fast Fourier transform. The analysis revealed that vibration acceleration primarily comprised the sine wave with a specific vibration frequency. This main component’s amplitude of vibration acceleration was changed as vibration time advanced. This value changes drastically when vibration time is insufficient to compact the ground. Conversely, it hardly changes when vibration time is sufficient. Using these phenomena, we proposed a parameter related to the bearing capacity. In the proposed method, the variation in the difference between the main spectra component relative to vibration time was obtained first. Next, the standard deviation was calculated using this variation as a parameter related to the bearing capacity. Additionally, we confirmed the correlation between the peak bearing capacity and the proposed vibration acceleration parameter.
The remainder of this paper is organized as follows. Section 2 explains the experimental setup and methods employed in this study. Section 3 explains the experimental results and discusses the relationship between bearing capacity and vibration acceleration. Finally, Section 4 summarizes the study.

2. Methods

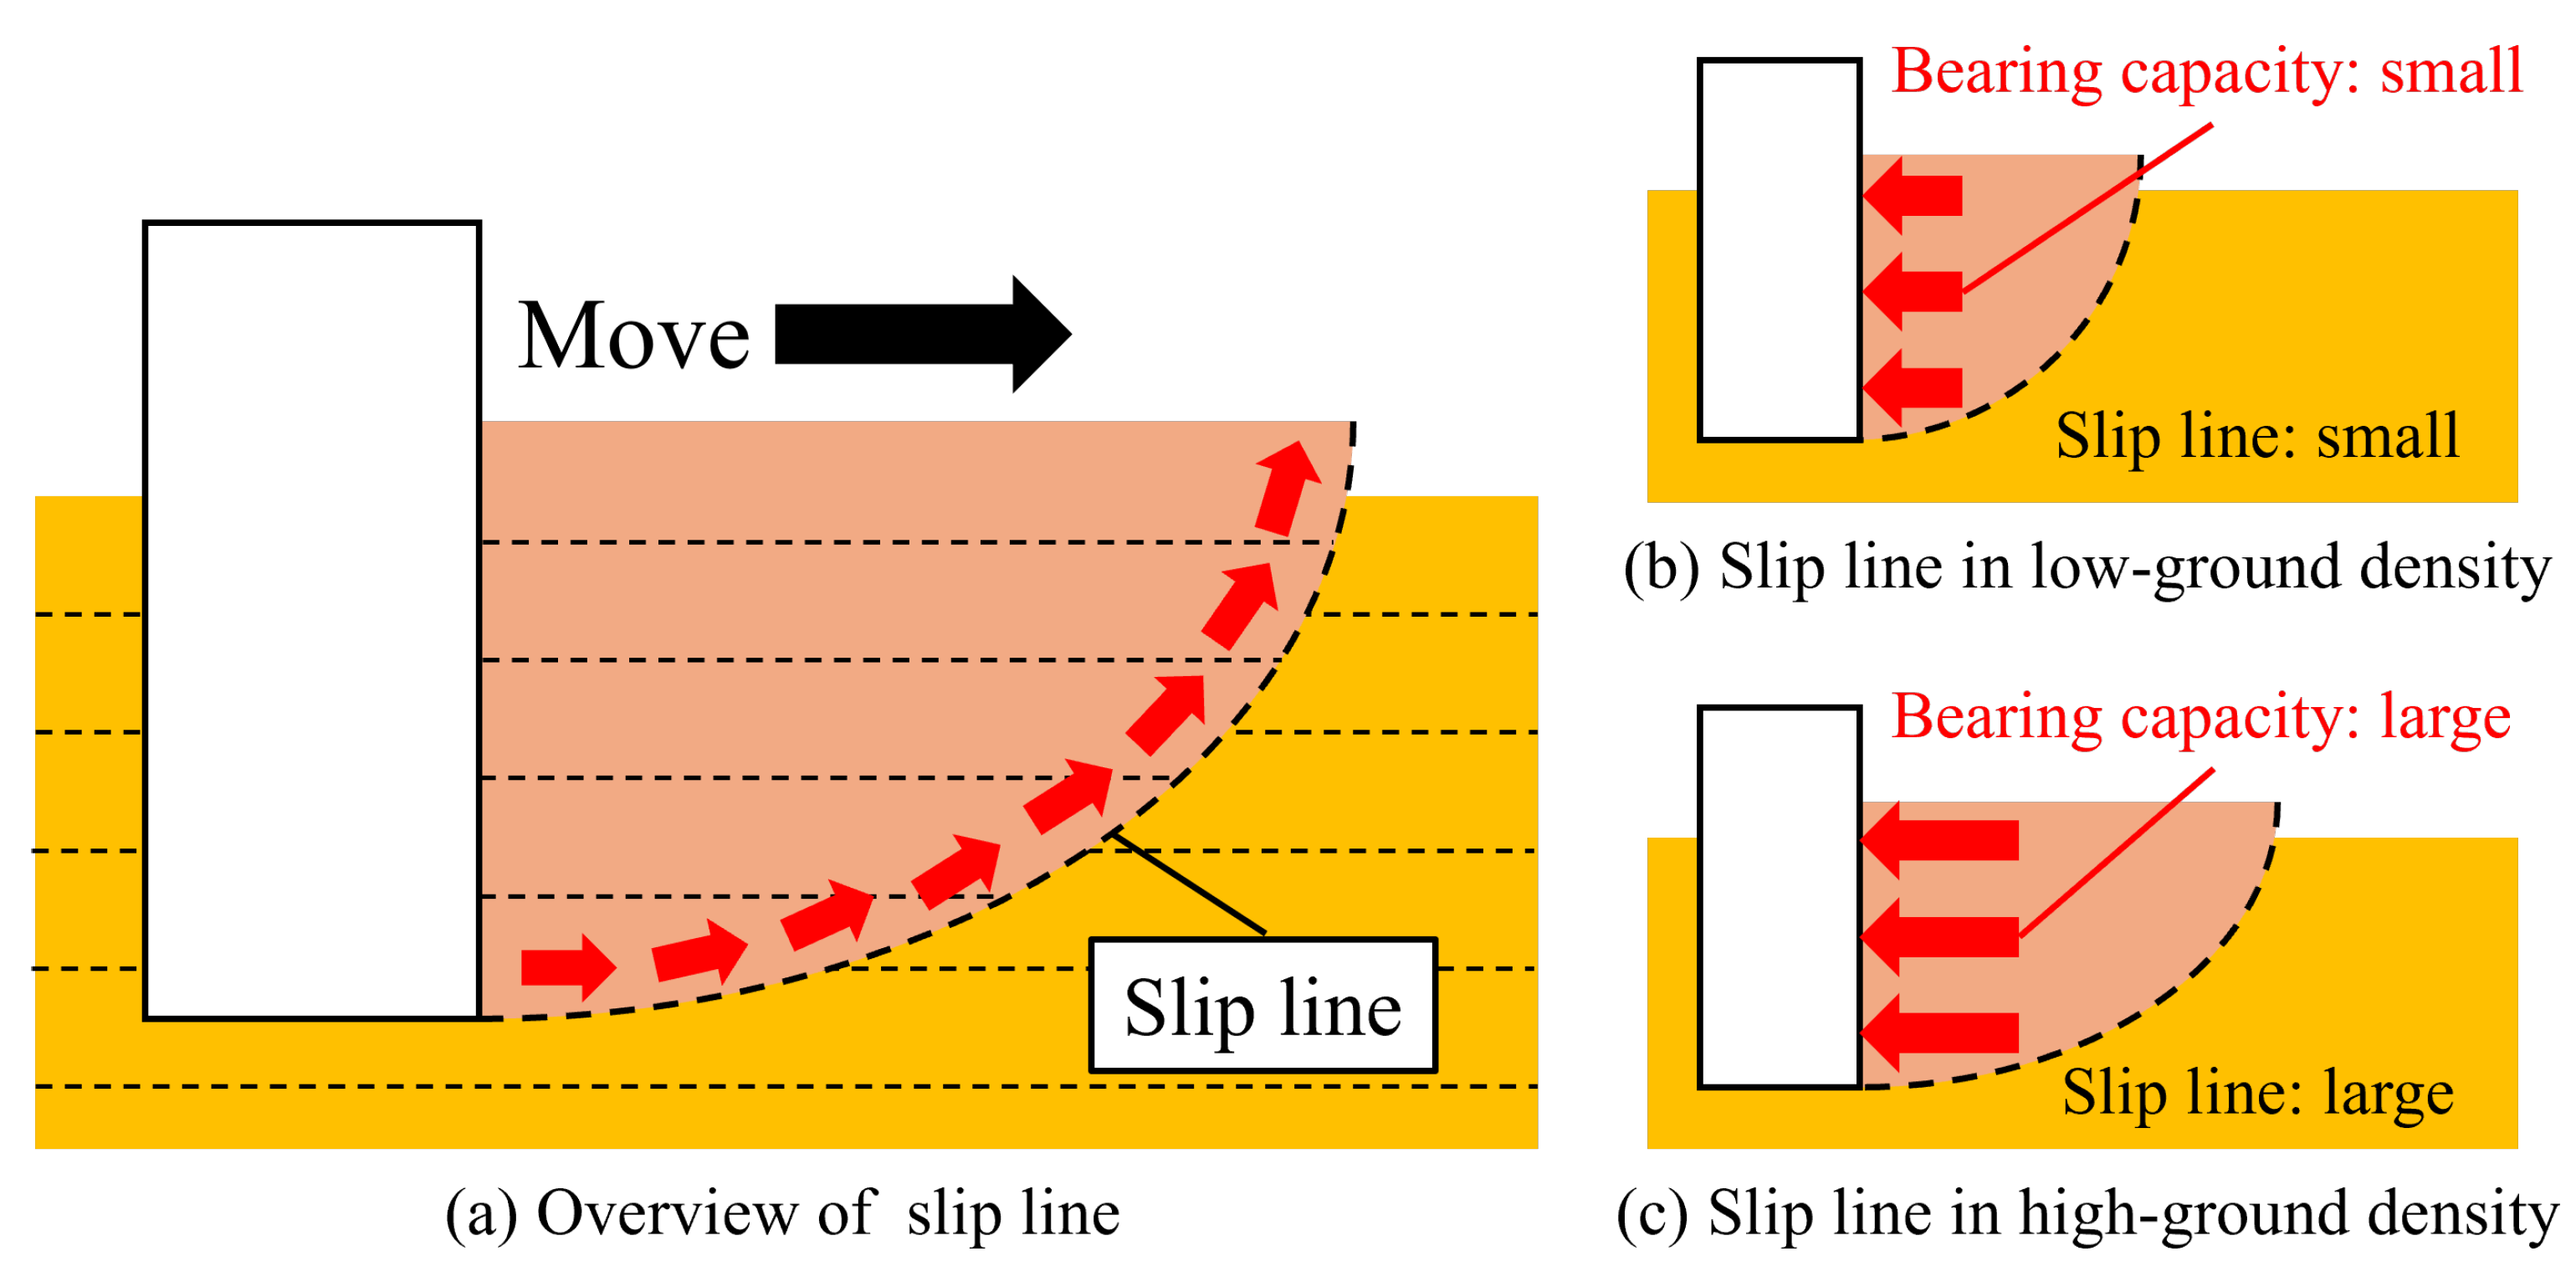
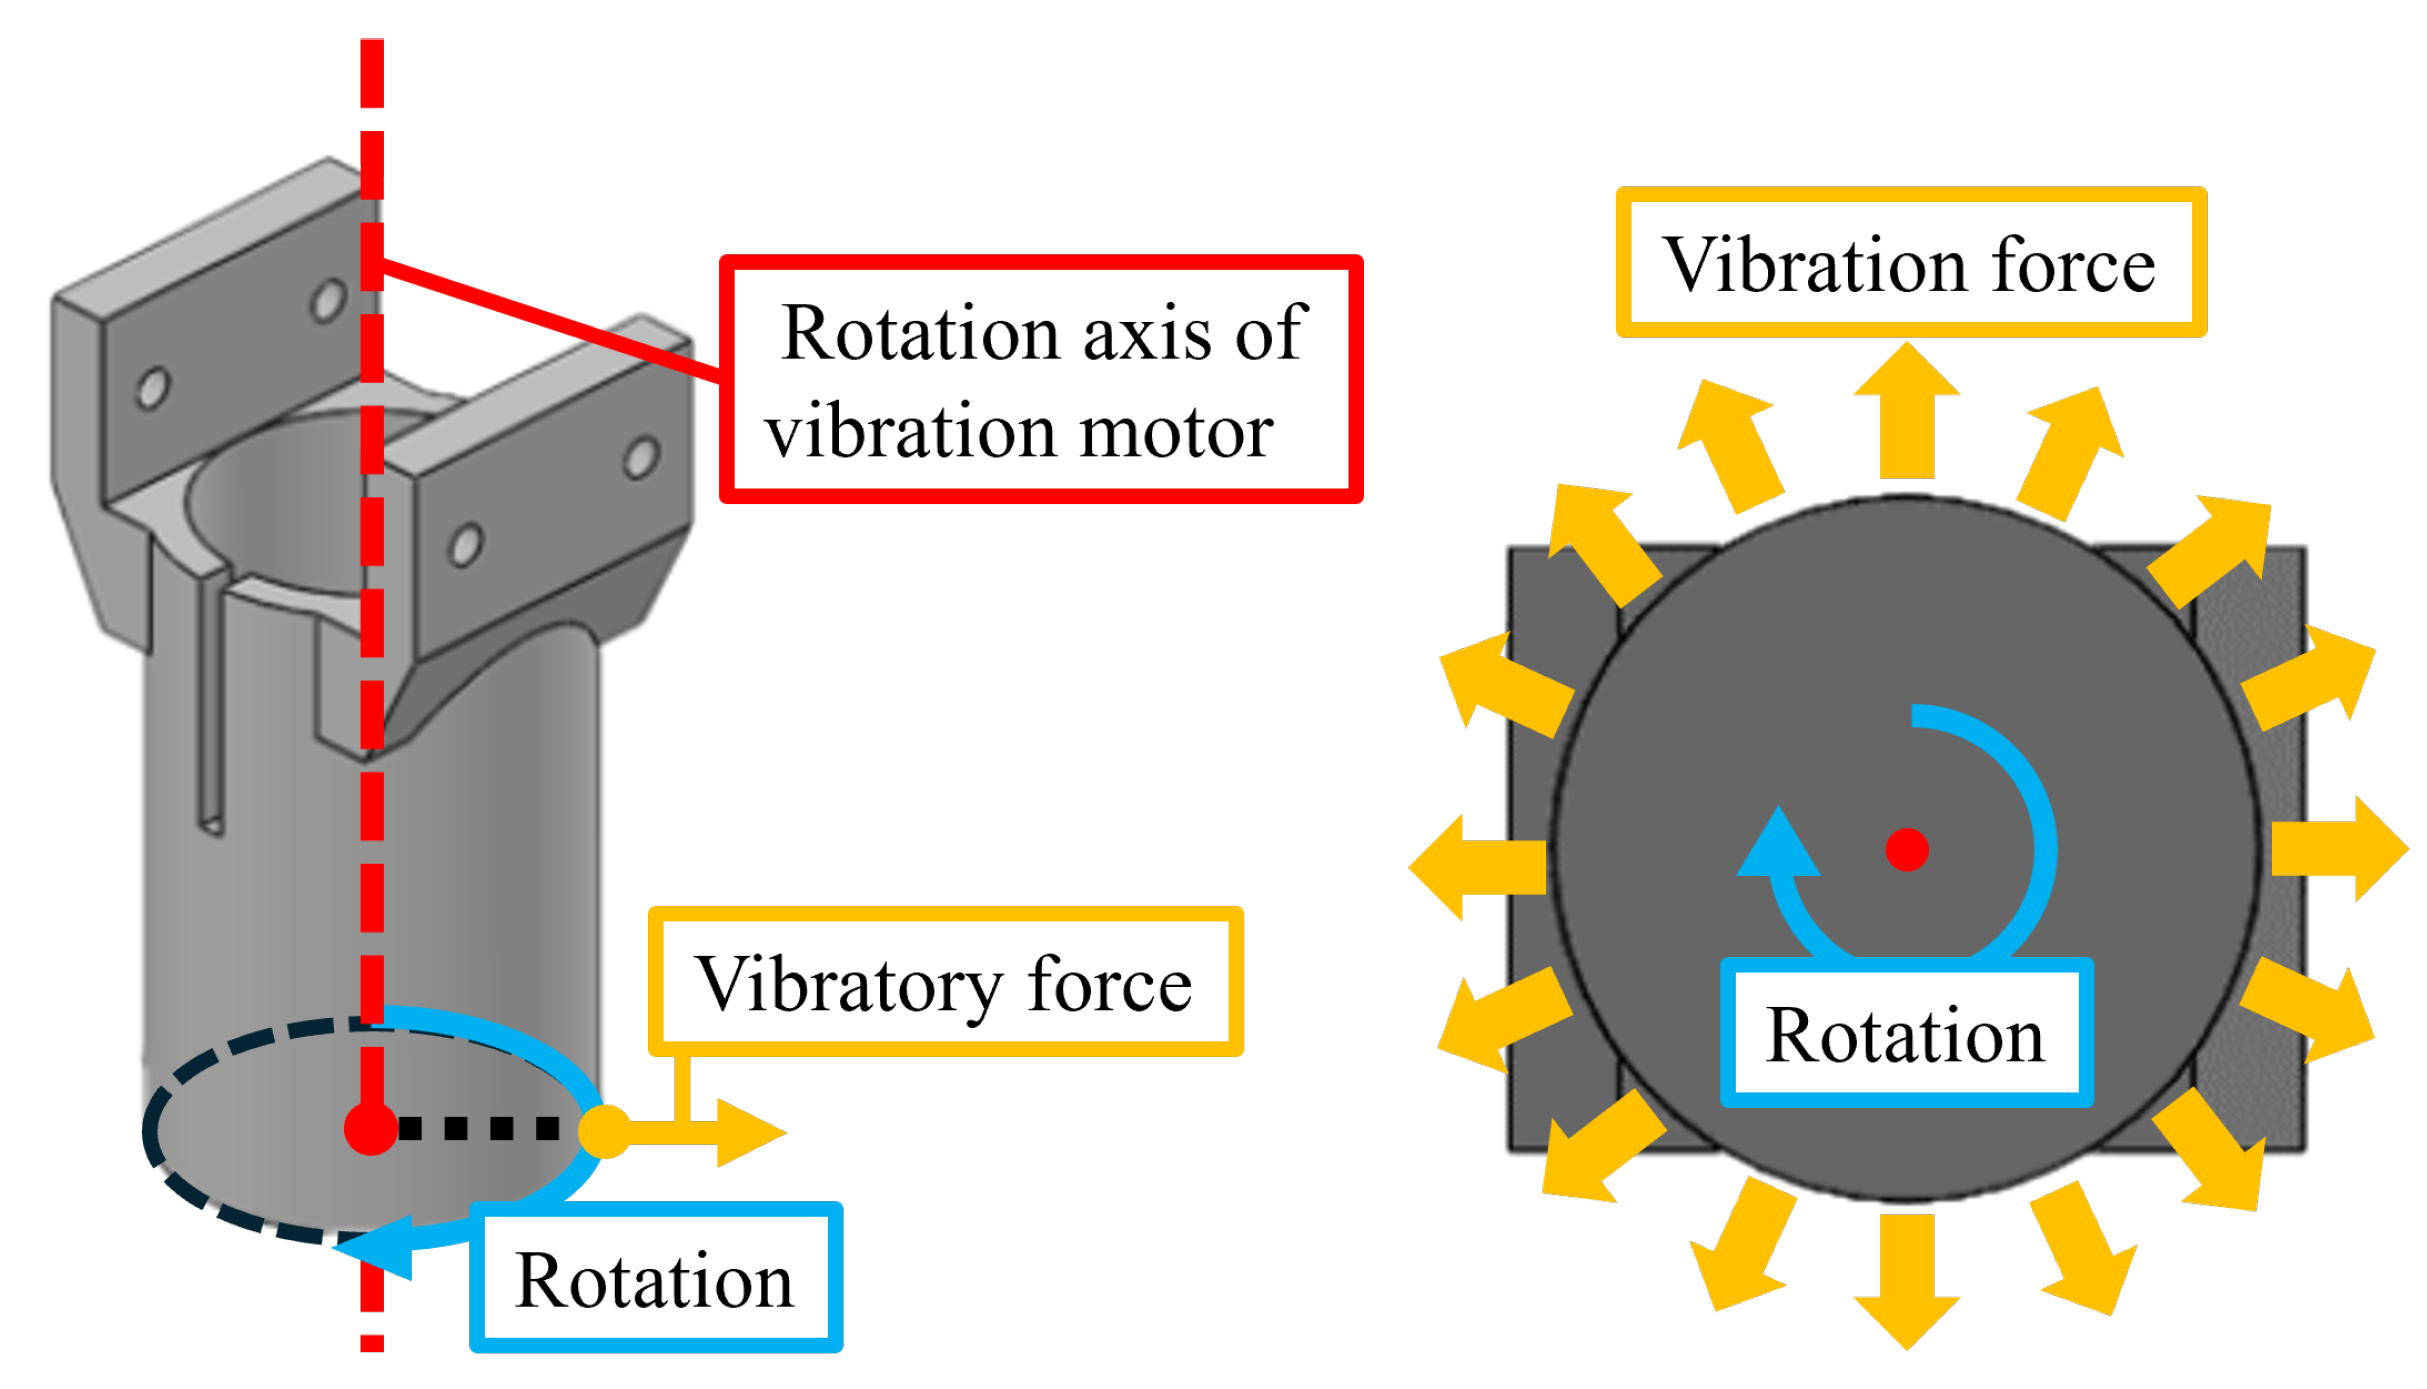
2.1. Introduction to the Related Research
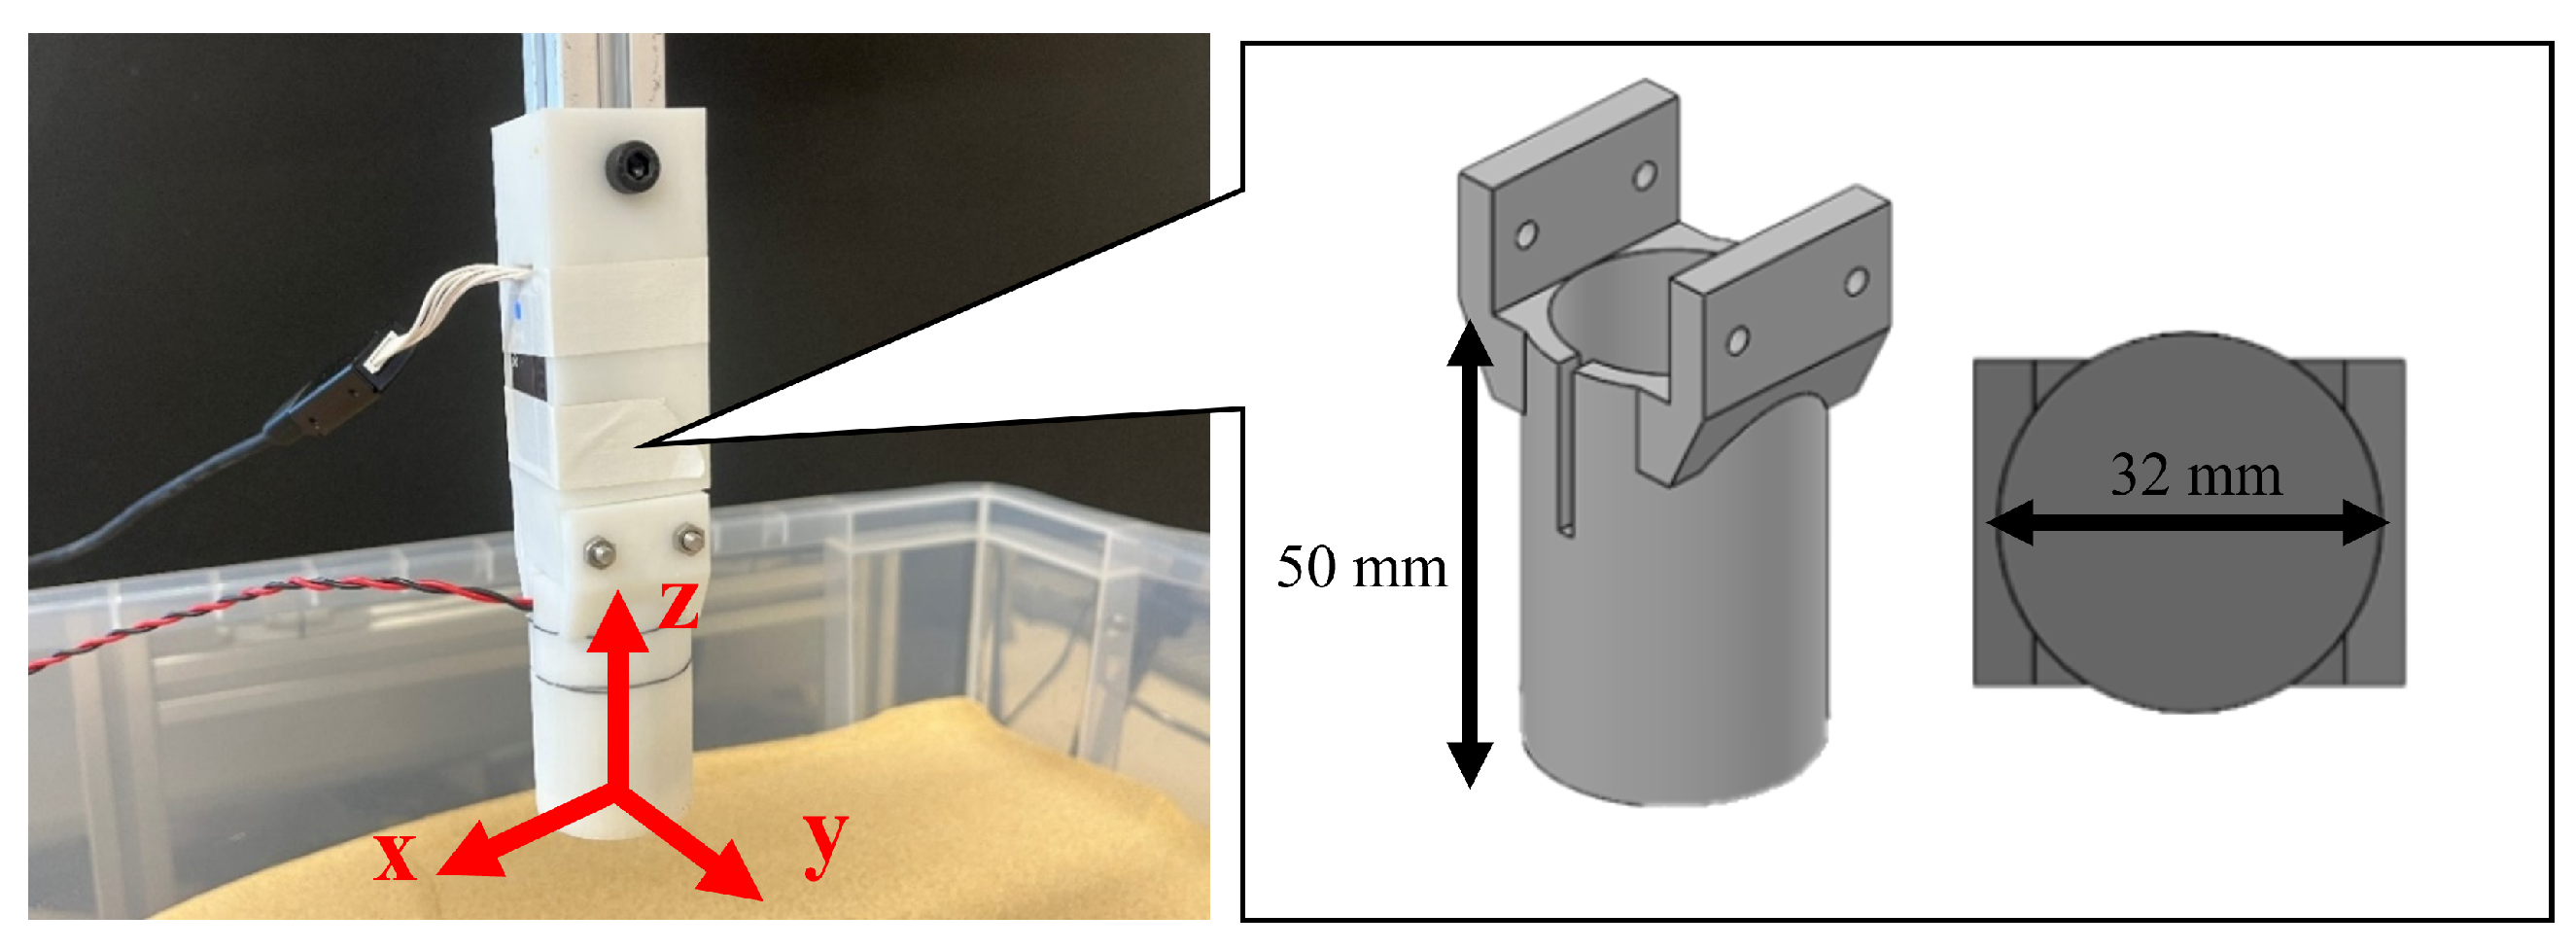
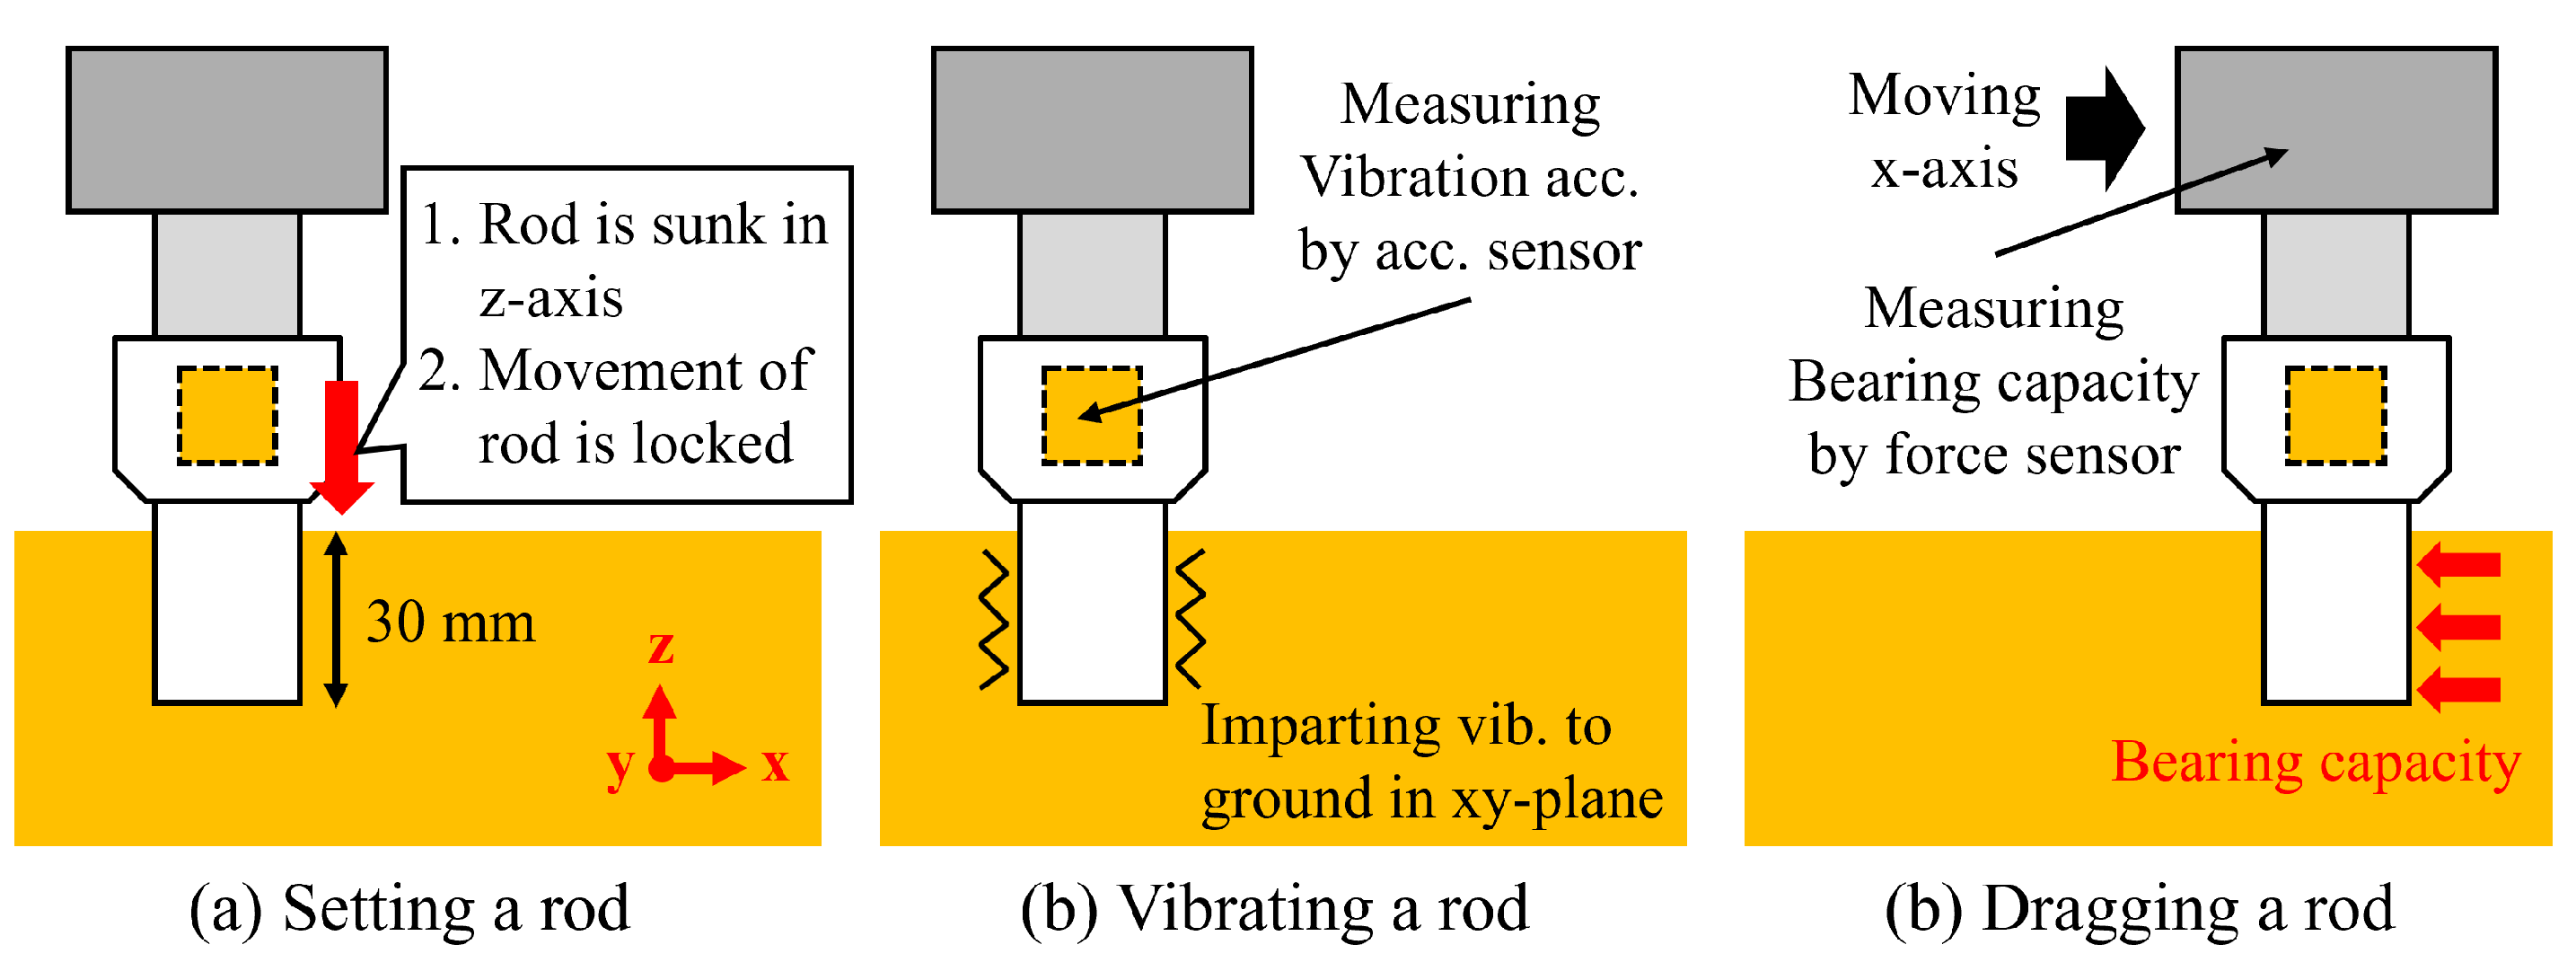
This study investigates using vibration acceleration to determine optimal vibration time, drawing on related research that suggests a relationship between vibration acceleration and geomechanics.
Fujiyama et al. proposed the ground stiffness evaluation method using the vibratory roller acceleration [20]. In general, it has been confirmed that higher vibration acceleration correlates with increased ground stiffness. Figure 5 illustrates the schematic diagram of this relationship. Figure 5a shows the vibration acceleration waveform spectrum obtained by analyzing FFT at low ground stiffness. Figure 5b,c show the corresponding results for moderate and high ground stiffness, respectively. As the ground compacts and becomes hard, spike-like components other than major frequency appear in the vibration acceleration waveform; this occurs because softer ground absorbs vibrations, while harder ground causes the roller to bounce. Thus, their study proposed the evaluation method of ground stiffness using the relationship between vibration acceleration and ground stiffness.
Our previous study investigated the relationship between bearing capacity in the horizontal direction and vibration parameters [21]. Our experimental results confirm that the bearing capacity is related to vibration acceleration, suggesting that we can estimate bearing capacity based on vibration acceleration.
Furthermore, we can determine the optimal vibration time for the walking method by measuring and analyzing the vibration acceleration when imparting vibration to the ground.

2.2. Experiments

Figure 6 illustrates the experimental setup, comprising a soil tank, a rod representing the rover’s leg, a force sensor, and an acceleration sensor. The soil tank has dimensions of 309 (length), 439 (width), and 300 (height) mm. The effect of the soil tank size on the experimental result was investigated. This result is explained in Appendix A. Toyoura sand is used as the ground material. This sand is commonly used in studies regarding robots and machines for space exploration [22,23,24]. The rod, shown in Figure 7, is a cylindrical prism with a circular base 32 mm in diameter, selected based on dimensions in space exploration legged rover studies ([10,15,25]). The vibration unit internally stores a motor (TP-2528C-24, Three Peace Co., Ltd., Daitou-ku, Tokyo, Japan). The vibration motor’s rotation axis is attached to an unbalanced load, and the vibration is generated by rotating an unbalanced load. Vibration force is generated in the tangent direction of the rotation circle, as illustrated in Figure 8. In this experiment, the vibration motor was supplied with 30 V, and a vibration force of 11.9 N and a frequency of 233 Hz were generated, respectively. The experiment was conducted using different kinds of vibrations. This result is explained in Appendix A. In addition, an acceleration sensor (AccStick, Shinyei Technology Co., Ltd., Koube city, Hyougo, Japan) is attached to the rod. In the coordinate system of the experimental setup, the x- and y-axes are set parallel to the ground surface, whereas the z-axis is set vertically (Figure 7). The experimental process, illustrated in Figure 9, begins by mixing and leveling the ground before setting the rod to a predetermined 30 mm sinkage. The z-axis movement of the rod is locked after the rod was sunk to the ground. The ground shear strength is measured using a hand vane before the experiments to confirm the ground conditions. Shear strength can be used to evaluate the bulk density and ground compaction. The ground condition is set to achieve the targeted shear strength ranging from 0.30 to 0.60 cN·m. The ground is mixed again if the measured shear strength exceeds this range. Vibrations to the ground are produced by supplying a voltage to the vibration motor. Vibrations are generated in the tangent direction of the surface of the cylindrical rod. Therefore, the rod imparts vibrations to the ground in the xy-plane direction. The vibration acceleration is measured while the ground vibrates. The vibration acceleration is measured along the x-axis direction. The vibration time is set from 0 to 200 s. The sampling frequency is 1600 Hz. Upon ceasing the vibrations, the rod is dragged at a consistent speed of 0.13 mm/s for 100 s in the same direction as the vibration acceleration measurement, and the force sensor records the bearing capacity. Five trials were conducted under each experimental condition to ensure reliability and accuracy. Table 1 lists the specific experimental conditions.

3. Results and Discussion

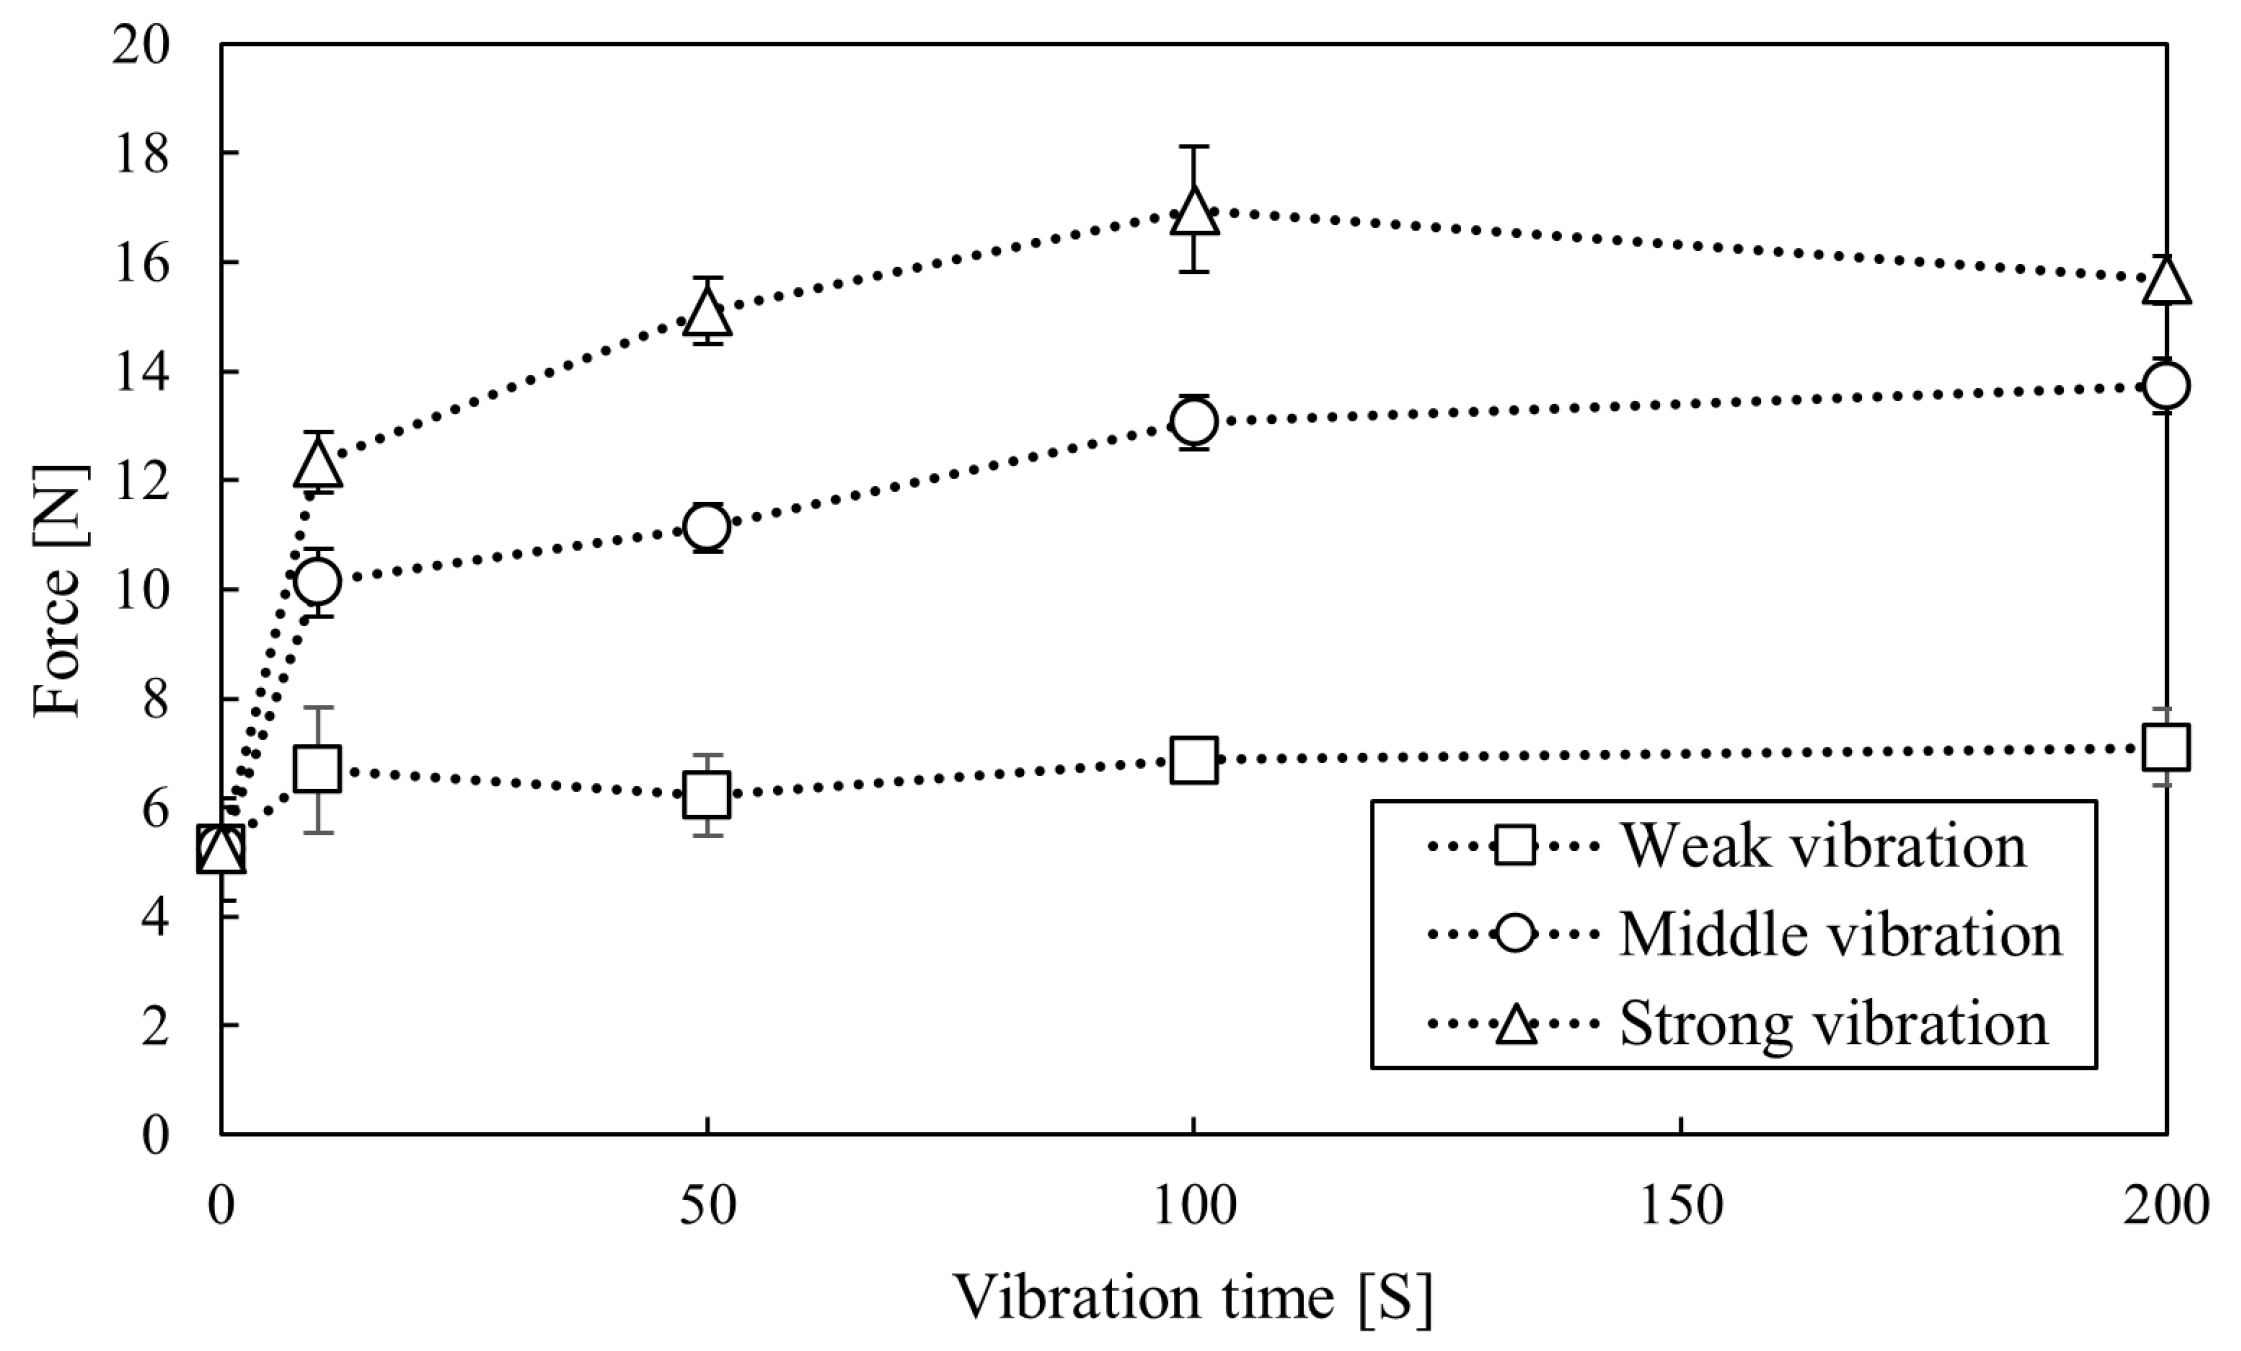
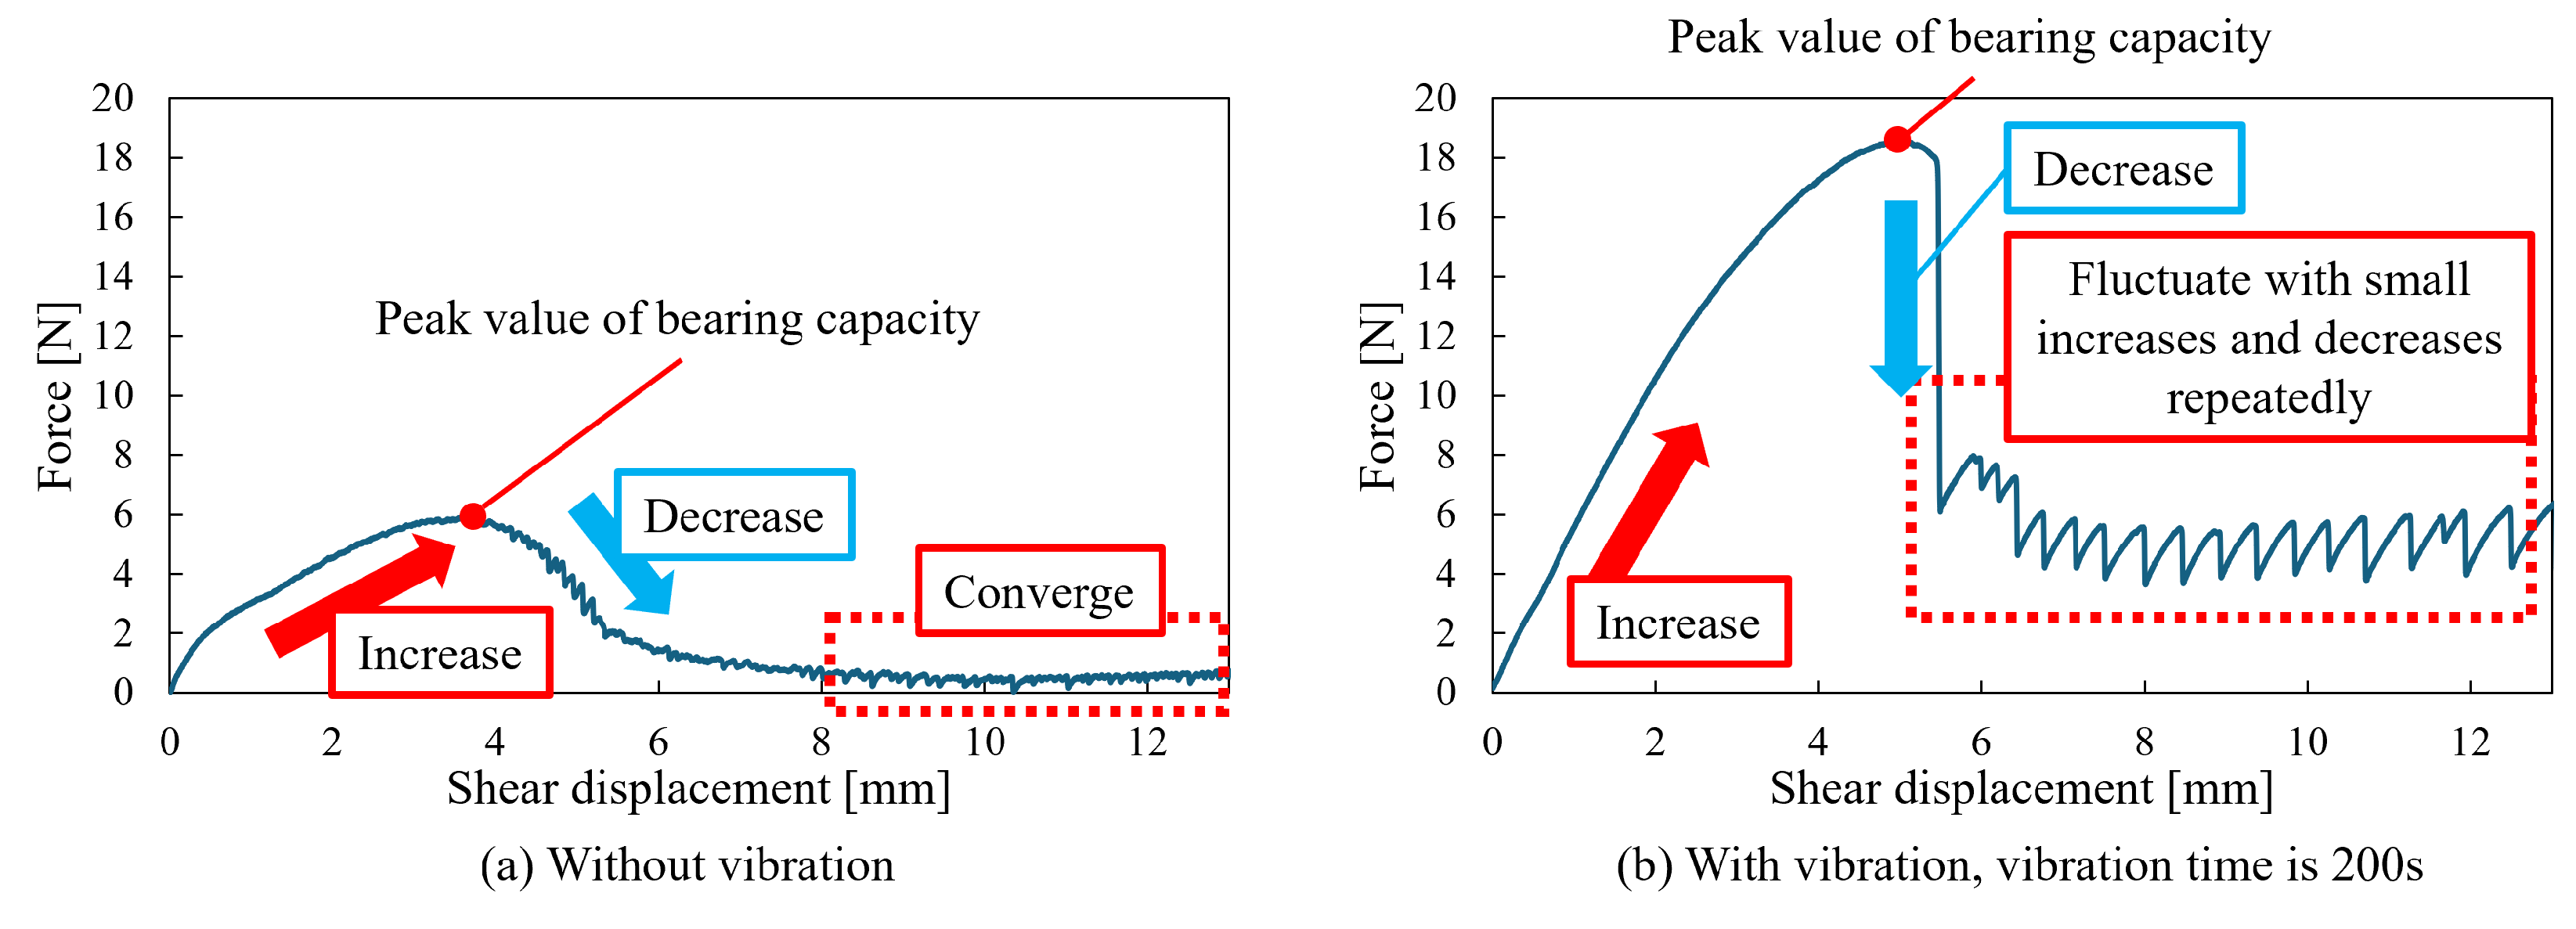
3.1. Relationship Between Vibration Time and Bearing Capacity

Figure 10 shows the variation in bearing capacity relative to shear displacement. Figure 10a,b depict the bearing capacity with and without vibration (Vibration time is 200 s). In Figure 10, the bearing capacity initially increases because the ground compacts and then decreases as the ground collapses. Finally, the value of bearing capacity without vibration converged (Figure 10a). The value of bearing capacity with vibration fluctuates with small increases and decreases repeatedly (Figure 10b). This phenomenon is also caused by compacting and collapsing the ground. Comparing these results demonstrates that the peak value of the bearing capacity with vibration is higher than that without vibration because vibrations compact the ground.
Figure 11 shows the peak bearing capacity for each vibration time averaged from five trials, along with the standard errors. The peak value of the bearing capacity with vibration is higher than that without vibration. When the vibration time is less than 85 s, the peak value increases with vibration time. When the vibration time exceeds 85 s, the peak value does not increase further; this suggests an optimal vibration time that effectively enhances bearing capacity, which can be controlled by changing the vibration time.

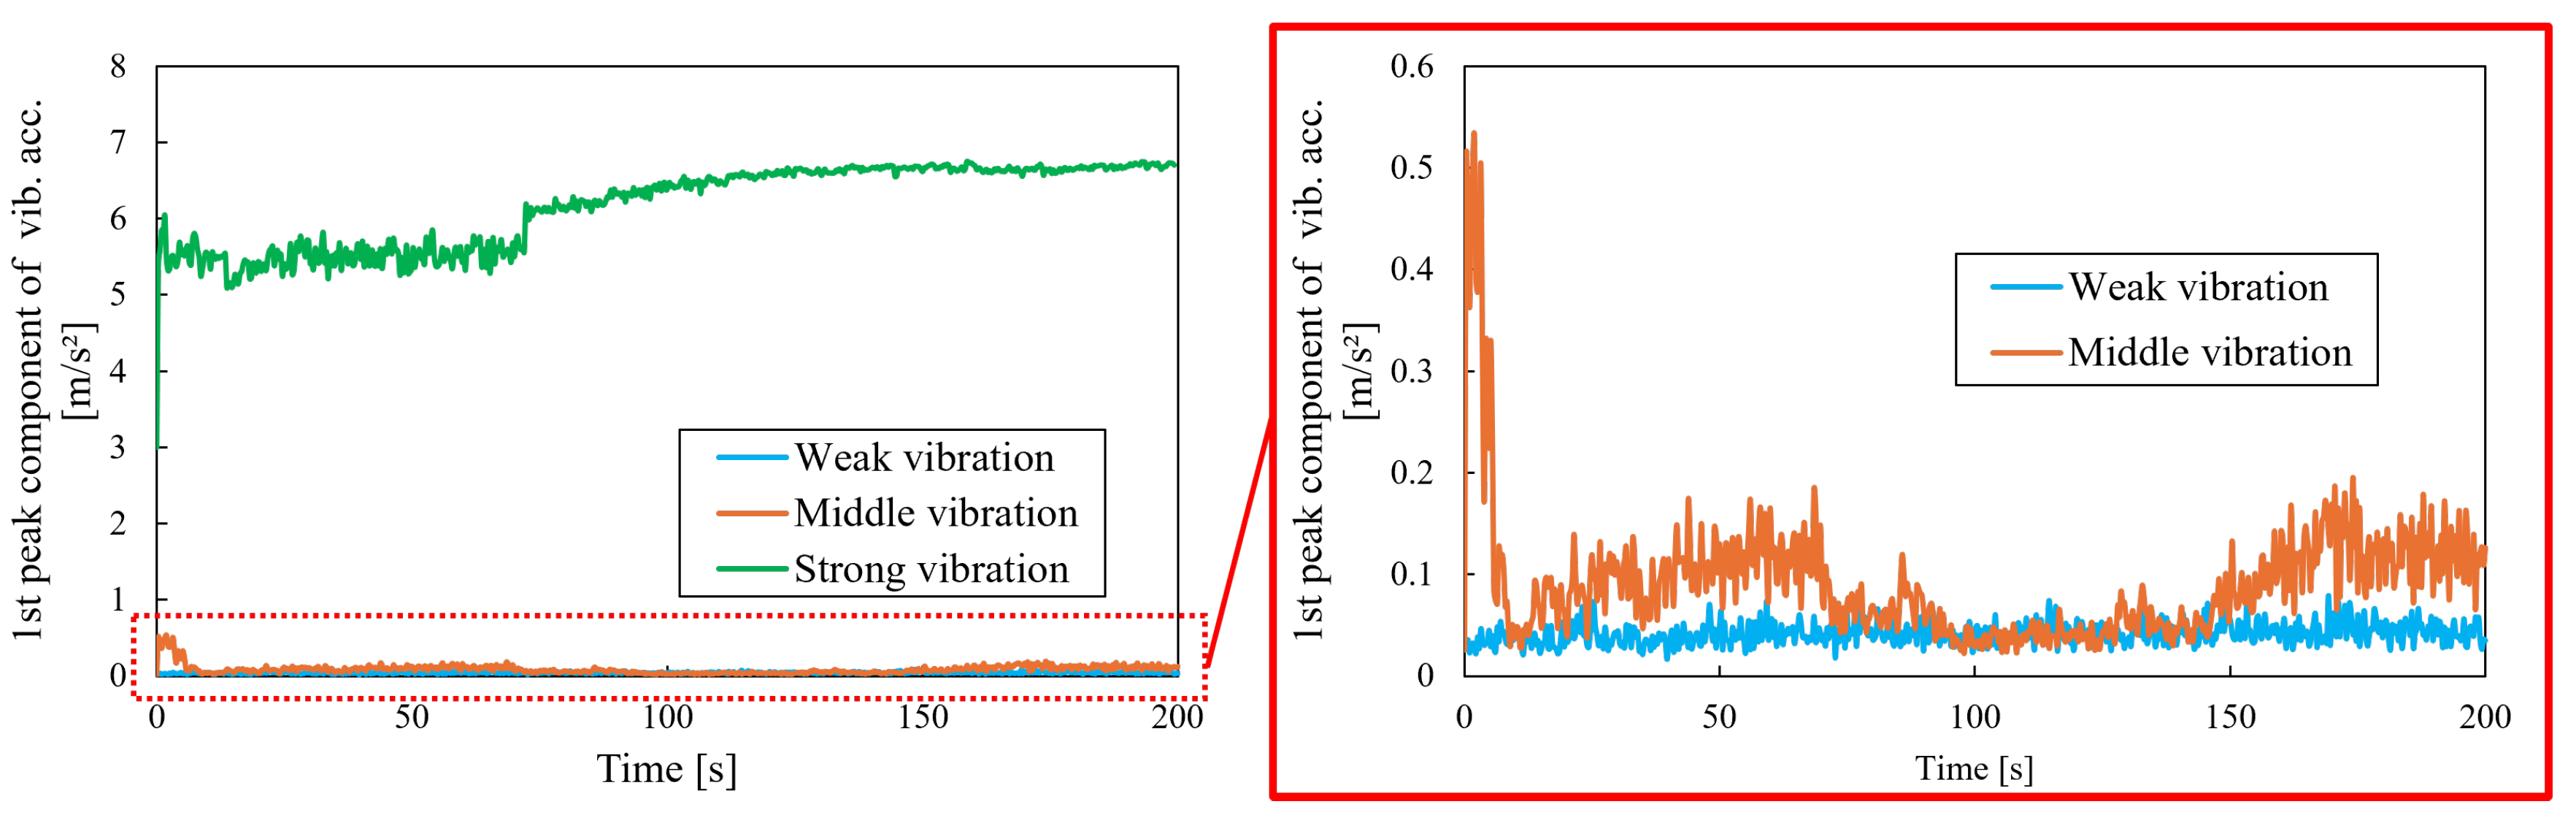
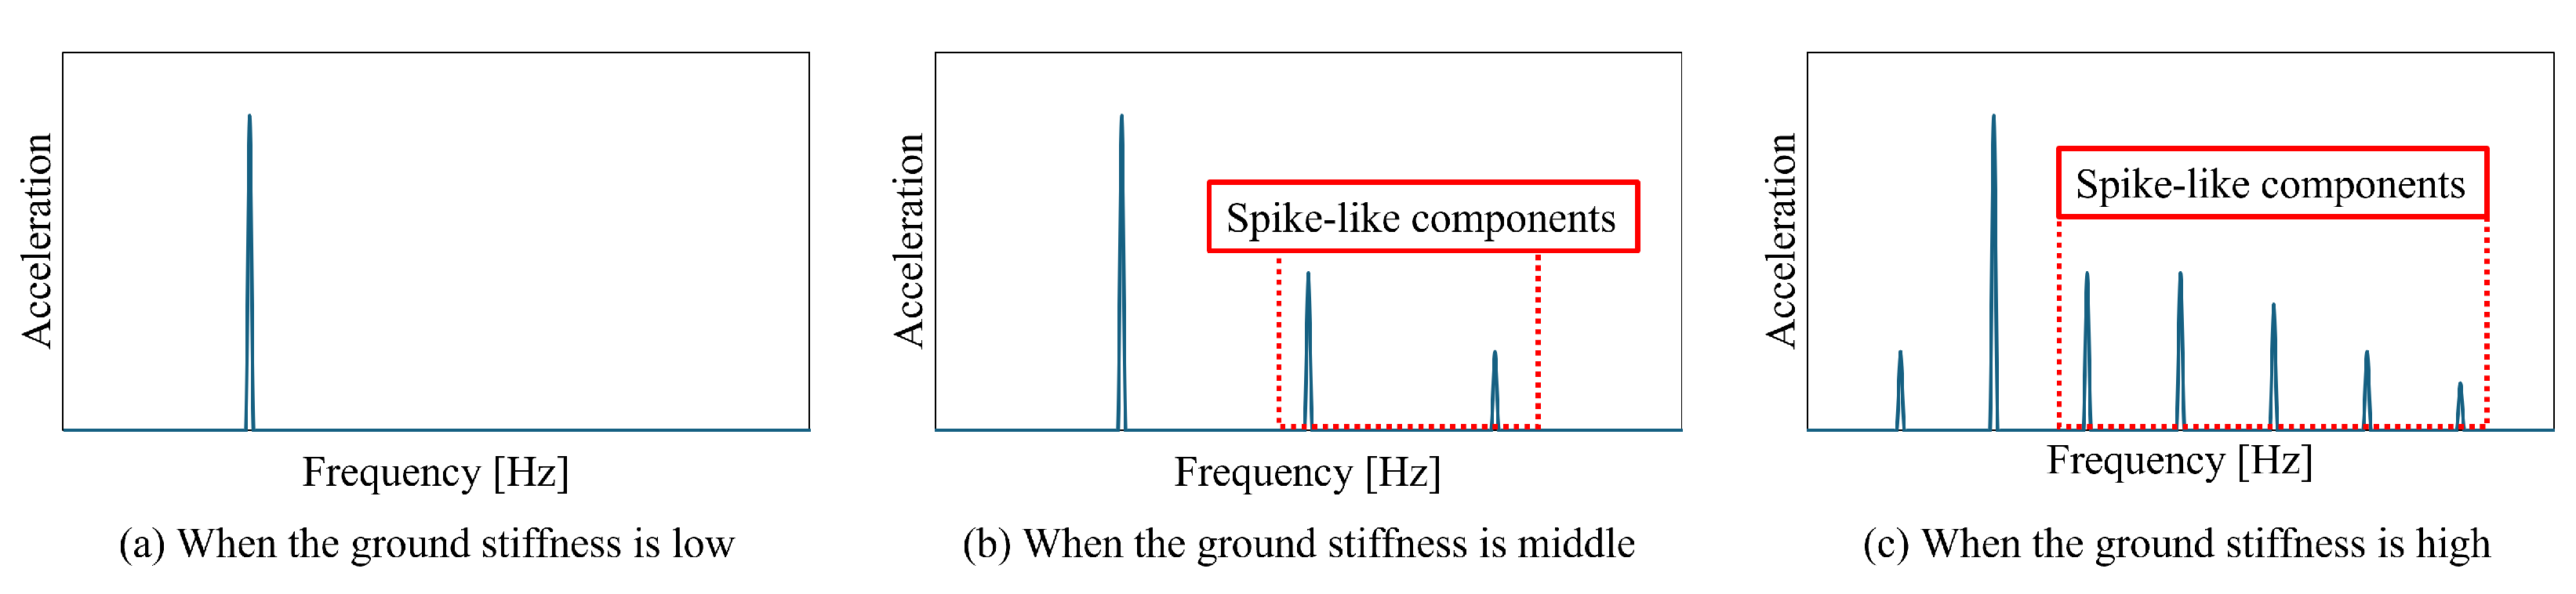
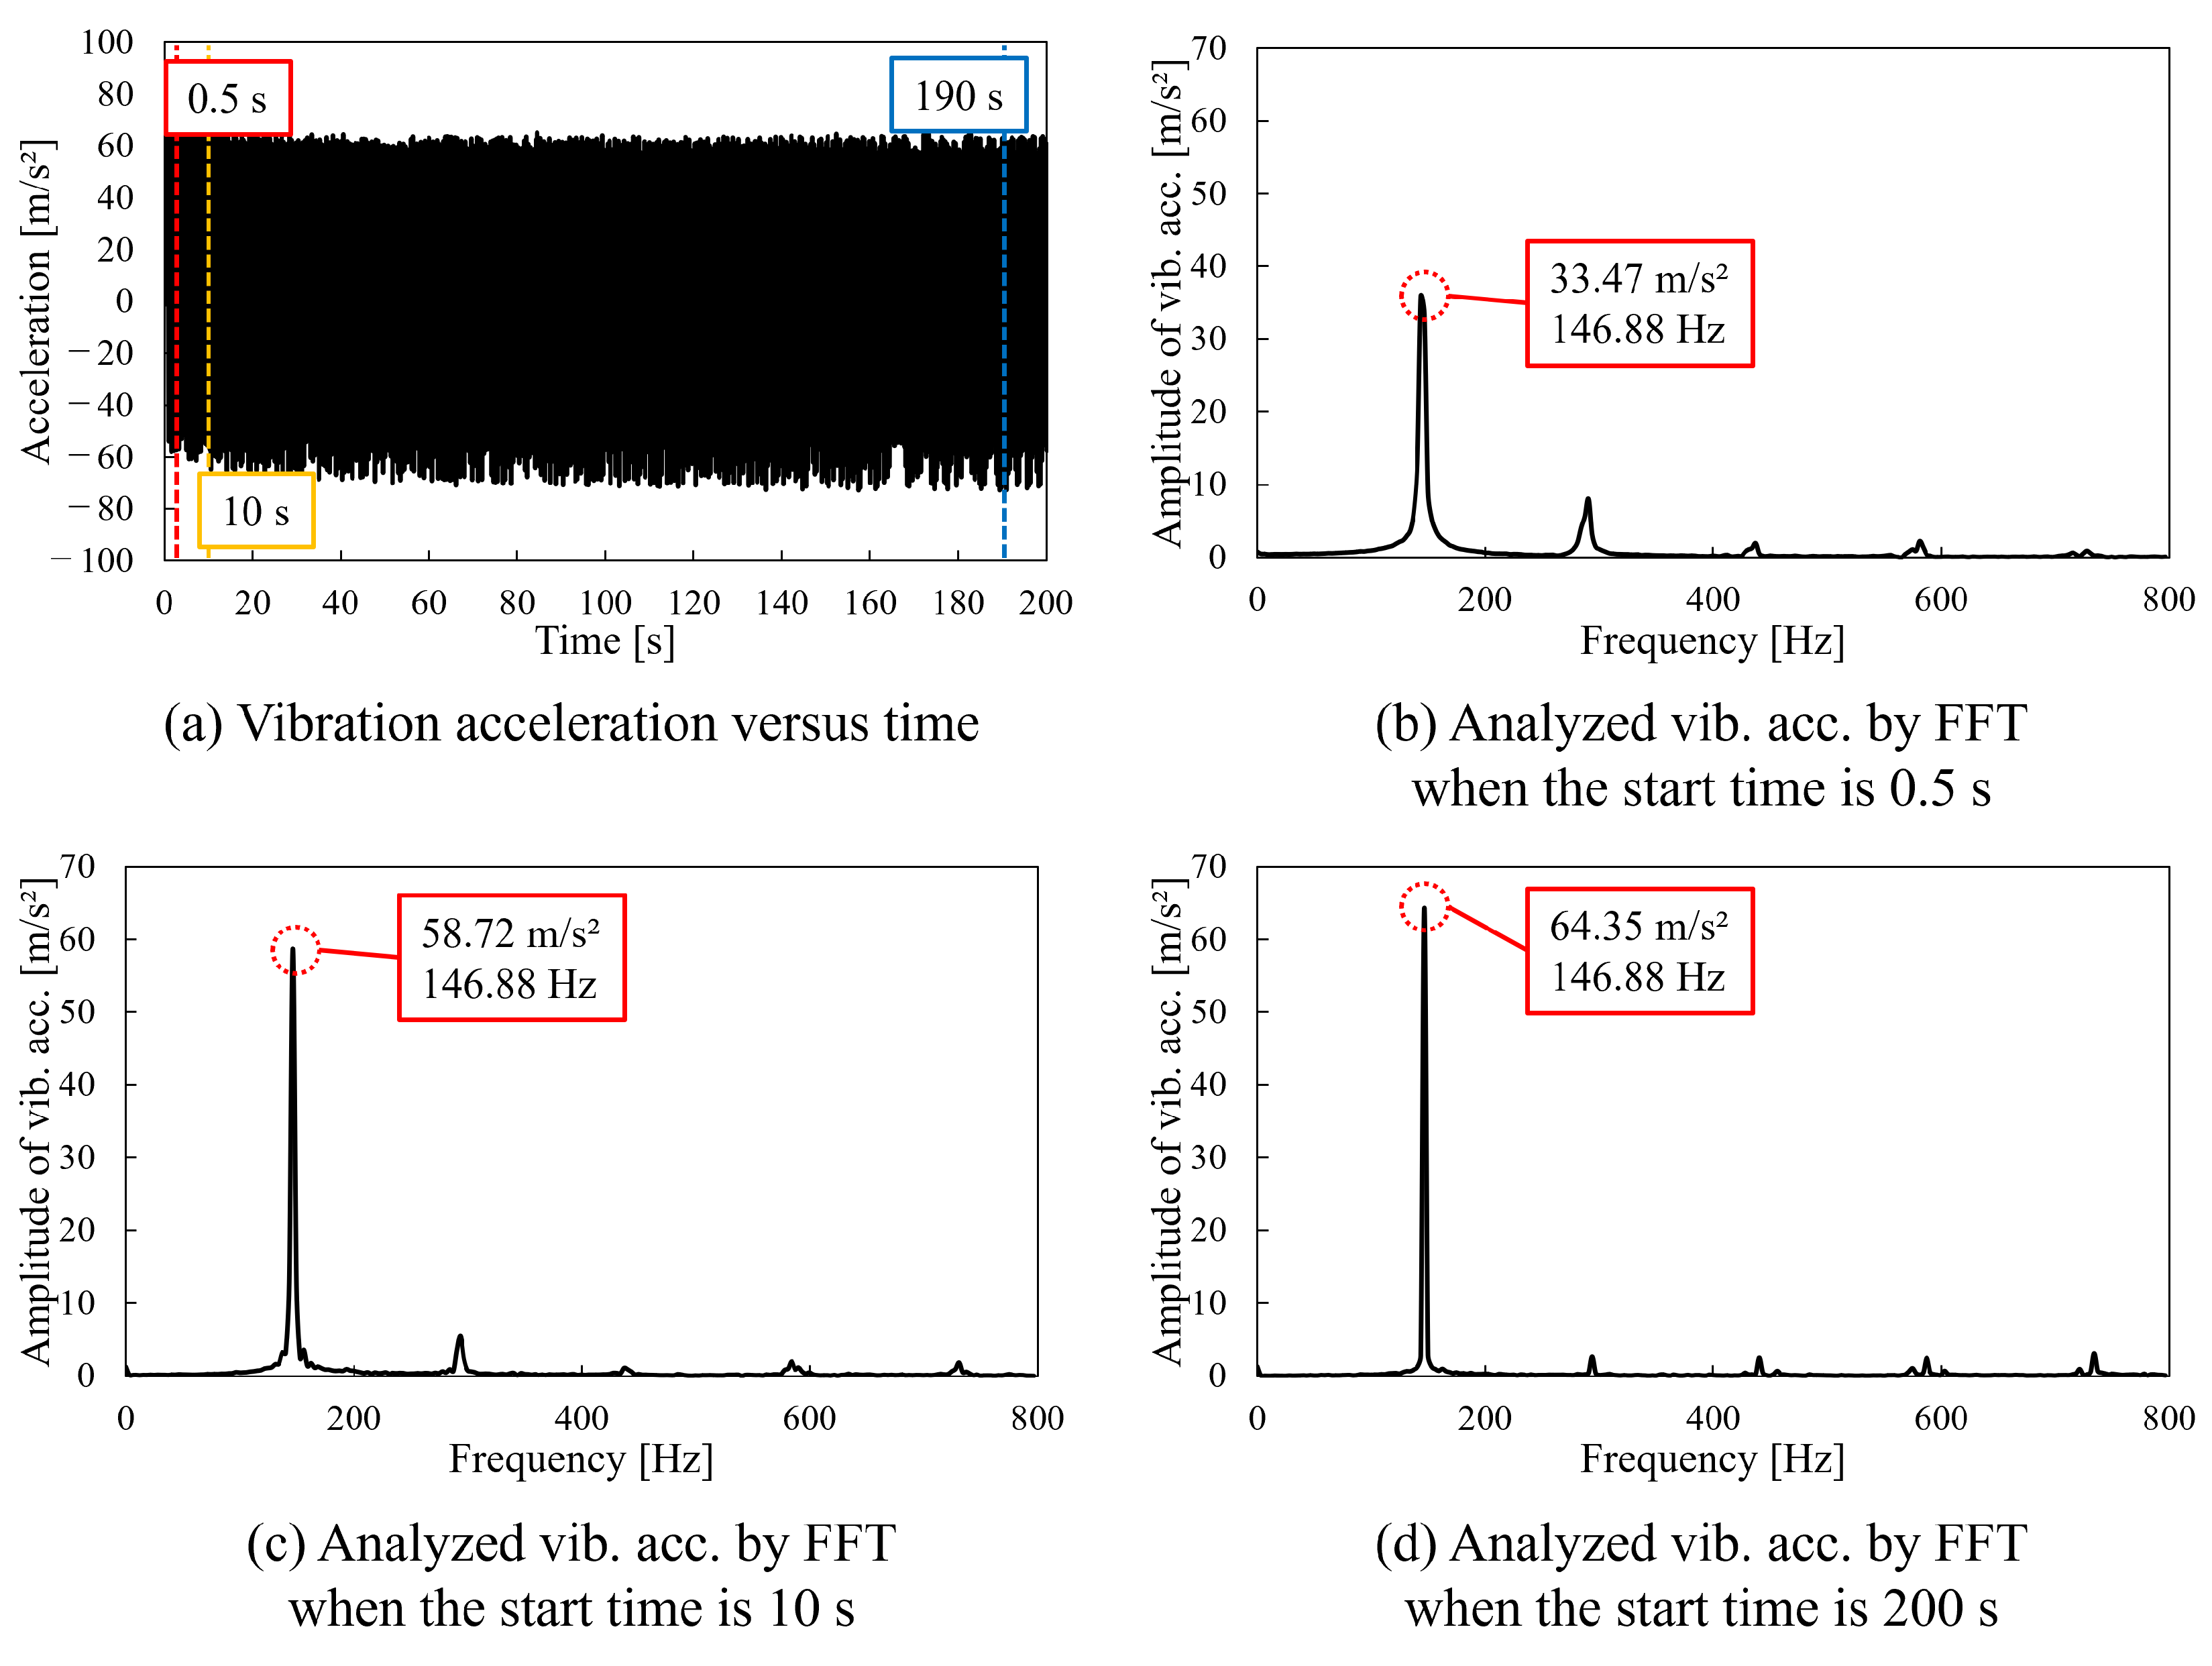
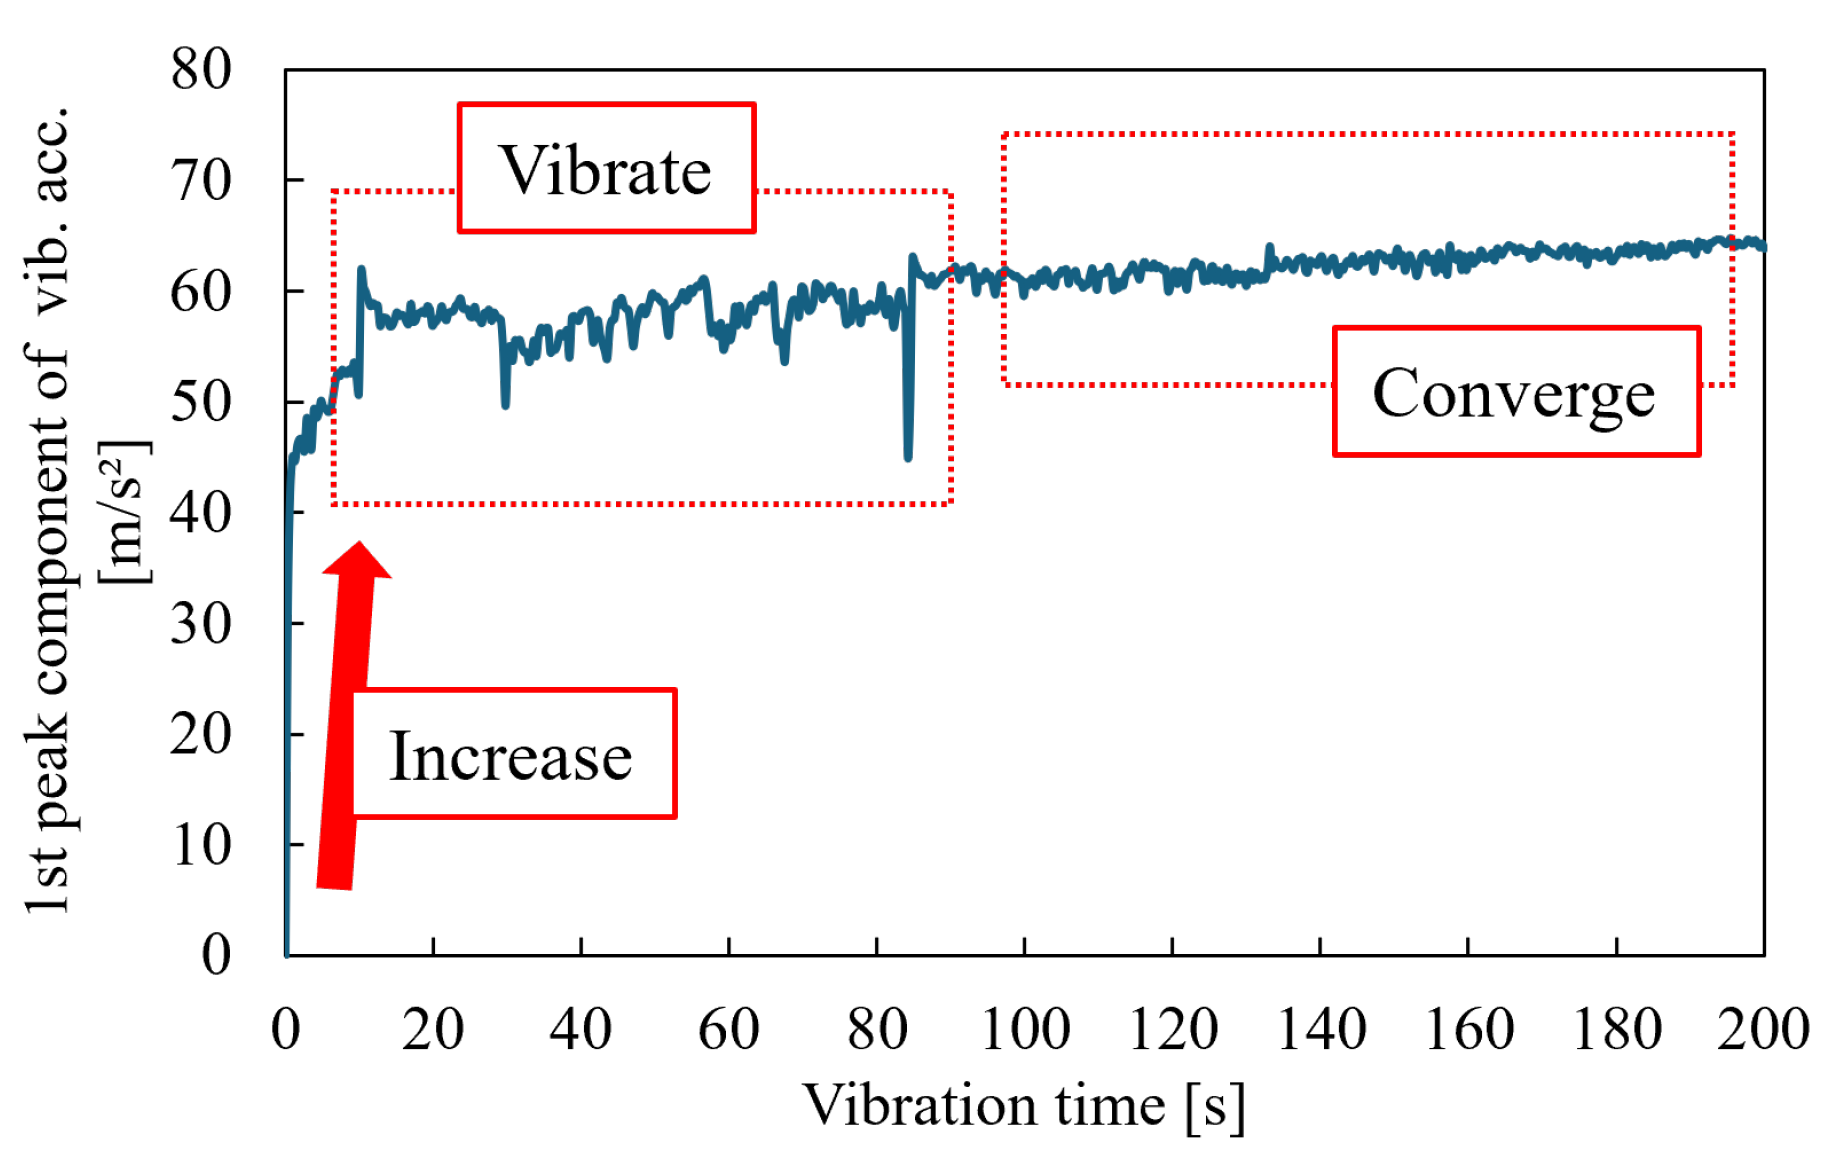
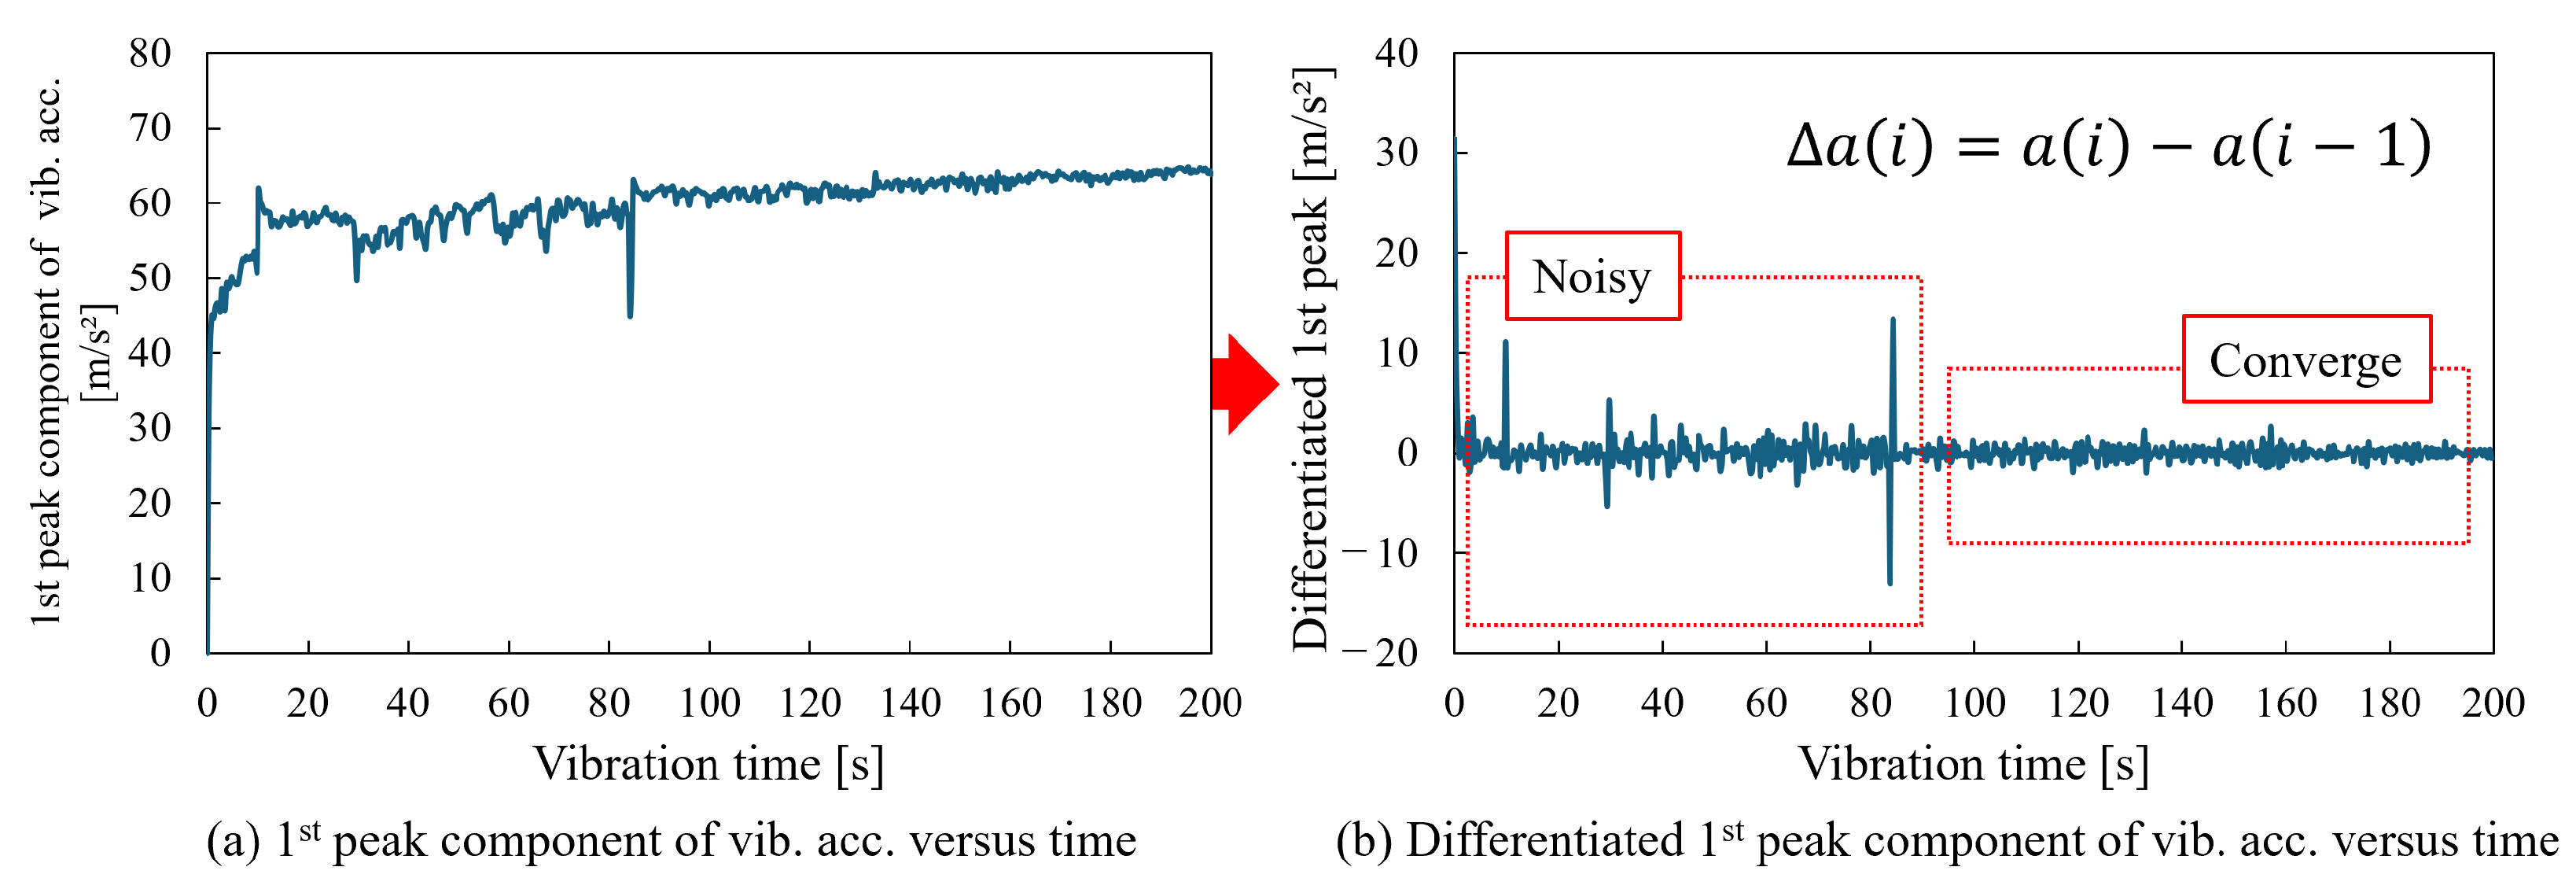
3.2. Relationship Between Vibration Time and Vibration Acceleration

Figure 12a shows the measured vibration acceleration with a vibration duration of 200 s. Figure 12b–d illustrate the vibration acceleration waveform spectrum obtained through FFT analysis of the measured data. The analyses were conducted at 0.5, 10, and 190 s, respectively, with data covering 512 samples from each start time being analyzed. In each analyzed result, the main spectra component exists. This component is at 146.88 Hz in all analyzed results and increases with increasing vibration time.
We focused on and investigated the main spectra component of vibration acceleration as the parameter related to the bearing capacity. Figure 13 depicts the variation in the main spectra component relative to time. The main spectra component was obtained for every 512 samples from the vibrations start and plotted every 0.32 s in Figure 13. The value of the main spectra component initially increases and vibrates when the vibration time is less than 85 s. Moreover, it converges when the vibration time exceeds 85 s, similar to the relationship between the bearing capacity peak and vibration time in Figure 11. Therefore, we consider the bearing capacity and vibration acceleration to be related.

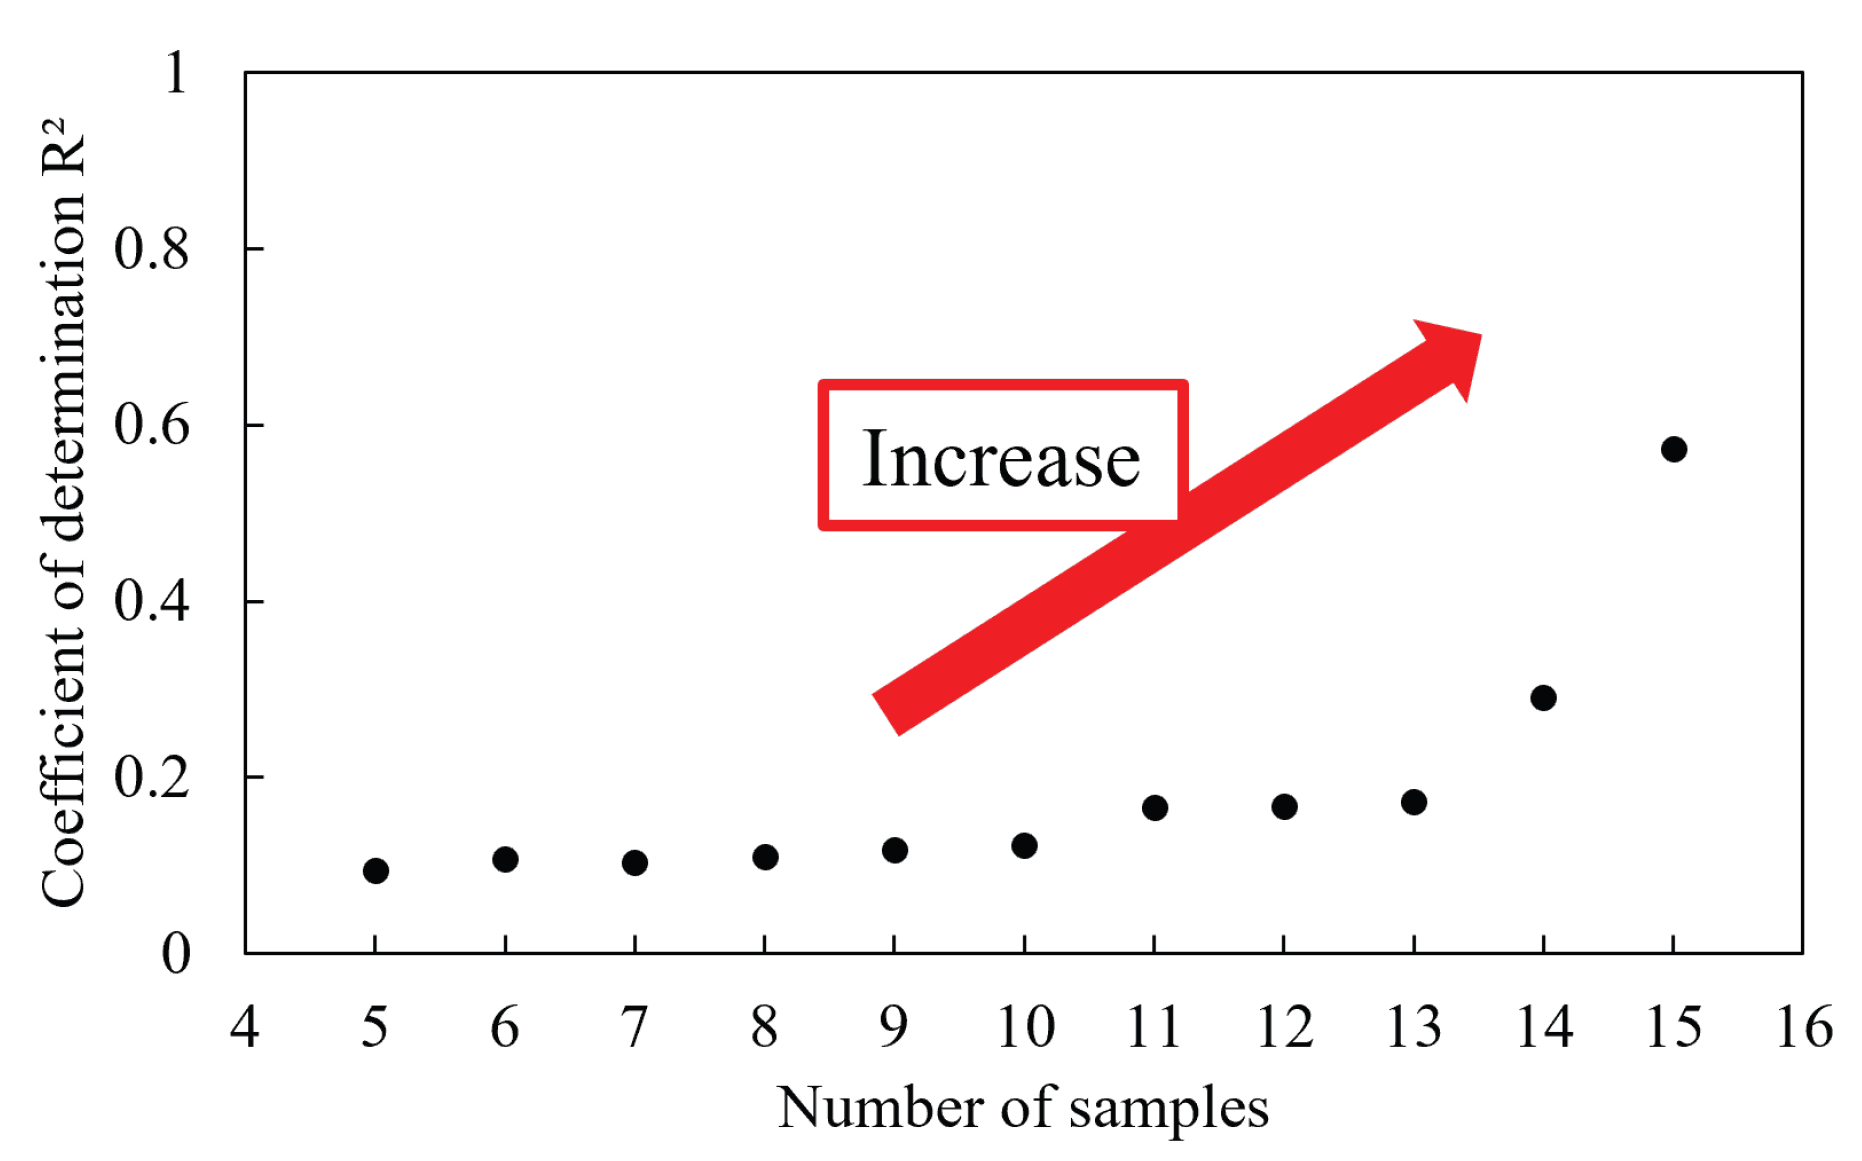
3.3. Suggestions for Correlated Indicators

The relationship between the bearing capacity peak value and the value of the main spectra component obtained via FFT analysis from 512 samples before vibrations stop is plotted in Figure 14. The bearing capacity peak and the main spectra component were combined in the same trial. The correlation between the two could not be confirmed from Figure 14. Therefore, the other correlated indicator using the main spectra component should be proposed.
The results in Section 3.2 demonstrate that the value of the main spectra component vibrates when vibration time is not enough to compact the ground, and it converges when vibration time is enough (Figure 13). The main spectra component was differentiated by Equation (11) to detect its vibration, as illustrated in Figure 15b.
Δ a ( i ) = a ( i ) a ( i 1 )
Here, a ( i ) and i are the main spectra component and the data number, respectively. The differentiated main spectra component was drastically changed when vibrations started; finally, it converged. Next, the standard deviation of the difference between the main spectra component S was calculated from Equation (12) to emphasize the vibration of the differentiated main spectra component.
S = 1 n i = N n N | Δ a ( i ) Δ a ¯ | 2
Here, n and N are the number of samples and the number of the last sample, respectively. Δ a ¯ is average of samples from number N n to N.
Figure 16a,c,e demonstrate the standard deviation of the difference between the main spectra component S for each vibration time averaged from five trials, along with the standard errors, the exponential approximation, and the coefficient of determination. These figures are double-logarithmic graphs. In Figure 16a,c,e, S was calculated when n was 5, 14, and 15. S was high when the vibration time was short. It decreased with increasing the vibration time. The correlation between the two quantities became high by increasing the number of samples n. When n was 15, the correlation between the two quantities could be confirmed because the coefficient of determination is 0.9171 and high.
The correlation between the bearing capacity peak value and the standard deviation of the difference between the main spectra component S are plotted in Figure 16b,d,f. Furthermore, these figures show the standard errors, the exponential approximation, and the coefficient of determination. The coefficient of determination was changed by the number of samples n. Figure 17 shows the coefficient of determination in each n. The maximum n was set 15 because the shortest vibration time in this study experiment is 5 s, and the maximum number of samples calculated from a vibration time of 5 s is 15. In Figure 17, the larger the number of samples used, the higher the coefficient of determination. Therefore, increasing the number of samples can increase the correlation of the proposed indicator with the bearing capacity. However, if the number of samples becomes large, the vibration time to calculate S must be large. Therefore, the measurement time of vibration acceleration required to calculate the proposed indicator and its correlation with the bearing capacity are trade-offs. This result suggests that n should be determined appropriately, considering the balance of these elements. When n was 15, the coefficient of determination was 0.5733, and the correlation between the two quantities was the highest (Figure 16f). In Figure 16f, we can identify the group of data in the data plots. In this group, S was low, and the high bearing capacity peak included almost. Therefore, sufficient vibration time to increase bearing capacity can be judged using this tendency.
Figure 18 shows the plots between the bearing capacity peak value and the standard deviation of the difference between the main spectra component S whose value is from 0 to 2. This figure shows the range of ± 10 % average value when vibration time from 85 to 200 s is shown. When S was smaller than the specific border, the measured bearing capacities are included in the range. This result suggests that the optimal vibration time can be judged, and the bearing capacity with vibration can be estimated by setting the threshold at about S and becoming under the threshold.

4. Conclusions

This study investigates enhancing bearing capacity by imparting vibration, focusing on determining the optimal vibration time for legged rovers in space exploration. First, the relationship between the bearing capacity and vibration time was confirmed. When the vibration time remained below a specific time, increasing the duration increased the peak bearing capacity. However, the bearing capacity converged beyond this specific vibration time; this suggests that the optimal vibration time efficiently increases the bearing capacity. Second, the relationship between the main spectra component of the vibration acceleration and vibration time was confirmed to be similar to that between bearing capacity and vibration time, suggesting a correlation between bearing capacity and vibration acceleration. Finally, we proposed using the main spectra component of the vibration acceleration as an indicator related to the bearing capacity. The proposed indicator is the standard deviation of the difference between the main spectra component. We confirmed that the larger the standard deviation of the difference between the main spectra component, the more bearing capacity with vibration increased; this result suggests that enough vibration time to increase bearing capacity can be judged by this indicator.
In the future studies, the relationship between the proposed correlated indicator and the bearing capacity will be investigated by changing the compacted condition of the ground and the kinds of sands because these conditions are considered to affect vibration acceleration. Furthermore, we will confirm whether sufficient vibration time can be experimentally judged. A system that judges the bearing capacity will be constructed and introduced into the walking method using vibrations to improve the mobility of exploration rovers. The testbed will walk while judging the optimal vibration time on the loose ground with slope, and energy consumption improvement will be discussed.
A weak point of the proposed method is that the number of measured vibration acceleration data points must be large to obtain a high correlation between the proposed correlated indicator and the bearing capacity. The interval time to judge that the ground is compacted enough becomes long when increasing the number of measured vibration accelerations. To solve this issue, we will also approach the method to judge the ground condition of compaction using a classification function based on deep learning from the wave shape of the vibration acceleration.

Author Contributions

T.W. wrote the manuscript as the corresponding author. T.W. and Y.F. developed the experimental setup and performed the experiments. K.H. and K.I. supervised this study. All authors read and agreed to the published version of the manuscript.

Funding

This research was funded by the Uchida Energy Science Promotion Foundation: Grant Number R06-1029.

Informed Consent Statement

Not applicable.

Data Availability Statement

The raw data supporting the conclusions of this study will be made available by the authors on request.

Acknowledgments

This work was supported by the Uchida Energy Science Promotion Foundation. Figure 1, Figure 2 and Figure 3, have been reprinted from “Watanabe, T.; Higashiyama, R.; Watanabe, D.; Iizuka, K. Analyzing bearing capacity changes due to vibration in discrete element method simulations. J. Terramech. 2025, 118, 101031”, with permission from Elsevier.

Conflicts of Interest

The authors declare no conflicts of interest.

Appendix A. Investigation of the Effect of Experimental Condition on the Measurement Data

The measured bearing capacity and vibration acceleration are considered to be affected by the experimental environment. Therefore, these values were measured by changing the size of the sand box and the kinds of vibrations. The measurement method was the same as the one explained in Section 2.2.

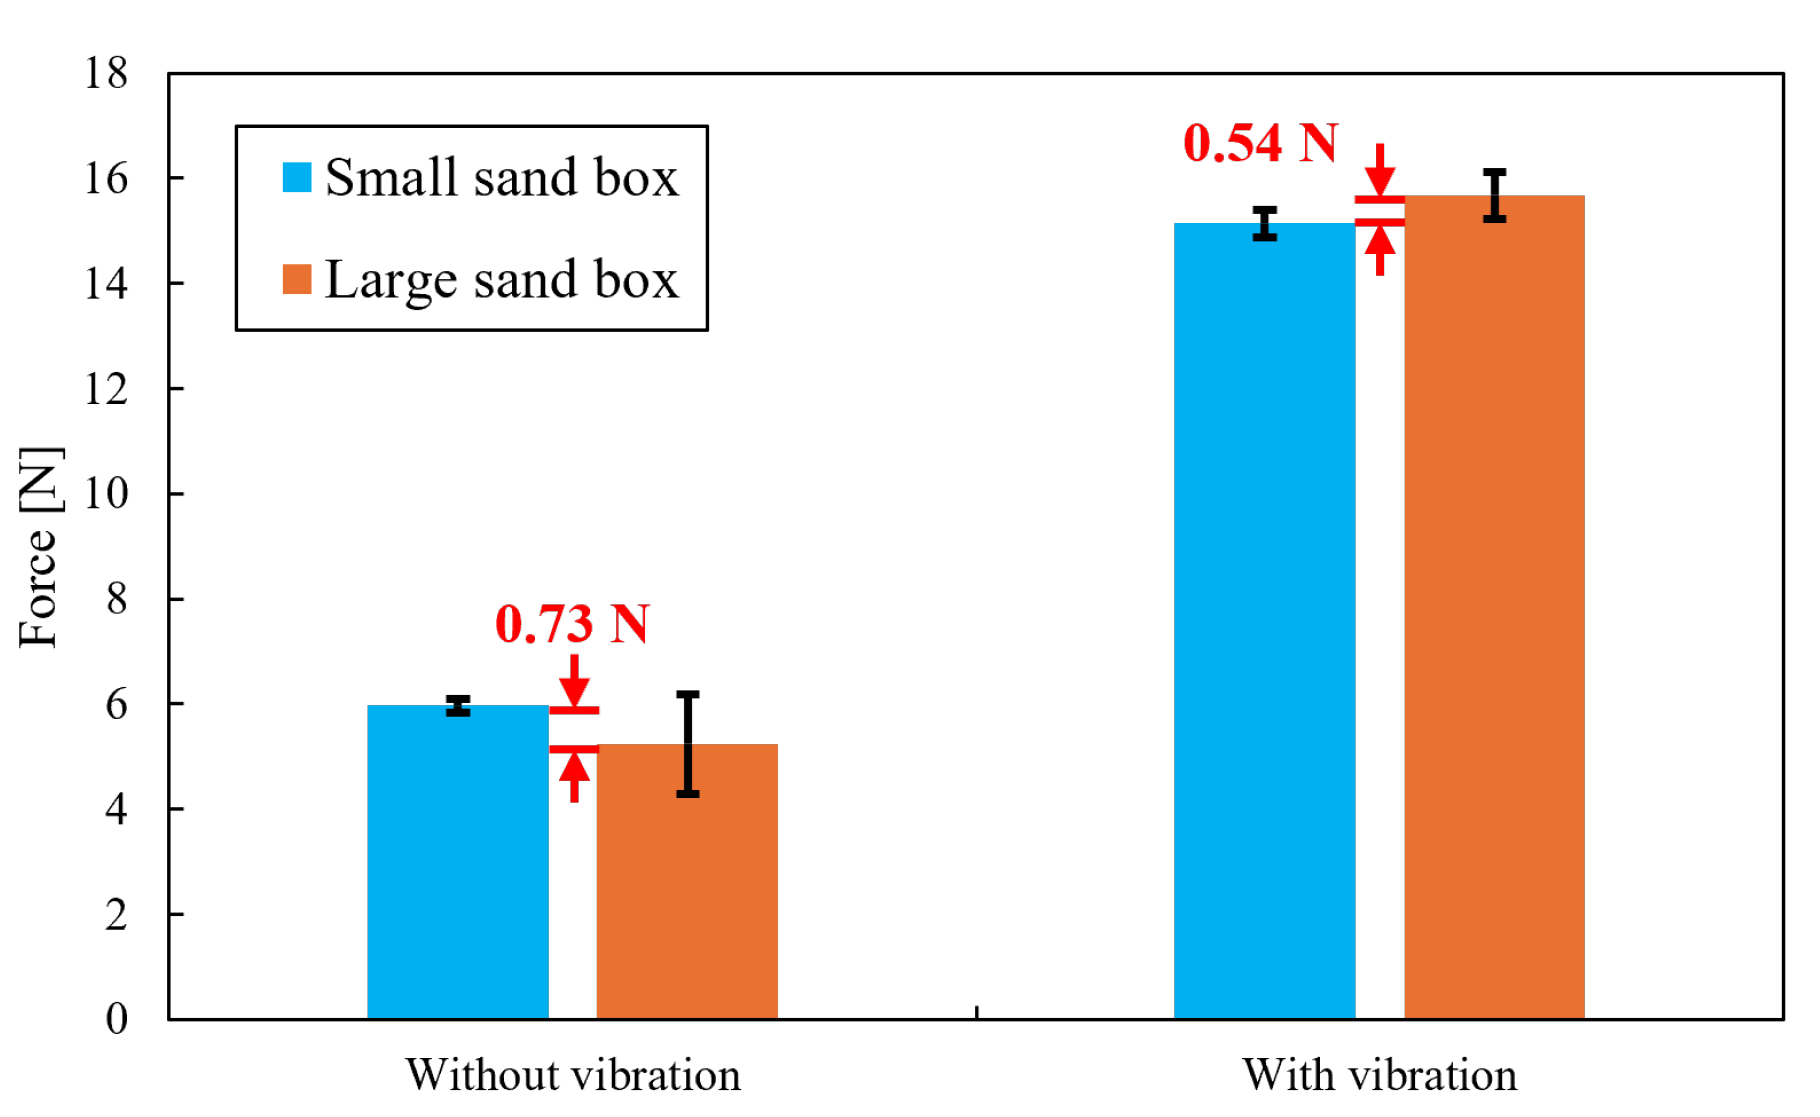
Appendix A.1. The Effect of the Sand Box Size on the Bearing Capacity

The size of the sand box, which was used in the experiment of Section 2.2, was 309 (length), 439 (width), and 300 (height) mm. The sand box in this experiment is smaller than the previous one, and this size was 245 (length), 365 (width), and 140 (height) mm. The bearing capacity was measured without and with vibration. The vibration time was 200 s when imparting vibration to the ground.
Figure A1 shows the peak bearing capacity for each experimental condition from five trials and the standard errors. The “Large sandbox” results were measured in the experiment of Section 2.2. The differences in the bearing capacity using each sand box were smaller than 1 N. Therefore, we consider that the effect of the sand box size on the bearing capacity is small in this study.
Figure A1. Comparison of peak bearing capacity in each sand size box condition.
Geotechnics 05 00021 g0a1

Appendix A.2. The Effect of Changing Vibrations on the Bearing Capacity and Vibration Acceleration

Changing the voltage supplied to the vibration motor produced three types of vibrations. The larger the supplied voltage, the higher the vibration force and frequency. Table A1 lists the vibrations. The bearing capacity was measured using three vibrations. The vibration time was set at 10, 50, 100, and 200 s. The vibration acceleration was also measured when the vibration time was 200 s.
Table A1. List of used vibrations.
VibrationSupply Voltage [V]Vibration Force (Error) [N]Frequency (Error) [Hz]
Weak vibration101.09 ( ± 0.01 )70 ( ± 0.45 )
Middle vibration205.20 ( ± 0.12 )154 ( ± 1.81 )
Strong vibration3011.9 ( ± 0.09 )233 ( ± 0.87 )
Figure A2 shows the peak bearing capacity for each vibration time averaged from five trials, along with the standard errors. The results using Strong vibration were measured in the experiment in Section 2.2. When the vibration time is short, the peak value increases with the vibration time. The peak value does not increase further when the vibration time is large. This tendency was confirmed using each vibration. Moreover, the larger the vibration, the larger the bearing capacity.
Figure A3 shows the variation in the main spectra component relative to time using each vibration. The larger the vibration, the larger the vibration acceleration. The value of the main spectra component initially increases and vibrates when the vibration time is short using Middle and Strong vibrations. Moreover, it converges when the vibration time is long using all vibrations. This result suggests that the proposed correlated indicator can judge the optimal vibration time when using other vibrations. In a future study, the availability of the proposed correlated indicator will be evaluated when using other vibrations.
Figure A2. Peak bearing capacity versus vibration time in each vibration.
Geotechnics 05 00021 g0a2
Figure A3. 1st peak component of vibration acceleration versus vibration time in each vibration.
Geotechnics 05 00021 g0a3

References

  1. NASA, Artemis. Available online: https://www.nasa.gov/specials/artemis/ (accessed on 12 March 2025).
  2. NASA Gateway. Available online: https://www.nasa.gov/mission/gateway/ (accessed on 12 March 2025).
  3. NASA. Mars 2020 Mission Perseverance Rover. Available online: https://mars.nasa.gov/mars2020/mission/overview/ (accessed on 12 March 2025).
  4. Enming, J.; Changqing, L.; Jian, C.; Xiaojia, Z.; Yanqing, X.; Ping, L.; Xiaohui, F.; Zongcheng, L. Detection of allophane by the Zhurong rover indicates water-limited alteration at Utopia Planitia, Mars. Earth Planet. Sci. Lett. 2024, 639, 118769. [Google Scholar] [CrossRef]
  5. Fairen, A.G.; Schulze-Makuch, D.; Rodriguez, A.P.; Fink, W.; Davila, A.F.; Uceda, E.R.; Furfaro, R.; Amils, R.; McKay, C.P. Evidence for Amazonian acidic liquid water on Mars: A reinterpretation of MER mission results. Planet. Space Sci. 2009, 57, 276–287. [Google Scholar] [CrossRef]
  6. Golombek, M.P.; Cook, R.A.; Economou, T.; Folkner, W.M.; Haldemann, A.F.C.; Kallemeyn, P.H.; Knudsen, J.M.; Manning, R.M.; Moore, H.J.; Parker, T.J.; et al. Overview of the mars pathfinder mission and assessment of landing site predictions. Science 1997, 278, 1743–1748. [Google Scholar] [CrossRef] [PubMed]
  7. Witze, A. Space rovers in a record race. Nature 2013, 498, 284–285. [Google Scholar] [CrossRef] [PubMed]
  8. NASA Science, Spirit. Available online: https://solarsystem.nasa.gov/missions/spirit/in-depth/ (accessed on 12 March 2025).
  9. Wilcox, B.H. ATHLETE: A Limbed Vehicle for Solar System Exploration. In Proceedings of the 2012 IEEE Aerospace Conference, Big Sky, MT, USA, 3–10 March 2012. [Google Scholar] [CrossRef]
  10. Yeomans, B.; Saaj, C.M.; Winnendael, M.V. Walking planetary rovers: Experimental analysis and modelling of leg thrust in loose granular soils. J. Terramech. 2013, 50, 107–120. [Google Scholar] [CrossRef]
  11. Colombano, S.; Kirchner, F.; Spenneberg, D.; Hanratty, J. Exploration of planetary terrain with a legged robot as a scout adjunct to a rover. In Proceedings of the Space 2004 Conference and Exhibit, San Diego, CA, USA, 28–30 September 2004. [Google Scholar] [CrossRef]
  12. Seidel, D.; Hermann, M.; Gumpert, T.; Loeffl, F.C.; Albu-Schaffer, A. Using elastically actuated legged robots in rough terrain: Experiments with DLR quadrupedal bert. In Proceedings of the 2020 IEEE Aerospace Conference, Big Sky, MT, USA, 7–14 March 2020. [Google Scholar] [CrossRef]
  13. Kato, T.; Uno, K.; Yoshida, K. A Gripper with Pin-Array Structure for Convex and Concave Terrain Shapes. J. Robot. Soc. Jpn. 2024, 42, 177–180. [Google Scholar] [CrossRef]
  14. Komizunai, S.; Konno, A.; Abiko, S.; Uchiyama, M. Development of a static sinkage model for a biped robot on loose soil. In Proceedings of the 2010 IEEE/SICE International Symposium on System Integration, Sendai, Japan, 21–22 December 2010. [Google Scholar] [CrossRef]
  15. Watanabe, T.; Iizuka, K. Proposal of walking to reduce slipping behavior using the compaction effect of loose soil caused by propagation of vibration for small light lunar planetary exploration rovers with legs. Trans. JSME 2020, 86, 19–00263. [Google Scholar] [CrossRef]
  16. Watanabe, T.; Higashiyama, R.; Watanabe, D.; Iizuka, K. Analyzing bearing capacity changes due to vibration in discrete element method simulations. J. Terramech. 2025, 118, 101031. [Google Scholar] [CrossRef]
  17. Wada, S.; Kouda, M.; Enami, A. Experimental Study on Passive Earth Pressure Part 1: The Experimental Device and An Example of Passive Earth Pressure Tests by the Device. J. Str. Con. Eng. 1998, 63, 69–76. [Google Scholar] [CrossRef] [PubMed]
  18. Terzaghi, K.; Peck, R.B. Soil Mechanics in Engineering Practice; Read Books Limited: Redditch, UK, 2010. [Google Scholar]
  19. Alqarawi, A.S.; Leo, C.J.; Liyanapathirana, D.S.; Sigdel, L.; Lu, M.; Hua, P. A spreadsheetbased technique to calculate the passive soil pressure based on the log-spiral method. Com. Geo. 2021, 130, 103926. [Google Scholar] [CrossRef]
  20. Fujiyama, T.; Tateyama, K. Evaluation of compacting ground stiffness by acceleration of vibratory roller. Jap. J. JSCE 2000, 652, 115–123. [Google Scholar] [CrossRef]
  21. Watanabe, T.; Iizuka, K. Experimental investigation of the relationship between bearing capacity and vibration parameters for planetary exploration of legged rovers. ROBOMECH J. 2023, 10, 27. [Google Scholar] [CrossRef]
  22. Kobayashi, T.; Fujiwara, Y.; Yamakawa, J.; Yasufuku, N.; Omine, K. Mobility performance of a rigid wheel in low-gravity environments. J. Terramech. 2010, 47, 261–274. [Google Scholar] [CrossRef]
  23. Ono, S.; Namikawa, S.; Yoshida, K. Analysis of soil flow and traction mechanics for lunar overs over different types of soils using particle image velocimetry. J. Terramech. 2021, 95, 89–100. [Google Scholar] [CrossRef]
  24. Oe, A.; Nishida, S.; Nakatani, S. Study of passive steering mechanism for small Martian surface exploration rovers. J. Terramech. 2024, 112, 35–43. [Google Scholar] [CrossRef]
  25. Yeomans, B.; Saaj, C.M. Towards terrain interaction prediction for bioinspired planetary exploration rovers. Bioinspir. Biomimetics 2014, 9, 016009. [Google Scholar] [CrossRef] [PubMed]
Figure 1. Condition of particles, which consist of the ground in each imparting vibration case. This figure is reprinted from the study by Watanabe et al. [16].
Geotechnics 05 00021 g001
Figure 2. Vibration timing of walking method as proposed in our previous study. This figure is reprinted from the study by Watanabe et al. [16].
Geotechnics 05 00021 g002
Figure 3. Slip line when rover’s leg is dragged on the ground. This figure is reprinted from the study by Watanabe et al. [16].
Geotechnics 05 00021 g003
Figure 4. Schematic diagram of Reece’s bearing capacity model.
Geotechnics 05 00021 g004
Figure 5. Vibration acceleration tendency related to ground stiffness.
Geotechnics 05 00021 g005
Figure 6. Experimental setup for measuring the bearing capacity and vibration acceleration.
Geotechnics 05 00021 g006
Figure 7. Overview of the rod.
Geotechnics 05 00021 g007
Figure 8. Direction that vibration is generated.
Geotechnics 05 00021 g008
Figure 9. Experimental outline for measuring the bearing capacity and vibration acceleration.
Geotechnics 05 00021 g009
Figure 10. Bearing capacity versus shear displacement.
Geotechnics 05 00021 g010
Figure 11. Peak bearing capacity versus vibration time.
Geotechnics 05 00021 g011
Figure 12. Frequency analysis results for vibration acceleration at each time.
Geotechnics 05 00021 g012
Figure 13. Variation in the main spectra component of vibration acceleration against time.
Geotechnics 05 00021 g013
Figure 14. The main spectra component of vibration acceleration versus peak bearing capacity.
Geotechnics 05 00021 g014
Figure 15. The differentiated main spectra component of vibration acceleration versus vibration time.
Geotechnics 05 00021 g015
Figure 16. The standard deviation of the difference between the main spectra component versus vibration time and the peak bearing capacity.
Geotechnics 05 00021 g016
Figure 17. The coefficient of determination versus the number of samples about the standard deviation of the difference between the main spectra component.
Geotechnics 05 00021 g017
Figure 18. The bearing capacity peak value versus the standard deviation of the difference between the main spectra component whose value is from 0 to 2.
Geotechnics 05 00021 g018
Table 1. Experimental conditions for measuring the bearing capacity and vibration acceleration.
ItemCondition (Value)
Number of trials5
Sinkage of the rod30 mm
Dragged speed0.13 mm/s
Dragged time100 s
Type of sandToyoura sand
Vibration motorTP-2528C-24, Three Peace Co., Ltd., Daitou-ku, Tokyo, Japan
Supply voltage for vibration motor30 V
Vibration force11.9 N
Vibration frequency233 Hz
Vibration time0, 5, 10, 20, 30, 40, 50, 60, 75, 85, 100, 125, 150, and 200 s
Force sensorPFS055YA251U6, Leptrino Co., Ltd., Saku city, Nagano, Japan
Acceleration sensorAccStick, Shinyei Technology Co., Ltd., Koube city, Hyougo, Japan
Sampling frequency of acceleration sensor1600 Hz
Disclaimer/Publisher’s Note: The statements, opinions and data contained in all publications are solely those of the individual author(s) and contributor(s) and not of MDPI and/or the editor(s). MDPI and/or the editor(s) disclaim responsibility for any injury to people or property resulting from any ideas, methods, instructions or products referred to in the content.

