Article

Evaluation of the Self-Weight Consolidation of Clay-Rich High Water Content Slurries in a Benchtop Centrifuge

1
Department of Civil and Environmental Engineering, University of Alberta, 9211 116 Street NW, Edmonton, AB T6G1H9, Canada
2
Centre for Oil Sands Sustainability, Northern Alberta Institute of Technology (NAIT), Edmonton, AB T5G 0Y2, Canada
*
Author to whom correspondence should be addressed.
Geotechnics 2025, 5(1), 18; https://doi.org/10.3390/geotechnics5010018
Submission received: 7 January 2025 / Revised: 1 February 2025 / Accepted: 14 February 2025 / Published: 3 March 2025

Abstract

:
Oil sands tailings consist of a combination of sand, fine particles, water, and residual unextracted bitumen in varying ratios. The management of these mine waste tailings is largely influenced by their consolidation behavior. Large strain consolidation testing, such as the multi-step large strain consolidation (MLSC) test, is commonly used to determine consolidation properties but requires considerable time. A benchtop centrifuge (BTC) apparatus was proposed to derive the consolidation parameters of the following three clay-rich oil sands tailings slurries: two samples of high-plasticity fluid fine tailings (FFT) and one of low-plasticity FFT. Comparison with the MLSC tests illustrates that the BTC-derived compressibility data closely matched the MLSC test’s compressibility curve within the BTC stress range. However, the hydraulic conductivity from the BTC test was an order of magnitude higher than that from the MLSC test. The consistency of the BTC method and the validation of scaling laws were confirmed through modeling-of-models tests, showing a consistent average void ratio regardless of the specimen height or gravity scale. The influence of the small radius of the BTC was found to be minimal. The limitations of the BTC in the physical modeling of the consolidation behavior are discussed and their impact on the interpretation of the observed consolidation behavior is addressed. Overall, the BTC test provides a rapid method to gain insight on high-water-content slurries’ large strain consolidation behavior.

1. Introduction

Oil sands mining has become a vital aspect of global energy production, particularly in regions like Alberta, Canada. However, along with its significant contributions to the energy supply, the extraction process generates substantial amounts of waste, primarily in the form of tailings, which pose significant environmental challenges. These tailings consist of water, mineral solids, including sand, silt, and clay, residual bitumen, and other chemical contaminants. Fluid fine tailings (FFT) with a high water content are generally observed to consolidate at a very slow rate. This slow consolidation is primarily due to the dispersion of clay caused by chemical interactions between clay, water, and residual bitumen during the extraction process, which significantly reduces the hydraulic conductivity of the FFT. Their management is crucial due to their potential impacts on surrounding ecosystems and communities [1]. One of the primary issues associated with oil sands mine waste is its sheer volume and composition. Tailings storage facilities can cover vast areas and contain billions of gallons of waste material, presenting risks of contamination to water sources, soil, and air [2]. For instance, in the Athabasca oil sands region, the cumulative volume of fluid tailings stored at the mine sites reached 1392 million cubic meters in the year 2020 [1]. Consolidation and dewatering issues exacerbate the challenges of managing oil sands mine waste [3,4]. As tailings settle and consolidate over time, they undergo substantial volume reductions, resulting in surface subsidence. If the closure objective for the FFT deposit is to create a terrestrial landform, this level of settlement can lead to extensive flooded areas, increasing the risk of dam breaches and altering the landform’s water balance [5,6].
Dewatering, on the other hand, involves the removal of excess water from the tailings, which is essential for minimizing the volume of waste and facilitating subsequent reclamation efforts. However, both consolidation and dewatering processes require careful monitoring and management to prevent environmental contamination and ensure the stability of waste management infrastructure [7]. The benefits of quantifying consolidation behavior quickly are manifold. Rapid assessment allows for timely decision making regarding tailings treatment options and management, facilitating the implementation of appropriate containment and reclamation measures [1]. Understanding consolidation behavior also enables engineers to optimize the design of tailings storage facilities and other waste management infrastructure, potentially reducing construction costs and environmental impacts. Additionally, the swift quantification of consolidation behavior with many more samples can aid in predicting long-term settlement patterns, allowing for proactive measures to mitigate potential risks that can be validated vis field data as opposed to relying solely on smaller datasets from more time-consuming, conventional lab tests.
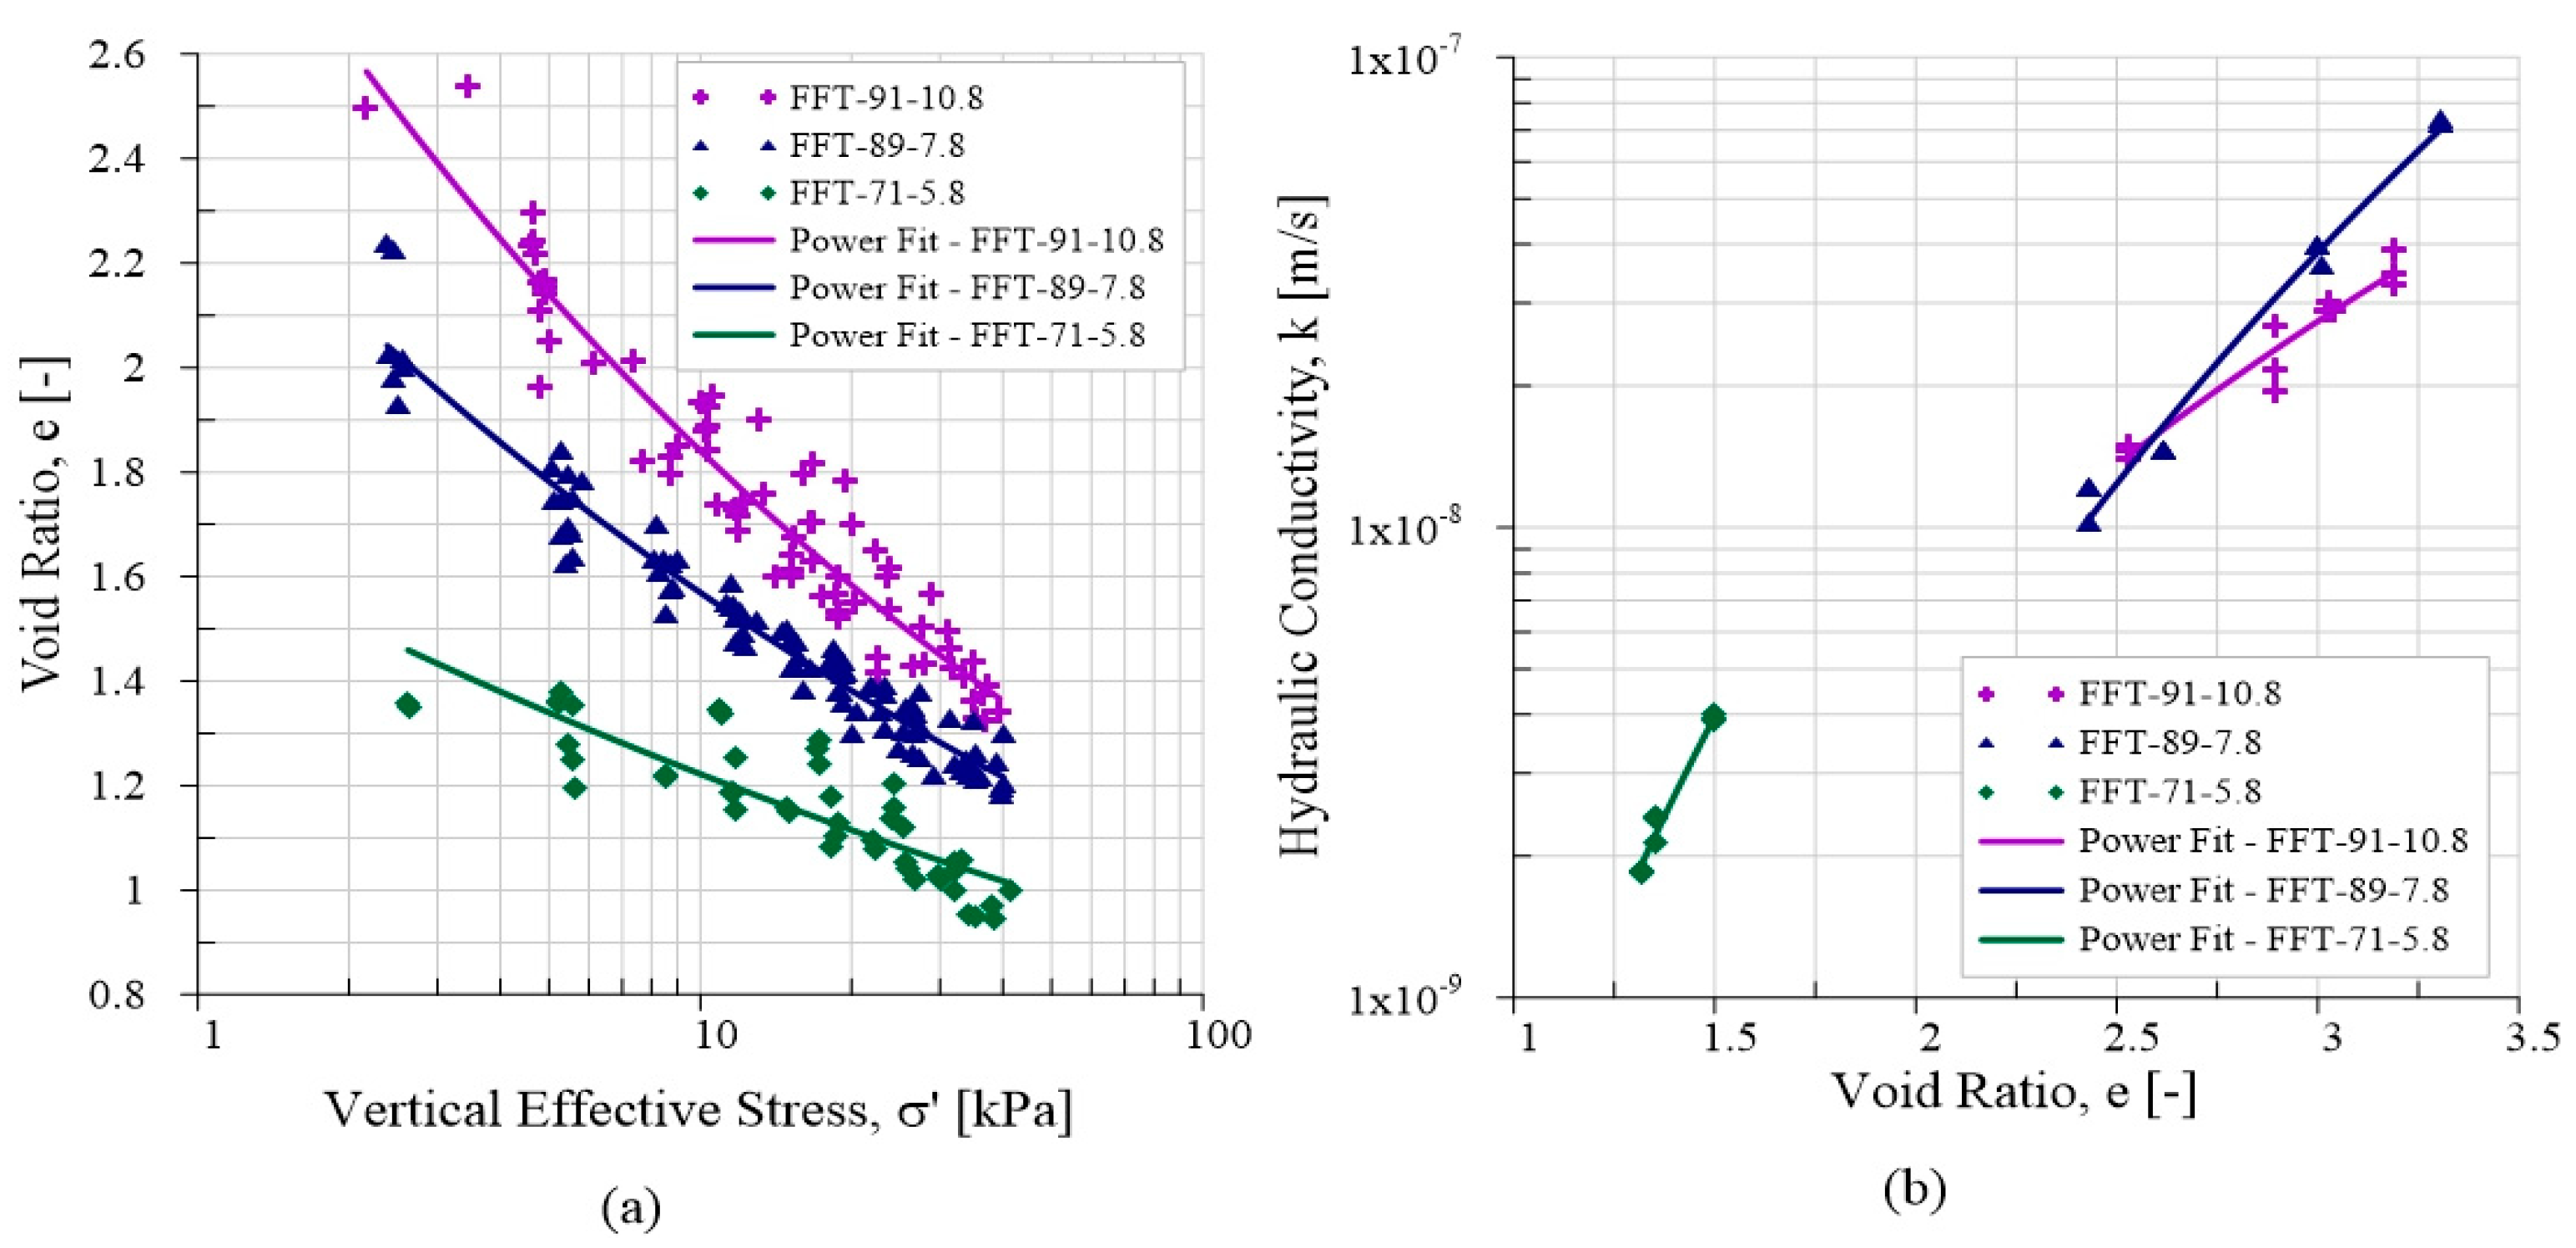
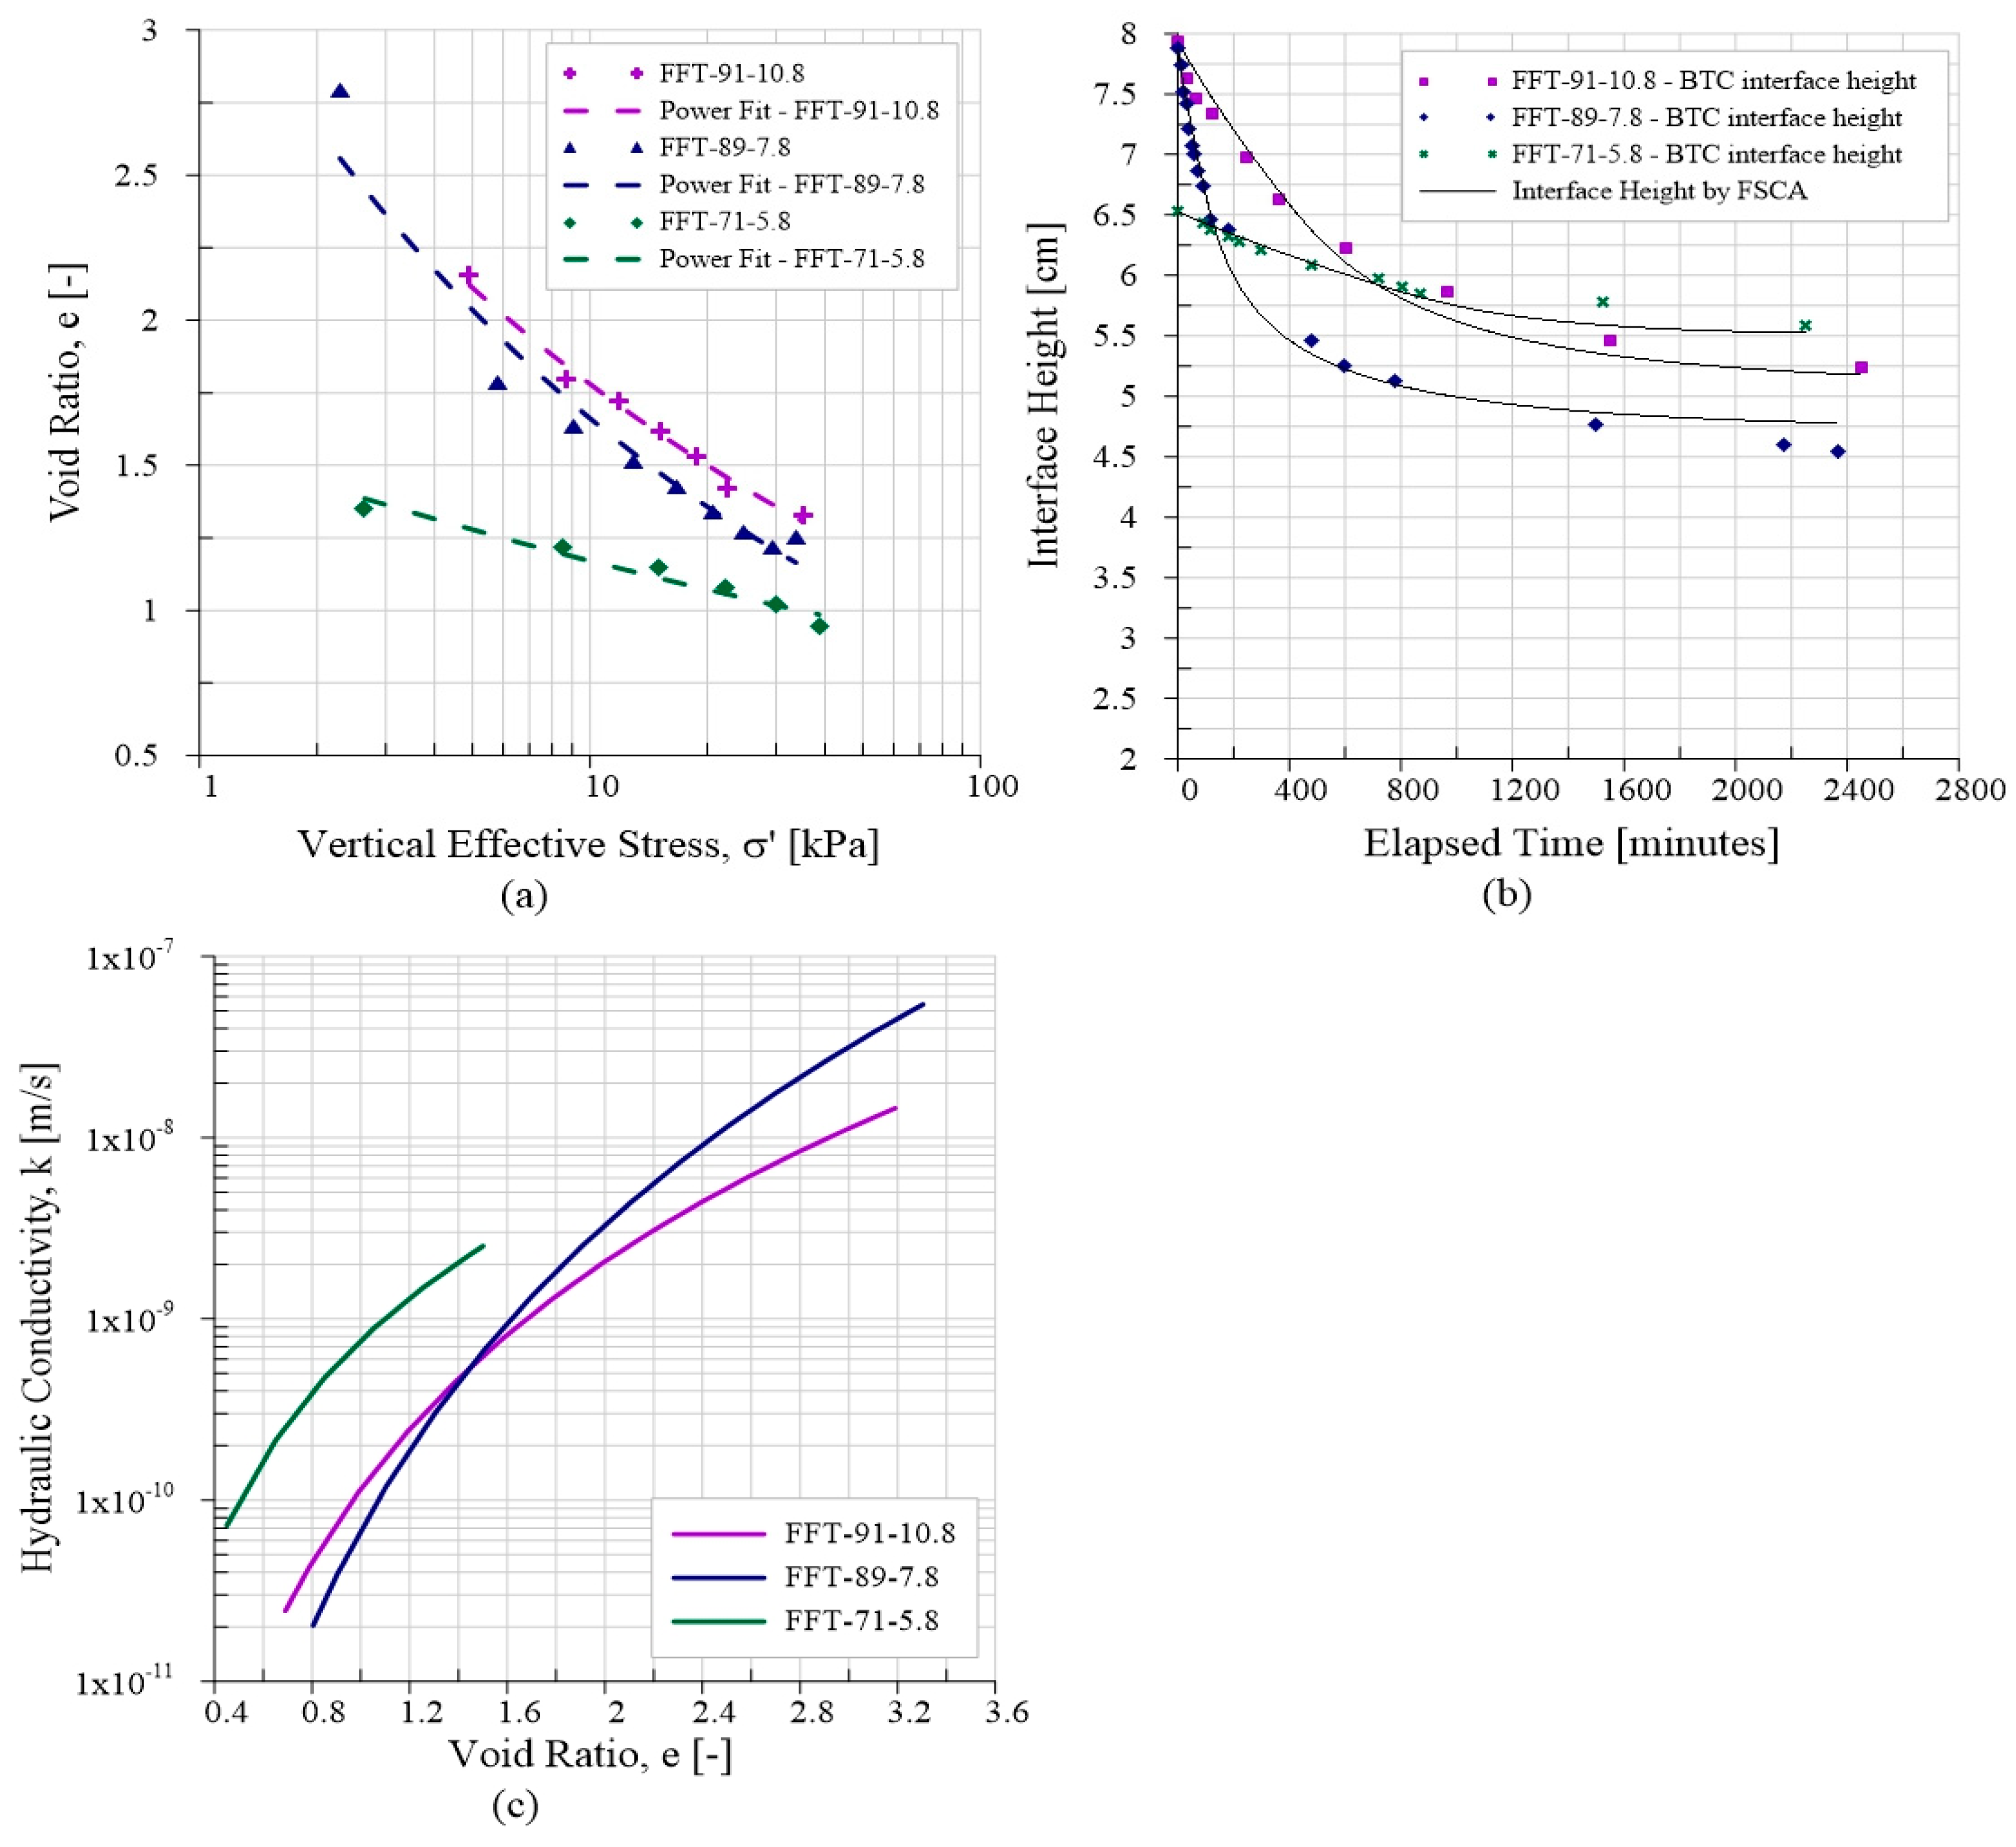
Various testing techniques may be employed to evaluate the large strain consolidation behavior of oil sands mine waste. Large strain geotechnical testing methods, such as the multi-step large strain consolidation (MLSC) test [8,9,10,11,12,13] and seepage-induced consolidation test (SICT) [14,15], provide valuable data on the consolidation behavior of the tailings under loading, known as compressibility (e-σ′), and the void ratio–hydraulic conductivity (k-e), where e is the void ratio, σ′ is the vertical effective stress, and k is the hydraulic conductivity. Advanced modeling techniques, including finite element analysis, utilize these constitutive relationships to simulate the complex consolidation processes and predict long-term settlement behavior. Furthermore, centrifuge testing techniques offer an alternative approach to studying consolidation behavior by subjecting tailings samples to an increased gravitational force, allowing oil sands operators to observe and analyze consolidation processes under controlled conditions [16,17,18,19]. Furthermore, several researchers have examined the consolidation of mine tailings and dredged deposits under the influence of self-weight using geotechnical beam centrifuges [20,21,22]. Beam centrifuges, commonly utilized in research environments, are sizable apparatuses that occupy entire rooms and entail significant operating costs. They are specifically designed to create a configuration that better aligns with theoretical ideals for geotechnical experiments and monitoring purposes. These centrifuges possess a larger spin radius, usually ranging between 2 and 8 m, which enables the generation of a more uniform acceleration field and facilitates the accommodation of substantial sample volumes [12]. Suncor has implemented a commercial technology known as a Permanent Aquatic Storage Structure (PASS) within its Accelerate Dewatering (ADW) process. This technology aims to convert mature fine tailings (MFT) or FFT into a substrate suitable for reclamation into freshwater lakes. The PASS centrifuge, developed in collaboration with Coanda, is a benchtop centrifuge patented by Suncor as a part of this initiative [23]. It allows for the rapid evaluation of the settling performance of treated tailings over short periods, typically a few hours, providing immediate insights into the long-term behavior of processed tailings upon production [23].
Benchtop centrifuges are ideal for both fieldwork and laboratory settings, yet they are often lacking in in-flight monitoring devices to track consolidation progress, unlike the geotechnical beam centrifuge [12] and PASS centrifuge [23]. Typically, sample analysis occurs at the conclusion of the spinning process. Although benchtop centrifuges have certain limitations, particularly related to their small size, they have still been utilized to simulate the self-weight consolidation of soft soils and slurry-like materials. Several researchers have examined the consolidation of very soft soils with high water contents under the influence of self-weight using benchtop centrifuges [24,25,26].
McDermott and King [24] conducted accelerated consolidation testing on Speswhite kaolin clay using a benchtop centrifuge. Their aim was to assess the consolidation behavior of kaolin slurries at varying initial moisture levels. They adopted a method for estimating hydraulic conductivity based on a methodology developed by Takada and Mikasa [21]. According to Takada and Mikasa’s method, the initial settling rate follows a near-linear pattern, indicating the permeability at the outset of the process. The relationship between the void ratio and effective stress was determined by analyzing the final void ratio distribution across the depth of the samples, following a methodology proposed by Takada and Mikasa [21]. A limitation of the study is the absence of data on whether the samples experienced segregation, particularly under a nominal acceleration of 753 g.
Reid et al. [26] utilized a modified benchtop centrifuge to investigate the consolidation behavior of slurry-like soil, specifically kaolin clay sourced from Unimin Australia [27]. They established the compressibility profile by directly measuring the moisture content at one- or two-millimeter intervals across the cored specimen post-consolidation, assuming the full saturation of the samples. Furthermore, they utilized the FLAC v7.0 finite difference code to develop an iterative numerical model. This model aimed to estimate the profile of the effective stress–hydraulic conductivity for the tested samples, aligning it with the observed dissipation of pore water pressure data. A drawback of the study is the lack of precise control and measurement of water loss through evaporation during spinning, which could complicate the numerical modeling and potentially destabilize the centrifuge due to uneven evaporation rates.
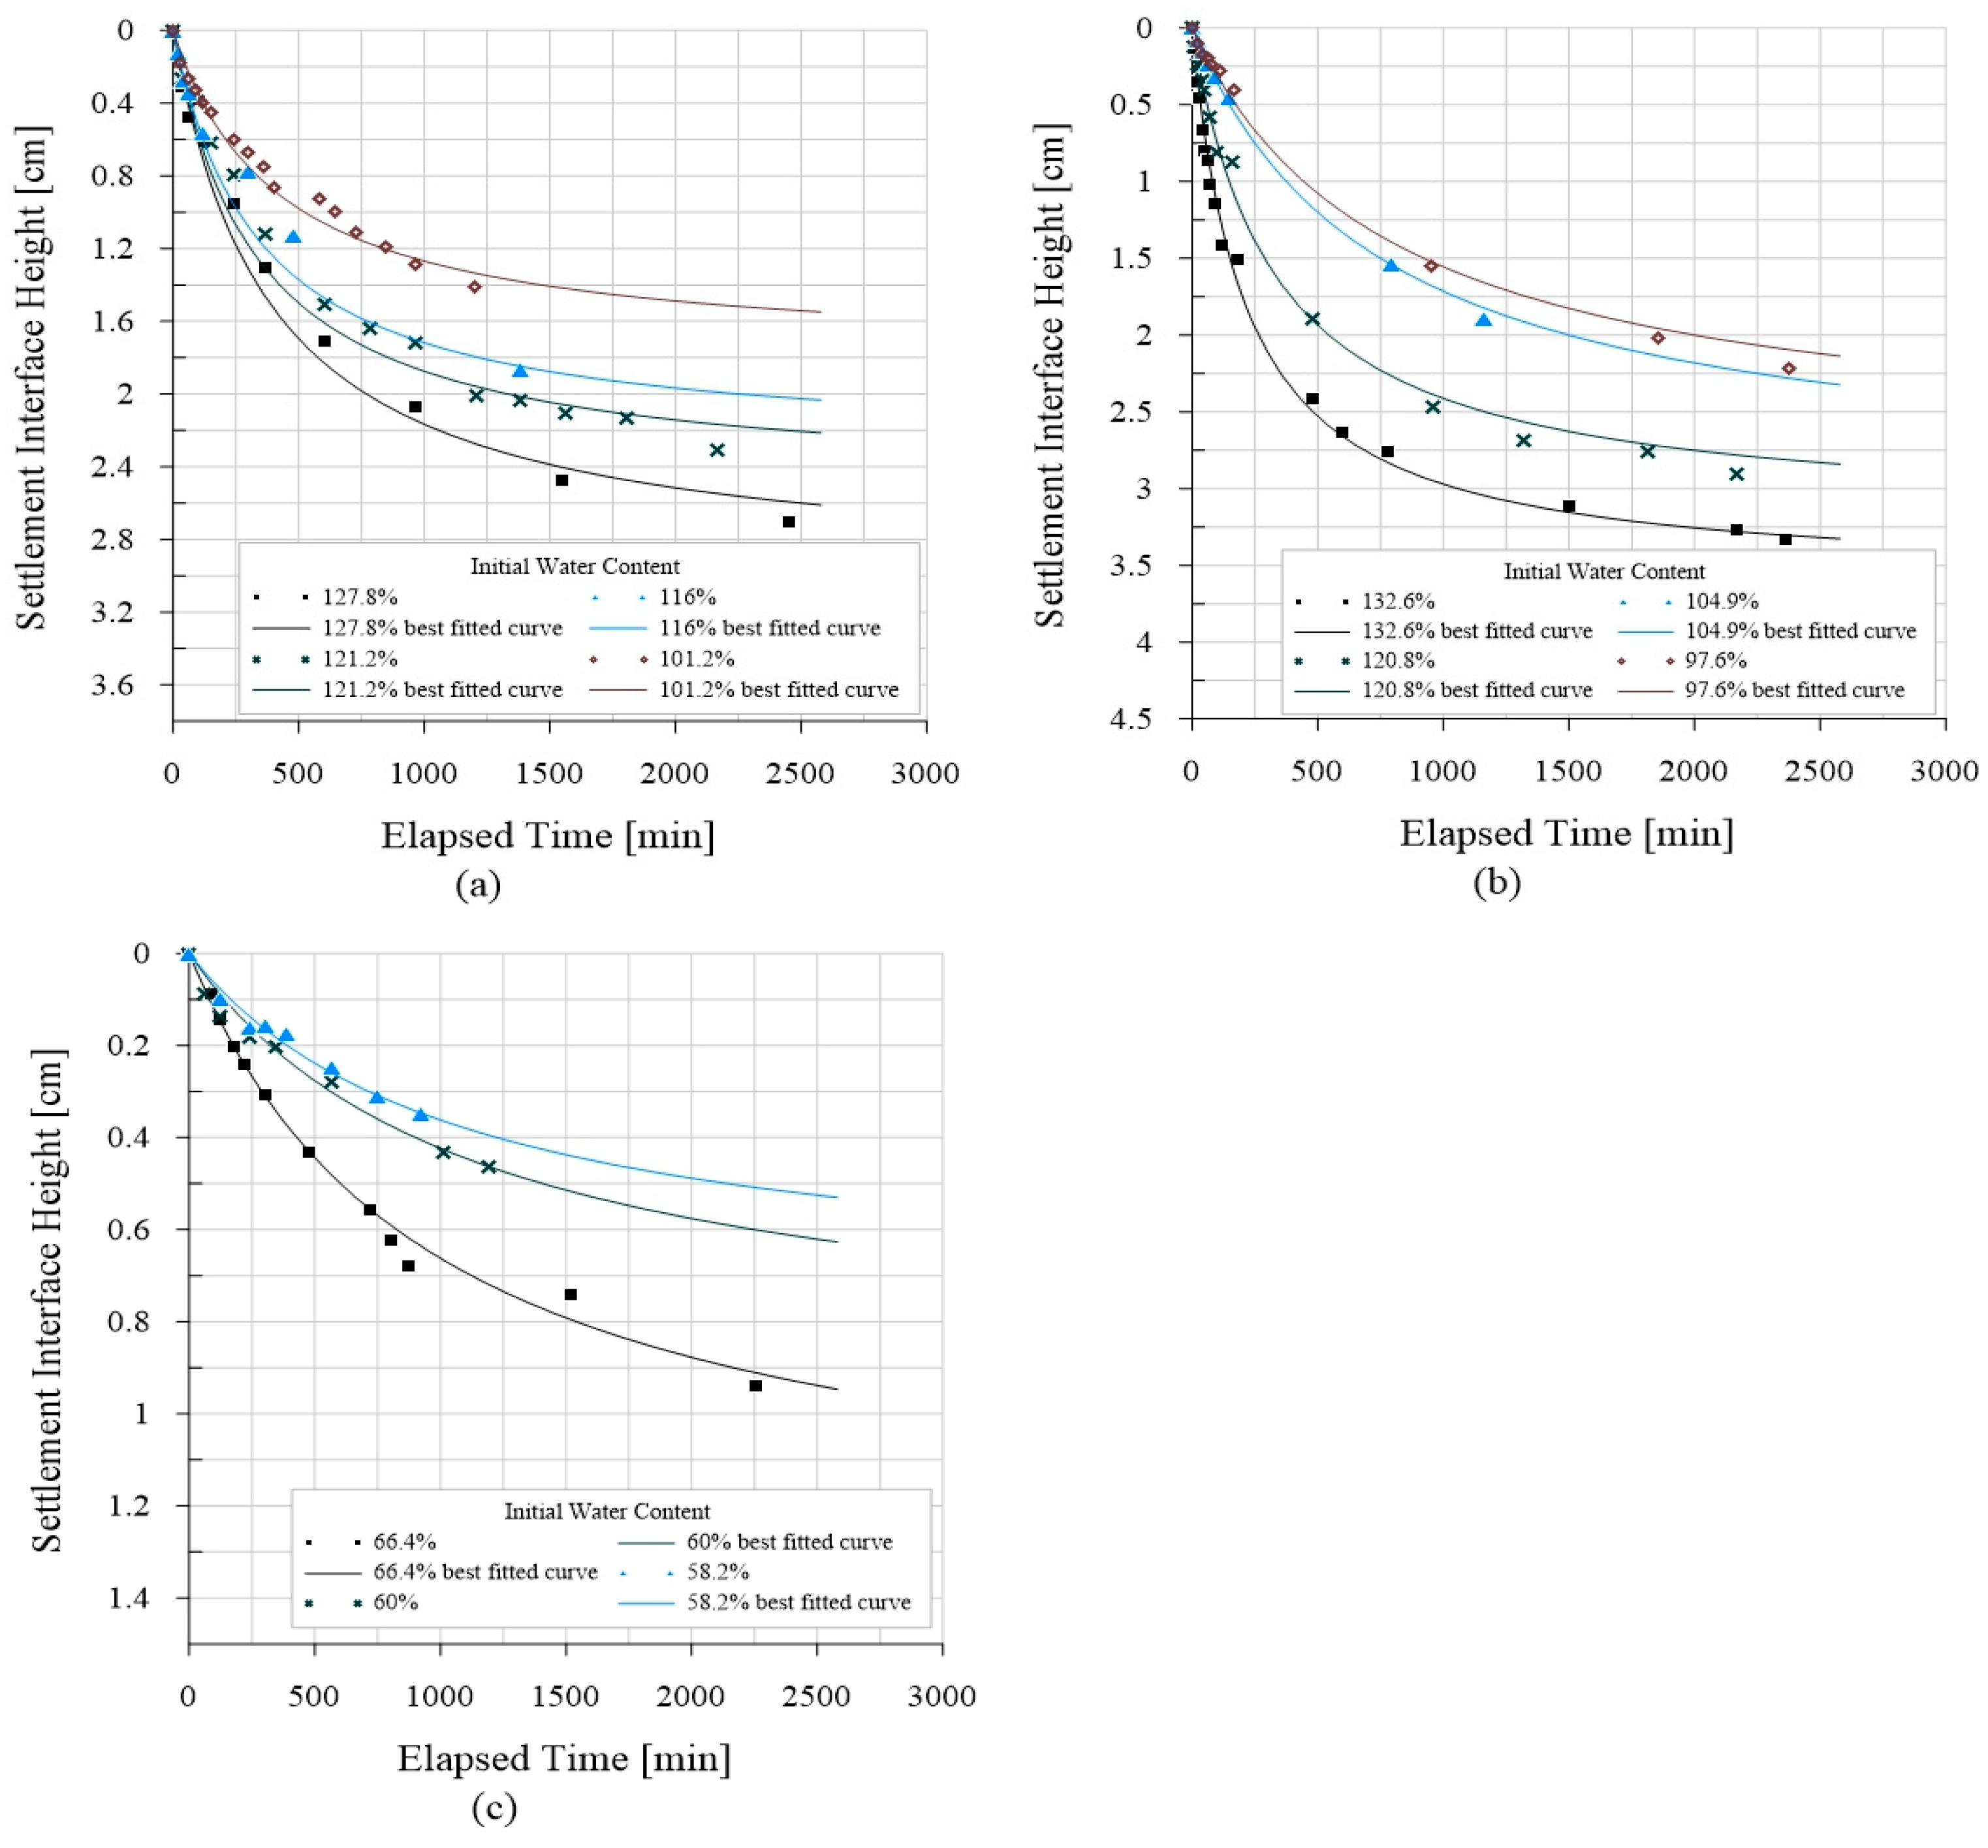
A benchtop centrifuge (BTC) enables faster data collection and analysis, providing insights into long-term settlement behavior in a fraction of the time required by conventional methods. A decreased turnaround time would offer numerous advantages to the oil sands sector, such as reducing the time to evaluate alternative tailings treatment technologies, enhanced tailings quality assurance and control, and expedited analysis and planning. This abbreviated testing period enables the assessment of a larger quantity of samples, thereby contributing to the development of an extensive properties database. As a result, engineers and researchers can make informed decisions more quickly, leading to more efficient tailings management strategies. The BTC enables operators to make well-informed decisions about the effectiveness of additives without the lengthy wait required for testing in the MLSC. Abdulnabi et al. [28] investigated the performance of various polymer and coagulant combinations used to enhance tailings dewatering and strength properties. Traditionally, MLSC testing for these additives takes between 4 and 10 months. However, the BTC can significantly reduce this timeframe, providing performance insights within just a few days.
The application of benchtop centrifuges for the assessment of the consolidation behavior of clay-rich high-water-content slurries like oil sands tailings is limited. Hence, this study aimed to examine the application of a benchtop centrifuge for swiftly acquiring consolidation parameters pertaining to oil sands tailings materials. The evaluation of these parameters was conducted by comparing them with data obtained from conventional large strain consolidation testing using the MLSC test. Furthermore, a series of tests were performed to verify the consistency, scaling law accuracy, and the impact of the benchtop centrifuge’s small radius.

2. Principles Behind Centrifuge Modeling

Centrifuge modeling aims to replicate the stress experienced by a prototype in a scaled-down model. This is particularly true in the case of centrifuge modeling, where the model is a smaller replica of the prototype. To accurately recreate the prototype’s response or interpret model findings in relation to prototype behavior, it is necessary to establish an appropriate scaling law that relates the prototype to the model [29]. For instance, when simulating the consolidation of tailings under significant strain, the geotechnical centrifuge model utilizes Equations (1) and (2) to describe the scaling laws for height and time, respectively, as follows:
h p = N h m
t p = N 2 t m
where hp represents the height of the prototype, hm represents the height of the specimen in the centrifuged model, N is the gravity scale factor which represents the ratio of the centrifuge acceleration (am) to the gravitational acceleration of the Earth (g), tp represents the elapsed time in the prototype, and tm represents the elapsed time in the centrifuged model.
When utilizing centrifuge testing for investigating the self-weight consolidation behavior of slurry-like materials, it is typically bound by several fundamental assumptions and inherent constraints. These include acknowledging the non-uniform distribution of vertical stress, recognizing the deviation from uniformity in horizontal stress distribution, and disregarding segregation effects, which will be described below.
The Earth’s gravitational acceleration remains uniform within the practical prototype height in many civil engineering applications, resulting in a linear vertical stress distribution across the prototype height. However, when employing a centrifuge to create the high acceleration necessary for physical modeling, there exists a slight variation in acceleration across the model. This discrepancy arises from the inertial acceleration field, calculated as Ng = 2, where r is the radius to any element within the soil model and ω is the centrifuge’s angular velocity. This indicates that the centrifugal acceleration level (g-level) increases linearly with the radius, leading to an uneven acceleration field and consequently causing an inherent variation in the vertical stress distribution across the centrifuge model, rendering it non-uniform.
An effective centrifuge radius (Re) is selected in a model to minimize the vertical stress distribution error. The effective centrifuge radius is defined by Schofield [30] and Taylor [31] as the distance from the center of rotation to one-third the specimen height. However, the one-third depth guideline is for samples that experience small strain and have a uniform material density. Therefore, Fox et al. [32] reported that, as the specimen undergoes larger deformations, the effective centrifuge radius increases with an increasing centrifugal acceleration ratio (
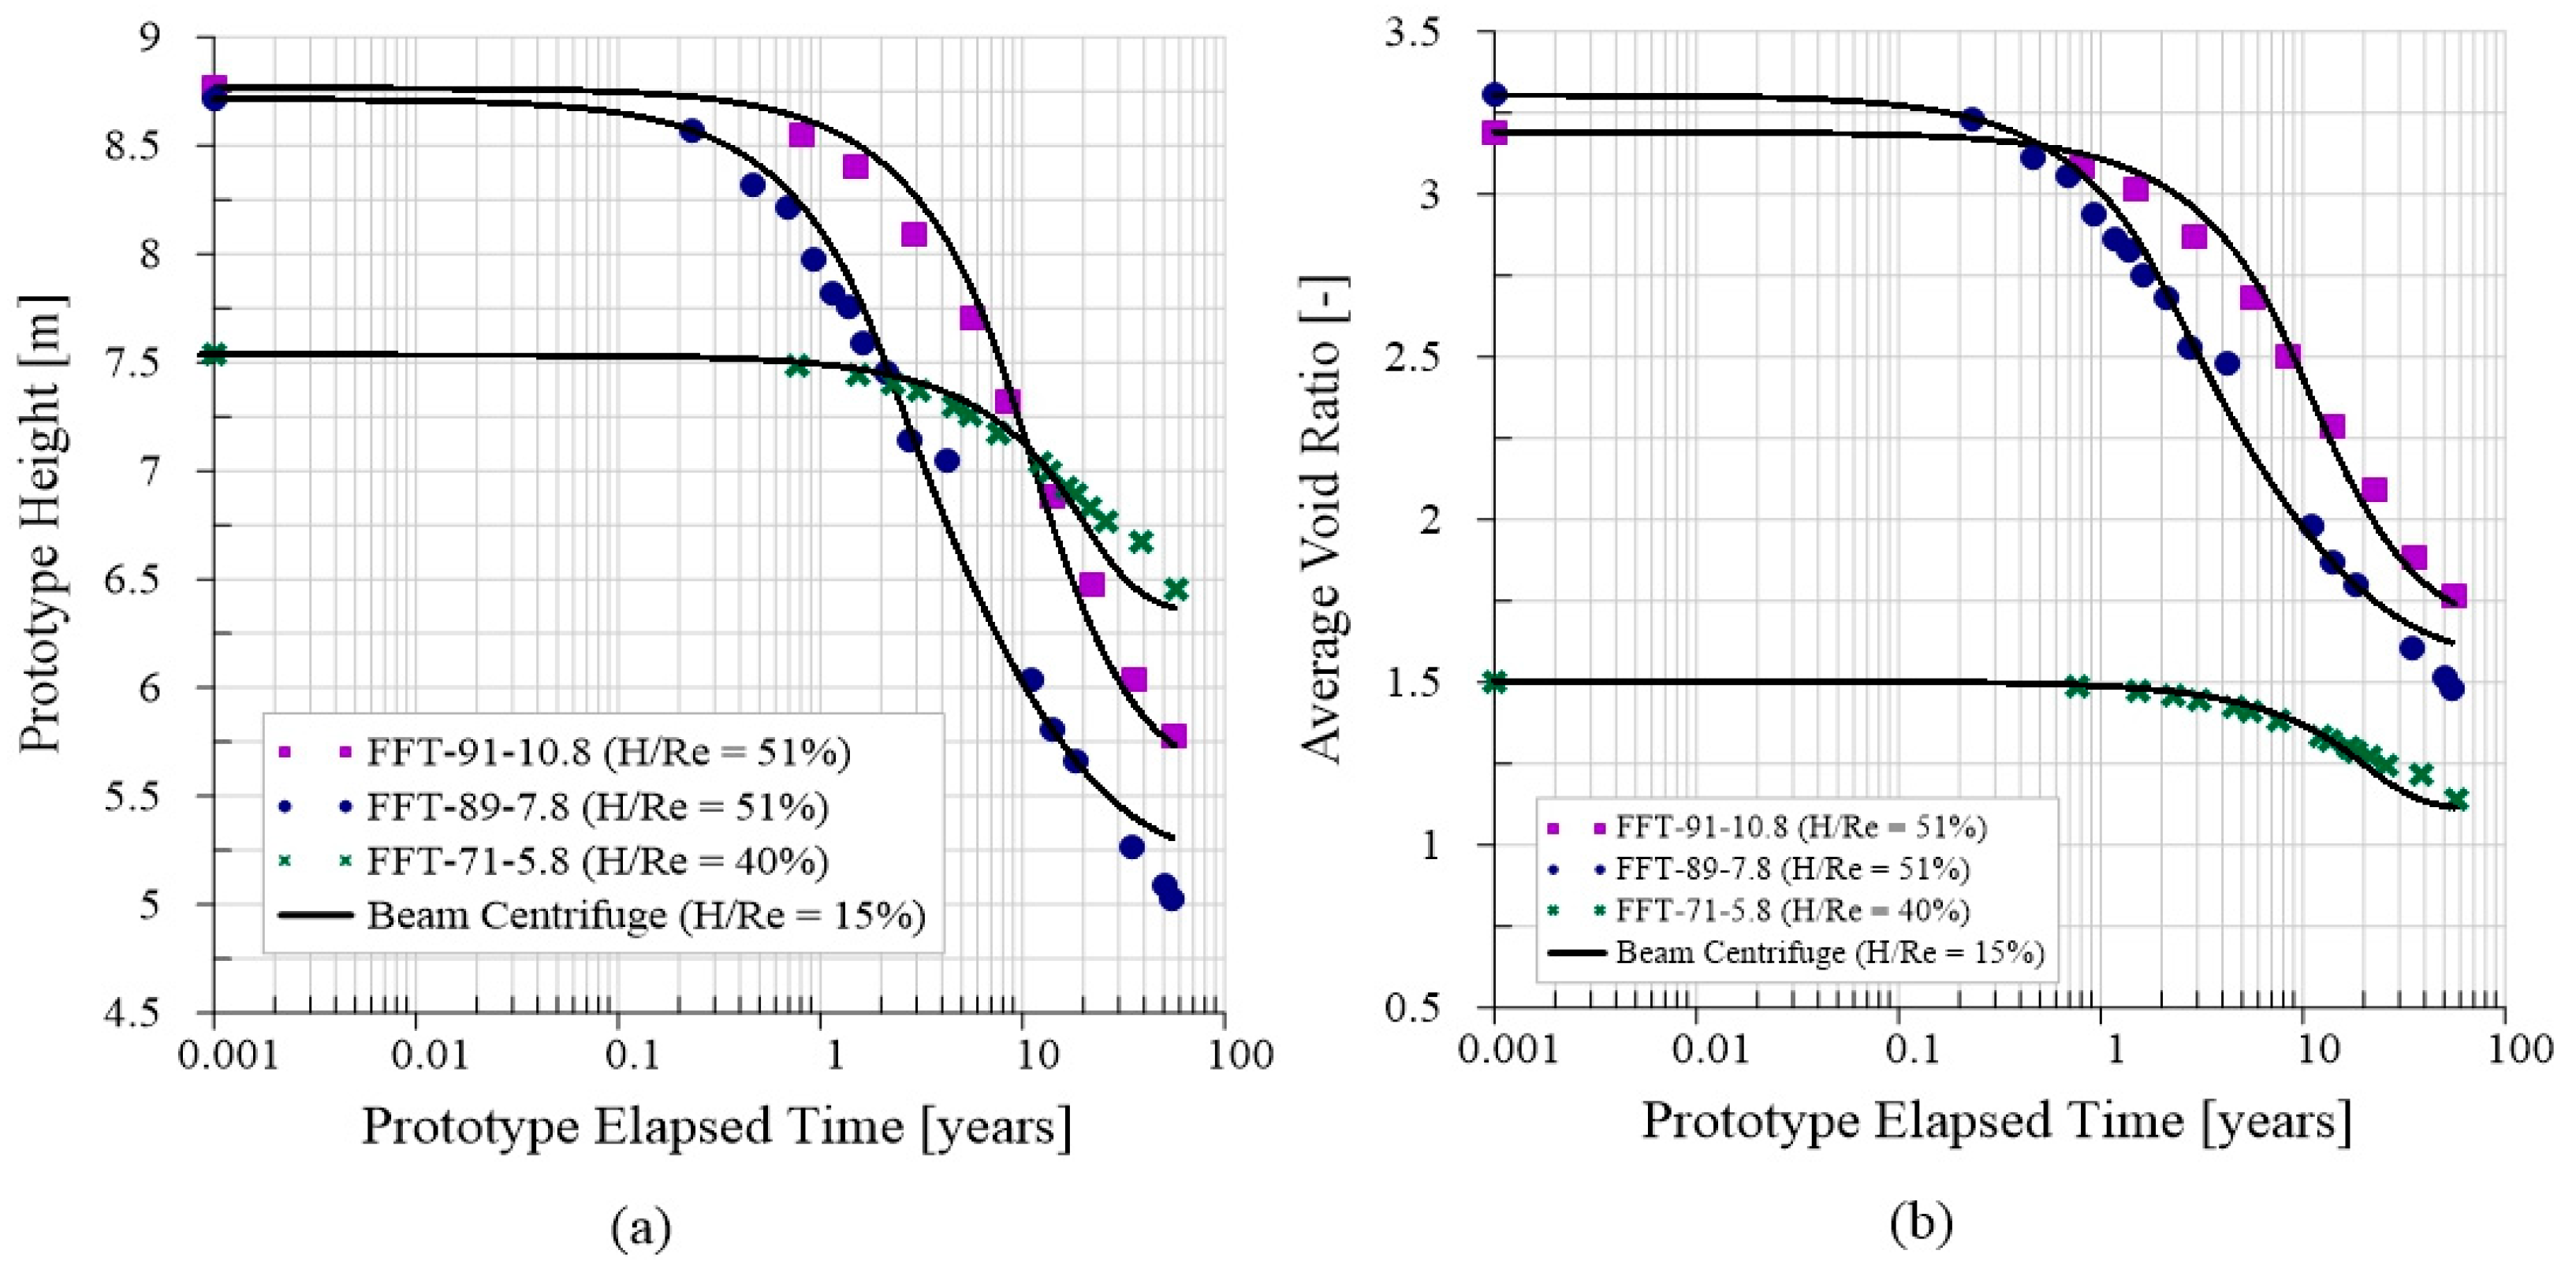
N), specimen height, and initial void ratio. The error in the time–settlement curves was less than 1.6% for all simulations when the effective radius was taken at the specimen’s initial mid-height. Taylor [31] reports that, provided the specimen height in the centrifuged model is less than about 20% of the effective centrifuge radius, the maximum error in the vertical stress distribution is often deemed negligible, and generally less than 3% of the actual prototype stress. The larger the effective centrifuge radius, the smaller the maximum error in the vertical stress distribution.
Furthermore, since a specimen in centrifuge modeling rotates in a circular path, the equipotential lines across the model are curved. Therefore, in the center of the specimen, the material is subjected only to vertical stresses, whereas, elsewhere, it is subjected to both vertical and horizontal stresses. A field deposit primarily experiences self-weight stress in the vertical direction, but it is not exclusively controlled by this force, whereas a centrifuge model experiences stress in the horizontal direction as well. This horizontal stress component in the centrifugal model will result in an inherent horizontal stress modeling error. Hird [33] reports that, provided the specimen width in the centrifuge model is less than about 20% of the centrifuge effective radius, the error introduced due to the curvilinear stress distribution across the specimen is often deemed negligible.
In centrifuge modeling, high gravitational acceleration will enhance the particle segregation [21,34,35,36]. This would cause specimen behavior in the centrifuge model to differ from what was observed in the prototype due to segregation. When segregation occurs, neither the test findings nor a segregated soil is representative of the prototype material. Reducing the potential of segregation during centrifuge tests may require the following: (1) utilizing a reduced g-force, (2) testing the slurry-like materials using a multi-staged centrifuge testing, (3) waiting some time to allow the specimen to consolidate and gain some strengths before spinning, and (4) increasing the initial solids content of the tested material. Takada and Mikasa [21] and McDermott and King [24] recommend that, to prevent particle segregation, but without practical basis, the slurry-like materials should be prepared at initial water content equal to or less than twice its liquid limit.

3. Experimental Program

3.1. Test Materials

This study employed three distinct types of clay-rich oil sands tailings slurries, specifically referred to as FFT-91-10.8, FFT-89-7.8, and FFT-71-5.8. Table 1 shows the physical characteristics of the three oil sands samples used in this study.
Particle size distribution (PSD) analyses were carried out separately for the coarse fraction (>44 µm) and the finer particles (<44 µm) using the sieve analysis method [38] and laser diffraction method [39], respectively. The PSD data for each sample, based on three replicated measurements, is depicted in Figure 1a. The fines content, measured as particles smaller than 44 µm, was determined for each sample by sieve analysis. The fines content for the FFT-91-10.8, FFT-89-7.8, and FFT-71-5.8 samples was found to be 91.4%, 88.9%, and 70.7%, respectively. Additionally, the clay-sized fraction, representing particles smaller than 8 µm (from the laser diffraction particle size analysis), was determined and found to be 38.7%, 29.9%, and 23.8% for the respective samples.
Atterberg limits for all samples were determined according to ASTM D4318-17e1 [40], with the results summarized in Figure 1b, illustrating the plasticity chart, indicating high plasticity for both FFT-91-10.8 and FFT-89-7.8 and low plasticity for FFT-71-5.8.

3.2. Benchtop Centrifuge

The primary objective of conducting BTC testing is to replicate the consolidation process resulting from the self-weight of different oil sands tailings samples. The self-weight stress exerted on the soil is determined by the unit weight and thickness of the soil deposit. The principle of geotechnical centrifuge modeling is to replicate the same self-weight stress in a laboratory model as observed in a real-world commercial scenario of interest, while significantly reducing the consolidation time. Based on the aforementioned concept, two potential consolidation approaches may be followed. The first approach involves scaling laws to convert centrifuge test results to the prototype (real-world) scale. By setting the centrifuge test to match the desired effective stress level of the prototype model, this method enables the direct modeling of real-world scenarios using centrifuge test data. It eliminates the need for consolidation theory in result analysis, with one centrifuge test corresponding to one prototype model. The second approach used in the current study focuses on extracting consolidation parameters from the centrifuge test using large strain consolidation theory. These extracted parameters are subsequently compared with those obtained from the MLSC test. In this context, a detailed discussion on how to produce high-quality slurry samples, including the sample size, mode of loading, and the measurement of both hydraulic conductivity and compressibility, as well as the strengths and weaknesses of the MLSC test, was provided by Ahmed et al. [12] and Ahmed et al. [41], which can be referenced for further details. Rather than making direct prototype predictions, this approach employs an inverse procedure based on consolidation theory to derive material compressibility and hydraulic conductivity parameters from the centrifuge test results.
The BTC testing was carried out using a Beckman Coulter Avanti® J-26XP centrifuge, (Beckman Coulter, Inc. Brea, CA, USA) as shown in Figure 2. This centrifuge utilizes a swinging-bucket rotor (i.e., the JS-4.3 rotor, Beckman Coulter, Inc. Brea, CA, USA) capable of accommodating 4 × 250 mL sample bottles, which are commonly held in place by bottle adapters designed to fit inside of the rotor bucket, as shown in Figure 2. This results in a centrifuge radius (r) of 19.4 cm from the center of rotation to the bottom of the specimen. The specimen bottles utilized in this experiment are made of translucent high-density polyethylene. These bottles have an internal diameter of 5.8 cm and are typically filled to a height of ranging from 6 to 8.1 cm, as this range was found to provide optimal conditions for accurately tracking the supernatant water on top of the sample. With a slurry height (H) ranging from 6 to 8.1 cm within the bottle, the effective centrifuge radius (Re), which represents the distance from the center of rotation to the specimen’s initial mid-height throughout the rest of the paper, ranges from 15.35 to 16.4 cm. Consequently, the H/Re ratio exhibits a range of variability from 0.37 to 0.53, which might lead to an anticipated maximum error (i.e., H/6Re) in the stress profile that varies between 6% and 8.8% of the calculated prototype stress [31]. A constant rotational speed of 800 RPM (i.e., centrifuge rotations per minute) was employed for all tests for a known duration. This speed was determined through trial and error to identify a rate that would prevent segregation during spinning. The entire flight duration for the tested samples ranges from 27 to 41 h, during which the centrifuge test was stopped at predetermined intervals to measure the height of the interface, which represents the mud line between the tailings and the supernatant water. The interface height is determined by averaging six measurements taken around the circumference of the bottles. The interface heights can be accurately determined within a margin of 1 mm (with a fractional uncertainty of less than 1.6%) for sample heights ranging from 6 to 8.1 cm, using a metric ruler with graduated millimeter markings.

3.2.1. Determination of Consolidation Constitutive Relationships

Method #1: Initial Settlement Rate and Final Void Ratio Distribution

This approach would necessitate conducting several centrifuge runs at varying initial void ratios for each sample to be tested. In order to prevent particle segregation, each sample would be prepared at initial water contents equal to or less than twice its liquid limit [21,24]. During self-weight consolidation under single upward drainage, in the initial stages of the process, the velocity of the pore water relative to the solid skeleton in the upper part of the layer is equal in magnitude but opposite in direction to the settlement rate of the clay skeleton in the stagnant water [21]. The following Equation (3), initially proposed by Takada and Mikasa [21], and later modified by McDermott and King [24], can be employed to determine the hydraulic conductivity of a slurry–lime material undergoing self-weight consolidation within a centrifuge:
k = s ˙ ( 1 + e 0 ) N ( G s 1 )
where s ˙ is the initial settlement rate, e0 is the initial void ratio of the tailings, and Gs is the specific gravity. The initial settlement rate of the specimen was calculated by either drawing a tangent to the initial segment of the settlement interface curve, as illustrated in Figure 3, or by using Equation (4), which represents the best-fit hyperbolic curve that describes the measured settlement interface versus time response, as follows:
t s = 1 s ˙ + t s m a x
where s is the settlement interface at a given instant t and smax is the maximum settlement interface. Curve fitting was accomplished through the adjustment of values for s ˙ and smax. The goodness-of-fit of the curve was evaluated through regression analysis, revealing that the standard error of estimate (SEE) for the FFT-91-10.8, FFT-89-7.8, and FFT-71-5.8 samples was consistently below 14%, 8%, and 5%, respectively. Additionally, a visual inspection suggests that the fitted curves to the measured data are satisfactory. The utilization of the best-fitted curve enables a smooth settlement interface curve and facilitates its utilization for the subsequent analysis in the following sections.
When the centrifuge stopped, the supernatant water that covered the specimen was immediately suctioned out to prevent the swelling of the consolidated tailings specimen, and the specimen bottle was detached from the centrifuge. A 2 cm diameter undisturbed soil column at the center of the bottle was subsequently extracted along the entire length of the specimen using a thin-walled sharpened steel tube. The gravimetric water content of each 5 to 10 mm thick slice was measured via oven drying along its depth. Subsequently, the submerged unit weight, γ′, and void ratio (e) at each depth were computed based on the water content distribution, assuming full saturation.
The vertical effective stress profile was calculated by integrating N γ′ from the surface along the full depth of the sample. Consequently, the void ratio and vertical effective stress values were employed to determine the compressibility parameters A and B of the tailings. The individual contributions to the total vertical stress above the hydrostatic level are described by the formula suggested by McDermott and King [24], as follows:
σ = j = 1 M ω 2 2 ρ s ρ w 1 + e j ( r 2 j l o w e r r 2 j u p p e r )
where M denotes the total numeral of discrete linear slices, rj(upper) and rj(lower) represent the distance from the axis of rotation to the upper and lower surface of the j’th slice, ρs is the density of solids, and ρw is the density of water.

Method #2: Large Strain Consolidation Theory and Back-Analysis Technique

This method would require performing a single centrifuge experiment to acquire the settlement interface height and the distribution of the void ratio–effective stress at the conclusion of the centrifuge test for the sample to be tested. To address the non-linear relationship between the void ratio and effective stress data, which is indicative of the compressibility, the compressibility data were subjected to a fitting process using a power law function, as illustrated in Equation (6). This fitting procedure allowed for the determination of the consolidation parameters A and B. Thus, the hydraulic conductivity parameters C and D in Equation (7) could be determined through a back-analysis technique, aiming to achieve the closest match between the numerical predictions and the observed behavior during the BTC test. Several researchers have devised consolidation models for centrifuge finite strain to enhance the investigation and application of centrifuge tests for slurries and mine waste tailings [32,41,42]. The finite strain consolidation analysis (FSCA) software V2.1.2 [43] was applied herein to conduct numerical simulations of the identical centrifuge tailings models. FSCA is a one-dimensional software utilizing Gibson et al.’s [44] large strain consolidation theory. It is tailored for large strain consolidation analysis, specifically aimed at determining the rate and magnitude of settlement in tailings, slurries, and soft soils.
e = A σ B
k = C   e D
where A, B, C, and D are curve-fitted consolidation parameters. The process for this back-analysis utilizes the compressibility parameters A and B, as shown in Figure 4a. It involves iteratively adjusting the hydraulic conductivity parameters C and D in the FSCA numerical analysis until the numerical outcomes align with the interface settlement height obtained from the BTC test, as shown in Figure 4b. The FSCA simulations were designed to replicate the BTC experiment by assuming one-way drainage and instantaneous filling conditions.

4. Benchtop Centrifuge Testing Validation

This section begins with validation tests, including the modeling-of-models, segregation checks, and an analysis of the impact of centrifuge radius on the results, to assess the applicability of the BTC. Following this, experimental results obtained from the BTC tests are presented, alongside MLSC data for comparative analysis. Additionally, the consolidation constitutive relationships derived from the BTC tests are compared to those obtained from the MLSC tests.

4.1. Check for Segregation

Segregation poses a significant problem in centrifuge testing because the high gravitational acceleration can intensify particle separation. The segregated materials do not accurately represent the prototype material, resulting in unreliable test results [17]. Under the accelerated gravity conditions of centrifuge testing, even fine tailings–sand mixtures designed to prevent segregation can still segregate. However, for fine tailings without significant coarse particles, segregation can still occur under high gravitational acceleration. Therefore, it is important to monitor and check for segregation both during and at the conclusion of the centrifuge test.
The potential for segregation decreases with an increase in the tailings’ shear strength because a higher shear strength enhances particle cohesion, making particle separation more difficult. The tailings samples herein were prepared at an initial water content equal to or less than twice its liquid limit [21,24]. Because the benchtop centrifuge lacks the ability to visually detect sample segregation, additional specimen analyses are necessary to verify segregation. For instance, it is recommended to conduct Methylene Blue Index (MBI) measurements on both the upper and lower halves of the cored samples post-centrifuge testing to verify no segregation by assessing clay content, with a tolerance of 0.35 meq/100 g between the upper and lower halves. Table 2 presents the MBI results of the tested tailings samples.
The findings clearly indicate that preparing the sample with an initial water content equal to or less than twice its liquid limit effectively mitigated segregation at a rotational speed of 800 RPM. However, when the initial water content exceeded twice the liquid limit, segregation became increasingly apparent.

4.2. Modeling-of-Models

The “modeling-of-models” principle introduced by Ko [45] is used to validate the scaling law relationships. This method conducts three centrifuge tests on the same material, varying heights and accelerations to simulate the same field prototype deposit. Validation relies on accurately replicating the deformation, stress, and flow conditions, ensuring consistent responses across model scales and to validate the scaling relationships. Comparing the results from these tests, either at the end or intermediate stages of consolidation, confirms the internal consistency, examines model size effects, and establishes time-scale relationships [17,23]. This validation enhances the confidence in using centrifuge modeling to represent full-scale geotechnical behavior.
Modeling-of-model tests were carried out on the FFT-91-10.8 and FFT-71-5.8 samples, utilizing different rotational speeds of 800, 900, and 1000 RPM. Specimen heights varied from 3.8 to 7.3 cm, as shown in Table 3. These parameters—rotational speeds, spin times, and sample heights—were selected to replicate the following hypothetical prototype scenario: (i) an 8.2-m-deep deposit consolidating over a 25-year period for the FFT-91-10.8 sample, and (ii) a 7.5-m-deep deposit consolidating over a 25-year period for the FFT-71-5.8 sample.
Figure 5 presents the average void ratio across the specimens versus the prototype elapsed time based on the modeling-of-models’ spins. The average void ratio of the sample was determined from the average mudline interface settlement measured at specific intervals. Subsequently, the prototype elapsed time was calculated using Equation (2) by multiplying the centrifuge model time by the square of the gravity scale factor N2. The data followed a normal distribution, and the paired samples were independent with equal variances between groups. Consequently, an unpaired t-test was conducted using IBM® SPSS® software (IBM® SPSS® Statistics Premium 29) to assess the statistical significance of the difference between the data. For the FFT-91-10.8 and FFT-71-5.8 samples, the calculated value for any paired test was consistently greater than the significance level (=0.05), resulting in a failure to reject the null hypothesis. This indicates no statistically significant difference between the sample means, implying that any apparent differences in means are likely due to random variability rather than a true effect. Figure 5 validates the scaling laws for FFT samples, showing that geotechnical centrifuge modeling can assess their self-weight consolidation behavior. The results also indicate that the benchtop centrifuge yields consistent results, regardless of the specimen initial heights or the gravity scale factor.

4.3. Impact of the Ratio of Specimen Initial Height to Effective Centrifuge Radius

Earth’s gravity, often considered constant in numerous contexts, differs from the centrifugal acceleration level in a centrifuge, which is non-uniform and changes along the specimen’s height. This would result in a non-linear vertical stress distribution in the centrifuge model, with the non-linearity increasing as the H/Re ratio increases. However, Taylor [31] recommends that, if the initial specimen height is less than about 20% of the effective centrifuge radius, the variation in vertical stress distribution is acceptable. FSCA features a model known as “Research Models: Beam Centrifuge Quiescent Model”, enabling users to simulate centrifuge experiments virtually instead of conducting physical tests. This approach is faster, simpler, more cost-effective, and particularly well-suited for studying the impact of H/Re ratios. Consequently, FSCA software was utilized to simulate centrifuge runs at different H/Re ratios and to investigate the impact of the ratio of the specimen initial height to the effective centrifuge radius. The inputs required for FSCA include the initial model height, centrifuge radius, speed, spin time, initial solid content, specific gravity, and consolidation parameters. The initial solids content, specific gravity, compressibility parameters (A and B), and hydraulic conductivity parameters (C and D) were held constant, while the g-level and spin time were derived from the prototype height and consolidation time. An H/Re ratio of 15% was selected and compared to data from the BTC test at an H/Re ratio of 51% for both the FFT-91-10.8 and FFT-89-7.8 samples, and 40% for the FFT-71-5.8 sample, to simulate a hypothetical prototype scenario. This scenario included the following: (i) an 8.8-m-deep deposit consolidating over 56.8 years for the FFT-91-10.8 sample, (ii) an 8.7-m-deep deposit consolidating over 55.1 years for the FFT-89-7.8 sample, and (iii) a 7.5-m-deep deposit consolidating over 57.1 years for the FFT-71-5.8 sample. The 15% ratio corresponds to the Geotechnical Centrifuge Experimental Research Facility (GeoCERF) at the University of Alberta, which uses a geotechnical beam centrifuge with a 2-m radius [12,46]. This results in an effective centrifuge radius of approximately 1.83 m for this analysis, as shown in Table 4. Figure 6a illustrates the prototype height’s temporal variation from both the FSCA modeling and BTC testing, with a percent difference of less than 3% between the two methods, except for a very few anomalies, where the difference ranges from 4% to 6%. Figure 6b shows the temporal variation in the average void ratio from both the FSCA modeling and BTC testing, with the ratio between the two methods ranging from approximately 0.96 to 1.0.

4.4. Determination of Consolidation Parameters from Benchtop Centrifuge Test

The three FFT samples were tested using the BTC to determine their consolidation constitutive relationships and to validate its application for oil sands tailings. For each test, the BTC was operated at a constant rotational speed of 800 RPM. Each material was prepared with varying initial water contents. The initial water content for FFT-91-10.8 and FFT-89-7.8 ranged from 98% to 132%, while FFT-71-5.8 had an initial gravimetric water content ranging from 58% to 66%, as shown in Table 5. Two methods, detailed in Section 3.2.1, were employed to determine the constitutive relationships of the tested FFT samples.

4.4.1. Consolidation Constitutive Relationships from Method #1

Figure 7 presents the temporal variation in the settlement interface results, demonstrating how the initial water content affects the settlement behavior of the material. The initial hydraulic conductivity was estimated from the initial settlement interface, a nearly linear segment of the settlement curve. Assuming one-way drainage and consolidation caused only by self-weight, Equation (3) was used to determine the average hydraulic conductivity at the initial void ratio, as shown in Table 6. Since there are no established relationships for the behavior of soils under non-uniform acceleration, the hydraulic conductivity was calculated based on the acceleration experienced at the mid-height of the specimen, measured from the axis of rotation. This method reduces the errors related to the variations in acceleration commonly encountered in centrifuge modeling.
Figure 8 presents data from the three replicates, highlighting the relationships between the volume compressibility and hydraulic conductivity for the studied tailings. The results indicate a high degree of similarity among the measurements, considering the limits of experimental accuracy. The compressibility plots in Figure 8a indicate that the FFT-91-10.8 and FFT-89-7.8 samples are generally more compressible compared to the FFT-71-5.8 sample. In contrast, the hydraulic conductivity plots in Figure 8b show that the FFT-71-5.8 sample exhibits higher hydraulic conductivity than the FFT-91-10.8 and FFT-89-7.8 samples. This difference can be attributed to the lower fines content in the FFT-71-5.8 sample, in contrast to the higher fines content observed in the other two samples.

4.4.2. Consolidation Constitutive Relationships from Method #2

To implement this method, a single centrifuge experiment was conducted to determine the settlement interface height and the distribution of the void ratio–effective stress at the conclusion of the test for the sample being evaluated. The initial water contents selected were 127.8% for FFT-91-10.8, 132.7% for FFT-89-7.8, and 66.4% for FFT-71-5.8. Figure 9 shows that the FFT samples display behaviors consistent with the conclusions derived from Method #1. Moreover, the hydraulic conductivity trend observed in Method #2 shows similarities to that observed in Method #1, wherein FFT-71-5.8 exhibited higher hydraulic conductivity compared to both FFT-91-10.8 and FFT-89-7.8.

4.5. Benchtop Centrifuge Versus MLSC Test

The MLSC test was conducted on as-received samples in triplicate for each material, with the results representing the outcomes of these three replicates, as shown in Figure 10. The measured data show a significant level of similarity within the limits of experimental accuracy. The compressibility curves in Figure 10a indicate that the FFT-91-10.8 and FFT-89-7.8 samples have higher overall compressibility compared to the FFT-71-5.8 sample, likely due to factors such as a lower initial solids content and the presence of clay minerals. Furthermore, the hydraulic conductivity curves in Figure 10b reveal that the FFT-71-5.8 sample has higher hydraulic conductivity than the other FFT samples, which can be attributed to its lower fines content and higher sand content. The sand content acts as a filter by reducing the fines content within a given volume, which, in turn, influences the hydraulic conductivity; thus, an increase in the sand content relative to the total void ratio typically results in higher hydraulic conductivity.
Figure 11 compares the compressibility data derived from the benchtop centrifuge with those from the MLSC tests. The results show a substantial agreement between the compressibility data from the BTC test and the MLSC test, especially within the centrifuge’s stress range, except for FFT-89-7.8. In this instance, the compressibility values from the centrifuge experiment were slightly lower than those from the MLSC test.
Figure 12 compares the hydraulic conductivity data obtained from the BTC test with those from the MLSC tests. The results indicate that hydraulic conductivity, whether measured from the initial settlement interface or back-calculated, is consistently higher in the BTC test compared to the MLSC test. The hydraulic conductivity in the BTC test is approximately one order of magnitude greater than in the MLSC test. Additionally, the hydraulic conductivity trends from both measurement methods in the centrifuge are always consistent and represent the upper bound of the hydraulic conductivity values. The increased hydraulic conductivity observed in the centrifuge experiments compared to the MLSC test could be attributed to a few key factors. First, the higher-pressure gradient created in the centrifuge setup leads to an increased flow rate, which is directly proportional to the hydraulic conductivity, assuming the hydraulic gradient and other conditions remain consistent. Additionally, the centrifugal forces present in the centrifuge apparatus serve to accelerate the movement of interstitial water, which refers to water that is entrapped within the floc structure and moves with the floc or is held by capillary forces between particles [47,48]. Upon the disruption of flocs, this interstitial water converts to free water, and it is presumed that mechanical or other means, like centrifuges, can partially remove it by compressing the flocs and expelling the water. This increased acceleration can help overcome the effects of any low-hydraulic-conductivity zones within the soil sample and facilitates the release of this interstitial water. This, in turn, contributes to the higher flow rates and overall higher measured hydraulic conductivity in the centrifuge experiment compared to the hydraulic conductivity measured using the constant head test in the MLSC test. Third, a fabric level known as minifabric in finer-grained soils impacts the hydraulic conductivity, which could arise from soil structure changes during centrifugation. This minifabric consists of aggregates and interassemblage pores, which can be several tens of micrometers in diameter. Flows through these larger interassemblage pores are significantly higher compared to the smaller intra-aggregate pores [49]. Finally, when soil is saturated with a high-water content, the pore water pressure, which is the capillary pressure, exerts a compressive force. This capillary water occupies the larger pores fully, resulting in higher hydraulic conductivity, as water can flow more easily through the interconnected pore spaces [50]. This paper does not delve into the detailed investigation of the underlying reasons for these differences; however, similar trends have been observed in previous studies [17,51].
To address the non-linearity in compressibility and hydraulic conductivity in numerical modeling, Equations (6) and (7) were applied to define the hydraulic conductivity and compressibility of the tested oil sands tailings. Table 7 presents a summary of the consolidation parameters obtained from both the MLSC and BTC tests.

5. Practical Implications of Proposed Technique

Wall friction introduces experimental errors in geotechnical tests like MLSC and BTC tests, but its impact in centrifuge tests is scarcely addressed in the literature. Wong et al. [19] utilized specimens with a diameter-to-height ratio of 0.3 in bench-scale centrifuge tests. They observed that the influence of friction along the centrifuge tube wall on the density distribution was evident under both 1-g and N-g loading conditions, especially at elevations close to the specimen’s top surface. However, the density distribution across each elevation profile exhibits irregularities, yet the variation in density values throughout the profile remains minimal, typically less than 3%. Sorta et al. [23] utilized PASS centrifuge tests to examine how jar wall effects impact the settlement behavior, employing both standard and modified jars. The findings revealed comparable settlement behavior between the two jar types, with the modified jars displaying slightly lower average void ratios (1–6%) compared to the regular jars, indicating the negligible influence from wall effects. Typical guidelines for minimizing the impact in consolidation tests encompass maintaining a diameter-to-height ratio of 2:1, ensuring a diameter exceeding 10 cm, applying lubrication to the side walls, and adjusting for vertical effective stress to account for wall friction. The initial height of the sample in all of the MLSC tests in this study was selected to ensure that the diameter-to-height ratio exceeded 2.5:1 [52]. This was performed to minimize the wall friction, particularly when vertical effective stresses reached significant levels above 10 kPa.
While BTC can be a valuable tool for technology screening and initial assessments, its scale and experimental conditions may not fully capture the real-world, long-term consolidation behavior of tailings. As a result, relying solely on BTC findings for critical engineering decisions may lead to inaccuracies or misinterpretations. When comparing laboratory predictions to field data, challenges such as sample heterogeneity, boundary effects, and differences in stress paths between lab and field conditions must be considered. These factors can influence the accuracy of predictions, underscoring the importance of integrating both laboratory and field validations with BTC findings. This approach ensures a more comprehensive and reliable foundation for engineering design decisions.

6. Summary and Conclusions

An accelerated self-weight consolidation test was conducted using a benchtop centrifuge (BTC) on three oil sands tailings samples to compare their consolidation constitutive relationships with those derived from the multi-step large strain consolidation (MLSC) test. The following two methods were proposed for extracting consolidation parameters from the tested tailings: (i) Method #1 was based on the initial settlement rate and the final void ratio distribution, necessitating the preparation of each sample with different initial void ratios, and (ii) Method #2 was based on large strain consolidation theory and a back-analysis technique utilizing FSCA software, requiring the adjustment of hydraulic conductivity parameters C and D in the FSCA numerical analysis until the results matched the temporal variation in the interface settlement height observed in the benchtop centrifuge. Additionally, the validity of the benchtop centrifuge for the large strain consolidation testing of oil sands tailings was evaluated to confirm its applicability. Moreover, the characteristics and limitations of the benchtop centrifuge testing were discussed. Based on the findings of this study, the following conclusions can be drawn:
  • The testing procedure is straightforward for routine implementation in any laboratory.
  • The benchtop centrifuge testing technique demonstrates time efficiency in determining the compressibility and hydraulic conductivity of oil sands tailings over a desired range of effective stresses when using the two proposed methods.
  • The results indicate a strong agreement between the compressibility data obtained from the BTC test and the MLSC test. However, the hydraulic conductivity trend observed in the BTC test is similar to that of the MLSC test, but the actual values are an order of magnitude higher than the value obtained from the MLSC test.
    This suggests that, while the BTC test may overestimate the hydraulic conductivity, it still provides a useful dataset for the preliminary screening and evaluation of different tailings types, thereby reducing the number of samples required for the MLSC tests.
  • Generally, the FFT-91-10.8 and FFT-89-7.8 samples exhibited greater overall compressibility compared to the FFT-71-5.8 sample. Conversely, the FFT-71-5.8 sample displayed higher hydraulic conductivity than both the FFT-91-10.8 and FFT-89-7.8 samples. The sand content appears to function as a filter in the FFT-71-5.8 sample, which displaces the fines matrix, decreasing the fines content within a given volume, and thereby influencing the hydraulic conductivity. Consequently, as the sand content increases in relation to the total void ratio, the hydraulic conductivity also tends to increase.
  • Modeling-of-model tests conducted at varying rotational speeds consistently yielded similar average void ratio results irrespective of the specimen initial heights or the gravity scale factor.
  • Preparing the samples with an initial water content that was equal to or less than twice the liquid limit was found to prevent segregation. This was confirmed by measuring the clay content of the top and bottom halves of the cored samples using the Methylene Blue Index (MBI) method, which indicated there was no segregation present.
  • Specimens with initial specimen height-to-effective centrifuge radius ratios ranging from 0.4 to 0.51 were utilized in the benchtop centrifuge tests, compared to a ratio of 0.15 in the geotechnical beam centrifuge, which was simulated numerically. The influence of the H/Re ratio on the temporal variation in the prototype height was observed to exhibit less than a 3% difference at a fixed (prototype) time, and the ratio of average void ratios between the geotechnical beam centrifuge simulations and the BTC experimental results at a fixed (prototype) time ranged from 0.96 to 1.0.
  • This research demonstrates the efficacy of integrating FSCA numerical simulations and BTC testing with back-analysis to evaluate tailings consolidation parameters and to forecast their behavior. This integrated methodology enables the prompt identification of potential challenges, leading to significant efficiencies in cost and time, and enhances risk mitigation within the industry.
  • The BTC is a valuable tool for technology screening, including dewatering methods and treatment processes for improving tailings management and environmental performance. Despite the potential errors and limitations inherent in such tests, when all other factors are held constant across separate benchtop centrifuge (BTC) tests, the results can be valuable for comparing different technologies or methods.

Author Contributions

Conceptualization, M.A.; methodology, M.A.; software, M.A.; validation, M.A., N.A.B. and H.K.; formal analysis, M.A.; investigation, M.A.; resources, N.A.B. and H.K.; data curation, M.A.; writing—original draft preparation, M.A.; writing—review and editing, N.A.B. and H.K.; visualization, M.A.; supervision, N.A.B. and H.K.; project administration, N.A.B.; funding acquisition, N.A.B. All authors have read and agreed to the published version of the manuscript.

Funding

This research was funded by the Natural Sciences and Engineering Research Council of Canada and Canada’s Oil Sands Innovation Alliance (NSERC/COSIA) Industrial Research Chair in Oil Sands Tailings Geotechnique (IRCPJ 460863-18).

Data Availability Statement

The original contributions presented in this study are included in the article. Further inquiries can be directed to the corresponding author.

Acknowledgments

The authors gratefully acknowledge research and financial support from the Natural Sciences and Engineering Research Council of Canada and Canada’s Oil Sands Innovation Alliance (NSERC/COSIA) Industrial Research Chair in Oil Sands Tailings Geotechnique.

Conflicts of Interest

No conflicts of interest exist between the authors and publication of this work; none of the authors have any financial interests in the results presented. The sponsors had no role in the study design; in the collection, analysis and interpretation of data; and in the writing of the manuscript.

References

  1. Alberta Energy Regulator. State of Fluid Tailings Management for Mineable Oil Sands, 2022; Alberta Energy Regulator: Calgary, AB, Canada, 2023; p. 130.
  2. Government of Alberta. Oil Sands Facts and Statistics; Government of Alberta: Edmonton, AB, Canada, 2024.
  3. Brown, L.D.; Ulrich, A.C. Oil sands naphthenic acids: A review of properties, measurement, and treatment. Chemosphere 2015, 127, 276–290. [Google Scholar] [CrossRef]
  4. Kindzierski, W. Review of Health Effects of Naphthenic Acids; Canadian Electronic Library: Online, 2012. [Google Scholar]
  5. Hyndman, A.; Sawatsky, L.; McKenna, G.; Vandenberg, J. Fluid fine tailings processes: Disposal, capping, and closure alternatives. In Proceedings of the 6th International Oil Sands Tailings Conference, Edmonton, AB, Canada, 9–12 December 2018. [Google Scholar]
  6. OSTDC. De-licensing of Oil Sands Tailings Dams. Technical Guidance Document; University of Alberta: Edmonton, AB, Canada, 2014. [Google Scholar]
  7. Furnell, E.; Bilaniuk, K.; Goldbaum, M.; Shoaib, M.; Wani, O.; Tian, X.; Chen, Z.; Boucher, D.; Bobicki, E.R. Dewatered and stacked mine tailings: A review. ACS EST Eng. 2022, 2, 728–745. [Google Scholar] [CrossRef]
  8. Jeeravipoolvarn, S. Geotechnical Behavior of In-Line Thickened Oil Sands Tailings. Ph.D. Thesis, Department of Civil and Environmental Engineering, University of Alberta, Edmonton, AB, Canada, 2010; 431p. [Google Scholar]
  9. Pollock, G.W. Large Strain Consolidation of Oil Sand Tailings Sludge. Ph.D. Thesis, Department of Civil and Environmental, University of Alberta, Edmonton, AB, Canada, 1988. [Google Scholar]
  10. Scott, J.D.; Dusseault, M.B.; Carrier, W.D. Large-scale self-weight consolidation testing. In Consolidation of Soils: Testing and Evaluation; ASTM International: West Conshohocken, PA, USA, 1986. [Google Scholar]
  11. Suthaker, N. Geotechnics of Oil sand Tailings. Ph. D. Thesis, University of Alberta, Edmonton, AB, Canada, 1995. [Google Scholar]
  12. Ahmed, M.; Beier, N.A.; Kaminsky, H. A comprehensive review of large strain consolidation testing for application in oil sands mine tailings. Mining 2023, 3, 121–150. [Google Scholar] [CrossRef]
  13. Ahmed, M.; Beier, N.A.; Kaminsky, H. Assessing compressibility and hydraulic conductivity relationships of oil sands tailings derived from a combined constant-pressure filtration and incremental cake compression test. Can. Geotech. J. 2024. [Google Scholar] [CrossRef]
  14. Abu-Hejleh, A.N.; Znidarčić, D.; Barnes, B.L. Consolidation characteristics of phosphatic clays. J. Geotech. Eng. 1996, 122, 295–301. [Google Scholar] [CrossRef]
  15. Imai, G. Development of a new consolidation test procedure using seepage force. Soils Found. 1979, 19, 45–60. [Google Scholar] [CrossRef] [PubMed]
  16. Narvaez, G.; Wang, Y.; Chalaturnyk, R.; Zahabi, A.; Rennard, D. Assessment of self-weight consolidation of co-deposition deposits in the geotechnical beam centrifuge. In Proceedings of the Sixth International Oil Sands Tailings Conference (IOSTC 2018), Edmonton, AB, Canada, 9–12 December 2018; University of Alberta: Edmonton, AB, Canada, 2018. [Google Scholar]
  17. Sorta, A.R. Centrifugal Modelling of Oil Sands Tailings Consolidation. Ph.D. Thesis, University of Alberta, Edmonton, AB, Canada, 2015. [Google Scholar]
  18. Znidarčić, D.; Miller, R.; Van Zyl, D.J.; Fredlund, M.; Wells, S. Consolidation testing of oil sand fine tailings. In Proceedings of the Tailings and Mine Waste, Vancouver BC, Canada, 6–9 November 2011. [Google Scholar]
  19. Wong, C.K.; Hu, T.; Graham, M.; Wong, R.C. Feasibility study of using bench-scale centrifugation for segregation and consolidation behaviour of oil sands tailings products. Can. Geotech. J. 2023, 61, 16–30. [Google Scholar] [CrossRef]
  20. Bloomquist, D. Centrifuge Modeling of Large Strain Consolidation Phenomena in Phosphatic Clay Retention Ponds (Florida). Doctoral Dissertation, University of Florida, Gainesville, FL, USA, 1982. [Google Scholar]
  21. Takada, N.; Mikasa, M. Determination of consolidation parameters by selfweight consolidation test in centrifuge. In Consolidation of Soils: Testing and Evaluation; ASTM International: West Conshohocken, PA, USA, 1986. [Google Scholar]
  22. Scully, R.W.; Schiffman, R.L.; Olsen, H.W.; Ko, H.Y. Validation of consolidation properties of phosphatic clay at very high void ratios. In Sedimentation Consolidation Models—Predictions and Validation; ASCE: Reston, VA, USA, 1984. [Google Scholar]
  23. Sorta, A.R.; Dubash, N.; Moyls, B.; Webster, S.E.; Omotoso, O. Development of a small-scale geotechnical centrifuge. Int. J. Phys. Model. Geotech. 2024, 24, 189–201. [Google Scholar] [CrossRef]
  24. McDermott, I.; King, A. Use of a bench-top centrifuge to assess consolidation parameters. In Tailings and Mine Waste’98; CRC Press: Boca Raton, FL, USA, 1998. [Google Scholar]
  25. El-Shall, H.; Moudgil, B.; Bogan, M. Centrifugal modeling of the consolidation of solid suspensions. Min. Metall. Explor. 1996, 13, 98–102. [Google Scholar] [CrossRef]
  26. Reid, D.; Fourie, A.; Watson, S. Accelerated consolidation of soft clays and mine tailings using a desktop centrifuge. In Proceedings of the 15th International Seminar on Paste and Thickened Tailings, Sun City, Pilansberg, South Africa, 16–19 April 2012. [Google Scholar]
  27. Lehane, B.; O’Loughlin, C.; Gaudin, C.; Randolph, M. Rate effects on penetrometer resistance in kaolin. Géotechnique 2009, 59, 41–52. [Google Scholar] [CrossRef]
  28. Abdulnabi, A.; Amoako, K.; Moran, D.; Vanadara, K.; Aldaeef, A.A.; Esmaeilzadeh, A.; Beier, N.A.; Soares, J.B.P.; Simms, P. Evaluation of candidate polymers to maximize geotechnical performance of oil sands tailings. Can. Geotech. J. 2022, 59, 359–371. [Google Scholar] [CrossRef]
  29. Croce, P.; Pane, V.; Znidarcic, D.; Ko, H.Y.; Olsen, H.W.; Schiffman, R.L. Evaluation of Consolidation Theories by Centrifuge Modelling; Publication of Balkema (AA): Cape Town, South Africa, 1985. [Google Scholar]
  30. Schofield, A.N. Cambridge Geotechnical Centrifuge Operations. Geotechnique 1980, 30, 227–268. [Google Scholar] [CrossRef]
  31. Taylor, R. Centrifuges in modelling: Principles and scale effects (Chapter 2). In Geotechnical Centrifuge Technology; Taylor, R.N., Ed.; Blackie Academic & Professional: London, UK, 1995; pp. 20–34. [Google Scholar]
  32. Fox, P.J.; Lee, J.; Qiu, T. Model for large strain consolidation by centrifuge. Int. J. Geomech. 2005, 5, 267–275. [Google Scholar] [CrossRef]
  33. Hird, C.C. Centrifugal Model Tests of Flood Embankments; University of Manchester: Manchester, UK, 1974. [Google Scholar]
  34. Townsend, F.; McVay, M.C.; Bloomquist, D.G.; Mcclimans, S.A. Reclamation of Phosphatic Clay Waste Ponds by Capping. Volume 1: Centrifugal Model Evaluation of Reclamation Schemes for Phosphatic Waste Clay Ponds; Florida Institute of Phosphate Research: Bartow, FL, USA, 1986. [Google Scholar]
  35. Townsend, F.; Hernandez, J. Predictions of phosphatic clay consolidation by numerical and centrifugal models. Flocculation, sedimentation and consolidation. In Proceedings of the Engineering Foundation Conference, Sea Island, GA, USA, 27 January–1 February 1985; pp. 449–455. Available online: https://eurekamag.com/research/001/659/001659826.php (accessed on 1 February 2025).
  36. McVay, M.; Townsend, F.C.; Bloomquist, D.G.; Martinez, R.E. Reclamation of Phosphatic Clay Waste Ponds by Capping Volume 6: Consolidation Properties of Phosphatic Clays from Automated Slurry Consolidometer and Centrifugal Model Tests; Florida Institute of Phosphate Research: Bartow, FL, USA, 1987. [Google Scholar]
  37. Konert, M.; Vandenberghe, J. Comparison of laser grain size analysis with pipette and sieve analysis: A solution for the underestimation of the clay fraction. Sedimentology 1997, 44, 523–535. [Google Scholar] [CrossRef]
  38. ASTM C136/C136M-19; Standard Test Method for Sieve Analysis of Fine and Coarse Aggregates. ASTM International: West Conshohocken, PA, USA, 2019. [CrossRef]
  39. ASTM E3340-22; Standard Guide for Development of Laser Diffraction Particle Size Analysis Methods for Powder Materials. ASTM International: West Conshohocken, PA, USA, 2022. [CrossRef]
  40. ASTM D4318-17e1; Standard Test Methods for Liquid Limit, Plastic Limit, and Plasticity Index of Soils. ASTM International: West Conshohocken, PA, USA, 2017. [CrossRef]
  41. Bharat, T.V.; Ubaid, M. Analytical model for consolidation settlements under centrifuge environment. Can. Geotech. J. 2019, 56, 484–494. [Google Scholar] [CrossRef]
  42. Malengier, B.; Peiffer, H.; Di Emidio, G. One-dimensional model for large-strain consolidation in a bench-scale centrifuge. Transp. Porous Media 2016, 114, 675–693. [Google Scholar] [CrossRef]
  43. Bright Beacon Co., Ltd. Finite Strain Consolidation Analysis Software (FSCA). Available online: https://www.fscasoftware.com/ (accessed on 15 December 2024).
  44. Gibson, R.; England, G.; Hussey, M. The Theory of one-dimensional consolidation of saturated clays: 1. finite non-Linear consildation of thin homogeneous layers. Geotechnique 1967, 17, 261–273. [Google Scholar] [CrossRef]
  45. Ko, H.-Y. Summary of the state-of-the-art in centrifuge model testing. Centrifuges Soil Mech. 1988, 11–18. Available online: https://www.taylorfrancis.com/chapters/edit/10.1201/9781003079378-2/summary-state-art-centrifuge-model-testing-ko-hon-yim (accessed on 1 February 2025).
  46. Zambrano-Narvaez, G.; Chalaturnyk, R. The new GeoREF geotechnical beam centrifuge at the University of Alberta, Canada. In Proceedings of the ICPMG2014-Physical Modelling in Geotechnics: Proceedings of the 8th International Conference on Physical Modelling in Geotechnics 2014 (ICPMG2014), Perth, Australia, 14–17 January 2014. [Google Scholar]
  47. Vesilind, P.A.; Martel, C.J. Freezing of water and wastewater sludges. J. Environ. Eng. 1990, 116, 854–862. [Google Scholar] [CrossRef]
  48. Demoz, A. Compressive Stress Dewaterability Limit in Fluid Fine Tailings. Minerals 2023, 13, 1514. [Google Scholar] [CrossRef]
  49. Mitchell, J.K.; Soga, K. Fundamentals of Soil Behavior; John Wiley & Sons: New York, NY, USA, 2005; Volume 3. [Google Scholar]
  50. Lu, N.; Likos, W.J.; Luo, S.; Oh, H. Is the conventional pore water pressure concept adequate for fine-grained soils in geotechnical and geoenvironmental engineering? J. Geotech. Geoenviron. Eng. 2021, 147, 02521001. [Google Scholar] [CrossRef]
  51. Sun, J.; Davison, E. Scale of Consolidation Testing for Tailings Reclamation-Preferred Methods to Characterize Consolidation Properties. In Proceedings of the GeoMontréal 2024, Montréal, QC, Canada, 15–18 September 2024. [Google Scholar]
  52. ASTM D2435/D2435M-11 (Reapproved 2020); Standard Test Methods for One-Dimensional Consolidation Properties of Soils Using Incremental Loading. ASTM International: West Conshohocken, PA, USA, 2011. [CrossRef]
Figure 1. (a) Particle size distribution of the three oil sands tailings and (b) the Casagrande plasticity chart for all tailings samples.
Geotechnics 05 00018 g001
Figure 2. (a) Beckman Coulter Avanti® J-26XP centrifuge, (b) Beckman Coulter JS-4.3 rotor with sample bottles installed, and (c) BTC sample bottle filled with tailings (5.8 cm internal diameter).
Geotechnics 05 00018 g002
Figure 3. Determination of the initial settlement rate for one solid content of the tested samples.
Geotechnics 05 00018 g003
Figure 4. Matching the consolidation curve from FSCA numerical simulations with the curve derived from centrifuge modeling: (a) fitting power law function to the final void ratio–effective stress distribution and (b) fitting the FFT-91-10.8 numerical simulation interface height curve with the BTC modeling curve.
Geotechnics 05 00018 g004
Figure 5. Average void ratio vs. prototype elapsed time from the modeling-of-model tests: (a) FFT-91-10.8 and (b) FFT-71-5.8.
Geotechnics 05 00018 g005
Figure 6. Benchtop centrifuge versus geotechnical beam centrifuge modeling results: (a) prototype height and (b) average void ratio.
Geotechnics 05 00018 g006
Figure 7. Temporal variation in the settlement interface height for one replicate: (a) FFT-91-10.8, (b) FFT-89-7.8, and (c) FFT-71-5.8.
Geotechnics 05 00018 g007
Figure 8. Experimental data of the BTC test: (a) compressibility and (b) hydraulic conductivity.
Geotechnics 05 00018 g008
Figure 9. Estimation of the consolidation parameters from one replicate: (a) compressibility curves from the index properties profile, (b) fitting the BTC-measured interface height to the FSCA numerical simulation, and (c) back-calculated hydraulic conductivity–void ratio relationships.
Geotechnics 05 00018 g009
Figure 10. Experimental data of the MLSC test: (a) compressibility and (b) hydraulic conductivity.
Geotechnics 05 00018 g010
Figure 11. MLSC vs. BTC compressibility results for the tested oil sands tailings: (a) FFT-91-10.8, (b) FFT-89-7.8, and (c) FFT-71-5.8.
Geotechnics 05 00018 g011
Figure 12. MLSC vs. BTC hydraulic conductivity results for the tested oil sands tailings: (a) FFT-91-10.8, (b) FFT-89-7.8, and (c) FFT-71-5.8.
Geotechnics 05 00018 g012
Table 1. Initial characteristics of the as-received oil sands tailings samples.
PropertyFFT-91-10.8FFT-89-7.8FFT-71-5.8
ValueValueValue
Water chemistry Electrical conductivity (EC) (μS = cm)1500 115951534
Dissolved ions (mg/L)Na+ (218.7); K+ (25.3); Ca2+ (84.7); Mg2+ (39.2); Cl (41.6); NO3 (0); SO42− (428)Na+ (294.3); K+ (18.9); Ca2+ (42.8); Mg2+ (24.4); Cl (131.4); NO2 (3.7); SO42− (227.1)Na+ (311.3); K+ (22.5); Ca2+ (29.8); Mg2+ (20.4); Cl (122.6); NO2 (3.7); SO42− (7.8)
pH7.87.67.3
Alkalinity as mg/L CaCO3N/A367628
Index properties Specific gravity, Gs 2.50 ± 0.012.49 ± 0.012.26 ± 0.03
PSD > 44 mm (%) 7.39.8527
PSD < 44 mm (%) 91.488.970.7
PSD < 8 mm (%)—clay 238.729.923.8
Methylene Blue Index (MBI), (meq/100 g)10.87.85.8
Clay-sized from MBI (%)77.155.741.5
Liquid limit, wl (%) 60.55642
Plastic limit, wp (%)19.219.217.8
Plasticity index, PI (%)41.336.824.2
Initial solids content (%)19.625.434.3
Initial water content (%)410294192
Bitumen content, b (%)1.31.252.3
Fines content, fb (%)92.790.1573
Sand–Fines Ratio (SFR)0.050.120.41
Clay–Water Ratio (CWR)0.190.160.21
Notes: 1 based on publicly available data and was not directly measured; 2 when analyzing a laser PSD for the percentage of clay, it is advised to utilize a cutoff range of 5–8 microns [37].
Table 2. Summary of the benchtop centrifuge segregation check.
TailingsInitial Solids Content (%)Initial Water Content (%)MBI for Top Core (meq/100 g)MBI for Bottom Core (meq/100 g)Clay in Top Core (%)Clay in Bottom Core (%)Segregation Check
FFT-91-10.843.9127.88.78.962.263.7NO
45.2121.210.310.674.175.8NO
49.7101.28.38.559.561.3NO
FFT-89-7.840.1149.49.47.567.153.6YES
43132.68.78.662.562NO
45.3120.87.87.75655NO
48.8104.97.98.15758NO
50.697.68.27.958.857NO
FFT-71-5.85485.26.35.845.341.6YES (“Slightly segregated”)
60.166.46.36.245.544.3NO
62.560.06.16.445.945.5NO
63.258.26.2644.243NO
Note: the FFT-91-10.8 sample was not tested for segregation at a solids content of 46.3%.
Table 3. Testing characteristics for the modeling-of-models tests for the FFT-91-10.8 and FFT-71-5.8 samples.
TailingsRotational SpeedInitial Void RatioNhptpHSpin TimeFinal Void Ratio
RPM-gmYearscmHour-
FFT-91-10.88002.531138.2257.320.11.9
9002.531518.2255.49.21.89
10002.531938.2254.261.84
FFT-71-5.88001.51157.5256.514.51.24
9001.51537.5254.99.31.23
10001.51957.5253.881.22
Table 4. Summary of the prototype height and prototype time.
TailingsInitial Solids Content (%)hp (m)tp (Years)H (m)Rotational Speed (RPM)Re (m)H/Re (%)—BTCH/Re (%)—Beam Centrifuge
FFT-91-10.843.98.856.80.27125.171.835115
FFT-89-7.8438.755.10.27125.141.835114.9
FFT-71-5.860.17.557.10.27117.011.834014.7
Table 5. Summary of the BTC parameters.
Tailings Initial Water Content (%)Model Initial Height (cm)Gravity Scale Factor (N)Spin Time (Hour)Re (cm)H/Re
FFT-91-10.8127.87.911040.815.450.51
121.27.511236.115.650.48
116.08.111037.315.350.53
101.27.311331.615.750.46
FFT-89-7.8132.67.911139.415.450.51
120.87.811136.115.50.50
104.97.711130.315.550.50
97.67.811139.615.50.50
FFT-71-5.866.46.511637.616.150.40
60.06.411626.516.20.40
58.26.511639.616.150.40
Table 6. Summary of the BTC hydraulic conductivity derived from three replicates.
Tailings Initial Void Ratio (-)Initial Settlement Interface Rate (mm/min)Hydraulic Conductivity (m/s)
FFT-91-10.83.190.0843.54 × 10−8
3.030.0732.93 × 10−8
2.890.0582.27 × 10−8
2.530.0421.45 × 10−8
FFT-89-7.83.300.1677.28 × 10−8
3.000.0953.84 × 10−8
2.610.0401.46 × 10−8
2.430.0331.15 × 10−8
FFT-71-5.81.500.0143.94 × 10−9
1.360.0092.32 × 10−9
1.320.0071.85 × 10−9
Table 7. Compressibility and hydraulic conductivity parameters derived from both the MLSC and BTC tests.
TailingsTesting MethodInitial Solids Content (%)A [kPa−1]B [-]C [m/s]D [-]
FFT-91-10.8MLSC19.63.590−0.2437.0 × 10−113.315
BTC—M1Various *3.036−0.2174.0 × 10−103.864
BTC—M243.93.078−0.2371.33 × 10−104.104
FFT-89-7.8MLSC25.43.222−0.1936.0 × 10−113.684
BTC—M1Various *2.395−0.1844.0 × 10−116.211
BTC—M2432.976−0.2626.87 × 10−115.584
FFT-71-5.8MLSC34.31.861−0.1631.0 × 10−104.523
BTC—M1Various *1.658−0.1324.0 × 10−105.606
BTC—M260.11.697−0.1507.51 × 10−102.967
Notes: * M1 involves preparing samples with varying solids contents, so the A and B parameters represent the fitting curve for all data at these levels.
Disclaimer/Publisher’s Note: The statements, opinions and data contained in all publications are solely those of the individual author(s) and contributor(s) and not of MDPI and/or the editor(s). MDPI and/or the editor(s) disclaim responsibility for any injury to people or property resulting from any ideas, methods, instructions or products referred to in the content.

