Article

Pore Water Pressure Generation and Energy Dissipation Characteristics of Sand–Gravel Mixtures Subjected to Cyclic Loading

by
Abilash Pokhrel
1,2 and
Gabriele Chiaro
1,*
1
Department of Civil and Natural Resources Engineering, University of Canterbury, Private Bag 4800, Christchurch 8140, New Zealand
2
Beca Ltd., ANZ Centre 267 High Street, Christchurch Central City, Christchurch 8011, New Zealand
*
Author to whom correspondence should be addressed.
Geotechnics 2024, 4(4), 1282-1303; https://doi.org/10.3390/geotechnics4040065
Submission received: 16 November 2024 / Revised: 15 December 2024 / Accepted: 18 December 2024 / Published: 19 December 2024
(This article belongs to the Special Issue Recent Advances in Geotechnical Engineering (2nd Edition))

Abstract

At least 32 case histories have shown that liquefaction can occur in gravelly soils (both natural deposits and manmade reclamations) during severe earthquakes, causing large ground deformations and severe damage to civil infrastructures. Gravelly soils, however, pose major challenges in geotechnical earthquake engineering in terms of assessing their deformation characteristics and potential for liquefaction. In this study, aimed at providing valuable insights into this important topic, a series of isotropically consolidated undrained cyclic triaxial tests were carried out on selected sand–gravel mixtures (SGMs) with varying degrees of gravel content (Gc) and relative density (Dr). The pore water pressure generation and liquefaction resistance were examined and then further scrutinized using an energy-based method (EBM) for liquefaction assessment. It is shown that the rate of pore water pressure development is influenced by the cyclic resistance ratio (CSR), Gc and Dr of SGMs. However, a unique correlation exists between the pore water pressure ratio and cumulative normalized dissipated energy during liquefaction. Furthermore, the cumulative normalized energy is a promising parameter to describe the cyclic resistance ratio (CRR) of gravelly soils at various post-liquefaction axial strain levels, considering the combined effects of Gc and Dr on the liquefaction resistance.

1. Introduction

Usually, gravelly soils are considered to be less susceptible to liquefaction than sandy soils due to their high permeability. Nonetheless, nowadays, there is notable evidence of gravelly soil liquefaction case histories, mostly in alluvial fan deposits and reclaimed soils, as a result of major earthquake events around the world [1]. The reported liquefied gravelly soils typically consist of well–graded mixtures of sand and gravel with gravel content (Gc) ranging from 5% to more than 85% [2].
Despite the large number of case histories, gravelly soil liquefaction studies are still very limited as compared to the large body of research focusing on the liquefaction resistance of sands. Consequently, the current engineering practice of evaluating the liquefaction performance of gravelly soils typically relies on the assessment procedures developed for sands. Yet, widely adopted sand-specific empirical correlations do not work for gravelly soils and could mislead engineering assessments; that is, because the micromechanical soil structure varies depending on the amount of sand and gravel present in the soils, the soil’s mechanical response, cyclic strain development and liquefaction resistance also vary. Therefore, research focusing on better understanding the liquefaction characteristics of gravelly soils and developing gravel-specific liquefaction triggering analyses is much needed.
From systematic laboratory investigations on undisturbed [3,4,5], reconstituted well-graded [6,7,8,9,10] and gap-graded (i.e., sand–gravel mixtures, SGMs) [11,12,13,14,15,16,17,18] specimens of gravelly soils, the liquefaction resistance of a few gravelly soils has been evaluated and key factors affecting it have been identified. There is a general agreement that the liquefaction resistance of gravelly soils can be as low as that of clean sands; moreover, previous studies also suggested that it is significantly affected by two key factors, namely, relative density (Dr) and gravel content (Gc). While it is recognized that the liquefaction of gravels increases with increasing Dr, there are inconclusive and/or contradictory findings regarding the effect of Gc on the liquefaction resistance of gravelly soils [19]. The conflicting finding regarding the effects of GC on the liquefaction behavior is probably due to the inactive and active participation of gravel particles in the force chain network of the sand matrix; thus, the soil’s mechanical response of soils remains the same or it may differ. Due to the difference in such behavior, adopting Dr (or global void ratio) for the liquefaction assessment of such SGMs becomes problematic, in a similar manner to that found in other studies carried out on sand–silt mixtures [20]. Therefore, intergranular state frameworks such as the equivalent fraction density model [11] and skeleton void ratio [13] have been used to capture the collective effect of GC and Dr on the liquefaction resistance of SGMs. The equivalent void ratio proposed by Thevanayagam et al. [21] is also applicable to uniquely describe the liquefaction resistance of gravelly soils, as it captures the combined effects of both GC and Dr [2]. For the application of those state parameters to in situ (mix) soils, not only is detailed information on index properties and the amount of gravel particles present in such soils needed, but it is also necessary to quantify the active and inactive participation of gravel particles in such a soil matrix. Therefore, applying the intergranular state concept is not a straightforward procedure.
In the liquefaction assessment, the generation of pore water pressure during undrained cyclic loading is of particular interest. For gravelly soils, a few studies [7,8,13,22,23,24] analyzed the pore pressure generation pattern and compared it with sand-based results obtained by Lee and Albaisa [25]. Those experimental investigations show contradicting results; for example, the rate of pore water pressure generation in gravel is significantly higher than that in sand [8], but similar to that of sand if the SGMs have GC less than 60% [13]. Later, Hubler et al. [24] also indicated that the rate of pore pressure generation is close to the upper bound for sand, more dependent on GC, Dr and gradation than particle size for SGMs, as well as cyclic stress ratio (CSR) and particle angularity. Evans and Seed [22] and Haeri and Shakeri [23] both acknowledged that the pore water pressure development in gravel specimens is significantly affected by the membrane penetration effect. These conflicting results can be explained by the effect of particle gradation, Dr, GC and CSR, in a similar way to that found for sand–silt mixtures [26,27].
The energy-based liquefaction evaluation method (EBM), introduced by Davis and Berrill [28], followed by the semi-theoretical work of Nemat-Nasser and Shokooh [29], has proven to be a promising method for evaluating pore water pressure generation [30,31,32,33,34] and liquefaction potential [33,35,36,37,38,39] even for mixed types of soils (i.e., sand–silt mixtures) [26,40]. The level of excess pore water pressure generated under undrained cyclic loading is proportional to the amount of energy dissipation in the soil [41]. The normalized dissipated energy can be uniquely correlated with the pore water pressure generation irrespective of Dr, CSR and consolidation stress ratio [42], as well as fine content [40]. Similarly, the EBM approach shows the potential applicability to assess the liquefaction resistance of mixed types of soils by simultaneously capturing the effect of fine content and Dr [36,38,39,40]. Furthermore, the energy-based method has shown suitability in predicting pore pressure generation across different loading conditions [38], suggesting that EBM can effectively predict pore pressure in real-world scenarios, including those involving non-sinusoidal loading patterns typical of seismic events. Regardless of the amount of evidence that exists for sand and sandy soils, the EBM approach has yet to be applied for the assessment of pore water pressure generation and liquefaction resistance of gravelly soils.
Therefore, given the importance of finding a suitable approach to assess the liquefaction resistance and pore water pressure generation characteristics of gravelly soils by capturing the combined effect of GC and Dr, a series of isotropically consolidated undrained cyclic triaxial tests on SGM specimens with varying GC and Dr were conducted by the authors. The liquefaction resistance characteristics of the investigated SGMs have been described in detail in the work of Pokhrel et al. [2]. This paper mainly focuses on the pore water pressure generation characteristics (using the boundary curves obtained by Lee and Albaisa [25] for sand as well as the mathematical model proposed by Booker et al. [43] for sand as a comparison) and further examines the liquefaction resistance using the energy-based method (EBM) for liquefaction assessment developed by Kokusho et al. [36].

2. Test Materials and Procedure
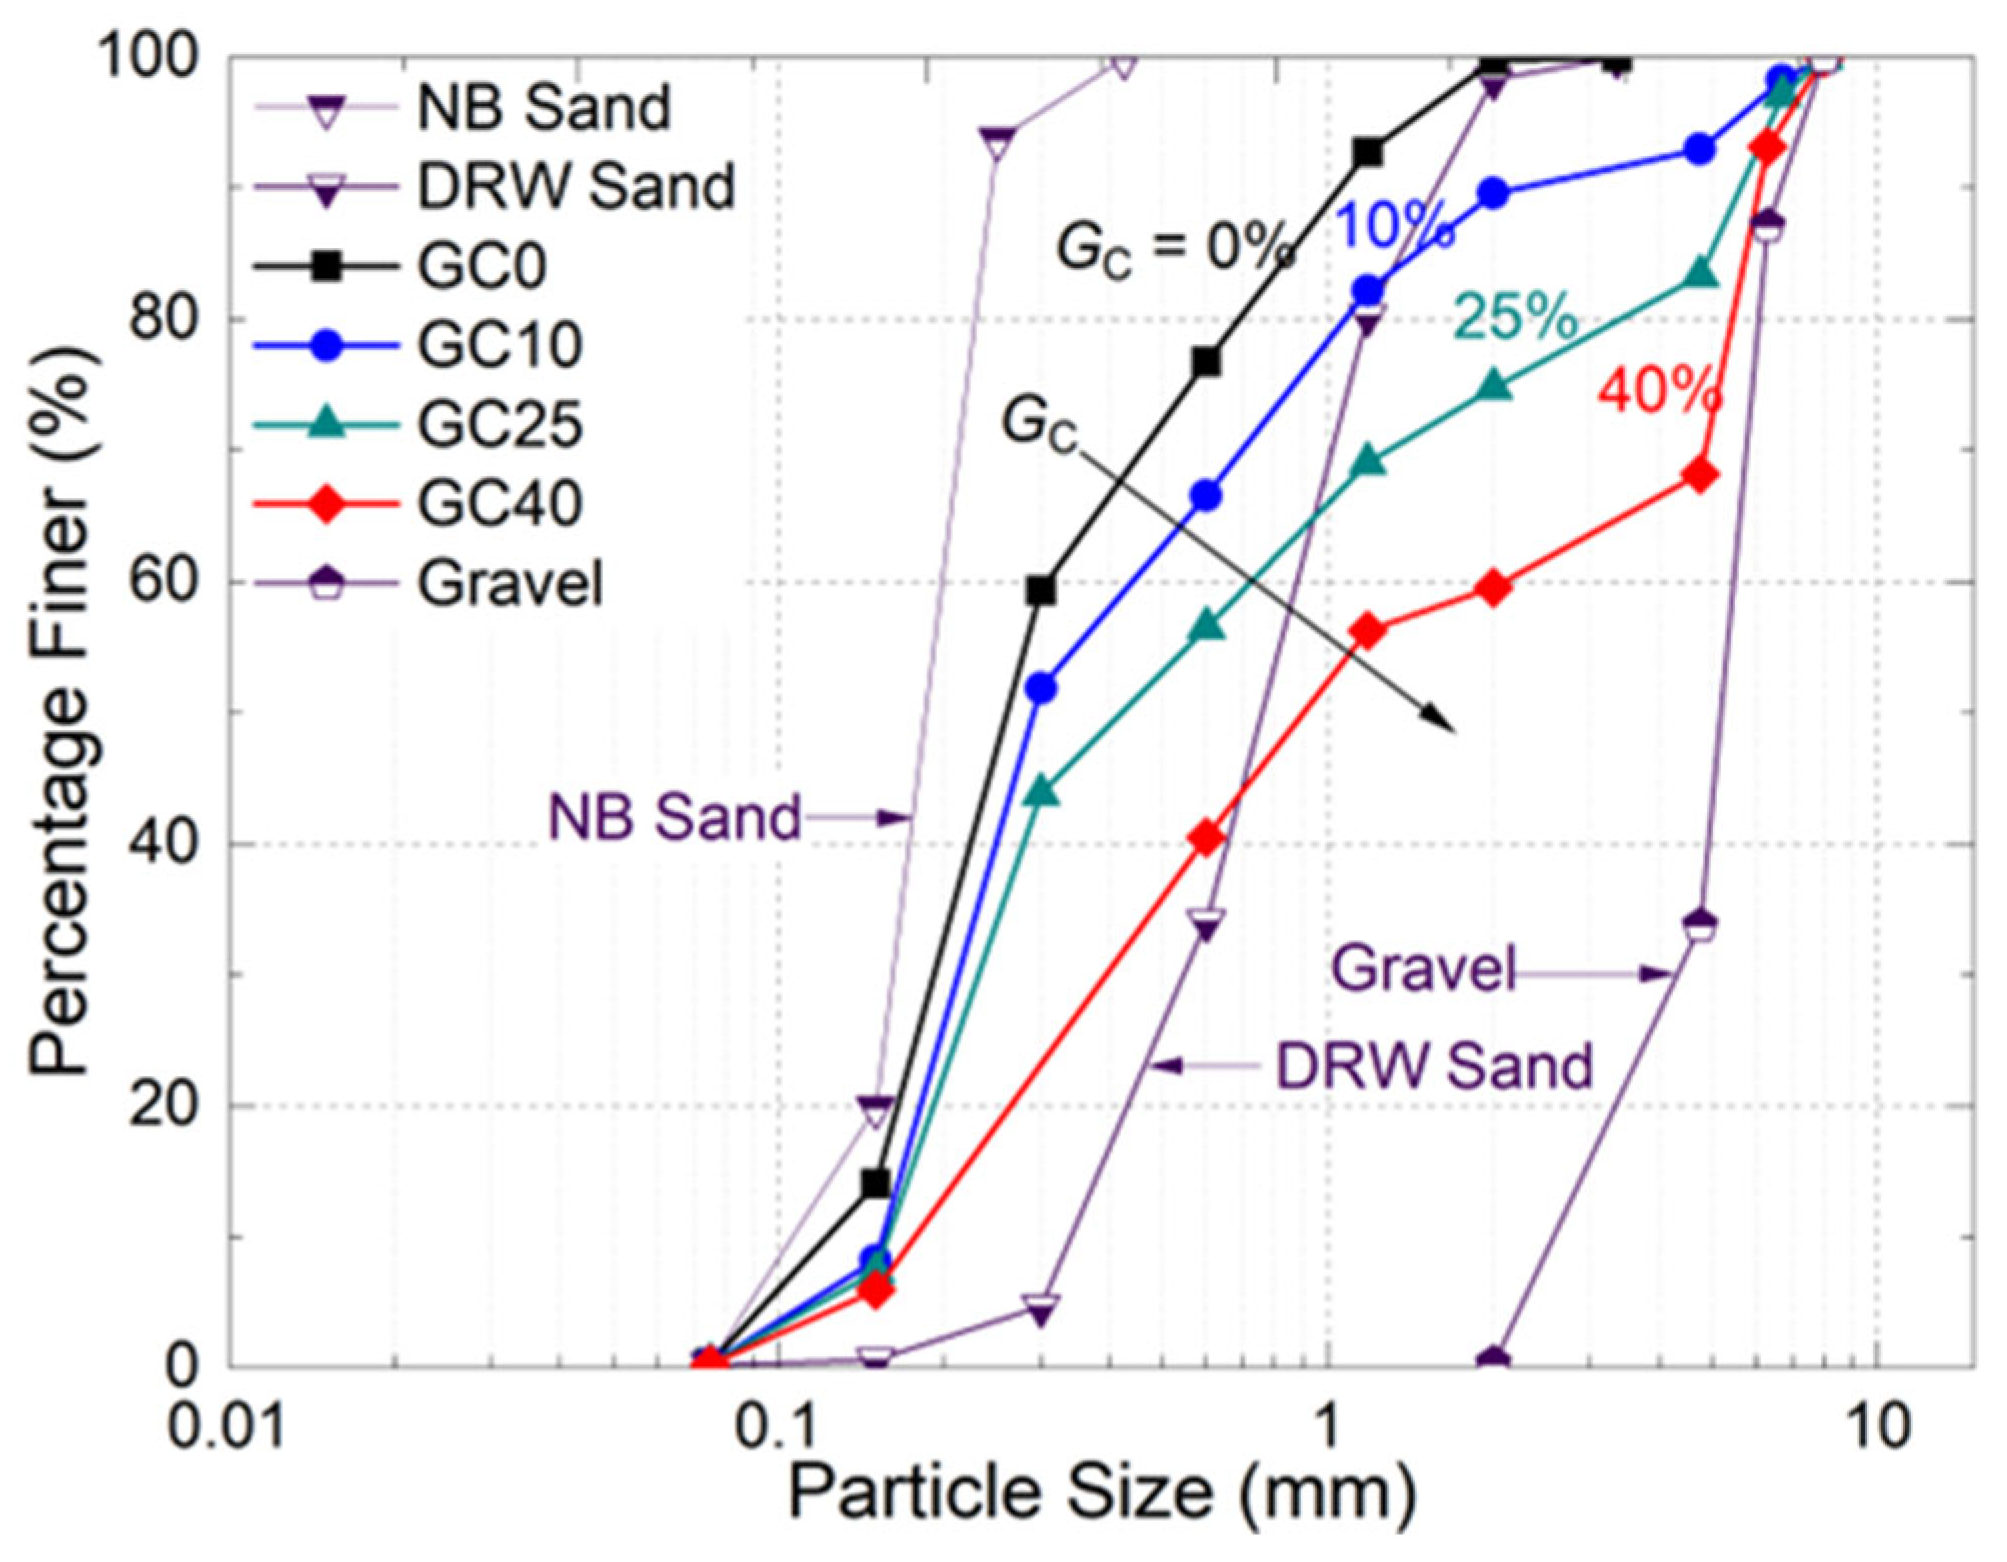
2.1. Materials

New Brighton sand (NB sand; mean diameter D50 = 0.2 mm; maximum diameter Dmax = 0.425 mm; specific gravity Gs = 2.66), Dalton River Washed sand (DRW sand, D50 = 0.75 mm; Dmax = 3.5 mm; Gs = 2.66), and rounded pea gravel (D50 = 5.5 mm; Dmax = 8 mm; Gs = 2.66) were the three materials used to undertake this study. The NB sand was collected from New Brighton Beach, Christchurch, New Zealand. Alternatively, DRW sand and pea gravel were commercially sourced. To ensure the testing materials were free from organic matter and unwanted chemicals, they were carefully washed with water and oven-dried.
The NB sand and DRW sand were mixed in equal proportion by mass (50:50) to produce a fine-to-medium reference sand. Then, the pea gravel was added to generate the desired SGM with a gravel content (GC) of 0, 10, 25, and 40% by mass. Figure 1 shows the particle size distribution curves of the parents’ materials and selected the SGM tested in this study.
The index properties of principal materials are listed in Table 1. The Gs of all the materials were obtained experimentally following JGS0111–2009 [44]. The minimum and maximum void ratios of the SGM were obtained experimentally utilizing a mold with a diameter of 200 mm and a depth of 200 mm following the JGS 0162–2009 [45]. Details are available in the work of Pokhrel et al. [2].

2.2. Test Procedure

In this study, reconstituted SGM specimens with a height of 130 mm and a diameter of 61 mm were prepared in 5 layers by adopting the wet tamping (WT) method. The required mass of mixed materials was calculated based on the dry density of the mix and the specimen size/volume. The materials were further divided into 5 equal-mass portions to obtain homogeneous specimens with uniform particle size distribution and required GC. The pre-weighed oven-dried SGMs were mixed with deaired water at a water content of less than 5%, as recommended by Ishihara [46]. Then, the moist material was placed inside a split mold by spoon and compacted at a predetermined Dr.
Carbon dioxide was circulated through the specimens, followed by water percolation and double vacuum saturation. During the saturation process, the cell and back pressures were slowly increased simultaneously with an increment of 5 kPa/min, keeping the effective stress at a constant level of 20 kPa. After confirming B values greater than 0.95, fully saturated specimens were then isotropically consolidated at a 100 kPa confining pressure under 200 kPa back pressure. Thereafter, stress-controlled undrained cyclic triaxial tests were performed at the frequency of 0.05 Hz using a pneumatic cyclic loading system. Specimens were sheared under cyclic stress ratios (CSR) ranging between 0.145 and 0.481.
Past studies on gravelly soils strongly recommended that the specimen’s diameter be around 6 to 8 times larger than the Dmax [11]. Considering the 61 mm diameter of the specimens and the 8 mm Dmax of tested materials, the ratio is close to 8 in this study. The list of 44 undrained cyclic triaxial tests conducted in this study is reported in Table 2. Full details of the test procedure, including the evaluation and correction for membrane force and penetration effects, are reported in the work of Pokhrel et al. [2].

3. Test Results and Discussions

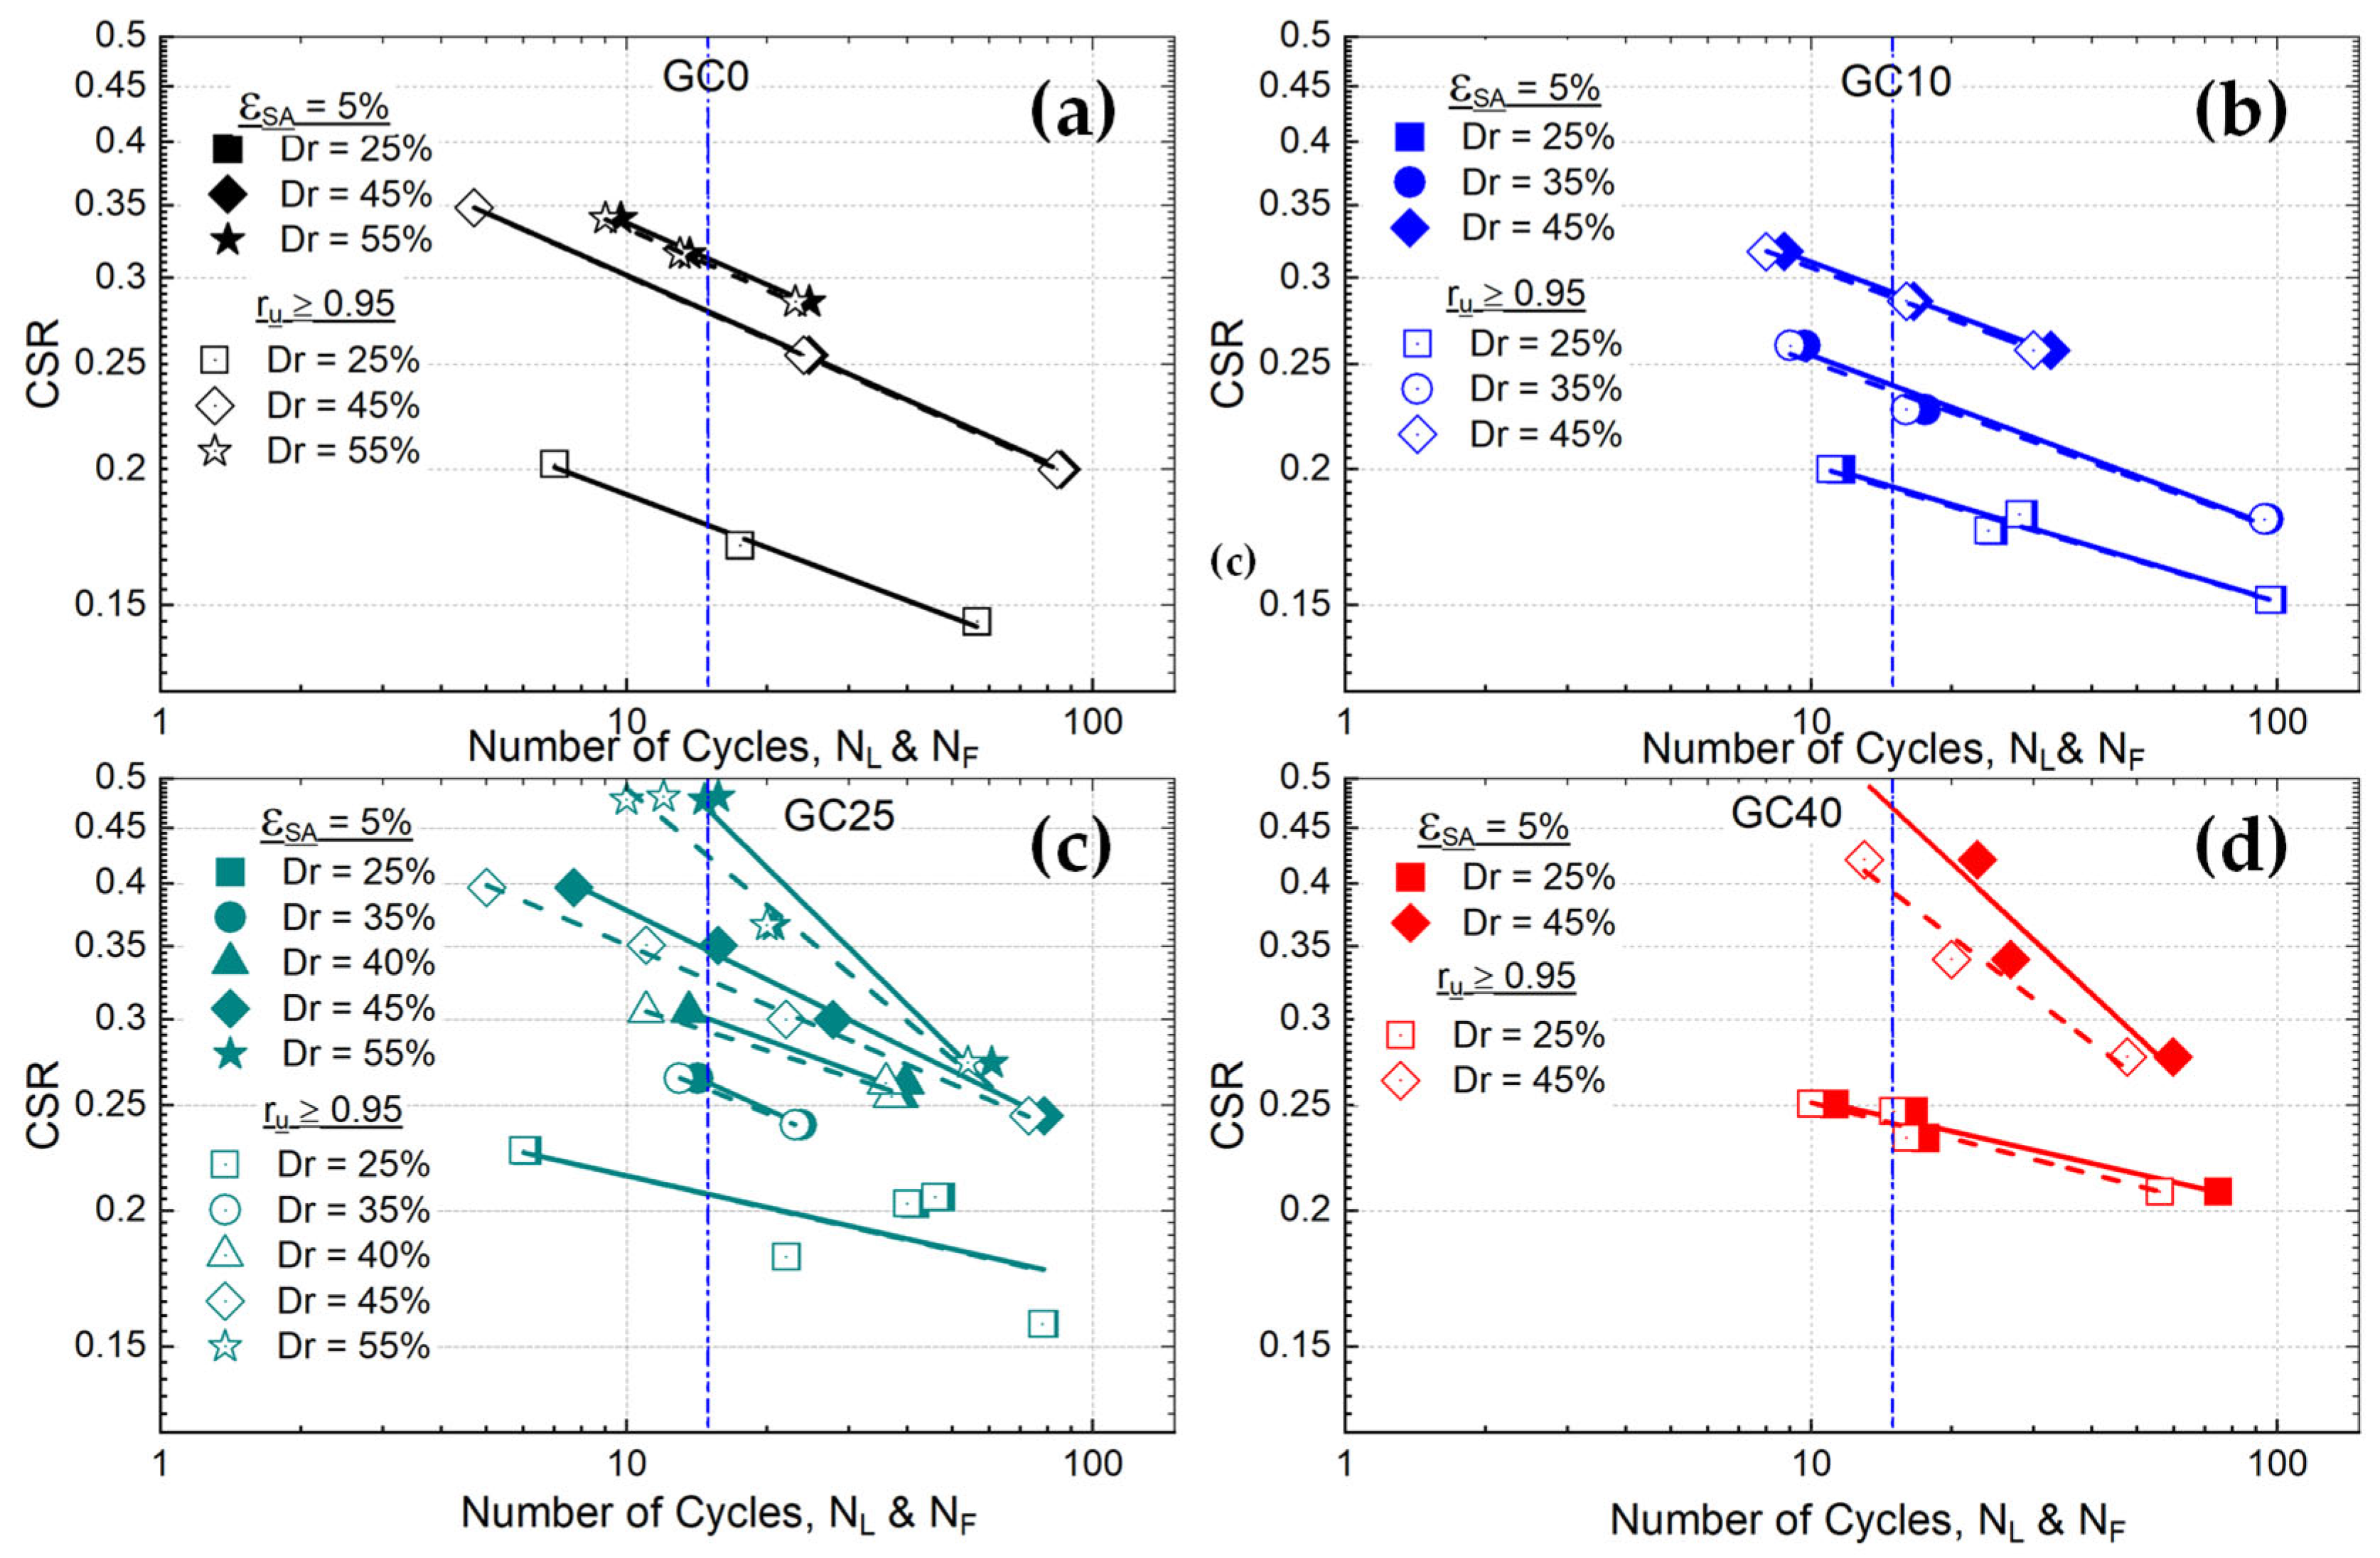
3.1. Cyclic Resistance

Typical triaxial test results have been reported by Pokhrel et al. [2], in terms of effective stress paths and stress–strain relationships, and thus are not reported here. Alternatively, the liquefaction resistance characteristics of the SGMs are presented in Figure 2 for completeness and to better support subsequent pore water pressure generation and energy dissipation analyses.
The CSR against the number of loading cycles to achieve the initial liquefaction (NL; based on pore water pressure ratio, ru ≥ 0.95) and to achieve the cyclic failure (NF; at 5% single amplitude axial strain, εSA = 5%, i.e., specimen failure condition assumed in this study) for the SGMs is presented in Figure 2, where Figure 2d correspond to GC = 0%, 10%, 25% and 40%, respectively. The CSRNL and CSRNF data points generally overlap each other for the lower GC and Dr values, as shown in Figure 2a,b. However, for higher GC and Dr values (Figure 2c,d), NF data points are found to be higher than NL, indicating that in those conditions, the specimens further developed axial strain even after the liquefaction state is achieved.
The CSRNL or CSRNF can be approximated by the following power-form function:
C S R = a   N L b
C S R = a   N F b
where a and b are the fitting parameters (for the tested SGMs, the values of a and b can be found in Pokhrel et al. [2]).
In the reported log–log plots, the trends for CSRNL and CSRNF given by Equation (1a,b) are linear and distinct for the different testing conditions. Such trends shift upwards with increasing GC and Dr, indicating that the position of the liquefaction resistance curve of an SGM is significantly influenced by both GC and Dr. Considering that 15 loading cycles are frequently employed in the literature to estimate the cyclic stress ratio (CRR15) in stress-based approaches [47], the CRR15 values for NL and NF (i.e., CRRL and CRRF) have been estimated for the SGMs and are reported in Table 2.

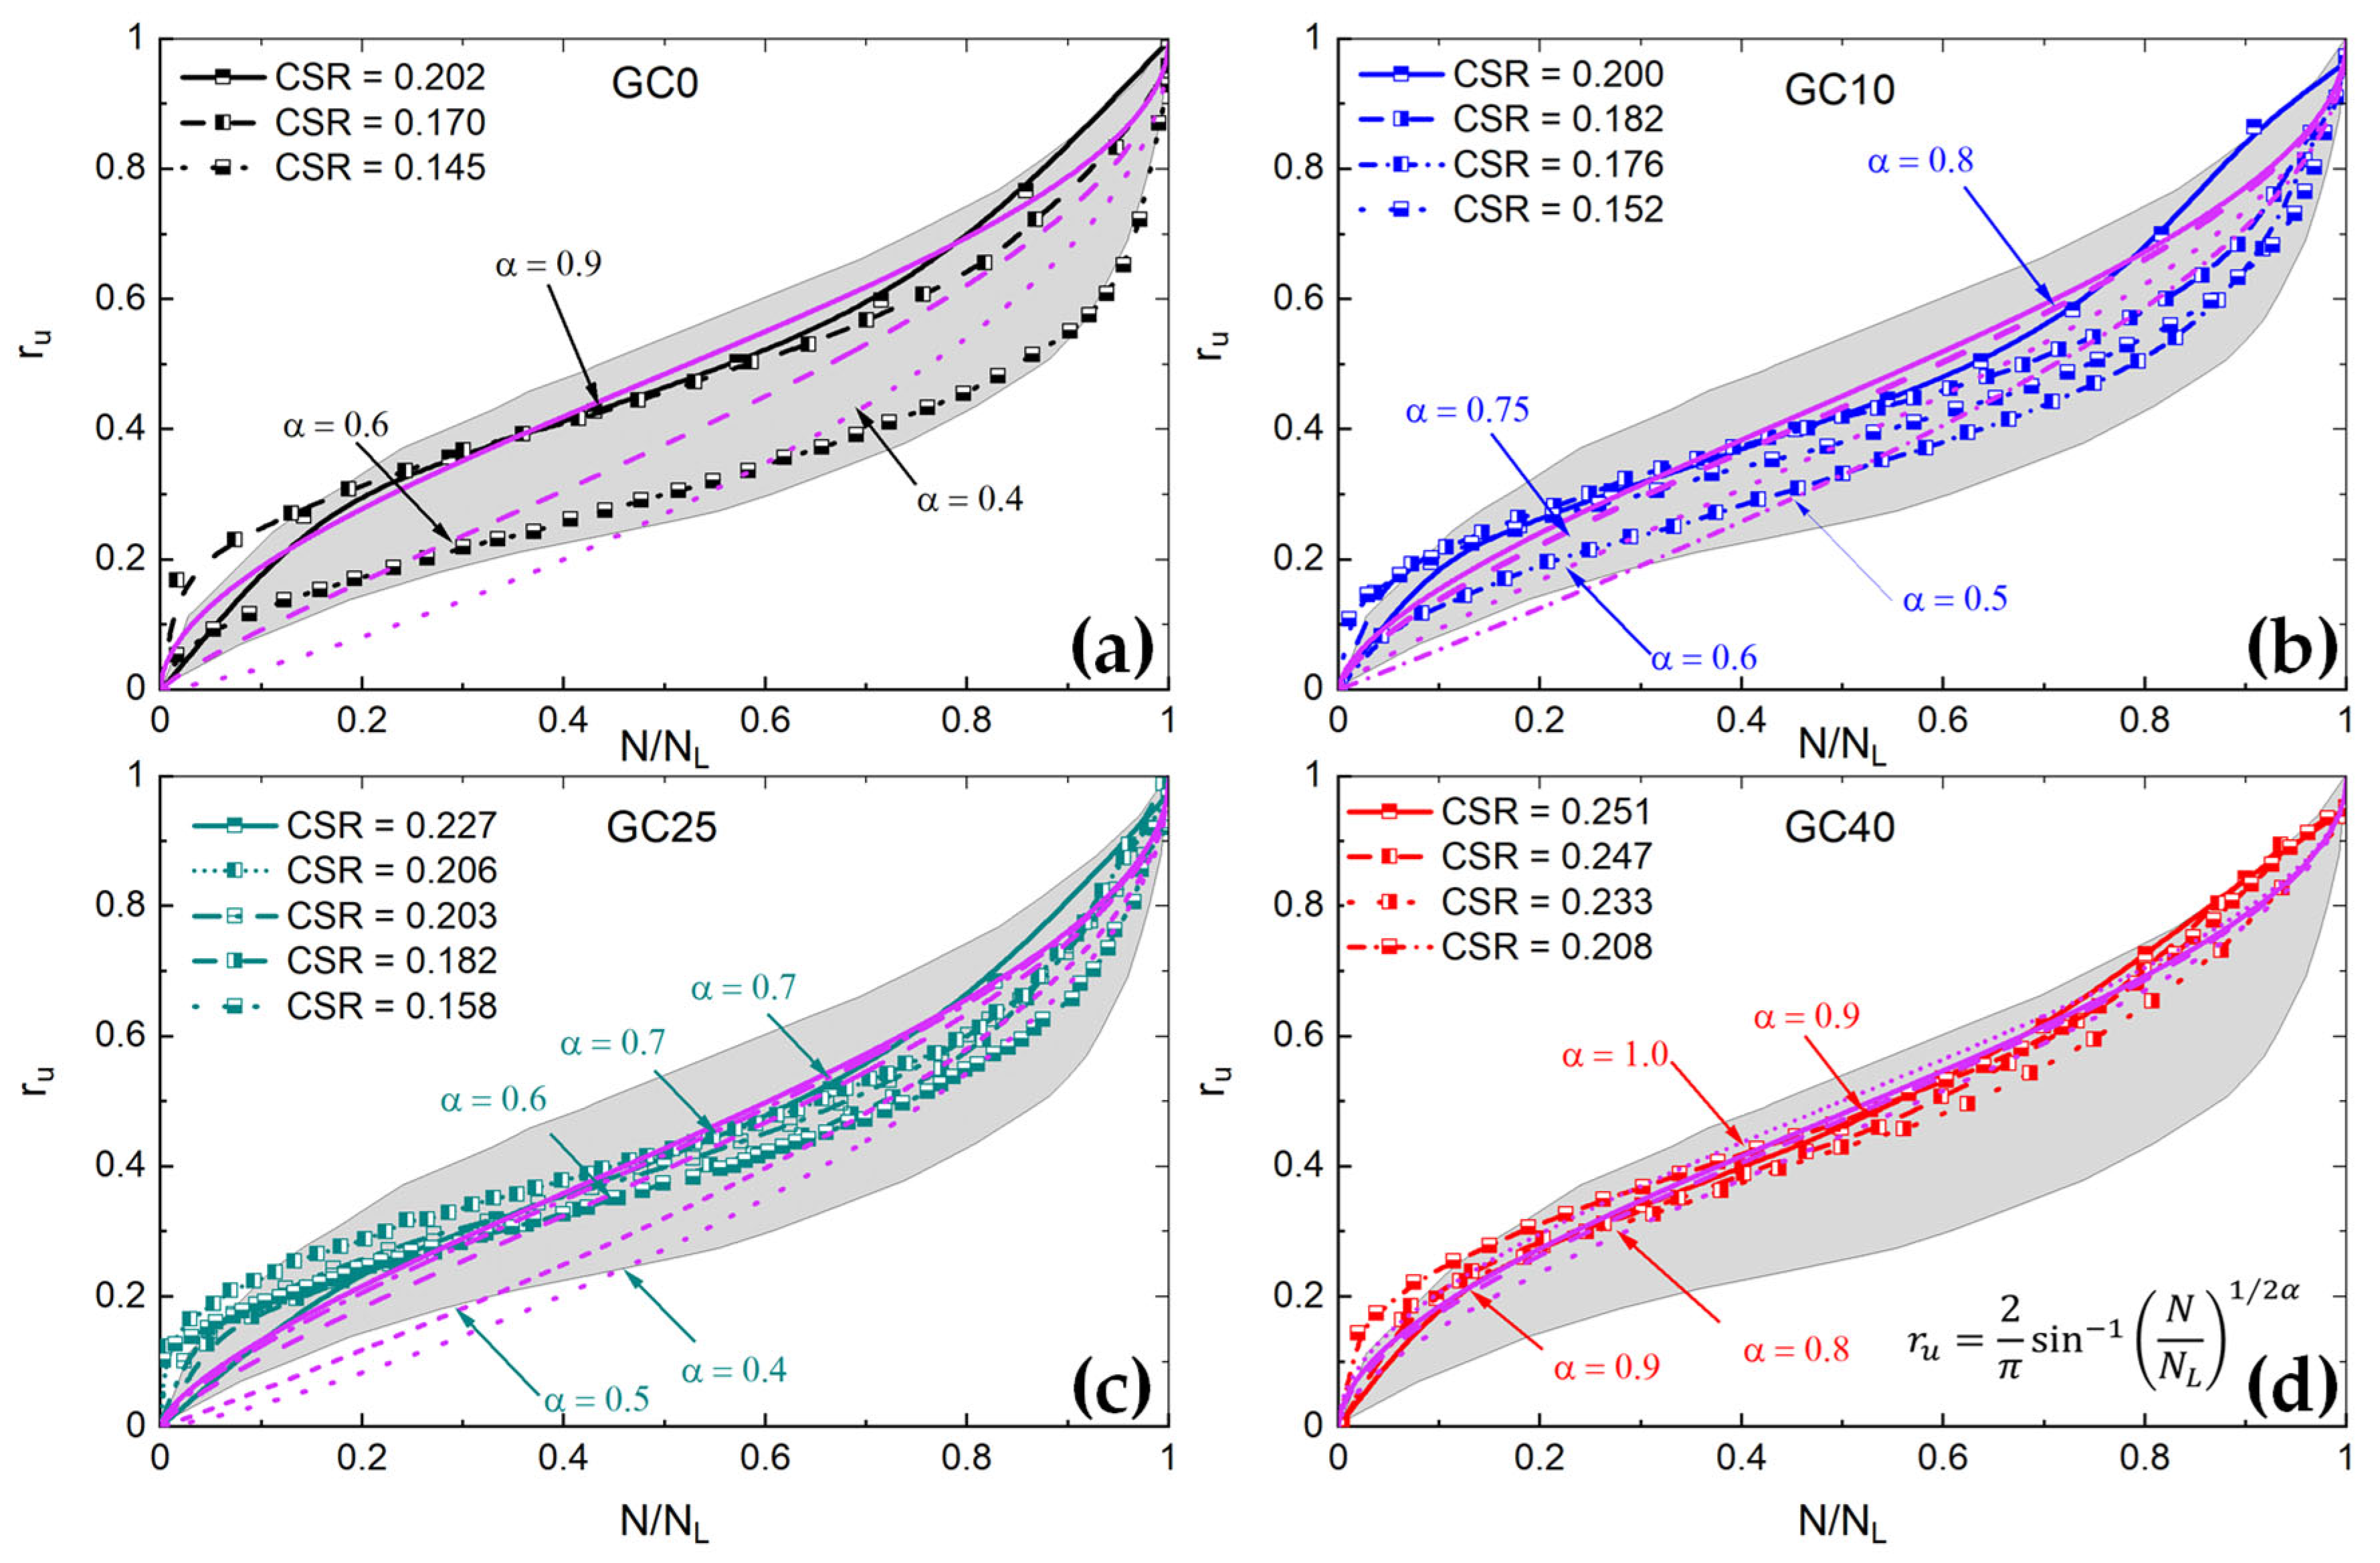
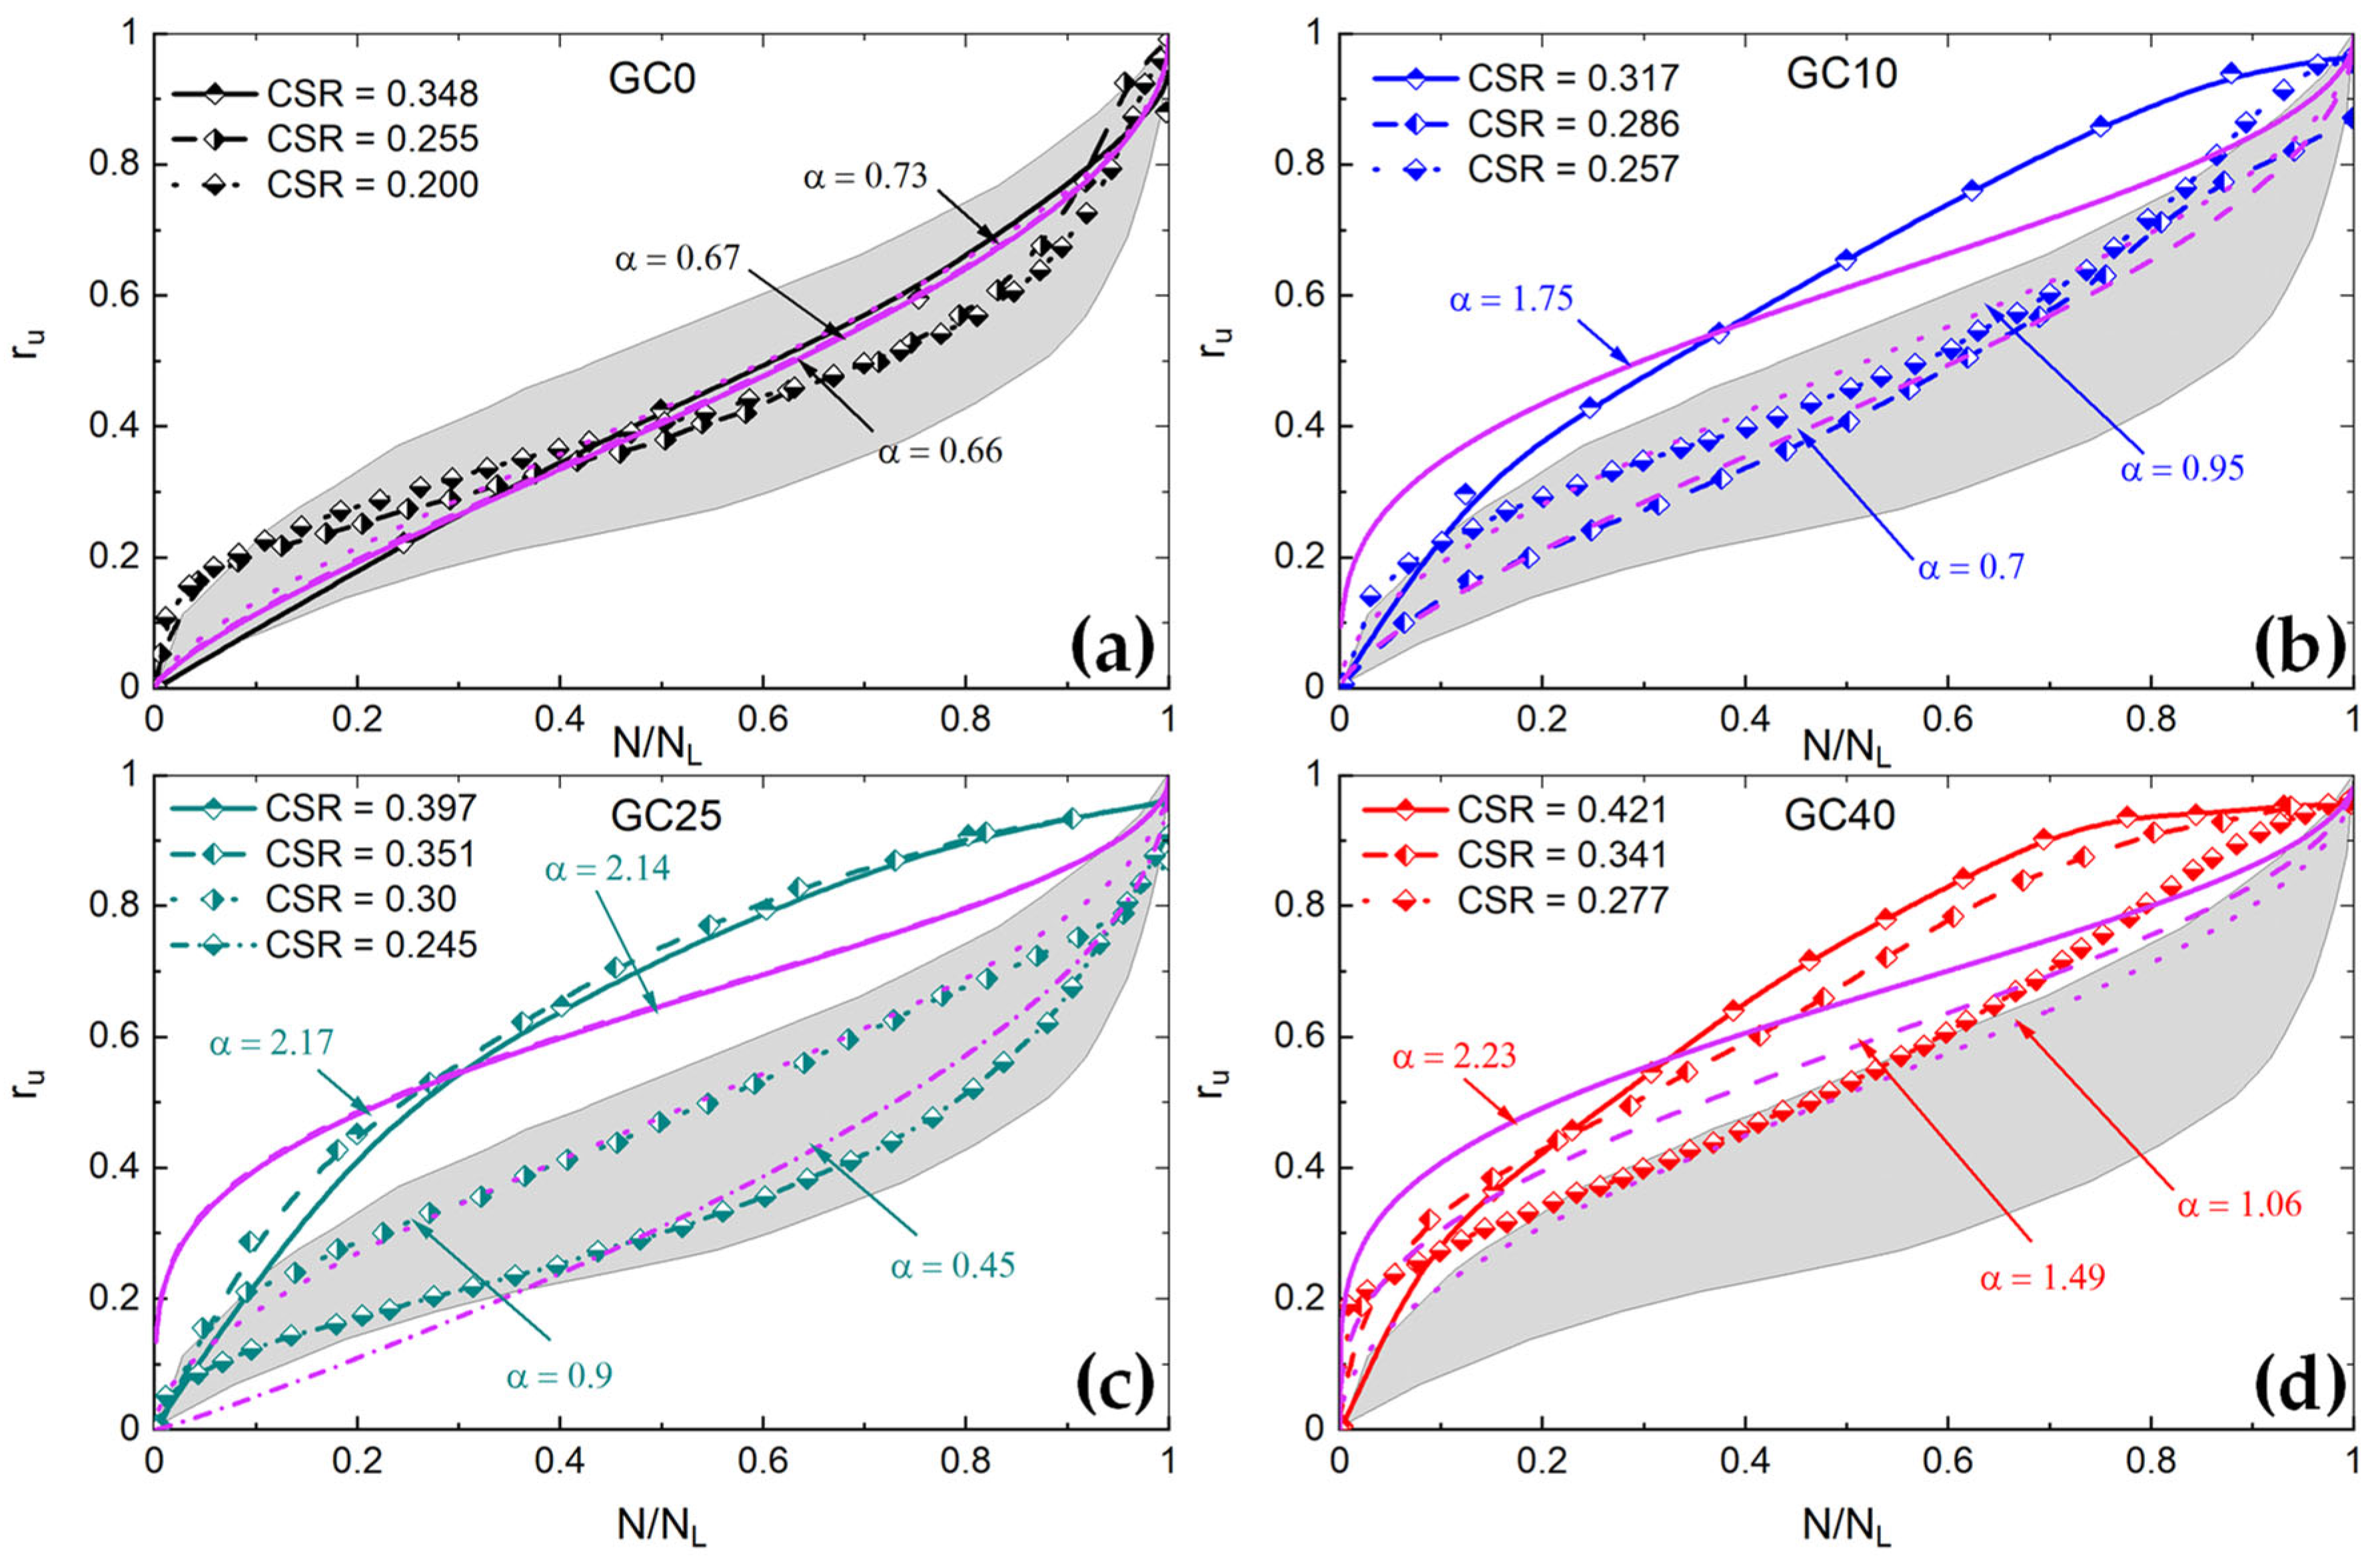
3.2. Pore Water Pressure Generation

In this study, the pore water pressure generation of all the SGM specimens was analyzed, and comparisons were made to assess the effect of GC, Dr and CSR.
The typical development of the pore water pressure for loose SGMs (Dr = 26–30%) with various GC is presented in Figure 3. The transient pore water pressure (ru,T, which represents the real-time change in ru during cycling loading) is plotted in solid lines, and the residual pore water pressure (ru,R, which is measured at the end of each loading cycle when the deviatoric stress goes back to zero) is indicated by symbols. While the ru,T varies in the range of 0.5 to 1.0 for all the SGMs, the range of ru,R is narrowed to 0.93–1.0.
For specimens with GC = 0 and 10%, no noticeable axial strain developed is observed until ru becomes equal to 0.80 or more, even though the ru develops uniformly. Then, the axial strain suddenly increases, and the specimen fails in just one to two additional loading cycles. εSA = 5% and ru ≥ 0.95 are reached almost simultaneously, showing a liquefaction behavior typical of loose sand.
In contrast, the SGMs with GC = 25 and 40% show different axial strain and ru responses. Both the axial strain and ru increase gradually until ru reaches 0.95 or more. Following, the axial strain continues to increase gradually before the specimen fails in an additional 16 loading cycles for the SGMs with GC = 40%. Despite the specimens being loose, their cyclic response is similar to that of dense sand.
The variation in ru for loose SGM specimens is presented in Figure 4 together with the boundary curves proposed by Lee and Albaisa [25] for Monterey sand.
In laboratory stress-controlled undrained cyclic triaxial tests, ru is usually related to the number of loading cycles to achieve initial liquefaction, NL [48]. The ru pattern for SGMs can be approximated by using the mathematical model proposed by Booker et al. [43] shown in Equation (2):
r u = 2 π s i n 1 N N L 1 2 α
where N is the number of loading cycles, and α is a parameter accounting for the soil properties and test conditions.
In Figure 4, the solid lines represent the ru,R of the tested SGMs, while the fitting curves are shown as dotted lines. The experimentally obtained rate of ru generation is found to be higher, at the initial and final stages of the tests, than predicted. It can be also noticed that the test results fall inside the boundary curves reported by Lee and Albaisa [25] for clean sand. The values of α obtained for GC = 0, 10, 25 and 40% are 0.9, 0.8, 0.7 and 1.0, respectively, and, thus, close to the value of α = 0.7 recommended by Seed et al. [48] for clean sand.
Figure 5 and Figure 6 show the ru generation at different CSR conditions for SGMs prepared at Dr = 26–33% and 47–54%, respectively. The fitting curves are also reported, and the corresponding α values are specified. It is observed that the Booker et al. [43] model conforms well with the variation in ru with the normalized number of stress cycles (N/NL) for all the tested SGMs and both Dr conditions, yielding coefficient of determination (R2) values exceeding 0.85 in all cases. The values of α obtained by the curve fitting method are generally higher for higher CSR values, indicating the dependency of ru generation on CSR. The values of α for Dr = 27–33% fall in the range of 0.4–1.0, as shown in Figure 5a–d, the upper bound value of 1.0 being for GC = 40% (Figure 5d) and the lower bound value of 0.4 being for GC = 0 and 25% (Figure 5a,c). For GC = 0%, the average value of α is close to 0.7 for both Dr conditions, which is consistent with the recommended value of 0.7 for clean sand [48]. However, for other GC configurations, the value of α is much higher for Dr = 47–54%. The maximum value of α is 2.23 for GC = 40% (Figure 6d), and 0.7 is the minimum for GC = 0 and 10% (Figure 6a,b). However, in the case of Dr = 47–54%, the fitting lines show a lower level of consistency with the experimental results. This is consistent with Haeri and Shakeri’s [23] study. Overall, the mathematical model proposed by Booker et al. [43] can be conveniently used to describe the pore water pressure generation for various SGMs with different GC and Dr as it yields R2 values greater than 0.85 (41 out of 44 tests), with the majority being over 0.9 (36 out of 44 tests) as reported in Table 2.
Figure 7 compares the upper and lower ru generation curves from this study with those reported in the literature for gravel and SGMs [8,23,49]. It also includes the curves for Monterey sand by Lee and Albaisa [25]. The lower bound curve from this study is similar to that for clean sand by Lee and Albaisa [25]. Instead, the upper bound curve is closer to the results of Haeri and Shakeri [23]; this curve shows that the ru generation increases rapidly in the first few cycles of loading, and then flattens after reaching an ru value greater than 0.8. From the plot, it is evident that the ru generation of gravel and gravelly soil mixtures may vary over a wide range of values. The differences can be partially explained by the different gradation characteristics of the tested material [24]. It strongly depends on the coefficient of uniformity (Cu) of the gravel and SGMs, and its location shifts up with increasing Cu: i.e., Cu = 1.6 [49], Cu = 2.5 to 11.8 (this study), Cu = 28 [23], and Cu = 47 [8]. By further scrutinizing the upper bound curves of the various materials, it can be said that naturally deposited gravelly soils, which have higher Cu compared to the clean sands, would have a higher rate of ru generation in the first few cycles of seismic loading.

4. Energy Dissipation Approach

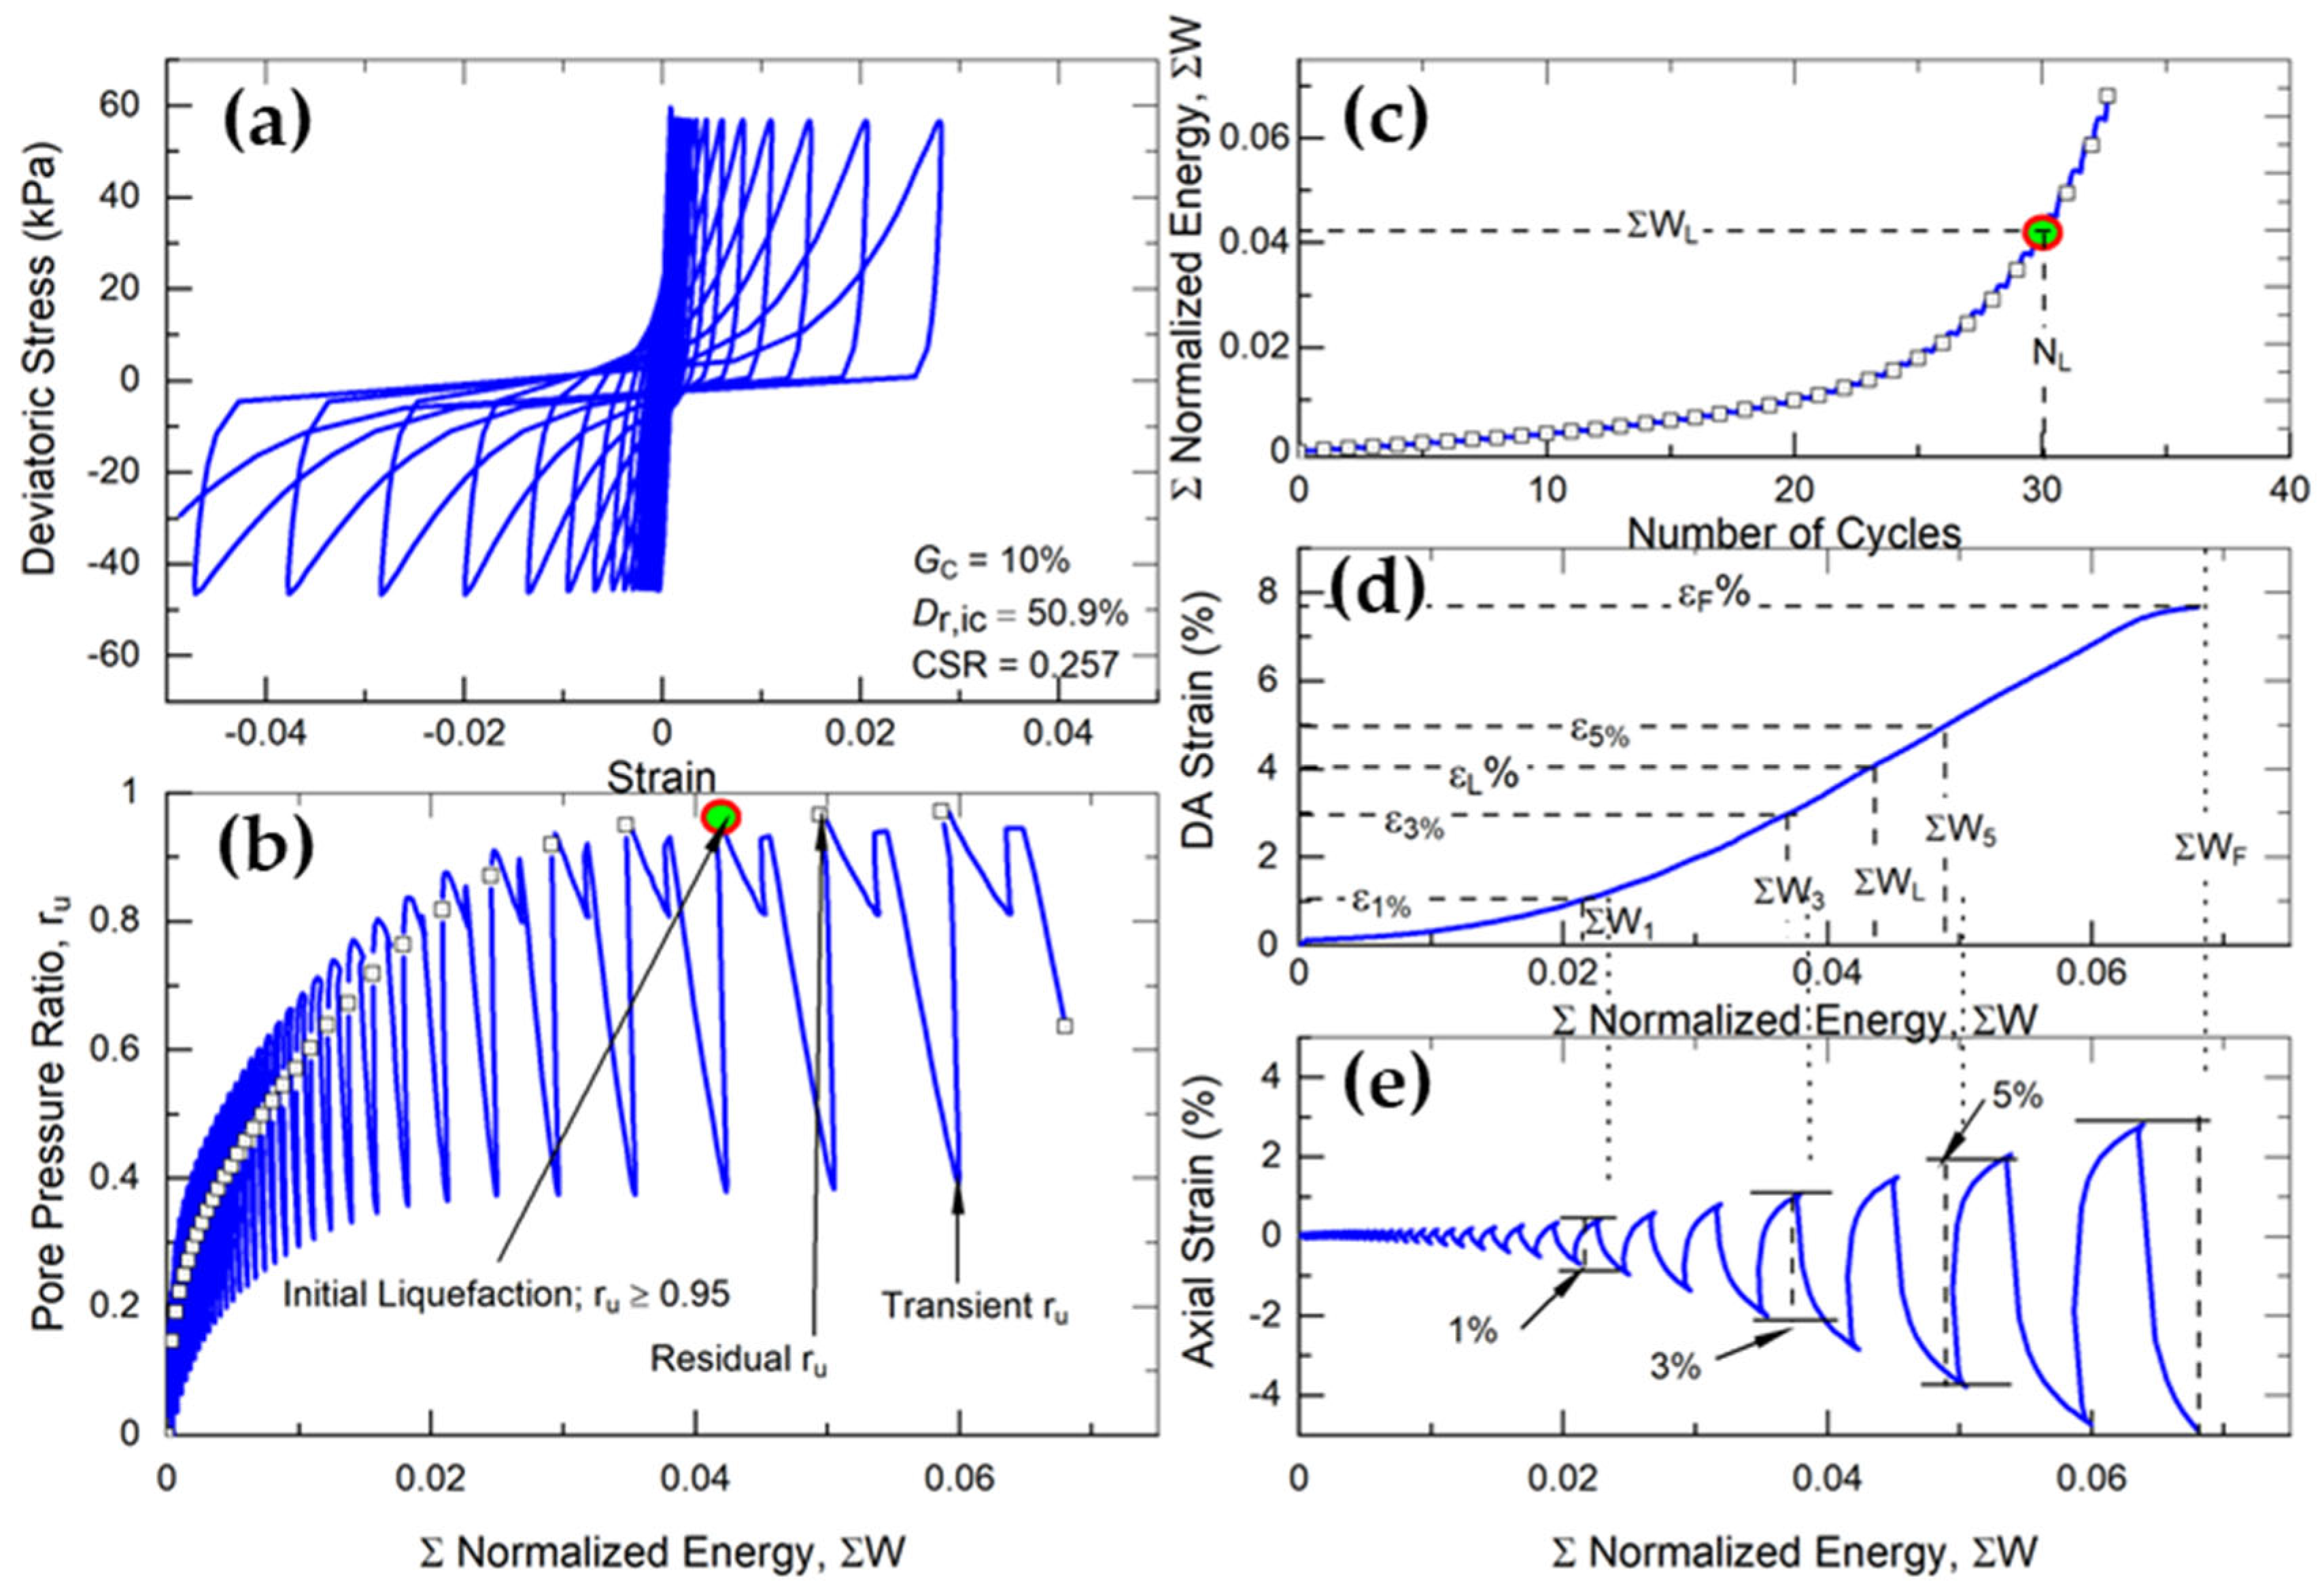
4.1. Theoretical Framework

In the case of saturated granular soils, under undrained cyclic loading, the tendency of the soil to densify controls the amount of energy dissipated during the rearrangement of soil particles and causes pore water pressure generation. The build-up of pore water pressure induces interparticle forces to decrease, and thus the ability of the soil to resist shear deformation decreases, resulting in significant strain development.
The dissipated energy during each undrained loading cycle is given by the hysteresis area of a stress–strain loop [36,50] and the cumulative dissipated energy can be calculated using the following equation [31]:
Σ w = 1 2 i = 1 n 1 σ d , i + 1 + σ d , i ε a , i + 1 ε a , i
where n is the number of loading increments; σ(d,i) and σ(d,i+1) are the deviator stress at load increment i and i + 1, respectively; ε(a,i) and ε(a,i+1) are the axial strains at load increments i and i + 1, respectively.
According to Kokusho and Tanimoto [39], the cumulative dissipated energy can be calculated by integrating the deviatoric stress into axial strain as follows:
Σ w = q ε
where q is the deviatoric stress and ε is the axial strain.
To remove the effect of the initial effective mean stress (σ0′), the cumulative dissipated energy is typically normalized or nondimensionalized:
Σ W = Σ w / σ 0
A typical deviator stress-axial strain plot is shown in Figure 8a for a medium-dense specimen of SGM (Dr = 51%) with GC = 10% subjected to CSR = 0.26. The corresponding cumulative normalized dissipated energy ΣW (hereinafter referred to as “dissipated energy”) is calculated by using the above Equations (3)–(5); its variation is plotted in Figure 8 against the pore water pressure ratio (Figure 8b), the number of loading cycles (Figure 8c), the double amplitude axial strain (Figure 8d) and the axial strain (Figure 8e) for completeness.
In the early stages of the cyclic loading, ΣW remains minimal, but it starts to increase significantly with increasing N and the effective stress reduces by half. Specifically, in Figure 8b,c, in the first 20 loading cycles, ΣW is almost 0.01 and ru is more than 0.6, but in the next 13 cycles, ΣW increased by more than 600%. Moreover, only εDA = 1% is developed in the first 26 loading cycles (Figure 8d), but then εDA starts to increase dramatically afterward, reaching 5% within the next 5 loading cycles (Figure 8e).
The ΣW required to achieve initial liquefaction is here defined as ΣWL and is based on the ru ≥ 0.95 criterion; the ΣW required to achieve cyclic failure is here defined as ΣWF and is based on the axial strain level εSA = 5% approach. Their variation with the number of loading cycles is plotted in Figure 9 for SGMs with varying GC and Dr, where Figure 9a–d represents GC = 0%, 10%, 25% and 40%, respectively. For the easy identification of data grouping, the data are presented with different symbols using hollow blocks connected by a dashed line for ΣWL, and full blocks connected by a solid line for ΣWF-based results. It can be seen that, for all the GC and Dr conditions, ΣWL is generally lower than ΣWF. This is due mainly to the fact that the ru,R reaches more than 0.95 before the specimen fails at εSA = 5%. Moreover, at GC = 0 and 10% (Figure 9a,b), the ΣW is relatively small and unchanged with the number of loading cycles, but a slightly to significantly increasing trend can be observed with increasing the number of loading cycles for GC = 25 and 40% (Figure 9c,d).
The above can be further discussed by looking at the relationships between ΣW and CSR, as shown in Figure 10. In fact, the number of loading cycles presented in Figure 9 is directly related to the CSR; that is, the higher the CSR is, the lower the N is, and vice versa. The ΣWCSR is relatively flat for GC = 0% (Figure 10a) under various Dr values, indicating the independency of ΣW on CSR. However, for other GC and Dr conditions (Figure 10b,c), ΣW mostly decreases with increasing CSR. The marginal dependence of ΣW on CSR is consistent with the findings of Kokusho and Tanimoto [39].
The ΣW during liquefaction can be directly correlated with the CRR [36]. From undrained cyclic triaxial tests carried out on reconstituted specimens over a wide range of fine content, relative density and effective stress, Kokusho [36] found that the ΣW and CRR have a unique relationship that can be described using a parabolic function as follows:
Σ W = A · C R R 2 + B · C R R + C
where A, B and C are fitting constants obtained from the experimental results. In this study, the CRR values for N = 15 loading cycles (CRR15) can be determined from Figure 2.
According to Kokusho and Tanimoto [39], the ΣW value can be interpolated using the log ΣW–log CSR plot (e.g., Figure 10) by using the following function with positive fitting constants c and d:
Σ W = c C S R d
Thus, the ΣW corresponding to a given CRR15 value can be estimated from Equation (7) by setting CSR = CRR15.
The relationships between ΣW and CRR15 obtained using the above-described approach are presented in Figure 11a for liquefaction criteria adopted in this study (i.e., εSA = 5% and ru ≥ 0.95) and Figure 11b for other criteria (i.e., εDA = 1, 3 and 5%). The CRR15 is found to be uniquely correlated with the respective ΣW in all cases considered.
For a comparison, the relationships obtained by Kokusho and Tanimoto [39] and Zhou et al. [40] are also included in Figure 11a. The deviation between the trend found in this study and the two previous studies is due to the differences in test materials, test conditions and liquefaction evaluation criteria. However, they all follow a similar trend, confirming that ΣW monotonically increases with increasing CRR. The fitting parameters A, B and C from this and previous studies are listed in Table 3.
The relationship between ΣW and CRR found in this study confirms that the energy dissipation approach can uniquely describe the liquefaction resistance of SGMs (i.e., gravelly soils) by simultaneously capturing the effects of GC and Dr. Considering the output of this and previous studies, the energy-based method is a promising technique to assess the liquefaction resistance of different types of soils, including sand–silt mixtures and SGMs of varying densities. Additionally, this method can also be applied to assess the liquefaction behavior of in situ soils [40]. Regardless, further laboratory and in situ investigation, specifically focusing on the different gradations of gravel, fabric, and stress state, is recommended to improve the suitability of this method for gravelly soils.

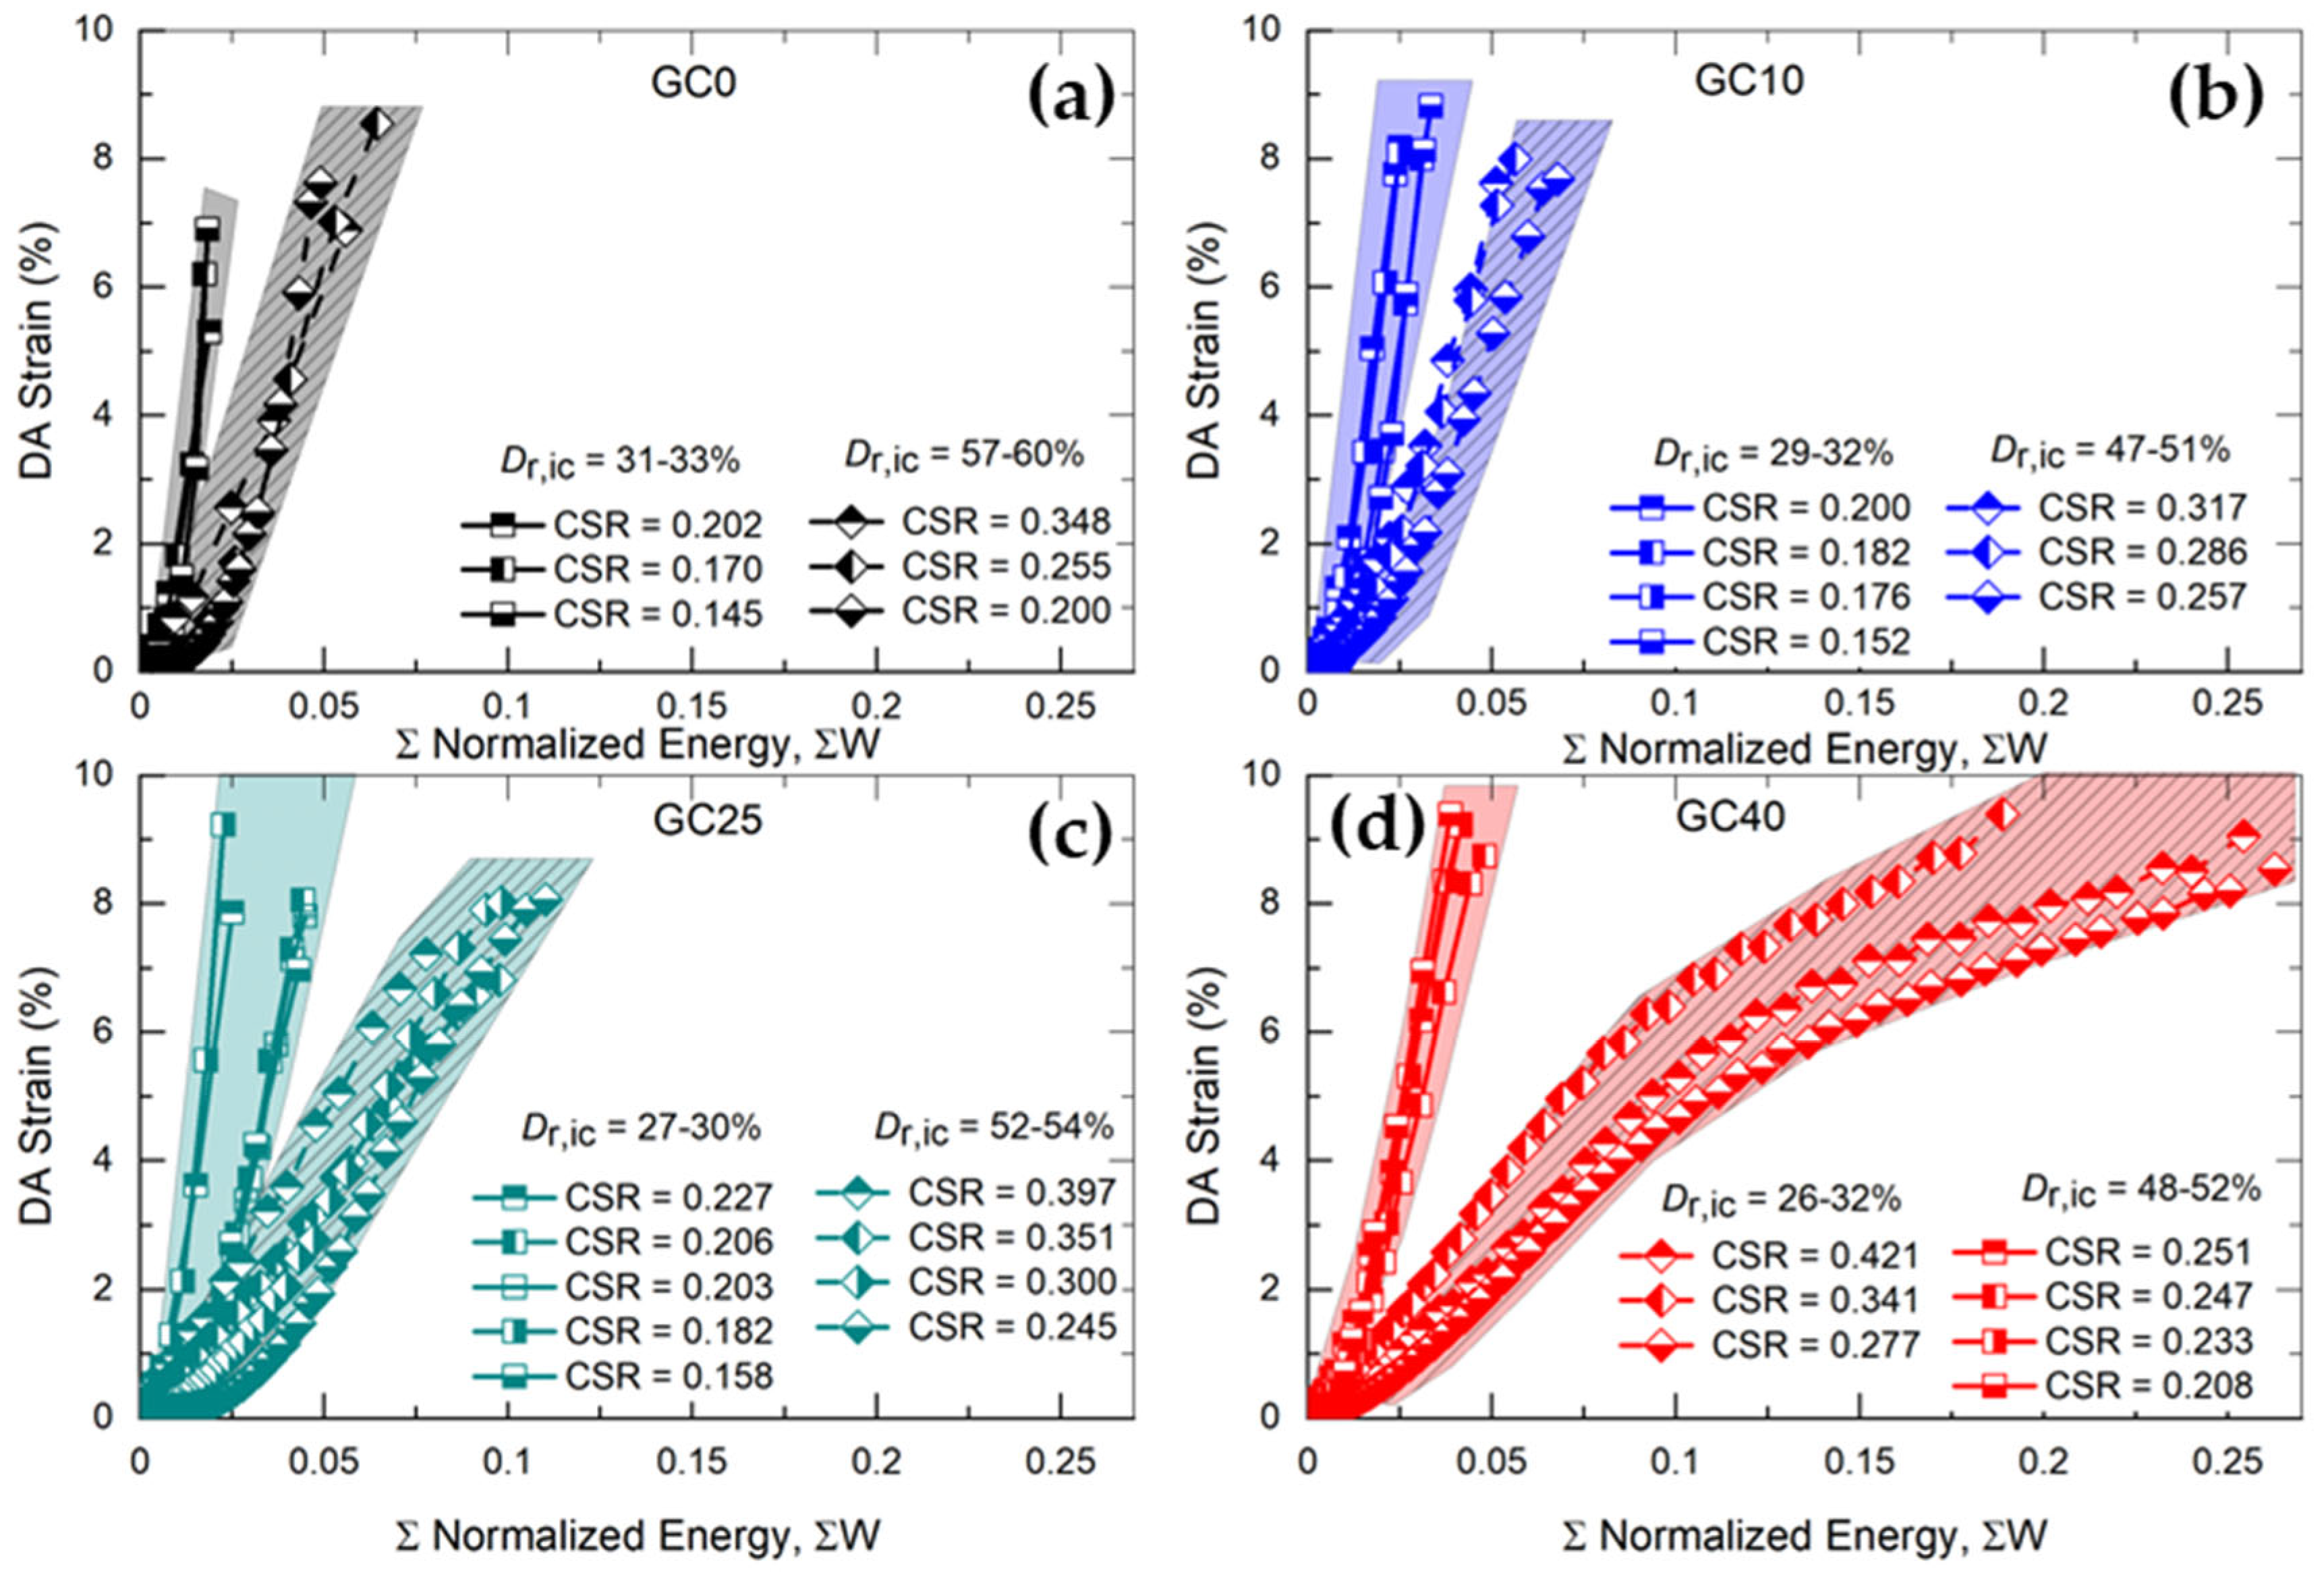
4.2. Relationship Between Energy Dissipation and Double Amplitude Axial Strain

In Figure 12, the ΣWεDA relationships obtained for the SGMs with Dr = 26–33% and 47–60% and for different GC conditions are plotted. Each data set includes 3 to 5 test results corresponding to different values of CSR. The effect of CSR on the ΣWεDA relation is noticeable, but the data can still be grouped according to their Dr. The ΣW values are found to be lower for Dr = 26–33% than Dr = 47–60% for any GC configuration, clearly demonstrating the effect of Dr on the ΣWεDA relation. Specifically, for SGMs with GC = 0% (Figure 12a), to attain the εDA = 5%, ΣW = 0.015 shall be dissipated for Dr = 26–33%, while ΣW = 0.042 is needed for Dr = 47–60%. The difference in ΣW required to attain similar εDA for Dr = 26–33% and Dr = 47–60% is almost similar to that for GC = 0 and 10% but increases in magnitude with increasing GC from 10% to 25% and 40% (Figure 12b–d).
Moreover, considering different GC but the same Dr, the curves tend to shift systematically rightwards, demanding higher energy dissipation to reach the same εDA. This is, for Dr = 47–60%, ΣW = 0.042 is required to reach the εDA = 5% for GC = 0% and ΣW = 0.048, 0.068 and 0.1 for GC = 10, 25 and 40%, respectively. Similarly, for Dr = 26–33%, for GC = 0, 10, 25 and 40%, the ΣW needed to attain εDA = 5% is 0.015, 0.017, 0.023 and 0.03, respectively. The marginal difference between GC = 0 and 10%, as well as the significant difference for the higher GC (25 and 40%), can be related to the effect of GC on the liquefaction resistance of SGMs. Therefore, it can be concluded that the ΣW−εDA relation is significantly affected by both the GC and Dr. This conclusion is consistent with the results obtained for sand–silt mixtures by Kokusho and Kaneko [38].

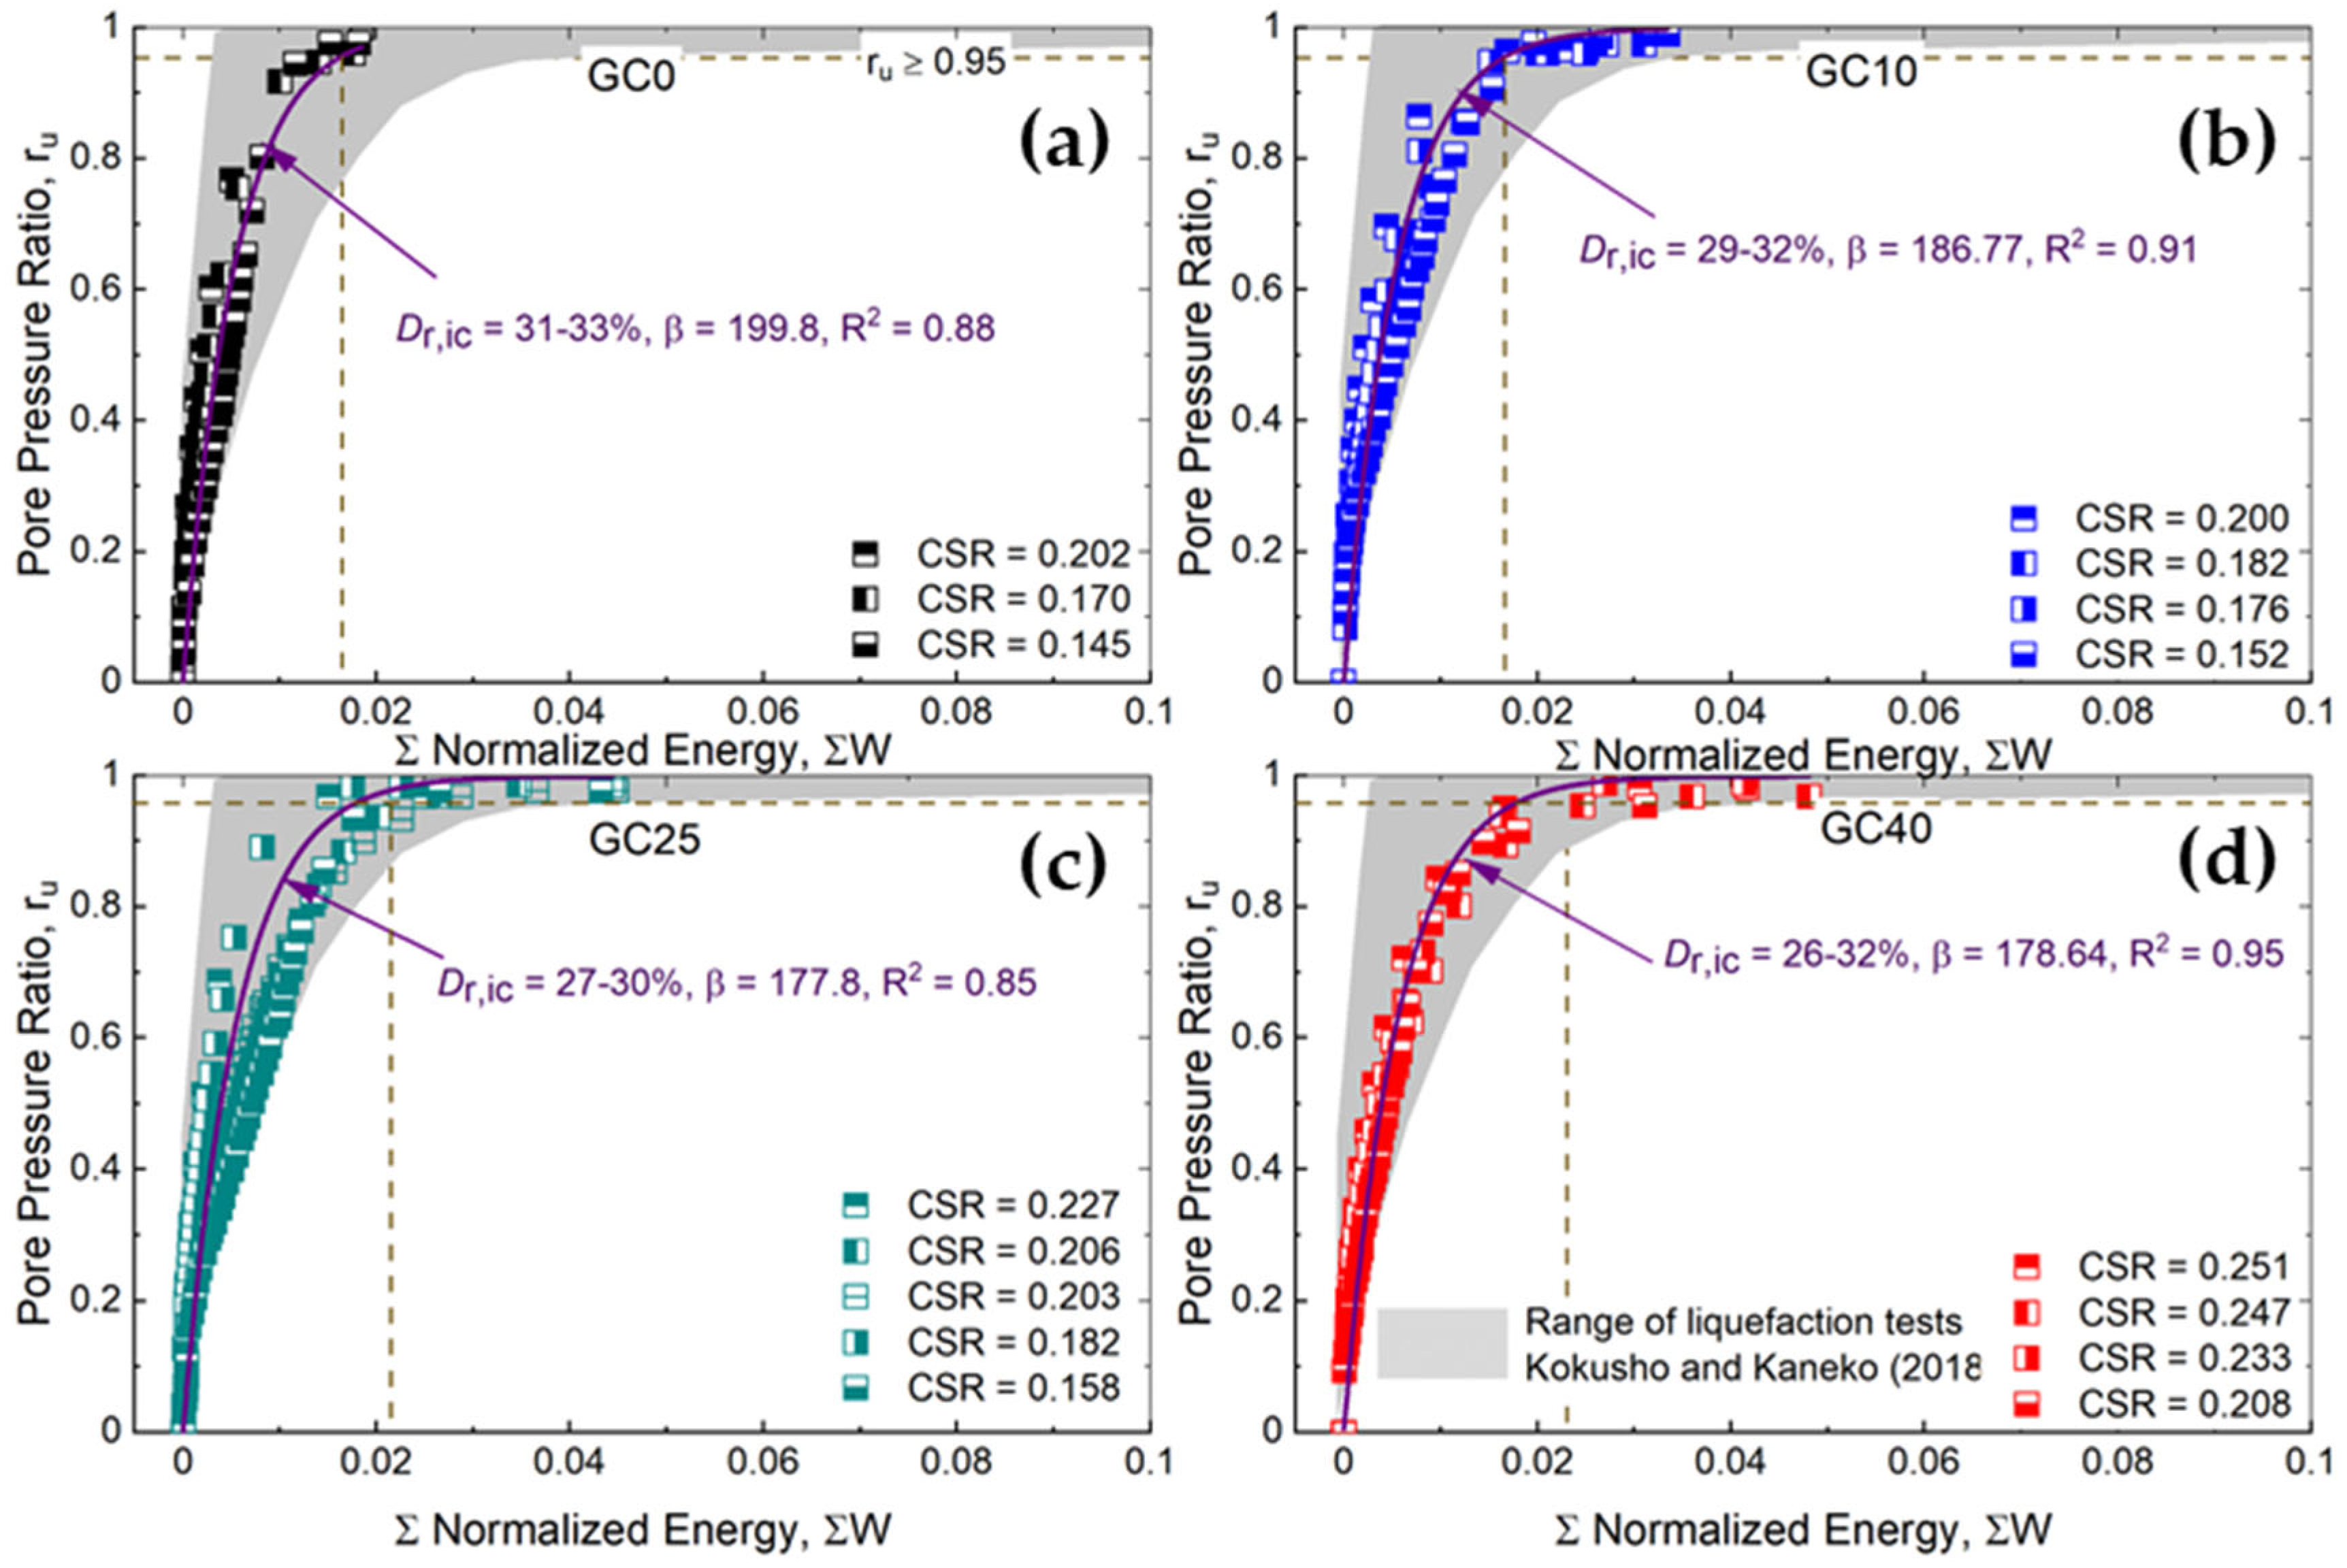
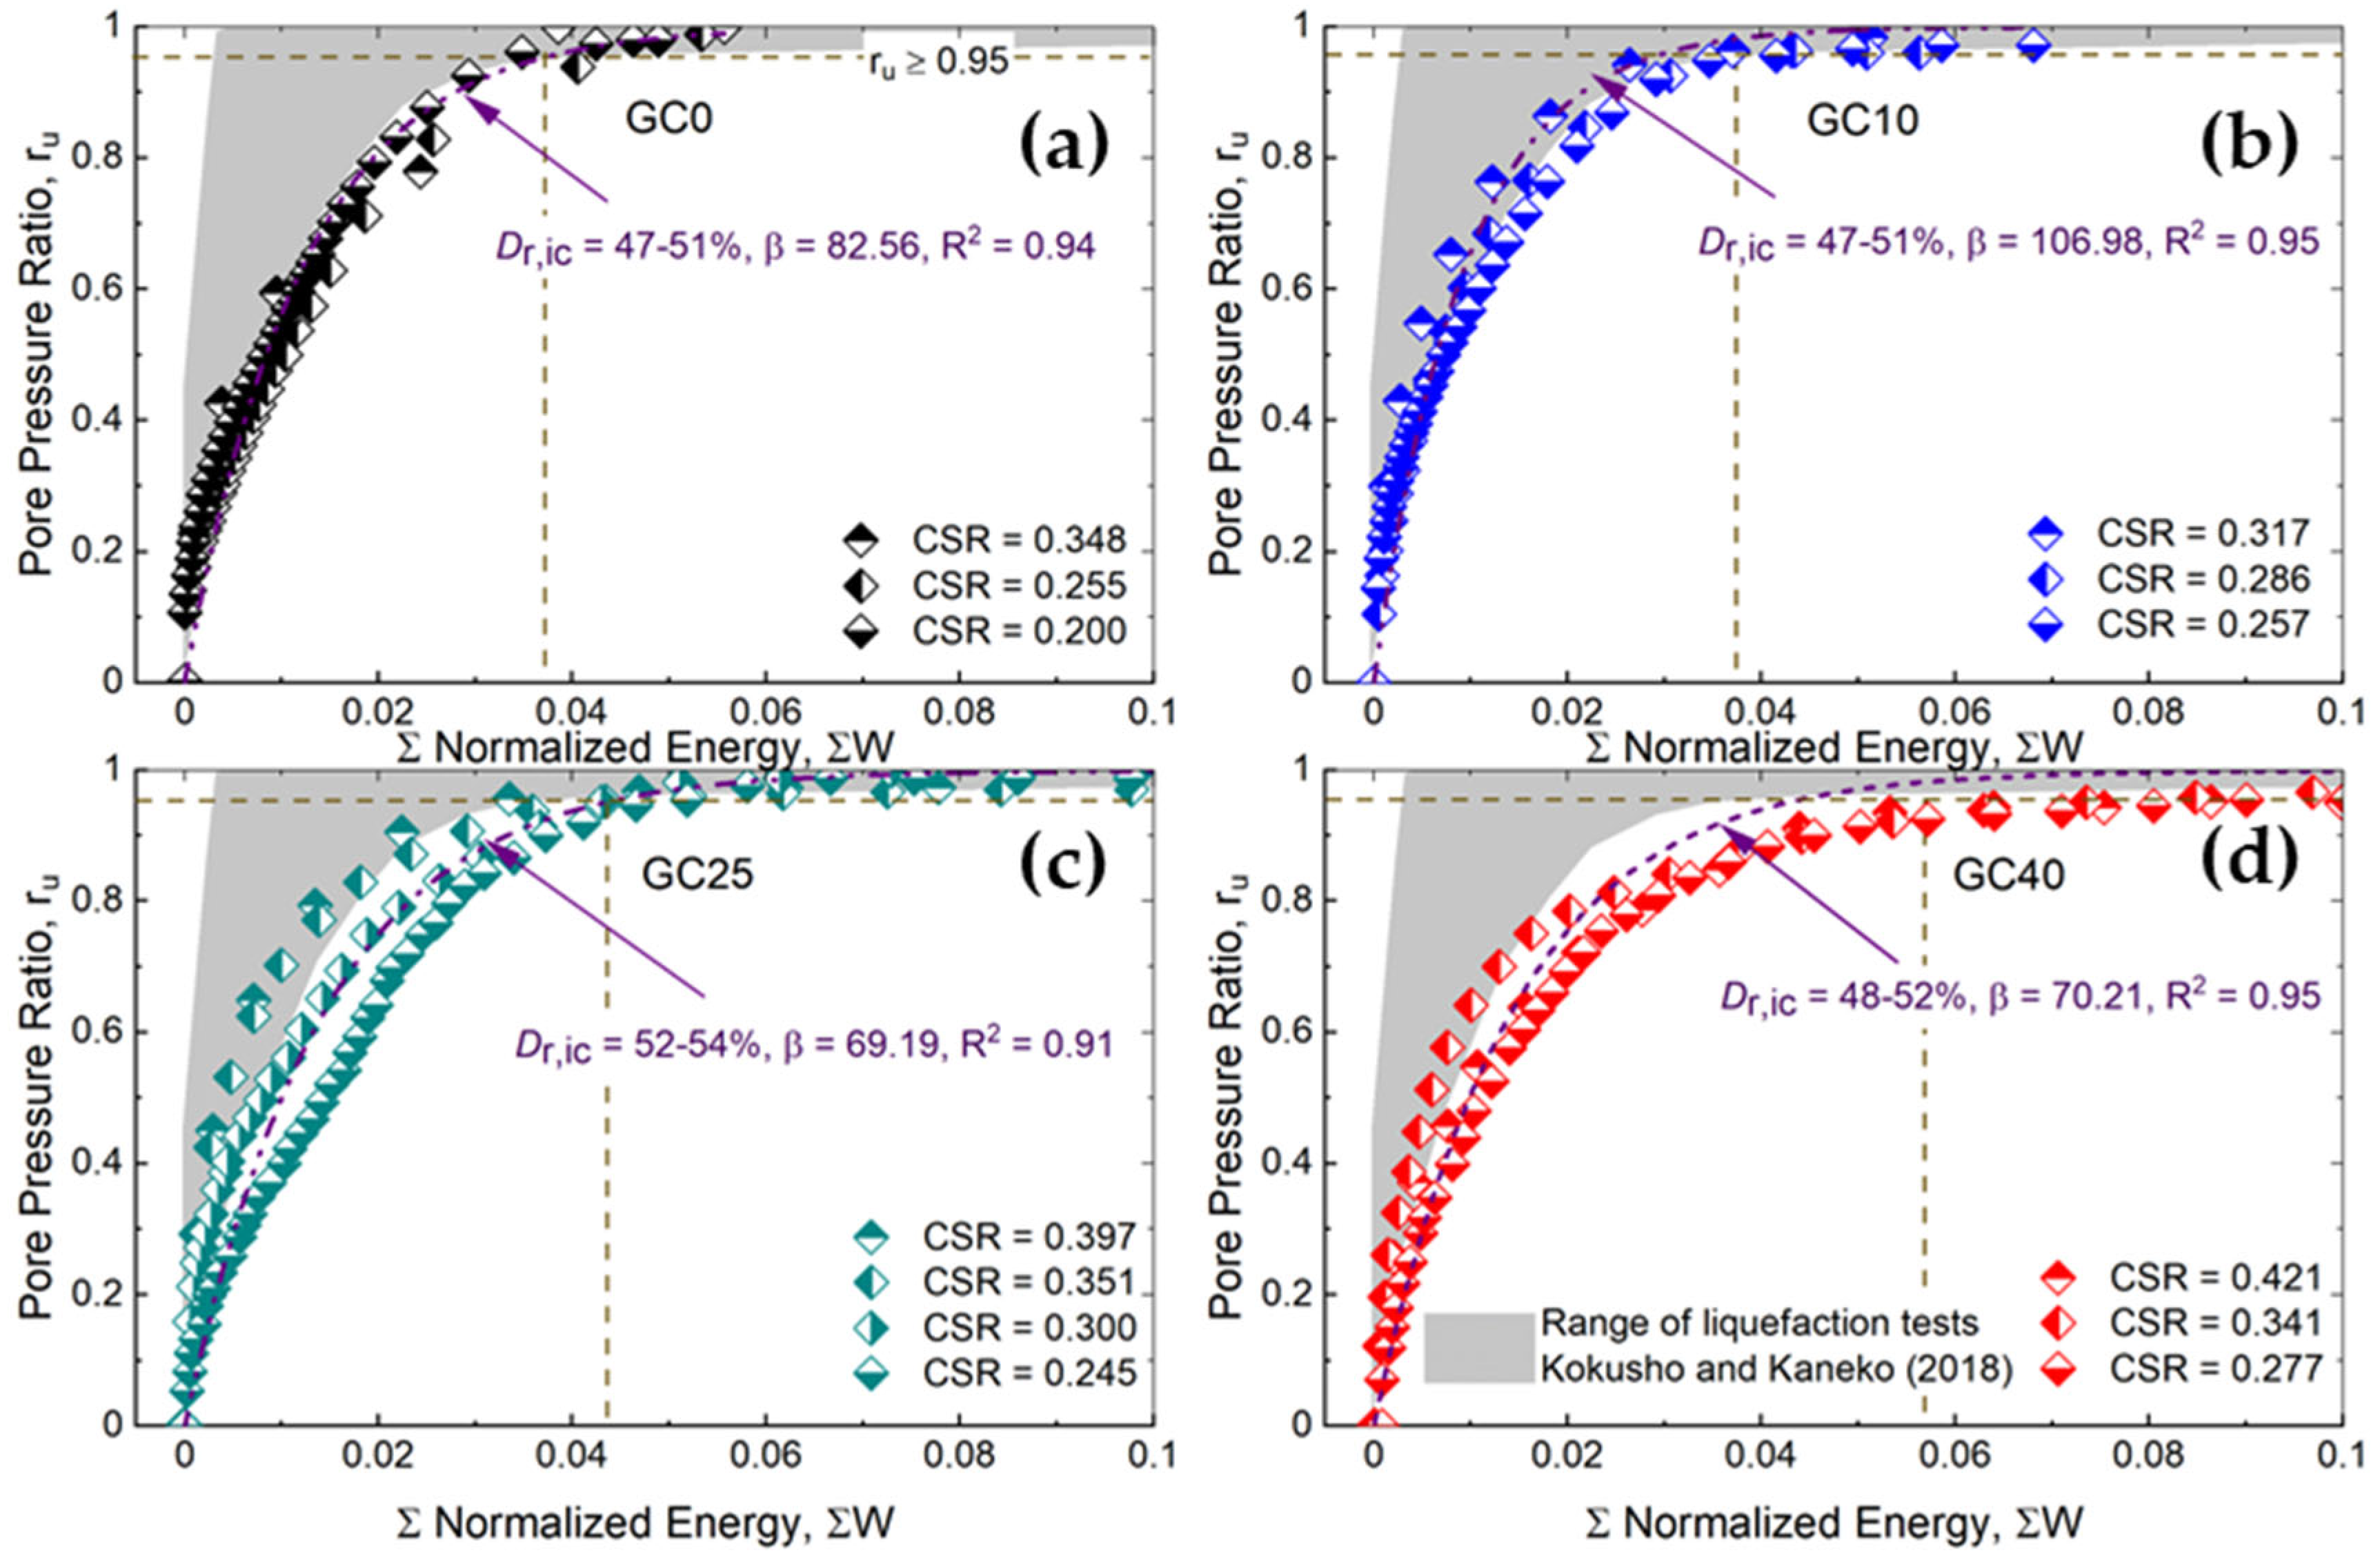
4.3. Relationship Between Energy Dissipation and Pore Water Pressure

The stress-based model developed by Seed et al. [48] is widely used for estimating pore water pressure build-up under specific cyclic loading conditions or earthquake intensity. This model requires selecting an equivalent number of uniform stress cycles or loading cycles to describe the actual in situ pore water pressure response to earthquake loading [51]. The application of an equivalent number of loading cycles is limited to liquefiable soils. However, even non-liquefiable soils containing plastic fines and dense sands can undergo significant pore water pressure increases and cyclic deformation due to cyclic softening [52]. Under more general loading conditions and different types of soil, a second alternative method based on ΣW has been used in cyclic liquefaction assessment. This theory is based on the observation that the expenditure of energy during particle rearrangement in undrained cyclic tests causes an increase in pore water pressure. Originally, Nemat-Nasser and Shokooh [29] suggested a relationship between ΣW and ru. This concept was further validated by Davis and Berrill [28]. Initially, a linear relationship between ru and ΣW was assumed; however, Simcock et al. [53] suggested a non-linear relationship. Based on undrained cyclic triaxial testing on New Brighton sand conducted by Simcock et al. [53], Berrill and Davis [54] proposed a nonlinear relationship between ru and ΣW. Following the same hypothesis, numerous energy-based pore pressure models based on laboratory undrained cyclic tests have been developed [32,55,56,57,58,59,60,61]. Similarly, the variation in ru with ΣW for different types of soils (sand and its mixtures) under different loading conditions (harmonic and irregular) has been investigated [34,36,38,40,41,50]. Such studies concluded that the energy-based approach reveals an intrinsic correlation between the ΣW and ru irrespective of the Dr, CSR, and consolidation ratio for various sands and silts under different loading conditions.
Considering that the ΣWru relation is independent of CSR, Amini et al. [34] proposed that the variation in ΣW with ru can be represented by the following simple model developed by Davis and Berrill [61]:
r u = 1 exp β   Σ W
where β is a dimensionless constant relating the dynamic excess pore water pressure determined from cyclic undrained tests.
The model was checked against the data points obtained from all 44 tests tested in this study. The estimated β and the fitting coefficient R2 value for each condition are presented in Table 4. The R2 value over 0.91 indicated that the model accurately captured the ΣWru relationship of SGMs. The constant parameter β is found to vary from 54 to 360 depending on the GC, Dr and CSR. For any given GC and Dr combination, β is found to generally decrease with decreasing CSR.
Figure 13 shows the variation in ΣW with ru for SGMs with Dr = 26–33%, where Figure 13a–d corresponds to GC = 0%, 10%, 25% and 40%, respectively. The pore water pressure is found to be well correlated with ΣW for each GC condition and different CSR, even though the β value is different for a different CSR. The ΣW required to reach ru ≥ 0.95 is also similar for any given GC and Dr but with a different CSR. For GC = 0 and 10% (Figure 13a,b), the ru value is greater than 0.95 at almost similar ΣW = 0.018. But, for GC = 25 and 40% (Figure 13c,d), the ru is slightly delayed and requires a higher ΣW than SGMs with GC = 0 and 10% to reach the same ru level. The grey shaded zone in Figure 13 represents the range of results obtained by Kokusho and Kaneko [38] for liquefaction tests conducted on sandy soil mixed with different fine content, densities and confining pressures. The ΣWru obtained in this study for SGMs is within the range found by Kokusho and Kaneko [38], indicating that the pore water pressure generation response of SGMs with different GC and low Dr could be the same as that of sandy soils.
The relationship between ΣWru for SGMs with Dr = 47–54% is presented in Figure 14. The requirement of ΣW for ru to reach 0.95 increases from 0.037 to 0.057 when GC increases from 0 to 40%. Yet again, the ru for SGMs with GC = 0 and 10% (Figure 14a,b) attains its maximum value at a smaller ΣW than SGMs with GC = 25 and 40% (Figure 14c,d). The requirement of lower ΣW for lower GC can be related to the effect of GC on the liquefaction behavior of gravelly soils. The ΣWru range is also shifted rightwards as compared to that of sandy soils reported by Kokusho and Kaneko [38]. The effect of Dr on ΣWru relation can be better understood by comparing Figure 13 and Figure 14. The development of ru is slightly more rapid for SGMs with Dr = 26–33% (Figure 13) than for those with Dr = 47–54% (Figure 14) for all the GC conditions. Similarly, by looking at the ΣWru data points for any given testing conditions (i.e., same GC and Dr), the test results fall in a small range and ru also reaches its maximum value at a similar ΣW for different CSR. Therefore, the ΣWru relation can be considered to be somehow independent of CSR.
By assuming that the ΣWru relation is actually independent of CSR, β could then be estimated by using Equation 8 for each testing condition, as tabulated in Table 4. The higher values of β indicate that the growth of pore water pressure would be higher for any given ΣW. The obtained fitting lines are also indicated in the plots. The fitting constant β is in a narrow range for each GC except for Dr = 26–33%. For the same Dr, but with different GC, β decreases with increasing GC but is in a very narrow range. The small effect of GC is similar to the effect of fines observed by Kokusho and Kaneko [38] and Zhou et al. [40] for silty sand. Similarly, for the same GC but with different Dr, β decreases with increasing Dr, indicating the effect of Dr on the ΣWru relation. The small effect of Dr on ΣWru relation is consistent with the findings of Kokusho and Kaneko [38].
Figure 15 shows the variations in ru with ΣW for all the cyclic tests tested in this study. Despite the marginal effect of GC, Dr and CSR as observed, all the test data points are found to be falling within a narrow band. This outcome is well in agreement with the previous experimental studies on Toyoura sand conducted at different Dr, CSR and consolidation stress ratios by Yang and Pan [42] and on mixtures of Fujian silica sand and its fines (fine content up to 20%) under different consolidation stress ratios [40].

5. Conclusions

A series of 44 isotropically consolidated undrained cyclic triaxial tests were conducted on selected sand–gravel mixtures (SGMs), with varying gravel content (GC = 0, 10, 25 and 40%) and prepared at different relative densities (Dr,ic = 30–60%), to characterize the undrained cyclic responses of gravelly soils. The pore water pressure generation (ru) response and the liquefaction resistance were examined. The ru results were compared with the experimentally derived boundary curves obtained by Lee and Albaisa [25] for sand and Banerjee et al. [8], Haeri and Shakeri [23] and Hubler [49] for gravelly soils, as well as with the mathematical model proposed by Booker et al. [43] for sand. The combined effect of GC and Dr on the liquefaction resistance of gravelly soils was also scrutinized using the energy–based method (EBM) for liquefaction assessment proposed by Kokusho [36].
The following main conclusions can be drawn from this experimental study:
  • It is confirmed that the liquefaction resistance (CRR) and pore water pressure generation (ru) of SGMs are influenced by the CSR, GC, and Dr; however, this study shows that it is critical to consider the combined effects of GC and Dr to properly characterize the response of SGMs subjected to undrained cyclic loading conditions;
  • For looser (Dr = 26–33%) SGMs, the influence of GC on the ru is marginal irrespective of the CSR level; alternatively, for denser (Dr = 47–60%) SGMs, the influence of GC on the ru becomes significant with an increasing CSR level;
  • The boundary curves for ru proposed by Lee and Albaisa [25] for sand describe well the response of loose SGMs; alternatively, the response of the denser SGMs is better described by the boundary curves proposed by Haeri and Shakeri [23] for gravels. The mathematical model proposed by Booker et al. [43] is fairly applicable to all SGMs cases examined in this study (GC = 0–40%; Dr = 26–60%; CSR = 0.145–0.481);
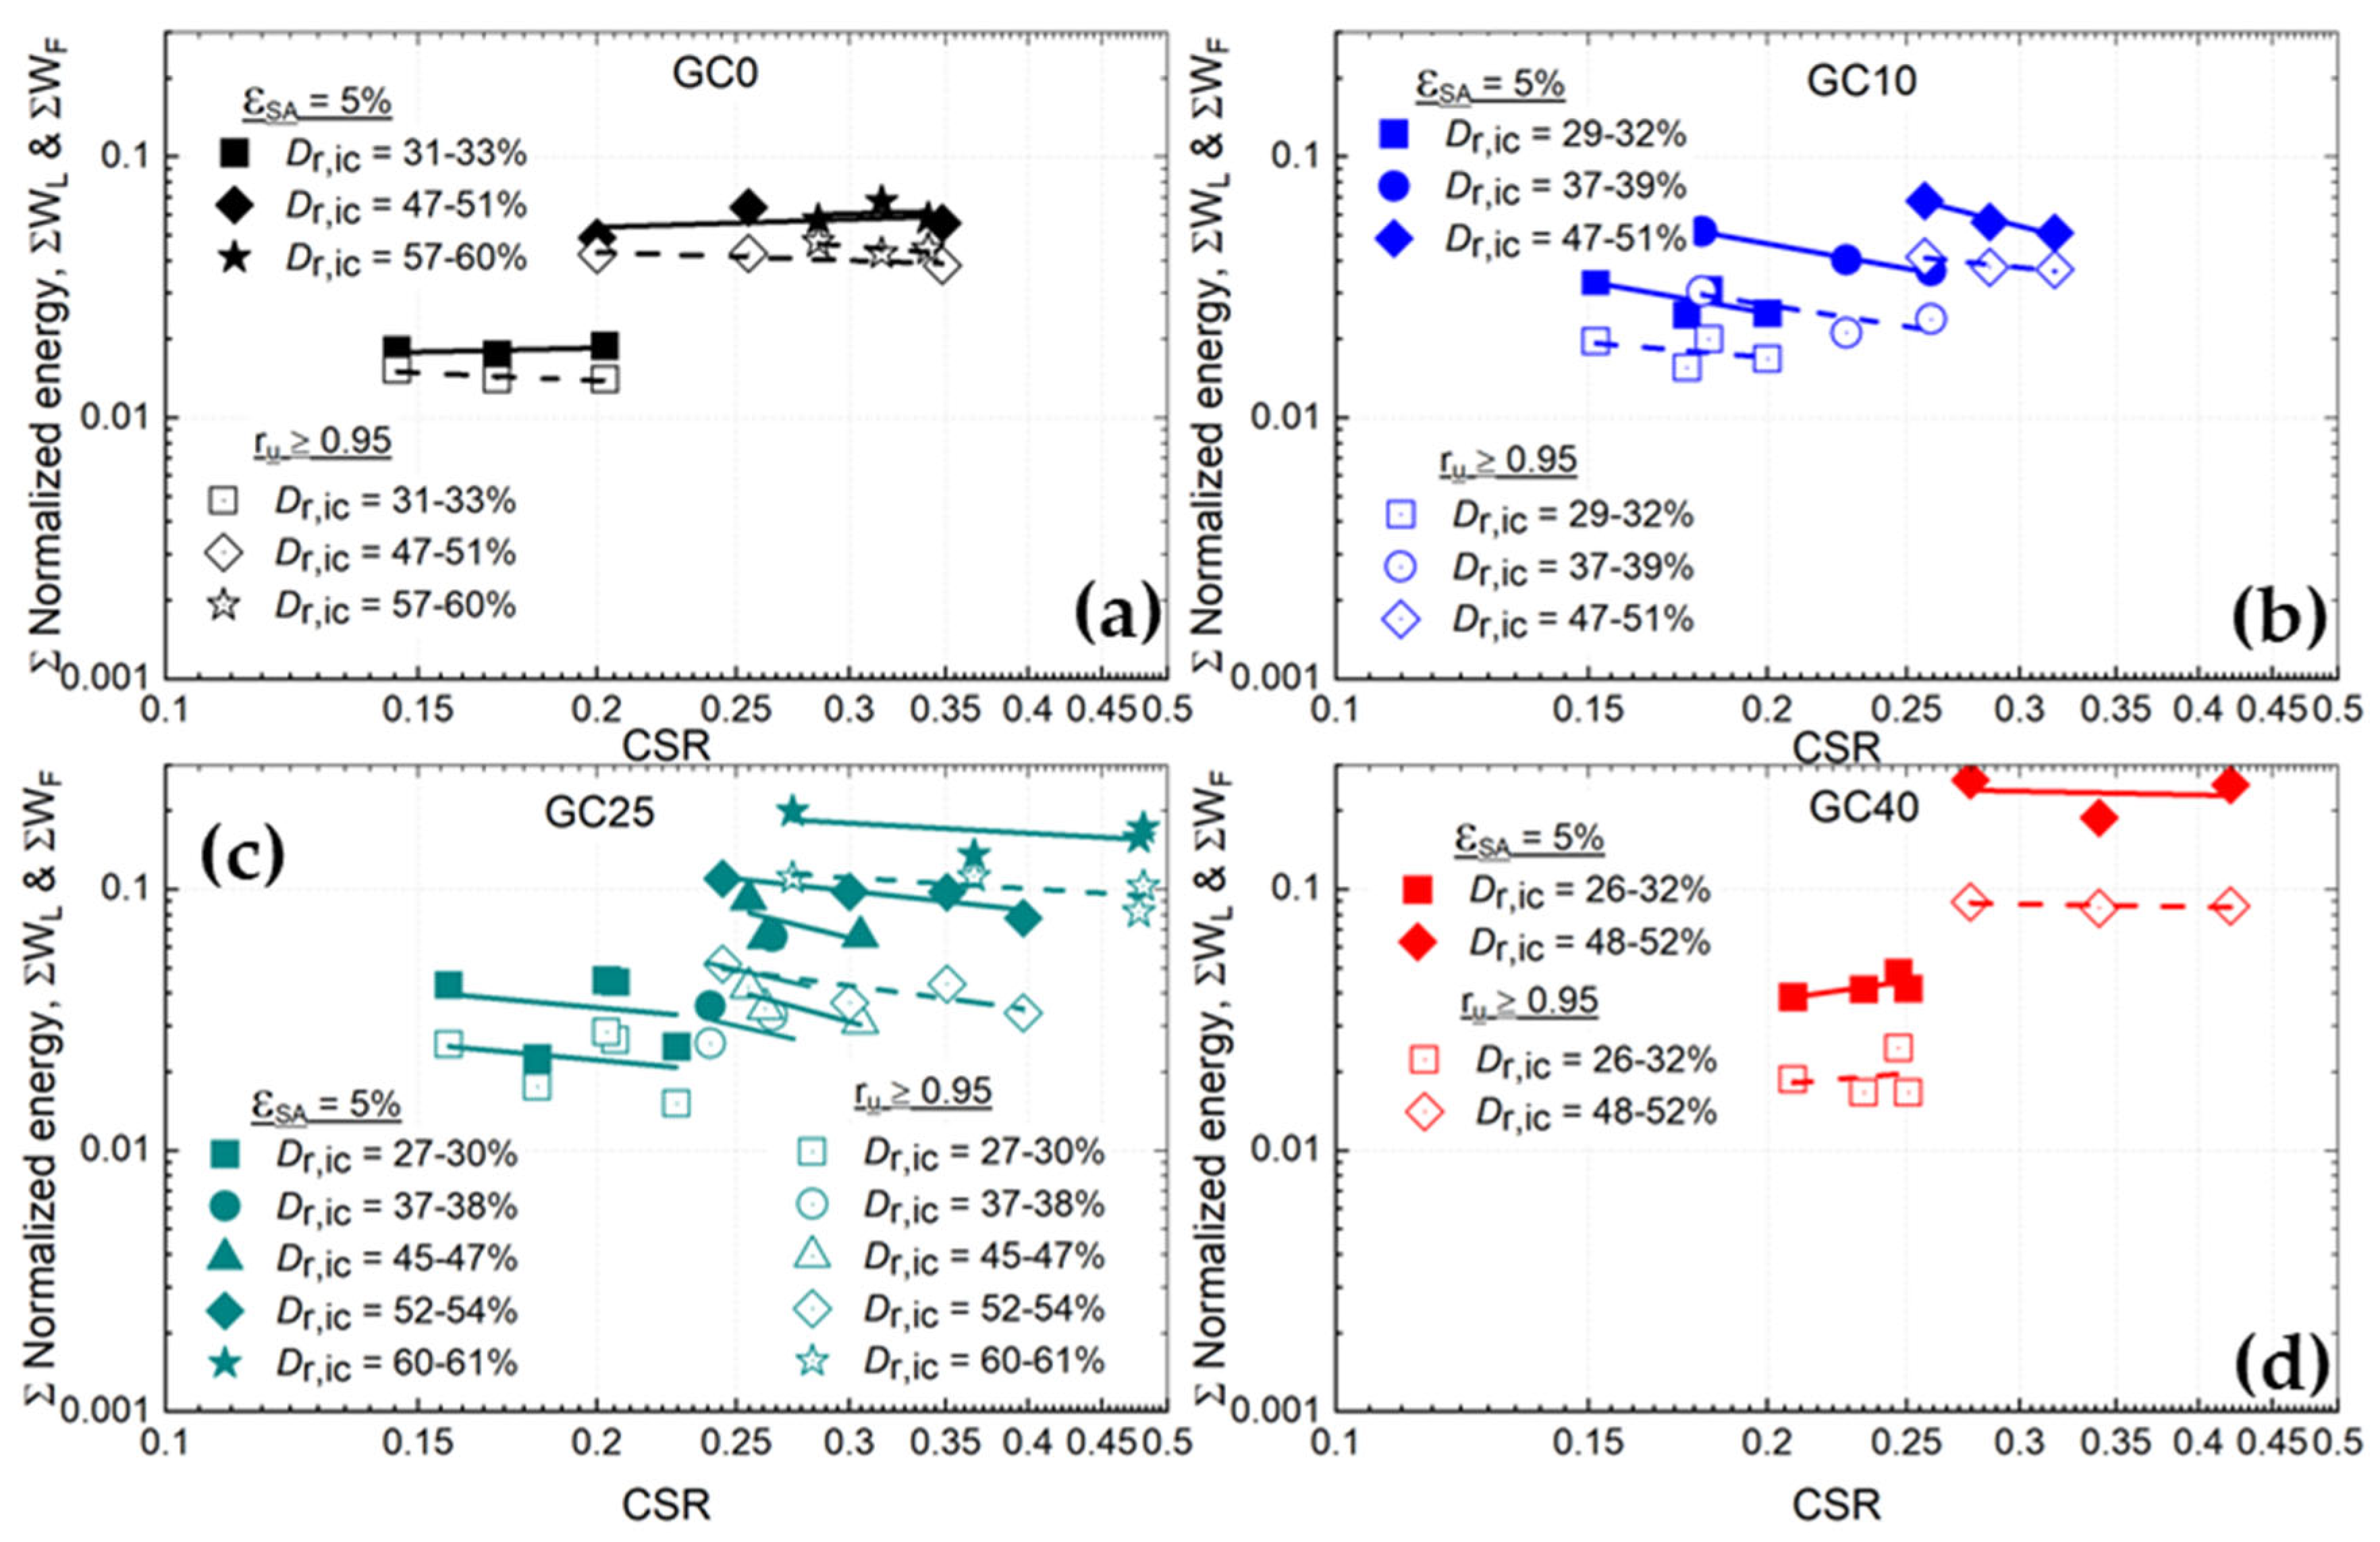
  • For SGMs with GC = 0 and 10%, the normalized cumulative energy dissipation (ΣW) slightly increases with increasing Dr; in contrast, for SGMs with GC = 25 and 40%, ΣW significantly increases with increasing Dr. Irrespective of the GC and Dr combinations, the effects of CSR on ΣW are mostly marginal;
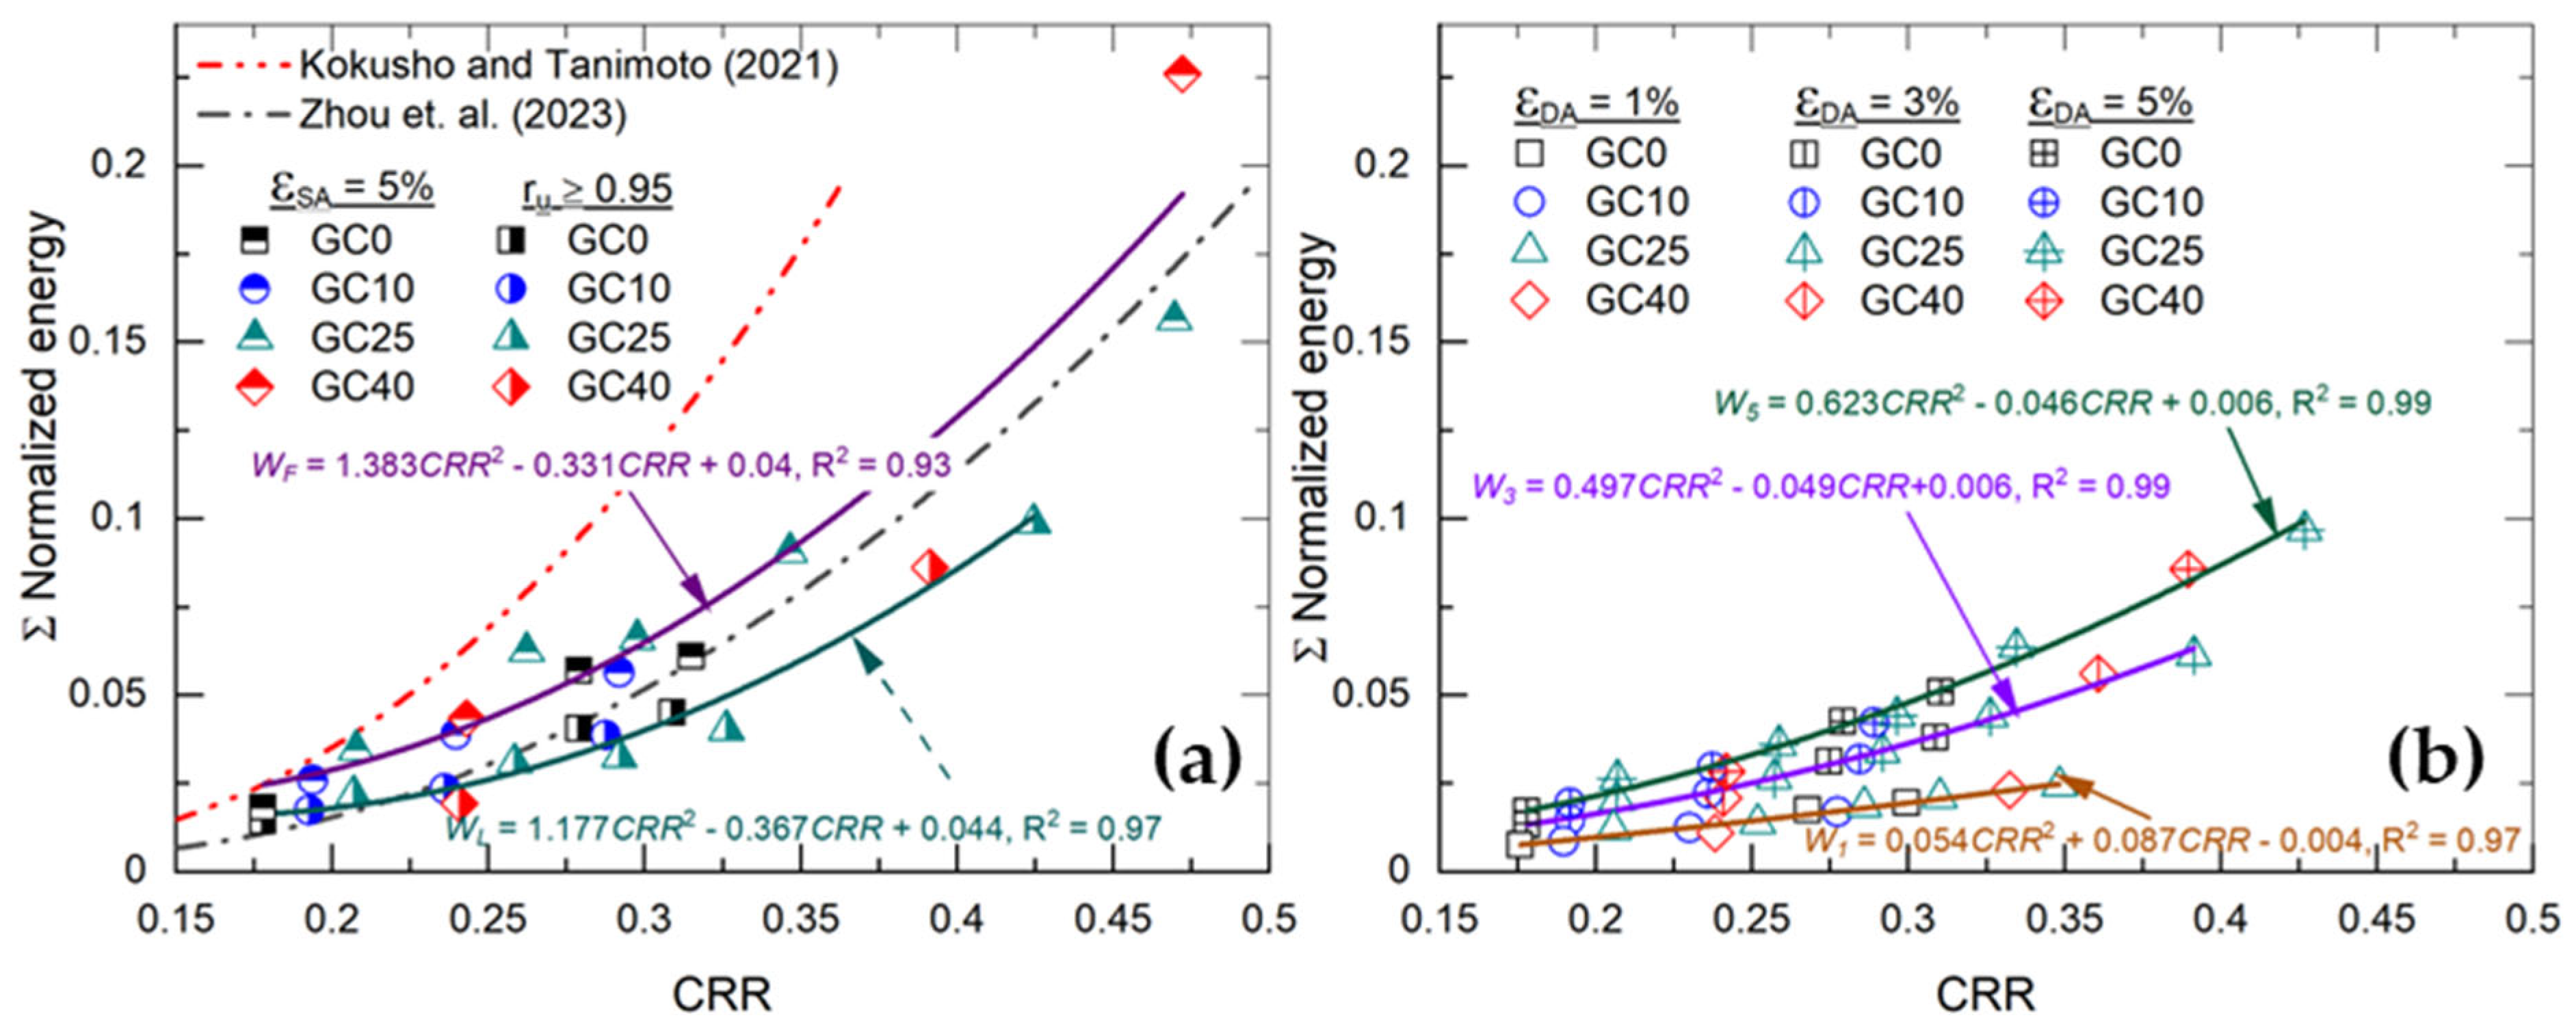
  • EBM is found to be an effective approach for uniquely describing the liquefaction potential of SGMs while simultaneously capturing the effects of GC and Dr. This highlights that EBM is a promising alternative to the CSR approach, which requires additional parameters, such as the skeleton void ratio and/or equivalent void ratio, to capture the effect of GC and Dr as described and correlated with CRR in the work of Pokhrel et al. [2]. This contribution adds significant value to the existing body of literature, which primarily focuses on sand and sand–silt mixtures. Based on the existing knowledge and the findings of this study, the EBM approach has demonstrated its robustness in predicting liquefaction potential across various soil types and loading conditions.
  • Both the CSR and EBM approaches demonstrate significant effectiveness in predicting the pore pressure generation of SGMs tested in this study. However, the EBM approach appears to be better suited due to the narrow band observed in the ΣWru. In contrast, the CSR approach shows a wider variability in the relationship between N/NL and the ru.

Author Contributions

Conceptualization, A.P. and G.C.; methodology, A.P. and G.C.; formal analysis, A.P. investigation, A.P.; writing—original draft preparation, A.P.; writing—review and editing, G.C.; visualization, A.P.; supervision, G.C.; funding acquisition, G.C. All authors have read and agreed to the published version of the manuscript.

Funding

This research was (partially) funded by QuakeCoRE, a New Zealand Tertiary Education Commission-funded Centre. This is QuakeCoRE publication number 1019. The first author was awarded a 3-year doctoral scholarship by the University of Canterbury, New Zealand, to undertake this research. The support is gratefully appreciated.

Data Availability Statement

The data that support the findings of this study are available on request from the corresponding author.

Acknowledgments

The authors would like to thank Sean Rees for his assistance with laboratory testing, and Claudio Cappellaro for many valuable discussions.

Conflicts of Interest

A.P. was employed by the Beca Ltd. The remaining authors declare that the research was conducted in the absence of any commercial or financial relationships that could be construed as a potential conflict of interest.

References

  1. Rollins, K.M.; Roy, J.; Athanasopoulos-Zekkos, A.; Zekkos, D.; Amoroso, S.; Cao, Z.; Milana, G.; Vassallo, M.; Di Giulio, G. A new Vs-based liquefaction-triggering procedure for gravelly soils. J. Geotech. Geoenv. Eng. 2022, 148, 04022040. [Google Scholar] [CrossRef]
  2. Pokhrel, A.; Chiaro, G.; Kiyota, T.; Cubrinovski, M. Liquefaction characteristics of sand-gravel mixtures: Experimental observations and its assessment based on intergranular state concept. Soils Found. 2024, 62, 101444. [Google Scholar] [CrossRef]
  3. Hatanaka, M.; Suzuki, Y.; Kawasaki, T.; Endo, M. Cyclic undrained shear properties of high quality undisturbed Tokyo gravel. Soils Found. 1988, 28, 57–68. [Google Scholar] [CrossRef] [PubMed]
  4. Suzuki, Y.; Goto, S.; Hatanaka, M.; Tokimatsu, K. Correlation between strengths and penetration resistances for gravelly soils. Soils Found. 1993, 33, 92–101. [Google Scholar] [CrossRef]
  5. Flora, A.; Lirer, S.; Silvestri, F. Undrained cyclic resistance of undisturbed gravelly soils. Soil Dyn. Earthquake Eng. 2012, 43, 366–379. [Google Scholar] [CrossRef]
  6. Wong, R.T.; Seed, H.B.; Chan, C.K. Liquefaction of Gravelly Soils Under Cyclic Loading Conditions; Report of the Earthquake Engineering Research Center, University of California: Berkeley, CA, USA, 1974; p. 92. [Google Scholar]
  7. Wong, R.T.; Seed, H.B.; Chan, C.K. Cyclic loading liquefaction of gravelly soils. J. Geotech. Eng. Div. 1975, 101, 571–583. [Google Scholar] [CrossRef]
  8. Banerjee, N.G.; Seed, H.B.; Chan, C.K. Cyclic Behavior of Dense Coarse-Grained Materials in Relation to the Seismic Stability of Dams; Report of the Earthquake Engineering Research Center, University of California: Berkeley, CA, USA, 1979; p. 252. [Google Scholar]
  9. Lin, P.S.; Chang, C.W. Damage investigation and liquefaction potential analysis of gravelly soil. J. Chin. Inst. Eng. 2002, 25, 543–554. [Google Scholar] [CrossRef]
  10. Kim, J.; Athanasopoulos-Zekkos, A.; Cubrinovski, M. Monotonic and cyclic simple shear response of well-graded sandy gravel soils from Wellington, New Zealand. J. Geotech. Geoenviron. Eng. 2023, 149, 04023046. [Google Scholar] [CrossRef]
  11. Evans, M.D.; Zhou, S. Liquefaction behavior of sand-gravel composites. J. Geotech. Eng. 1995, 121, 287–298. [Google Scholar] [CrossRef]
  12. Amini, F.; Chakravrty, A. Liquefaction testing of layered sand-gravel composites. Geotech. Test. J. 2003, 27, 36–46. [Google Scholar] [CrossRef]
  13. Chang, W.J.; Chang, C.W.; Zeng, J.K. Liquefaction characteristics of gap-graded gravelly soils in K0 condition. Soil Dyn. Earthquake Eng. 2014, 56, 74–85. [Google Scholar] [CrossRef]
  14. Chang, W.J. Evaluation of liquefaction resistance for gravelly sands using gravel content–corrected shear-wave velocity. J. Geotech. Geoenviron. Eng. 2016, 142, 04016002. [Google Scholar] [CrossRef]
  15. Chang, W.J.; Phantachang, T. Effects of gravel content on shear resistance of gravelly soils. Eng. Geol. 2016, 207, 78–90. [Google Scholar] [CrossRef]
  16. Hubler, J.F.; Athanasopoulos-Zekkos, A.; Zekkos, D. Monotonic, cyclic, and postcyclic simple shear response of three uniform gravels in constant volume conditions. J. Geotech. Geoenviron. Eng. 2017, 143, 04017043. [Google Scholar] [CrossRef]
  17. Hubler, J.F.; Athanasopoulos-Zekkos, A.; Zekkos, D. Monotonic and cyclic simple shear response of gravel-sand mixtures. Soil Dyn. Earthquake Eng. 2018, 115, 291–304. [Google Scholar] [CrossRef]
  18. Toyota, H.; Takada, S. Effects of gravel content on liquefaction resistance and its assessment considering deformation characteristics in gravel—Mixed sand. Canadian Geotech. J. 2019, 56, 1743–1755. [Google Scholar] [CrossRef]
  19. Chen, G.; Wu, Q.; Sun, T.; Zhao, K.; Zhou, E.; Xu, L.; Zhou, Y. Cyclic behaviors of saturated sand-gravel mixtures under undrained cyclic triaxial loading. J. Earthquake Eng. 2018, 25, 756–789. [Google Scholar] [CrossRef]
  20. Rahman, M.M.; Lo, S.R. Equivalent granular void ratio and state parameters for loose clean sand with small amount of fines. In Proceedings of the 10th Australia New Zealand Conference on Geomechanics, Brisbane, Australia, 20–25 October 2007; pp. 674–679. [Google Scholar]
  21. Thevanayagam, S.; Shenthan, T.; Mohan, S.; Liang, J. Undrained fragility of clean sands, silty sands, and sandy silts. J. Geotech. Geoenviron. Eng. 2002, 128, 849–859. [Google Scholar] [CrossRef]
  22. Evans, M.D.; Seed, H.B. Undrained Cyclic Triaxial Testing of Gravels—The Effect of Membrane Compliance; Report No. UCB/EERC-87/0B; Earthquake Engineering Research Center, University of California: Berkeley, CA, USA, 1987; p. 440. [Google Scholar]
  23. Haeri, S.M.; Shakeri, M.R. Effects of membrane compliance on pore water pressure generation in gravelly sands under cyclic loading. Geotech. Test. J. 2010, 33, 375–384. [Google Scholar] [CrossRef]
  24. Hubler, J.F.; Athanasopoulos-zekkos, A.; Zekkos, D. Pore pressure generation of gravelly soils in constant volume cyclic simple shear. J. Geotech. Geoenviron. Eng. 2023, 149, 04022130. [Google Scholar] [CrossRef]
  25. Lee, K.L.; Albaisa, A. Earthquake induced settlements in saturated sands. J. Geotech. Eng. Div. 1974, 100, 387–406. [Google Scholar] [CrossRef]
  26. Polito, C.P.; Green, R.A.; Lee, J. Pore pressure generation models for sands and silty soils subjected to cyclic loading. J. Geotech. Geoenviron. Eng. 2008, 134, 1490–1500. [Google Scholar] [CrossRef]
  27. Porcino, D.D.; Diano, V. The influence of non-plastic fines on pore water pressure generation and undrained shear strength of sand-silt mixtures. Soil Dyn. Earthquake Eng. 2017, 101, 311–321. [Google Scholar] [CrossRef]
  28. Davis, R.O.; Berrill, J.B. Energy dissipation and seismic liquefaction in sands. Earthquake Eng. Struct. Dyn. 1982, 10, 59–68. [Google Scholar] [CrossRef]
  29. Nemat-Nasser, S.; Shokooh, A. A unified approach to densification and liquefaction of cohesionless sand in cyclic shearing. Canadian Geotech. J. 1979, 16, 659–678. [Google Scholar] [CrossRef]
  30. Towhata, I.; Ishihara, K. Shear work and pore water pressure in undrained shear. Soils Found. 1985, 25, 73–84. [Google Scholar] [CrossRef]
  31. Green, R.A.; Mitchell, J.K.; Polito, C.P. An energy-based excess pore pressure generation model for cohesionless soils. In Proceedings of the John Booker Memorial Symposium—Developments in Theoretical Geomechanics, Sydney, Australia, 16–17 November 2000; pp. 1–10. [Google Scholar]
  32. Jafarian, Y.; Towhata, I.; Baziar, M.H.; Noorzad, A.; Bahmanpour, A. Strain energy based evaluation of liquefaction and residual pore water pressure in sands using cyclic torsional shear experiments. Soil Dyn. Earthquake Eng. 2012, 35, 13–28. [Google Scholar] [CrossRef]
  33. Amini, P.F.; Noorzad, R. Energy-based evaluation of liquefaction of fibre-reinforced sand using cyclic triaxial testing. Soil Dyn. Earthquake Eng. 2018, 104, 45–53. [Google Scholar] [CrossRef]
  34. Amini, P.F.; Huang, D.; Wang, G.; Jin, F. Effects of strain history and induced anisotropy on reliquefaction resistance of Toyoura sand. J. Geotech. Geoenviron. Eng. 2021, 147, 04021094. [Google Scholar] [CrossRef]
  35. Baziar, M.H.; Sharafi, H. Assessment of silty sand liquefaction potential using hollow torsional tests—An energy approach. Soil Dyn. Earthquake Eng. 2011, 31, 857–865. [Google Scholar] [CrossRef]
  36. Kokusho, T. Liquefaction potential evaluations: Energy-based method versus stress-based method. Canadian Geotech. J. 2013, 50, 1088–1099. [Google Scholar] [CrossRef]
  37. Kokusho, T. Liquefaction potential evaluations by energy-based method and stress-based method for various ground motions: Supplement. Soil Dyn. Earthquake Eng. 2017, 95, 40–47. [Google Scholar] [CrossRef]
  38. Kokusho, T.; Kaneko, Y. Energy evaluation for liquefaction-induced strain of loose sands by harmonic and irregular loading tests. Soil Dyn. Earthquake Eng. 2018, 114, 362–377. [Google Scholar] [CrossRef]
  39. Kokusho, T.; Tanimoto, S. Energy capacity versus liquefaction strength investigated by cyclic triaxial tests on intact soils. J. Geotech. Geoenviron. Eng. 2021, 147, 04021006. [Google Scholar] [CrossRef]
  40. Zhou, G.Y.; Pan, K.; Yang, Z.X. Energy-based assessment of cyclic liquefaction behavior of clean and silty sand under sustained initial stress conditions. Soil Dyn. Earthquake Eng. 2023, 164, 107609. [Google Scholar] [CrossRef]
  41. Polito, C.P.; Moldenhauer, H.H.M. Energy dissipation and pore pressure generation in stress− and strain−controlled cyclic triaxial tests. Geotech. Test. J. 2019, 42, 1083–1089. [Google Scholar] [CrossRef]
  42. Yang, Z.X.; Pan, K. Energy-based approach to quantify cyclic resistance and pore pressure generation in anisotropically consolidated sand. J. Mater. Civ. Eng. 2018, 30, 04018203. [Google Scholar] [CrossRef]
  43. Booker, J.R.; Rahman, M.S.; Seed, H.B. GADFLEA—A Computer Program for the Analysis of Pore Pressure Generation and Dissipation During Cyclic or Earthquake Loading; Report No. EERC 76-24; Earthquake Engineering Research Center, University of California: Berkeley, CA, USA, 1976; p. 69. [Google Scholar]
  44. JGS 0111–2009; JGS 0111 Test Method for Density of Soil Particles. Japanese Geotechnical Society: Tokyo, Japan, 2009.
  45. JGS 0162–2009; JGS 0162 Test Method for Minimum and Maximum Densities of Gravels. Japanese Geotechnical Society: Tokyo, Japan, 2009.
  46. Ishihara, K. Liquefaction and flow failure during earthquakes. Geotechnique 1993, 43, 351–451. [Google Scholar] [CrossRef]
  47. Idriss, I.M.; Boulanger, R.W. Soil Liquefaction During Earthquake; Monograph MNO-12; Earthquake Engineering Research Institute: Oakland, CA, USA, 2008; p. 261. [Google Scholar]
  48. Seed, H.B.; Martin, P.P.; Lysmer, J. The Generation and Dissipation of Pore Water Pressures During Soil Liquefaction. Report No. EERC 75-26; Earthquake Engineering Research Center, University of California: Berkeley, CA, USA, 1975; p. 47. [Google Scholar]
  49. Hubler, J.F. Laboratory and In-Situ Assessment of Liquefaction of Gravelly Soils. Ph.D. Thesis, The University of Michigan, Ann Arbor, MI, USA, 2017. [Google Scholar]
  50. Pan, K.; Yang, Z.X. Evaluation of the liquefaction potential of sand under random loading conditions: Equivalent approach versus energy−based method. J. Earthquake Eng. 2020, 24, 59–83. [Google Scholar] [CrossRef]
  51. Seed, H.B.; Idriss, I.M.; Arango, I. Evaluation of liquefaction potential using field performance data. J. Geotech. Eng. 1983, 109, 458–482. [Google Scholar] [CrossRef]
  52. Boulanger, R.W.; Idriss, I.M. Liquefaction susceptibility criteria for silts and clays. J. Geotech. Geoenviron. Eng. 2006, 132, 1413–1426. [Google Scholar] [CrossRef]
  53. Simcock, K.; Davis, R.; Berrill, J.; Mullenger, G. Cyclic triaxial tests with continuous measurement of dissipated energy. Geotech. Test. J. 1983, 6, 35–39. [Google Scholar] [CrossRef]
  54. Berrill, J.B.; Davis, R.O. Energy dissipation and seismic liquefaction of sands: Revised model. Soils Found. 1985, 25, 106–118. [Google Scholar] [CrossRef]
  55. Yamazaki, F.; Towhata, I.; Ishihara, K. Numerical model for liquefaction problem under multi-directional shearing on horizontal plane. In Proceedings of the 5th International Conference on Numerical Methods in Geomechanics, Nagoya, Japan, 1–5 April 1985; pp. 399–406. [Google Scholar]
  56. Law, K.T.; Cao, Y.L.; He, G.N. An energy approach for assessing seismic liquefaction potential. Canadian Geotech. J. 1990, 27, 3. [Google Scholar] [CrossRef]
  57. Yanagisawa, E.; Sugano, T. Undrained shear behaviors of sand in view of shear work. In Proceedings of the 13th International Conference on Soil Mechanics and Foundation Engineering (Special Volume on Performance of Ground and Soil Structures during Earthquakes), New Delhi, India, 5–10 January 1994; pp. 155–158. [Google Scholar]
  58. Liang, L. Development of an Energy Method for Evaluating the Liquefaction Potential of a Soil Deposit. Ph.D. Thesis, Department of Civil Engineering, Case Western Reserve University, Cleveland, OH, USA, 1995. [Google Scholar]
  59. Wang, G.; Takemura, J.; Kuwano, J. Evaluation of excess pore water pressure of intermediate soils due to cyclic loading by energy method. In Proceedings of the Conference of Computer Methods and Advances in Geomechanics (Yuan), Morgantown, WV, USA, 22–28 May 1994; A.A. Balkema Publishers: Rotterdam, The Netherlands, 1994. [Google Scholar]
  60. Polito, C. The Effects of Non-Plastic and Plastic Fines on the Liquefaction of Sandy Soils. Ph.D. Thesis, Virginia Polytechnic Institute and State University, Blacksburg, VA, USA, 1999. [Google Scholar]
  61. Davis, R.O.; Berrill, J.B. Pore pressure and dissipated energy in earthquake—Field verification. J. Geotech. Geoenviron. Eng. 2001, 127, 269–274. [Google Scholar] [CrossRef]
Figure 1. Particle size distribution curves of the tested materials.
Geotechnics 04 00065 g001
Figure 2. Relationships between CSR and the number of loading cycles required to cause initial liquefaction (NL at ru ≥ 0.95.) and cyclic failure (NF at εSA = 5%) for SGMs with different gravel content (Gc): (a) 0%, (b) 10%, (c) 25%, and (d) 45%.
Geotechnics 04 00065 g002
Figure 3. Typical undrained cyclic response of loose SGMs with gravel content of 0, 10, 25 and 40% (Dr = 26–30%; CSR = 0.2).
Geotechnics 04 00065 g003
Figure 4. Variation in pore water pressure generation for loose SGMs with GC = 0, 10, 25, 40% [25].
Geotechnics 04 00065 g004
Figure 5. Variation in pore water pressure generation with normalized number of stress cycles to liquefaction for loose SGMs (Dr = 26–33%) subjected to various CSR conditions: (a) GC = 0%, (b) GC = 10%, (c) GC = 25%, and (d) GC = 40%.
Geotechnics 04 00065 g005
Figure 6. Variation in pore water pressure generation with normalized number of stress cycles to liquefaction for medium-dense SGMs (Dr = 47–54%) subjected to various CSR conditions: (a) GC = 0%, (b) GC = 10%, (c) GC = 25%, and (d) GC = 40%.
Geotechnics 04 00065 g006
Figure 7. Comparison between pore water pressure generation functions reported in the literature for gravelly soils and SGMs [8,23,25,49], and those obtained in this study for SGMs.
Geotechnics 04 00065 g007
Figure 8. Typical undrained cyclic response of medium-dense SGM with GC = 10% subjected to CSR = 0.26: (a) deviator stress–axial strain relationship; (b) pore water pressure ratio variation with Σ W ; (c) Σ W variation with number of loading cycles; (d) Σ W –double amplitude axial strain relationship; and (e) Σ W –axial strain relationship.
Geotechnics 04 00065 g008
Figure 9. Relationships between Σ W and the number of loading cycles required to cause initial liquefaction (NL at ru ≥ 0.95) and cyclic failure (NF at εa = 5%) for SGMs with different gravel content (GC): (a) 0%, (b) 10%, (c) 25%, and (d) 40%.
Geotechnics 04 00065 g009
Figure 10. Relationships between Σ W and CSR for SGMs with different gravel content (GC): (a) 0%, (b) 10%, (c) 25%, and (d) 40% for initial liquefaction (NL at ru ≥ 0.95) and cyclic failure (NF at εa = 5%).
Geotechnics 04 00065 g010
Figure 11. Correlations between Σ W and CRR for SGMs [39,40], this study considering various liquefaction criteria: (a) ru ≥ 95% and εSA = 5%; and (b) εDA = 1, 3 and 5%.
Geotechnics 04 00065 g011
Figure 12. Σ W εDA relationships for SGMs with Dr = 26–33% and 47–60% and subjected to various CSR: (a) GC = 0%; (b) GC = 10%; (c) GC = 25%; and (d) GC = 40%.
Geotechnics 04 00065 g012
Figure 13. ΣWru relationships for loose SGMs (Dr = 26–33%) subjected to various CSR: (a) GC = 0%; (b) GC = 10%; (c) GC = 25%; and (d) GC = 40% [38].
Geotechnics 04 00065 g013
Figure 14. ΣWru relationships for medium-dense SGMs (Dr = 47–54%) subjected to various CSR: (a) GC = 0%; (b) GC = 10%; (c) GC = 25%; and (d) GC = 40% [38].
Geotechnics 04 00065 g014
Figure 15. Comparison of ΣWru relationships obtained for all SGMs tested in this study.
Geotechnics 04 00065 g015
Table 1. Index properties of the tested materials.
MaterialsGc (%)D50 (mm)GsemaxeminCuCc
GC000.262.660.8890.5382.500.90
GC10100.292.660.7390.4942.770.66
GC25250.412.660.6320.4154.500.42
GC40400.902.660.5200.34311.760.47
Note: D50 = mean diameter; Gs = specific gravity; emax and emin = maximum and minimum void ratio, respectively; Cu and Cc = coefficient of uniformity and gradation, respectively.
Table 2. List of undrained cyclic triaxial tests performed in this study.
TestGC (%)Dr* (%)Dr
(%)
Dr,ic (%)CSRru ≥ 0.95εSA = 5%N/NLru = f(WF)
NL Σ WLCRRL Σ WL*NF Σ WFCRRF Σ WF*αR2βR2
102529.731.50.2026.70.01410.1780.0147.00.01890.1780.0180.930.993600.96
228.632.40.17017.50.014117.60.01750.590.962690.93
331.133.10.14556.30.015356.60.01820.390.851470.98
44546.347.20.3484.60.03850.2790.0414.80.05580.2790.0570.670.911040.95
546.650.80.25524.00.042824.60.06430.680.95750.95
645.148.00.20084.70.042485.60.04900.730.92860.93
75555.056.90.3408.70.04430.3090.0459.80.05820.3150.0611.980.931330.95
856.059.50.31613.00.042813.70.06740.600.96730.98
957.060.40.28523.60.047324.70.05760.540.94780.98
10102528.631.50.20011.00.01690.1930.01711.60.02510.1940.0260.800.983360.96
1125.928.90.18228.00.020128.60.03090.750.931860.92
1225.930.50.17624.00.015624.60.02480.490.952240.97
1326.728.90.15296.00.019797.60.03350.600.891440.95
143535.538.80.2608.70.02390.2360.0249.70.03650.2390.0391.190.972170.95
1534.936.70.22716.00.021217.60.04030.840.982060.96
1634.836.70.18094.00.030695.60.05180.590.86790.95
174547.949.50.3177.80.03700.2880.0398.80.05130.2920.0561.750.941490.96
1845.047.40.28615.60.037916.60.05630.720.991070.98
1950.450.90.25730.00.041532.70.06800.950.98990.94
20252525.830.00.2276.00.01510.2070.0226.10.02500.2080.0350.730.993600.98
2123.926.70.20646.00.026547.60.04420.480.941290.95
2226.230.20.20339.80.028641.70.04480.700.971470.91
2324.130.20.18222.00.017522.10.02260.640.963020.96
2426.430.00.15878.00.025578.70.04310.400.891080.97
253535.237.80.26513.00.03300.2580.03114.20.06610.2620.0621.000.991460.93
2632.137.40.24023.00.025823.70.03590.690.971570.97
274040.746.00.30511.00.03100.2920.03213.60.06630.2980.0661.220.981310.95
2839.445.30.26237.00.034939.70.06540.380.98670.99
2940.347.30.25536.00.042338.70.09210.640.45620.95
304544.752.10.3975.00.03370.3260.0407.70.07770.3460.0912.140.931470.97
3144.752.50.35111.00.043515.70.09762.170.891340.94
3246.552.40.30022.00.036927.70.09820.910.97880.94
3348.154.10.24573.00.051778.70.11010.440.96540.99
345554.461.40.48112.00.10310.4250.09915.70.17200.4700.1563.380.78830.93
3555.559.80.47810.00.082014.70.15753.560.77940.95
3655.360.00.36620.00.111920.70.13610.770.98570.99
3756.561.10.27454.00.111060.80.19920.790.99670.96
38402524.425.60.25110.00.01670.2410.01911.20.04170.2430.0440.920.992430.97
3925.731.50.24715.00.024716.60.04800.880.981670.95
4025.629.40.23316.00.016717.60.04140.790.981990.96
4125.829.40.20853.00.018774.80.03871.000.991630.97
424547.851.50.42113.00.08670.3910.08622.70.25230.4720.2262.230.9680.96
4346.350.30.34120.00.085126.80.18881.490.911040.95
4445.848.40.27747.70.089859.80.26270.960.92600.99
Note: Dr* = nominal relative density; Dr = measured relative density; Dr,ic = consolidated relative density; CSR = cyclic stress ratio; NL = number of cycles to liquefaction (ru ≥ 0.95); Σ WL = cumulative dissipated energy to liquefaction; CRRL = cyclic resistance ratio for ru ≥ 0.95; Σ WL* = cumulative dissipated energy with respect to CRRL; NF = number of cycles to cyclic failure (εSA = 5%);   Σ WF = cumulative dissipated energy to cyclic failure; CRRF = cyclic resistance ratio for cyclic failure; Σ WF* = cumulative dissipated energy with respect to CRRF; α = pore water pressure parameters for stress-based method (Equation (2)); and β = pore water pressure parameters for energy-based method (Equation (8)).
Table 3. Summary of the fitting parameters for Σ W C R R relations based on the experimental finding from this study on SGMs and previous studies on gravelly soils and SGMs.
ReferenceCRR CriterionABCR2
This study ε D A = 1%, NL = 15 0.0540.087−0.0040.97
ε D A = 3%, NL = 150.497−0.0490.0060.99
ε D A = 5%, NL = 150.623−0.0460.0060.99
r u = 1, NL = 151.177−0.3670.0440.97
ε S A = 5%, NL = 151.383−0.3310.0400.93
Kokusho and Tanimoto [39] ε D A = 5%, NL = 152.7−0.540.0350.92
Zhou et al. [40] ε S A = 5%, NL = 201.27−0.2720.0189-
Table 4. Fitting parameter β and R2 value.
GC (%)0102540
Dr (%)31–3347–5157–6029–3237–3947–9127–3037–3845–4752–5460–6126–3248–52
β 199.882.677.85186.8110.9106.9177.8153.370.7469.1967.78178.670.21
R20.880.940.980.910.840.950.850.950.920.910.950.950.94
Disclaimer/Publisher’s Note: The statements, opinions and data contained in all publications are solely those of the individual author(s) and contributor(s) and not of MDPI and/or the editor(s). MDPI and/or the editor(s) disclaim responsibility for any injury to people or property resulting from any ideas, methods, instructions or products referred to in the content.

