1. Introduction
Azerbaijan region is located in the northwest of Iran. Urmia Lake is located in this region and is the largest salt lake in the Middle East and the sixth-largest salt lake on earth. In spite of the unique properties of this region, few researchers have tended to collect information on these properties [
1].
Figure 1 shows the location of this lake on the map of Iran as well as pictures of the lake. In 1980, a causeway was constructed over this lake to shorten the road distance between Iran and Europe. In addition, considering the eye-catching scenery of this region, this project is essentially important from economic and tourism industry perspectives.
The causeway connects the east and west of Azerbaijan and shortens the road distance between them, which is a great contribution to the residents of these two provinces in terms of intercity transportation. Several cone penetration text (CPTu) tests were carried out at a depth of about 100 m for the construction of this causeway. Different in situ and laboratory tests were also undertaken for local exploration of the project, and due to environmental concerns, a bridge was included in the middle of the causeway. Site surveys and local explorations are the first steps in designing a land or marine structure [
2,
3,
4,
5,
6]. Effective soil improvement methods are important measures taken to ensure the strength required to erect the project on soft or problematic soils because erecting a project on a problematic land without taking the necessary measures involves the risk of serious human and material damage. Problematic soils can be seen on marine and land sediments, and soil improvement in both sediments is of interest to researchers [
7,
8,
9,
10,
11,
12,
13,
14,
15]. The results of tests on treated soft marine sediments showed that for a given water–cement ratio, the strength of the treated soil appears to increase with the soil–cement ratio, and empirical relations for the modulus and strength of marine–clay–cement mix were proposed [
12]. According to another study, the properties of Singapore soft marine clays improved by cement mixing, and this improvement helped to reduce the ground movement in the retaining walls [
13]. Different methods and materials can be used in soil improvement [
12].
Considering soft clay sediment conditions in UL, 400 piles were used to ensure adequate strength and improve soil prior to the construction of the bridge over this lake. Laboratory test results, as well as CPTu test results, were used extensively in design works.
Considering the importance of investigating the geotechnical properties in sea, marine, and lake regions such as Laurentian Great Lakes, Lake Urmia, Lake Michigan, and others, diverse studies have been conducted by different researchers in this domain [
16,
17,
18,
19,
20,
21,
22,
23,
24,
25,
26,
27,
28,
29,
30].
Various researchers have studied the characteristics of lake and marine sediments in different regions of the world.
Table 1 presents some of the results of these studies. Song et al. (2021) reported the engineering properties of deep marine soft clay in the Guangdong–Hong Kong–Macao Greater Bay Area. According to this study, geotechnical characterization of this area was reported and analyzed [
14]. Marine clays from the eastern coast of India were studied by Basack and Purkayastha (2009) and by Bushra and Robinson (2009) [
31,
32]. They reported that the marine sediments in this area mainly consisted of high plasticity soils, and their organic matter content was about 5%. Rahman et al. (2013) studied marine sediments in Malaysia and reported that 81% of the sediments were fine-grained ones and, according to the Casagrande plasticity chart, high plasticity soils constituted the sediments [
33]. Otoko and Blessing (2014) researched marine sediments in Nigeria and determined the specific gravity of soil, its organic matter content, and the types of sediment [
34]. They also reported that the mean moisture content of the deep-sea sediments was 89%. Izabel, Sangeetha, and Tongwei et al. (2014) carried out research on marine sediments in India. They reported that the liquid limit and the plasticity index were 58% and 23%, respectively, which indicated that the sediments consisted of high-plasticity silt [
35,
36]. Pakir et al. (2014) studied marine sediments in Malaysia. Their results suggested that the specific gravity of the sediments in the study area was about 2.6, and they were MH sediments according to the Casagrandeh classification chart [
37]. The research that Yunus et al. conducted on marine sediments in Malaysia in 2015 indicated that the liquid limit and plasticity index in the study area were 58% and 36%, respectively. Research on marine sediments in India showed that fine-grained sediments constituted about 95% of the total sediments, and their specific gravity was 2.4 [
38]. Kiran and Prasad (2016) carried out research on marine sediments in India and reported that the liquid limit and the plasticity index were 73% and 32%, respectively, which indicated that the MH sediments type [
39]. Myint et al. (2015) studied marine sediments and reported that they were high plasticity clay soils, and their moisture content was in the 40–60% range [
40]. Mengy et al. (2023) studied marine sediments in China. The results found suggested that the liquid limit and the plasticity index were 60.5% and 25.2%, respectively, and they were MH type of sediments [
41].
Considering the importance of geotechnical characterizations in design works and site explorations, structural design, and environmental issues, in the present study, a number of laboratory and in situ test results were used to determine different parameters such as soil strength, Atterberg limits, undrained shear strength, and natural water content. Soil consolidation evaluation parameters such as compression index, soil classification using Casagrande’s chart, and determining the number of soil profiles in depth are the other subjects investigated in the present study. The main minerals and soil components were identified using XRD and XRF analysis, and the microscopic structure of the sediments was investigated using SEM microscopes. Furthermore, parameters are analyzed in each section and applied relationships are presented for estimating the soil parameters in this area. Finally, the results of this research are compared with those of other similar research.
2. Geology of UL
Geological information on the site helps in a better understanding of geotechnical characteristics [
42,
43]. Studies have shown that shale and limestone of the Cretaceous and Permian eras are found in the sedimentary rocks situated under the current deposits of the lake. According to the research, igneous rocks have been known to contain volcanic breccias, trachyandesite-dacy, and granite [
44]. Alongside the lake islands and shoreline, this region has experienced complicated folding, fractures with multiple rock outcrops, as well as faults. As is known, Lake Urmia has been created in a natural depression with the coordinates that have been geographically described as 37°06′15″ and 38°15′15″ North and 45°00′13″ and 45°55′20″ East. Moreover, the average area has been estimated to be ~5000 km
2. Therefore, researchers have examined current investigations of the geological deposits of the Pleistocene period [
44].
With regard to the research, the fallout and traction processes from suspension are involved in the creation of sediments. Hence, we may use a depositional model to explain the complicatedness of the sediments. The model prevails for the lake that illustrates the impacts of Brownian forces, which have been applied between various particles. According to the mentioned process, the flocculated clay particles will stick to the fine particles of silt and sand grains and result in their rapid settlement. Then, this process is accelerated by the ions and cations’ concentration in super salt water. Based on the above condition, underconsolidation of the top layers is largely observed, though very great flocculated compressibility of the upper soft clay layers occurs under continuous consolidation. In fact, analysis has shown their collapsible structures under dynamic loading (earthquake) conditions [
44].
Furthermore, organic matter is found in the lower part of the sediments that are considered the remains of species such as Artemia salina and algae possiblly resistant to the salty waters. Some researchers referred to the production of a dark-colored sludge through oxidation, and other researchers have made a summary of the structures’ sequence and range as five main units with local stratigraphic prominence [
45]. The main origin of the sediments is constituted of lithogenous sediments. Although Artemia populations are found in UL, because of their small size and limited number, and also due to the scant vegetation in this lake and the salinity of the water in it, the effects of the organic matter on the geotechnical characteristics of the sediments in UL are much less considerable than in freshwater lakes, where there is usually very great biodiversity.
3. Methodology
In the present study, laboratory and in situ tests are used to determine different geotechnical parameters. In situ tests are important, because they make it possible to evaluate soil properties at the project site. The laboratory test results are also required to determine some of the soil’s properties. Using the results of both types of tests contributes to the accurate determination of sediment properties. Determining the properties of undisturbed soil on the site is an important advantage of in situ tests because the samples are disturbed to a considerable extent during the transportation and test process. Moreover, using undisturbed samples is not required in some tests, and disturbing the samples has no effect on soil parameters, such as sieve analysis and Atterberg limits. Results of 55 in situ tests, are used in the present study. In the following, explanations are provided regarding sampling and conducting tests.
Cone penetration test (CPTu): In this test, a cone was pushed into the soil at a speed of 2 cm per second, and the information obtained from the sensors was recorded. Tip resistance profile, sleeve friction strength, and excess pore water pressure are measured using the CPTu test. This test was performed according to conventional test methods. Also, sediment classification was investigated using the Eslami–Fellenius method [
45]. Hydrostatic water pressure was compared to excess pore water pressure extracted from the CPTu test, and valuable information was achieved.
Standard penetration test (SPT): In SPT, the soil conditions are evaluated using the number of impacts needed to penetrate the sampling device into the sediments. In this test, the number of required impacts was measured for a 3–15 cm penetration, and the number of impacts required for the last 30 cm penetration was shown by Nspt. Considering different correlations proposed by different research in the evaluation of the geotechnical properties of sediments, using these test results can help determine the sediment’s properties. ASTM 1586 was used to perform and evaluate the SPT tests.
Vane shear test (VST): In the vane shear test (VST), the strength of fine-grained soils against rotations of a vane was measured. Considering the importance of this test in determining fine-grained soil behavior, the results of this test were used in the present study. Soil sensitivity is an important parameter, which is measured by evaluating the undisturbed soil strength to disturbed soil strength ratio. ASTM 2573 was used to perform and evaluate the parameters of vane shear tests. The vane shear test apparatus consisted of two orthogonal stainless steel blades attached to a steel rod. The test included inserting the blades to the desired depth and rotating them around the vertical axis at the rate of 0.1 degrees per second. The torque was measured by turning the vanes. The maximum applied torque and the shear resistance resulting from it was considered to be the shear strength in the disturbed state. The vanes were turned at least 5–10 times to calculate the residual shear strength. Following that, the maximum applied torque and the equivalent shear strength were calculated.
Results from 255 different laboratory tests were also used in the present study. Consolidation tests were made on undisturbed samples, and other laboratory tests were carried out on disturbed samples.
Preparing Undisturbed samples: These samples were extracted and tested by U4 and thin-walled sampling devices. Preparing some of the samples required excavation to a depth of 150 m. ASTM 6913 was used to evaluate soil gradation, and the results were used in the classification of the soil and measuring the soft soil content.
Atterberg limits test: The liquid limit and plastic limit information is very important in the classification of fine-grained soils. The liquid limit and plastic limit were measured using ASTM 4318, and the soil was sieved using a 40 mesh. The liquid limit is the water content at which soil changes from a plastic to a liquid state and is determined using a Casagrandeh cup, and the plastic limit is the water content at the change from a plastic to a semi-solid state and determined using the thread method. The values extracted for liquid and plastic limits were used to determine the plasticity index. Casagrande’s chart is commonly used for the classification of fine-grained soils. In this method, the liquid limit (LL) and plasticity index (PI) were used to classify the soil by the respective chart. In this method, the soil is classified in accordance with ASTM D2487.
Consolidation test: This test is used for determining the settlement properties of fine-grained soils and is an important geotechnical test. In the present study, the results of consolidation tests were used to investigate the settlement and compressibility properties of the sediments. In these tests, saturated undisturbed samples (5 cm diameter) underwent different loads, including 25, 50, 100, 200, 400, and 800 Kpa, and e-log p diagrams were extracted. The coefficient of compressibility (Cc) of the soil was also measured based on the depth. The consolidation test was carried out in accordance with ASTM D2435.
Specific gravity test: Considering the fact that the specific gravity of soil is required for drawing soil consolidation diagrams, ASTM D 845 was used to measure this parameter. Soil sieved by a 4 mesh and a 250 mL pycnometer were used in the tests.
X-ray diffraction (XRD) analysis, X-ray fluorescence (XRF), and SEM analysis: The XRD test were used to better understand the characteristics of lake sediments. The XRF test results were used to identify the chemical compounds in the UL sediments. In the XRD and XRF tests, 50 g of powdered soil was used. Microscopic SEM images of the examined soil can help to better understand the soil particles. The method of conducting these tests was based on the usual laboratory methods.
4. Results and Discussion
4.1. XRF, XRD, and SEM
The results of the XRD analysis test are shown in
Figure 2. The main minerals identified in these sediments include calcite, dolomite, quartz, calcium chloride, and halite, and the salinity of the lake water is due to the presence of calcium chloride and halite minerals. The Cao factor seen in chemical compounds can have a significant effect on the cohesion of soil particles to each other.
The results of the XRF analysis are presented in
Table 2. According to these results, SiO
2 had the highest and TIO
2 the lowest percentage in the composition, and organic content was about 25%. To compare the results of the present research with those of other studies, the findings in East Lake (Wuhan) were used [
41]. This comparison is presented in
Table 2. The SiO
2 and Al
2O
3 contents of East Lake (Wuhan) are considerably larger compared to UL. However, the CaO content of UL is higher than that of East Lake (Wuhan), indicating the stronger cohesive sediment characteristics and cementation of sediments in UL. There are differences between these two lakes in terms of other elements and compounds, but these differences are not very important from the geotechnical aspects.
The microscopic SEM image of the examined soil can help to better understand the soil particles.
Figure 3 shows the SEM image of a soil sample. Salt crystals can be seen because they are formed due to the salinity of UL water. As shown in
Figure 3b, soil particles are held together by natural cementing agents. There are several reasons for the adhesion of these particles. The results of XRF testing indicate that CaO accounts for 19.6% of UL sediments. In addition, XRD testing shows the presence of calcite. This material is one of the main agents holding the particles together, thus helping them to stick together better and thereby considerably increasing the resistance of the sediments.
4.2. Sediment Layering
It is crucial to obtain information concerning the status of the sediment layering in the sea, river, and ocean in order to conduct designs in that regard. Samples were collected from the different depths of a borehole, and their results were utilized to assess its stratification. The data were interpreted using the Atterberg limit experiments. The results of the investigation carried out at a depth of 145 m of the respective lake bed was examined. Considering the necessity of collecting appropriate samples to determine their properties, the U4 and thin-walled sampling methods were employed. Collecting undisturbed samples was impossible in the primary depths down to 10 m below the surface due to the high water content and softness of the soil. The undisturbed samples were collected at a greater depth.
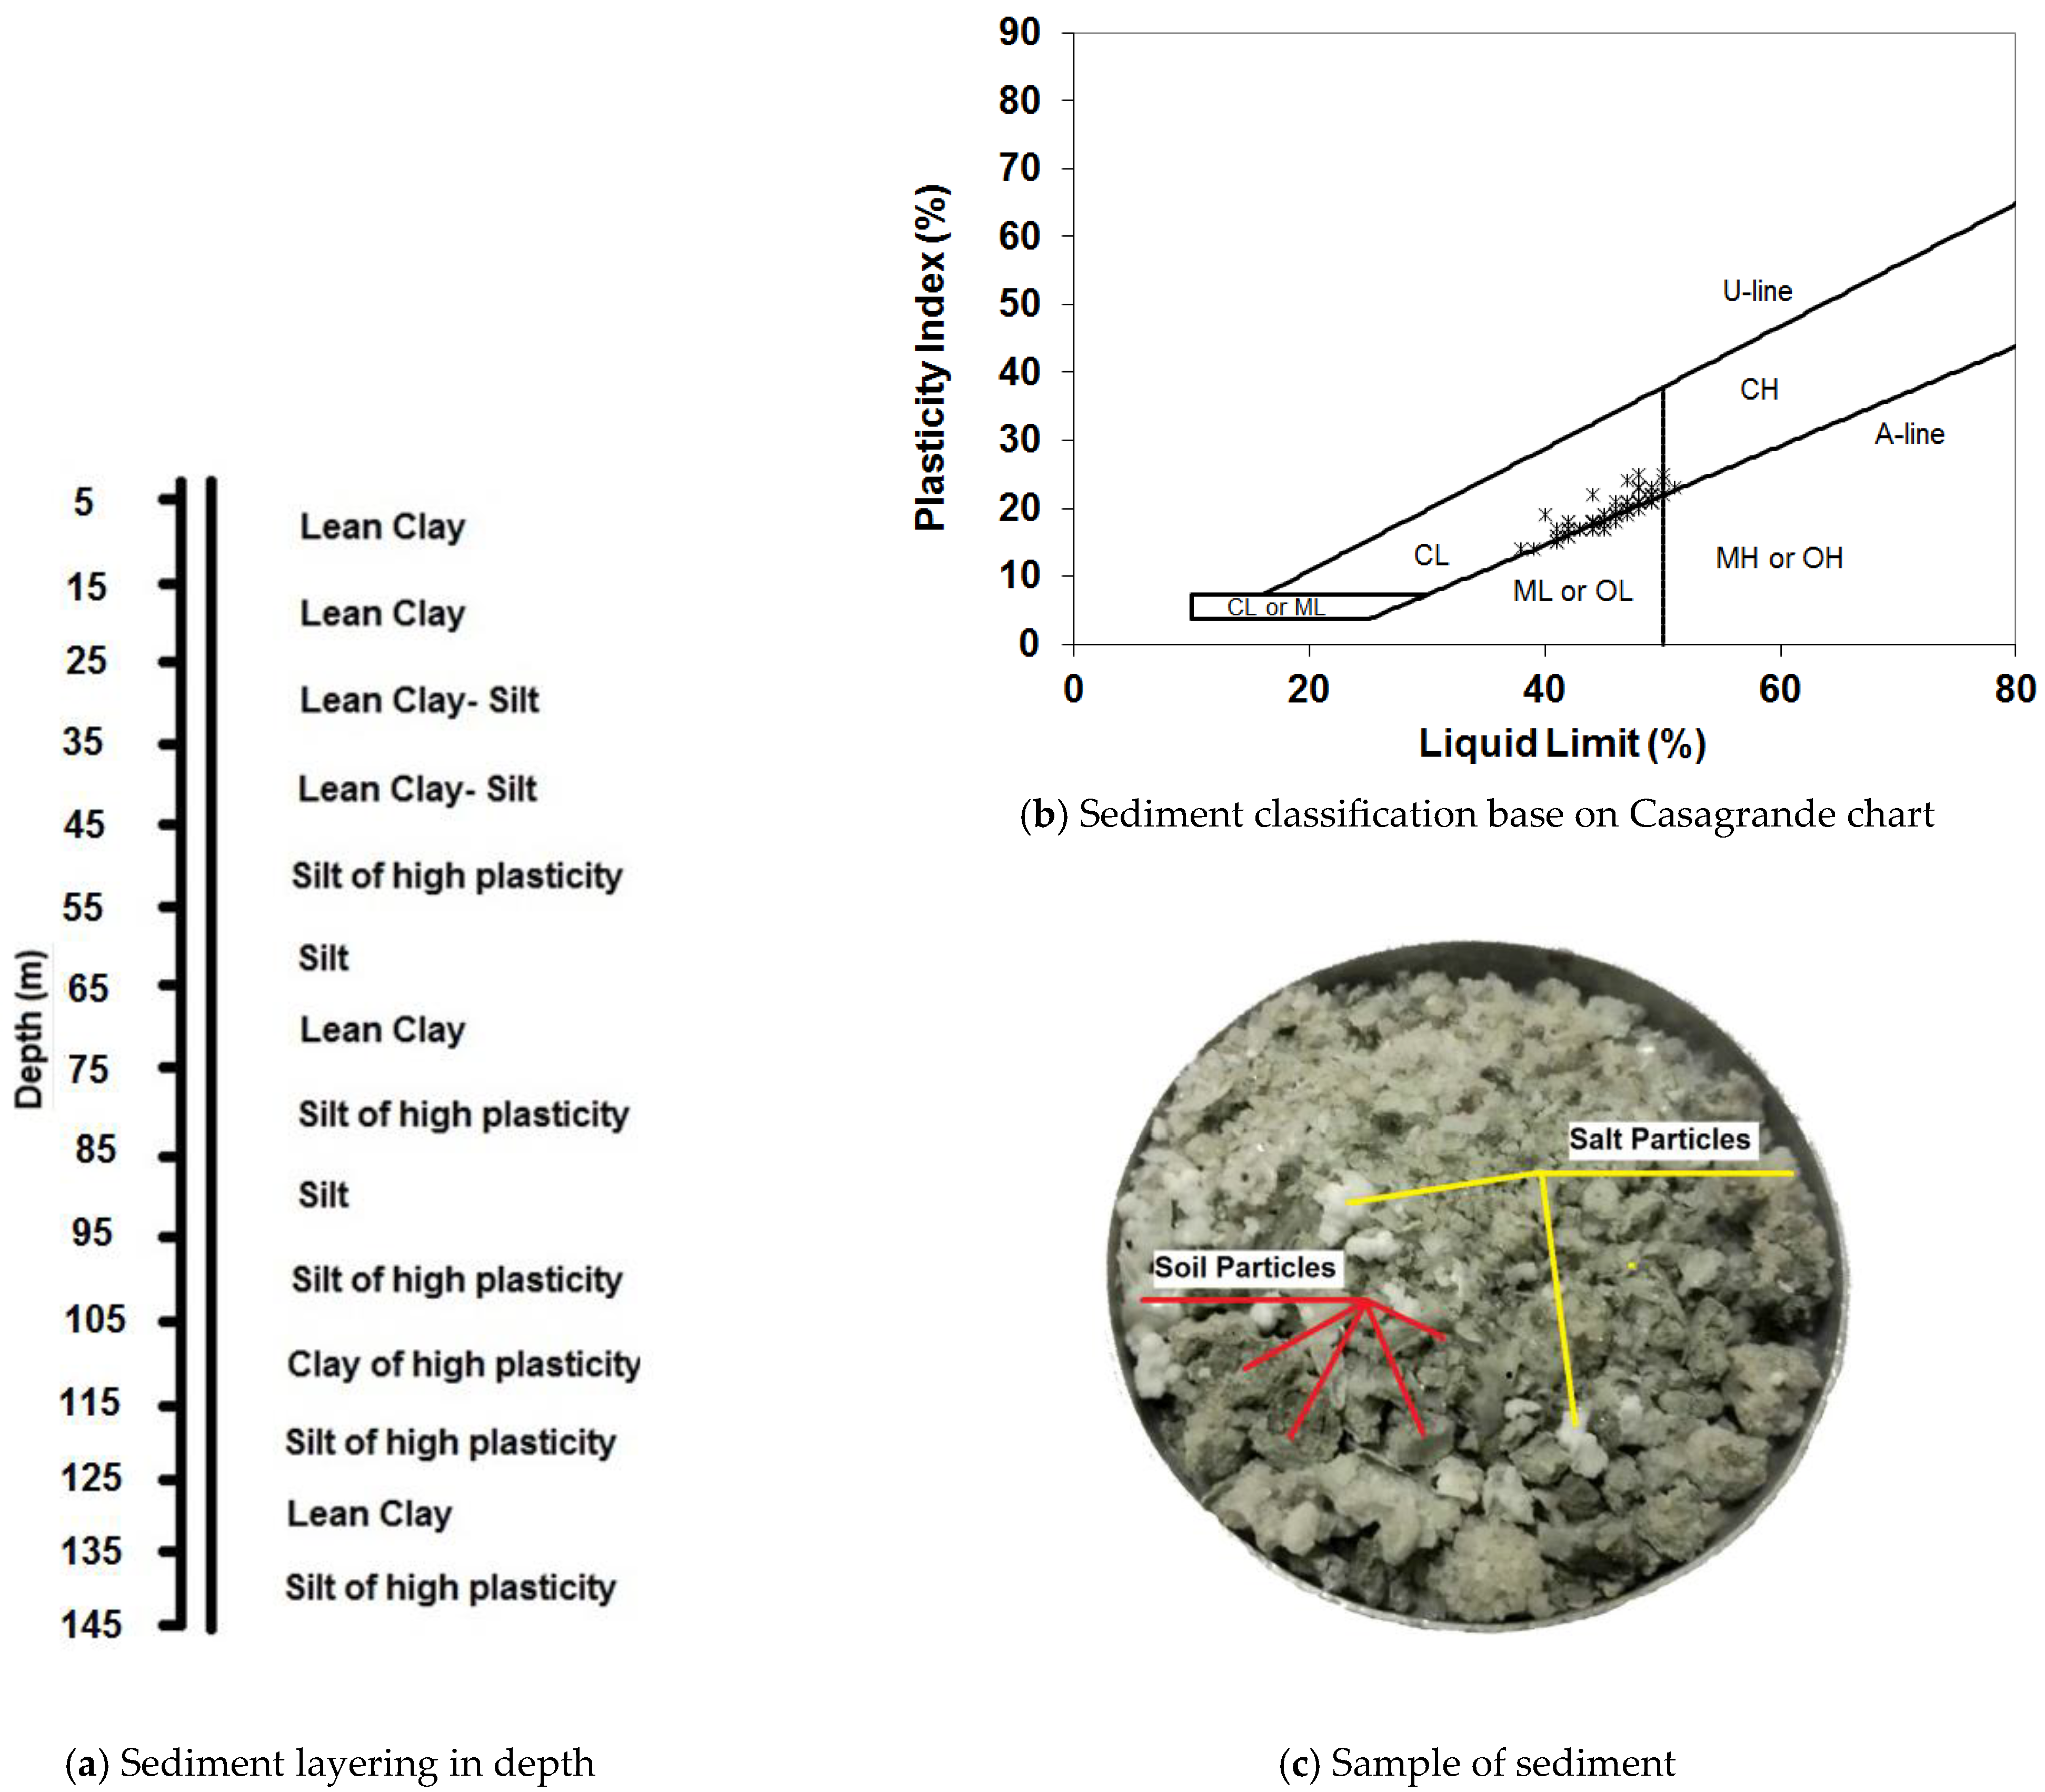
Figure 4a,b shows the results of sediment layering, Casagrandeh classification, and an image of a sample of sediments.
In accordance with this Figure, the lake sediment components constitute lean clay, silt, and silt of high plasticity, and their thickness ranges between 5 to 20 m. The Casagrande chart is crucial in terms of identifying the fine-grained sediment classification.
Figure 4c shows the Casagrande chart from various boreholes for a more accurate identification of the soil stratification. In this method, the liquid limit and plastic index of soil were employed to evaluate the sediment classification. In accordance with this diagram, a large part of the sediments consisted of clay sediments with low plasticity (lean clay) and silt.
4.3. CPTu Profile
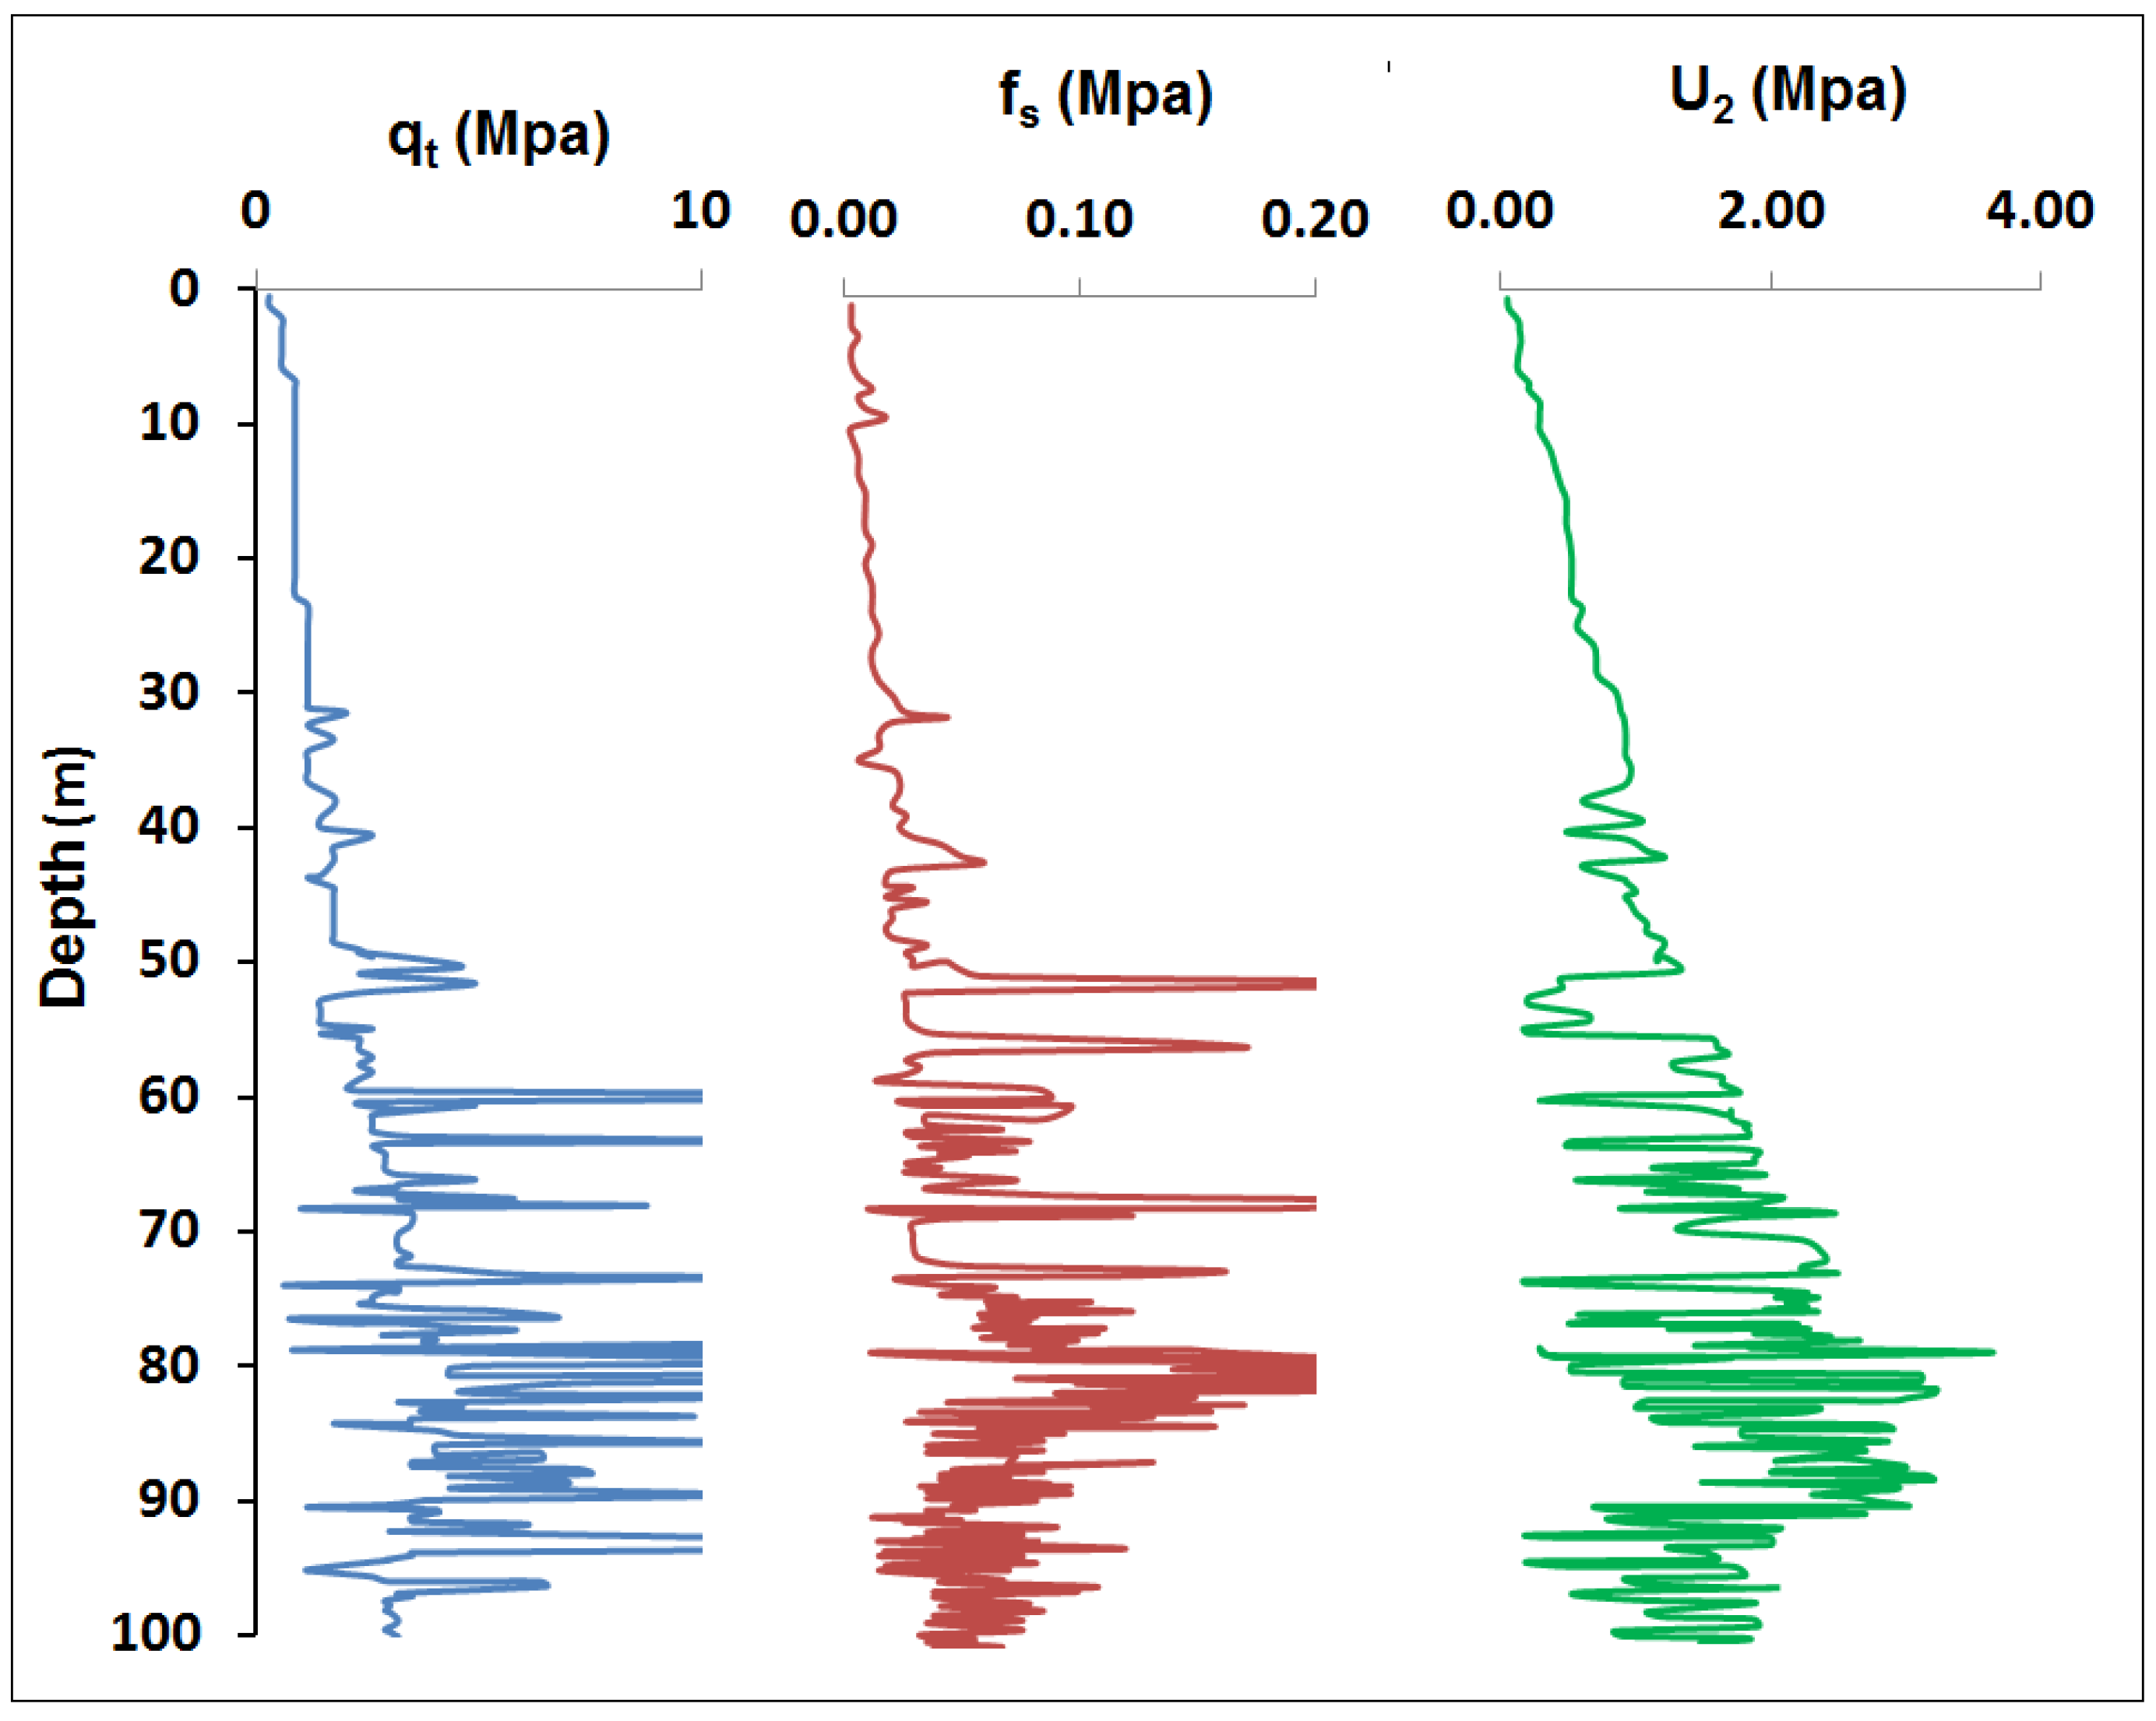
CPTu test is among the practical tests in geotechnical engineering, particularly in determining the properties of marine sediments. The present research utilized the results of this test. The parameters of this test constitute tip resistance (qt), sleeve friction (fs), and excess pore-water pressure (U2). Taking into account that a consistent profile is obtained from the soil in various depths, the achieved information is invaluable.
Figure 5 shows the U2 profiles, qt, and fs in one of the CPTUs carried out at this site. Comparing the hydrostatic pressure of water and PWP obtained from CPTu provided valuable information regarding the type of sediments of this location. This Figure manifests that the U2 level is higher than hydrostatic pore-water pressure at all of the assessed depths, which indicates that these sediments were composed of clay. On the other hand, as the depth increases, the hydrostatic pressure of water gets closer to U2 pressure, which might be due to the sand lenses at this depth. Profiles of qt and fs are an indication of clay sediments at various depths. Other profiles in CPTu demonstrated similar results.
One of the crucial applications of CPTus is sediment classification. This method was employed to determine the sediments bearing these properties in order to classify the sediments on the basis of their behavior. The present research has used this method to determine the sediment types of UL. Various researchers proposed diagrams in this field to classify sediments [
45,
46,
47,
48,
49]. The following are a few types of research carried out in this regard. Using the parameters of the CPTu, Douglas and Olsen presented a chart in 1981 that can be used for classifying sediments [
46]. Jefferies and Davies (1991) introduced a method for sediment classification that was based on cone tip resistance and sleeve friction [
47]. Robertson et al. (1985) proposed a chart for assessing the types of sediments by using the friction ratio (f
s/q
c) [
48]. Robertson (1990) introduced another chart based on the friction ratio (f
s/q
c) for the assessment of sediment classification that was more complete compared to the previous one [
49]. Eslami and Fellenius (1997) suggested a chart for classifying sediments by using the u
2, q
e, and f s parameters [
45]. Their chart used the three parameters obtained from the CPTu for this classification.
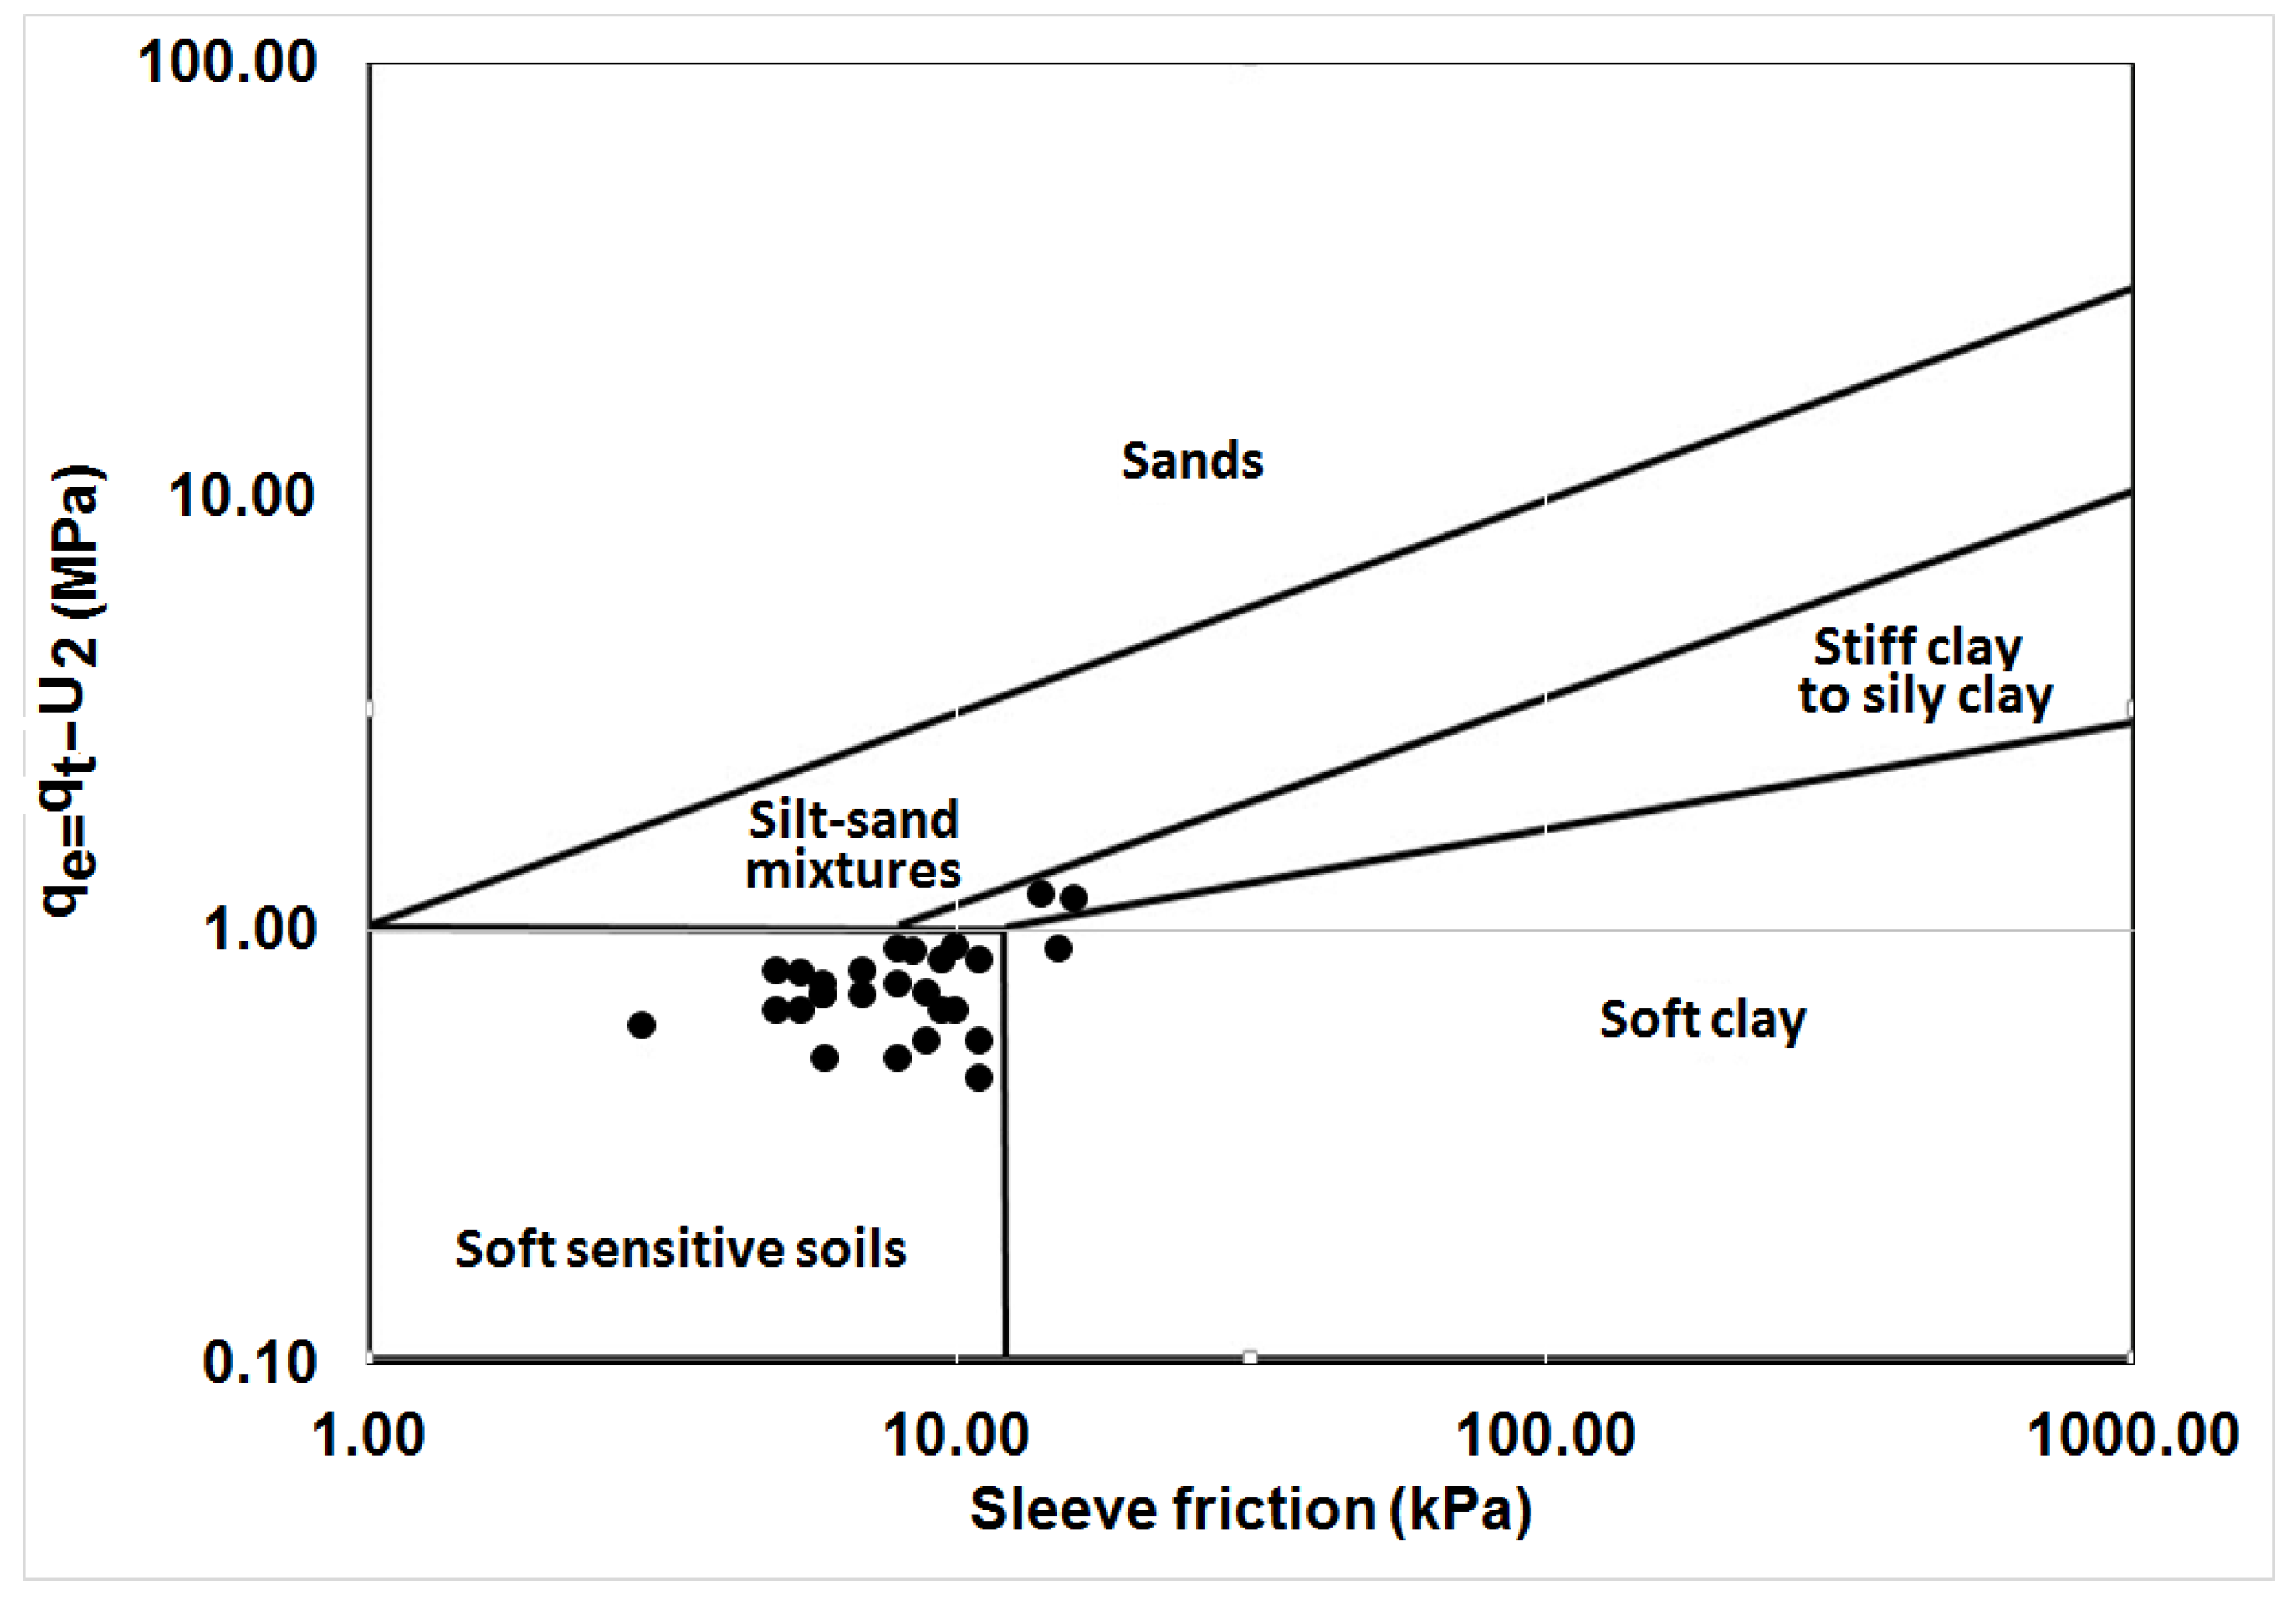
The present research used the Eslami–Fellenius [
45] method, which is one of the best methods regarding the marine sediments’ classification. In this method, three parameters of q
t, U2, and cone sleeve friction were used together to assess the type of sediments.
Figure 6 shows that a large part of the sediments was soft sensitivity clay, and there were soft clay and silt as well. As seen in this Figure, the majority of sediments are soft sensitive clay, which requires sufficient precision when conducting a design regarding these sediments.
4.4. Natural Water Content and Atterberg Limits
Even though the assessment of the water content of samples in the coarse-grained soil is not quite important in understanding their behavior, this parameter is considerably important in the behavior of sediments in fine-grained soils [
50]. Thus, for a better understanding of the condition of the sediments of UL, the profile of the water content of sediments was assessed in comparison to the depth.
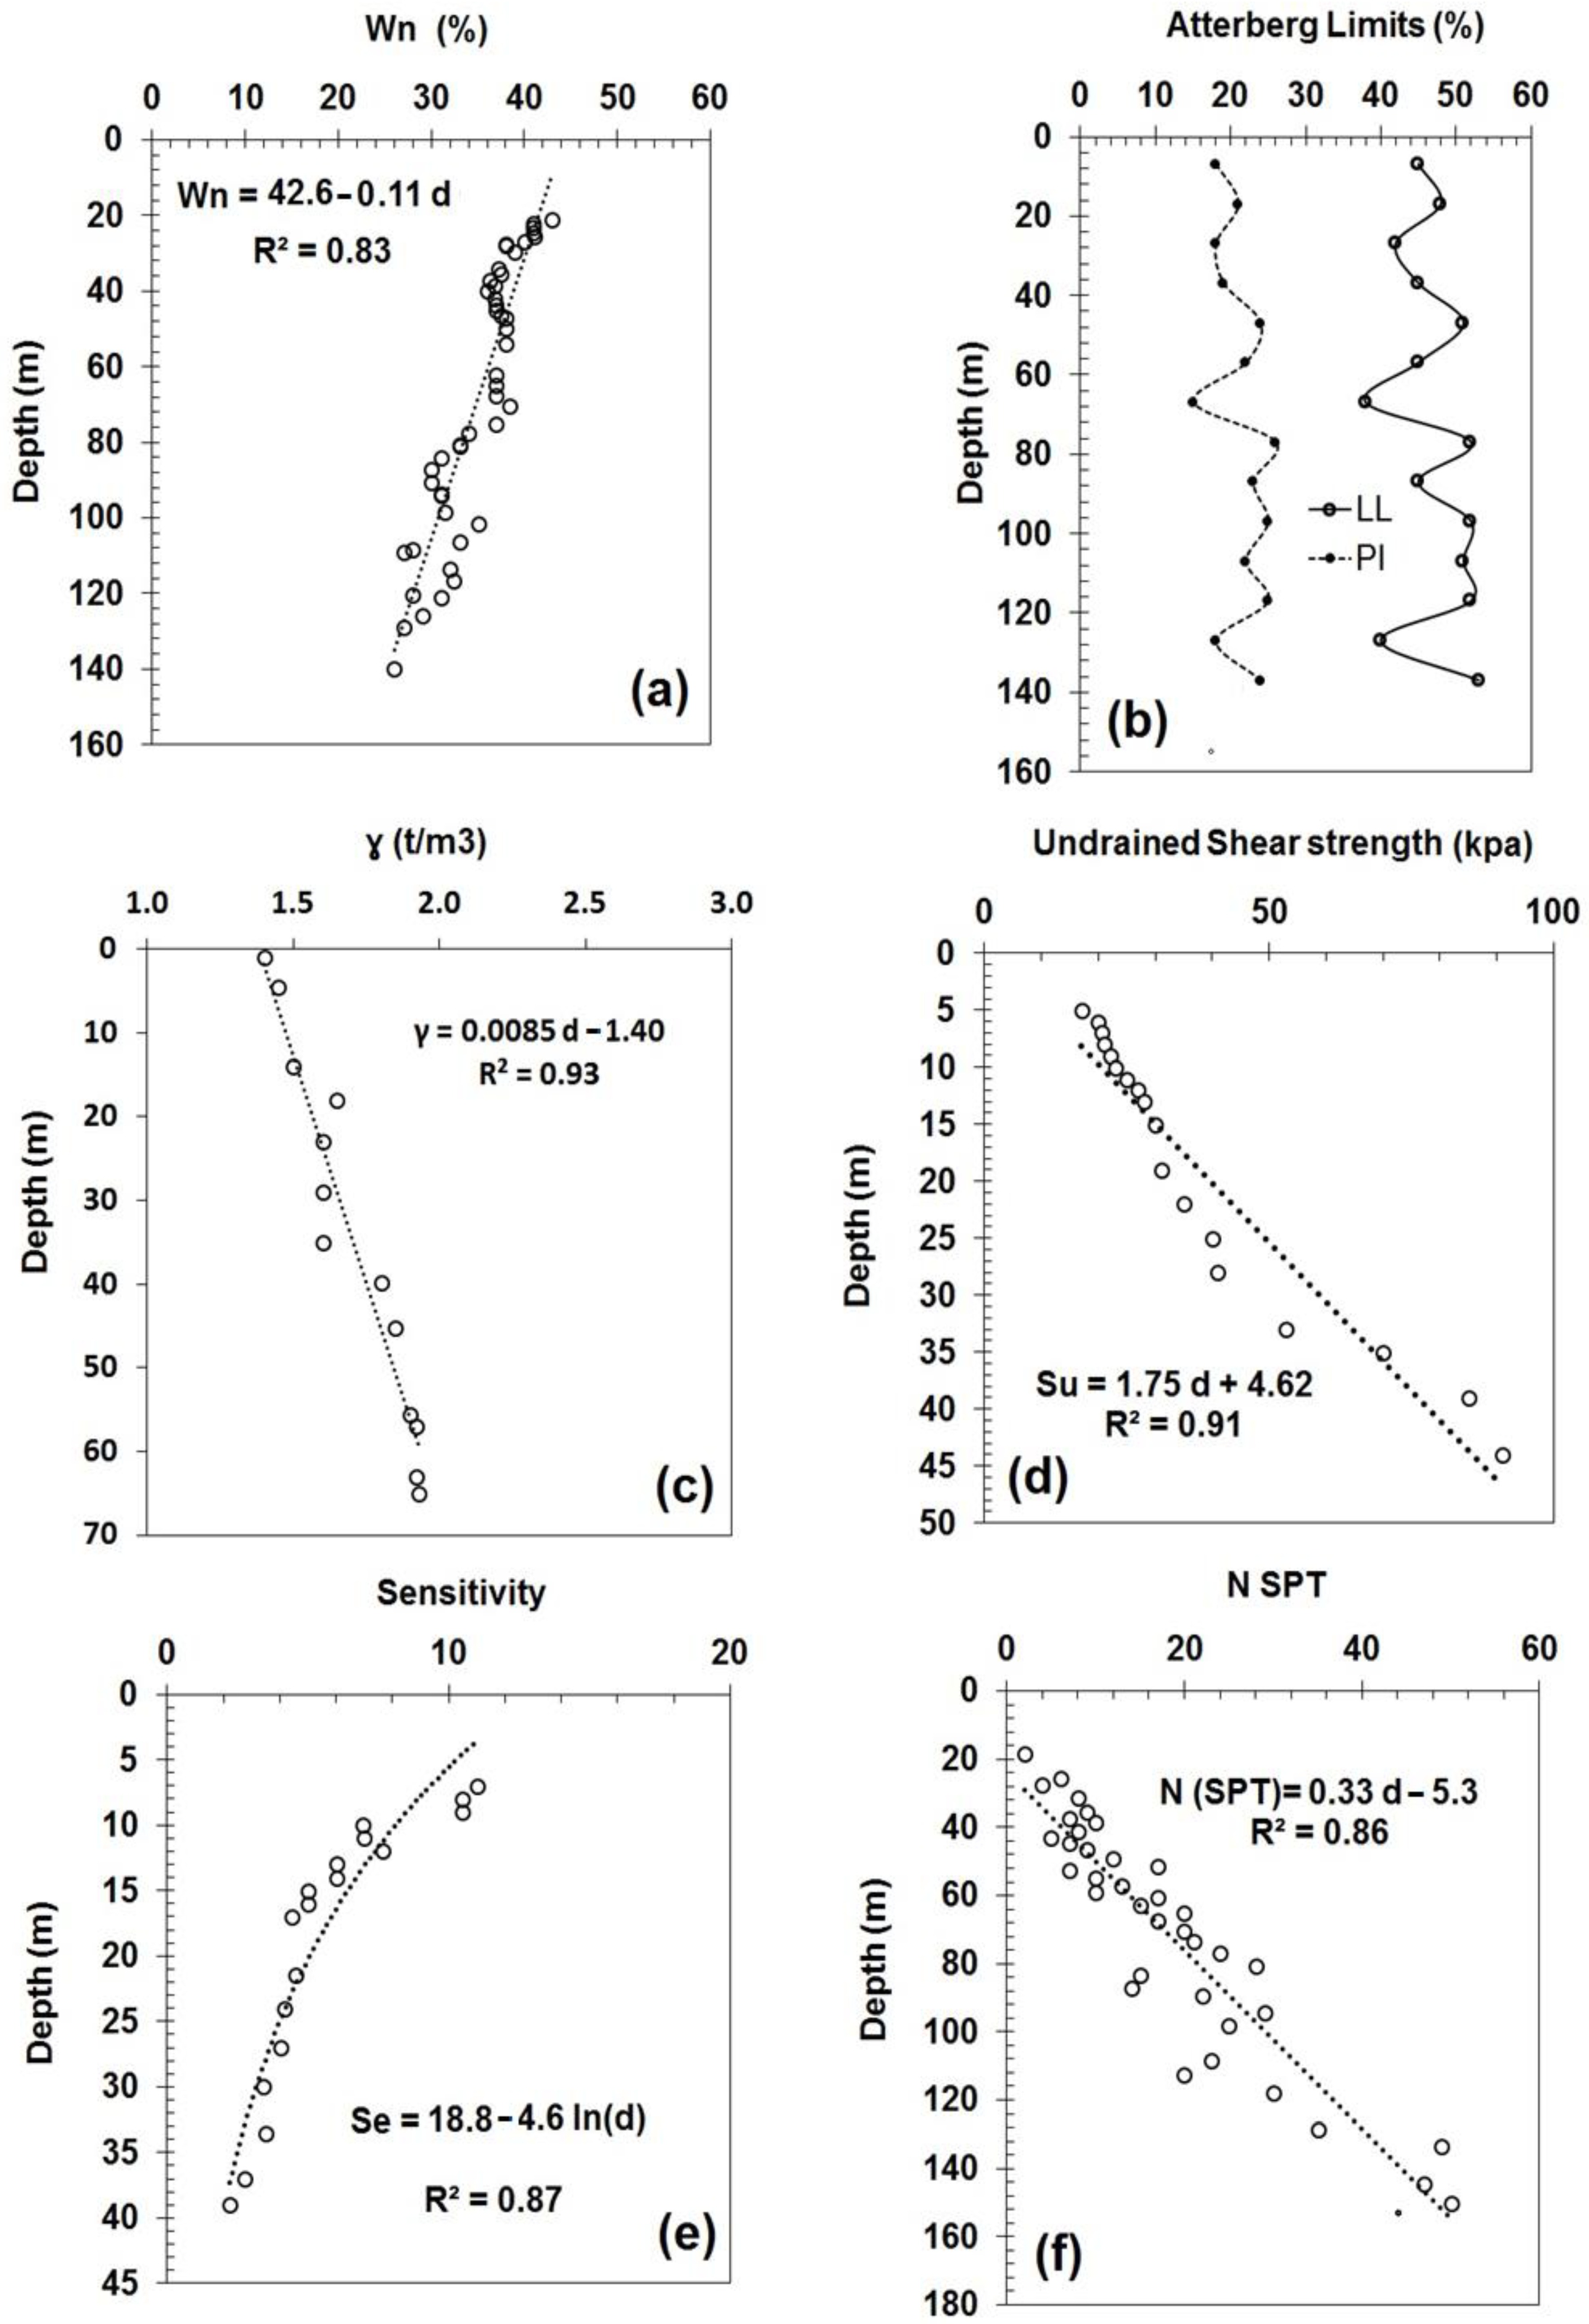
Figure 7a shows the results of examining the samples collected from the 145 m depths of sediments. Taking into account this Figure, the water content of samples varied from 42 percent at the 18 m to 22 percent at the 145 m below the lake bed. On the basis of the observations, as the depth of sediments increases, their water content decreases. Comparing the natural water content of sediments and the Atterberg limit demonstrates that the water content of these sediments varies between the plastic limit and liquid limit. Thus, it is soft, formable, and compressible.
Figure 7b presents the changes in Atterberg limits, including the liquid limit and plasticity index. As shown by this chart, there was no clear trend for the changes in these parameters with depth. Hence, it was not possible to present any specific relationship. Moreover, considering the liquid limit and the plasticity index, the observed sediments were mainly low plasticity ones.
4.5. Wet Unit Weight of the Sediments
The wet unit weight of sediments at different depth levels is among the effective factors for geotechnical detections [
51]. This parameter was examined using the U4 and thin-walled samples obtained from disparate depth levels.
Figure 7c shows the wet unit weight changes as the depth increases. According to this Figure, as the depth of sediments increases, their special weight increases as well. Given that, this parameter increases from 1.4 t/m
3 at 3 m depths to 1.7 t/m
3 at the depth of 68 m. The reason for the increase in the special weight of sediments at the greater depths is the increase in the compression of components and the decrease in their porosity ratio.
4.6. Undrained Shear Strenght (Vane Shear Test)
The undrained shear strength of sediments is assessed via the vane shear test.
Figure 7d shows the achieved undrained shear strength from the shear vane test. Given this Figure, as the depth of sediments increases, their strength increases as well. Accordingly, the strength of sediments is quite low on the surface of the lake bed. As stated in the examination of the sediments’ water content, the soil of the sediments of lake bed has high water content, and due to the reverse relationship between water content and soil strength, this high water content reduces the soil strength. The water content of sediments decreases in the greater depths and the strengths manifest a rising trend. The changes of shear strength in the depth of sediments demonstrate that shear strength ranges between approximately 16 kPa at the depth of 5 m up to 85 kPa at the depth of 44 m of the sediments.
Figure 7d shows the relationship between the sediments’ strength and depth. The correlation coefficient is quite high in this situation, and proper relations were achieved.
4.7. Sensitivity
Another important parameter in geotechnics is the sensitivity of fine-grained soils. Soil sensitivity equals the ratio of the strength of undisturbed soil to the strength of disturbed soil. This parameter is determined using the shear vane test.
Figure 7e shows the results of this investigation. Given the results, as the depth increases, the sensitivity of the soil decreases as a result. Accordingly, the sensitivity of soil was decreased from 12 at the depth of 7 m to 4 at the depth of 40 m. Soil sensitivity depends on a variety of factors such as type of minerals, imposed tensions, age of sediments, and water content of sediments. The main cause of the reduction of the sensitivity of soil by the increases of the depths in this site is the reduction of soil water content and the increase of soil strength upon the increase of depth. As seen in the previous sections, the water content decreases with the increase in depth. In other words, the decrease in water content leads to a decrease in the sensitivity of soil. The reduction of the sensitivity of soil by the increase in depth signifies the possibility of collecting more appropriate and less disturbed samples from the greater depths.
4.8. Number of Blows from SPT Tests (Nspt)
SPT is one of the important tests regarding the assessment of soil strength. The researchers proposed a variety of correlations between the number of impacts and disparate soil parameters, which are widely used in engineering. The present research used the results of this test.
Figure 7f shows the changes in the number of Nspt with the increase of depth. In this test, the greater the size of Nspt, the higher the strength of the soil. Per this Figure, at the depths closer to the lake bed, Nspt is lower and as the depth increases, its amount increases as well. Given that, Nspt is equal to 0 at 20 m depth and increases up to 50 at the 150 m depth. Considering that disparate correlations can be proposed at any site depending on the sediments’ types and status,
Figure 7f suggested a relation to estimating Nspt at the sediments of UL. Taking into account the high correlation between the number of impacts and depth, this relation can be employed for similar cases from the engineering viewpoint. Other researchers proposed relations concerning the assessment of the geotechnical properties of sediments using soil parameters [
52].
4.9. Consolidation Properties
Another important parameter in geotechnical assessments is to determine the soil settlement. The settlement consolidation is considerably important in fine-grained soils. The consolidation test is one of the crucial tests regarding the determination of the settlement of soil layer and marine sediments. The results of this test can be utilized to determine disparate parameters pertinent to determining the settlement consolidation of soil. Consolidation tests were used to assess the consolidation of sediments in UL. Samples were collected from disparate depths and undisturbed sediments using the U4 or thin-walled methods and they were used to conduct these tests. Taking into account the high water content of the sample at depths close to the lake bed surface, undisturbed sampling was impossible at the first 10 m. According to these tests, at the depth closer to the surface, the initial void ratio of samples was higher, and as the depth increased, the ratio of void decreased considerably. Accordingly, the initial void ratio decreased from 1 at the depth of 70 m to 0.5 at the depth of 100 m in the samples. The high water content and low compression of components at the depth close to the lake bed are the reasons for the high void ratio at these depths. Considering the low water content and high compression of the samples due to the high overburden pressure, the void ratio is lower at the greater depths. Another important issue is examining the samples’ pre-consolidation status. According to the consolidation tests, the sediments are mainly normal consolidated sediments. Therefore, this issue must be taken into account when conducting a design regarding the structural components of these sediments.
Another crucially important parameter in computations pertinent to sediment settlement is the compression index (Cc).
Figure 8a shows the changes in Cc with respect to the depth. Given this Figure, the amount of Cc varies at different depths, and its level differs from 0.2 at the depth of 70 m to 0.1 at the depth of 127 m. Similar to the void ratio, with the increase of the depth of sediments, their compressibility decreases due to the higher pressure and lower water consent of the sample. Taking into account the importance of estimating the coefficient of soil compression, plus the appropriate correlation between the soil compression coefficient and initial void ratio,
Figure 8a proposed a relation with a high correlation coefficient to estimate the soil compression, and it was used to determine soil settlement. Other researchers proposed relations concerning the assessment of the geotechnical properties of sediments using soil parameters [
44].
Changes in OCR with depth are shown in
Figure 8b. The chart indicates that there is a specific trend for the changes in these parameters with depth, and the value of this parameter decreases with increases in depth. Finally, its value approaches near to 1 at the depth of 79 m, which shows that these sediments are normally consolidated at great depths. Since the observed trend is appropriate, it is possible to present a relationship for estimating this parameter at great depths. This relationship is shown in
Figure 8b. The correlation coefficient for it is higher than 0.95.
5. Comparison with the Literature
Estimating relationships by using correlations has always attracted the interest of researchers, and many relationships have been introduced that can be used for estimating soil parameters. Furthermore, various researchers have proposed relationships in this relation [
53,
54,
55]. Since the type of sediment also influences the comparison between relationships, the present research used those relationships that matched well with the sediments in UL.
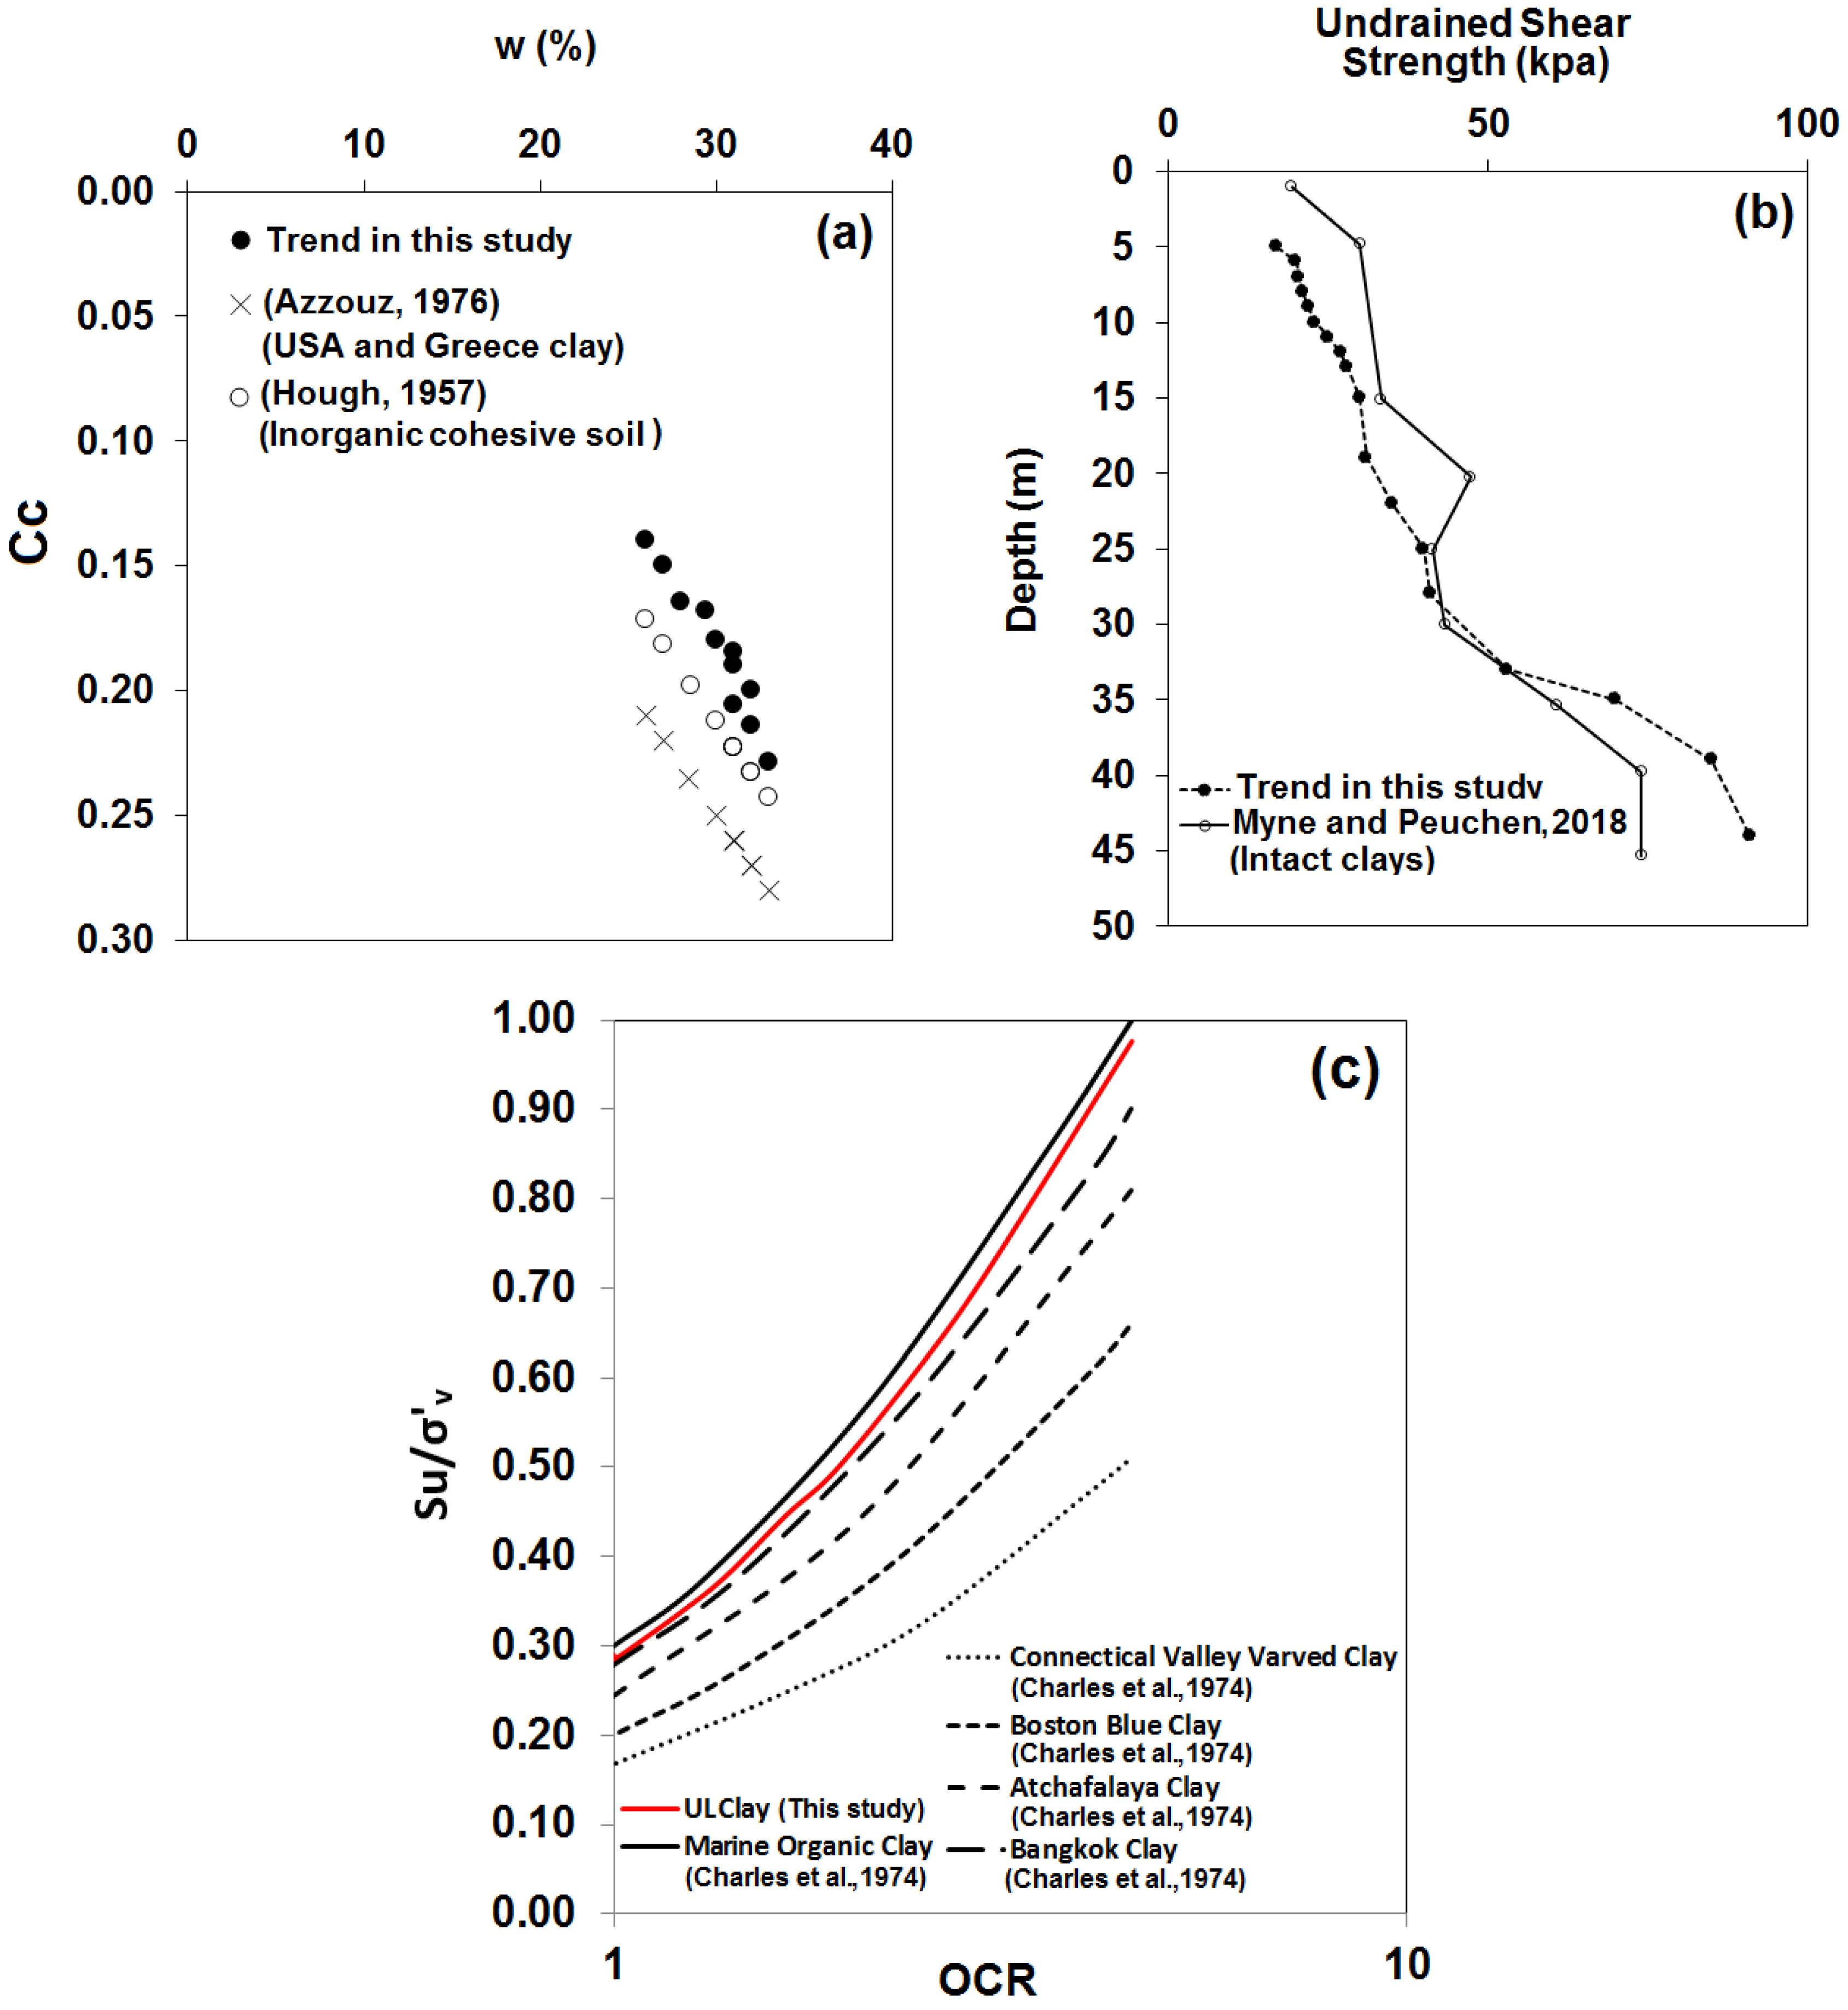
Figure 9a presents a comparison between the data reported by Azzouz (1976) [
56] and by Hough (1975) [
57] and those obtained from the present research regarding the relationships between Cc and the water content of sediments. As shown in
Figure 9a, the trend presented by Hough (1957) matches relatively well with that observed in the present search.
A comparison was also made between the present research and the studies by Myne and Peuchen (2018) [
58] regarding the determination of the undrained shear strength of sediments.
Figure 9b shows the comparison. The results obtained in these two studies indicate that, in both of them, undrained shear strength increased at greater depths, and there were similar trends between the two studies with respect to changes in undrained shear strength with increases in depth.
Figure 9c presents a comparison between the data reported by Charles et al. [
53] and those obtained from the present research regarding the relationships between Su/σ’
v and OCR. OCR of the sediments are presented up to 5 in this graph. Charles et al.‘s research contains clays in different regions composed of Marine organic clay, Bangkok clay, Atchafalaya clay, Boston blue clay, and Connecticut Valley varved clay. As shown in
Figure 9c, the relationship in this study matches relatively well with Marine organic clay and Bangkok clay sediments.
The presented explanations and charts indicate that there was little difference between the results obtained in the present research and those of the studies by other researchers for the trend of variations in Cc and undrained shear strength with increases in depth. The reason for this can be differences in the type of minerals in the sediments of the various regions, the type and method of taking samples, and the way the tests were performed. This degree of difference in geotechnical engineering is considered to be normal.
6. Conclusions
The present research examined the geotechnical characteristics of sediments in UL surrounding the bridge on this lake. The results of more than 310 in situ and laboratory tests were examined in this research. The results were used, and valuable information was acquired. Various geotechnical parameters were assessed separately, including shear strength and effective parameters in sediment settlements such as initial void ratio, compression index, Atterberg limits, sieve analysis, sensitivity, water content, sediment classification, and unit weight. The results of the present study are as follows:
Sediment classification and organic content: Examining the sediment classification using the CPTu method indicated that lake sediments are mainly composed of soft and sensitive clay sediments and problematic sediment and must be considered when conducting a design. Classification of sediment types was carried out at disparate depths using the Casagrande chart. The type of soil was mainly clay with low plasticity (lean clay) and it corresponded to CPTu interpretations. The organic content of the sediments was about 25%. This issue shows that sufficient attention should be paid to the presence of organic materials and the provision of suitable solutions to deal with it in the geotechnical designs.
Excess pore water pressure: Taking into account the excess pore water pressure using the profiles acquired from the CPTu test, in a majority of cases, the excess pore water pressure along the depth was greater than the pore water pressure at the lateral state and in some cases, and these two parameters were approximately similar due to sand lenses.
Unit weight: The wet unit weight of the sediments was studied. The results revealed that with the increase in the depth of sediments, the unit weight increased considerably. Accordingly, this unit weight was increased from 1.4 t/m3 at the depth of 3 m to 1.7 t/m3 at the depth of 68 m.
Water content: Investigating the water content of sediments revealed that with the increase of the depth of sediments, the water content decreases. Accordingly, the water content decreased from 42% at the depth of 18 m to 22% at the depth of 145 m. Furthermore, the changes in the water content of samples differed from liquid limit to plastic limit at disparate depths. Given that, with the increase of the depths, the water content of samples gets closer to the plastic limit.
Sediment settlement: The sediment settlement was investigated using a consolidation test. The results indicated a high amount of void ratio and, as a result, the compressibility of sediments at a depth close to the lake bed was decreased by the increase of depth. In accordance with the analyses, the compression coefficient of soil was decreased from 0.2 at the depth of 70 m to 0.1 at the depth of 127 m.
Undrained shear strength: The undrained shear strength of the sediments was studied. The results revealed that with the increase of the depth of sediments, the shear strength increased considerably. Accordingly, this strength was increased from 16 kPa at the depth of 5 m to 85 kPa at the depth of 44 m. Moreover, Nspt from the SPT test results revealed that with the increase of the depth of sediments, Nspt increased considerably. Accordingly, Nspt was increased from 0 at the depth of 20 m to 50 at the depth of 150 m.
Sensitivity: Investigating the sensitivity of sediments at disparate depths demonstrated that the sensitivity was decreased with the increase of depth. The changes in sensitivity increase from 12 at the 7 m depth to 4 at the 40 m depth. Sensitivity is higher in shallow depths, and they are problematic types of soils and need improvement in projects. The high sensitivity and low strength of sediments at the superficial depth manifest the necessity of paying sufficient attention to their designs.
OCR: Investigating the OCR of sediments at disparate depths indicates that there is a specific trend for the changes in these parameters with depth, and the value of this parameter decreases with increases in depth. Finally, its value approaches near to 1 at the depth of 79 m, which shows that these sediments are normally consolidated at great depths.
Disparate correlation relations: One of the important points in utilizing the results of the studies is the possibility of using these results in engineering problems. To accomplish this goal, disparate correlation relations were suggested in this research and different chapters, which are significant both scientifically and in terms of engineering as a preliminary estimate.
UL Minerals: The main minerals identified in these sediments included calcite, dolomite, quartz, calcium chloride, and halite. The salinity of the lake water was caused by the presence of calcium chloride and halite minerals.
Comparison with the literature: There is a good agreement between the data obtained from this research and other research. There was little difference between the results obtained in the present research and those of the studies by other researchers for the trend of variations in Cc and undrained shear strength with increases in depth. The reason for this can be differences in the type of minerals in the sediments of the various regions, the type and method of taking samples, and the way the tests were performed. This degree of difference in geotechnical engineering is considered to be normal. Variation of Su/σ’v with respect to OCR is presented and had a good agreement with other studies in similar low plasticity clays. This curve can be used in scientific researches and for comparison in similar sediments.
Disparate geotechnical parameters concerning sediments in UL were examined, and several correlations were proposed. When conducting research, utilizing appropriate and sufficient information can serve as a considerable help in accurately designing the projects. Besides conducting an appropriate design in terms of economy, the designs will impose less damage to the environment. The information acquired from this research, particularly the correlation relations, can be employed as axillary relations by researchers and engineers in similar studies and executive projects. The UL sediments are soft and sensitive, and they are types of problematic soils. Therefore, a suitable soil improvement method must be considered in structural and geotechnical designs. Piles Method to improve these sediments, which has been successfully used in the construction of the UL Bridge, is one of the methods that can be used to improve these types of problematic sediments. Considering that there is limited research conducted to identify the best suitable method can be used to improve marine sediments of UL, future research in this regard is suggested for researchers interested in research in this field.


