Article

An Extended Evaluation of the CERCHAR Abrasivity Test for a Practical Excavatability Assessment

Institute of Applied Geosciences, Graz University of Technology, 8010 Graz, Austria
*
Author to whom correspondence should be addressed.
Geotechnics 2024, 4(4), 1246-1258; https://doi.org/10.3390/geotechnics4040063
Submission received: 6 November 2024 / Revised: 6 December 2024 / Accepted: 8 December 2024 / Published: 9 December 2024
(This article belongs to the Special Issue Recent Advances in Geotechnical Engineering (2nd Edition))

Abstract

The CERCHAR abrasivity test is a widely used index test in earth and subsurface works, delivering numerical values for abrasion that are critical to the selection of excavation tools, TBM performance or cost and project schedule estimates. The test evaluates the wear of the tip of a standardized metal pin after a scratch test on a rock surface. However, excavatability is not considered in this test. The present study presents an approach to assessing the material removal of a rock specimen due to the scratching action of a steel pin. The concept is tested for a broad range of sedimentary, metamorphic and igneous rocks. The volume of removed rock material is determined by measuring the width of the scratch groove and assuming an idealized trapezoid geometry. The CAI and volumetric removal are used to calculate the CERCHAR abrasivity ratio (CAR), and the results are in good agreement with those from the literature where specialized equipment was used. A classification scheme to estimate the excavatability of rock based on the CAI in combination with the material removal of a rock specimen is introduced. Based on the amount of material removed and the wear on the pin, an estimate can be made as to whether the excavation is likely to be economical in terms of time and material costs. The approach does not require additional testing, but rather makes use of the inherent geometry of the steel pin and the scratch groove on the rock specimen. The approach can be implemented as a complementary analysis to the existing CERCHAR test with little additional effort.

1. Introduction

The assessment of potential tool wear in engineering geology and rock mechanics is essential for estimating tool life (pick consumption, TBM disc or drill bit replacement intervals) and associated costs and time schedules [1,2,3,4,5]. Over time, a great variety of tests for the determination of the abrasiveness of rocks have been established [6,7]. Among these, the CERCHAR abrasivity test [8] is one of the most widely used. Due to its simplicity, the CERCHAR abrasiveness (or abrasivity) index (CAI) is commonly determined in this test in the course of projects where extensive (underground) rock excavation is required [9,10]. The test records the wear on a steel pin caused by the rock. The steel pin is dragged over a rock surface for a defined length of 10 mm while being loaded with a static force of 70 Newtons [11] (Figure 1a). The test, however, only considers the tool aspect of excavation, neglecting the volumetric material removal of the rock. Recently, Zhang and Konietzky [12] presented an approach to determine the volumetric material removal from a rock specimen using scanning electron microscopes or 3D microscope images. This approach uses the CERCHAR abrasivity ratio (CAR) to determine the abrasion on the steel pin in relation to the volume of material excavated from the rock specimen. Based on a custom-designed apparatus capable of recording the vertical and horizontal displacement of the steel pin during the test, Hamzaban et al. [13,14] suggested a modified CAI (MCAI) to assess the pin–rock interaction characteristics. The energy required to penetrate the rock is set in relation to the traditional CAI. Due to the limitations associated with such specialized (or prototype) equipment, Kaspar et al. [15] suggested a simplified, practical approach to determining the CAR that can be conducted by standard laboratories outside academic institutions lacking highly specialized instrumentation. Existing systems for predicting or evaluating the expected excavatability or cutting efficiency correlate additional rock mechanical parameters such as uniaxial compressive strength (UCS) to the CAI [4,16]. There are uncertainties associated with this method, as two very different types of parameters, i.e., bulk strength (UCS) and (mineral) surface hardness, are correlated. There is a great variety in the nature of fracture propagation in rock in the UCS tests [17] and the micromechanical wear regime of the different rock types [18]. The excavatability of rock depends on the combination of mineralogical composition, fabric characteristics (grain size, grain shape and the degree of interlocking/intergranular cohesion, porosity) and the state of weathering [19] (Figure 1b).
There exists a large number of rock parameters and derived indices that are correlated with the CAI to estimate or predict tool wear and TBM performance, based on mineralogical composition (FEQu—equivalent quartz content, VHNR—Vickers hardness number of the rock), compressive (UCS) and tensile strength (BTS), or a combination of several parameters (RAI—rock abrasiveness index, CLI—cutter life index) [3,4,20,21]. Such approaches are subject to uncertainties when applied to real construction projects since the testing specimens only reflect intact rock conditions on a small scale. Oggeri and Oreste [21] showed that these predictive methods need field calibration and verification by taking into account TBM performance data and rock mass characteristics. The predictive models also depend on the type of excavator used and the geometry of the tool (e.g., discs, pick, bit, chisel) [4].
The present study uses parameters obtained from one type of test, i.e., the CERCHAR abrasiveness test. The inherent geometrical properties of the steel pin used in the CERCHAR test together with the scratch groove geometry produced during the test on the rock specimen are used to develop a classification that helps estimate the potential excavatability of the rock. Emphasis is laid on the practical applicability of the method so it can easily be conducted and included as a complementary analysis in rock excavation projects. The integration of the volumetric material removal of the rock in order to assess the excavatability of the rock can be of great advantage to future laboratory testing campaigns at jobsites.

2. Materials and Methods

A total of 56 rock samples from the Austrian Alps and surrounding regions, including sedimentary, metamorphic and igneous rocks, were investigated for the present study. The procedures for determining the CAI comply with the standards of AFNOR P94 430-1 [11] and ASTM designation 7625 [22], as well as recommendation No. 23 of the Commission on Rock Testing of the German Geotechnical Society (DGGT) [23] and the recommendation of the International Society for Rock Mechanics and Rock Engineering (ISRM) [24]. Rock specimen preparation was performed in accordance with ÖBV [25] to ensure consistent testing surface conditions using a diamond saw. Each set of tests consisted of five individual 10 mm long scratches per specimen. The sedimentary and metamorphic rocks were tested perpendicular to their bedding and foliation, respectively. Massive, coarse-grained rocks such as granite were tested in two directions, with a set of three scratches in one direction and a set of two at 90° [22]. A West-type testing apparatus (NextGen Material Testing, Vancouver, BC, Canada) [26], with a stationary pin and a specimen fixed in a vice and moved using a hand crank, was used to perform the CERCHAR tests (Figure 2a). The steel pins exhibited a Rockwell hardness of HRC 54–56, had a conical pin geometry with a 90° apex and were axially loaded with a static force of 70 Newtons. The average wear on the five steel pins multiplied by ten yielded the CAI of a specimen (Equation (1)). The wear was measured from four sides per pin under a digital transmitting light microscope (Leica DM LMP, Leica Mikrosysteme Ges.m.b.H., Vienna, Austria) in side-view mode with 80× magnification (Figure 2b). The geometry of the scratch grooves (Figure 2c) was measured under the same microscope in reflected light mode. The background and considerations of the proposed assessment were elaborated based on the geometric implications of the steel pin and the scratch groove produced on the rock specimen. The data were analyzed using simple and multiple linear regression models and were visualized in 2D and 3D. The CERCHAR abrasivity ratio (CAR) was determined using Equation (2) from Zhang and Konietzky [12].
CAI = d × 10
where
  • CAI = CERCHAR abrasivity index (−)
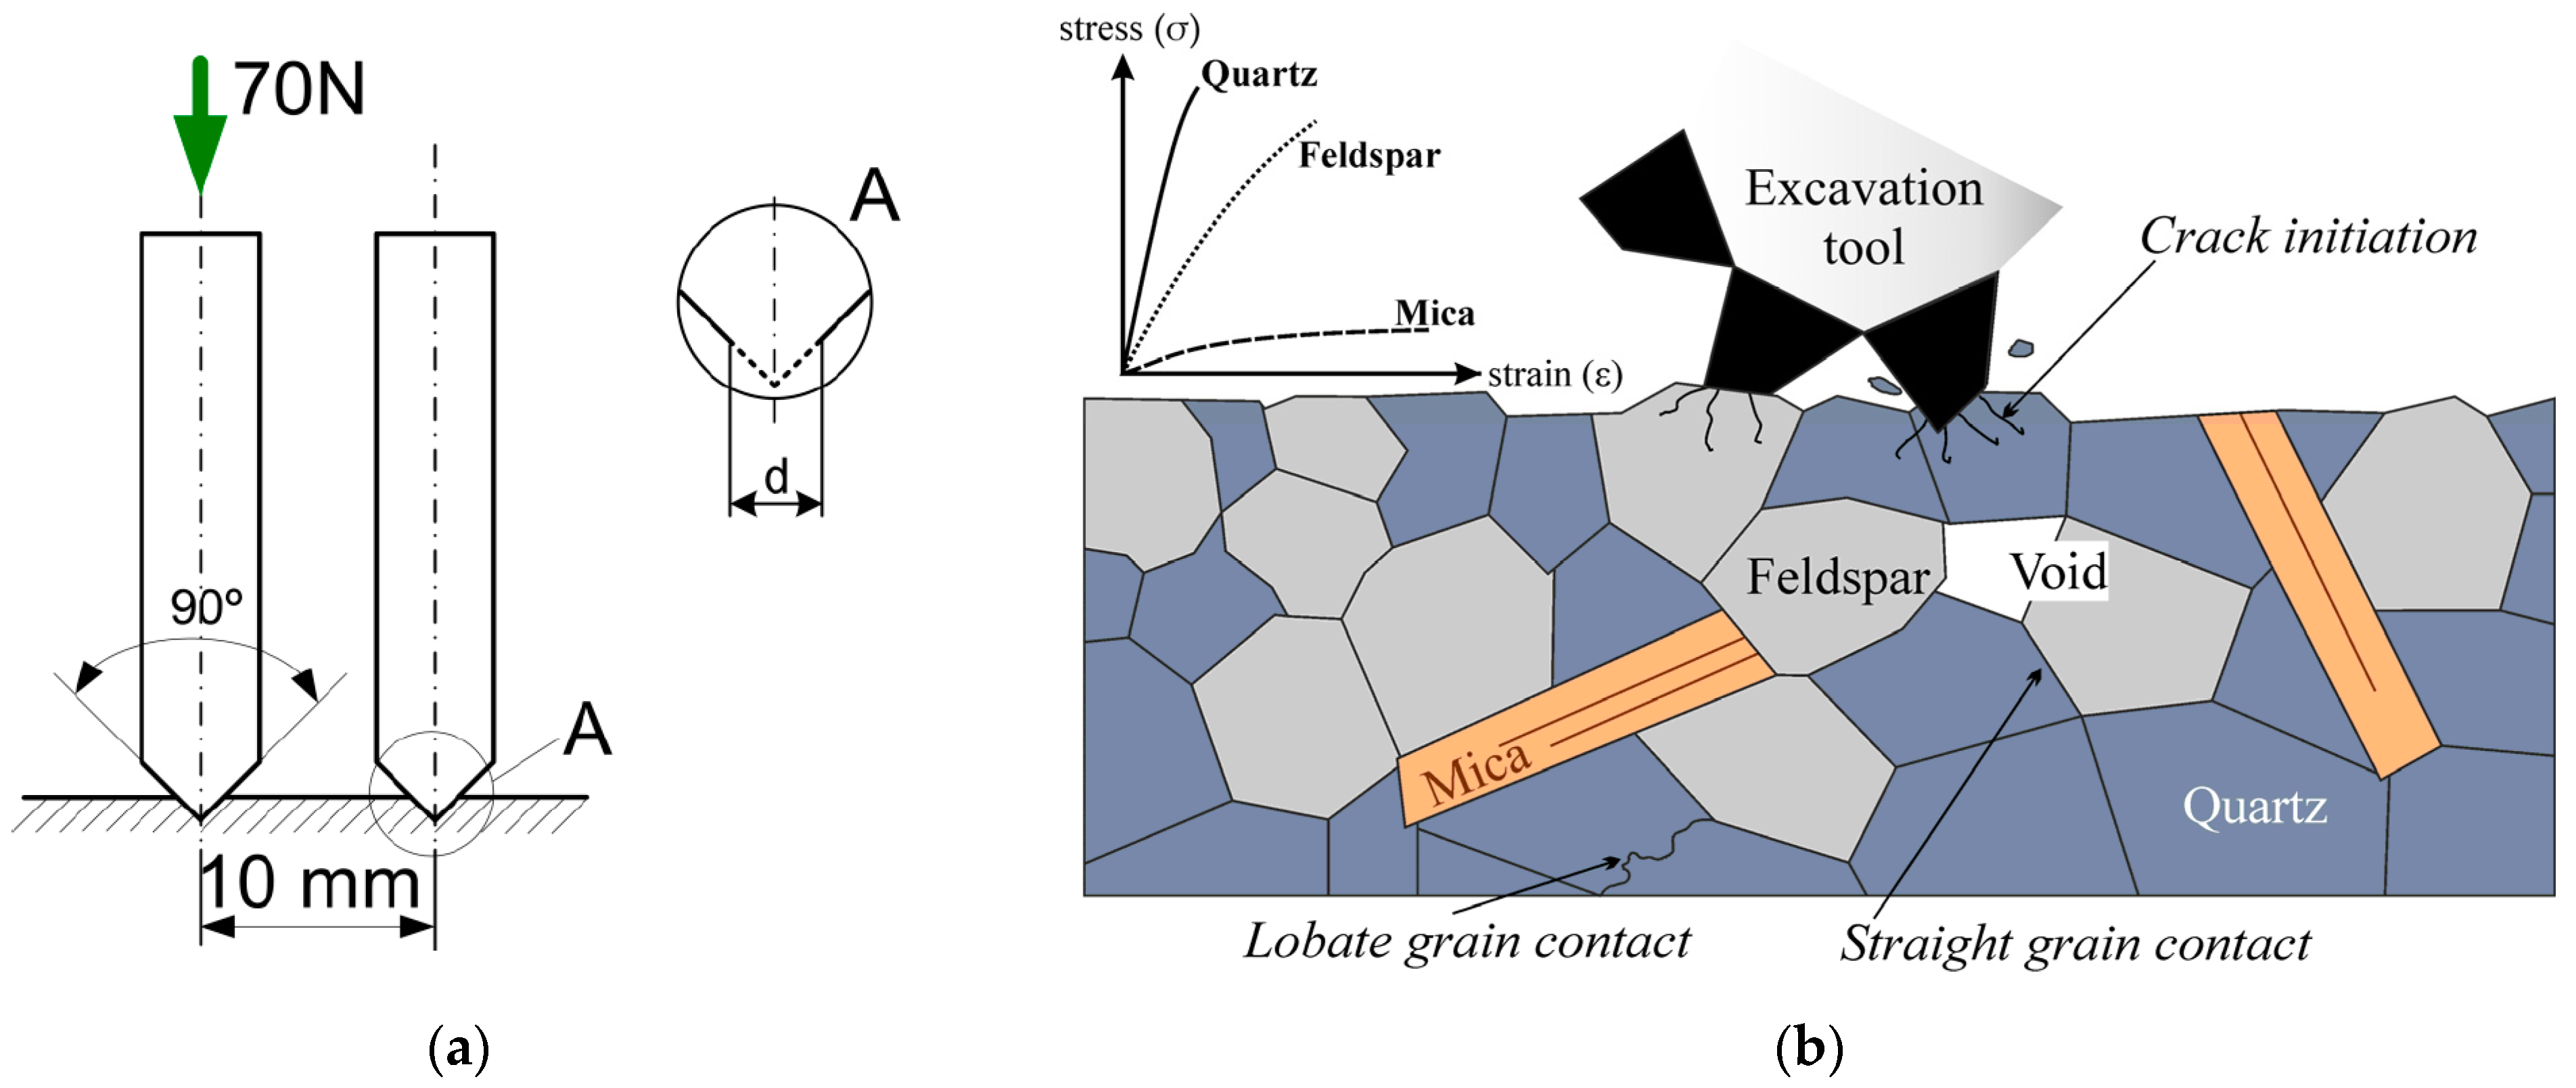
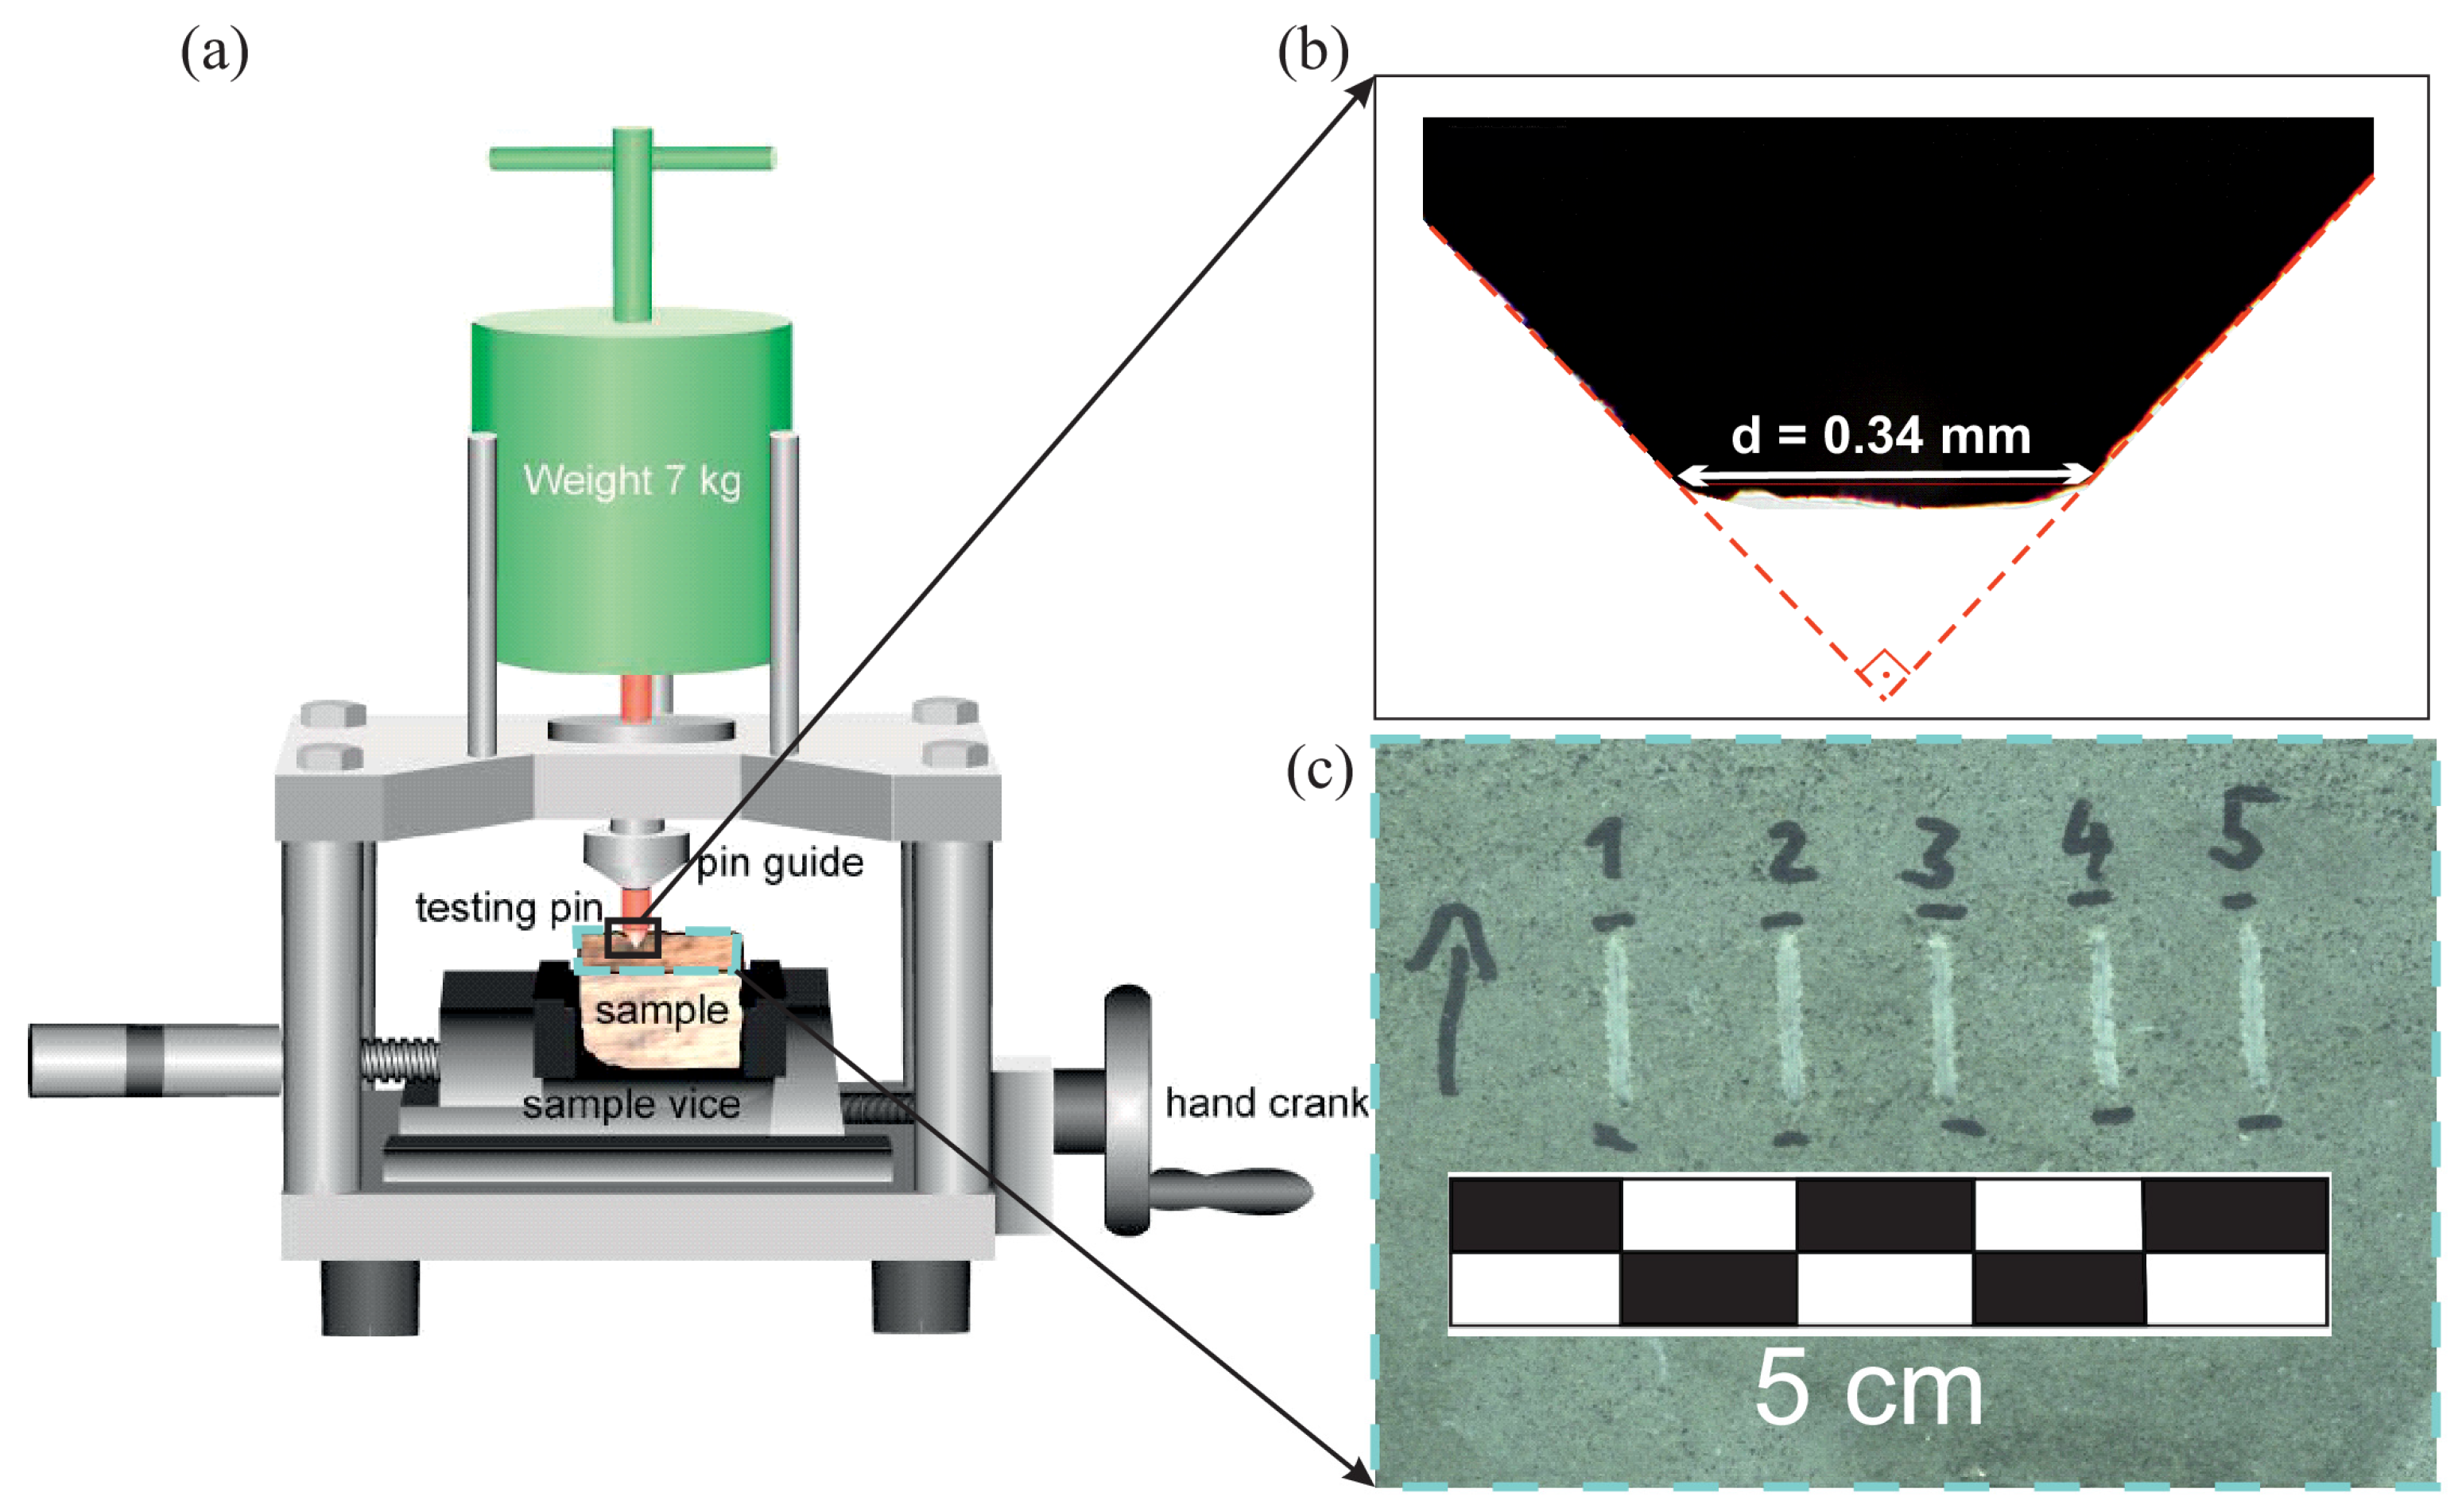
  • d = Wear of the steel pin (mm)
C A R   = log 10 V m V s
  • where
  • CAR = CERCHAR abrasivity ratio (−)
  • Vm = Volume of the rock material removed from the specimen (mm3)
  • Vs = Volumetric wear of the abraded steel pin tip (mm3)
The volumetric wear of the abraded steel pin tip is expressed as the volume of a cone, as written in Equation (3). Because the pin tip is 90°, the height of the pin tip loss is half of the pin tip wear (i.e., 0.05CAI).
V s   mm 3 = 1 3 × 0.05 C A I 3

3. Results

3.1. Concept Layout

The concept for evaluating the excavatability of rock is based on the geometry of the steel pin tip and the scratch groove produced on the surface of the rock specimen during the CERCHAR test (Figure 3). The 90° pin tip geometry creates an isosceles trapezoid with a length of 10 mm during the CERCHAR test. In a regular case, both abrasion of the pin tip and penetration into the rock, Px, will occur, and the total vertical pin displacement, Ax, is the sum of the simultaneous height loss due to material loss at the pin tip and material loss in the rock (Figure 3a). Extreme scenarios involve either only rock penetration with almost no abrasion on the pin or extreme pin abrasion with no penetration into the rock. The latter occurs in coarse-grained crystalline rocks such as granites, whereas deep penetration is commonly observed in soft rocks such as claystones [15].
The geometry allows the volume of removed material (Vm) to be determined if the CAI and the scratch width, Sw, of the groove are known. Due the geometry of the pin, the produced scratch groove exhibits a geometry from which the penetration depth into the rock can be obtained from the CAI and Sw (Figure 3a) (Equation (4)). In addition to determining the CAI by measuring pin wear, Sw is measured on the surface of the rock specimen (Figure 3b). Similar to the steel pin evaluation, Sw is measured at each of the five scratch grooves of a specimen, and the average of the five scratch groove volumes is calculated. Just as the CAI increases with the progressive sliding distance [2], the pin penetration increases along the sliding distance of the pin [13]. However, 85% of the final values are already reached at 30 to 40% of the sliding distance of the pin. Thus, an idealized trapezoid geometry is assumed, and Sw is measured in the last 25% of the scratch groove [15]. The measurement involves placing tangent lines along the edges of the groove without incorporating breakout molds (Figure 3b).
The corresponding volume of the isosceles trapezoid, Vm, is then merely a function of Px and CAI, which can be simplified to Equation (5):
P x   mm = S w 0.1 C A I 2
where
  • Px = Pin penetration depth into the rock surface (mm)
  • Sw = Scratch width at the top of the groove (mm)
  • CAI = CERCHAR abrasivity index (−)
V m   mm 3 = 0.1 C A I × P x + P x ² × 10
  • where
  • Vm = Volume of the rock material removed from specimen (mm3)
  • Px = Pin penetration depth into the rock surface (mm)
  • Sw = Scratch width at the top of the groove (mm)
The values of the tested rock types comprise sedimentary, metamorphic and igneous rocks (Table 1). For comparing and differentiating the various aspects that potentially influence abrasivity, the rock types were organized into six groups based on similar mineralogical composition or origin. Granites are coarse-grained rocks with an interlocking texture and a lack of preferred mineral alignment, gneisses belong to the orthogneiss type containing some augen clasts and mica schists exhibit a distinct foliation with spacing in a millimeter range.

3.2. The Excavatability Classification Scheme

Based on the combination of CAI, Px and Vm, the excavatability of the investigated rocks was assessed. Figure 4 shows the schematic background for defining the excavatability classes. The upper and lower boundaries of the classes are defined by the maximum volume of extractable material for a fixed penetration depth, Px, at a given CAI (Figure 4a and Figure 5a). Similar to the classification categories of CAI, the steps are set to 0.1 mm intervals. For consistent units, the CAI values are changed back to millimeters by dividing the CAI by ten.
The cross section in Figure 4b reflects a trend of reduced excavatability, at the end of which, the CAI corresponds to the initial penetration depth. This trend is shown as red lines/arrows in Figure 5a, indicating the increase in abrasivity as a result of more difficult and slower excavation (i.e., a reduction in Px and increase in CAI). The red lines also delineate the excavation classes based on what is realized in actual rock excavation. Some fields in the diagram are not realized in rock cutting and drilling; there is no machine that can mechanically excavate extremely hard rock at high rates without experiencing substantial wear on the tool. On the other hand, even extremely soft rock cannot be excavated with zero abrasion. The dataset used in this study embraces a broad variety of rocks exhibiting a wide range of CAI and Vm values to create the proposed diagram and classification scheme. If a rock specimen plots outside the diagram shown in Figure 5a, the color regions in the diagram should follow the same logic so that the fields can be extended accordingly.
Excavatability is divided into seven classes ranging from highly economical to expensive excavatability (Figure 5a). The color regions classify excavatability based on the amount of removed material and the associated tool wear. The excavation can be economical in terms of time (i.e., higher rates of Vm and thus faster progress) or in terms of tool life (i.e., low CAI with less abrasion). Rocks plotting in the same class might exhibit better or poorer values of either Vm or CAI, achieving an economical excavation at the expense of either tool wear or time. Higher excavation volumes within a class are associated with higher abrasivity.
As an example, sandstone “No. 22” and limestone “No. 16” in Figure 5a both plot in the yellow field, indicating a moderately economical excavatability. The sandstone might cause the tool to be replaced sooner due to its CAI value, but it can be excavated more efficiently, as shown by the Vm. The limestone is less abrasive on the tool, but the progress rate during excavation is expected to be lower based on its Vm. The higher CAR of the limestone would suggest that the pick consumption per m3 of excavated material is less than that for the sandstone [12]. As such, high CAR values indicate a good ratio between excavatability and tool wear. However, the CAR provides relative, dimensionless information on excavatability. In general, the decrease in the CAR follows the trend from the highly economical class to the expensive excavation class (Figure 5b). Due to the variability of characteristics such as rock fabric, porosity and the state of weathering, the CAR may be the same for some rocks plotting in different excavation classes. Granite “No. 54” and marble “No. 12” have almost the same CAR (Table 1), but gneiss plots in the yellow field and marble in the orange field (Figure 5a). From the diagram, it can be inferred that the excavation of marble will be more time-consuming with a lower Vm, while gneiss can be excavated at higher rates. However, the mineralogical composition of gneiss with higher contents of abrasive minerals such as quartz and feldspars will cause the tool to wear much faster. Economical excavation is therefore always a trade-off between the progress rate and tool consumption. Hence, the most comprehensive, holistic information on excavatability is obtained by combining the information from the CAR with the assigned excavation classes to check whether the excavation behavior is related more to time or tool wear (abrasivity).
The diagram (Figure 5a) also allows a more differentiated view on abrasivity. Marble “No. 12” and sandstone “No. 25” in Table 1/Figure 5a exhibit the same CAI while showing very different values of Vm. Even though both rocks have a medium abrasiveness in terms of CAI, the low Vm value suggests that the excavation of marble might be less efficient (more time-consuming) compared to that of sandstone at a similar pick consumption. Coarse-grained crystalline metamorphic and igneous rocks are almost always hard to excavate. Some lower CAI values are observed for fine-grained metamorphic rocks. The most economical excavation is expected for fine-grained siltstones and claystones, where low CAI values and high Vm values are observed.

4. Discussion

Measurement of the scratch width as a complementary evaluation of the CERCHAR abrasivity test allows an approximate estimation of the removed volume of rock material. The values obtained from this method are comparable to those obtained by laborious methods such as scanning electron microscopy or 3D microscope rendered images [15] (Figure 6). The presented approach should be determined on saw-cut rock surfaces since irregularities in freshly broken surfaces could lead to less reliable estimates of Vm. The CAR and associated excavatability classes can be included in routine engineering geological laboratory campaigns. The original intention of the CERCHAR test, to determine a quick index value as a rule of thumb at jobsites [28,29], is maintained. There exist numerous studies investigating the correlations among mineralogical, petrographic and rock mechanical parameters in order to assess the excavatability and abrasiveness of rocks [4,30,31,32,33,34,35,36]. The combination of strength, mineralogical compositions and fabric characteristics and the natural variability of rocks make a universally valid correlation not practical, and a differentiated, project-specific evaluation of rock parameters is always required [33,36]. The mining industry, for example, uses so-called cuttability windows to estimate the excavation performance of their machines using the correlation between UCS and CAI [16]. The rock abrasivity index (RAI), as a product of UCS and the equivalent quartz content, embraces the strength and mineralogical aspects of a rock to assess the wear potential of rocks [37]. However, abrasivity and strength (UCS) are not always interconnected [38,39]. Soft rocks (UCS < 25 MPa [38]), for example, can be abrasive on the tool, and high-strength rocks can be of low abrasivity, e.g., marble [39], and the hardness of rocks is not, in general, a reliable indicator of drillability [40] (Figure 7). By adding information on the removed material to the abrasivity obtained during a single test, a more realistic estimate for project schedule planning can be made. The present method considers abrasion and excavation on a small laboratory specimen scale. The scalability and transferability of laboratory values to the prediction of actual site rock mass behavior and excavation performance is a common issue in rock engineering [41,42]. Since the different rock parameters commonly determined in the laboratory need to be related to onsite conditions to make meaningful predictions for excavatability [21,43], future investigations incorporating real construction site excavation performance data to calibrate and validate the current findings are necessary.
The proposed approach makes use of the indentation capability of the steel pin as a measure for excavatability. There is a good correlation between the CAI and the indentation hardness of a rock expressed by the Vickers hardness number of the rock (VHNR), commonly used in Scandinavian countries for estimating tool wear [44] (Equation (6)). The VHNR can be determined from a (semi)quantitative mineralogical analysis (e.g., X-ray powder diffractometry or thin-section analysis) and the mineral conversion factors given in [24]. It has to be kept in mind that the VHNR values are for fresh, unweathered rocks.
V H N R   = C A I 145

5. Conclusions

Time and materials are among the most significant cost factors affecting excavation projects [33]. With only the CAI, UCS or the mineral content determined in the laboratory, no reliable statement on excavatability can be made. Currently, the abrasivity of rocks is assessed by determining the steel tip wear of the testing pin, neglecting the amount of rock material removed. Recently, this aspect has gained more attention, and specialized testing equipment has also been developed [12,14]. The presented approach individually assesses the abrasivity of rocks and puts the CAI into perspective compared with actual excavated material in one single type of test, i.e., the CERCHAR abrasivity test. At the same time, the original intention that the CAI test remain simple and easy to conduct by rock testing laboratories is maintained. In addition to determining the CAI, the scratch width, Sw, of the groove produced by the steel pin on the specimen surface is measured. The volume is calculated from Sw using a formula given by the intrinsic geometry of the scratch groove.
The obtained CAR results are comparable to those reported in the literature using specialized equipment. Based on the CAI and Vm, a diagram is introduced allowing a rule-of-thumb assessment of whether the expected excavation will be time and/or cost controlled. The CAR can now be merged with a qualitative class rather than just being a dimensionless number expressing the ratio of two volumes. With the proposed diagram, the assessment is related to the actual rock material removed (excavated), preconditioned by the penetration depth of the tool into the rock, whereas tool wear is defined by the widely used CAI. The volume of removed rock material can be determined with little additional effort in the laboratory while conducting the CERCHAR abrasivity test, delivering complementary information on excavatability. The concept of cuttability windows is not able to encompass the excavation behavior to its full extent. In particular, the soft rocks in this study show a wide range of Px and associated Vm. The classification can also be used to specify the nature of soft rocks beyond a solely UCS-based classification.
The proposed evaluation assumes an idealized geometry of the scratch groove. It is therefore suitable for diamond saw-cut rock surfaces. Freshly broken irregular surfaces would affect the estimation of the volume of rock material removed. The applicability of the classification scheme compared to real excavation projects needs to be confirmed in further studies. It should be borne in mind that the laboratory (index) tests take into account intact rock properties, whereas onsite excavation concerns the entire rock mass, with joints at various spacings and the possible presence of water [20,21]. In addition, in situ stresses may affect the actual abrasive properties of rock during underground excavation [45]. The presented classification has the potential to be complementary to the widely used CAI test along with the traditional rock testing routines such as mineralogical analyses and UCS/BTS tests, which are commonly used to estimate disc replacement intervals or the penetration rates of TBMs.

Author Contributions

Conceptualization, M.K. and C.L.; methodology, M.K.; software, M.K.; validation, C.L.; formal analysis, M.K.; investigation, M.K.; resources, C.L.; data curation, M.K. and C.L.; writing—original draft preparation, M.K.; writing—review and editing, C.L.; visualization, M.K.; supervision, M.K.; project administration, M.K.; funding acquisition, M.K. and C.L. All authors have read and agreed to the published version of the manuscript.

Funding

Supported by the TU Graz Open Access Publishing Fund.

Data Availability Statement

All the used data are presented in this paper.

Conflicts of Interest

The authors declare no conflicts of interest.

References

  1. Thuro, K. Drillability prediction: Geological influences in hard rock drill and blast tunneling. Geol. Rundsch. 1997, 86, 426–438. [Google Scholar] [CrossRef]
  2. Plinninger, R.; Kasling, H.; Thuro, K.; Spaun, G. Testing conditions and geomechanical properties influencing the CERCHAR abrasiveness index (CAI) value. Int. J. Rock Mech. Min. Sci. 2003, 40, 259–263. [Google Scholar] [CrossRef]
  3. Plinninger, R.J. Abrasiveness assessment for hard rock drilling. Geomech. Tunn. 2008, 1, 38–46. [Google Scholar] [CrossRef]
  4. Schumacher, L. Design parameters and operating conditions for hard-rock tunnelling machines. Felsbau 2004, 22, 21–28. [Google Scholar]
  5. Cardu, M.; Catanzaro, E.; Farinetti, A.; Martinelli, D.; Todaro, C. Performance analysis of tunnel boring machines for rock excavation. Appl. Sci. 2021, 11, 2794. [Google Scholar] [CrossRef]
  6. Mucha, K. Application of rock abrasiveness and rock abrasivity test methods—A review. Sustainability 2023, 15, 11243. [Google Scholar] [CrossRef]
  7. Hamzaban, M.-T.; Rostami, J.; Dahl, F.; Macias, F.J.; Jakobsen, P.D. Wear of cutting tools in hard rock excavation process: A critical review of rock abrasiveness testing methods. Rock Mech. Rock Eng. 2023, 56, 1843–1882. [Google Scholar] [CrossRef]
  8. Centre d’Études et Recherches des Charbonnages de France. The CERCHAR Abrasiveness Index; CERCHAR Report No 86-538; Centre d’Études et Recherches des Charbonnages de France: Paris, France, 1986; 12p.
  9. Zhang, S.-R.; She, L.; Wang, C.; Wang, Y.-J.; Cao, R.-L.; Li, Y.-L.; Cao, K.-L. Investigation on the relationship among the Cerchar abrasivity index, drilling parameters and physical and mechanical properties of the rock. Tunn. Undergr. Space Technol. 2021, 112, 103907. [Google Scholar] [CrossRef]
  10. Gao, K.; Wang, X.; Wei, H.; Wang, S.; Xu, W.; Li, X.; Sun, L. Abrasivity database of different genetic rocks based on CERCHAR Abrasivity Test. Sci. Data 2024, 11, 630. [Google Scholar] [CrossRef]
  11. AFNOR. Détermination du Pouvoir Abrasive D’une Roche—Partie 1: Essai de Rayure avec une Pointe (NF P94-430-1); Association Française de Normalisation: Paris, France, 2000; 7p. [Google Scholar]
  12. Zhang, G.; Konietzky, H. CERCHAR Abrasion Ratio (CAR) as a new indicator for assessing rock abrasivity, rock–stylus interaction and cutting efficiency. Rock Mech. Rock Eng. 2020, 53, 3363–3371. [Google Scholar] [CrossRef]
  13. Hamzaban, M.-T.; Memarian, H.; Rostami, J. Continuous monitoring of pin tip wear and penetration into rock surface using a new Cerchar Abrasivity testing device. Rock Mech. Rock Eng. 2014, 47, 689–701. [Google Scholar] [CrossRef]
  14. Hamzaban, M.-T.; Memarian, H.; Rostami, J.; Ghasemi-Monfared, H. Study of rock–pin interaction in Cerchar abrasivity test. Int. J. Rock Mech. Min. Sci. 2014, 72, 100–108. [Google Scholar] [CrossRef]
  15. Kaspar, M.; Frühwirt, T.; Latal, C.; Blümel, M. Towards a rapid and practical determination of the pin-rock interaction parameters of the CERCHAR abrasivity test. In Engineering Geology and Geotechnics: Building for the Future, Proceedings of the 4th European Regional Conference of IAEG, Dubrovnik, Croatia, 8–12 October 2024; University of Zagreb, Faculty of Civil Engineering: Zagreb, Croatia, 2024; pp. 71–80. [Google Scholar]
  16. Heiniö, M. Rock Excavation Handbook; Sandvik Tamrock Corporation: Tampere, Finland, 1999; 183p. [Google Scholar]
  17. Arthur, C.D. The determination of rock material properties to predict the performance of machine excavation in tunnels. Q. J. Eng. Geol. 1996, 29, 67–81. [Google Scholar] [CrossRef]
  18. Piazzetta, G.R.; Lagoeiro, L.E.; Figueira, I.F.R.; Rabelo, M.A.G.; Pintaude, G. Identification of abrasion regimes based on mechanisms of wear on the steel stylus used in the Cerchar abrasiveness test. Wear 2018, 410–411, 181–189. [Google Scholar] [CrossRef]
  19. Verhoef, P.N.W. Wear of Rock Cutting Tools—Implications for the Site Investigation of Rock Dredging Projects, 1st ed.; Routledge: London, UK, 1997; 340p. [Google Scholar] [CrossRef]
  20. Maidl, B.; Schmid, L.; Ritz, W.; Herrenknecht, M. Hardrock Tunnel Boring Machines; Ernst & Sohn: Berlin, Germany, 2008; 343p. [Google Scholar] [CrossRef]
  21. Oggeri, C.; Oreste, P. The wear of Tunnel Boring Machine excavation tools in rock. Am. J. Appl. Sci. 2012, 9, 1606–1617. [Google Scholar] [CrossRef]
  22. ASTM D 7625-22; Standard Test Method for Laboratory Determination of Abrasiveness of Rock Using the CERCHAR Abrasiveness Index Method (D 7625). ASTM International: West Conshohocken, PA, USA, 2022.
  23. Alber, M.; Yarali, O.; Dahl, F.; Bruland, A.; Kasling, H.; Michalakopoulos, T.N.; Cardu, M.; Hagan, P.; Aydin, H.; Ozarslan, A. ISRM suggested method for determining the abrasivity of rock by the CERCHAR Abrasivity Test. Rock Mech. Rock Eng. 2014, 47, 261–266. [Google Scholar] [CrossRef]
  24. Käsling, H.; Plinninger, R.J. Determining the abrasivity of rock using the CERCHAR test—Recommendation No. 23 of the Commission on Rock Testing of the German Geotechnical Society. Bautechnik 2016, 93, 409–415. [Google Scholar] [CrossRef]
  25. ÖBV. Merkblatt Abrasivitätsbestimmung von Grobkörnigem Lockergestein; Österreichische Bautechnikvereinigung: Vienna, Austria, 2013; 27p. [Google Scholar]
  26. West, G. Rock abrasiveness testing for tunnelling. Int. J. Rock Mech. Min. Sci. Geomech. Abstr. 1989, 26, 151–160. [Google Scholar] [CrossRef]
  27. Plinninger, R.J.; Restner, U. Abrasivity Testing, Quo Vadis?—A commented overview of abrasivity testing methods. Geomech. Tunn. 2008, 1, 61–70. [Google Scholar] [CrossRef]
  28. Valantin, A. Test CERCHAR pour la mesure de la dureté et de l’abrasivité des roches. In Development and Exploratory Techniques in Coal Mines; Commission of the European Communities: Luxembourg, Luxembourg, 1974; pp. 186–193. [Google Scholar]
  29. Rostami, J.; Ozdemir, L.; Bruland, A.; Dahl, F. Review of issues related to Cerchar abrasivity testing and their implications on geotechnical investigations and cutter cost estimates. In Proceedings of the Rapid Excavation and Tunneling Conference, Seattle, WA, USA, 27–29 June 2005; Society for Mining Metallurgy & Exploration: Englewood, CO, USA, 2005. 13p. [Google Scholar]
  30. Suana, M.; Peters, T. The Cerchar Abrasivity Index and its relation to rock mineralogy and petrography. Rock Mech. 1982, 15, 1–8. [Google Scholar] [CrossRef]
  31. Al-Ameen, S.I.; Waller, M.D. The influence of rock strength and abrasive mineral content on the CERCHAR Abrasive Index. Eng. Geol. 1994, 36, 293–301. [Google Scholar] [CrossRef]
  32. Ersoy, A.; Waller, M.D. Textural characterization of rocks. Eng. Geol. 1995, 39, 123–136. [Google Scholar] [CrossRef]
  33. Thuro, K.; Käsling, H. Classification of the abrasiveness of soil and rock. Geomech. Tunn. 2009, 2, 179–188. [Google Scholar] [CrossRef]
  34. Moradizadeh, M.; Cheshomi, A.; Ghafoori, M.; TrighAzali, S. Correlation of equivalent quartz content, Slake durability index and Is50 with Cerchar abrasiveness index for different types of rock. Int. J. Rock Mech. Min. Sci. 2016, 86, 4247. [Google Scholar] [CrossRef]
  35. Askaripour, M.; Saeidi, A.; Mercier-Langevin, P.; Rouleau, A.A. Review of relationship between texture characteristic and mechanical properties of rock. Geotechnics 2022, 2, 262–296. [Google Scholar] [CrossRef]
  36. Kaspar, M.; Latal, C.; Pittino, G.; Blümel, M. Hardness, strength and abrasivity of rocks: Correlations and predictions. Geomech. Tunn. 2023, 16, 184–192. [Google Scholar] [CrossRef]
  37. Plinninger, R.J.; Spaun, G.; Thuro, K. Prediction and classification of tool wear in drill and blast tunnelling. In Engineering Geology for Developing Countries; International Association for Engineering Geology and the Environment: Durban, South Africa, 2002; pp. 2226–2236. ISBN 0-620-28559-1. [Google Scholar]
  38. Kanji, M.A. Critical issues in soft rocks. J. Rock Mech. Geot. Eng. 2014, 6, 186–195. [Google Scholar] [CrossRef]
  39. Kaspar, M.; Latal, C.; Blümel, M.; Pittino, G. Is soft rock also non-abrasive rock? An evaluation from lab testing campaigns. IOP Conf. Ser. Earth Environ. Sci. 2023, 1124, 012019. [Google Scholar] [CrossRef]
  40. Rao Karanam, U.M.; Misra, B. Principles of Rock Drilling; A.A. Balkema: Rotterdam, The Netherlands, 1998; 265p. [Google Scholar]
  41. Piazzetta, G.R.; Figueira, I.F.R.; Gonçalves, M.A. Cerchar Abrasiveness Test—The portability between rock abrasiveness laboratory test and real excavation projects. In International Symposium on Field Measurements in Geomechanics; ISSMGE: Rio de Janeiro, Brazil, 2018; 16p. [Google Scholar]
  42. Rostami, J. Hard rock TBM cutterhead modeling for design and performance prediction. Geomech. Tunn. 2008, 1, 18–28. [Google Scholar] [CrossRef]
  43. Singh, S.P. A simple criterion for the machinability of hard rocks. Int. J. Mining Geol. Eng. 1989, 7, 257–266. [Google Scholar] [CrossRef]
  44. Lislerud, A. Principles of Mechanical Excavation; Posiva Report No. 97-12; Possiva Oy: Helsinki, Finland, 1997; 186p. [Google Scholar]
  45. Alber, M. Stress dependency of the Cerchar abrasivity index (CAI) and its effects on wear of selected rock cutting tools. Tunn. Undergr. Space Technol. 2008, 23, 351–359. [Google Scholar] [CrossRef]
Figure 1. Principles of the CERCHAR abrasivity test and rock excavation. (a) Schematic sketch of the CERCHAR pin geometry and associated wear of tip d [6]; (b) lithologic factors controlling the excavatability of rocks. The type, quantity and grain size of minerals, their spatial orientation and the type of grain contacts (e.g., straight, lobate), together with the presence of voids (porosity), control how abrasive the material is and how efficiently it can be cut from the intact rock. Stress–strain diagram in the top left shows the mechanical differences among the various mineral species of the example rock. Redrawn and modified in line with [19].
Geotechnics 04 00063 g001
Figure 2. Overview of the CERCHAR abrasivity test. (a) Testing device setup [27]; (b) microscopic side-view photograph of the steel pin with a reconstructed 90° pin geometry (red dashed lines) and measured wear d; (c) macroscale photograph of a test specimen with five individual scratch grooves on a diamond saw-cut surface.
Geotechnics 04 00063 g002
Figure 3. Concept for determining the additional parameters for an updated evaluation of the CERCHAR abrasivity test. (a) Schematic drawing showing the geometrical relationship between the CAI and the Sw for a regular case during the CERCHAR test; (b) example of a scratch groove and a measurement of the scratch width Sw under the microscope.
Geotechnics 04 00063 g003
Figure 4. Synthetic cross sections of the rock specimen used for the boundaries in Figure 5a. (a) Increasing Vm is associated with an increasing CAI at constant Px (black lines in diagram). The schematic cross section of the specimen illustrates that the increase in Vm is associated with the widening of the trapezoid profile. Note that the cross-section profile evolves from being V-shaped to trapezoid with an increasing CAI; (b) decreasing Vm with an increasing CAI. The initial Px value corresponds to the final CAI (evolution along red arrows in Figure 5a).
Geotechnics 04 00063 g004
Figure 5. Diagram for the assessment of efficient excavatability classes. (a) Regions of excavatability are bound by the maximum amount of extractable material for a given penetration depth (Px) and the lines of decreasing material removal as a result of higher abrasivity on the pin. White regions are not realized due to the inherent tribological properties of the pin–rock interaction. CAI classes labeled according to CERCHAR [8], and boundaries in the diagram (dashed lines) drawn after [23]; (b) 3D plot of CAI–Vm–CAR. The decrease in CAR follows the trend defined by the excavation classes.
Geotechnics 04 00063 g005
Figure 6. The overall correlation of the CAR and CAI obtained from the presented approach in comparison with the one published by Zhang and Konietzky [12]. Modified in line with [15].
Geotechnics 04 00063 g006
Figure 7. Plot of UCS vs. penetration depth, Px. Modified in line with [15]. The traditional limit of soft rocks is shown for reference. The criterion for defining soft rocks can be extended by considering the ability of a tool to penetrate the rock surface in combination with the bulk strength (UCS) of the rock and its abrasive potential (i.e., CAI). Soft rocks can be penetrated at higher rates, have low-to-medium abrasiveness on the tool and exhibit low-to-moderate strength (light blue box). In contrast, the light green box illustrates that there are also certain low-strength rocks that can only be penetrated at lower rates. The content of hard minerals (Mohs hardness > 6) responsible for elevated tool wear [3] is shown next to the data points, suggesting that several rock parameters, such as the fabric and the composition, affect the penetration depth, abrasivity and UCS.
Geotechnics 04 00063 g007
Table 1. Parameters determined for the different rocks investigated in the present study. No. 1–17: carbonates/marly carbonates, No. 18–21: sulfate rocks, No. 22–29: sandstones, No. 30–35: clay-/siltstones, No. 36–46: mica schists, No. 47–56: gneisses and granites.
Rock TypeSpecimen No.CAI (−)Vm (mm3)CAR (−)
Limestone (marly)10.81.244.27
Limestone (marly)21.90.372.61
Limestone (marly)32.50.061.46
Limestone (marly)40.81.204.25
Limestone (marly)51.50.242.73
Limestone62.30.101.80
Marble w. dolomite70.73.374.88
Marble w. dolomite81.30.142.70
Limestone91.20.162.85
Limestone101.20.253.05
Limestone111.10.253.15
Dolomitic marble121.40.403.04
Dolomitic marble130.92.434.41
Dolomite (w. palygorskite)142.20.222.20
Limestone (marly)150.81.344.30
Limestone (marly)161.11.864.03
Dolomite breccia171.21.023.65
Anhydrite w. dolomite181.30.202.84
Anhydrite w. dolomite191.50.242.73
Gypsum201.40.933.41
Gypsum211.70.763.07
Sandstone222.22.223.20
Sandstone231.71.353.32
Sandstone241.72.413.57
Sandstone251.42.903.91
Sandstone263.20.602.14
Sandstone272.00.352.52
Sandstone (coarse-grained)282.40.822.66
Sandstone291.01.734.12
Clay-/siltstone300.31.045.47
Clay-/siltstone310.61.364.68
Clay-/siltstone321.03.574.44
Clay-/siltstone330.43.665.64
Clay-/siltstone340.92.054.33
Clay-/siltstone350.62.214.89
Mica schist362.60.131.74
Mica schist374.40.141.10
Mica schist382.90.492.19
Mica schist393.30.231.68
Mica schist401.50.653.17
Quartzitic phyllite413.80.211.47
Serizitic phyllite/mica schist422.70.962.57
Mica schist433.20.762.25
Mica schist (folded)443.30.792.23
Mica schist453.90.171.35
Mica schist463.50.121.34
Granite473.90.121.20
Gneiss484.60.171.11
Gneiss (coarse-grained)493.80.161.34
Granite503.90.201.41
Gneiss (coarse-grained)513.80.161.34
Gneiss (coarse-grained)523.70.181.44
Gneiss (coarse-grained)533.60.081.14
Granite542.41.682.97
Granite553.40.231.65
Gneiss, quarzitic, banded564.10.231.40
Disclaimer/Publisher’s Note: The statements, opinions and data contained in all publications are solely those of the individual author(s) and contributor(s) and not of MDPI and/or the editor(s). MDPI and/or the editor(s) disclaim responsibility for any injury to people or property resulting from any ideas, methods, instructions or products referred to in the content.

