Abstract
Rock mechanics and the estimation of their material properties through field tests are important aspects and challengees in civil and geotechnical engineering. However, this procedure is expensive and difficult to attain, while the machine learning and neural network theory provide a computational tool for estimating the material properties with limited data. In this work, an estimation of the Young Modulus and the cohesion of a clayey-originated rock through feed-forward neural networks constructed from in situ data measurements is given. The input values come from the Geological Strength Index (GSI) proposed values of the point load index , the uniaxial compression strength , as well as the specific gravity of the rock mass. The convergence analysis revealed that the convergence occurs at approximately 2000 epochs, with the largest mean square error norm being no greater than . In addition, it is demonstrated that augmenting results in the estimation of rock that is stiffer and stronger. The aforementioned increase in the specific site may be up to 20% for the stiffness and up to 25% for the cohesion. This model, aside from readability and accuracy, offers the convenience of enriching it with more in situ data, thereby enhancing the flexibility of the proposed numerical tool proposed. However, its applicability is limited to the specific data acquired from the particular site, so a more general estimation requires a substantially larger dataset. Finally, the justification of the proposed model has been carried out based on suggestions from the literature for common values of clayey-oriented rock, which is fairly disintegrated as seen in the field.
1. Introduction
Rock mechanics and the subsequent estimation of material parameters are of paramount importance in civil engineering and infrastructure design. In this context, in situ data measurements are the tool by which to acquire the material constitutive model. The measurements may be conducted through tests such as the standard/cone penetration tests (SPT, CPT), cross-hole and down-hole methods, and material cylinder extraction [1,2,3,4,5,6]. The amount of data taken from the site and the quality of the data provide the accuracy in the stress–strain law and, subsequently, the mass response to loading. The stress–strain law in rock masses is typically of the Mohr–Coulomb type but can significantly differ, such as the Hoek and Brown failure criterion and the Barton failure criterion, which rely on the value of the Geological Strength Index (GSI) to classify the rock mass and construct the yield function [7,8,9,10,11].
The evolution of computer science and the subsequent computational power of supercomputers led to the evolution of machine learning science. One of machine learning’s most prominent tools is the neural network (NN). In civil engineering, NNs have been employed to replace analysis and simulations when the data are sufficient; however, even with limited data, reliable models of substantial relative accuracy can be obtained [12,13,14,15,16,17]. From structural engineering to multi-scale modeling and geotechnical engineering, as well as hydraulics and transportation, all subtopics of infrastructure design have been employing NNs to reduce the analyses needed for the design and response prediction of physical and mechanical systems. For the investigation of rock mass characteristics and neural networks, scientific publications imply the computational machine learning tools, among other methods, for tasks such as rock mass classification [18,19], predicting the bearing capacity of pile tips embedded rock masses [20], combining and comparing results with fuzzy and genetic programming [21,22], and estimating abutments stresses through neural network models using data obtained from numerical analyses [23]. Most of these have the advantage that they fit with the given data and their estimations are fairly reliable. However, as usual, they adopt only experimental or only estimated data through numerical analysis or literature estimations. Moreover, for general use, a substantially increased amount of data is required.
In this work, feed-forward neural network models are proposed for the estimation of the Young Modulus E and cohesion c for a clayey-oriented rock sited in Koropi, Athens, Greece. A dataset of 50 points, in which the GSI method was adopted with the point load index value, uniaxial compression strength value, and specific gravity value as the input parameters for the NNs, while the outputs are E and c. It is demonstrated that the mean square relative error is on the order of magnitude of , which is substantial for the applications investigated. Moreover, an increase in each input value mainly results in a significant increase in the values of E and c. The propositions of the aforementioned NNs are taken from in situ data measurements and are combined with an augmented dataset estimated from nearby values. Thus, the model training is completed not only for reliable estimations but also to prove that an enrichment of the in situ data with the estimated data can provide a reliable and accurate NN model. In addition to the aforementioned advantage, this model presents computational efficiency and accuracy, as well as adaptivity and flexibility for incorporating both in situ and computational data. This presents an advantage over alternative model formulations. In conclusion, the limitation of this model lies in the fact that it is trained for specific sites. The enrichment of the data to accommodate more general cases requires a substantially larger dataset.
2. Feed-Forward Neural Networks
A feed-forward neural network (FNN) refers to a set of interrelated processors called neurons, distributed into an input, an output, and median layers. By defining , an FNN with k median layers, each part of it consists of neurons for . Denoted by and are the input and the output layers’ neuron numbers, respectively. Each layer, with the exception of the input, is given a weight matrix and a bias vector: and , respectively; all of these, assumed for each of the network layers, are the model parameters to be found. The input vector is denoted as , and the output vector of the layer is denoted as , for . An illustration of an FNN with one median layer is given in Figure 1.
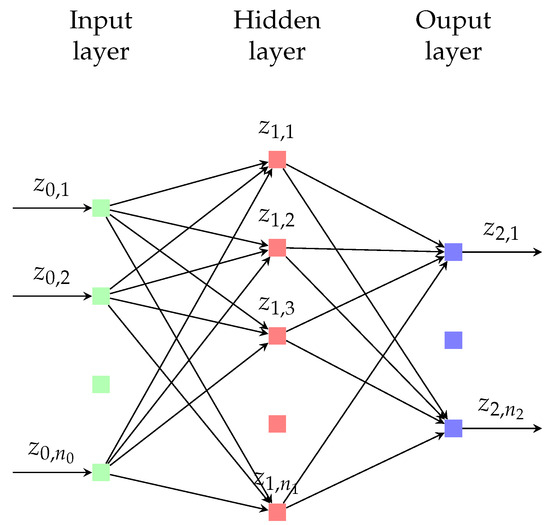
Figure 1.
A feed-forward neural network with one median layer.
Each layer, j, may have the following equation:
where is a non-linear activation function calculated layer-wise. Subsequently, the FNN is a function mapping from input parameters to output values using Equation (1).
The model parameters are found through a method called supervised learning. In supervised learning, the FNN is given data with input and target (flag) values, and its objective is to reduce the divergence, or error, between its processed output and the target values. The error is estimated through a loss function, , such as the mean squared norm. If a continuous case and a dataset are assumed, then the error function is as follows:
denoting the inputs as and the targets as .
The activation functions are non-linear; consequently, the reduction in the loss through Equation (2) is a non-convex problem that may only be solved with non-linear methods, such as stochastic gradient descent [24] and quasi-Newton procedures [25]. In the present paper, the FNN method is implemented in order to estimate the Young Modulus and the cohesion of a clayey-oriented rock for which in situ measurements have been taken.
3. Geological Strength Index and the Relation to the Material Variables of Strength and Stiffness
For the classification of the rock masses and, subsequently, the estimation of the corresponding constitutive model, the GSI has been introduced. This index is a quantitative representative of the qualitative characteristics of the rock mass. More specifically, for jointed rock masses, the surface conditions and the structure of the rock have been characterized in five and six different ways, respectively. Then, the combination of surface conditions and the surface of the rock result in a range of GSI values. It is recommended to choose a range, rather than a mean value itself; however, the divergence in the estimation of the GSI for certain conditions is not necessarily widely diverged. This way is not applicable to structurally controlled failures. The illustration of the method of derivation of the GSI is depicted in Figure 2. It should be noted that a fit with the experimental data to verify the range of the chosen GSI is always important.

Figure 2.
Geological Strength Index (GSI) deriviation for joint masses as proposed in [26].
After the determination of the GSI, the Hoek and Brown criterion may be formulated. This failure function states that a Mohr–Coulomb non-linear relation is that which defines the pair of stresses that leads to failure. The largest principal effective stress and the minimal principal effective stress , which hereinafter will be denoted without the “’ ’ ” sign for simplicity, are related to this equation:
where can be determined from experimental data involving five triaxial load experiments, each with a minimal principal effective stress not exceeding 0.5 . A typical parameter estimation, however, is possible through the quality of the rock mass as stated in [26,27]. A proposition of without the experimental data is depicted in Table 1.

Table 1.
Proposal for estimation of m_b as proposed in [27].
Finally, a more generalized form of this model [28] is below:
where
and D is the degree of disturbance to which the rock mass has been forced to blast damage, and the stress relaxation in this work is assumed to be D = 1. It should be emphasized that the range in values is intended to account for the different granularities and the interlocking of the crystal structure. It is evident that higher values of represent more frictional rock masses and high granularity. Moreover, these values pertain to intact rock specimens that tested normal to bedding or foliation. If there is a weakness plane or the integrity of the rock mass is reduced, these values will be significantly different.
Given the formation of the GSI and the Hoek and Brown yield criterion, it becomes possible to estimate the Young Modulus, cohesion, and friction angle. In this work, an empirical relation with the GSI is available and used for the derivation of the Young Modulus [28]:
As for cohesion and the friction angle, determining the Hoek and Brown yield function with the assumption that this function balances over and under the Mohr–Coulomb (MC) yield function plot areas provides values for the cohesion c and friction angle . Subsequently, the stiffness and the strength of the rock are fully determined. In this work, these procedures have been employed in order from the experimental data to derive the rock material properties in order to form the input data vector that will lead to the construction of the feed-forward neural networks described above.
4. Numerical Application-Formulation of Dataset from In Situ Measurements and Construction of the Feed-Forward Neural Network-Discussion
4.1. Research Methodology
The aforementioned theory was applied to data measurements obtained from geotechnical drilling to a site of clayey-oriented, fully disintegrated cobblestone rock with substantial clayey- and calcium-oriented connecting substances, situated in Koropi, Athens, Greece, as portrayed in Figure 3. The cobbles are limestone. From this drilling, seven data points were obtained, and, with the estimation of the material input variable range in the vicinity of the data point input values, the dataset vector size has been augmented to 50. Subsequently, the procedure portrayed in Section 3 was employed with the aid of the program Rocklab, and the values for the Young Modulus and the cohesion were calculated through the fit of the Hoek and Brown curve to the Mohr–Coulomb circle of failure. The friction angle was also estimated; however, a very small divergence from the mean value of the dataset must result in considering and assuming the friction angle to be a deterministic value of 34°. Then, a formulation of the feed-forward neural networks took place, considering the mean square error norm as the objective function to be minimized. The results are depicted in Figure 4, Figure 5, Figure 6, Figure 7, Figure 8, Figure 9, Figure 10 and Figure 11 and Table 2. In the aforementioned items, the largest relative mean square error of the NN estimations and the dataset are given alongside the amount of epochs needed to achieve convergence to this amount. Moreover, the schematic representation of the two NN models in a 3D plot and the model projections onto each input axis X, Y, and Z, corresponding to , , and , respectively, are portrayed. Neural Network 1 (NN1) stands for the model estimating the Young Modulus in GPa, while Neural Network 2 (NN2) stand for the model predicting the cohesion in KPa. In conclusion, the dataset points are also depicted in the aforementioned figures in order to illustrate the substantial model fit to the data provided. It should be noted that the formulation of the neural networks has been completed through the open-source numerical computational program MSolve of the Institute of Structural Analysis of the School of Civil Engineering (NTUA); details about this program are given in the Data Availability Statement.
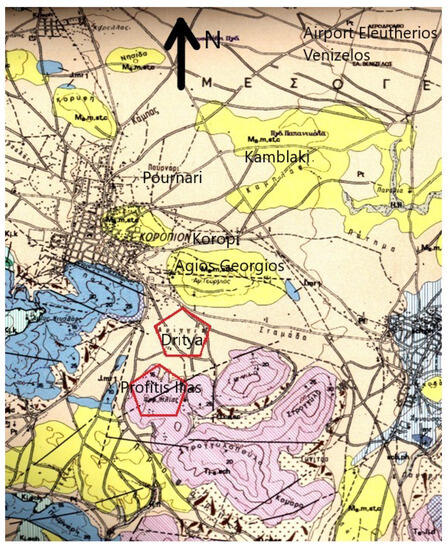
Figure 3.
The site of the rock mass in Koropi, Athens, Greece. The polygons refer to the positions of the data measurements taken. Scale is 1:100.
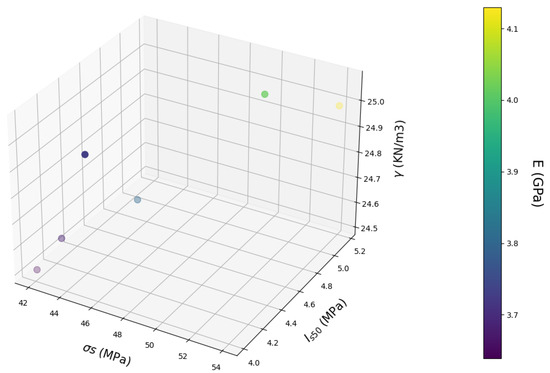
Figure 4.
The NN model for the estimation of Young Modulus E in GPa in 3D representation.
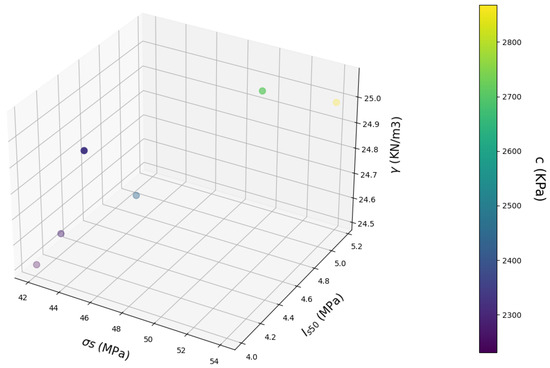
Figure 5.
The NN model for the estimation of cohesion in KPa in 3D representation.
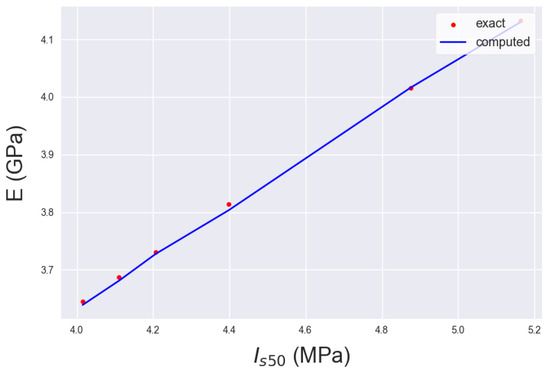
Figure 6.
NN projection of Figure 4 on input axis X ( in MPa).
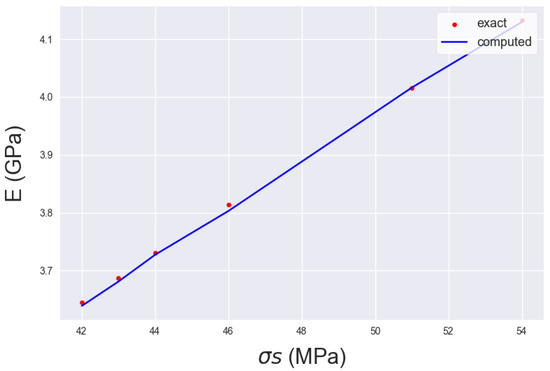
Figure 7.
NN projection of Figure 4 on input axis Y ( in MPa).
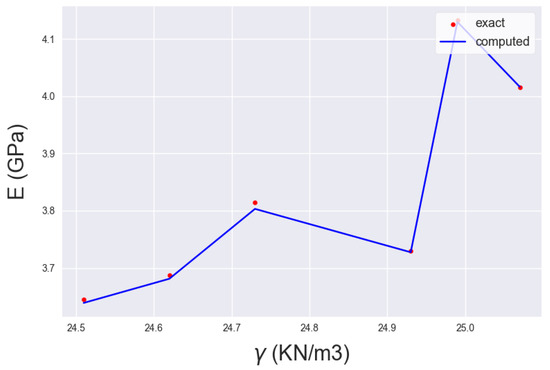
Figure 8.
NN projection of Figure 4 on input axis Z ( in ).
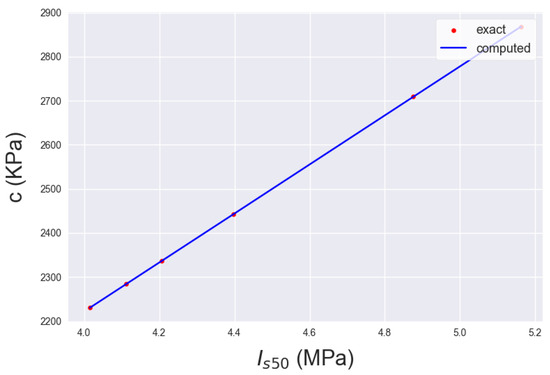
Figure 9.
NN projection of Figure 5 on input axis X ( in MPa).
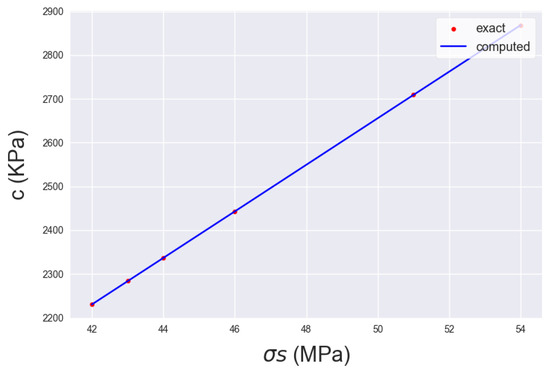
Figure 10.
NN projection of Figure 5 on input axis Y ( in MPa).
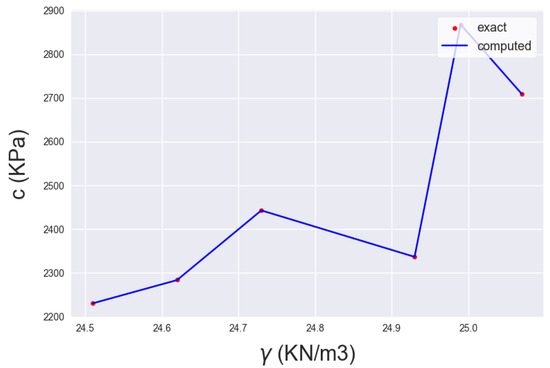
Figure 11.
NN projection of Figure 5 on input axis Z ( in ).

Table 2.
Estimation of maximum relative mean square error for the neural networks proposed. Both models needed about 2000 epochs for convergence.
4.2. Results and Discussion—Advantages and Limitations of the Proposed Models
The convergence analysis of the proposed NN sheds light on the quality of the dataset’s vector length and the model’s estimation accuracy. The mean square error norm is investigated, along with the epochs needed for convergence which are the iterations necessary for defining the hyperparameters of the model in supervised learning algorithms. As depicted in Table 2, the highest relative mean square error values for both neural networks fall within the range of 0.08 for the Young Modulus and for the cohesion. Both of them, for the mean values of the estimators, are fairly low; thus, the model accuracy is substantial for the amount of datasets provided and for its applications in geotechnical and geological engineering. It is evident that increasing the dataset’s vector length leads to improved accuracy. Given that the number of epochs is in the vicinity of 2000, it can be concluded that the model can readily be adapted to accommodate additional computational and experimental data, with a reduced computational cost, in order to achieve higher accuracy in the material parameter estimation. In conclusion, the estimations proposed by the models are reliable as input variables for an FEM model, especially considering the standard deviation of the material input parameters, which exhibit moderately increased values (up to or exceeding 50%).
The considerations in the model estimating the Young Modulus shed light on the influence of each input parameter on the actual value. The range of the model predictions is in the subset of [3.5–4.2] in GPa. Moreover, an increase in and results in an increase in the Young Modulus, whereas for , there are both increases and decreases in the output value. However, the largest increase in the Young Modulus derived from the output range is no more than about 20%. The subset range of the estimations does apply to typical values of the Young Modulus for a clayey-oriented rock. The input values for the greatest value of E are () = (5.1, 54 MPa, 24.9 ). These are considered to be large values for the specific gravity and moderate values for the rest of the input variables, which correspond to a fairly disintegrated rock that still exhibits rock behavior. Subsequently, the model estimations represent a reliable and realistic range of estimations as stated in [26,27,28,29].
The reflections in the model approximating the cohesion portray the effect of each input variable on the real value. The model’s estimations are in the subset of [2250–2850] in KPa. In addition, when the and are augmented, the cohesion also increases with an alternating slope, whilst for , there are subsets of increase and subsets of decrease in the output estimation. Nonetheless, the largest increase in the cohesion given from the output subset is less than in the vicinity of 26%. The subset range of the predictions corresponds to typical cohesion values for a clayey-oriented rock. The input triad for the largest value for c is () = (5.1, 54 MPa, 24.9 ). This is assumed to have large values for the specific gravity and moderate values for the rest of the input variables, which correspond to a fairly disintegrated that still exhibits rock behavior. Consequently, the model estimations represent a reliable and realistic range of estimations. Finally, the input triad that optimizes stiffness and strength is the same as in the specific material constitutive model proposed by the GSI, as expected, and this drives the conclusion that the model’s formulation is realistic and well-founded, as confirmed in [26,27,28,29].
From the discussion above, we draw two general conclusions. The NNs proposed are reliable and realistic with substantial accuracy for geotechnical engineering. Moreover, the convergence is fast and easy to obtain, and the formulation of the NNs does not involve an enlarged computational effort. In addition, the input triad providing an optimization for the stiffness and the strength of the rock material is the same as expected from the theory proposing the material behavior of the rock mass, which leads to the conclusion that the model is well-constructed. In addition, the adaptivity to additional data is an extra advantage of the proposed models, which implies that, with an alleviated computational cost, a more precise estimation is available. There are two main limitations of the model. First, the models are site-dependent, i.e., they apply only to specific sites that have the same geological parameters. This would provide a broader scope within the specific site if additional data were available. Moreover, in terms of accounting for the same geological parameters, but at sites different than the one investigated in Koropi, a substantially increased dataset would be necessary. However, both limitations of the model can be tackled in a reasonable amount of computational time.
The model identities and results provide some general conclusions as well. First, it validates the behavior of rock materials, where stiffness and strength typically align, meaning that higher stiffness in a specific rock results in a similarly high strength. This is not the case when the specific gravity lies within the subset [24.7–24.9] . This is a small divergence compared to the common values for , so the conclusion is that, in most cases, the stiffer stone results in a stronger one as well, and this relationship is not linear. Moreover, the fact that the same input triad gives the maximum values for the Young Modulus and cohesion not only validates the NNs predictions but also indicates that the aforementioned value, which established the largest value for the estimations, is a real-world value and not a spurious one. Moreover, the actual values of and vary in the range of 20–25%, while the outputs have a similar relative range. Subsequently, it is demonstrated that the NNs provide detailed information about the outputs, since they can estimate using a fairly small range subset. Finally, the possibility of a broader dataset was not feasible since, as the drilling procedure validated the range of material variables under consideration.
5. Conclusions
In this article, feed-forward neural networks are suggested to approximate the cohesion c and the Young Modulus E for a clayey-originated cobblestone rock situated in Koropi, Athens, Greece. At this position, drilling took place, and in situ measurements were incorporated. A data vector of 50 points in length is used, implementing the GSI method with the NN input parameters of the point load index value, uniaxial compression strength value, and specific gravity value. With the aid of computational tools, the material parameter approximation from the experimental data and the subsequent neural network are formulated, and the convergence study is assessed. Moreover, an evaluation of the model properties is postulated, and its qualitative and quantitative properties are elucidated and depicted. In addition, the computational cost is considered and evaluated as a comparison with other similar analyses.
The convergence study sheds light on the precision of the estimations of the output material parameters. The relative error, after a small to moderate number of epochs and iterations needed to define the model parameters, is in the vicinity of less than 0.1 and , respectively, which holds significant value for all applications in geotechnical engineering. The computational effort of the model through the computer-aided machine learning open-source computational programs is alleviated subsequent to the formulation and reformulation of the NN. This applies regardless of the assumed hidden layers between the input and the output. The model is efficient, accurate, adaptive, and flexible to more data that can be added. The output material parameters vary from 20 to 25% in relation to the largest and the smallest values. The Young Modulus has a moderate to large estimation for a rock that has a clayey orientation and is fairly disintegrated, and the input triad results in moderate values, except for the specific gravity, which is fairly large. The cohesion has a moderate to large approximation for the aforementioned rock, and the input vector results in moderate values, except for the specific gravity, which is augmented. It is demonstrated that the input vector triad that optimizes the stiffness and the strength of the material variable is the same, as expected from the theory. This validates the model and postulates the fact that, in rock materials, a large stiffness often comes with a corresponding augmented strength; this is not always the case in materials engineering.
In a future work, extending NNs with additional data and combining them with other types of models could be considered. Convolutional neural networks, physics-dnduced neural networks, and fuzzy and genetic programming methods may be adopted for constructing similar estimations that can be compared and evaluated. Subsequently, the aforementioned approximations may be more reliable, and any possible limitation of one model may be addressed by the estimation of another model, thus rendering the full range of practical situations fully predictable. Other classifications, such as RQD, RMR, and Qslope, may also be employed, and similar NN models may be formulated. In addition, analyses of the estimation of the material parameters originating from NN predictions may be incorporated and compared to the regulatory and empirical estimations of material parameters and rock mass responses in order to advance the geotechnical engineering design by validating and improving the regulations and empirical approximations of the material parameters and rock responses. Finally, direct NNs from data that relate the absolute response of the rock mass may be formulated, and a similar comparison and design optimization may take place.
Author Contributions
Conceptualization, A.-A.S. and A.A.A.; Methodology, A.-A.S.; Software, L.P., A.M. and K.K.; Validation, A.-A.S.; Formal analysis, L.P., A.M. and K.K.; Data curation, A.A.A.; Writing—original draft, A.-A.S. All authors have read and agreed to the published version of the manuscript.
Funding
This research has been supported by REGALE “An open architecture to equip the next generation of HPC applications with exascale capabilities”, Grant Number 956560 coming from H2020 from the European Union.
Data Availability Statement
The data that support the findings of this study are not openly available for simplicity and are available from the corresponding author upon reasonable request via the email address provided. The open-source code MSolve in Programming Language C# is used for the analyses. Information can be found at the following link: http://mgroup.ntua.gr/ accessed on 1 September 2023.
Conflicts of Interest
The authors declare no conflict of interest.
References
- Hawkins, L.; Wootton, P.; Holmes, W. Coal seam structure delineation by downhole-crosshole seismic methods. Geoexploration 1987, 24, 409–419. [Google Scholar] [CrossRef]
- Bowles, J. Foundation Analysis and Design; McGraw Hill: New York, NY, USA, 1988; ISBN 13: 978-0070067769. [Google Scholar]
- Clayton, C.R.I. The Standard Penetration Test (SPT): Methods and Use: R143-Softcover; Construction Industry Research and Information Association: London, UK, 1995; ISBN 13: 9780860174196. [Google Scholar]
- Eslami, A.; Moshfeghi, S.; MolaAbasi, H.; Eslami, M. Piezocone and Cone Penetration Test (CPTu and CPT) Applications in Foundation Engineering; Butterworth-Heinemann: Oxford, UK, 2019; ISBN 13: 978-0081027660. [Google Scholar]
- Huynh, V.H.; Nguyen, T.; Nguyen, D.P.; Nguyen, T.S.; Huynh, T.M.D.; Nguyen, T.C. A novel direct SPT method to accurately estimate ultimate axial bearing capacity of bored PHC nodular piles with 81 case studies in Vietnam. Soils Found. 2022, 62, 101163. [Google Scholar] [CrossRef]
- Hwang, J.H.; Lu, C.C.; Wang, J.S. Characterized model uncertainties of CPT-based simplified procedures for assessing soil liquefaction and its application to Taiwan offshore wind farms. Appl. Ocean Res. 2023, 138, 103645. [Google Scholar] [CrossRef]
- Barton, N. The shear strength of rock and rock joints. Int. J. Rock Mech. Min. Sci. Geomech. Abstr. 1976, 13, 255–279. [Google Scholar] [CrossRef]
- Hoek, E.; Brown, E.T. Underground Excavations in Rock; Institution of Mining and Metallurgy: London, UK, 1980. [Google Scholar]
- Hoek, E.; Marinos, P. GSI: A Geologically Friendly Tool for Rock Mass Strength Estimation; 2000. Available online: https://onepetro.org/ISRMIS/proceedings-abstract/IS00/All-IS00/50905 (accessed on 1 September 2023).
- Zhao, L.; Yu, C.; Li, L.; An, A.; Nie, Z.; Peng, A.; Zuo, S. Rock slope reliability analysis using Barton-Bandis failure criterion with modified pseudo-dynamic approach. Soil Dyn. Earthq. Eng. 2020, 139, 106310. [Google Scholar] [CrossRef]
- Zhong, J.; Yang, X. Two-dimensional face stability analysis in rock masses governed by the Hoek-Brown strength criterion with a new multi-horn mechanism. Int. J. Min. Sci. Technol. 2023, 33, 963–976. [Google Scholar] [CrossRef]
- Granata, F.; de Marinis, G. Machine learning methods for wastewater hydraulics. Flow Meas. Instrum. 2017, 57, 1–9. [Google Scholar] [CrossRef]
- Asteris, P.G.; PLevris, V. Anisotropic Masonry Failure Criterion Using Artificial Neural Networks. Neural Comput. Appl. 2017, 28, 2207–2229. [Google Scholar] [CrossRef]
- Budak, A.; Sarvari, P.A. Profit margin prediction in sustainable road freight transportation using machine learning. J. Clean. Prod. 2021, 314, 127990. [Google Scholar] [CrossRef]
- Nikolopoulos, S.; Kalogeris, I.; Papadopoulos, V. Machine learning accelerated transient analysis of stochastic nonlinear structures. Eng. Struct. 2022, 257, 114020. [Google Scholar] [CrossRef]
- Savvides, A.A.; Papadopoulos, L. A neural network model for the estimation of failure stresses and strains in cohesive soils. Geotechnics 2022, 2, 1084–1108. [Google Scholar] [CrossRef]
- Mohammadi, A.; Karimzadeh, S.; Amir, S.; Ozsarac, V.; Lourenço, P.B. The Potential of Region-Specific Machine-Learning-Based Ground Motion Models: Application to Turkey. Soil Dyn. Earthq. Eng. 2023, 172, 108008. [Google Scholar] [CrossRef]
- Azarafza, M.; Nanehkaran, Y.A.; Rajabion, L.; Akgün, H.; Rahnamarad, J.; Derakhshani, R.; Raoof, A. Application of the modified Q-slope classification system for sedimentary rock slope stability assessment in Iran. Eng. Geol. 2020, 264, 105349. [Google Scholar] [CrossRef]
- Brousset, J.; Pehovaz, H.; Quispe, G.; Raymundo, C.; Moguerza, J.M. Rock mass classification method applying neural networks to minimize geomechanical characterization in underground Peruvian mines. Energy Rep. 2023, 9, 376–386. [Google Scholar] [CrossRef]
- Millán, M.; Picardo, A.; Galindo, R. Application of artificial neural networks for predicting the bearing capacity of the tip of a pile embedded in a rock mass. Eng. Appl. Artif. Intell. 2023, 124, 106568. [Google Scholar] [CrossRef]
- Beiki, M.; Bashari, A.; Majdi, A. Genetic programming approach for estimating the deformation modulus of rock mass using sensitivity analysis by neural network. Int. J. Rock Mech. Min. Sci. 2010, 203, 1091–1103. [Google Scholar] [CrossRef]
- Alemdag, S.; Gurocak, Z.; Cevik, A.; Cabalar, A.; Gokceoglu, C. Modeling deformation modulus of a stratified sedimentary rock mass using neural network, fuzzy inference and genetic programming. Eng. Geol. 2016, 203, 70–82. [Google Scholar] [CrossRef]
- Dzimunya, N.; Fujii, Y.; Kawamura, Y. Integrating the effect of abutments in estimating the average vertical stress of elastic hard rock pillars by combining numerical modelling and artificial neural networks. Undergr. Space 2023, 13, 121–135. [Google Scholar] [CrossRef]
- Kingma, D.P.; Ba, J. A method for stochastic optimization. arXiv 2015, arXiv:1412.6980. [Google Scholar]
- Fletcher, R. Practical Methods of Optimization; Wiley and Sons: Hoboken, NJ, USA, 1987. [Google Scholar]
- Hoek, E.; Marinos, P.; Marinos, V. The geological strength index: Applicationsand limitations. Bull. Eng. Geol. Environ. 2005, 64, 55–65. [Google Scholar] [CrossRef]
- Hoek, E.; Marinos, P. Estimating thegeotechnical properties of heteroge-neous rock masses such as flysch. Bull. Eng. Geol. Environ. 2001, 60, 82–92. [Google Scholar]
- Hoek, E.; Carranza-Torres, C.; Corkum, B. Hoek-Brown failure criterion—2002 Edition. Proc. NARMS-TAC Conf. Tor. 2002, 1, 267–273. [Google Scholar]
- Rahn, P.H. Engineering Geology an Environmental Approach; Prentice Hall: Upper Saddle River, NJ, USA, 1996. [Google Scholar]
Disclaimer/Publisher’s Note: The statements, opinions and data contained in all publications are solely those of the individual author(s) and contributor(s) and not of MDPI and/or the editor(s). MDPI and/or the editor(s) disclaim responsibility for any injury to people or property resulting from any ideas, methods, instructions or products referred to in the content. |
© 2023 by the authors. Licensee MDPI, Basel, Switzerland. This article is an open access article distributed under the terms and conditions of the Creative Commons Attribution (CC BY) license (https://creativecommons.org/licenses/by/4.0/).