Abstract
Over the last fifteen years, the Google Earth Engine (GEE) has become a pivotal tool for large-scale geospatial analysis, with growing applications in urban environmental monitoring. This review examines the peer-reviewed literature, published between 2015 and 2024, that utilizes GEE to evaluate urban environments through remote sensing-derived indices. The literature search strategy was guided by predefined search terms, which were applied to online databases including Scopus and Google Scholar. The inclusion criteria for this review comprised English-language publications, limited to articles only from journals, while book series, books, and conference articles were excluded. The eligibility criteria applied aimed to identify peer-reviewed studies that applied GEE to urban contexts using vegetation, thermal, greenness, or density indices. Studies without a clear urban focus or not employing GEE as a primary tool were excluded. The selection process followed a structured methodological flow, where a total of 291 studies were identified that fulfilled the applied criteria. This review indicates that key methodological trends encompass both conventional techniques, such as Random Forests (RFs), Support Vector Machines (SVMs), and classification/regression trees, as well as emerging machine learning algorithms, with Landsat, Sentinel, and MODIS as the most commonly used satellite datasets. The articles included in this review show a geographic focus, with over 44% of publications from China, 11% from the United States, and 9% from India, while the rest of the countries identified in this review contribute fewer than 5% each, suggesting that there is a significant opportunity for research in underrepresented regions. The main result of this review is that GEE proves to be an effective, scalable, and reproducible platform for urban environmental analysis, with most studies focusing on vegetation and thermal indices using Landsat, Sentinel, and MODIS data. As GEE has become one of the most widely used platforms for urban environmental monitoring, future research should focus on addressing challenges such as the standardization of indices, the consistency of methodological approaches, and the expansion of global coverage through advanced cloud-based geospatial frameworks.
Keywords:
Google Earth Engine; urban monitoring; urban indices; land surface temperature; NDVI; NDBI 1. Introduction
Urban areas are dynamic systems that undergo constant transformation; their form is influenced constantly by the interaction of social, economic, and environmental forces. The physical form of the city, expressed through factors such as building density, the presence of green spaces, patterns of land use, and their spatial arrangement, plays a decisive role in shaping both the sustainability and resilience of urban environments [1,2,3]. Considering the implications that urban morphology has on various sectors, from its impact on environmental factors such thermal comfort or air quality to its influence on citizens’ overall well-being, it is essential to systematically monitor and analyze the form and growth of contemporary cities. The United Nations, by adopting Agenda 2030 and its Sustainable Development Goals (SDGs) [4], has underscored the pivotal role of urban environments in advancing sustainability and enhancing livability.
Monitoring the characteristics of an urban environment is essential for understanding how cities adapt to ongoing challenges under the combined pressures of rapid demographic expansion, climate change, and constrained natural resources. In this context, geospatial technologies and remote sensing provide powerful tools for capturing urban dynamics [5,6,7], which can be assessed through urban monitoring and urban index calculations. Urban monitoring refers to the general assessment of urban environments, including land use and land cover dynamics, while urban indices are specific quantitative measures, often derived from spectral data, used to characterize particular aspects of urban conditions, such as vegetation, built-up areas, or surface temperature. Indeed, the use of satellite-based remote sensing for urban monitoring has been the focus of numerous scientific studies [8,9,10,11,12]. Its practical importance lies in the ability to capture the complexity and variability of urban environments across both space and time. Satellite imagery provides consistent and repeated coverage of large areas, making it possible to monitor cities alongside surrounding regions. With data collected at regular intervals, tracking changes in urban form, land use, vegetation, and environmental conditions over time is possible by creating and analyzing time series data. Building on this advantage, researchers and planners have been able to observe seasonal variations, long-term changes, and spatial patterns in urban areas. This capability has helped establish remote sensing as one of the most effective tools for comprehensive urban analysis.
The recent advances in cloud-based platforms of satellite imagery, together with the growing availability of freely accessible datasets, have created unprecedented opportunities for researchers worldwide. The Google Earth Engine (GEE) platform in particular has proven to be a powerful tool, offering an extensive and continuously updated archive of remotely sensed data [13]. Beyond simple data access, GEE integrates advanced computational capabilities that allow researchers to efficiently process, analyze, and visualize large volumes of Earth observation data at multiple spatial and temporal scales. A notable example is the work by Hansen et al. [14], which utilized GEE for the production of global forest maps. When combined with established remote sensing methodologies, these capabilities can enable the assessment of urban morphology, environmental quality, and urban resilience. Such analyses help interpretating patterns of urban expansion influenced by population growth, climate change, and resource scarcity, thereby supporting decision-making for sustainable urban planning and policy development [15,16,17].
This study aims to review the existing body of literature related to the use of Google Earth Engine (GEE)-based methodologies employed for the assessment of urban environmental indices. Focusing solely on GEE can provide a detailed synthesis of methodological trends and applications within this rapidly growing research domain. The review aims to explore how researchers have utilized GEE for monitoring and evaluating urban dynamics, including land use and land cover change, vegetation, surface temperature, water availability, and other indicators relevant to environmental quality and urban resilience. To this end, the underlying research question can be framed as follows: what approaches and analytical workflows have been developed using GEE to compute and interpret urban environmental indices? How do these contribute to the understanding of sustainable urban development? In addition, this review examines how the research community has responded to the growing availability of freely accessible satellite data and cloud-based geospatial platforms, and the extent to which these resources have transformed practices in urban monitoring. By synthesizing current applications, highlighting methodological strengths and limitations, and identifying research gaps, the study provides insights to guide future uses of GEE in supporting sustainable urban planning and policy.
2. Materials and Methods
In this section, the methods and materials employed to synthesize the existing literature are presented in order to establish the study’s initial scope: the use of Google Earth Engine (GEE)-based approaches for assessing urban environmental indices. To achieve this, data were retrieved from 2015 to 2024, primarily from Scopus, complemented by additional searches in Google Scholar, since some journals are not indexed in Scopus but could contain relevant publications. The search strategy was designed with keywords related to urban monitoring, urban indices, and Google Earth Engine (GEE). Specific inclusion and exclusion criteria were applied to ensure the relevance of the collected literature. First of all, the review was limited to articles published in English and classified as peer-reviewed journal papers, while conference proceedings, book series, and monographs were excluded. To minimize the risk of omitting relevant studies that are not indexed in Scopus, Google Scholar was also consulted to identify additional publications and confirm their DOI information when available. The last literature search was conducted on 15 September 2025. The selection process followed a structured methodological flow, as illustrated in Figure 1, and was guided by the established inclusion and exclusion criteria.
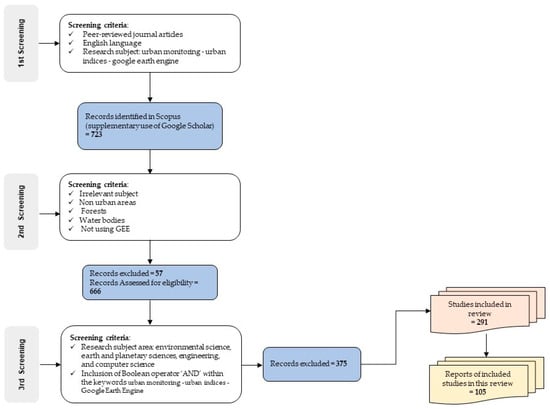
Figure 1.
The structured framework integrating the applied screening criteria.
2.1. Information Sources and Search Strategy
Scopus was selected as the primary online database due to its comprehensive indexing of peer-reviewed research. More specifically, selecting Scopus as our primary source for indexed literature retrieval was based on three main factors: First, Scopus indexes a very high proportion of the journals included in other databases such as Web of Science (WoS) [18], but at the same time it offers additional coverage of relevant scientific sources across interdisciplinary fields. Therefore, the likelihood of missing high-value peer-reviewed research was minimal. Additionally, Scopus includes extensive coverage in Earth observation-, remote sensing-, and Geographic Information System (GIS)-related disciplines, the main focus areas of our review, making it well suited to capture the publication landscape of studies using GEE. Finally, it provides efficient search and refinement tools and advanced query capabilities (e.g., year limits, subject area filters, document type restrictions) that enabled the systematic retrieval and screening of publications for the 2015–2024 period.
The initial search was conducted using the keywords “Google Earth Engine,” “GEE,” “urban monitoring,” and “urban indices” for the period 2015–2024. At this stage, the keywords were combined using the Boolean operator “OR” to ensure a broad capture of the relevant literature. Additionally, predefined filters within Scopus were applied to exclude conference proceedings, books, and book series, focusing exclusively on journal articles. This search strategy yielded a total of 723 documents (Table 1). The data show a clear and substantial increase in research activity related to urban monitoring over the period 2015–2024. In the early years, 2015–2017, the number of publications was very low, with only two, one, and three articles per year, respectively. A notable increase begins in 2018, with 13 articles, signaling the growing adoption of urban monitoring as a research focus. From 2019 onwards, the growth becomes more pronounced, with 25 articles in 2019 and a steep rise to 217 articles by 2024.

Table 1.
Number of articles retrieved from Scopus within the subject areas of urban monitoring, Google Earth Engine, and urban indices.
To refine the dataset and ensure alignment with the research objectives, additional filtering was applied by combining the keywords “Urban monitoring” and “Urban indices” with the Boolean operator “OR”, and subsequently linking them with “Google Earth Engine” using the Boolean operator “AND”. Combinations of these keywords were also used with specific indices such as “NDVI”, “NDBI”, “LST”, “SUHI”, “index”, and “indices”. The search covered January 2015–December 2024. Furthermore, Scopus’ predefined filtering tools were employed to restrict the subject areas to Environmental Science, Earth and Planetary Sciences, Engineering, and Computer Science, thereby excluding unrelated disciplines and enhancing the thematic relevance of the results. This search strategy was designed to narrow the scope of retrieved publications to studies explicitly addressing urban environments and, at the same time, to ensure that the methodological framework involved the use of GEE—this way, the search focused primarily on research employing GEE for the computation, analysis, and interpretation of urban indices, thereby aligning the literature selection with the principal aim of this review (see Table 2 and Figure 2).
Table 2.
Annual distribution of articles retrieved from Scopus (2015–2024) and the successive screening stages.
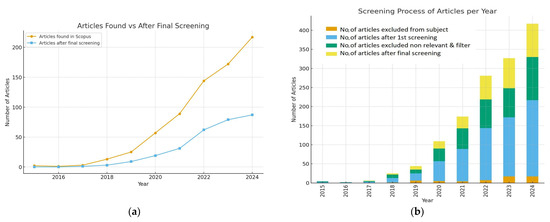
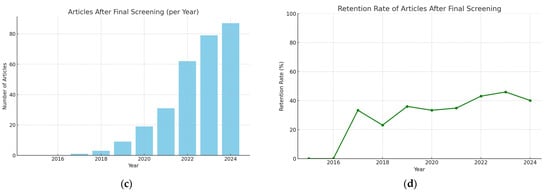
Figure 2.
(a) Chart depicting the comparison of the number of articles retrieved from Scopus and those retained after the final screening for the period 2015–2024. (b) Annual distribution of articles across the different screening stages. (c) Number of articles included after the final screening for each year between 2015 and 2024. (d) Retention rate of articles after final screening; (%) of articles retained relative to the number of articles initially found in Scopus, for the years 2015–2024.
2.2. Data Collection and Extraction
For the selection process, two reviewers independently screened titles and abstracts; disagreements were resolved by discussion until consensus was reached. Full texts were evaluated for eligibility using the same criteria. No automation tools or statistical software were used in the selection process; all stages, including database querying, screening, and data extraction, were performed manually to ensure accuracy and consistency. The resulting articles were extracted into a structured spreadsheet that included key information of each article, such as bibliographic details (authors, year, and journal), study location, remote sensing datasets used (e.g., Landsat, Sentinel, MODIS), indices computed (such as NDVI, NDBI, LST, and SUHI), temporal coverage, spatial resolution, and the main urban environmental themes addressed. The extraction process was carefully cross-checked by all reviewers to ensure accuracy and consistency across all entries.
The synthesis approach was primarily qualitative and descriptive, focusing on identifying and summarizing emerging patterns across the selected studies. Data were organized according to the type of environmental index analyzed, the satellite datasets employed, and the geographical distribution of the study areas. Quantitative summaries were provided using counts and percentages to highlight dominant research trends, data preferences, and thematic focuses. No formal meta-analysis was undertaken, as the included studies exhibited a considerable heterogeneity in research objectives, analytical frameworks, and environmental indicators, making statistical synthesis inappropriate. As this review focuses on mapping and analyzing the application of GEE in urban environmental studies rather than evaluating intervention outcomes, no standardized risk-of-bias assessment tool was applicable. However, the overall quality and reliability of the included studies were indirectly assessed, as only Scopus-indexed articles were screened. Additionally, the transparency and reproducibility of methodological descriptions was also assessed, together with the clarity of data processing and validation procedures.
3. Results
Figure 2 illustrates the results of the screening process through a series of charts and graphs. As the visualizations highlight, during the first five years of the study period (2015–2019), the application of GEE in the context of urban monitoring was absent from the published literature featured in Scopus. The emergence of GEE in relevant publications becomes noticeable only from 2018 onwards, marking a turning point where the platform began to be adopted as a standard tool in urban research.
This can also be noticed in the retention rate analysis (Figure 2d), which illustrates the proportion of articles that remained from the initial Scopus search to the final screening stage across the period of 2015–2024. In the early years of the review (2015–2016), the retention rate was extremely low, reaching 0%, which indicates that, although a small number of articles were retrieved, none of them met the relevance and quality criteria. From 2017 onwards, a gradual increase is observed, with the proportion of engaged articles increasing steadily as the research field became more established and publications more closely aligned with this review’s focus. The highest retention rates are recorded during 2022 and 2023, where nearly 45% of the initially identified articles were eventually included after applying the final screening filters. This screening stage required that articles explicitly contain the keywords “Urban Monitoring/Urban Indices” and “Google Earth Engine” and belong to the subject areas of Environmental Science, Earth and Planetary Sciences, Engineering, or Computer Science.
Table 3 shows the number of articles and their respective percentage published within the examined period in the context of urban monitoring by country, as derived from Scopus predefined filters. China leads significantly with 127 publications, accounting for the largest share. The United States (33) and India (26) follow, but with much lower counts. Australia (15), Italy (12), and Iran (12) occupy a mid-range, while the United Kingdom and Pakistan each have 10 publications. Germany and Spain have slightly fewer, with nine and eight publications, respectively. These results suggest that, within our dataset of 291 studies, the geographic distribution is highly uneven, with nearly 44% of publications originating from China, 11% from the United States, and 9% from India, while the rest of the countries identified in this review represent the 9.97%. This percentage refers to the cumulative percentage of all countries that contributed fewer than five papers each. This imbalance suggests that conducting regional comparisons could introduce bias and may not yield fully reliable conclusions. However, the synthesis reveals a rapidly expanding research landscape where GEE serves as a transformative platform for urban environmental analysis. This trend highlights a shift toward cloud-based geospatial analytics that foster reproducibility and collaborative research practices.
Table 3.
Number of articles published by country within the examined period.
3.1. Study Period 2015–2019
The articles retrieved in the early phase of this review (2015–2019) predominantly addressed urban monitoring in a broader sense, often relying on traditional remote sensing tools, geospatial analysis techniques, or case-specific methodologies. While these contributions were valuable in laying the foundations for urban environmental assessment, they did not all incorporate GEE as a cloud-based platform for large-scale geospatial processing. Goldblatt et al. [19], for example, created a dataset for India consisting of 21,030 polygons from across the country that were manually classified as “built-up” or “not built-up,” which were further used for supervised image classification in GEE and the detection of urban areas. Huang et al., in 2017 [20], assessed the change in health benefits generated by urban green spaces in 28 megacities worldwide between 2005 and 2015, applying the Random Forest classifier in GEE. Another relevant study is that of Agapiou [21], which utilized a multi-temporal DMSP-OLS nighttime light time series at the European scale to illustrate the effects of urban sprawl around UNESCO World Heritage sites and monuments. Huang et al., in 2017 [22], used the Normalized Difference Vegetation Index (NDVI), calculated in GEE, to detect major land cover dynamics in Beijing. In 2018, Huang et al. [23] generated land cover maps for 262 Chinese cities using 6673 Landsat ETM+/OLI scenes processed on the Google Earth Engine platform. Their study aimed to examine how urban form influences the landscape structure of urban green spaces through regression tree analysis.
Xiaoping Liu et al. [24] proposed the Normalized Urban Areas Composite Index (NUACI) and leveraged Google Earth Engine to enable global urban land classification using a large collection of Landsat images. Chen, in 2019 [25], used Google Earth data and applied Keyhole Markup Language (KML) for the visualization of air monitoring data in Beijing. Zhong et al. [1] measured alterations in the Impervious Surface Area (ISA) and analyzed how urbanization influenced vegetation greenness, using the Enhanced Vegetation Index (EVI), as well as gross primary production (GPP) in Shanghai between 2000 and 2016. Khanal et al. [26] proposed a new metric, the Normalized Difference and Distance Built-up Index (NDD-BI), to identify built-up areas by combining Landsat-derived vegetation indices with the proximity to the nearest roads and buildings obtained from OpenStreetMap (OSM). Sun et al., in 2019 [27], calculated the Potential Urban Land index (PUL) from Synthetic Aperture Radar (SAR) data, the Normalized Difference Vegetation Index (NDVI), and the mean modified Normalized Difference Water Index (MNDWI) from Sentinel-2 imagery within the GEE. Their approach highlighted the effectiveness of combining optical and SAR data within the GEE platform for extracting urban land over large areas. Hao et al. [28] examined interannual variations in Land Surface Temperature (LST) and seasonally integrated the Normalized Difference Vegetation Index (SINDVI) into the Three Gorges Reservoir catchment from 2000 to 2015, using Moderate Resolution Imaging Spectroradiometer (MODIS) products (built for NASA by Santa Barbara Remote Sensing (SBRS)) sourced and processed via the Google Earth Engine.
3.2. Study Period 2020–2024
As mentioned earlier, articles from 2018 onwards have been increasingly using the Google Earth Engine platform as a tool for estimating urban morphology and various urban indices. Many research studies have increasingly employed GEE for calculating indices such as the NDVI, EVI, Normalized Difference Buit-up Index (NDBI), Urban Heat Island index (UHI), and Urban Index (UI), among others [29,30,31,32,33,34,35,36,37,38,39,40,41]. Shi et al. [42], for instance, extracted the index-based built-up index (IBI) within the Google Earth Engine platform using Landsat-8 optical images. Machine learning techniques, including linear regression and Principal Component Analysis (PCA), were applied to explore the relationship between land subsidence and contributing factors such as changes in groundwater levels and the thickness of quaternary deposits. Yang et al. [43] examined the percentage of landscape (PLAND) and the aggregation index (AI) to quantify the abundance and fragmentation of urban green spaces over time. Urban greenery was mapped annually using Landsat imagery processed in GEE, and factors such as the road network density, NDBI, terrain elevation and slope, and precipitation were analyzed, showing significant correlations with the landscape metrics. Zhao et al. [44] focused on differences between daytime and nighttime temperatures in city centers and newly expanded urban areas across China’s 34 municipalities, defining this as the Surface Urban Heat Difference (SUHD). Their further analysis using GEE algorithms revealed that the NDVI difference between urban center and urban expansion regions and moisture were significant indicators affecting the SUHD. Another interesting study by Chakraborty et al. in 2020 [38] quantified clear-sky Surface Urban Heat Island (SUHI) intensities across all urbanized areas in the United States using a modified Simplified Urban-Extent (SUE) method, integrating fused remotely sensed datasets from GEE with multiple US Census-defined urban boundaries. An interesting finding of this analysis was that most urbanized areas exhibited a lower SUHI intensity in census tracts with a higher median income and a greater proportion of white residents. The study further indicated that low-income and non-white urban populations are more likely to experience the negative impacts of summer SUHI while receiving fewer of its potential benefits (e.g., milder winter temperatures). Ranagalage et al. [45] employed annual median temperatures derived from Landsat data spanning 1996 to 2019, processed through GEE. A range of geospatial methods was applied, including spectral index-based land use/land cover mapping (for 1996, 2009, and 2019), urban–rural gradient zoning, UHI profiling, statistical analysis, and grid-based assessment. Venter et al. [46] found that green infrastructure in Oslo, such as tree canopy cover, reduces extreme Land Surface Temperatures, using Satellite-derived spatially explicit measures in GEE, and thus reduces health risk from heat exposure, as city-wide skin-related morbidity was correlated with air temperatures. Mugiraneza et al. [47] introduced a framework for analyzing urban land cover change trajectories using Landsat time series and the LandTrendr algorithm. Annual land cover maps were validated with reference datasets and assessed using the GEE-based area estimation and accuracy assessment tool. The approach demonstrated cost-effectiveness and a practical value for the ongoing monitoring of complex urban land cover dynamics, especially in regions where access to Earth observation data is limited.
The analysis of large-scale data has emerged as one of the most prominent research directions. For instance, Lui et al. [48] presented a semiautomatic framework for long annual urban land mapping, using OpenStreetMap(OSM) data combined with Landsat images in GEE. Annual spectral indices and texture feature maps were computed to efficiently analyze the patterns, traces, and hotspots of urban expansion within the study area. Lin et al. [49] also focused on large-scale data, combining Synthetic Aperture Radar (SAR) and optical imagery to map impervious surfaces across China. Yang et al. [50] proposed a new automatic rule-based superpixel (RBSP) approach for detecting water bodies in various scenes, e.g., urban, agricultural, and mountainous areas. Spectral indices and superpixel techniques were used in GEE to delineate the surface water extent, proving their efficiency in large-scale, dynamic, and automatic monitoring.
In 2021, many researchers used GEE and urban monitoring to assess the impact of COVID-19; Ghasempour et al. [51] used GEE to perform a spatiotemporal analysis of air pollutants before and during the first wave the COVID-19 outbreak over Turkey. Similar efforts can be found in studies [52,53,54], which examined changes in air pollution in relation to COVID-19 restrictions. The topic continued to receive attention in 2022, with new research seen, for example, in the works of [8,55,56], exploring the implications of COVID-19 on air pollution dynamics, while further extending the analysis of [56] to urban ventilation capacity by considering the spatial form and wind direction, thereby providing insights for urban planning measures that could prioritize specific spatial configurations to help mitigate COVID-19 transmission. At the same time, many studies have focused on the environmental implications of urbanism, as seen in [57], where the ecological quality (EQ) in the study area was evaluated using a five-level classification (poor, inferior, medium, good, and excellent) within GEE, and the changes in EQ on a pixel basis were identified. Onačillová et al. [58] combined Landsat-8 and Sentinel-2 data in GEE to derive higher-resolution Land Surface Temperature maps in Košice city, Slovakia. Espinoza-Molina et al. [59] identified the spatial and temporal variations in Urban Heat Islands (UHIs) during the period 1985–2020 in Tacna city in Peru, and examined their relationship with influencing factors, such as vegetation, urban extent, and population, through indices derived from satellite imagery in GEE. Sangiorgio et al. [60] proposed a simplified multiparametric approach to assess the Urban Heat Island (UHI) effect, based on three key parameters, albedo, vegetation, and anthropogenic heat, derived from refined remote sensing data within the GEE environment. Ulla et al. [61] investigated the multi-scale spatial analysis of the spatiotemporal impact of urbanization on UHI and the Urban Thermal Field Variance Index in Tianjin City, China, using remote sensing and GIS data in GEE. In 2023, Dong aet al. [62] utilized GEE, satellite remote sensing data, meteorological records, and the Vegetation Photosynthesis Model (VPM) to examine the spatiotemporal patterns of vegetation growth and the sensitivity of greenness to vegetation water content in three eastern Chinese megacities, Beijing, Shanghai, and Guangzhou, between 2001 and 2020. Pokhariya et al. [63] evaluated different machine learning algorithms for Land Use Land Cover (LULC) classification using Sentinel-2 MSI images in GEE. Ji et al. [64] analyzed the spatial pattern of regional green space morphology outside built-up areas in Shanghai, based on GEE algorithms and Biophysical Component Modeling, revealing a fluctuating growth pattern of “decreasing and then increasing” in greenness. Su et al. [65] investigated the process of urban expansion in the Central Plains Urban Agglomeration of China by introducing a novel adjusted index specifically designed to capture the spatiotemporal dynamics of urban growth, using GEE. Siddique et al. [66] performed a risk assessment of urbanization on the thermal comfort level in Beijing City, China, by extracting LST and LULC data from satellite imagery, identifying UHI areas, and determining the correlations between LST, LULC, and NDVI in GEE. Langenkamp and Rienow [67], using a data fusion strategy within GEE, mapped impervious surfaces in Wuppertal, integrating 0.9 m color–infrared true orthophotos, digital elevation models, and vector information for the Rhine–Ruhr Metropolitan Region in Germany.
In 2024, the maximum number of articles utilizing GEE for urban monitoring was recorded, reflecting both the growing maturity of the platform and the increasing demand for large-scale, cloud-based geospatial analyses. This surge highlights a research shift toward applying GEE not only for traditional land use and land cover change detection, but also for more complex urban applications such as heat island assessment, air quality monitoring, vegetation dynamics, urban expansion mapping, and resilience planning in the context of climate change and sustainability goals. Some characteristic examples of work can be seen in Gxokwe and Dube [68], who used the GEE platform for analyzing Sentinel-2 data to map the geographical extent of informal settlements in the Cape Town Metropolitan Area. Falah et al. [69] performed a two-decade analysis of the Urbanization Index (UI), Local Climate Zones (LCZ), and LST in Seville using GEE algorithms. Paniagua-Villada et al. [70] analyzed changes in the built and urban green cover of Medellín and adjacent municipalities (Colombia) between 2016 and 2017 and 2022 and 2023, revealing that urban green cover is increasingly reduced and isolated. Xu et al. [71] investigated the diurnal and seasonal variations, spatial heterogeneity, temporal trends, and driving factors of surface UHI intensity in the Guangdong–Hong Kong–Macao Greater Bay Area, finding that anthropogenic heat emissions and urban size are the primary contributors to surface UHI. Surface UHI was analyzed in [9], comparing three cities in Greece with different geomorphological characteristics in GEE. Banerjee et al. [72] examined the LULC change in the industrial city of the Chotanagpur Plateau Region, India, by exploring various indices in GEE such as the NDVI, Normalized Difference Water Index (NDWI), NDBI, and Normalized Difference Bareness Index (NDBaI), in correlation with the LST and Urban Thermal Field Variance Index (UTFVI). Wang et al. [73] utilized long-term Landsat remote sensing image data from 2000 to 2020 on the GEE platform for studying the dynamic changes in vegetation coverage in the central Yunnan urban cluster in China. Fractional Vegetation Cover (FVC) was analyzed, and the results revealed that FVC changed significantly, showing an overall improvement trend.
4. Discussion
To synthesize recent research trends in the topic of this review, three key dimensions were identified: the application of machine learning (ML) techniques, the use of urban indexes, and the characteristics of observation data, including study periods and observation data. Together, these aspects can provide a comprehensive picture of how GEE has been leveraged to analyze urban dynamics, from land cover changes and urban expansion to environmental impacts such as heat islands and vegetation stress. By examining these dimensions, the discussion highlights both methodological advancements and existing gaps, offering insights into the evolving role of GEE in supporting urban planning, environmental management, and sustainable development.
4.1. Machine Learning Techniques in the GEE Platform for Urban Monitoring
Machine learning (ML) has become a cornerstone of GEE-based urban monitoring, since it offers a scalable and accurate approach to handling the vast volumes of data available on the platform. The majority of studies primarily employed conventional algorithms such as Random Forests (RFs) [74,75,76,77], Support Vector Machines (SVMs) [47,63,78], and classification and regression trees [35,43,79], which proved effective for land use/land cover classification and urban expansion mapping [5,22,48,80]. More recent work demonstrates a growing adoption of advanced methods, including ensemble approaches and deep learning architectures [42,81,82,83], which allow for more refined analyses, such as the detection of informal settlements, impervious surface mapping, and the integration of multi-source datasets. Despite these advances, the majority of applications remain concentrated on well-established algorithms like Random Forests, reflecting both their robustness and their seamless integration within the GEE environment [16,32,64,65,84]. This indicates that, while methodological innovation is progressing, the potential for more sophisticated ML frameworks within GEE is still underexplored, leaving opportunities for future research to exploit their capabilities for capturing complex urban processes and enhancing predictive modeling. Table 4 summarizes some of the best-performing models of applied ML techniques and their performance metrics.
Table 4.
Machine learning techniques for urban monitoring using GEE.
4.2. Key Metrics for Urban Monitoring Within GEE
Based on the reviewed articles of this report, an analysis was conducted on widely used urban indices that have been applied across multiple studies, ensuring their reliability and relevance for assessing urban environments. These indices, derived primarily from satellite-based remote sensing data, can provide valuable information on various aspects of urban landscapes, including vegetation cover, built-up areas, bare soil, and overall environmental quality. Only the most frequently applied urban indices were considered, while those reported in a single study were excluded, allowing for a focused analysis of widely adopted and reliable metrics for urban assessment.
The Normalized Difference Vegetation Index (NDVI) and the Normalized Difference Built-up Index (NDBI) (Equations (1) and (2)) are among the most widely used spectral indices in urban and environmental studies reviewed in this report. These indices provide complementary information that enables researchers to effectively distinguish between vegetated and built-up (impervious) surfaces in urban environments. The NDVI is designed to quantify vegetation density based on the difference in reflectance between the near-infrared (NIR) and red (RED) bands. Healthy vegetation strongly reflects NIR radiation, while absorbing most of the visible red light for photosynthesis. NDVI values range from −1 to +1, with higher values indicating denser or healthier vegetation. It is expressed as follows:
NDVI = NIR − RED/NIR + RED
On the other hand, the NDBI is used to identify built-up or impervious surfaces such as concrete, asphalt, and rooftops. It is based on the difference between the shortwave infrared (SWIR) and near-infrared (NIR) bands, exploiting the fact that urban materials tend to reflect more strongly in the SWIR region, while exhibiting a lower reflectance in the NIR region. NDBI values also range from −1 to +1, with higher values corresponding to urbanized or built-up areas. It is calculated as follows:
NDBI = (SWIR − NIR)/(SWIR + NIR)
The combined use of NDVI and NDBI provides a powerful framework for urban analysis, as it allows for clear discrimination between vegetated and impervious surfaces within the same urban scene. Their simplicity, interpretability, and robustness across different satellite sensors, including Landsat and Sentinel missions, make them highly useful for researchers conducting urban studies. The consistent revisit frequency and long-term archives of these satellites enable the monitoring of urban expansion and land cover change over several decades. Furthermore, their widespread adoption has been significantly enhanced by platforms such as GEE, which provide access to historical archives as well as to current satellite imagery, along with built-in functions to calculate the NDVI, NDBI, and other indices.
The Urban Index (UI) (Equation (3)) is another spectral indicator identified in this review. UI is used to characterize and quantify urbanization patterns, particularly the spatial extent and intensity of built-up areas. The index is based on the contrast between the shortwave infrared (SWIR) and near-infrared (NIR) bands, leveraging their distinct spectral responses to urban materials and vegetation. Built-up surfaces such as concrete, asphalt, and roofing materials typically exhibit a high reflectance in the SWIR region and low reflectance in the NIR region, whereas vegetation shows the opposite behavior. The UI is expressed as follows:
Urban Land Index (UI) = (SWIR − NIR)/(SWIR + NIR)
Higher UI values correspond to areas dominated by impervious or built-up surfaces, while lower or negative values generally indicate vegetated or natural areas. The UI provides a simple and effective way to map urbanized zones and assess land cover transitions over time.
Land Surface Temperature (LST) has emerged as another key metric for assessing urban environments. LST provides valuable insights into the thermal characteristics of cities and their relationship to land cover, vegetation, and the Urban Heat Island effect. While various sensors require different parameters and formulas for deriving LST from remote sensing data, the most widely adopted general equation for LST estimation is expressed as follows:
where LST is the LST in Celsius (°C), Tb is the brightness temperature (in Kelvin), λ is the wavelength of emitted radiance, ε is the surface the emissivity, and ρ = h × c/σ (1.438 × 10⁻² mK), where σ = Boltzmann constant (1.38 × 10⁻²³ J/K), h = Planck’s constant (6.626 × 10⁻³⁴ Js), and c = velocity of light (2.998 × 10⁸ m/s).
LST = Tb/[1 + {(λ × Tb/ρ) × ln ε] − 273.15
Remotely sensed data are processed using the LST equation (Equation (4)) to calculate surface temperature, incorporating radiance temperature, atmospheric temperature, and emissivity derived from satellite imagery or meteorological data.
Another frequently used index is the Surface Urban Heat Island (SUHI), which quantifies elevated temperatures in urban areas. The SUHI index provides a means to quantify dynamic urban properties, including temperature variation, spatial heterogeneity, and Urban Heat Island intensity. Its computation is given by the following equation:
where SUHI is the Surface Urban Heat Island intensity Turban is the average temperature in an urban area, Trural is the average temperature in a rural area.
SUHI = Turban − Trural
The above-mentioned equation measures the temperature contrast between urban and rural zones, with positive values showing warmer urban areas and negative values indicating cooler urban areas relative to their rural surroundings.
The Urban Environmental Quality Index (UEQI) is a composite indicator designed to assess the environmental conditions within urban areas by integrating multiple parameters that reflect both ecological and anthropogenic characteristics. Typically, the UEQI combines LST, the NDVI, and population density to capture spatial variations in environmental quality.
Finally, the Normalized Differential Built-up and Bare Soil Index (NDBSI) is an integrated index used to discriminate between built-up and bare soil surfaces within urban and peri-urban environments. It combines two spectral indicators, the index-based built-up index (IBI) and the Soil Index (SI), using a weighted linear formulation:
where IBI = (NIR + Red) − (Blue + SWIR)/(NIR + Red) + (Blue + SWIR), SI = (SWIR + Red)-(NIR + Green)/(SWIR + Red) + (NIR + Green), α and β are weight coefficients, which may vary depending on the specific study and data characteristics.
NDBSI = α × IBI + β × SI
Table 5 provides a summary of the above-mentioned urban indices, along with a selection of corresponding studies referenced in this review.
Table 5.
Some of the most popular urban indices used for urban monitoring using GEE.
The analysis of urban indexes in GEE-based monitoring reveals that researchers frequently rely on a set of well-established indices, such as the NDVI and NDBI, to quantify urbanization and its environmental impacts. Some studies also incorporate Local Climate Zone (LCZ) classifications or combined indices to link urban forms with microclimatic effects, such as surface temperature variations [106,107]. The key parameters used in these cases are building height, building surface fraction, and pervious surface fraction, which are derived from remote sensing data and used to train models that automatically classify LCZs. While these indexes have proven effective in standardizing comparisons across cities and temporal scales, the results of this review highlight a relative underutilization of newer or composite indices that could integrate social, environmental, and infrastructural dimensions. This suggests that, although current practices provide robust insights into urban patterns and dynamics, expanding the repertoire of indexes could improve the assessment of complex urban processes and support more comprehensive urban planning and resilience strategies.
Figure 3 offers a complementary perspective to this review analysis, revealing distinct trends in index usage over time. It presents an annual stacked bar chart summarizing the number of studies applying the selected satellite-derived indices in GEE from 2015 to 2024. The distribution of publications using NDVI consistently emerges as the most widely adopted metric across all years, followed by the indices of LST and NDBI, which show notable growth, particularly after 2020. The interest in SUHI-focused studies has also increased in recent years, whereas UI and UEQI applications remain comparatively limited but have shown a steady upward trajectory since 2020. Overall, the chart clearly highlights the rapid rise in GEE-based urban monitoring research, especially after 2021, and emphasizes the dominance of vegetation and land surface temperature metrics within the field.
Figure 3.
Annual distribution of publications using major satellite-derived indices (NDVI, NDBI, LST, SUHI, NDBSI, UI, UEQI) within Google Earth Engine for urban monitoring applications from 2015 to 2024.
To better understand how researchers employ GEE across different spatial contexts, the articles analyzed in this review (a subset of 105 from the 291 initially identified) were further categorized, with review papers excluded. Review articles were removed because they do not focus on a specific study area or region but instead present general or conceptual analyses. The remaining 98 articles were then categorized according to their analytical scale: (i) single-city investigations, (ii) regional analyses, and (iii) multi-city comparisons. As shown in Figure 4, the majority of studies (51.02%) focused on the city level, highlighting GEE’s strong adoption in detailed urban monitoring. Regional-scale studies accounted for 27.55%, reflecting growing interest in examining broader spatial patterns and dynamics. Meanwhile, approximately one fifth of the studies (21.43%) utilized a comparative approach, which involves analyzing two or more cities side by side. This methodology is favored by researchers that aim to generalize patterns in urban phenomena that cannot be fully understood through a single-city case study alone. The results reinforce the concept that GEE is widely applied for individual city mapping; however, its use in larger-scale and comparative analyses is steadily expanding.
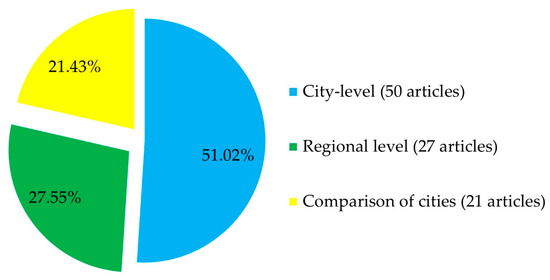
Figure 4.
Distribution of the reviewed articles by spatial scale: city-level, regional, and multi-city comparison analyses.
4.3. Observation Data, Study Period, and Computational Domains
The review of the observation data and study periods highlights the versatility of GEE in supporting urban monitoring across multiple spatial and temporal scales. Table 6 presents the main types of observational data employed in GEE across the reviewed studies, while Figure 5 summarizes the use of satellite datasets and the corresponding study periods across the reviewed articles. It should be noted that the percentages shown in Table 6 and Figure 5 represent the proportion of studies using each satellite source rather than mutually exclusive categories, as several studies employed multiple datasets in combination.
Table 6.
Observation data and study period categories identified in the majority of reviewed GEE-based urban monitoring studies.
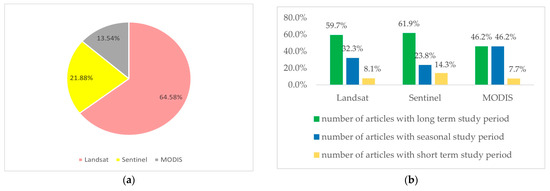
Figure 5.
(a) Percentage distribution of studies using different satellite imagery sources (Landsat, Sentinel, and MODIS). (b) Distribution of study periods (long-term, seasonal, and short-term) for each satellite dataset used in the analyzed articles. The percentages in (a,b) represent the proportion of studies using each satellite source rather than mutually exclusive categories, as several studies employed multiple datasets in combination.
The results presented in Table 6 and Figure 5a indicate that Landsat data are the most commonly used, featuring in 64.58% of the studies. This prominence can be attributed to Landsat’s extensive temporal record (dating back to the 1970s) [108], in combination with its spatial resolution of 30 m and the open access policy. These characteristics make Landsat imagery particularly well suited for analyzing urban growth patterns, land use and land cover changes, and Surface Urban Heat Island dynamics, which are the main research focuses in the reviewed articles. Sentinel data, used in 21.88% of the reviewed articles, represent the second most frequent data source and illustrate a shifting trend toward higher-resolution and multi-sensor integration. Sentinel-2 imagery, developed by the European Union’s Copernicus programme [109], with spatial resolution ranging between 10 and 20 m, is widely adopted for urban mapping; urban greenness, impervious surface extraction, and urban morphology mapping are some of the most common research topics. On the other hand, Sentinel-1 with Synthetic Aperture Radar (SAR) data is increasingly used to complement optical analyses, especially in cloudy or humid regions. The growing use of Sentinel datasets reflects their free availability, high revisit frequency, and compatibility with Landsat data for fusion-based approaches. Lastly, MODIS data, produced by a satellite sensor operated by NASA to observe the Earth’s surface and temperature, appear in 13.54% of studies. This could be explained by their low spatial analysis (250–1000 m), which significantly limits the urban detail that is necessary for urban studies; however, MODIS can provide valuable long-term, high-frequency observations that support analyses of urban form such as climate patterns, thermal anomalies, and regional-scale vegetation. Additionally, many studies were found to combine satellite imagery with open source or in situ datasets, including national geospatial repositories, OpenStreetMap (OSM), cadastral data, meteorological measurements, and socio-economic indicators. This integration trend indicates a growing recognition of the need for multi-source, contextualized data to enhance the interpretation and validation of satellite-derived results. By leveraging such auxiliary datasets, researchers can improve the classification accuracy, as well as the actual depiction of urban functionality.
The analysis based on the duration of the studies carried out (Figure 5b) highlights the clear variations in how different satellite datasets are applied depending on the duration of the study period. Research relying on Landsat imagery is mainly oriented toward long-term investigations (59.7%), a trend that can be linked to the mission’s long historical record and consistent data availability. A smaller proportion of studies apply Landsat data to seasonal analyses (32.3%), focusing on intra-annual variations in vegetation or surface temperature, while short-term studies (8.1%) are less frequent. Studies using Sentinel imagery show a similar, though slightly stronger, emphasis on long-term analyses (61.9%), despite the mission’s more recent start in 2015. This may reflect the increasing use of multi-temporal Sentinel composites or the combination of Sentinel and Landsat datasets to observe multi-year urban patterns. Seasonal studies (23.8%) based on Sentinel typically analyze vegetation dynamics and urban surface changes, whereas short-term investigations (14.3%) take advantage of Sentinel’s higher temporal resolution to monitor rapid environmental or urban changes. In contrast, MODIS-based research shows a more even split between long-term (46.2%) and seasonal studies (46.2%), a result that aligns with its daily coverage and ability to capture large-scale temporal trends across regions or continents. Only 7.7% of MODIS studies focus on short-term changes, which can be explained by its coarse spatial resolution that limits detailed urban applications.
Overall, this review demonstrates that GEE is a robust and widely adopted platform for urban environmental monitoring. Landsat and Sentinel are most frequently used for their high spatial resolution and long-term continuity, while MODIS provides a dense temporal coverage for broader or seasonal analyses. The reviewed studies highlight both conventional and emerging machine learning approaches and show a geographic concentration of research in regions such as China, the United States, and India. These findings emphasize the complementary strengths of different satellite datasets, the methodological diversity enabled by GEE, and the platform’s versatility in supporting diverse urban research needs, while also pointing to opportunities for future studies in underrepresented regions.
5. Conclusions
A critical review was conducted in this study on a total of 105 selected manuscripts to examine the applications of GEE for urban monitoring over the last decade. The screening process followed the methodological flow, including peer-reviewed studies that applied GEE to urban contexts using vegetation, thermal, greenness, or density indices. Studies without a clear urban focus or not employing GEE as a primary tool were excluded. The analysis reveals a clear and accelerating trend in the adoption of GEE, with moderate usage in the early years (2015–2017) and a steady increase from 2018 onwards, leading to a substantial surge in publications by 2024. This pattern underscores GEE’s growing prominence as a reliable and accessible platform for large-scale, multi-temporal urban analyses. Its effectiveness in integrating diverse datasets enables advanced analyses of complex urban environments. Several key conclusions from this review can be summarized as follows:
- (a)
- Machine learning applications: Conventional algorithms such as Random Forests (RFs), Support Vector Machines (SVMs), and classification/regression trees dominated, particularly for land cover classification and urban expansion mapping. Advanced approaches, including ensemble and deep learning models, are increasingly adopted for refined analyses (e.g., informal settlement detection, multi-source data integration); however, their potential within GEE is still underexplored.
- (b)
- Urban indices and environmental metrics: Widely used indices included the NDVI, NDBI, UI, and SUHI. These indices effectively quantify urbanization, impervious surfaces, and environmental impacts. The analysis highlights that GEE’s cloud-based processing environment allows researchers to perform multi-temporal analyses, visualize trends, and quantify urban growth dynamics without the need for local data storage or complex pre-processing steps. The results of the reviewed studies reveal that GEE offers a comprehensive framework for understanding the spatial and spectral complexity of urban environments.
- (c)
- Satellite data usage: The Landsat missions were the predominant source for urban analysis (64.58%), followed by Sentinel (21.88%) and MODIS (13.54%). Some studies integrated two or more satellite datasets to leverage complementary spatial and temporal resolutions.
- (d)
- Temporal trends and data integration: Landsat and Sentinel data were primarily used for long-term urban monitoring, while MODIS was valued for its dense temporal coverage for seasonal or regional-scale analyses. Various studies combined satellite imagery with open source datasets (e.g., OpenStreetMap, meteorological data, cadastral information) to improve the classification accuracy and contextual understanding of urban processes. This finding also suggests that researchers tend to favor multi-year, trend-oriented analyses in GEE-based studies.
- (e)
- Geographical patterns: The geographic distribution of the articles included in this review show that over 44% of publications originate from China, 11% from the United States, and 9% from India, while all other countries contribute fewer than 5% each. This imbalance highlights a substantial opportunity for research in underrepresented regions, indicating considerable room to expand knowledge and applications for cities worldwide.
Limitations and Future Directions
This review has several limitations that should be acknowledged. First of all, the screening process resulted in an uneven regional representation, with a higher concentration of studies in Asia, where other regions remain underrepresented. This might indicate a misrepresentation of studies in this review. Additionally, the exclusion of non-English publications may have resulted in the omission of relevant studies, potentially introducing a publication bias. However, English is the primary language of international scientific communication, ensuring that the reviewed studies are widely accessible, reproducible, and comparable. This constraint is therefore necessary for a systematic review of global relevance. Variations in index definitions and methodological approaches, for example, the different formulations of Surface Urban Heat Island- or NDVI-based metrics, could further limit the direct comparability between the selected studies. This variability is an important consideration for interpreting the results and for standardizing future urban remote sensing research using GEE. Finally, it has to be mentioned that the review relied primarily on a single bibliographic database (Scopus). Although manual screening and cross-checking by two reviewers were conducted to minimize bias, the process remains subject to selection subjectivity. Furthermore, no formal quality appraisal tool was employed, as the review focused on spatial and methodological mapping rather than intervention outcomes.
Looking forward, future research should aim to broaden the scope of evidence by incorporating additional databases. Efforts should also focus on enhancing reproducibility and transparency through the open sharing of GEE scripts and data-processing workflows. Incorporating newer or composite socio-environmental indicators could provide a more holistic view of urban systems. Cross-city comparative analyses could provide deeper insights into temporal trends and the scalability of GEE-based urban environmental monitoring, while analyzing the spatial patterns of the spectral indices could offer valuable insights on the overall trends. Furthermore, the distinction between the JavaScript and Python Application Programming Interfaces (APIs) could also offer an important perspective in the evolution of GEE-based research. In particular, the growing adoption of the Python ecosystem, supported by libraries such as geemap, has significantly lowered the barrier for integrating GEE into advanced geospatial analysis, machine learning workflows, and reproducibility practices. This growing trend has broadened GEE’s adoption across multiple disciplines, and future work could further explore how API selection trends are evolving and influencing application development. Adding to that, as this review aimed to summarize the types of algorithms applied in GEE-based urban studies rather than to perform a quantitative comparison of their accuracy or computational efficiency, an evaluation of the algorithmic performances and their reproducibility and scalability is another useful future research direction.
This review contributes to a better understanding of the relationships between urban forms and environmental dynamics. At the same time, these results could offer practical guidance for future research directions, methodological improvements, and targeted studies in underrepresented geographies. By identifying trends, limitations, and opportunities, these findings can help advance urban monitoring practices and support sustainable and resilient urban planning.
Author Contributions
Conceptualization, A.S.; methodology, A.S. and E.S.; data curation, A.S.; writing—original draft preparation A.S. and E.S.; writing—review and editing, A.S. and E.S.; supervision, E.S. All authors have read and agreed to the published version of the manuscript.
Funding
This research received no external funding.
Data Availability Statement
No new data were created or analyzed in this study. Data sharing is not applicable to this article.
Conflicts of Interest
The authors declare no conflicts of interest.
References
- Zhong, Q.; Ma, J.; Zhao, B.; Wang, X.; Zong, J.; Xiao, X. Assessing Spatial-Temporal Dynamics of Urban Expansion, Vegetation Greenness and Photosynthesis in Megacity Shanghai, China during 2000–2016. Remote Sens. Environ. 2019, 233, 111374. [Google Scholar] [CrossRef]
- Duncan, J.M.A.; Boruff, B.; Saunders, A.; Sun, Q.; Hurley, J.; Amati, M. Turning down the Heat: An Enhanced Understanding of the Relationship between Urban Vegetation and Surface Temperature at the City Scale. Sci. Total Environ. 2019, 656, 118–128. [Google Scholar] [CrossRef]
- Alvi, U.; Suomi, J.; Käyhkö, J. A Cost-Effective Method for Producing Spatially Continuous High-Resolution Air Temperature Information in Urban Environments. Urban Clim. 2022, 42, 101123. [Google Scholar] [CrossRef]
- United Nations—Department of Economic and Social Affairs United Nations—Sustainable Development Goals. Available online: https://sdgs.un.org/goals (accessed on 10 April 2023).
- Azzari, G.; Lobell, D.B. Landsat-Based Classification in the Cloud: An Opportunity for a Paradigm Shift in Land Cover Monitoring. Remote Sens. Environ. 2017, 202, 64–74. [Google Scholar] [CrossRef]
- Cao, W.; Zhou, Y.; Li, R.; Li, X.; Zhang, H. Monitoring Long-Term Annual Urban Expansion (1986–2017) in the Largest Archipelago of China. Sci. Total Environ. 2021, 776, 146015. [Google Scholar] [CrossRef]
- Manson, S.M.; Kernik, M. Human–Environment Interactions and Scalable Remote Sensing. In Comprehensive Remote Sensing; Liang, S., Ed.; Elsevier: Oxford, UK, 2018; Chapter 9.02; pp. 4–16. ISBN 978-0-12-803221-3. [Google Scholar]
- Haque, M.N.; Sharif, M.S.; Rudra, R.R.; Mahi, M.M.; Uddin, M.J.; Ellah, R.G.A. Analyzing the Spatio-Temporal Directions of Air Pollutants for the Initial Wave of COVID-19 Epidemic over Bangladesh: Application of Satellite Imageries and Google Earth Engine. Remote Sens. Appl. Soc. Environ. 2022, 28, 100862. [Google Scholar] [CrossRef] [PubMed]
- Stamou, A.; Karachaliou, E.; Dosiou, A.; Tavantzis, I.; Stylianidis, E. Exploring Patterns of Surface Urban Heat Island Intensity: A Comparative Analysis of Three Greek Urban Areas. Discov. Cities 2024, 1, 18. [Google Scholar] [CrossRef]
- Goldblatt, R.; Deininger, K.; Hanson, G. Utilizing Publicly Available Satellite Data for Urban Research: Mapping Built-up Land Cover and Land Use in Ho Chi Minh City, Vietnam. Dev. Eng. 2018, 3, 83–99. [Google Scholar] [CrossRef]
- Pandey, B.; Seto, K.C. Urbanization and Agricultural Land Loss in India: Comparing Satellite Estimates with Census Data. J. Environ. Manag. 2015, 148, 53–66. [Google Scholar] [CrossRef]
- Li, X.; Yao, R.; Liu, M.; Costanzo, V.; Yu, W.; Wang, W.; Short, A.; Li, B. Developing Urban Residential Reference Buildings Using Clustering Analysis of Satellite Images. Energy Build. 2018, 169, 417–429. [Google Scholar] [CrossRef]
- Gorelick, N.; Hancher, M.; Dixon, M.; Ilyushchenko, S.; Thau, D.; Moore, R. Google Earth Engine: Planetary-Scale Geospatial Analysis for Everyone. Remote Sens. Environ. 2017, 202, 18–27. [Google Scholar] [CrossRef]
- Hansen, M.C.; Potapov, P.V.; Moore, R.; Hancher, M.; Turubanova, S.A.; Tyukavina, A.; Thau, D.; Stehman, S.V.; Goetz, S.J.; Loveland, T.R.; et al. High-Resolution Global Maps of 21st-Century Forest Cover Change. Science 2013, 342, 850–853. [Google Scholar] [CrossRef]
- Stamou, A.; Dosiou, A.; Bakousi, A.; Karachaliou, E.; Tavantzis, I.; Stylianidis, E. Assessing Spatial Correlations Between Land Cover Types and Land Surface Temperature Trends Using Vegetation Index Techniques in Google Earth Engine: A Case Study of Thessaloniki, Greece. Remote Sens. 2025, 17, 403. [Google Scholar] [CrossRef]
- Liang, J.; Xie, Y.; Sha, Z.; Zhou, A. Modeling Urban Growth Sustainability in the Cloud by Augmenting Google Earth Engine (GEE). Comput. Environ. Urban Syst. 2020, 84, 101542. [Google Scholar] [CrossRef]
- Hu, Y.; Dong, Y.; Batunacun. An Automatic Approach for Land-Change Detection and Land Updates Based on Integrated NDVI Timing Analysis and the CVAPS Method with GEE Support. ISPRS J. Photogramm. Remote Sens. 2018, 146, 347–359. [Google Scholar] [CrossRef]
- Pranckutė, R. Web of Science (WoS) and Scopus: The Titans of Bibliographic Information in Today’s Academic World. Publications 2021, 9, 12. [Google Scholar] [CrossRef]
- Goldblatt, R.; You, W.; Hanson, G.; Khandelwal, A.K. Detecting the Boundaries of Urban Areas in India: A Dataset for Pixel-Based Image Classification in Google Earth Engine. Remote Sens. 2016, 8, 634. [Google Scholar] [CrossRef]
- Huang, C.; Yang, J.; Lu, H.; Huang, H.; Yu, L. Green Spaces as an Indicator of Urban Health: Evaluating Its Changes in 28 Mega-Cities. Remote Sens. 2017, 9, 1266. [Google Scholar] [CrossRef]
- Agapiou, A. Remote Sensing Heritage in a Petabyte-Scale: Satellite Data and Heritage Earth Engine© Applications. Int. J. Digit. Earth 2017, 10, 85–102. [Google Scholar] [CrossRef]
- Huang, H.; Chen, Y.; Clinton, N.; Wang, J.; Wang, X.; Liu, C.; Gong, P.; Yang, J.; Bai, Y.; Zheng, Y.; et al. Mapping Major Land Cover Dynamics in Beijing Using All Landsat Images in Google Earth Engine. Remote Sens. Environ. 2017, 202, 166–176. [Google Scholar] [CrossRef]
- Huang, C.; Yang, J.; Jiang, P. Assessing Impacts of Urban Form on Landscape Structure of Urban Green Spaces in China Using Landsat Images Based on Google Earth Engine. Remote Sens. 2018, 10, 1569. [Google Scholar] [CrossRef]
- Liu, X.; Hu, G.; Chen, Y.; Li, X.; Xu, X.; Li, S.; Pei, F.; Wang, S. High-Resolution Multi-Temporal Mapping of Global Urban Land Using Landsat Images Based on the Google Earth Engine Platform. Remote Sens. Environ. 2018, 209, 227–239. [Google Scholar] [CrossRef]
- Chen, P. Visualization of Real-Time Monitoring Datagraphic of Urban Environmental Quality. EURASIP J. Image Video Process. 2019, 2019, 42. [Google Scholar] [CrossRef]
- Khanal, N.; Uddin, K.; Matin, M.A.; Tenneson, K. Automatic Detection of Spatiotemporal Urban Expansion Patterns by Fusing OSM and Landsat Data in Kathmandu. Remote Sens. 2019, 11, 2296. [Google Scholar] [CrossRef]
- Sun, Z.; Xu, R.; Du, W.; Wang, L.; Lu, D. High-Resolution Urban Land Mapping in China from Sentinel 1A/2 Imagery Based on Google Earth Engine. Remote Sens. 2019, 11, 752. [Google Scholar] [CrossRef]
- Hao, B.; Ma, M.; Li, S.; Li, Q.; Hao, D.; Huang, J.; Ge, Z.; Yang, H.; Han, X. Land Use Change and Climate Variation in the Three Gorges Reservoir Catchment from 2000 to 2015 Based on the Google Earth Engine. Sensors 2019, 19, 2118. [Google Scholar] [CrossRef]
- Liu, A.; Wu, Q.; Cheng, X. Using the Google Earth Engine to Estimate a 10 m Resolution Monthly Inventory of Soil Fugitive Dust Emissions in Beijing, China. Sci. Total Environ. 2020, 735, 139174. [Google Scholar] [CrossRef] [PubMed]
- Tamiminia, H.; Salehi, B.; Mahdianpari, M.; Quackenbush, L.; Adeli, S.; Brisco, B. Google Earth Engine for Geo-Big Data Applications: A Meta-Analysis and Systematic Review. ISPRS J. Photogramm. Remote Sens. 2020, 164, 152–170. [Google Scholar] [CrossRef]
- Xia, Z.; Guo, X.; Chen, R. Automatic Extraction of Aquaculture Ponds Based on Google Earth Engine. Ocean Coast. Manag. 2020, 198, 105348. [Google Scholar] [CrossRef]
- Singha, M.; Dong, J.; Sarmah, S.; You, N.; Zhou, Y.; Zhang, G.; Doughty, R.; Xiao, X. Identifying Floods and Flood-Affected Paddy Rice Fields in Bangladesh Based on Sentinel-1 Imagery and Google Earth Engine. ISPRS J. Photogramm. Remote Sens. 2020, 166, 278–293. [Google Scholar] [CrossRef]
- Ghorbanian, A.; Kakooei, M.; Amani, M.; Mahdavi, S.; Mohammadzadeh, A.; Hasanlou, M. Improved Land Cover Map of Iran Using Sentinel Imagery within Google Earth Engine and a Novel Automatic Workflow for Land Cover Classification Using Migrated Training Samples. ISPRS J. Photogramm. Remote Sens. 2020, 167, 276–288. [Google Scholar] [CrossRef]
- Wang, L.; Diao, C.; Xian, G.; Yin, D.; Lu, Y.; Zou, S.; Erickson, T.A. A Summary of the Special Issue on Remote Sensing of Land Change Science with Google Earth Engine. Remote Sens. Environ. 2020, 248, 112002. [Google Scholar] [CrossRef]
- Wang, Y.; Sha, Z.; Tan, X.; Lan, H.; Liu, X.; Rao, J. Modeling Urban Growth by Coupling Localized Spatio-Temporal Association Analysis and Binary Logistic Regression. Comput. Environ. Urban Syst. 2020, 81, 101482. [Google Scholar] [CrossRef]
- Lin, Y.; Wang, Z.; Jim, C.Y.; Li, J.; Deng, J.; Liu, J. Water as an Urban Heat Sink: Blue Infrastructure Alleviates Urban Heat Island Effect in Mega-City Agglomeration. J. Clean. Prod. 2020, 262, 121411. [Google Scholar] [CrossRef]
- Sarricolea, P.; Serrano-Notivoli, R.; Fuentealba, M.; Hernández-Mora, M.; de la Barrera, F.; Smith, P.; Meseguer-Ruiz, Ó. Recent Wildfires in Central Chile: Detecting Links Between Burned Areas and Population Exposure in the Wildland Urban Interface. Sci. Total Environ. 2020, 706, 135894. [Google Scholar] [CrossRef] [PubMed]
- Chakraborty, T.; Hsu, A.; Manya, D.; Sheriff, G. A Spatially Explicit Surface Urban Heat Island Database for the United States: Characterization, Uncertainties, and Possible Applications. ISPRS J. Photogramm. Remote Sens. 2020, 168, 74–88. [Google Scholar] [CrossRef]
- Wang, Z.; Liu, M.; Liu, X.; Meng, Y.; Zhu, L.; Rong, Y. Spatio-Temporal Evolution of Surface Urban Heat Islands in the Chang-Zhu-Tan Urban Agglomeration. Phys. Chem. Earth Parts ABC 2020, 117, 102865. [Google Scholar] [CrossRef]
- Wellmann, T.; Lausch, A.; Andersson, E.; Knapp, S.; Cortinovis, C.; Jache, J.; Scheuer, S.; Kremer, P.; Mascarenhas, A.; Kraemer, R.; et al. Remote Sensing in Urban Planning: Contributions towards Ecologically Sound Policies? Landsc. Urban Plan. 2020, 204, 103921. [Google Scholar] [CrossRef]
- Koroso, N.H.; Zevenbergen, J.A.; Lengoiboni, M. Urban Land Use Efficiency in Ethiopia: An Assessment of Urban Land Use Sustainability in Addis Ababa. Land Use Policy 2020, 99, 105081. [Google Scholar] [CrossRef]
- Shi, L.; Gong, H.; Chen, B.; Zhou, C. Land Subsidence Prediction Induced by Multiple Factors Using Machine Learning Method. Remote Sens. 2020, 12, 4044. [Google Scholar] [CrossRef]
- Yang, C.; Li, R.; Sha, Z. Exploring the Dynamics of Urban Greenness Space and Their Driving Factors Using Geographically Weighted Regression: A Case Study in Wuhan Metropolis, China. Land 2020, 9, 500. [Google Scholar] [CrossRef]
- Zhao, J.; Yu, L.; Xu, Y.; Li, X.; Zhou, Y.; Peng, D.; Liu, H.; Huang, X.; Zhou, Z.; Wang, D.; et al. Exploring Difference in Land Surface Temperature between the City Centres and Urban Expansion Areas of China’s Major Cities. Int. J. Remote Sens. 2020, 41, 8965–8985. [Google Scholar] [CrossRef]
- Ranagalage, M.; Ratnayake, S.S.; Dissanayake, D.; Kumar, L.; Wickremasinghe, H.; Vidanagama, J.; Cho, H.; Udagedara, S.; Jha, K.K.; Simwanda, M.; et al. Spatiotemporal Variation of Urban Heat Islands for Implementing Nature-Based Solutions: A Case Study of Kurunegala, Sri Lanka. ISPRS Int. J. Geo-Inf. 2020, 9, 461. [Google Scholar] [CrossRef]
- Venter, Z.S.; Krog, N.H.; Barton, D.N. Linking Green Infrastructure to Urban Heat and Human Health Risk Mitigation in Oslo, Norway. Sci. Total Environ. 2020, 709, 136193. [Google Scholar] [CrossRef]
- Mugiraneza, T.; Nascetti, A.; Ban, Y. Continuous Monitoring of Urban Land Cover Change Trajectories with Landsat Time Series and LandTrendr-Google Earth Engine Cloud Computing. Remote Sens. 2020, 12, 2883. [Google Scholar] [CrossRef]
- Liu, D.; Chen, N.; Zhang, X.; Wang, C.; Du, W. Annual Large-Scale Urban Land Mapping Based on Landsat Time Series in Google Earth Engine and OpenStreetMap Data: A Case Study in the Middle Yangtze River Basin. ISPRS J. Photogramm. Remote Sens. 2020, 159, 337–351. [Google Scholar] [CrossRef]
- Lin, Y.; Zhang, H.; Lin, H.; Gamba, P.E.; Liu, X. Incorporating Synthetic Aperture Radar and Optical Images to Investigate the Annual Dynamics of Anthropogenic Impervious Surface at Large Scale. Remote Sens. Environ. 2020, 242, 111757. [Google Scholar] [CrossRef]
- Yang, X.; Qin, Q.; Yésou, H.; Ledauphin, T.; Koehl, M.; Grussenmeyer, P.; Zhu, Z. Monthly Estimation of the Surface Water Extent in France at a 10-m Resolution Using Sentinel-2 Data. Remote Sens. Environ. 2020, 244, 111803. [Google Scholar] [CrossRef]
- Ghasempour, F.; Sekertekin, A.; Kutoglu, S.H. Google Earth Engine Based Spatio-Temporal Analysis of Air Pollutants before and during the First Wave COVID-19 Outbreak over Turkey via Remote Sensing. J. Clean. Prod. 2021, 319, 128599. [Google Scholar] [CrossRef] [PubMed]
- Sannigrahi, S.; Kumar, P.; Molter, A.; Zhang, Q.; Basu, B.; Basu, A.S.; Pilla, F. Examining the Status of Improved Air Quality in World Cities Due to COVID-19 Led Temporary Reduction in Anthropogenic Emissions. Environ. Res. 2021, 196, 110927. [Google Scholar] [CrossRef]
- Beloconi, A.; Probst-Hensch, N.M.; Vounatsou, P. Spatio-Temporal Modelling of Changes in Air Pollution Exposure Associated to the COVID-19 Lockdown Measures across Europe. Sci. Total Environ. 2021, 787, 147607. [Google Scholar] [CrossRef]
- Naqvi, H.R.; Mutreja, G.; Shakeel, A.; Siddiqui, M.A. Spatio-Temporal Analysis of Air Quality and Its Relationship with Major COVID-19 Hotspot Places in India. Remote Sens. Appl. Soc. Environ. 2021, 22, 100473. [Google Scholar] [CrossRef]
- Purwanto, P.; Astuti, I.S.; Rohman, F.; Utomo, K.S.B.; Aldianto, Y.E. Assessment of the Dynamics of Urban Surface Temperatures and Air Pollution Related to COVID-19 in a Densely Populated City Environment in East Java. Ecol. Inform. 2022, 71, 101809. [Google Scholar] [CrossRef]
- Lu, H.; Guan, R.; Xia, M.; Zhang, C.; Miao, C.; Ge, Y.; Wu, X. Very High-Resolution Remote Sensing-Based Mapping of Urban Residential Districts to Help Combat COVID-19. Cities 2022, 126, 103696. [Google Scholar] [CrossRef]
- Lin, L.; Hao, Z.; Post, C.J.; Mikhailova, E.A. Monitoring Ecological Changes on a Rapidly Urbanizing Island Using a Remote Sensing-Based Ecological Index Produced Time Series. Remote Sens. 2022, 14, 5773. [Google Scholar] [CrossRef]
- Onačillová, K.; Gallay, M.; Paluba, D.; Péliová, A.; Tokarčík, O.; Laubertová, D. Combining Landsat 8 and Sentinel-2 Data in Google Earth Engine to Derive Higher Resolution Land Surface Temperature Maps in Urban Environment. Remote Sens. 2022, 14, 4076. [Google Scholar] [CrossRef]
- Espinoza-Molina, J.; Acosta-Caipa, K.; Chambe-Vega, E.; Huayna, G.; Pino-Vargas, E.; Abad, J. Spatiotemporal Analysis of Urban Heat Islands in Relation to Urban Development, in the Vicinity of the Atacama Desert. Climate 2022, 10, 87. [Google Scholar] [CrossRef]
- Sangiorgio, V.; Capolupo, A.; Tarantino, E.; Fiorito, F.; Santamouris, M. Evaluation of Absolute Maximum Urban Heat Island Intensity Based on a Simplified Remote Sensing Approach. Environ. Eng. Sci. 2022, 39, 296–307. [Google Scholar] [CrossRef]
- Ullah, N.; Siddique, M.A.; Ding, M.; Grigoryan, S.; Zhang, T.; Hu, Y. Spatiotemporal Impact of Urbanization on Urban Heat Island and Urban Thermal Field Variance Index of Tianjin City, China. Buildings 2022, 12, 399. [Google Scholar] [CrossRef]
- Dong, G.; Chen, S.; Liu, K.; Wang, W.; Hou, H.; Gao, L.; Zhang, F.; Su, H. Spatiotemporal Variation in Sensitivity of Urban Vegetation Growth and Greenness to Vegetation Water Content: Evidence from Chinese Megacities. Sci. Total Environ. 2023, 905, 167090. [Google Scholar] [CrossRef]
- Pokhariya, H.S.; Singh, D.P.; Prakash, R. Evaluation of Different Machine Learning Algorithms for LULC Classification in Heterogeneous Landscape by Using Remote Sensing and GIS Techniques. Eng. Res. Express 2023, 5, 045052. [Google Scholar] [CrossRef]
- Ji, Y.; Zhang, L.; Gu, X.; Zhang, L. Study on the Spatial and Temporal Evolution of Regional Green Space Morphology Outside Built-Up Areas Based on the Google Earth Engine and Biophysical Component Modeling. Land 2023, 12, 2184. [Google Scholar] [CrossRef]
- Su, Y.; Lu, C.; Su, Y.; Wang, Z.; Huang, Y.; Yang, N. Spatio-Temporal Evolution of Urban Expansion Based on a Novel Adjusted Index and GEE: A Case Study of Central Plains Urban Agglomeration, China. Chin. Geogr. Sci. 2023, 33, 736–750. [Google Scholar] [CrossRef]
- Amir Siddique, M.; Boqing, F.; Dongyun, L. Modeling the Impact and Risk Assessment of Urbanization on Urban Heat Island and Thermal Comfort Level of Beijing City, China (2005–2020). Sustainability 2023, 15, 6043. [Google Scholar] [CrossRef]
- Langenkamp, J.-P.; Rienow, A. Exploring the Use of Orthophotos in Google Earth Engine for Very High-Resolution Mapping of Impervious Surfaces: A Data Fusion Approach in Wuppertal, Germany. Remote Sens. 2023, 15, 1818. [Google Scholar] [CrossRef]
- Gxokwe, S.; Dube, T. Using Cloud Computing Techniques to Map the Geographic Extent of Informal Settlements in the Greater Cape Town Metropolitan Area. Remote Sens. Appl. Soc. Environ. 2024, 36, 101275. [Google Scholar] [CrossRef]
- Falah, N.; Solis-Guzman, J.; Falah, N. Thermal Footprint of the Urbanization Process: Analyzing the Heat Effects of the Urbanization Index (UI) on the Local Climate Zone (LCZ) and Land Surface Temperature (LST) over Two Decades in Seville. Land 2024, 13, 1877. [Google Scholar] [CrossRef]
- Paniagua-Villada, C.; Garizábal-Carmona, J.A.; Martínez-Arias, V.M.; Mancera-Rodríguez, N.J. Built vs. Green Cover: An Unequal Struggle for Urban Space in Medellín (Colombia). Urban Ecosyst. 2024, 27, 1055–1065. [Google Scholar] [CrossRef]
- Xu, X.; Wu, Y.; Lin, G.; Gong, J.; Chen, K. Exploring Diurnal and Seasonal Variabilities in Surface Urban Heat Island Intensity in the Guangdong-Hong Kong-Macao Greater Bay Area. J. Geogr. Sci. 2024, 34, 1472–1492. [Google Scholar] [CrossRef]
- Banerjee, B.; Pal, A.; Tiwari, A.K.; Kanchan, R. Assessing the Land Use Dynamics and Thermal Environment Using Geospatial Techniques in the Industrial City of Chotanagpur Plateau Region, India. Environ. Monit. Assess. 2024, 196, 609. [Google Scholar] [CrossRef]
- Wang, R.; Ding, X.; Yi, B.; Wang, J. Spatiotemporal Characteristics of Vegetation Cover Change in the Central Yunnan Urban Agglomeration from 2000 to 2020 Based on Landsat Data and Its Driving Factors. Geocarto Int. 2024, 39, 2316643. [Google Scholar] [CrossRef]
- Chen, Q.; Zhong, C.; Jing, C.; Li, Y.; Cao, B.; Cheng, Q. Rapid Mapping and Annual Dynamic Evaluation of Quality of Urban Green Spaces on Google Earth Engine. ISPRS Int. J. Geo-Inf. 2021, 10, 670. [Google Scholar] [CrossRef]
- Belgiu, M.; Drăgu, L. Random Forest in Remote Sensing: A Review of Applications and Future Directions. ISPRS J. Photogramm. Remote Sens. 2016, 114, 24–31. [Google Scholar] [CrossRef]
- Qin, Y.; Cao, L.; Li, S.; Ye, F.; Boloorani, A.D.; Liang, Z.; Huang, J.; Liu, G. Multisource Geoscience Data-Driven Framework for Subsidence Risk Assessment in Urban Area. Int. J. Disaster Risk Reduct. 2024, 113, 104901. [Google Scholar] [CrossRef]
- Hu, Z.; Chu, Y.; Zhang, Y.; Zheng, X.; Wang, J.; Xu, W.; Wang, J.; Wu, G. Scale Matters: How Spatial Resolution Impacts Remote Sensing Based Urban Green Space Mapping? Int. J. Appl. Earth Obs. Geoinf. 2024, 134, 104178. [Google Scholar] [CrossRef]
- Mazhar, S.; Sun, G.; Bilal, A.; Li, Y.; Farhan, M.; Awan, H.H. Digital and Geographical Feature Detection by Machine Learning Techniques Using Google Earth Engine for CPEC Traffic Management. Wirel. Commun. Mob. Comput. 2022, 2022, 1192752. [Google Scholar] [CrossRef]
- Bille, R.A.; Jensen, K.E.; Buitenwerf, R. Global Patterns in Urban Green Space Are Strongly Linked to Human Development and Population Density. Urban For. Urban Green. 2023, 86, 127980. [Google Scholar] [CrossRef]
- Feng, L.; Hussain, S.; Pricope, N.G.; Arshad, S.; Tariq, A.; Feng, L.; Mubeen, M.; Aslam, R.W.; Fnais, M.S.; Li, W.; et al. Seasonal Dynamics in Land Surface Temperature in Response to Land Use Land Cover Changes Using Google Earth Engine. Sel. Top. Appl. Earth Obs. Remote Sens. 2024, 17, 17983–17997. [Google Scholar] [CrossRef]
- Thenkabail, P.; Teluguntla, P.; Xiong, J.; Oliphant, A.; Congalton, R.G.; Ozdogan, M.; Gumma, M.K.; Tilton, J.; Giri, C.; Milesi, C.; et al. Global Cropland-Extent Product at 30-m Resolution (GCEP30) Derived from Landsat Satellite Time-Series Data for the Year 2015 Using Multiple Machine-Learning Algorithms on Google Earth Engine Cloud; Professional Paper; U.S. Geological Survey: Reston, VA, USA, 2021; p. 63. [Google Scholar]
- Parekh, J.R.; Poortinga, A.; Bhandari, B.; Mayer, T.; Saah, D.; Chishtie, F. Automatic Detection of Impervious Surfaces from Remotely Sensed Data Using Deep Learning. Remote Sens. 2021, 13, 3166. [Google Scholar] [CrossRef]
- Assaf, M.N.; Selma, A.; Kacem, M. Spatiotemporal Investigation of Surface Urban Heat Island (SUHI) Using Landsat: Application on African Cities. In Advances in Science, Technology & Innovation; Springer Nature: Berlin, Germany, 2023. [Google Scholar]
- Belenok, V.; Hebryn-Baidy, L.; Bielousova, N.; Gladilin, V.; Kryachok, S.; Tereshchenko, A.; Alpert, S.; Bodnar, S. Machine Learning Based Combinatorial Analysis for Land Use and Land Cover Assessment in Kyiv City (Ukraine). J. Appl. Remote Sens. 2023, 17, 014506. [Google Scholar] [CrossRef]
- Guo, F.; Fan, L.; Zhang, C.; Xue, S. A Novel Space–Spectrum Array Tile Probability Random-Forest Model Enhances LULC Mapping Accuracy on Google Earth Engine: An Experiment in Ordos, China. Ecol. Inform. 2024, 81, 102607. [Google Scholar] [CrossRef]
- Bihon, Y.T.; Mohammed, A.K.; Ayele, E.G. Spatiotemporal Analysis of Land Use and Land Cover Using Random Forest in Google Earth Engine: A Case Study of the Grand Ethiopian Renaissance Dam Basin and Reservoir, Upper Blue Nile, Ethiopia. Environ. Chall. 2025, 21, 101311. [Google Scholar] [CrossRef]
- Patel, S.; Indraganti, M.; Jawarneh, R.N. A Comprehensive Systematic Review: Impact of Land Use/ Land Cover (LULC) on Land Surface Temperatures (LST) and Outdoor Thermal Comfort. Build. Environ. 2024, 249, 111130. [Google Scholar] [CrossRef]
- Faridatul, M.I.; Wu, B. Automatic Classification of Major Urban Land Covers Based on Novel Spectral Indices. ISPRS Int. J. Geo-Inf. 2018, 7, 453. [Google Scholar] [CrossRef]
- Ding, Y.; Ding, Q.; Yang, J.; Shao, Z.; Huang, X. PRISI: A Novel Piecewise Radar Impervious Surface Index for Urban Monitoring Using Sentinel-1 Data. Int. J. Appl. Earth Obs. Geoinf. 2022, 114, 103033. [Google Scholar] [CrossRef]
- Mustafa, E.K.; Liu, G.; Abd El-Hamid, H.T.; Kaloop, M.R. Simulation of Land Use Dynamics and Impact on Land Surface Temperature Using Satellite Data. GeoJournal 2021, 86, 1089–1107. [Google Scholar] [CrossRef]
- Assaf, G.; Hu, X.; Assaad, R.H. Mining and Modeling the Direct and Indirect Causalities among Factors Affecting the Urban Heat Island Severity Using Structural Machine Learned Bayesian Networks. Urban Clim. 2023, 49, 101570. [Google Scholar] [CrossRef]
- Becker, D.A.; Browning, M.H.E.M. Total Area Greenness Is Associated with Lower Per-Capita Medicare Spending, but Blue Spaces Are Not. City Environ. Interact. 2021, 11, 100063. [Google Scholar] [CrossRef]
- Gong, P.; Li, X.; Wang, J.; Bai, Y.; Chen, B.; Hu, T.; Liu, X.; Xu, B.; Yang, J.; Zhang, W.; et al. Annual Maps of Global Artificial Impervious Area (GAIA) between 1985 and 2018. Remote Sens. Environ. 2020, 236, 111510. [Google Scholar] [CrossRef]
- Abarca-Alvarez, F.J.; Campos-Sánchez, F.S.; Osuna-Pérez, F. Urban Shape and Built Density Metrics through the Analysis of European Urban Fabrics Using Artificial Intelligence. Sustainability 2019, 11, 6622. [Google Scholar] [CrossRef]
- Azmi, R.; Tekouabou Koumetio, C.S.; Diop, E.B.; Chenal, J. Exploring the Relationship between Urban Form and Land Surface Temperature (LST) in a Semi-Arid Region Case Study of Ben Guerir City—Morocco. Environ. Chall. 2021, 5, 100229. [Google Scholar] [CrossRef]
- Chen, Y.; Shu, B.; Zhang, R.; Amani-Beni, M. LST Determination of Different Urban Growth Patterns: A Modeling Procedure to Identify the Dominant Spatial Metrics. Sustain. Cities Soc. 2023, 92, 104459. [Google Scholar] [CrossRef]
- Eleftheriou, D.; Kiachidis, K.; Kalmintzis, G.; Kalea, A.; Bantasis, C.; Koumadoraki, P.; Spathara, M.E.; Tsolaki, A.; Tzampazidou, M.I.; Gemitzi, A. Determination of Annual and Seasonal Daytime and Nighttime Trends of MODIS LST over Greece—Climate Change Implications. Sci. Total Environ. 2018, 616–617, 937–947. [Google Scholar] [CrossRef]
- Shi, L.; Ling, F.; Foody, G.M.; Yang, Z.; Liu, X.; Du, Y. Seasonal SUHI Analysis Using Local Climate Zone Classification: A Case Study of Wuhan, China. Int. J. Environ. Res. Public Health 2021, 18, 7242. [Google Scholar] [CrossRef] [PubMed]
- Hidalgo-García, D.; Arco-Díaz, J. Modeling the Surface Urban Heat Island (SUHI) to Study of Its Relationship with Variations in the Thermal Field and with the Indices of Land Use in the Metropolitan Area of Granada (Spain). Sustain. Cities Soc. 2022, 87, 104166. [Google Scholar] [CrossRef]
- Benas, N.; Chrysoulakis, N.; Cartalis, C. Trends of Urban Surface Temperature and Heat Island Characteristics in the Mediterranean. Theor. Appl. Climatol. 2017, 130, 807–816. [Google Scholar] [CrossRef]
- Musse, M.A.; Barona, D.A.; Santana Rodriguez, L.M. Urban Environmental Quality Assessment Using Remote Sensing and Census Data. Int. J. Appl. Earth Obs. Geoinf. 2018, 71, 95–108. [Google Scholar] [CrossRef]
- Hu, X.; Xu, H. A New Remote Sensing Index for Assessing the Spatial Heterogeneity in Urban Ecological Quality: A Case from Fuzhou City, China. Ecol. Indic. 2018, 89, 11–21. [Google Scholar] [CrossRef]
- Roy, B.; Bari, E.; Nipa, N.J.; Ani, S.A. Comparison of Temporal Changes in Urban Settlements and Land Surface Temperature in Rangpur and Gazipur Sadar, Bangladesh after the Establishment of City Corporation. Remote Sens. Appl. Soc. Environ. 2021, 23, 100587. [Google Scholar] [CrossRef]
- Wu, Z.; Zhang, S.; Liu, M.; Wu, Z.; Hu, X.; Lin, S. Impact of Forest Landscape Patterns on Ecological Quality in Coastal Cities of Fujian, China, from 2000 to 2020. Forests 2024, 15, 1925. [Google Scholar] [CrossRef]
- Xu, C.; Li, B.; Kong, F.; He, T. Spatial-Temporal Variation, Driving Mechanism and Management Zoning of Ecological Resilience Based on RSEI in a Coastal Metropolitan Area. Ecol. Indic. 2024, 158, 111447. [Google Scholar] [CrossRef]
- Qiu, C.; Mou, L.; Schmitt, M.; Zhu, X. Local Climate Zone-Based Urban Land Cover Classification from Multi-Seasonal Sentinel-2 Images with a Recurrent Residual Network. ISPRS J. Photogramm. Remote Sens. 2019, 154, 151–162. [Google Scholar] [CrossRef] [PubMed]
- Shi, L.; Ling, F. Local Climate Zone Mapping Using Multi-Source Free Available Datasets on Google Earth Engine Platform. Land 2021, 10, 454. [Google Scholar] [CrossRef]
- Data | Landsat Science. Available online: https://landsat.gsfc.nasa.gov/data/ (accessed on 7 October 2025).
- About Copernicus | Copernicus. Available online: https://www.copernicus.eu/en/about-copernicus (accessed on 7 October 2025).


Disclaimer/Publisher’s Note: The statements, opinions and data contained in all publications are solely those of the individual author(s) and contributor(s) and not of MDPI and/or the editor(s). MDPI and/or the editor(s) disclaim responsibility for any injury to people or property resulting from any ideas, methods, instructions or products referred to in the content. |
© 2025 by the authors. Licensee MDPI, Basel, Switzerland. This article is an open access article distributed under the terms and conditions of the Creative Commons Attribution (CC BY) license (https://creativecommons.org/licenses/by/4.0/).