Abstract
Understanding long-term cloud cover variability is essential for assessing past climate dynamics and human influences on atmospheric conditions. In Padua, instrumental weather records (temperature, precipitation, pressure) and descriptive sky observations date back to 1725, but quantitative cloud cover data, expressed as tenths of the sky covered by clouds, began in 1872 at the Astronomical Observatory. From 1920 to 1989, observations continued under the authority of the Meteorological Observatory of the Water Magistrate, and from 1951 to 1990, additional records by the Italian Air Force expressed in eighths of sky are available. These visual datasets—based on multiple daily observations—are complemented by satellite records (from 1983) and reanalysis such as ERA5 (from 1940) and NOAA 20CRv3 (from 1872 to 2015). The aim of this study is to reconstruct a homogenized, long-term total cloud cover (TCC) time series for Padua from 1872 to 2024, integrating all available observational sources. By comparing overlapping periods across different subseries and nearby ground-based stations, the analysis not only investigates consistency and potential discontinuities across datasets but also quantifies the reliability and limitations of historical visual observations. This work provides one of the few centennial-scale reconstructions of cloud cover in Europe, offering a valuable contribution to historical climatology and climate change studies.
1. Introduction
The meteorological series of Padua (Northern Italy), where regular observations started in 1725 [], includes total cloud cover (hereafter TCC) from 1872 to 1990. Occasionally, the original logs reported not only the TCC but also the cloud type and direction of movement. Before this period, only qualitative descriptions of the sky are available, whereas in more recent times, modern instruments, such as geostationary satellites (from 1983), help estimate TCC. Despite the subjective nature of visual observations, the 1872–1990 records represent a valuable source of information for the pre-satellite era. The main issues related to early TCC observations are summarized in Table 1 [,].

Table 1.
Main issues related to TCC visual observation.
Inhomogeneities can be assessed using independent, simultaneous series from nearby locations and change-point detection algorithms.
While visual TCC observations refer to a particular location, large scale variations can be evaluated by means of satellites, also accessing the sea areas. However, satellite data cover only the last few decades and, furthermore, some inhomogeneities could occur because of instrument changes between missions, and the decay of satellite orbits [].
Systematic cloud cover observations, expressed as the fraction of sky covered by clouds, have been made mostly available since the 20th century, but there are also data from the 19th century or, more rarely, from even earlier. For example, some studies considered the changes in TCC in the whole Spain since 1866 [], in Lisbon (Portugal) since 1890 [], in Athens (Greece) since 1882 [], in Geneva (Switzerland) since 1799 [], and in Paris (France) since 1665 []. Concerning Italy, starting from 1951, all the Italian Air Force stations have been analyzed [,]. Some cloudiness data from the mid-19th century have been considered in the context of the HISTALP project, even though only four stations were located in the Po Valley, in Northern Italy, which has an area of ~48,000 km2 [,].
As the Mediterranean region is one “hot-spot” of climate change, [,], the assessment of TCC variations is of particular importance. In fact, clouds have a dual role in the energy budget at the surface. On one hand, they reflect a portion of the shortwave solar radiation back to space, reducing the amount that reaches the Earth’s surface. On the other hand, they absorb some of the longwave infrared radiation emitted by the Earth’s surface and re-emit it, both upward and downward []. There are still large uncertainties in the TCC variability as well as in its response to anthropogenic and natural forcings [,].
The aim of this study is to produce a homogenized daily TCC series for Padua spanning the 1872–2024 period. The variability in TCC has been investigated and quality-checked using change-point analysis. Additionally, TCC daily subseries from four nearby locations—each within 50 km of Padua and collectively covering an area of approximately 2700 km2—have been analyzed. These series partially overlap with the one from Padua and are used as independent validation datasets to compare trends.
2. Materials and Methods
2.1. Datasets
In this study, eight subseries have been considered to compose the daily TCC series for the 1872–2024 period, in Padua, as shown in Figure 1 and Table 2. For the 1872–1874 period, only monthly averages have been recovered. In addition, Figure 2 presents the timeline of the TCC data available. The Specola Observatory was managed by astronomers, and the Water Magistrate at the Magrini Observatory collected the observations for the “Ufficio Idrografico”, i.e., the Hydrographic Office (HO hereafter).
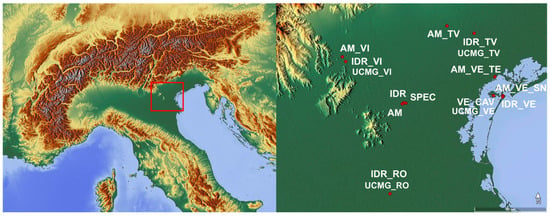
Figure 1.
Locations of the meteorological stations considered in this study.

Figure 2.
Overview of the Padua TCC series. The red dashed part of SPEC indicates SPEC9.
From 1983 to 2020, data from CLAAS-3 (CLAAS-3: CLoud property dAtAset using SEVIRI, edition 3) derived from Spinning Enhanced Visible and InfraRed Imager (SEVIRI) observations onboard the EUMETSAT METEOSAT Second Generation (MSG) satellites are considered. Data are provided by the Satellite Application Facility on Climate Monitoring (CM-SAF) with ~4 km resolution near Padua and 1 h intervals. The Fractional Cloud Cover (CFC) product is used to quantify how much of a given area (e.g., a satellite pixel) is covered by cloud at a given time, in percentages []. Since 2004, the Cloud Mask (CMA) product has been used, with ~4 km resolution near Padua and 15 min intervals, which provides a probabilistic cloud mask, expressed in percentages [].
Additional independent daily TCC datasets are available for other locations in the Veneto region: Venice (~40 km east of Padua), Treviso (~40 km north-east), Vicenza (~30 km north-west), and Rovigo (~35 km south). In the text, a different prefix was used according to the network affiliation of each station: “IDR_” for the HO network, “AM_” for the Air Force network, and “UCMG_” for the stations part of the “Ufficio Centrale Meteorologico e Geodinamico Italiano” (“Italian Central Meteorological and Geodynamic Office”). The Specola Observatory was part of the UCMG network.
The HISTALP database has also been considered. Its CRSM dataset (Coarse Resolution Subregional Mean) provides homogenized cloudiness monthly data for six subregions []. Padua, whose TCC data have not been included in this dataset, lies on the boundary between the south-east (HISTALP_SE, 1844–2008) and south-west (HISTALP_SW, 1763–2008) regions; therefore, the average field, HISTALP_S, has also been calculated as the mean between HISTALP_SE and HISTALP_SW. Interpolated values for these regions are based on 66 stations, of which only Venice (VE_CAV) is within 100 km from Padua [].

Table 2.
Daily TCC datasets for Padua from 1872 to 2024 and for the other locations shown in Figure 1. The numbers in brackets () represent the percentage of the subseries completeness.
Table 2.
Daily TCC datasets for Padua from 1872 to 2024 and for the other locations shown in Figure 1. The numbers in brackets () represent the percentage of the subseries completeness.
| Stations Abbreviation | Location | Station | TCC Scale | Long. | Lat. | Observations |
|---|---|---|---|---|---|---|
| SPEC 1 SPEC9 2 | Padua | Specola Obs. | 0–10 | 11.869 | 45.402 | 1 January 1872–31 December 1919 (99.8%) |
| 1 January 1920–14 Septemer 1938 (99.6%) | ||||||
| IDR 3 | Magrini Obs. | 11.859 | 45.403 | 1 January 1920–6 November 1989 (87.8%) | ||
| AM 4 | Airport | 0–8 | 11.848 | 45.395 | 1 January 1951–29 December 1990 (91.5%) | |
| SEVIRI_CFC | % | 11.875 | 45.425 | 1 January 1983–31 December 2020 (97.0%) | ||
| SEVIRI_CMA | % | 19 January 2004–31 December 2024 (99.1%) | ||||
| ERA5 5 | % | 11.750 | 45.500 | 1 January 1940–31 December 2024 (100.0%) | ||
| NOAA 6 | % | 12.000 | 45.000 | 1 January 1872–31 December 2015 (100.0%) | ||
| VE_CAV 7 | Venice | Cavanis | 0–10 | 12.334 | 45.430 | 1 January 1900–31 December 2000 (78.8%) |
| UCMG_VE 1 | Seminario Patriarcale | 12.333 | 45.431 | 1 January 1872–31 December 1906 (88.7%) | ||
| IDR_VE 3 | Lido | 12.383 | 45.430 | 1 January 1917–31 December 1986 (94.0%) | ||
| AM_VE_SN 4 | San Nicolò Airport | 0–8 | 12.382 | 45.426 | 1 January 1951–3 July 1977 (69.8%) | |
| AM_VE_TE 4 | Tessera Airport | 12.341 | 45.501 | 1 Mar 1961–31 December 2024 (82.7%) | ||
| UCMG_TV 1 | Treviso | Seminario Vescovile | 0–10 | 12.231 | 45.663 | 1 January 1879–31 December 1906 (89.3%) |
| IDR_TV 3 | 1 January 1917–31 December 1962 (85.6%) | |||||
| AM_TV 4 | Istrana Airport | 0–8 | 12.086 | 45.690 | 1 January 1951–31 December 2024 (90.6%) | |
| UCMG_VI 1 | Vicenza | Accademia Olimpica | 0–10 | 11.532 | 45.555 | 1 January 1872–31 December 1906 (89.3%) |
| IDR_VI 3 | 1 November 1917–31 December 1962 (86.6%) | |||||
| AM_VI 4 | Airport | 0–8 | 11.531 | 45.572 | 1 January 1951–14 December 2007 (93.6%) | |
| UCMG_RO 1 | Rovigo | Seminario Vescovile | 0–10 | 11.788 | 45.065 | 1 January 1879–31 December 1906 (89.3%) |
| IDR_RO 3 | 1 January 1917–31 December 1962 (82.0%) |
1 TCC was recorded three times a day, at 9, 15, and 21 local time (LT). For the UCMG_ series, monthly data have been considered. For SPEC in the 1872–1874 period, only monthly averages are available. 2 Only the morning observation (9 LT) was recorded. 3 Logs report one single value for each day, evaluated as the average of the TCC observed at 8, 14, and 19 LT. 4 TCC is present in the 3 h SYNOP records (for Padua, 0 and 21 UTC observations are not available, and from September 1983 the 3 UTC observations are also missing). 5 TCC estimates from ERA5 reanalysis provided every hour (in UTC) with 0.25° resolution []. 6 TCC estimates from NOAA20CRv3 reanalysis, provided at 0, 3, 6, 9, 12, 15, 18, 21 UTC with ~0.75° resolution []. 7 From 1900 to 1903, TCC is available for 6, 12, and 21 LT; from 1904 to 1917, for 9, 15, and 21 LT; and from 1918, for 8, 14, and 19 LT [].
2.2. Methodology
Since the TCC observations are limited to the 0–8 oktas interval (in the oktas scale of measurements, 0 is clear sky and 8 is overcast) and they are extracted from diverse datasets with different resolutions, the quantile matching approach has been used as a homogenization procedure. This method, also known as empirical cumulative distribution function (ECDF) matching, has been frequently used for bias correction of climate data thanks to its low computational cost [,,,]. The empirical cumulative distribution function (ECDF) represents the proportion of data points less than or equal to a given value. It provides a non-parametric estimate of the cumulative distribution of a sample. Its core is the transformation of a certain series by replacing its values with those of a target series having the same probability evaluated by the ECDF. The procedure is represented in Figure 3. First, the ECDF of the uncorrected series (F1) and of the target series (F2) are calculated over the same period, i.e., the training period. Subsequently, the ECDF value F1(x1) of the TCC observation x1 of the uncorrected series is extracted and the corresponding TCC value x2 with the same cumulative probability in F2 is calculated, F2−1(F1(x1)).
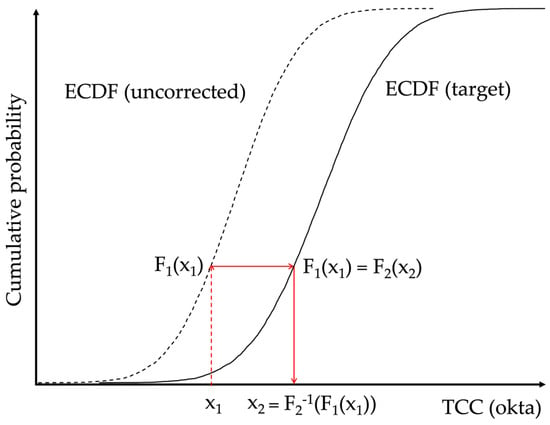
Figure 3.
Schematic view of the ECDF matching method.
Since the SEVIRI_CMA series is the most recent, all other series have been transformed relative to it, comparing the respective ECDFs in their overlapping periods and homogenizing all the data backwards. The procedure has been applied for each month, separately. The difference with the CFC product is that CMA is not a direct measure of cloud amount, but a detection confidence: a probability of cloud detection is assigned to each pixel, and a binary classification (0–1) is given whether the probability is below or above 50%. However, the percentage values of the two products are well correlated (see Section 3.1).
Some absolute homogeneity tests have also been applied to the final TCC yearly and seasonal series: the Standard Normal Homogeneity test (SNH) [], the Buishand U and Range tests [,], the Pettitt test [,], the F-test [,,], and the Von Neumann ratio test []. These tests were used to independently verify the internal consistency of the final homogenized series. These tests detect possible remaining change-points in the mean that are not necessarily addressed by the ECDF adjustment, thus ensuring the overall statistical stability of the series.
3. Results and Discussion
3.1. Homogenization
To properly apply the ECDF matching procedure, the overlapping periods with the largest correlations between the data must be selected. The Spearman correlation coefficient has been considered as the TCC data are categorical and not normally distributed. Table 3 shows the Spearman coefficients for the intersection of the TCC datasets used in the ECDF matching method. The correlation coefficients of the other intersections are not shown but they are generally lower than those presented in Table 3 and/or based on shorter intervals. Table 4 shows the number of days used for the calculation of the correlation coefficients in Table 3. Overall, the coefficients are in the range of 0.68–0.92, with minima in summer, except for the NOAA/SEVIRI_CFC case, which exhibits low values throughout the whole year (0.40–0.60). However, the NOAA data have been used to fill just a few gaps (twenty days in total, 0.04% of the series), sparse over the 1872–1939 period as no more than three infilled days are present for a single year, so they do not spoil the results. ERA5 provides moderate to high correlations, 0.70–0.80 with AM and 0.75–0.87 with SEVIRI_CFC, and has been used to infill 110 days in total (0.20%).

Table 3.
Spearman correlation coefficients between the daily TCC values of each dataset used in the ECDF matching method.

Table 4.
Number of days used to compute the coefficients in Table 3.
The correlation coefficients between SPEC and NOAA are low (0.38–0.67, indicating that the NOAA data cannot be used to link SPEC values to the other series. Although SPEC9 partially overlaps with IDR, it was not used to homogenize the 1872–1919 period because of the not-so-high correlations in summer (0.68–0.72). This is likely due to convective clouds, which typically form in the afternoon during summer, often missed by the 9 LT observations.
Therefore, as no other subseries overlaps with SPEC, this subseries has not been corrected. To preserve the continuity of the data, it is essential to calculate the daily TCC mean values of the other subseries considering the same observation hours of SPEC, i.e., 9, 15, and 21 LT. As the SEVIRI_CMA, SEVIRI_CFC, and ERA5 data are provided with hourly resolution, the same observation hour as in SPEC was selected. The IDR values are calculated using the 8, 14, and 19 LT, which are nearly the same with SPEC, while AM and NOAA have coarse temporal resolution and observation hours different from those of SPEC. Therefore, for both AM and NOAA, the 6, 12 and 18 UTC hours (i.e., 7, 13, 19 LT) have been selected, to maximize the correlation coefficients reported in Table 2. However, since SEVIRI_CMA, which is the series to which all the others are homogenized, can be evaluated using the same observation hours of SPEC, the temporal continuity of the final series will be preserved. This assumption will be verified by the change-point analysis presented in Section 3.2.
Considering SEVIRI_CMA, the difference between the daily mean computed using all the 0–23 h or only the 9, 15, and 21 observations, is in the range of +0.03/+0.28 oktas (+0.15 oktas on average), according to the month, with larger values in winter and smaller values in summer. Thus, there is no significant difference between the two approaches in evaluating the daily average.
Some statistical indicators have been calculated to assess the performance of the ECDF matching, i.e., the closeness of the transformed data to the target data in the overlapping periods (i.e., the training periods). In particular, beyond the Spearman correlation coefficient, the Root Mean Square Error is as follows:
and the Mean Bias Error is as follows:
where N is the number of points in pairs and and are the two series. Results are shown in Table 5. The Spearman correlation coefficients are higher than 0.76 except for the transformation that involves NOAA; the RMSEs are in the range of 1.3–2.3 oktas. Note that the best performance of these indicators involves subseries produced by human observers (IDR and AM). The MBEs are in the range of −0.3–+0.2 oktas, the worst cases being the transformations which consider NOAA or SPEC9.

Table 5.
Statistics of the training periods for which the ECDF matching procedure has been applied. Some transformations are applied sequentially; for example, SEVIRI_CFC → SEVIRI_CMA is the first (1) transformation, NOAA → (1) means that NOAA is transformed into the SEVIRI_CFC values already converted into SEVIRI_CMA ones, and so on.
Before applying the homogenization procedure, all the TCC data have been converted to oktas (Figure 4). The homogenized TCC series is shown in Figure 5 and the data source for each year is visualized in Figure 6. Generally, SEVIRI_CMA has been used from 2004 onward, SEVIRI_CFC in the 1983–2003 period, AM in the 1951–1982 period (except for the whole year 1974), IDR in the 1920–1950 period and 1974 (except 1923 and part of 1922), and finally SPEC in 1872–1919 with SPEC9 filling the 1922–1923 gap. Lastly, Figure 7 shows the seasonal TCC time series. At the yearly scale, TCC had a minimum towards the end of the 19th century and then again at the present day, and a maximum in the 1930s–1940s. In winter and summer, the maximum was reached in the 1950s–1960s, while in spring and autumn, it was reached in the 1930s.
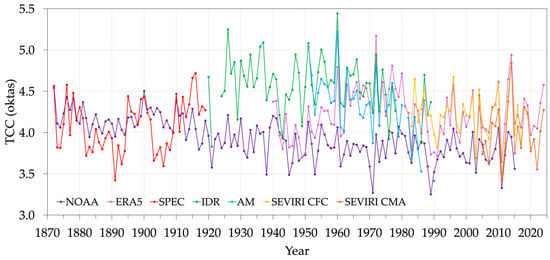
Figure 4.
Yearly means of all the Padua TCC datasets used to obtain the homogenized series shown in Figure 5, 1872–2024.
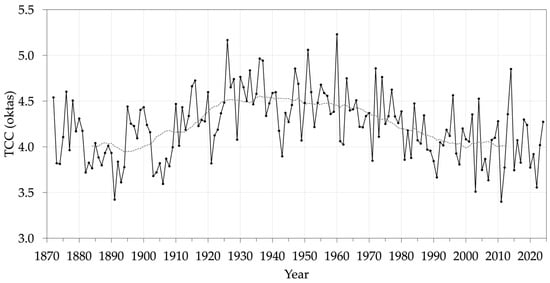
Figure 5.
Yearly average of the homogenized Padua TCC series, 1872–2024. The dashed line is the 25-year moving average.
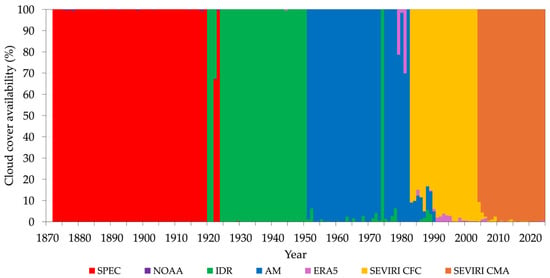
Figure 6.
Yearly availability of the homogenized Padua TCC series presented in Figure 5.
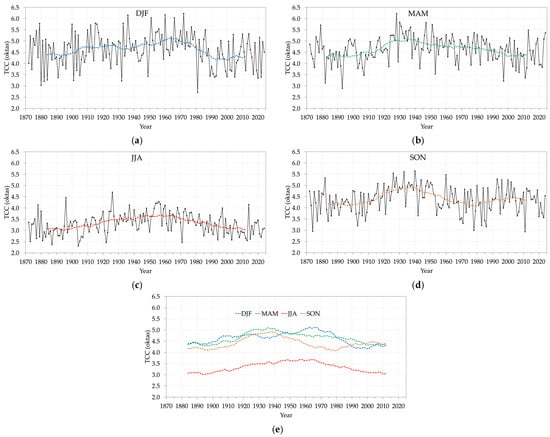
Figure 7.
Seasonal average of the homogenized Padua TCC series, 1872–2024. The dashed line is the 25-year moving average. (a) Winter (DJF); (b) Spring (MAM); (c) Summer (JJA); (d) Autumn (SON); (e) the four 25-year moving averages only.
In the NOAA reanalysis reconstruction, the increase in TCC in the mid-20th century is absent even considering longer time scales, i.e., 25-year averages (Figure 8). The limited multidecadal variability in surface radiation can be explained by the assumption of constant aerosol forcing []. On the other hand, ERA data are more accurate, excluding the 1925–1949 period (covered only in part by the reconstructions), confirming that this reanalysis product provides some of the best estimates in terms of correlation and bias compared with satellite observations [].
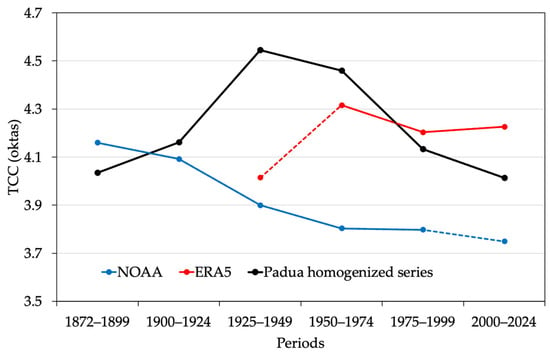
Figure 8.
The 25-year average (except for the first period, which is 28 years long) of the homogenized Padua TCC series (black), NOAA (violet), and ERA5 (pink); the last and first points of the NOAA and ERA5 series, respectively, are connected with a dashed line, as they cover only part of the corresponding period.
From the homogenized daily TCC series over the 1872–2024 period, it is possible to extract the yearly number of fine days ([0,2] oktas), partly cloudy days ((2,5] oktas), cloudy days ((5,7] oktas) and overcast days ((7,8] oktas). Over the 1991–2020 period, the climatological values are 106, 94, 69, and 95 days, respectively. The complete series is shown in Figure 9. No significant trend has been found in those categories according to the Mann–Kendall test. The month with the lowest mean TCC is February 2003, 1.4 oktas, while the one with the highest value is February 1902, 7.1 oktas. The year with the lowest mean TCC is 2011, 3.4 oktas, and the year with the highest value is 1960, 5.2 oktas.
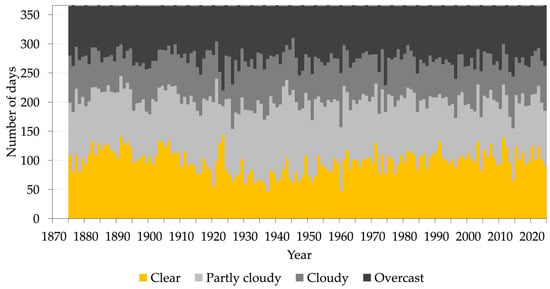
Figure 9.
Yearly number of clear days, partly cloudy days, cloudy days, and overcast days in Padua, 1875–2024.
Figure 10 shows the kernel density estimates (evaluated by using the “density” function of the R package “stats” []) of the monthly TCC anomalies with respect to the 1991–2020 period, for each 25-year interval in the 1872–2024 period. The Kolmogorov–Smirnov test applied to each interval indicates that the 1872–1899, 1975–1999, and 2000–2024 periods have Gaussian distributions (at the 95% confidence level). The same test has been applied to all possible pairs of 25-year datasets to assess whether they are drawn from the same distribution. Results indicate that within the six periods, two groups can be identified that do not differ statistically (95% confidence level): one group included the 1872–1899, 1900–1924, and 1975–1999 periods; the other included the 1925–1949 and 1950–1974 periods. These two groups are different from each other and different from the 2000–2024 period. The reduced variability in the TCC observed in 1925–1949 may indicate a phase of enhanced atmospheric stability; however, potential influences from changes in the observational methods or station coverage cannot be excluded.
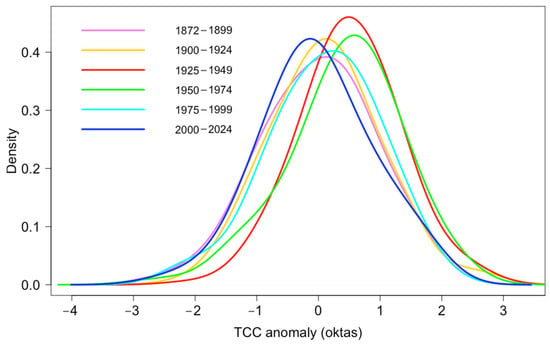
Figure 10.
Kernel density estimates of monthly TCC anomaly in Padua, with respect to 1991–2020 climatology, for each 25-year interval in 1872–2024 (except the first interval which is 28 years long).
3.2. Change-Point Analysis
A change-point is a point in a time series where a significant shift occurs in its statistical properties, such as the mean, variance, or trend, indicating a possible change in measurement conditions or data consistency. Applying the pool of absolute tests to the TCC yearly and seasonal series helps disentangle climate signals from statistical artifacts. The results of the homogeneity tests are shown in Table 6. The Mann–Kendall test [,,] applied to the 1872–2024 series detects no significant trends either at the yearly or seasonal scale.

Table 6.
Results of absolute homogeneity tests applied to the yearly and seasonal TCC series in Padua, over the 1872–2024 period. Only the change-points with p-value < 0.05 are shown.
The year 1980 emerges as probable change-point, while at the seasonal scale, 1914 is the suggested change-point for spring, and 1923 or possibly 1907 for summer. No clear indication is provided for autumn. The 1914 change-point can be due to different observation methodologies used by the Italian army, which recorded the meteorological data during World War I. A possible explanation for the 1980 change-point is the conversion of the energetic production in Italy and Europe after the Yom Kippur War of 1973, when, after the increase in the oil price, a gradual switch from oil to methane took place in the following decade, together with the implementation of the first European air quality policies aimed at reducing atmospheric pollution []. This led to a general reduction in air pollution and a change in aerosol size, which in turn affected the type of clouds and their persistence [].
3.3. Comparison of TCC Series with Other Datasets
The quality of the Padua TCC observations can also be verified by comparing them with the results obtained by Manara et al. []. They produced an interpolated product of the TCC throughout Italy, with resolution, for the 1951–2018 period at 12 UTC, by means of the observations of the Italian Air Force station network (168 stations). The TCC time series has been extrapolated for the coordinates of Padua and compared to the series reconstructed in this study. At the yearly scale, over the common period 1951–2018, the linear correlation coefficient between the two datasets is 0.89, while for the four seasons, the coefficient is 0.91–0.92, which are statistically significant, despite the different observation times. Furthermore, the linear trends over the same period are compatible and all negative, at the yearly and seasonal levels, i.e., a decrease of ~0.01–0.02 oktas/year (but no trend has been found for autumn). Over the 1951–2024 period, the yearly mean of the TCC has a slope of −0.09 ± 0.02 oktas/decade. During the same period, the number of clear days increases by +2.7 ± 0.9 per decade while the number of partly cloudy days decreases by −2.7 ± 0.5 per decade; the other categories have no significant trend.
Figure 11 shows the comparison between the yearly TCC time series collected by the Air Force network in Padua and in nearby locations, from 1951 to 2024. There is a good agreement in the TCC trend among the various series, even though a peculiar behavior is noticeable for AM_TV: before the mid-1970s, its values are generally lower than those of the other series, whereas afterwards it exhibits higher values. Moreover, the AM_VE_TE observations in 2018–2024 are anomalously lower than the AM_TV values.
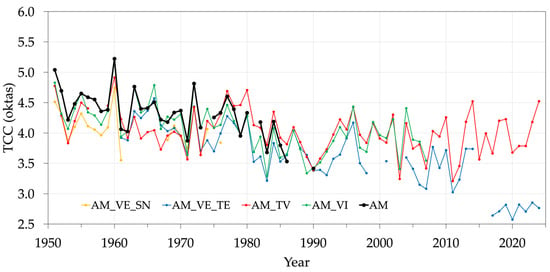
Figure 11.
Yearly TCC for the Air Force stations: Padua (black), Venice (yellow and blue), Treviso (red), and Vicenza (green).
Figure 12 shows the comparison between the TCC yearly series collected by the HO network available in Padua and in nearby locations. In this case, there is more variability among the series. From 1924 to the beginning of the 1940s, there is good agreement between the observations; afterwards, IDR_RO and IDR_VE exhibit very low values compared to the other stations, and, while IDR_VE then increases to reach abnormally high values, IDR_RO remains low. Finally, the last part of IDR_VE unexpectedly drops to very low values.
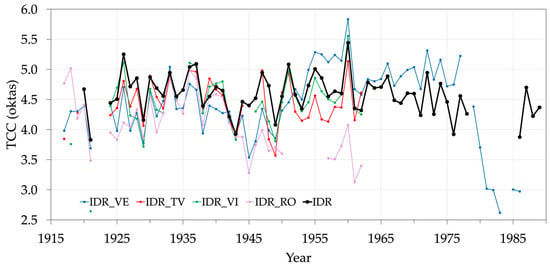
Figure 12.
Yearly mean of TCC for the HO stations: Padua (black), Venice (blue), Treviso (red), Vicenza (green), and Rovigo (pink).
Lastly, Figure 13 shows the yearly series of SPEC and the UCMG stations. Unfortunately, at the beginning of the 20th century, many gaps exist, and only SPEC is continuous. Efforts are currently underway to recover the missing part of the UCMG series. Nonetheless, the correlation between the Padua series and the other locations’ data in the common period (1879–1906, with a gap in 1902–1904) is lower than in more recent periods (see Figure 11 and Figure 12). The Pearson correlation coefficients between each subseries of direct observations taken in Padua and other cities are shown in Table 7. The more recent the period, the higher the correlation coefficients, except for Treviso, whose correlation with Padua is higher for the HO station.
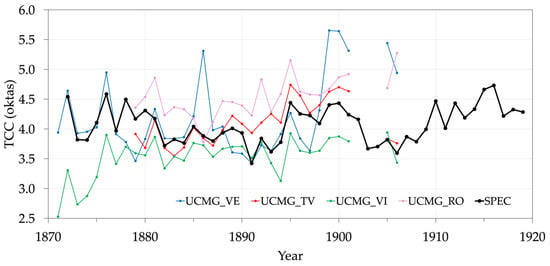
Figure 13.
Yearly TCC for the UCMG stations: Padua (black), Venice (blue), Treviso (red), Vicenza (green), and Rovigo (pink).

Table 7.
Pearson correlation coefficients between the yearly subseries of Padua and the other locations. Correlations significant at the 95% confidence level are marked with an asterisk (*).
To better visualize the inconsistent trend of the observations provided by HO, Figure 14 compares these data with the Air Force observations, grouping the same locations, even though the stations of the two networks were not situated exactly in the same place. Overall, for Padua (Figure 14a), IDR exhibits larger TCC values with respect to AM throughout the whole common period. For Venice (Figure 14b), something changed in the observation method, or the observer, for IDR_VE in the 1950s, when a sudden increase occurred, and again in the latest part of the series, when an abrupt decrease happened. However, the Spearman correlation coefficient between IDR_VE and VE_CAV evaluated at the daily level in the 1917–1951 period is high, 0.89. Furthermore, the correlation is also high, 0.86, between VE_CAV and AM_VE_TE in the 1979–2000 period. Conversely, the correlation between VE_CAV and SPEC in the 1900–1919 period is low, 0.38. This is probably due to a problem in the VE_CAV series, as the rapid decrease over the 1900–1919 period is not confirmed by the HISTALP data, which assimilated VE_CAV as input data. In fact, over the 1900–1919 period, the yearly linear correlation coefficient between SPEC and HISTALP_SE on one side, and with HISTALP_SW, is 0.59 and 0.62, respectively, and 0.69 if HISTALP_S is used. The slope of the linear regression over the same period is −0.104 ± 0.013 oktas/year for VE_CAV, and +0.020 ± 0.009, +0.007 ± 0.009, and 0.014 ± 0.008 oktas/year for HISTALP_SE, HISTALP_SW, and HISTALP_S, respectively. The slope for SPEC over the same period is +0.027 ± 0.011 oktas/year, which is compatible with the slope of HISTALP_S, but not of VE_CAV.
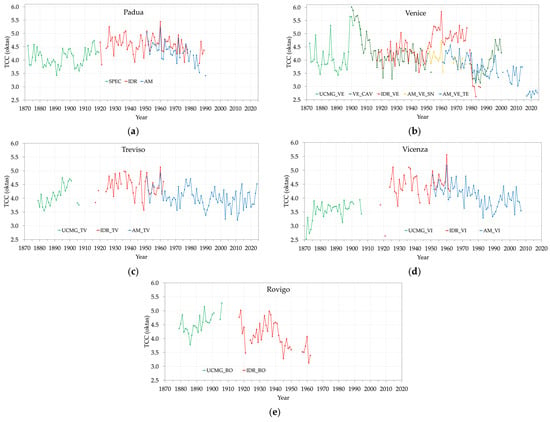
Figure 14.
Yearly TCC series of the observations provided by UCMG (green), HO (red), the Air Force (blue and yellow), and Cavanis Observatory (VE_CAV, dark green). (a) Padua; (b) Venice; (c) Treviso; (d) Vicenza; (e) Rovigo.
Treviso (Figure 14c) is more coherent, with UCMG_TV, IDR_TV, and AM_TV exhibiting similar values. Vicenza (Figure 14d) is consistent in the recent period, as the IDR_VI and AM_VI values have a comparable trend even though with an offset, while UCMG_VI has lower values compared to the subsequent periods. The two series available for Rovigo, i.e., UCMG_RO and IDR_RO (Figure 14e), are comparable, but values after the 1940s are inexplicably low with respect to the previous period, with a decrease which is not present in the other locations. For Padua, the homogeneity tests did not reveal clear change-points inside the IDR period, and the values in the 1924–1950 period are coherent with those of the other stations. Our findings do not provide evidence for problems with the SPEC data and the homogenized TCC series.
4. Conclusions
This study presented a unique reconstruction and analysis of the total cloud cover (TCC) variability in Padua over a 150-year period (1872–2024). Despite no significant trend being found across the entire series, a statistically significant decrease in TCC was observed from the 1950s onward in all seasons except autumn, with a rate of −0.01–0.02 oktas/year.
The analysis combined early visual observations with satellite data available since 1983. While visual observations are inherently subjective—being influenced by factors such as observer sensitivity, sky brightness, cloud transparency, and observation time—the availability of overlapping records from multiple observatories within Padua, as well as nearby locations, provided a rare opportunity to validate and homogenize the historical data. These auxiliary datasets, together with change-point analysis, enabled an assessment of the consistency and reliability of the reconstructed series.
Through correlation analysis and monthly ECDF matching, all Padua subseries were successfully homogenized into a continuous and coherent time series. Data from the Italian Air Force across Padua, Vicenza, Treviso, and Venice showed overall consistency over the 1951–2024 period. In contrast, discontinuities in the Hydrographic Office network and the Italian Central Meteorological and Geodynamic Office—particularly for Venice and Rovigo—are likely related to changes in observer personnel.
For the beginning of the 20th century, independent data are scarce and the NOAA reanalysis values proved to be unreliable, but a recovery effort is currently ongoing, jointly with the daily TCC values for Padua in the 1872–1874 period. Nevertheless, a probable change-point could be identified during World War I, when army staff replaced astronomers in managing meteorological observations. A second distinct shift occurred around 1980, likely associated with the post-1973 energy crisis, the introduction of European air quality policies, and the transition from oil to gas as the primary energy source. This shift led to a reduction in air pollution and a consequent decrease in cloud condensation nuclei, particularly affecting low cloud and fog formation.
Overall, this work provided a rare and robust long-term view of TCC variability at a local scale, offering valuable insights into understanding past and future cloud trends in relation to both observational practices and external forcing.
Author Contributions
Conceptualization, C.S., F.B., A.d.V. and D.C.; methodology, C.S.; validation, C.S.; formal analysis, C.S.; investigation, C.S.; data curation, C.S. and D.C.; writing—original draft preparation, C.S.; writing—review and editing, C.S., F.B., F.Z., D.C. and A.d.V.; supervision, D.C. All authors have read and agreed to the published version of the manuscript.
Funding
This research received no external funding.
Data Availability Statement
The original and homogenized Padua TCC data presented in this study are openly available in FigShare at https://doi.org/10.6084/m9.figshare.29500358.
Acknowledgments
The authors are grateful to the Historical Archive of the Specola Astronomical Observatory, Padua, for free consultation of the documents. The authors wish to thank Attilio Pecorari and Marco Camillini for their valuable assistance in reproducing part of the historical records preserved at the Sormani Library in Milan.
Conflicts of Interest
The authors declare no conflicts of interest.
References
- Camuffo, D. History of the Long Series of Daily Air Temperature in Padova (1725–1998). Clim. Change 2002, 53, 7–75. [Google Scholar] [CrossRef]
- Utrillas, M.P.; Marín, M.J.; Estellés, V.; Marcos, C.; Freile, M.D.; Gómez-Amo, J.L.; Martínez-Lozano, J.A. Comparison of Cloud Amounts Retrieved with Three Automatic Methods and Visual Observations. Atmosphere 2022, 13, 937. [Google Scholar] [CrossRef]
- Silva, A.A.; Souza-Echer, M.P. Ground-based observations of clouds through both an automatic imager and human observation. Met. Apps 2016, 23, 150–157. [Google Scholar] [CrossRef]
- Pfeifroth, U.; Bojanowski, J.S.; Clerbaux, N.; Manara, V.; Sanchez-Lorenzo, A.; Trentmann, J.; Walawender, J.P.; Hollmann, R. Satellite-based trends of solar radiation and cloud parameters in Europe. Adv. Sci. Res. 2018, 15, 31–37. [Google Scholar] [CrossRef]
- Sanchez-Lorenzo, A.; Calbó, J.; Wild, M. Increasing cloud cover in the 20th century- review and new findings in Spain. Clim. Past 2012, 8, 1199–1212. [Google Scholar] [CrossRef]
- Aparicio, A.J.P.; Carrasco, V.M.S.; Montero-Martín, J.; Sanchez-Lorenzo, A.; Costa, M.J.; Antón, M. Analysis of sunshine duration and cloud cover trends in Lisbon for the period 1890–2018. Atmos. Res. 2023, 290, 106804. [Google Scholar] [CrossRef]
- Founda, D.; Nastos, P.T.; Pierros, F.; Kalimeris, A. Historical observations of cloudiness (1882–2012) over a large urban area of the eastern Mediterranean (Athens). Theor. Appl. Climatol. 2019, 137, 283–295. [Google Scholar] [CrossRef]
- Auchmann, R.; Brönnimann, S.; Breda, L.; Bühler, M.; Spadin, R.; Stickler, A. Extreme climate, not extreme weather: The summer of 1816 in Geneva, Switzerland. Clim. Past Res. 2012, 8, 325–335. [Google Scholar] [CrossRef]
- Pliemon, T.; Foelsche, U.; Rohr, C.; Pfister, C. Subdaily meteorological measurements of temperature, direction of the movement of the clouds, and cloud cover in the Late Maunder Minimum by Louis Morin in Paris. Clim. Past Res. 2022, 18, 1685–1707. [Google Scholar] [CrossRef]
- Maugeri, M.; Bagnati, Z.; Brunetti, M.; Nanni, T. Trends in Italian total cloud amount, 1951–1996. Geophys. Res. Lett. 2001, 28, 4551–4554. [Google Scholar] [CrossRef]
- Manara, V.; Brunetti, M.; Wild, M.; Maugeri, M. Variability and trends of the total cloud cover over Italy (1951–2018). Geophys. Res. Lett. 2023, 285, 106625. [Google Scholar] [CrossRef]
- Auer, I.; Böhm, R.; Jurkovic, A.; Lipa, W.; Orlik, A.; Potzmann, R.; Schöner, W.; Ungersböck, M.; Matulla, C.; Briffa, K.; et al. HISTALP—Historical instrumental climatological surface time series of the Greater Alpine Region. Int. J. Climatol. 2007, 27, 17–46. [Google Scholar] [CrossRef]
- Brunetti, M.; Lentini, G.; Maugeri, M.; Nanni, T.; Auer, I.; Böhm, R.; Schöner, W. Climate variability and change in the Greater Alpine Region over the last two centuries based on multi-variable analysis. Int. J. Climatol. 2009, 29, 2197–2225. [Google Scholar] [CrossRef]
- Cos, J.; Doblas-Reyes, F.; Jury, M.; Marcos, R.; Bretonnière, P.-A.; Samsó, M. The Mediterranean climate change hotspot in the CMIP5 and CMIP6 projections. Earth Syst. Dynam. 2022, 13, 321–340. [Google Scholar] [CrossRef]
- Lazoglou, G.; Papadopoulos-Zachos, A.; Georgiades, P.; Zittis, G.; Velikou, K.; Manios, E.M.; Anagnostopoulou, C. Identification of climate change hotspots in the Mediterranean. Sci. Rep. 2024, 14, 29817. [Google Scholar] [CrossRef] [PubMed]
- Zhou, C.; Zelinka, M.; Klein, S. Impact of decadal cloud variations on the Earth’s energy budget. Nature Geosci. 2016, 9, 871–874. [Google Scholar] [CrossRef]
- Tang, T.; Shindell, D.; Zhang, Y.; Voulgarakis, A.; Lamarque, J.-F.; Myhre, G.; Stjern, C.W.; Faluvegi, G.; Samset, B.H. Response of surface shortwave cloud radiative effect to greenhouse gases and aerosols and its impact on summer maximum temperature. Atmos. Chem. Phys. 2020, 20, 8251–8266. [Google Scholar] [CrossRef]
- Mendoza, V.; Pazos, M.; Garduño, R.; Mendoza, B. Thermodynamics of climate change between cloud cover, atmospheric temperature and humidity. Sci. Rep. 2021, 11, 21244. [Google Scholar] [CrossRef]
- Stöckli, R.; Bourgeois, Q.; Tetzlaff, A.; Schröder, M.; Hollmann, R. CM SAF ClOud Fractional Cover Dataset from METeosat First and Second Generation—Edition 2 (COMET Ed. 2), Satellite Application Facility on Climate Monitoring. 2024. Available online: https://wui.cmsaf.eu/safira/action/viewDoiDetails?acronym=CFC_METEOSAT_V002 (accessed on 7 July 2025).
- Meirink, J.F.; Karlsson, K.-G.; Solodovnik, I.; Hüser, I.; Benas, N.; Johansson, E.; Håkansson, N.; Stengel, M.; Selbach, N.; Schröder, M.; et al. CLAAS-3: CM SAF CLoud Property dAtAset Using SEVIRI—Edition 3, Satellite Application Facility on Climate Monitoring. 2022. Available online: https://wui.cmsaf.eu/safira/action/viewDoiDetails?acronym=CLAAS_V003 (accessed on 7 July 2025).
- Historical Instrumental Climatological Surface Time Series of the Greater Alpine Region. Available online: https://www.zamg.ac.at/histalp/index.php (accessed on 7 July 2025).
- ERA5 Hourly Data on Single Levels from 1940 to Present. Available online: https://cds.climate.copernicus.eu/datasets/reanalysis-era5-single-levels?tab=overview (accessed on 7 July 2025).
- NOAA/CIRES/DOE 20th Century Reanalysis (V3). Available online: https://www.psl.noaa.gov/data/gridded/data.20thC_ReanV3.html (accessed on 7 July 2025).
- Istituto Veneto di Scienze, Lettere ed Arti. Archivio 100 Anni Osservatorio Patriarcale. Banca Dati Ambientale Sulla Laguna di Venezia. Available online: https://www.istitutoveneto.org/venezia/dati/atmosfera/dati_cavanis/cavanis_db/osservatorio.php (accessed on 7 July 2025).
- Themeßl, M.J.; Gobiet, A.; Heinrich, G. Empirical-statistical downscaling and error correction of regional climate models and its impact on the climate change signal. Clim Change. 2012, 112, 449–468. [Google Scholar] [CrossRef]
- Hoffman, R.N.; Boukabara, S.; Kumar, V.K.; Garrett, K.; Casey, S.P.F.; Atlas, R. An Empirical Cumulative Density Function Approach to Defining Summary NWP Forecast Assessment Metrics. Mon. Wea. Rev. 2017, 145, 1427–1435. [Google Scholar] [CrossRef]
- Teng, T.-Y.; Liu, T.-M.; Tung, Y.-S.; Cheng, K.-S. Converting Climate Change Gridded Daily Rainfall to Station Daily Rainfall—A Case Study at Zengwen Reservoir. Water 2021, 13, 1516. [Google Scholar] [CrossRef]
- Dogbey, F.; Asilevi, P.J.; Dzrobi, J.F.; Koffi, H.A.; Klutse, N.A.B. Modelling Cloud Cover Climatology over Tropical Climates in Ghana. Atmosphere 2022, 13, 1265. [Google Scholar] [CrossRef]
- Alexandersson, H. A homogeneity test applied to precipitation data. J. Climatol. 1986, 6, 661–675. [Google Scholar] [CrossRef]
- Buishand, T. Some methods for testing the homogeneity of rainfall records. J. Hydrol. 1982, 58, 11–27. [Google Scholar] [CrossRef]
- Hawkins, D.M. Testing a Sequence of Observations for a Shift in Location. J. Am. Stat. Assoc. 1977, 72, 180–186. [Google Scholar] [CrossRef]
- Pettitt, A.N. A Non-Parametric Approach to the Change-Point Problem. Appl. Stat. JSTOR 1979, 28, 126. [Google Scholar] [CrossRef]
- Chow, G.C. Tests of Equality Between Sets of Coefficients in Two Linear Regressions. Econom. JSTOR 1960, 28, 591. [Google Scholar] [CrossRef]
- Yozgatligil, C.; Yazici, C. Comparison of homogeneity tests for temperature using a simulation study. Int. J. Climatol. 2015, 36, 62–81. [Google Scholar] [CrossRef]
- Militino, A.; Moradi, M.; Ugarte, M.D. On the Performances of Trend and Change-Point Detection Methods for Remote Sensing Data. Remote Sens. 2020, 12, 1008. [Google Scholar] [CrossRef]
- von Neumann, J. Distribution of the Ratio of the Mean Square Successive Difference to the Variance. Ann. Math. Stat. Inst. Math. Stat. 1941, 12, 367–395. [Google Scholar] [CrossRef]
- Wohland, J.; Brayshaw, D.; Bloomfield, H.; Wild, M. European multidecadal solar variability badly captured in all centennial reanalyses except CERA20C. Environ. Res. Lett. 2020, 15, 104021. [Google Scholar] [CrossRef]
- Wu, H.; Xu, X.; Luo, T.; Yang, Y.; Xiong, Z.; Wang, Y. Variation and comparison of cloud cover in MODIS and four reanalysis datasets of ERA-interim, ERA5, MERRA-2 and NCEP. Atmos. Res. 2023, 281, 106477. [Google Scholar] [CrossRef]
- Kernel Density Estimation. Available online: https://stat.ethz.ch/R-manual/R-devel/RHOME/library/stats/html/density.html (accessed on 5 November 2025).
- Mann, H.B. Nonparametric Tests against Trend. Econom. JSTOR 1945, 13, 245. [Google Scholar] [CrossRef]
- Kendall, M.G. Rank Correlation Methods, 4th ed.; Charles Griffin: London, UK, 1975. [Google Scholar]
- Gilbert, R.O. Statistical Methods for Environmental Pollution Monitoring; Wiley: New York, NY, USA, 1987. [Google Scholar]
- Turnock, S.T.; Butt, E.W.; Richardson, T.B.; Mann, G.W.; Reddington, C.L.; Forster, P.M.; Haywood, J.; Crippa, M.; Janssens-Maenhout, G.; Johnson, C.E.; et al. The impact of European legislative and technology measures to reduce air pollutants on air quality, human health and climate. Environ. Res. Lett. 2024, 11, 024010. [Google Scholar] [CrossRef]
- Ramanathan, V.; Crutzen, P.J.; Kiehl, J.T.; Rosenfeld, D. Aerosols, Climate, and the Hydrological Cycle. Science 2001, 294, 2119–2124. [Google Scholar] [CrossRef] [PubMed]
Disclaimer/Publisher’s Note: The statements, opinions and data contained in all publications are solely those of the individual author(s) and contributor(s) and not of MDPI and/or the editor(s). MDPI and/or the editor(s) disclaim responsibility for any injury to people or property resulting from any ideas, methods, instructions or products referred to in the content. |
© 2025 by the authors. Licensee MDPI, Basel, Switzerland. This article is an open access article distributed under the terms and conditions of the Creative Commons Attribution (CC BY) license (https://creativecommons.org/licenses/by/4.0/).