Article

Characterization and GIS Mapping of the Physicochemical Quality of Soils in the Irrigated Area of Tafrata (Eastern Morocco): Implications for Sustainable Agricultural Management

1
Doctoral Studies Center of Engineering Sciences and Techniques, Mohammadia School of Engineers (EMI), Mohammed V University in Rabat, Av. Ibn Sina, P.O. Box 765, Rabat 10090, Morocco
2
Civil Engineering and Environment Laboratory (LGCE), Materials Water and Environment Team, Higher School of Technology of Mohammed V University of Rabat, Sale 11060, Morocco
3
National Center for Genetic Resources (CNRG), Regional Center of Agronomic Research of Rabat, National Institute of Agronomic Research (INRA), Avenue Ennasr, Rabat P.O. Box 415, Morocco
4
Laboratory of Geophysics and Natural Hazards, Department of Geology, Scientific Institute, Mohammed V University in Rabat, 4 Avenue Ibn Batouta, Rabat P.O. Box 1014, Morocco
5
Laboratory of Applied Geomatics and Soil Science, Regional Center of Agricultural Research of Oujda, National Institute of Agricultural Research (INRA), Oujda P.O. Box 428, Morocco
6
Biotechnology Research Unit, Regional Center of Agricultural Research of Rabat, National Institute of Agricultural Research (INRA), Avenue Ennasr, P.O. Box 415, Rabat 10090, Morocco
*
Author to whom correspondence should be addressed.
Geographies 2025, 5(4), 66; https://doi.org/10.3390/geographies5040066
Submission received: 5 July 2025 / Revised: 24 September 2025 / Accepted: 26 September 2025 / Published: 7 November 2025

Abstract

The Tafrata Irrigated Perimeter (TIP) in Taourirt province, located in a semi-arid environment, faces pressures from intensive agriculture and unsustainable resource use, leading to soil degradation, low organic matter, salinity risks, and nutrient imbalances. Despite the need for effective management, limited studies have used spatial and geostatistical tools to assess soil quality in the region. This study aims to evaluate the physico-chemical quality of TIP soils and to identify management priorities for sustainable agricultural development. To achieve this, 84 soil samples analyzed for particle size, density, electrical conductivity, pH, organic matter, total carbonate content, potassium, and phosphorus. GIS was used to generate thematic maps. Findings show that 55% of the area consists of balanced sandy loam soils, with 76% of samples having slightly alkaline pH. Phosphorus and potassium concentrations average 35.23 (mg∙kg−1) and 166.06 (mg∙kg−1), respectively. While 76% of soils are non-saline, 87% have moderate carbonate content. Organic matter is critically low at 1.46%, raising concerns about soil fertility and water retention. The study emphasizes the need for sustainable agricultural practices to manage soil variability and improve fertility, offering actionable insights to support long-term soil health and resource sustainability in the TIP.

1. Introduction

Soil health and fertility are fundamental to sustainable agricultural systems, as they directly impact crop productivity and resource conservation. In arid and semi-arid regions, where water is scarce and soil resources are vulnerable, maintaining soil quality is particularly challenging. Approximately 60% of such regions globally are located in lower-income nations, where agricultural production heavily relies on rainfall [1]. Morocco exemplifies this reality, with about 85% of its agricultural land depending on rainfall for irrigation. However, irrigation is crucial to Morocco’s economy and food security. Of the 8.7 million hectares of arable land, approximately 1.2 million hectares are irrigated, representing about 14% of the total arable land [2]. Irrigated agriculture contributes, on average, about 45% of the country’s agricultural value added, while the agricultural sector itself represents between 13% and 20% of the national GDP [3]. Agriculture also remains Morocco’s largest employment sector, underscoring its social and economic significance.
Despite its essential role, Morocco’s irrigated areas face significant challenges due to excessive exploitation and various forms of degradation [4]. Studies show that intensive irrigation without sustainable practices can lead to soil degradation, as demonstrated by research across Morocco [5,6,7,8,9,10]. Factors such as climate, agronomic practices, soil texture, low organic matter, and the quality of irrigation water and drainage conditions are major contributors to this degradation [11,12].
This situation highlights the importance of continuous monitoring of soil and water resources in irrigated perimeters to assess degradation levels, estimate problem severity, and provide timely data for guiding sustainable practices [13]. Based on field investigations in the TIP, several issues have been identified that significantly affect soil quality and sustainability. Intensive agriculture, characterized by the irrational use of synthetic fertilizers and pesticides, has led to soil degradation and fertility loss. Moreover, the predominant use of traditional gravity-based irrigation systems, which are less efficient in water management, further exacerbates resource wastage. To address these challenges, the adoption of localized irrigation techniques could significantly improve water efficiency and help mitigate these negative impacts [14]. The semi-arid climatic conditions of the region aggravate these issues by intensifying evapotranspiration, thereby increasing the risks of abiotic stress. These combined factors contribute to declining soil quality, reduced agricultural productivity, and lower crop yields, posing a threat to food security in the face of growing climate change challenges.
This study, conducted for the first time in the TIP, focuses on understanding and addressing these challenges. It examines TIP’s soil properties to evaluate their physico-chemical characteristics and identify suitable management strategies. The region, located in Taourirt province, relies on seasonal rainfall from the Oued Za dam for irrigation. In this semi-arid environment, promoting sustainable agricultural practices is crucial to preserving resources for long-term viability [5].
This study aims to analyze TIP’s soil properties to understand its physico-chemical characteristics and identify suitable management strategies. Key parameters, including particle size, soil bulk density, pH, electrical conductivity, organic matter, and nutrient levels, were measured to assess soil quality. Data collected will be analyzed using Geographic Information System (GIS) to create thematic maps illustrating spatial variations across the TIP. This approach not only enhances the understanding of soil health but also informs decision making for soil and water management.
It is hypothesized that intensive agricultural practices, coupled with the absence of sustainable management models, have caused significant spatial variability in soil quality within the TIP. Factors such as low organic matter and nutrient imbalances may be worsening soil degradation and reducing water retention. This study will test whether GIS can provide insights into these variations and help develop strategies to mitigate risks and ensure long-term agricultural sustainability.
Ultimately, this research seeks to offer data-driven recommendations for sustainable soil management in the TIP, contributing to enhanced agricultural productivity, economic growth and environmental conservation, with potential applications for other arid regions in Morocco.

2. Materials and Methods

2.1. Study Area and Site Description

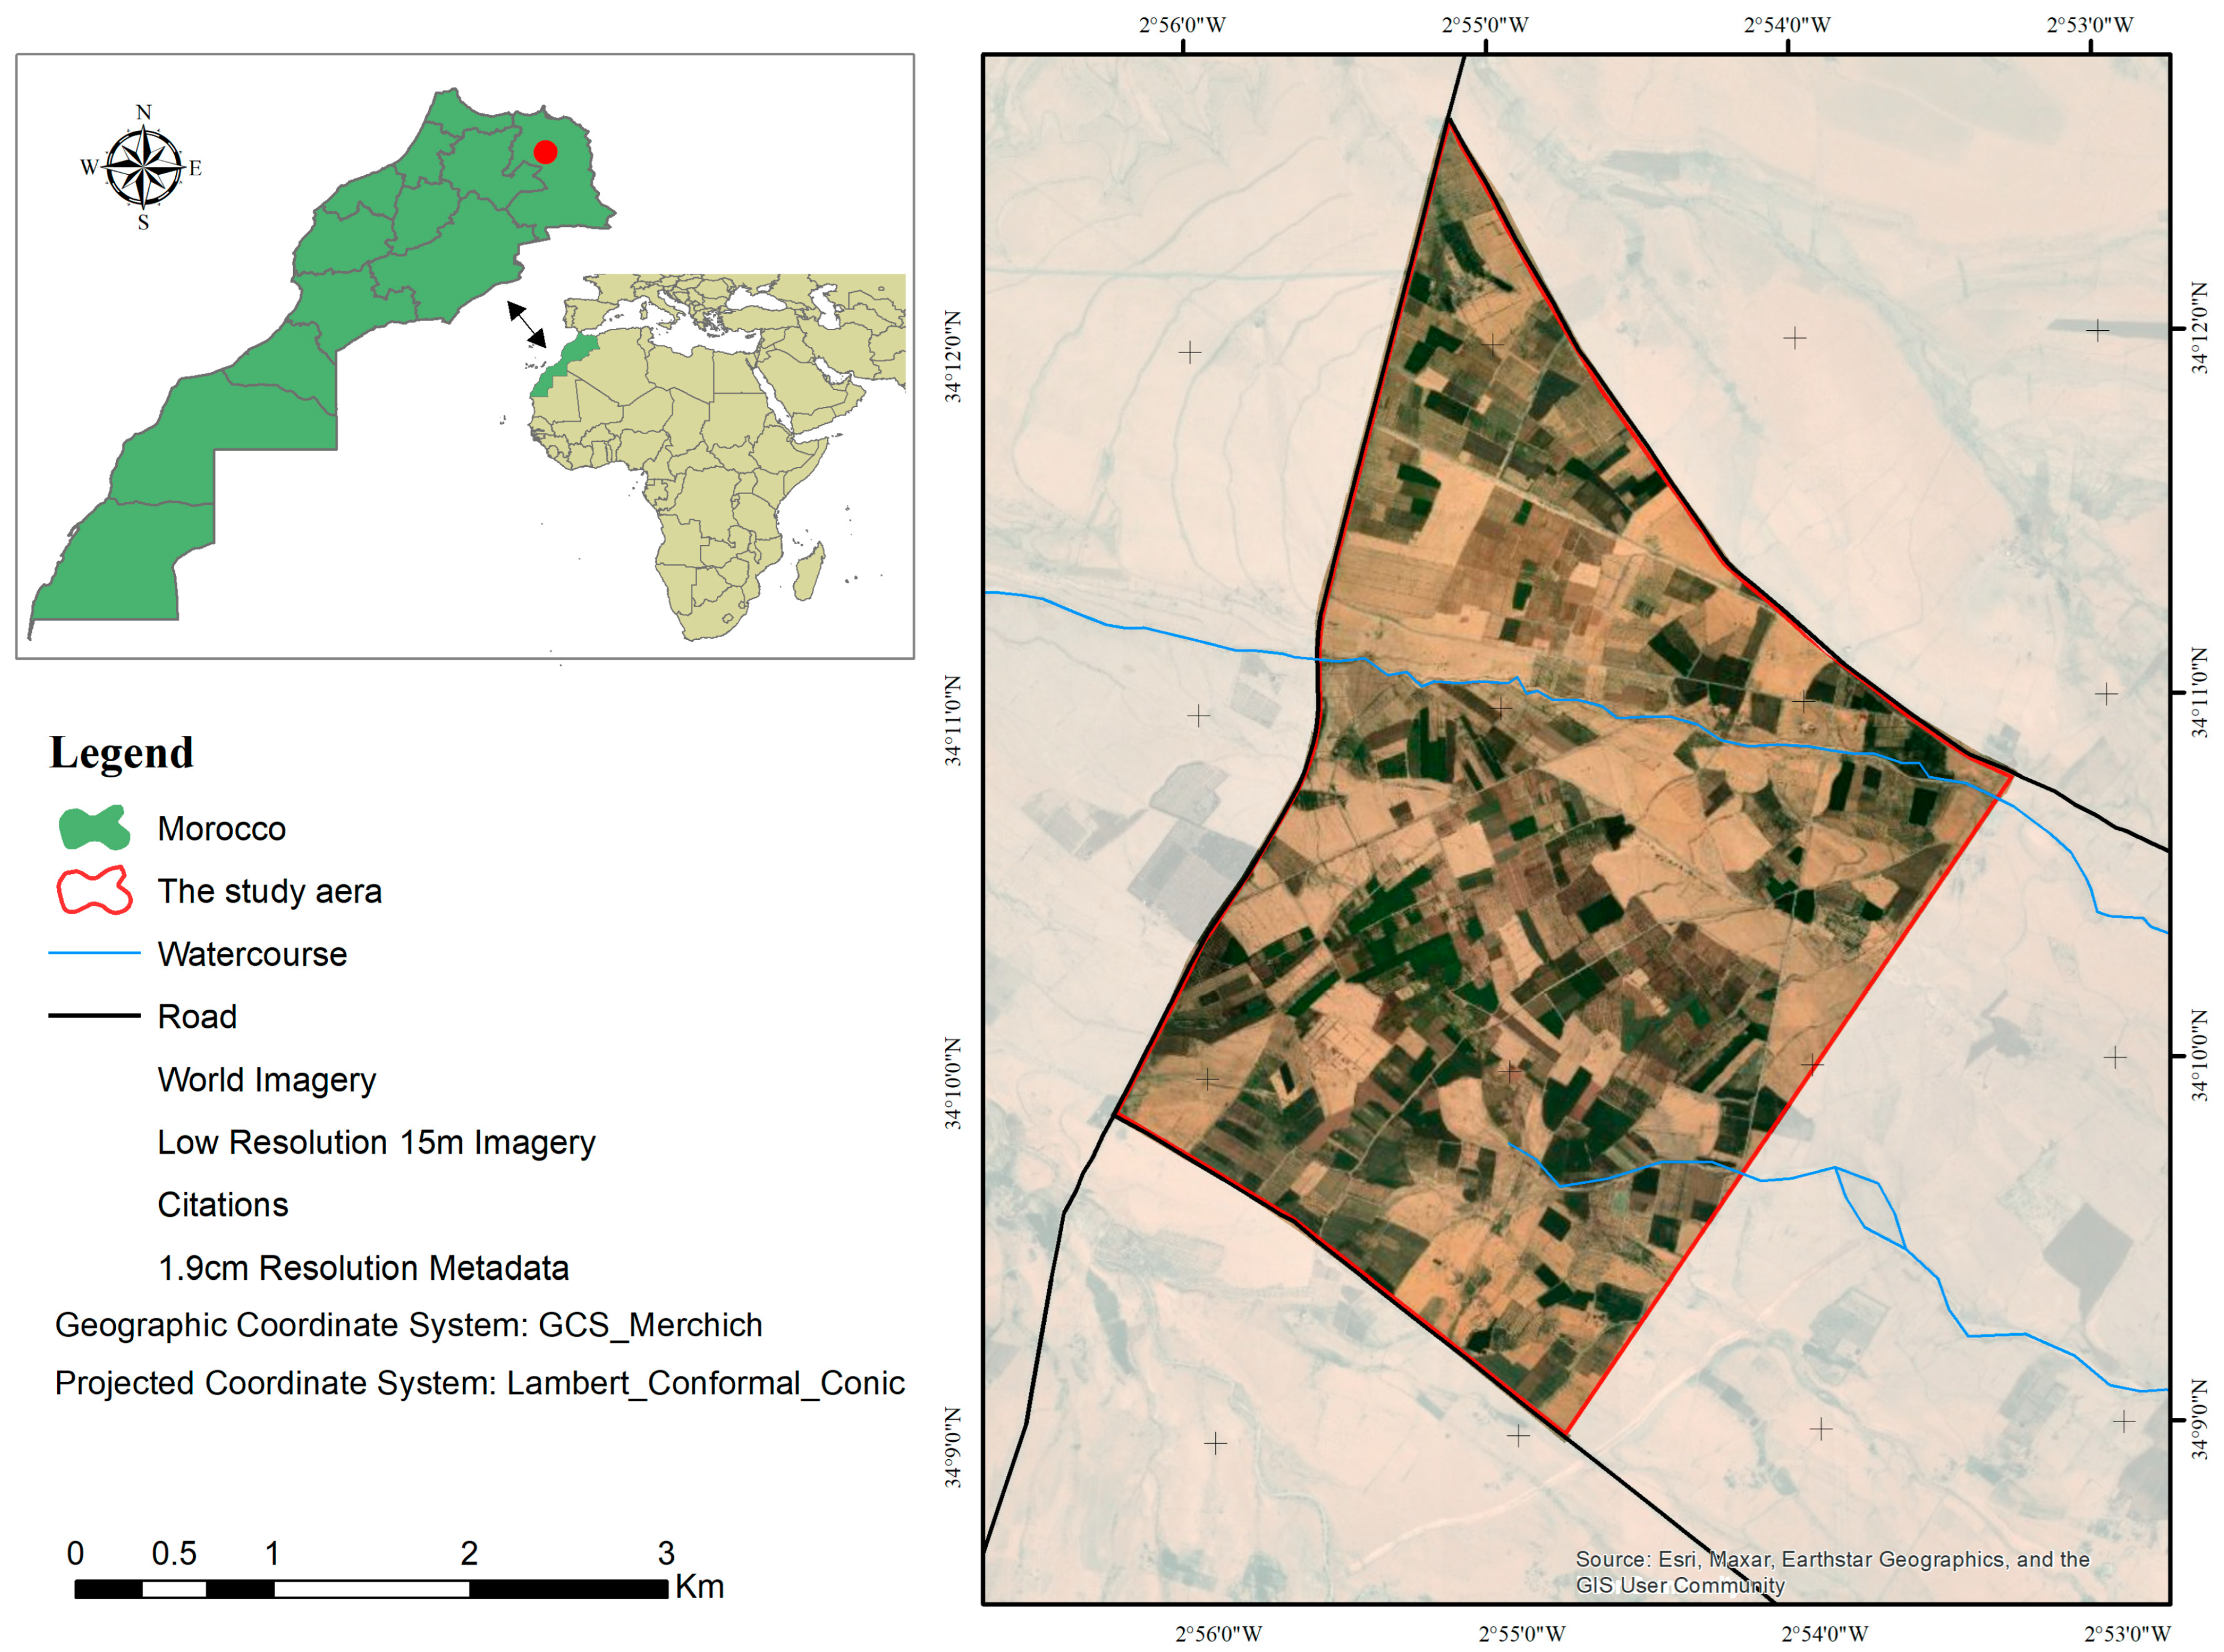
The study area is located in the province of Taourirt, in eastern Morocco (Figure 1). It covers an area of 1373 hectares divided into 387 plots, and forms part of the irrigated lands of the Tafrata plain. The water supply, estimated at 10 million cubic meters, comes from the dam on the Oued Za. This resource is conveyed through underground channels to a storage basin and then filtered in a dedicated station before being distributed throughout the perimeter for the irrigation of fruit, vegetables, and forage crops.
A particularly semi-arid climate characterizes the region. Summers are marked by very high temperatures reaching up to 48 °C, while winters experience low temperatures around 7 °C, accompanied by frost. Precipitation is scanty and irregular, not exceeding 310 mm per year. The wet period generally occurs in spring, although sometimes summer can see substantial precipitation, often in the form of violent and short-lived storms. Regional winds exacerbate the harshness of the climate, being strong and coming from the southwest. They manifest themselves mainly as sandstorms, blowing at an average speed of 30 km/h, and reaching up to 50 km/h. According to the World Reference Base for Soil Resources, the soils in the study area mainly correspond to Leptosols, Calcisols, and Phaeozems [15,16].

2.2. Sampling Protocols

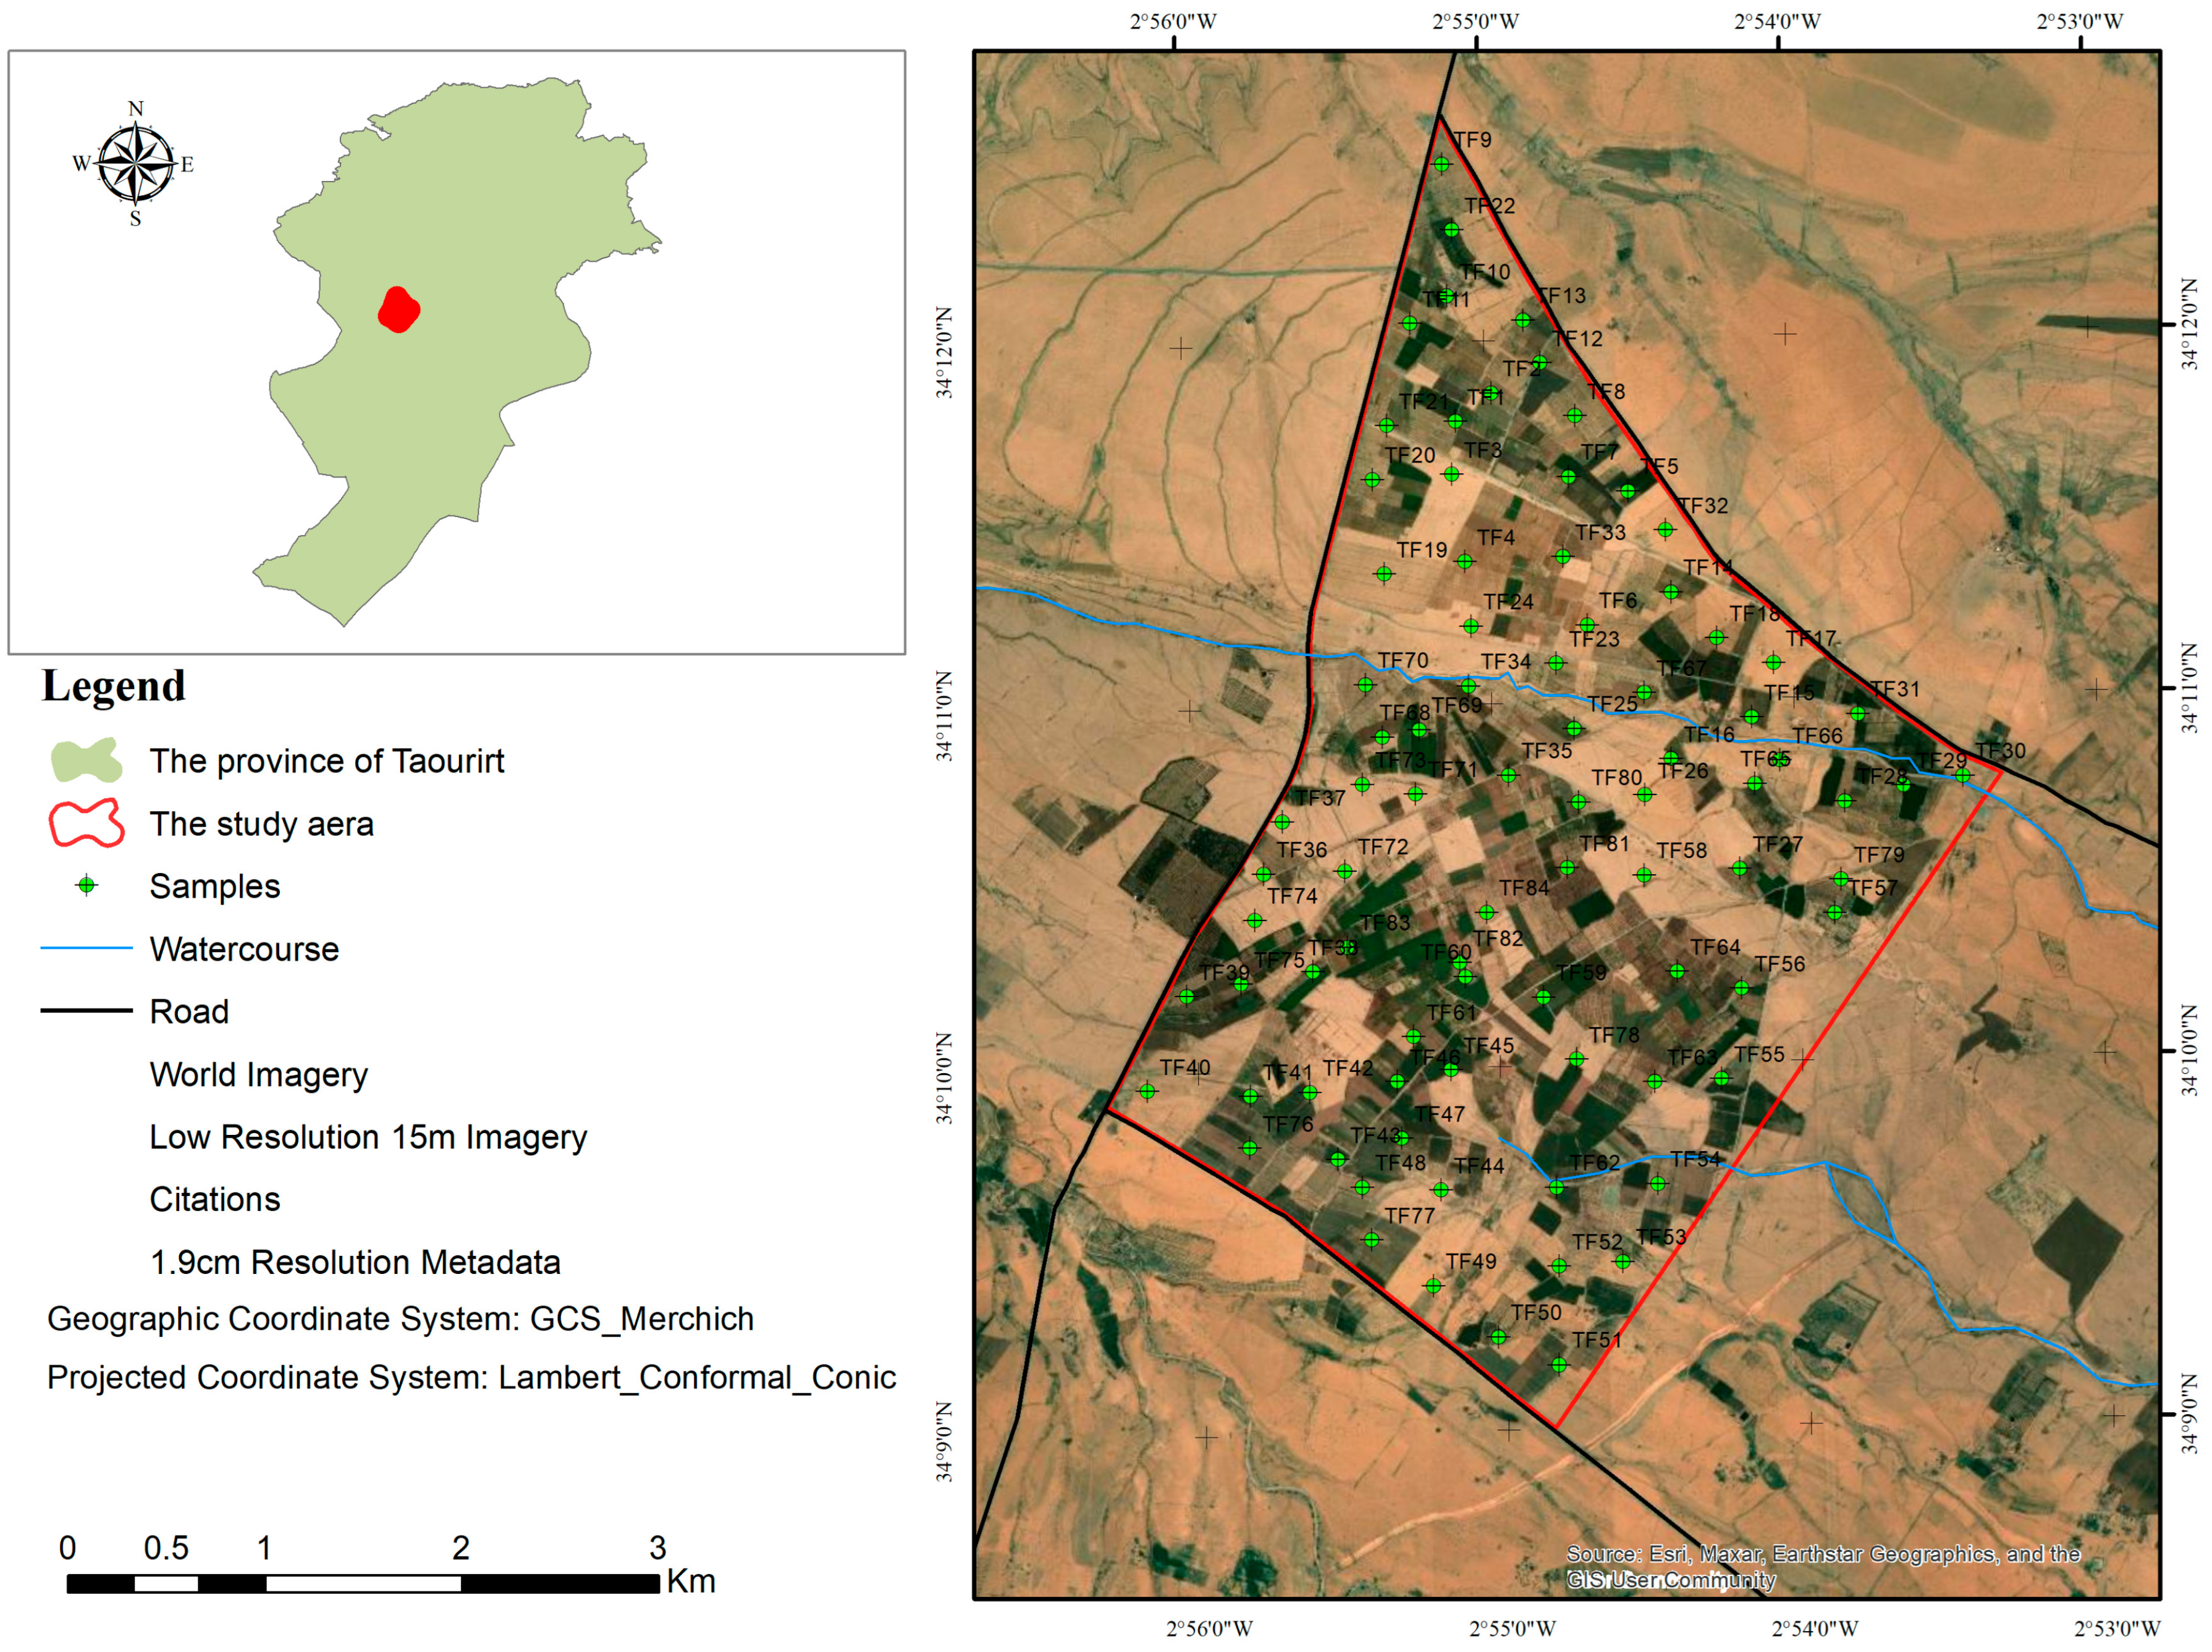
The methodological approach used aims to ensure adequate representation of the entire study area by strategically distributing sampling points. A systematic grid was established, consisting of rectangular cells of 25 hectares (500 m × 500 m). Each cell in this grid is assigned an observation point to cover the various soil types present in the plain. To ensure a comprehensive representation of the soils within the perimeter, samples were collected using a soil auger to a depth of 0–30 cm. For each sampling point, a composite average sample was created following the “ZigZag” method [17,18] collecting between 4 and 6 sub-samples. In cases where atypical areas were encountered, such as highly eroded surfaces or areas near roads, the sampling points were relocated to improve the accuracy of the plot representation, using GPS coordinates. Each soil sample was placed in a bag with a reference label (GPS coordinates, crops grown, altitude, etc.). This process resulted in the identification of 56 soil observation points according to the established ratio (Figure 2). Additionally, 28 points were randomly added to increase the network density. Thus, a total of 84 points were located on a thematic map, representing the different soil types within the TIP.

2.3. Soil Analyses

The samples were brought to the INRA Soil Science Laboratory (Agropole, Berkane, Morocco), where they were air-dried, ground using a mortar, and sieved to a particle size of 2 mm in accordance with the laboratory standard. They are then placed in plastic boxes on which the sample code and the sampling depth are noted. The estimation of organic matter is carried out based on the determination of organic carbon using the method [19], which consists of oxidizing organic carbon with potassium bichromate (K2Cr2O7) in the presence of sulfuric acid. The method for determining total carbonate content (TCC) is based on a volumetric analysis of carbon dioxide (CO2) released during the reaction between hydrochloric acid (HCl) and the various carbonate compounds present in the soil. By measuring the volume of carbon dioxide released following this reaction under the same temperature and pressure conditions, the amount of TCC present in the sample is evaluated according to [20]. The soil texture or granulometry was determined by sedimentation according to Stokes’ law [21] by classifying soil elements according to their size and determining the percentage of each fraction. The soil pH was measured using the potentiometric method [22] with a pH meter model PL-500 R, in a 1:2.5 soil-to-water suspension. Additionally, electrical conductivity (EC) (mS.cm−1) was measured by applying the saturated paste method [23] using a Cond 7110 conductivity meter. Available phosphorus is determined by the method [24] in which extraction is done by sodium hydrogen carbonate at a pH equal to 8.5. This method is based on the formation and reduction of a complex sulfomolybdic acid (sky blue coloration). A UV–visible spectrophotometer model T 60 U at a wavelength of 825 nm was used to read the phosphorus content. The content of available potassium forms was determined using an extraction with ammonium acetate (CH3COONH4) at a concentration of 1 mol∙dm−3 (1N) and a pH of 7 [22]. Its levels were determined using a flame photometer model CL 378. The determination of bulk density (Da) involves the insertion of a metal cylinder open at both ends into the soil [25], and then a sample is taken to dry at 105 °C for 24 h and weighed in the laboratory. The Da provides an overview of soil compaction, which is closely related to its porosity [26] and was calculated by dividing the dry mass obtained after drying by the volume of the sample [27]. The value of porosity was obtained by applying Equation (1) as exposed by [28,29].
P o r o s i t y % = ( 1 D a 2.65 ) × 100

2.4. Data Analysis

2.4.1. GIS Mapping and Spatial Interpolation

Progress in geographic information systems (GISs) and the integration of geostatistics into these platforms, as mentioned by [28,30], have significantly facilitated the rapid assessment of soil spatial variability and the creation of soil property maps [31]. These advancements have allowed, for example, the development of detailed thematic maps of all studied parameters of the Tafrata plain irrigated perimeter. The entry of analysis results into ArcGIS 10.8 software was followed by the application of the IDW (Inverse Distance Weighted) interpolation method. This technique, which assigns differentiated weights based on the proximity of points, resulted in the creation of a continuous raster surface [32]. The area of each class was calculated using the Reclassification tool from the Spatial Analyst toolbar, which allows for the reclassification of raster values.

2.4.2. Descriptive Statistics and Validation Methods

The variables under investigation were analyzed using descriptive statistics in SPSS 25. For each variable, key statistical indicators including minimum, maximum, mean, standard deviation, coefficient of variation (CV), and skewness were computed. In addition, boxplots were generated to visually assess data distribution and variability. Furthermore, the prediction points were validated using ArcGIS 10.8 through the Leave-One-Out Cross-Validation (LOOCV) method.

3. Results

3.1. Statistical Characterization of Soil Physicochemical Properties

The descriptive statistics presented in Table 1, along with the boxplot visualization in Figure 3, provide a comprehensive overview of the variability and distribution patterns of key soil physicochemical properties across the TIP. Parameters such as electrical conductivity (EC), available phosphorus (P2O5), exchangeable potassium (K2O), and salinity exhibit the highest standard deviations and coefficients of variation, indicating strong spatial heterogeneity. This variability is further evidenced in Figure 3 by the wider interquartile ranges and numerous outliers, particularly for K2O and EC, which suggest localized enrichment or leaching zones possibly influenced by irrigation practices, fertilizer input variability, or texture-related retention capacity. While most soil properties show kurtosis and skewness values near zero, consistent with a normal distribution, EC and salinity present positive kurtosis and moderate positive skewness, indicating peaked and asymmetric distributions dominated by a few high-concentration zones. These observations are statistically supported by the Shapiro–Wilk normality test, where most variables show p-values > 0.05, confirming normality. However, EC and salinity displayed p-values < 0.05, indicating non-normal behavior. This deviation is largely driven by two extreme values (samples TF76 and TF83), which exceeded 5 mS/cm, while most samples ranged between 0 and 0.6 mS/cm. Given that these values represent real field conditions rather than measurement errors, we retained them in the analysis as they reflect localized salinization hotspots within the TIP. Consequently, the statistical interpretation of EC and salinity was complemented with non-parametric considerations and mapped visualization, ensuring that their heterogeneity and agronomic implications were adequately captured. In contrast, parameters such as pH, organic matter (OM), TCC, and porosity are more stable across the study area, as seen in their tight boxplot ranges and lower variability indices. Notably, OM shows low median values, highlighting a regional deficiency that may impair soil structure, microbial activity, and nutrient retention. The integrated use of statistical metrics and boxplot visualization thus reveals both general trends and specific anomalies, underscoring the necessity of spatially differentiated soil management strategies to address fertility imbalances and mitigate salinity risks within the TIP.

3.2. Soil Texture and Types

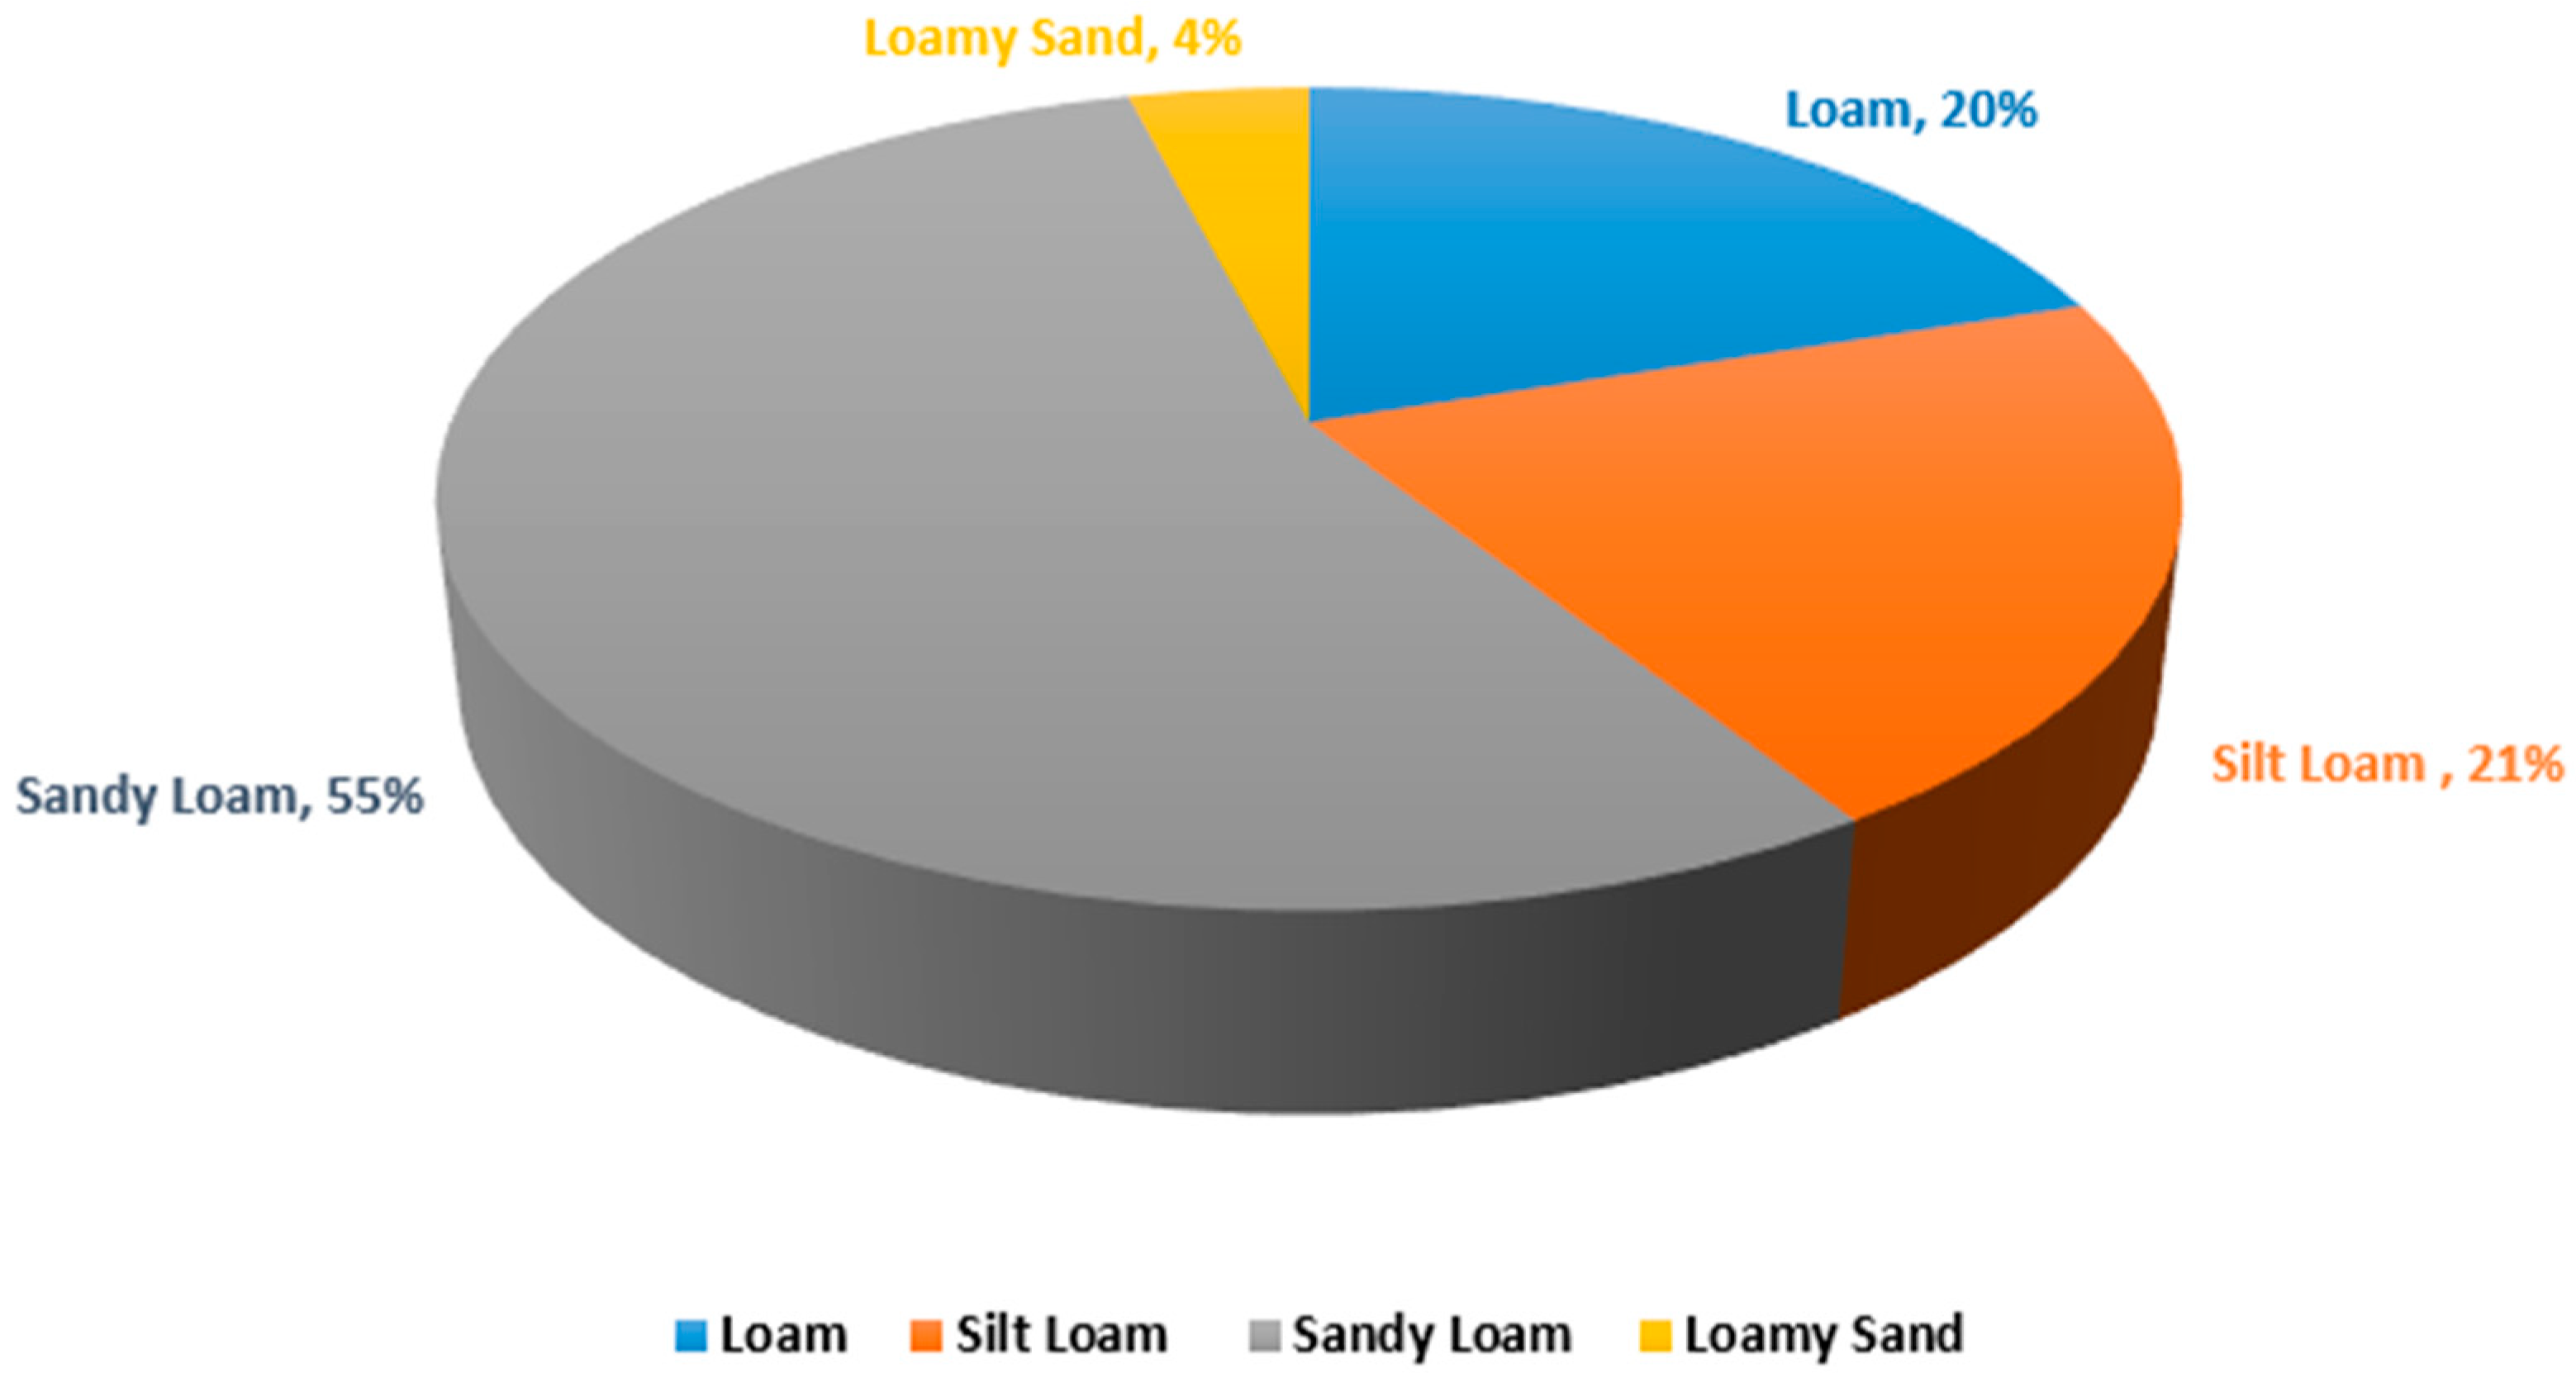
According to the USDA system of soil texture triangle, the predominant soil texture in the study area is sandy loam, which constitutes 55% of the total area. These soils are known for their high drainage capacity, which, while beneficial for preventing waterlogging, results in poor water retention. This property can lead to potential issues with plant nutrition and, in extreme cases, may contribute to plant mortality. Consequently, sandy loam soils require regular fertilization and irrigation to support healthy plant growth. The granulometric analysis results for the surface horizon are shown in Figure 4.

3.3. Bulk Density

The average bulk density of the soil is 1.31 g/cm3, with the lowest value of 1.07 g/cm3 recorded at station TF60, indicating relatively lower compactness. In contrast, stations TF46, TF58, and TF78 exhibit the highest levels of compaction, with values exceeding 1.50 g/cm3. These sites are uncultivated lands where plowing has not been practiced for a long time and are occasionally used as passageways for heavy machinery, which reduces soil porosity and increases particle compaction. Porosity ranged from 34.32% to 58.46%, averaging 49.32%, with lower values in loamy sand due to coarse texture and higher values in soils under natural vegetation or recent tillage. These variations are key for water, gas movement, and root development [29].

3.4. Electrical Conductivity

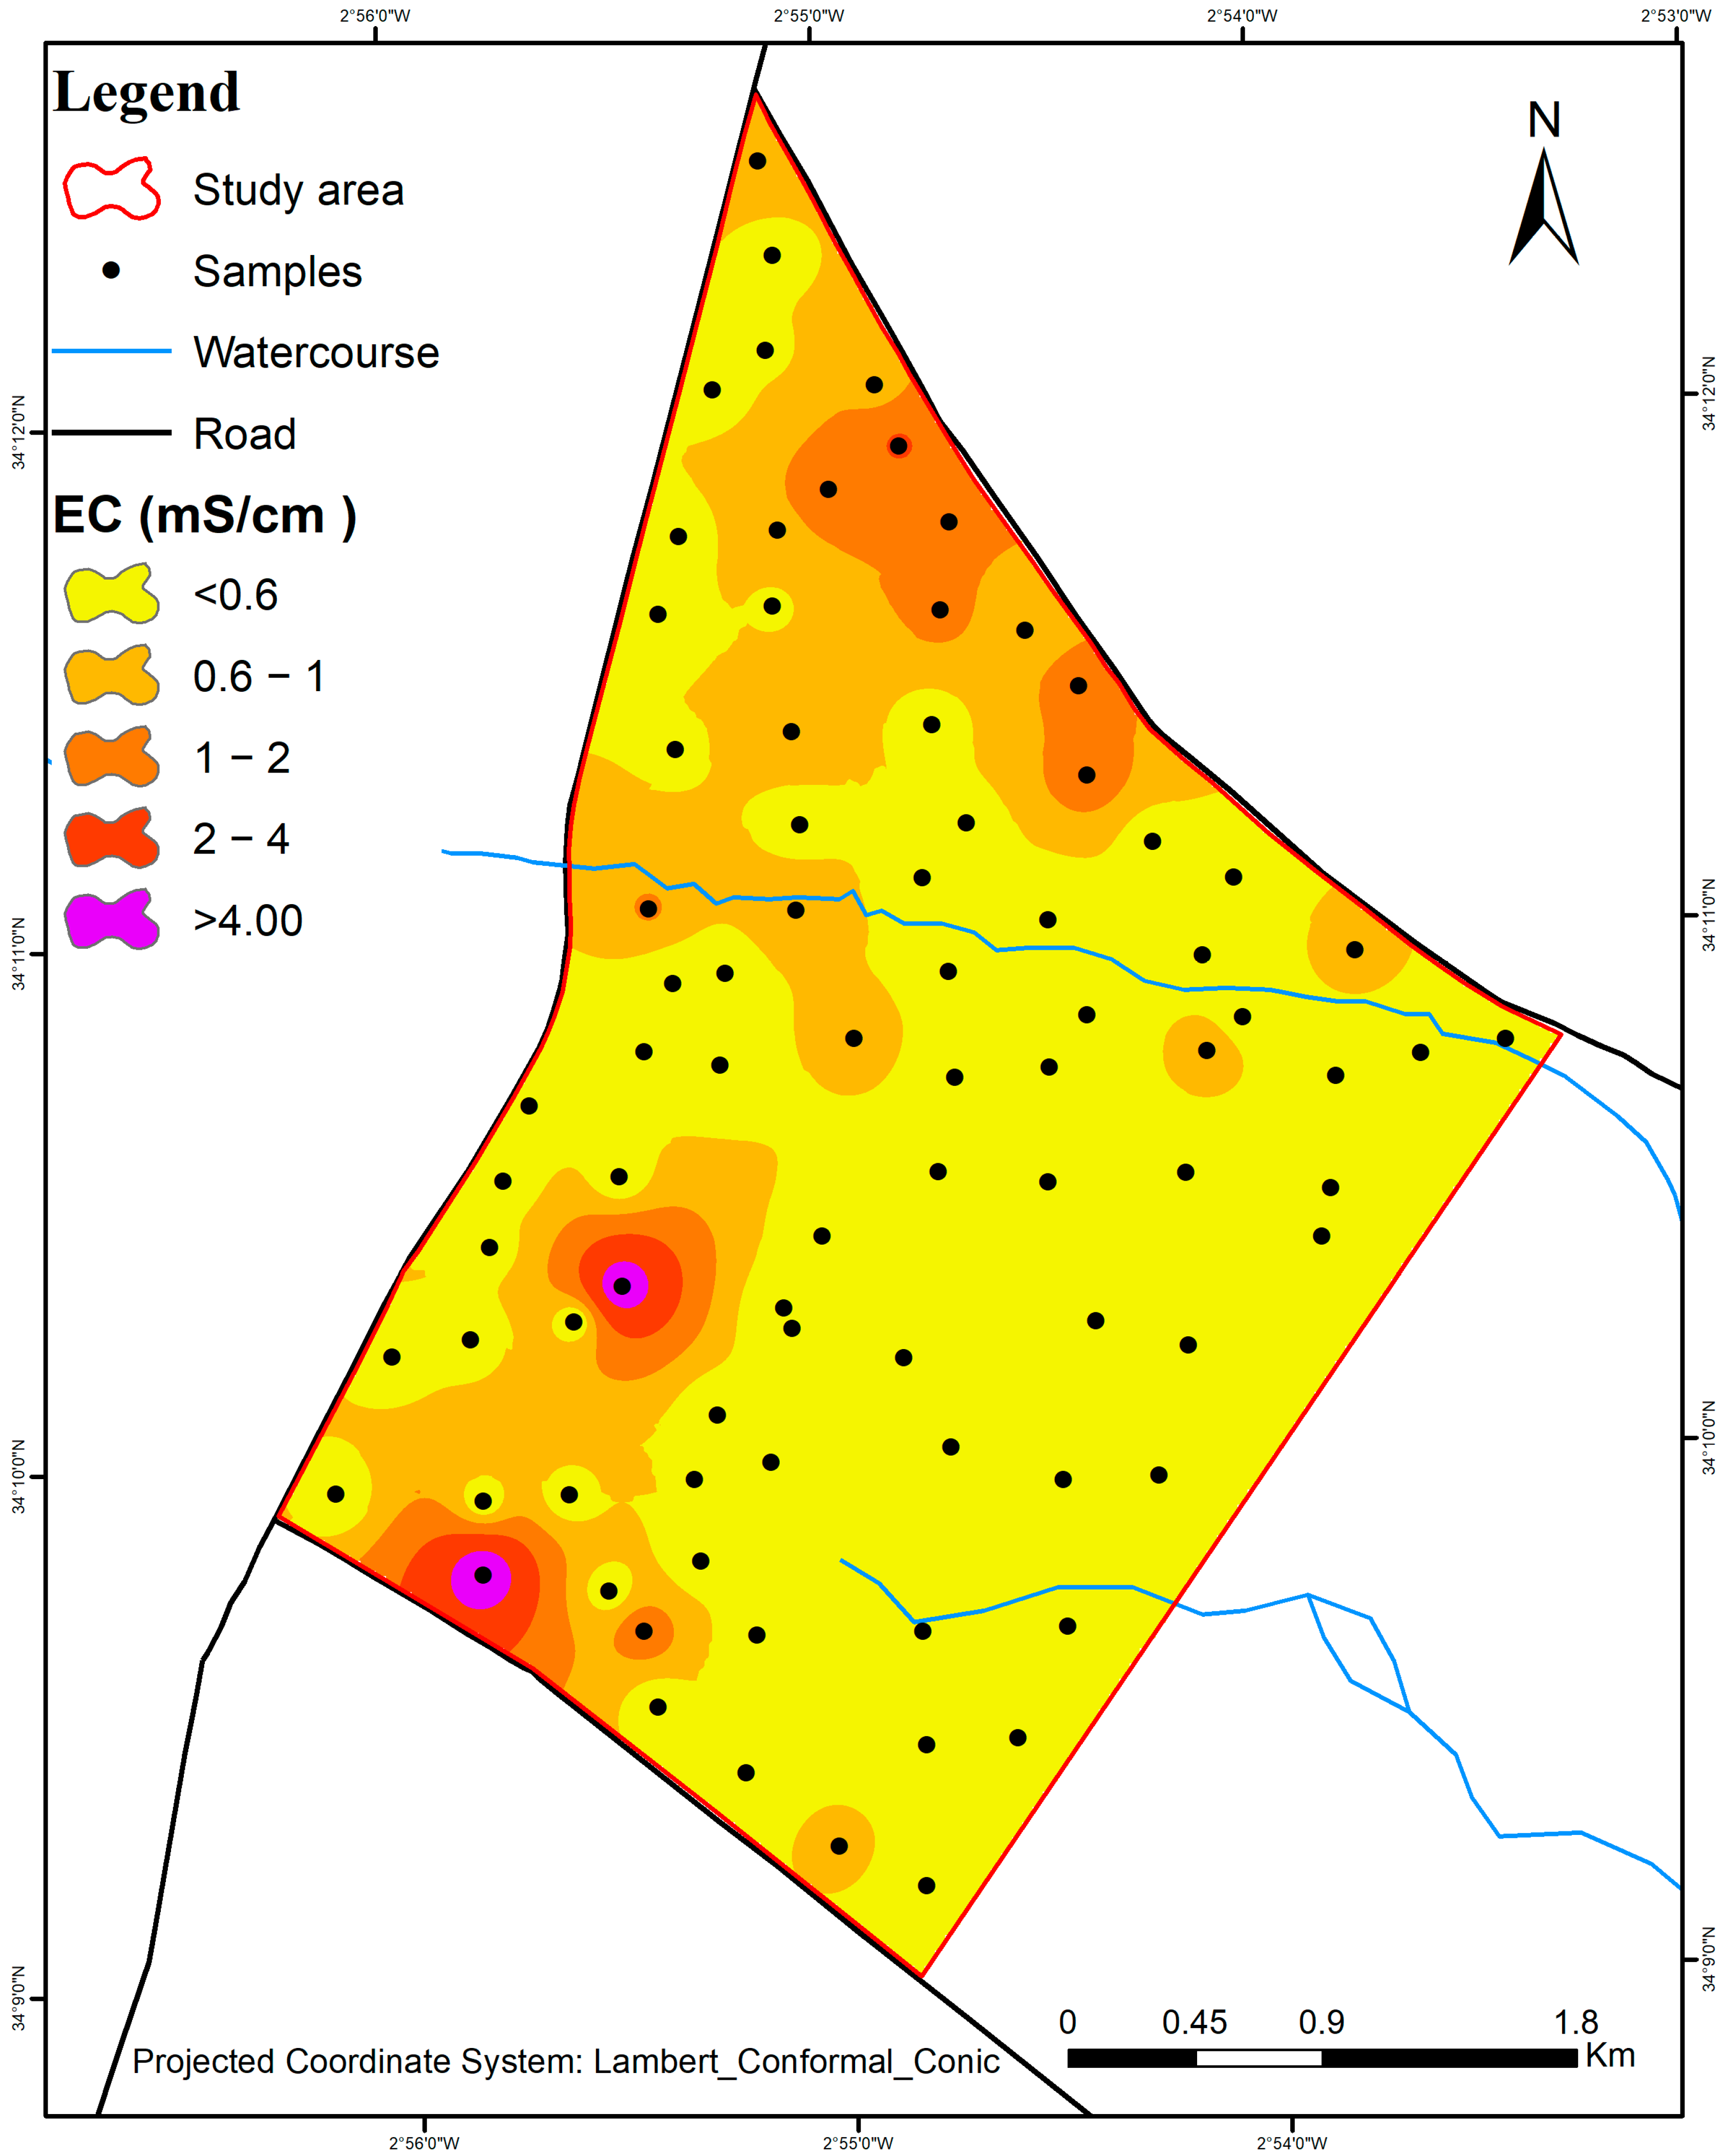
The analysis of soil Electrical Conductivity (EC) in the 0–30 cm horizon of the studied plots (Figure 5) indicated that salinity does not represent a major threat to soil degradation. The EC values ranged from 0.1 to 5.57 mS/cm, with an average of 0.53 mS/cm (Table 1). While most samples exhibited low salinity levels (<0.6 mS/cm), two samples exceeded 4 mS/cm (Table 2), reflecting localized salinity anomalies. These outliers significantly affected the cross-validation performance. When the two high-salinity samples were included, the LOOCV results yielded RMSE = 0.906, MAE = 0.469, and R2 = 0.00014. In contrast, excluding these samples considerably improved the validation metrics, with RMSE = 0.352, MAE = 0.236, and R2 = 0.221.

3.5. pH

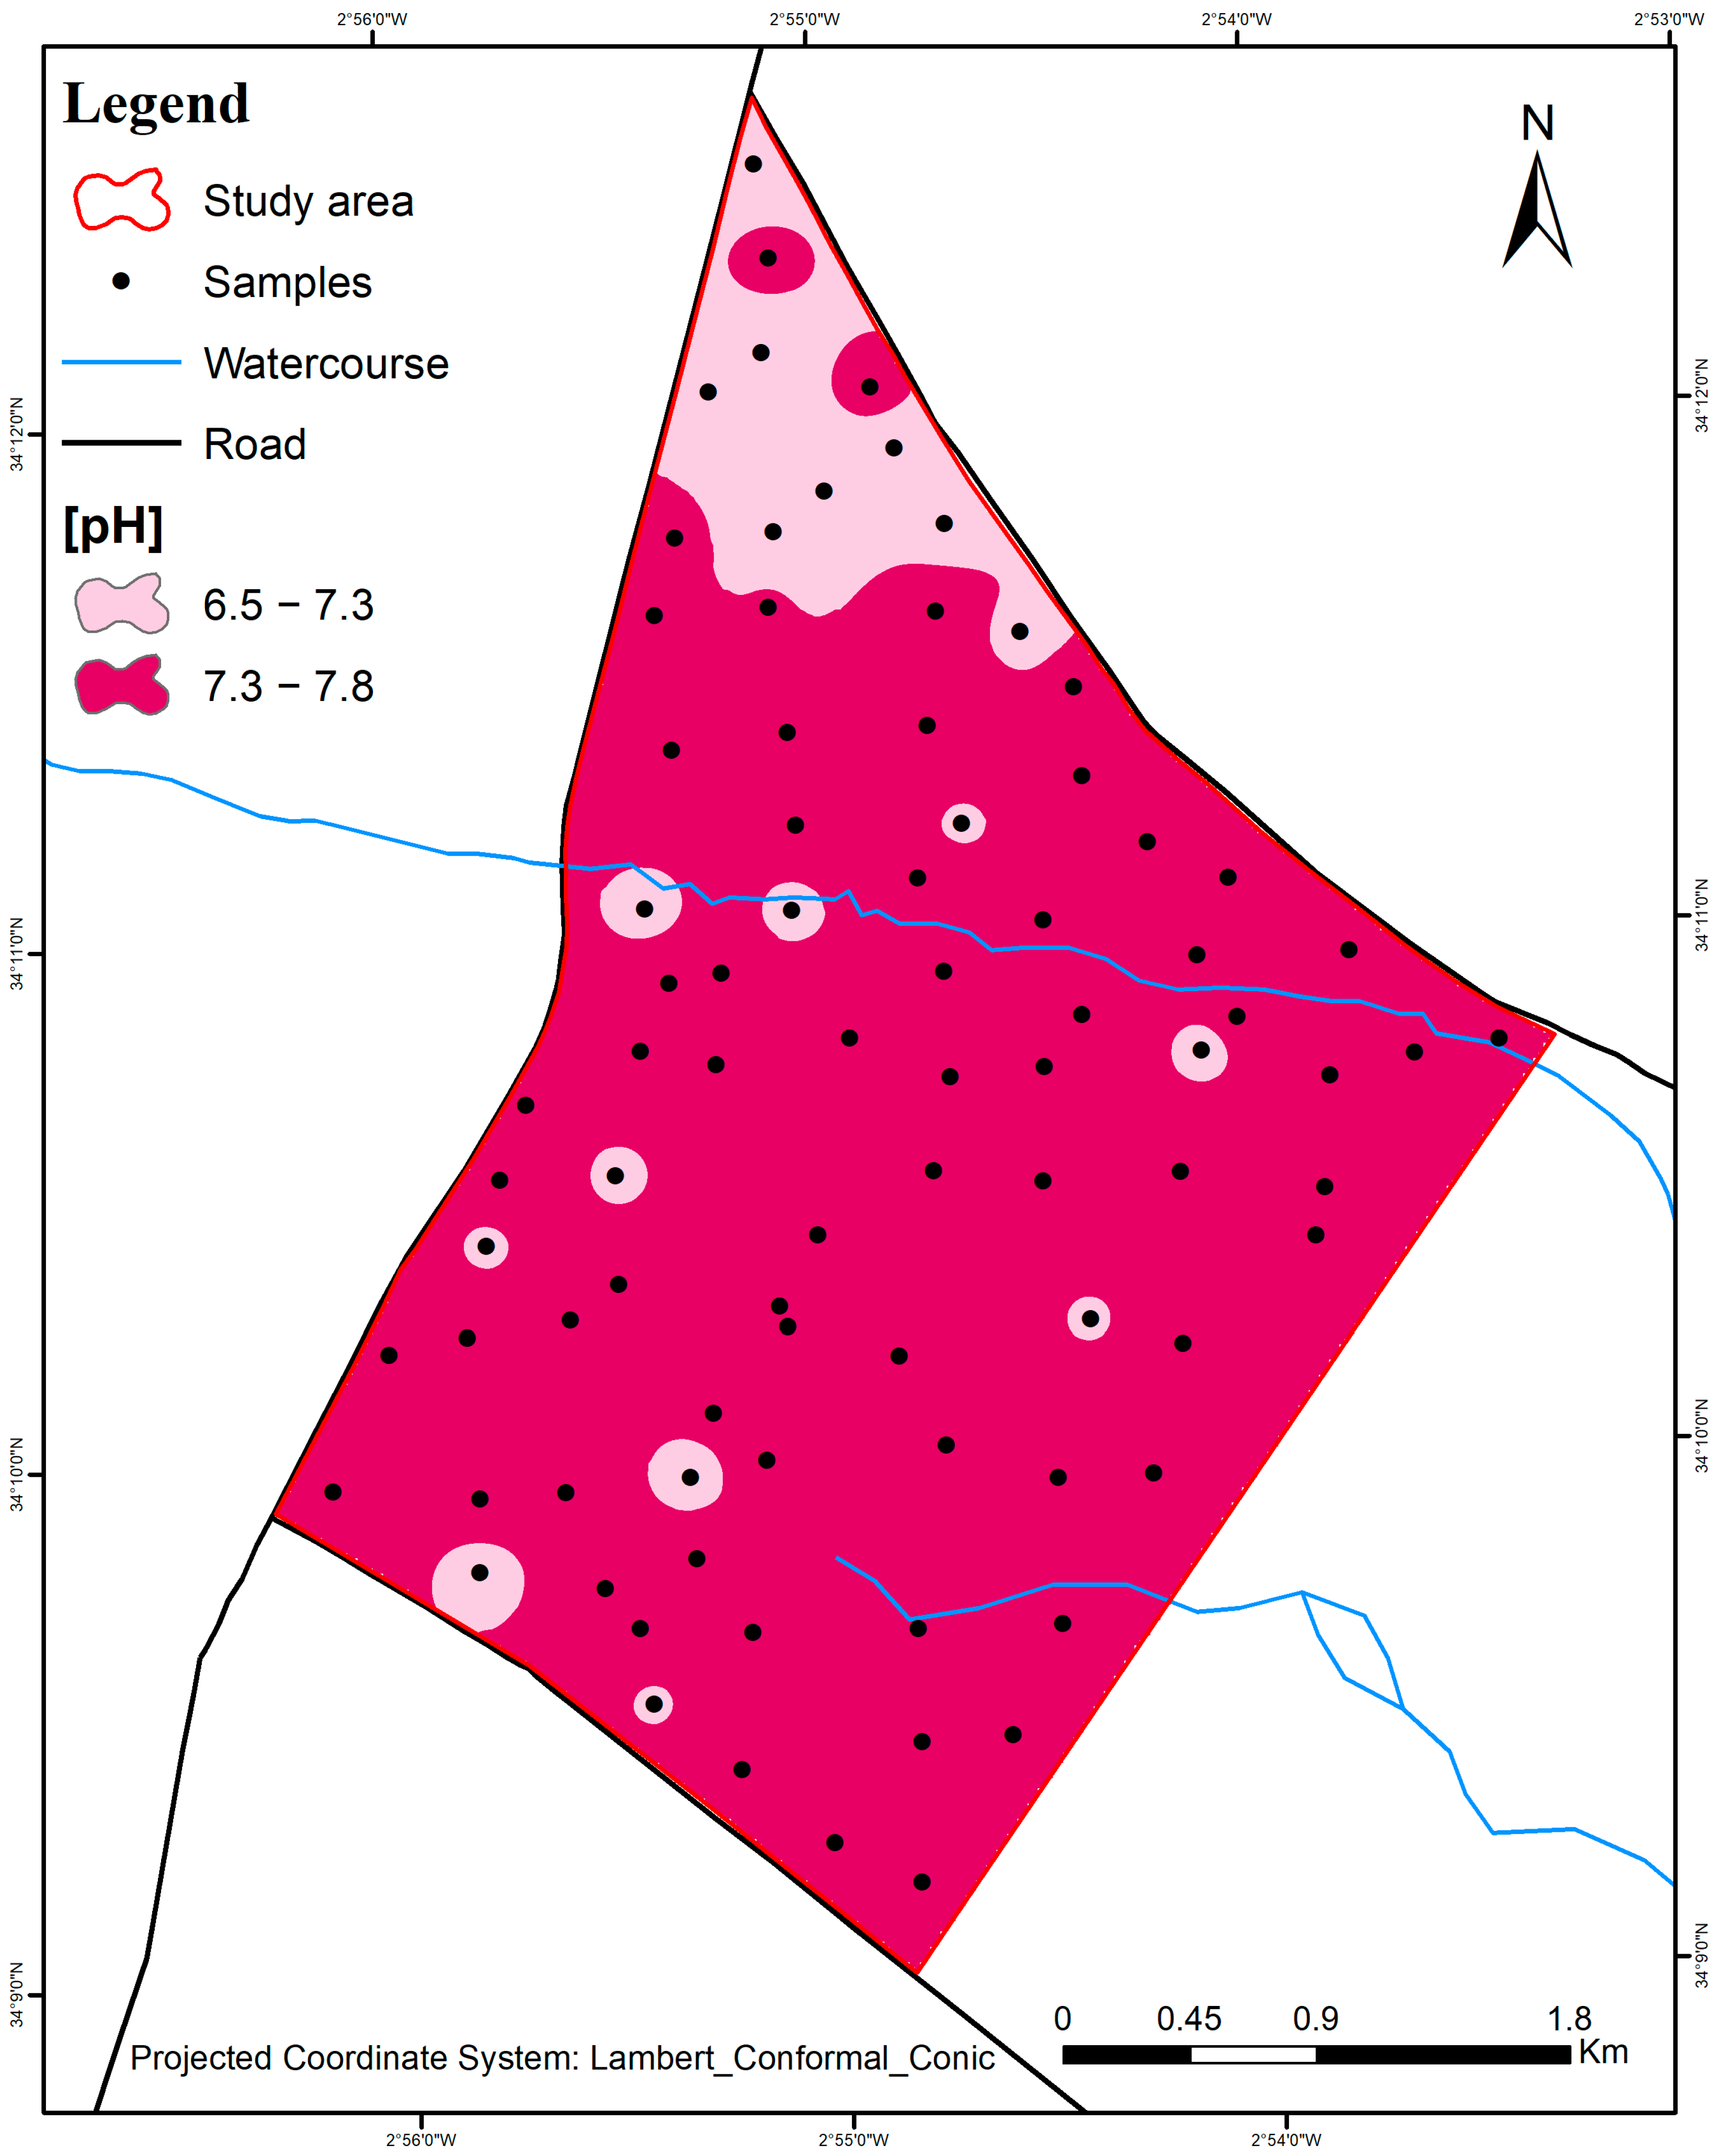
The results of the pH analysis in the 0–30 cm soil horizon (Figure 6) show that most of the studied soils (76%) have a weakly alkaline pH, while 24% are neutral according to standard soil acidity tables (Table 3). The pH values ranged from 7.01 to 7.78, with an average of 7.41 (Table 1). The cross-validation results yielded RMSE = 0.173, MAE = 0.141, and R2 = 0.091.

3.6. Total Carbonate Content

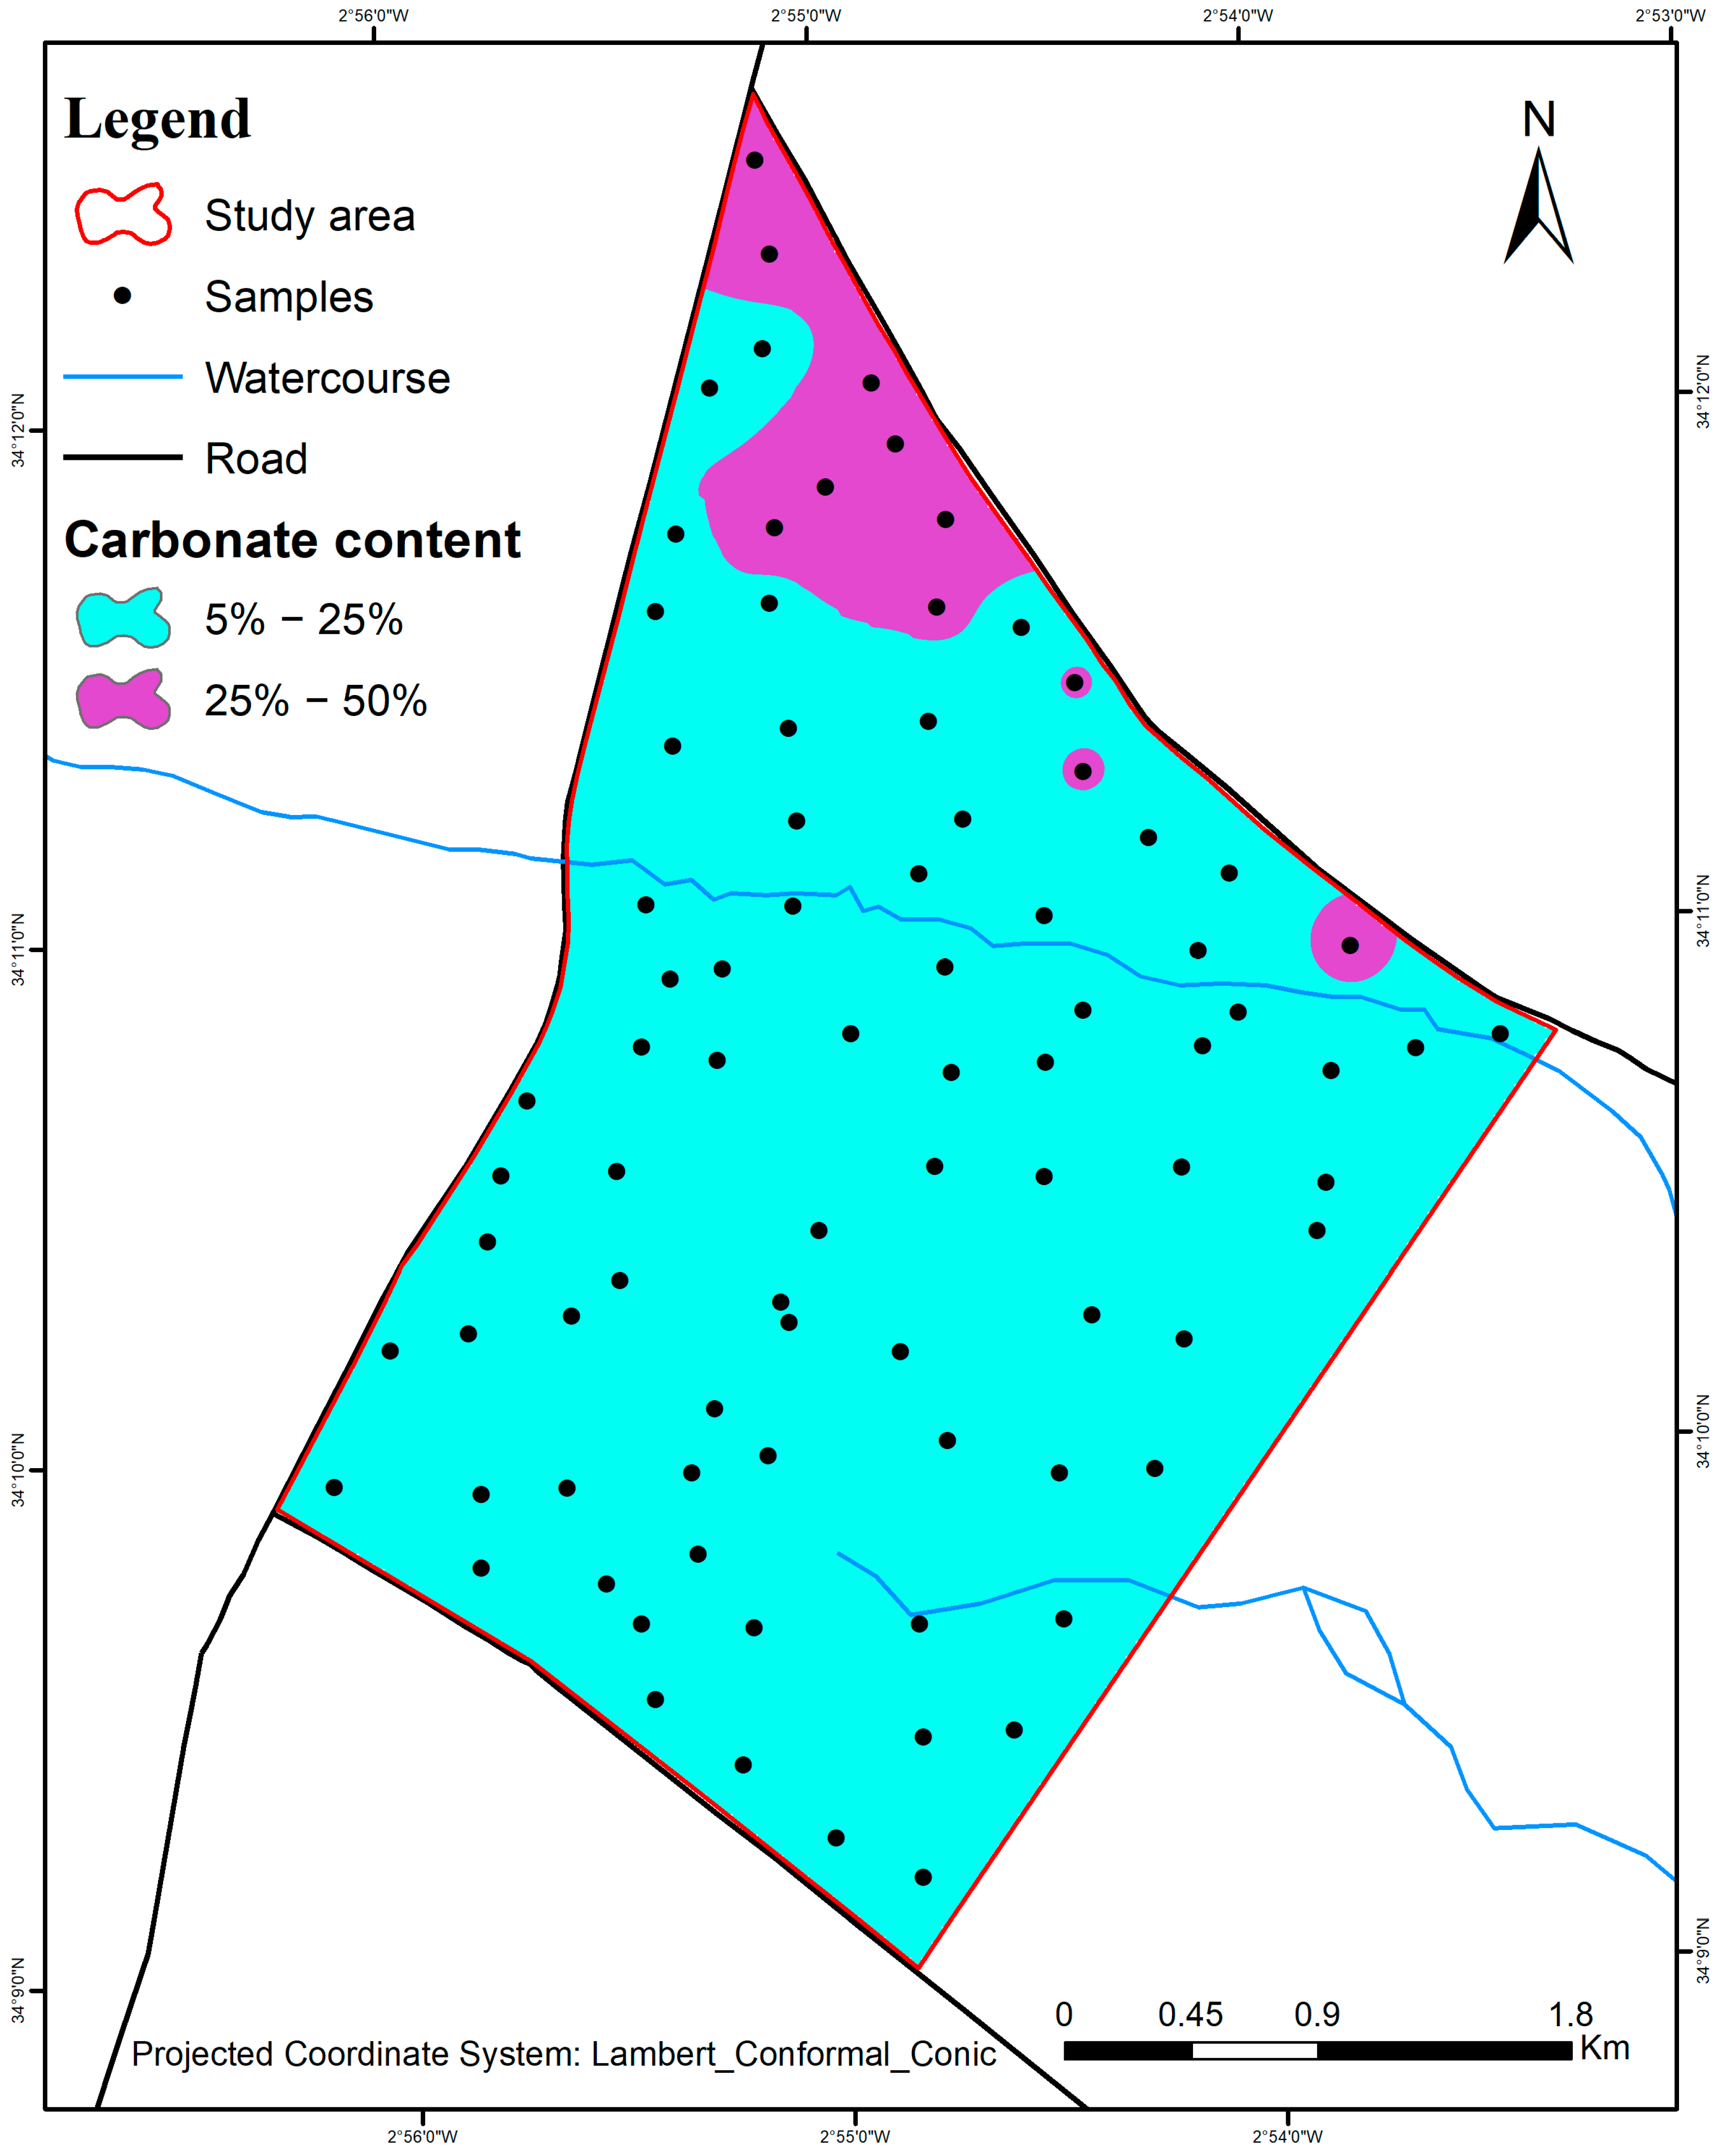
The TCC of the soil ranges from 11.16% to 32.74%, corresponding to 111.6 to 327.4 g·kg−1, with an average value of 190 g·kg−1 (Table 1). This represents the fraction of coarse elements (stones, gravels, sands, loams) composed predominantly of carbonates. The presence of superficial carbonates is confirmed in the study area, where the majority of surface soils (87%) are moderately calcareous (Table 4). An increase in carbonate content is also observed in the northeastern part of the area, where 13% of the soils reach the threshold of strongly calcareous soils (Figure 7). The performance of IDW, as assessed by cross-validation, was characterized by RMSE = 3.683, MAE = 2.853, and R2 = 0.409.

3.7. Available Phosphorus

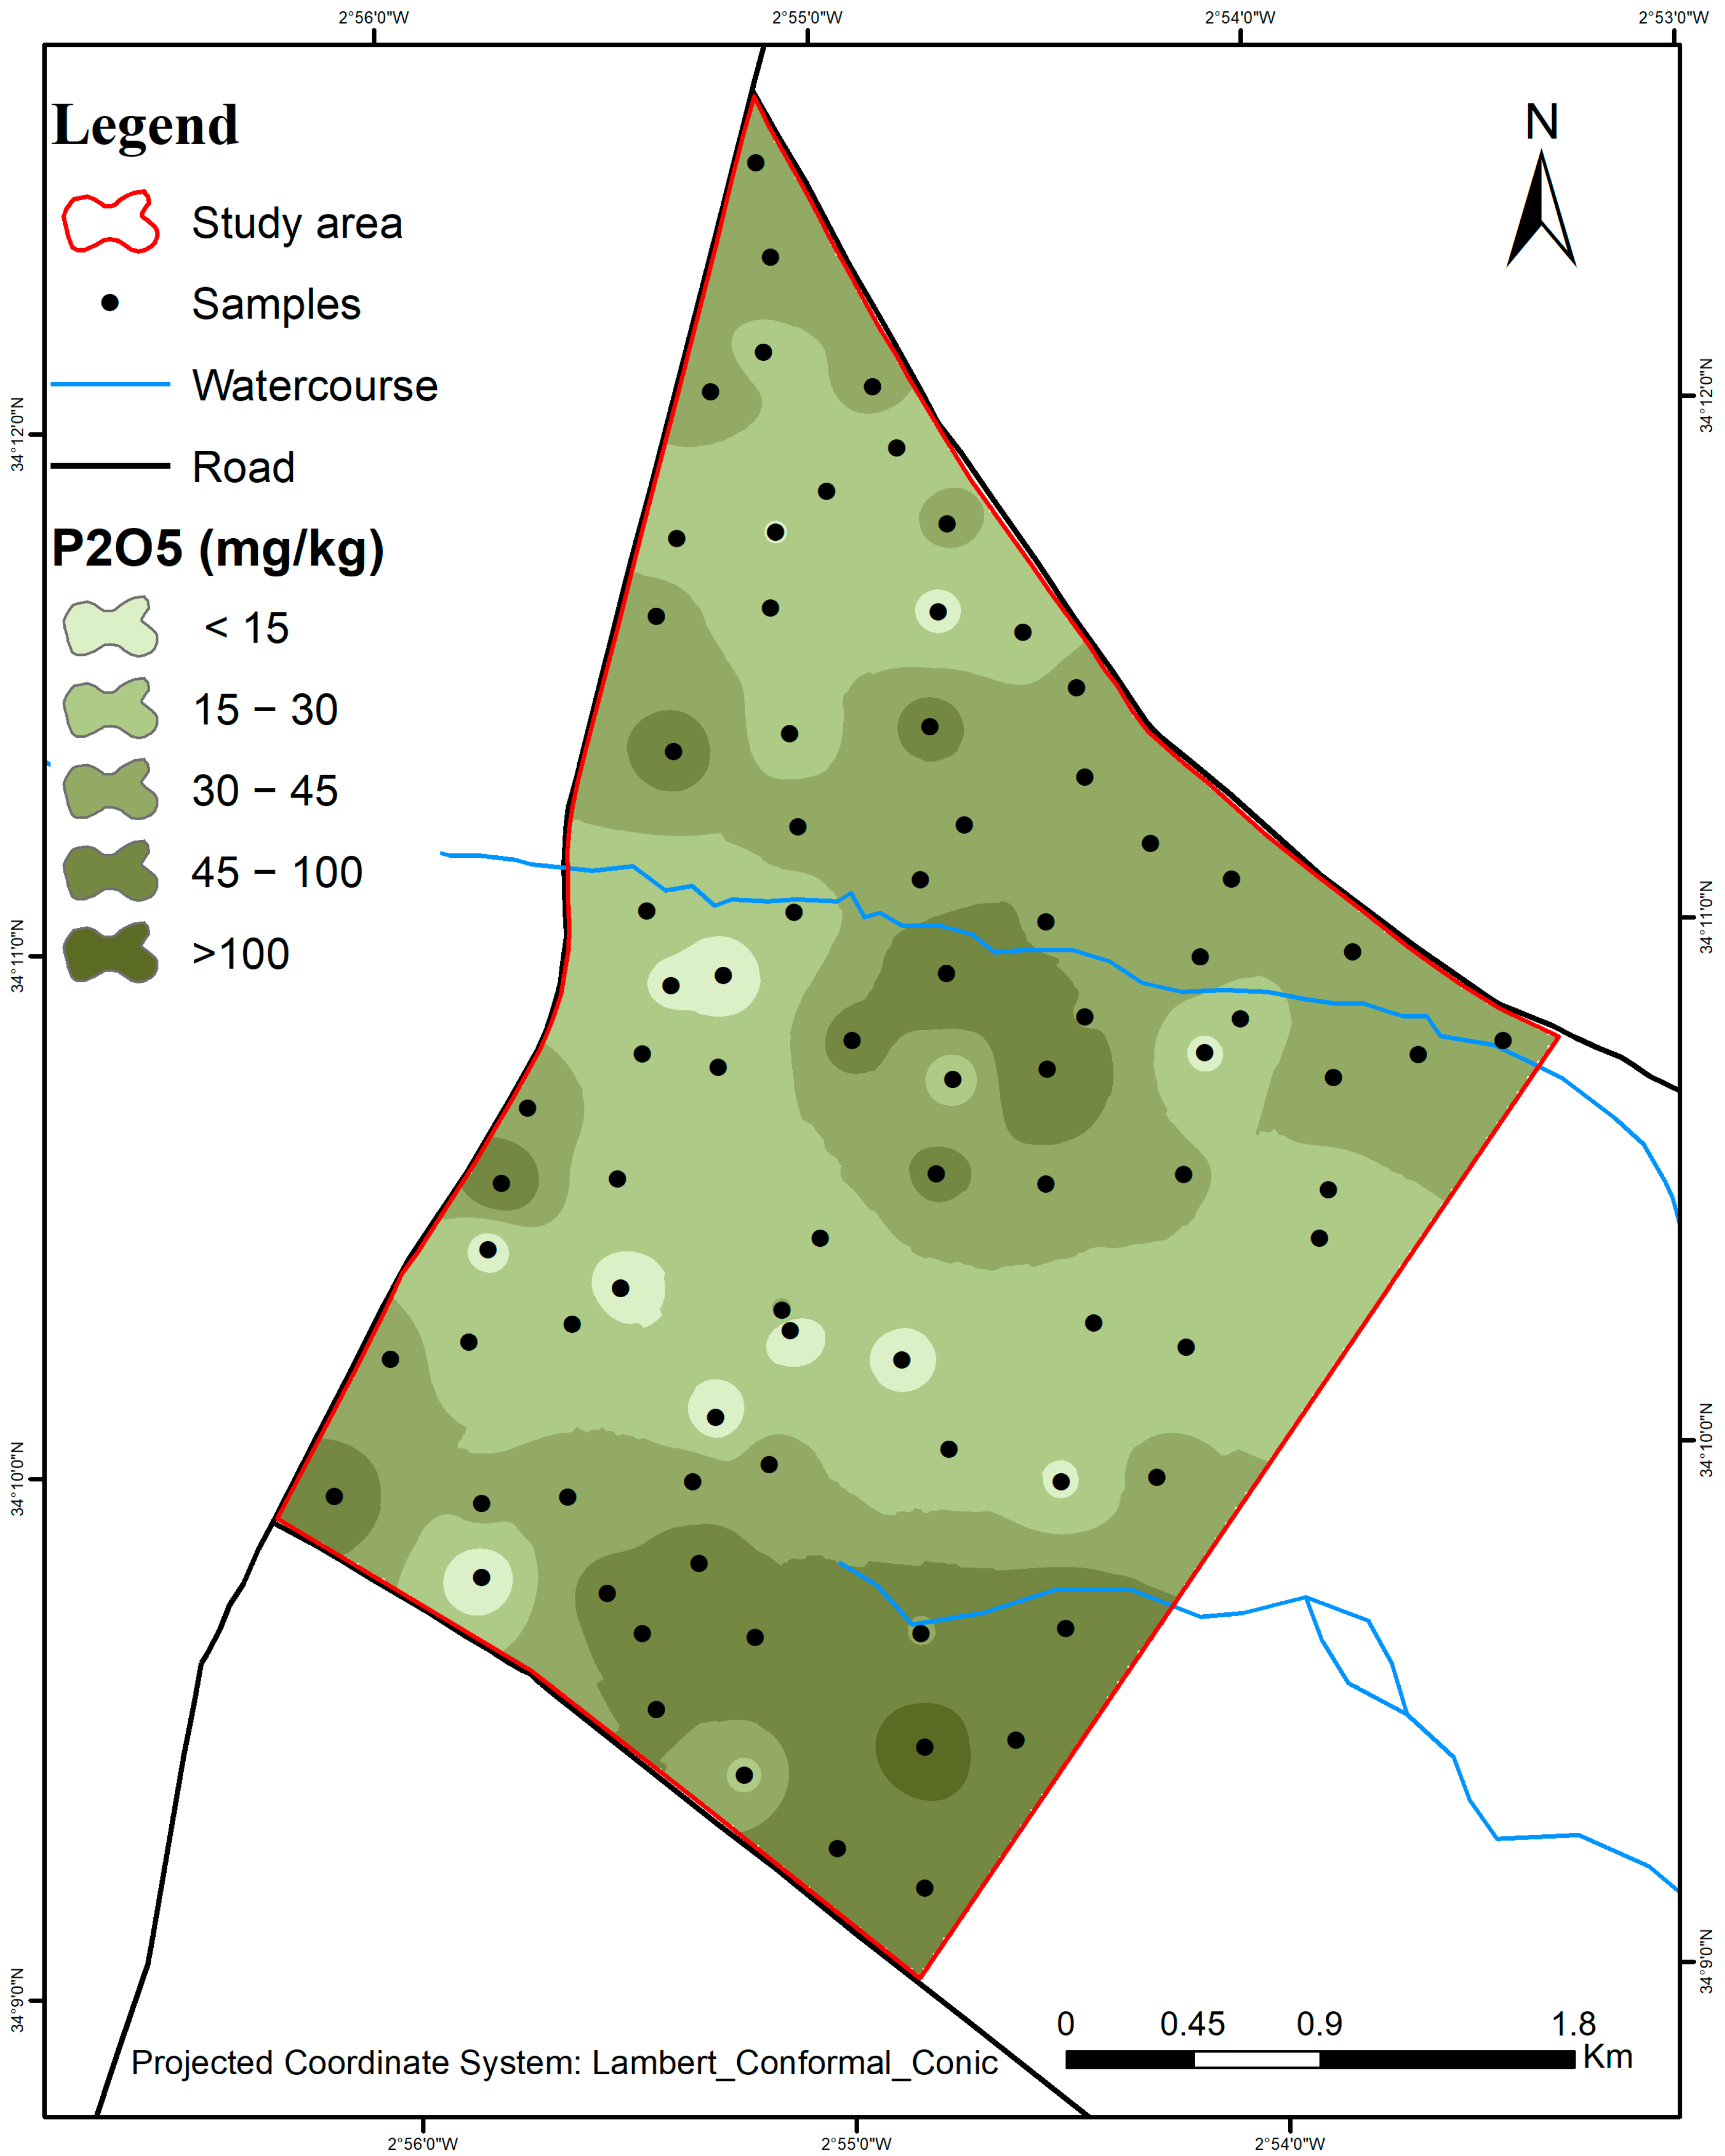
The analysis of available phosphorus (AP) in the studied soil samples reveals concentrations ranging from 0.08 to 147.24 mg/kg, with an average value of 35.23 mg/kg (Table 1). According to the AP classification standards of Delaunois et al. (2008) [37], a clear differentiation is observed within the perimeter (Figure 8). Specifically, 23% of the soil samples are classified as high, 35% as medium, 26% as low, and 15% as very low in terms of AP content (Table 5). According to the cross-validation test, the model performance indicators were RMSE = 18.551, MAE = 12.818, and R2 = 0.268.
Figure 7. Map of carbonate Content in the Soils of TIP According to Standardized Methods.
Geographies 05 00066 g007

3.8. Exchangeable Potassium

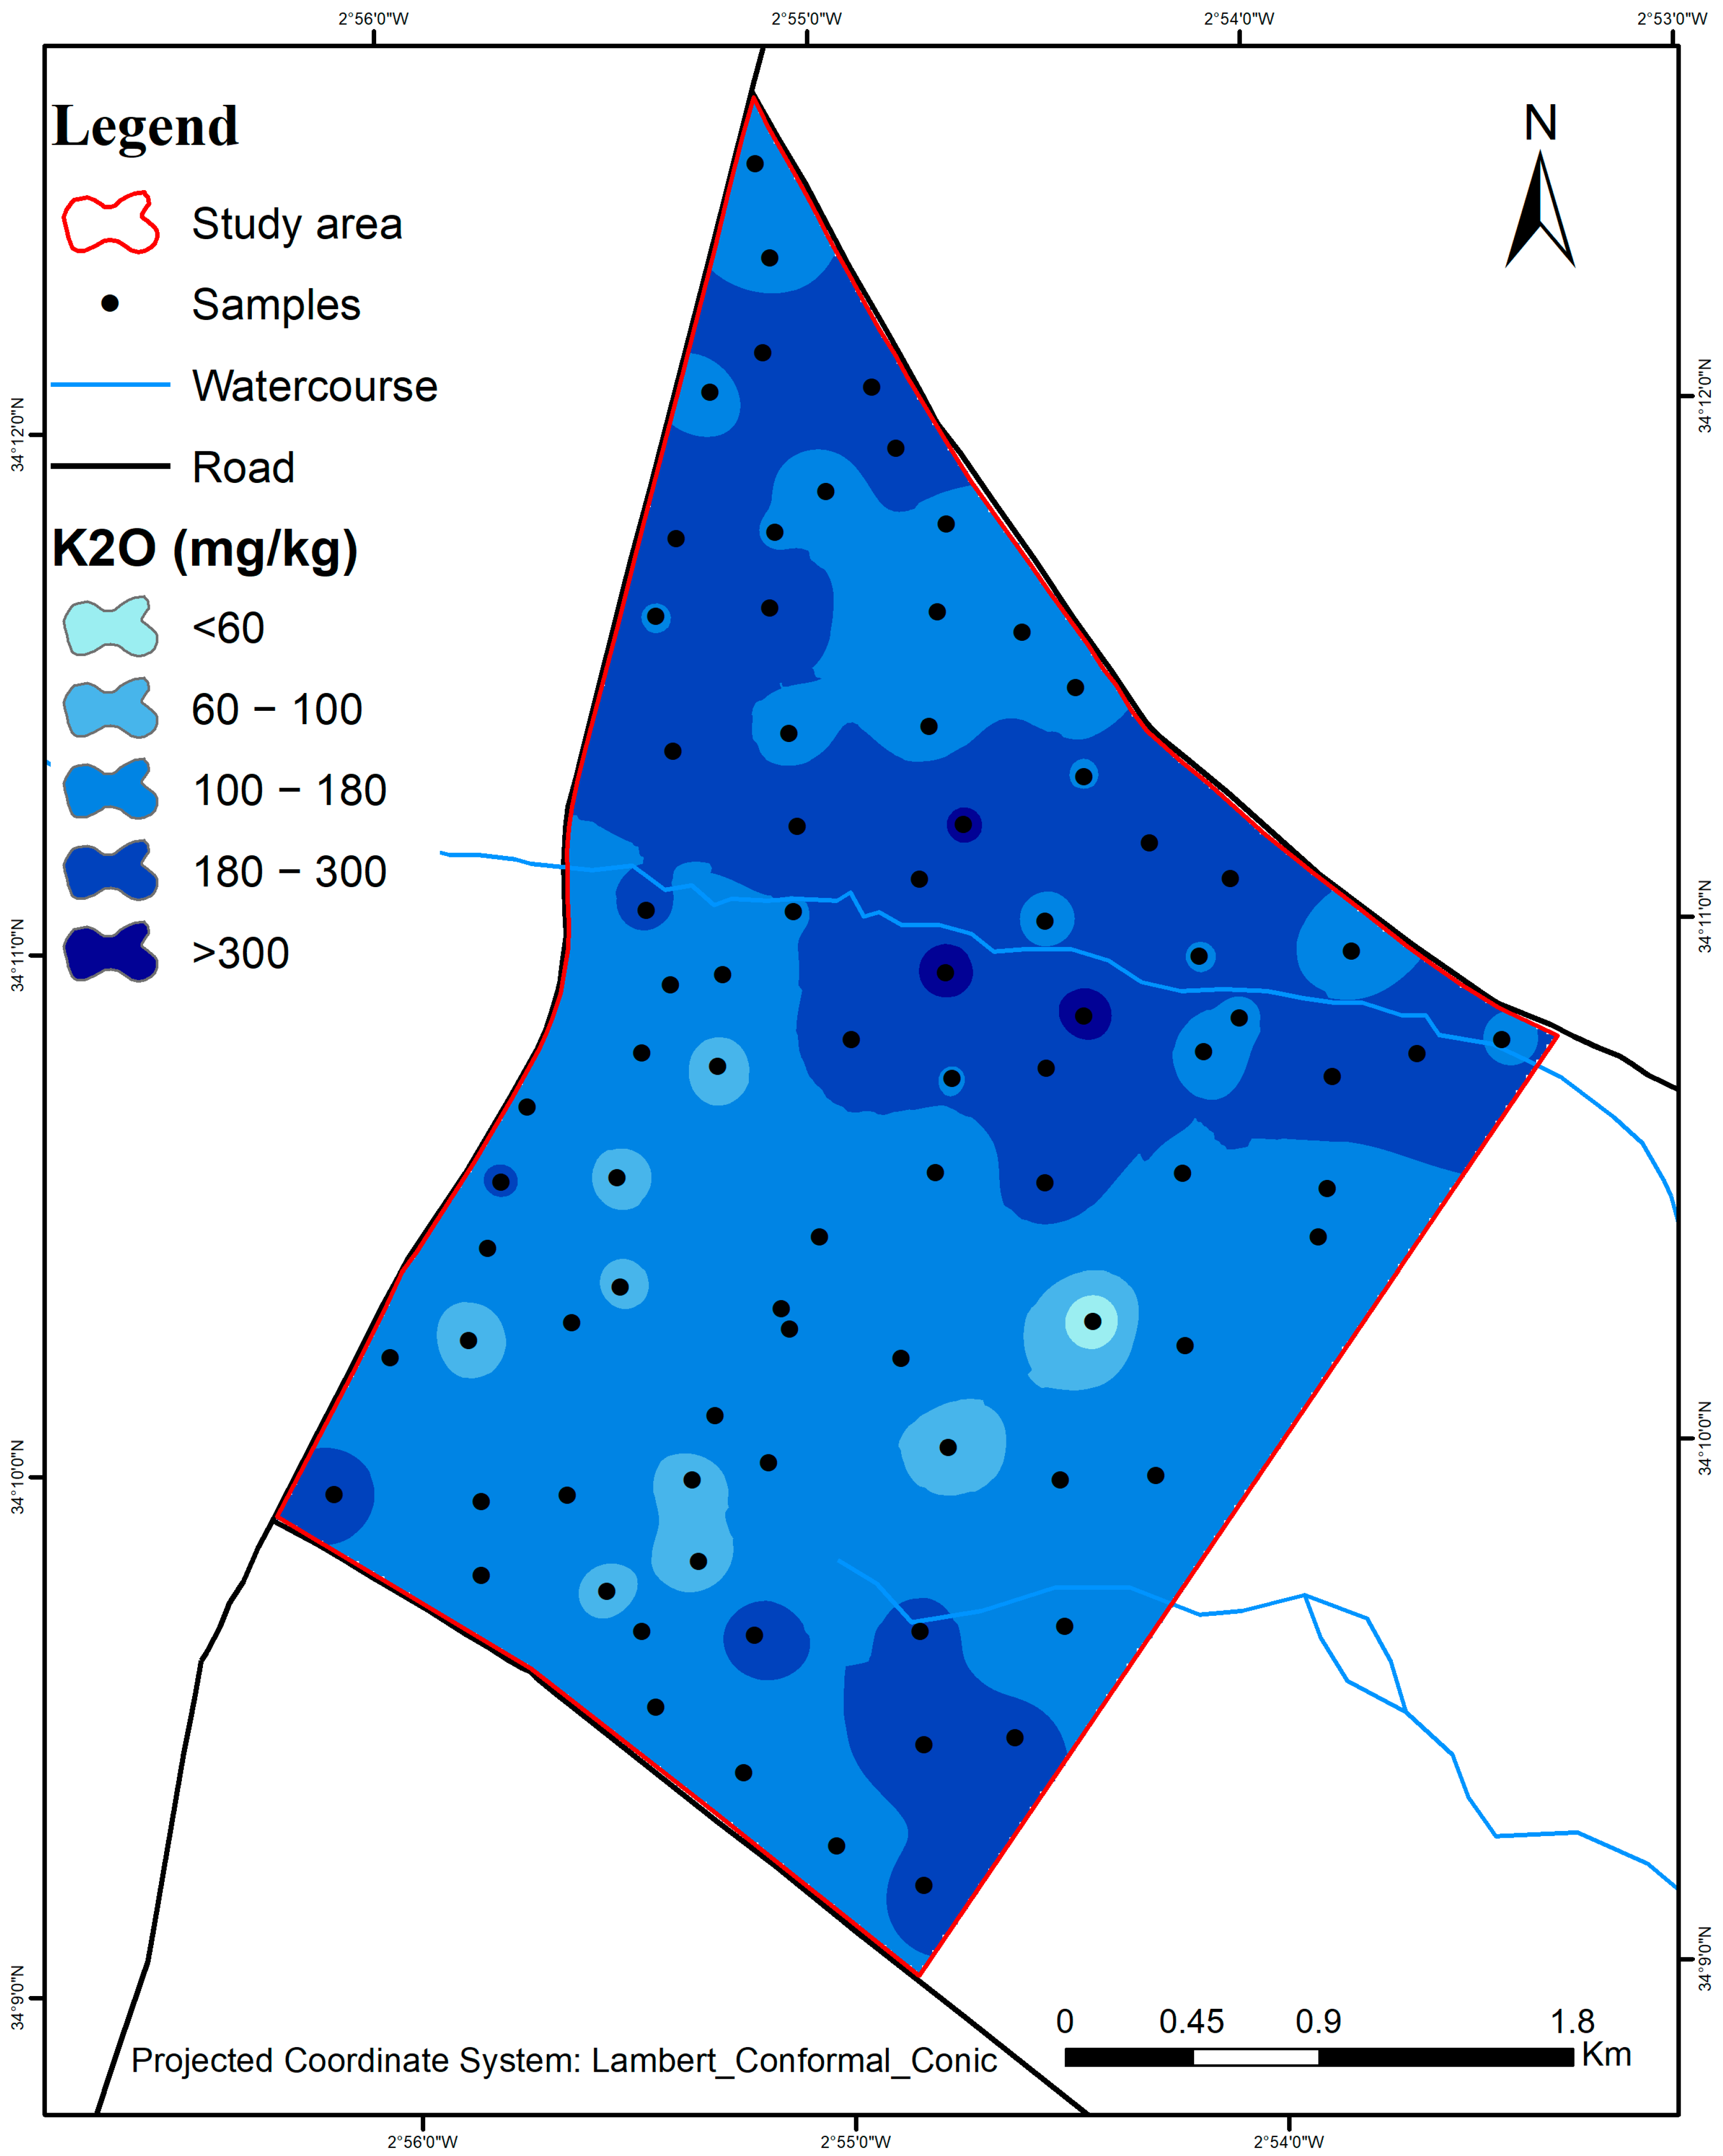
The results for exchangeable potassium (EP) in the sampled soils show concentrations ranging from 35.18 to 351.79 mg/kg, with an average value of 166.06 mg/kg (Table 1). According to the classification system of Delaunois et al. (2008) [37], most of the soils are rich in EP (Figure 9), with 4% of the samples falling into the very high category, 27% classified as high, 58% as medium, 10% as low, and only 1% as very low (Table 6). Cross-validation produced values of RMSE = 54.737, MAE = 45.46, and R2 = 0.245. This distribution pattern is like that observed for available phosphorus (AP) (Figure 8), suggesting that these soils are enriched with both phosphorus and potassium. In general, farmers tend to use NPK fertilizers, which contribute to the simultaneous enrichment of both nutrients.
Figure 8. Map of AP Distribution in the Soils of TIP According to Standardized Methods.
Geographies 05 00066 g008
Figure 9. Mapping of Soil EP Levels in the TIP Using Standardized Methods.
Geographies 05 00066 g009

3.9. Organic Matter

The results for organic matter (OM) in the sampled soils show concentrations ranging from 0.87 to 2.36% with an average value of 1.46% (Table 1). According to the DIAEA/DRHA/SEEN standards (2008) [34], most of the soils are low in OM (Table 7), with 61% of the samples falling into the poor soil category and 39% classified as moderately poor soil (Figure 10). Cross-validation produced values of RMSE = 0.304, MAE = 0.247, and R2 = 0.189.

4. Discussion

Soil texture: Soil texture directly influences the soil–water relationship, aeration, and root penetration. It also plays a key role in determining the soil’s nutritional status. The dominant soil texture (sandy loam) is characterized by a predominance of sand-sized particles (0.05–2.0 mm diameter). These soils exhibit good drainage characteristics, moderate to high hydraulic conductivity, and provide optimal conditions for root development and proliferation. However, they also present specific challenges related to moisture retention and nutrient availability [38]. Importantly, the TIP is a recently established irrigated plain, created in 2013. In contrast, the Triffa Plain (TP) is a well-established agricultural area located approximately 100 km away, sharing similar soil characteristics and farming systems. According to [5], soils in the TP are also predominantly sandy loam, which confirms the pedological similarity between the two plains. Moreover, Fetouani et al. (2007) [39] highlighted the environmental vulnerability of these sandy soils under intensive irrigation: their study found that 73% of sampled groundwater in the TP exceeded the WHO standard of 50 mg·L−1 for nitrate (NO3-N), and over 71% of the samples were classified as “bad” or “very bad” in terms of water quality. Given the similarities in soil texture, irrigation practices, and agricultural intensification between the TIP and TP, it is crucial to draw lessons from the Triffa experience. Without proper management, the TIP may face comparable risks of nutrient leaching and groundwater contamination. These findings underscore the urgent need for proactive soil and irrigation management strategies in the TIP to prevent environmental degradation and ensure long-term sustainability. As also shown by [40], sandy loam soils require site-specific management such as precision fertilization, organic matter enrichment, and controlled irrigation to optimize productivity and minimize environmental risks. As well, the addition of clay can help increase yields [41] and limit nutrient leaching [42], making it an effective strategy for improving the performance of light-textured soils.
Bulk density: Soil compaction, as observed in the area, leads to significant changes in the physical and chemical properties of the soil, as well as alterations to the root system structure. These changes can severely limit nutrient uptake by plants and negatively impact the surrounding ecosystem. Specifically, in compacted soils, nitrogen losses to groundwater and the atmosphere are often higher compared to non-compacted soils [43]. The compression of pores between and within aggregates reduces aeration and water infiltration, increases soil resistance, and disrupts the functioning of soil pores, ultimately hindering root development. This increased compaction can also enhance horizontal water flow, raising the risk of soil erosion [44]. The observed porosity values align with previous findings by [45], indicating that similar trends occur in comparable soil conditions. To mitigate these effects and move toward sustainable land use, it is crucial to implement soil conservation strategies that address compaction at both structural and operational levels. Practices such as controlled traffic farming, deep tillage, organic matter incorporation, and cover cropping can significantly improve soil structure, restore porosity, and enhance biological activity. Integrating these techniques within a broader sustainable agricultural management framework not only improves crop resilience and yields but also preserves the ecological functions of the soil. In the context of the TIP, where newly developed irrigated lands are vulnerable to degradation, promoting such practices is essential to ensure long-term soil health and sustainable agricultural production.
Electrical conductivity: According to the guidelines established by [33] and later referenced by [46], 77% of the plots are classified as non-saline, 11% as slightly saline, 8% as saline, and the remaining plots fall between the “very saline” and “extremely saline” categories (Table 2). The results indicated that, in more than 76% of the plots, covering an area of 924.46 ha, salinity had a negligible effect on plant growth. However, for 12% of the plots, salinity levels could affect very sensitive crops, and for 8% of the plots, salinity could substantially reduce the quantity and quality of most crops. For the remaining soils, only salt-tolerant crops can be grown [47]. This relatively low salinity in the soils can be attributed to continuous surface irrigation throughout the year for intensive agricultural production, as well as the good drainage capacity of soils. Both factors contribute to the continuous leaching of salts from the superficial soil layer (0–30 cm), where plant roots develop.
On the other hand, high electrical conductivity values ranging from 4 to 5.57 mS/cm were observed at stations TF76 and TF83. These localized salinity peaks are not attributed to saline irrigation water but are more likely linked to the nature of the parent material or excessive mineralization in certain soil layers. In semi-arid environments such as the TIP, the use of drip irrigation during the summer period, although efficient in terms of water use, can inadvertently lead to salt accumulation in the rhizosphere, especially when the irrigation flow rate is very low and leaching practices are insufficient. Salt stress is recognized as one of the most critical forms of soil degradation globally, as it severely limits both crop productivity and soil biological activity [48]. Without appropriate mitigation strategies, salinization may progressively render soils agriculturally marginal or even unproductive.
This situation underlines the urgent need for a comprehensive and sustainable soil management strategy tailored to the saline-prone areas of the TIP. As highlighted by Salvadora et al. (2023) [49], several nature-based and agronomic solutions have proven effective for the reclamation of saline and degraded soils in Mediterranean and semi-arid climates. These include phytoremediation, phytodesalination, vegetative bioremediation, the application of soil amendments (e.g., gypsum, compost), the use of Technosols, and the inoculation of beneficial microorganisms, such as plant growth-promoting bacteria and arbuscular mycorrhizal fungi, which enhance plant tolerance to salt stress and improve nutrient uptake.
pH: Soil pH in the TIP area is not currently a limiting factor for crop production, as 76% of the studied area is classified as weakly basic, while the remaining portion is neutral, and the relatively low R2 values can be explained by the wide classification intervals adopted in this study (Table 3), where each class spans at least 0.5 units. In contrast, the RMSE and MAE values remained below 0.2, indicating limited absolute prediction errors. This outcome is consistent with our methodological approach, as the interpolation was not designed to achieve exact point predictions but rather to classify soils within standard pedological ranges. Given that these intervals are relatively broad, the predicted values generally fall within the correct soil category, even if the statistical indicators suggest modest predictive performance. Such reasoning applies not only to pH but also to all soil parameters evaluated in the present study.
This distribution is typical for soils in semi-arid regions, where the presence of basic parent materials and the accumulation of carbonates are the primary factors responsible for soil alkalinity. The limited leaching under low rainfall conditions also contributes by allowing these alkaline compounds to persist and accumulate in the soil profile. Soil pH plays a fundamental role in nutrient availability, microbial activity, and overall soil fertility. In calcareous soils, as found in TIP, alkalinity is largely explained by the interaction between calcium carbonate (CaCO3) and the clay–humus complex (CHC). When calcium ions (Ca2+) are released, they are exchanged with hydrogen ions (H+), which then react with hydroxide ions (OH) to form water (H2O), thereby neutralizing potential acidity and stabilizing the pH [5]. While this natural buffering confers stability on the system, it does not exclude future risks of acidification. Unsustainable fertilization practices, particularly the repeated use of ammonium-based fertilizers, can induce soil acidification over time. The nitrification of ammonium (NH4+) releases hydrogen ions (H+), which lower pH, especially when nitrate leaching exceeds plant uptake, a common scenario in over-fertilized or poorly managed systems [50]. In addition, intense summer rainfall events, often observed in semi-arid climates, may promote surface runoff that preferentially removes base cations (Ca2+, Mg2+, K+), leaving acidic protons behind. Optimal pH ranges for crop production typically lie between 6.5 and 7.5 in non-calcareous soils and between 7.9 and 8.5 in calcareous systems [51]. However, high pH levels can reduce the availability of micronutrients such as Fe, Mn, Zn, and Cu [52] and may also impact soil infiltration and water movement due to changes in clay dispersion and aggregation [53]. Maintaining the current pH balance will require sustainable nutrient management, as mentioned by [54,55].
Total carbonate content: In the studied plots, carbonate precipitations are observed under the tree canopy, often appearing as whitish efflorescences. This preferential accumulation beneath trees, as opposed to inter-tree or bare areas, can be attributed to localized leaching effects induced by irrigation, which displace carbonates from the surrounding soil and concentrate them in areas of reduced evaporation. The carbonate content in inter-row zones is also influenced by the region’s semi-arid climate, which promotes limited leaching and facilitates carbonate persistence.
Field observations using hydrochloric acid (HCl) revealed visible effervescence in several bare areas, confirming the presence of carbonates beyond just calcium carbonate, potentially including other forms such as magnesium carbonates or dolomitic components. These findings are consistent with the regional pedogenesis, as the soils across the study area are derived from carbonate-rich parent materials, as noted in [15]. Calcareous soils pose significant agronomic challenges due to their high carbonate content, which can limit the availability of micronutrients (such as iron, zinc, and manganese), increase the risk of soil compaction, and reduce water retention capacity. To cope with these constraints, local farmers often choose tolerant species, such as fig trees, which are better adapted to such edaphic conditions. However, long-term sustainability in such systems requires more than crop selection. As part of a sustainable agricultural management strategy, interventions such as clay amendment incorporation, organic matter enrichment, and microbial inoculation can enhance soil structure, nutrient availability, and water-holding capacity. For example, studies conducted in arid regions by [56] have shown that applying clay-rich layers to sandy calcareous soils improves root distribution, increases soil water content, and reduces salinity. Promoting these practices at the local level is essential to improve the resilience and productivity of calcareous soils under increasing climatic and agronomic pressures.
Available phosphorus: The spatial variability of available phosphorus (AP) in the TIP area reflects differences in fertilization practices among farmers, particularly in the use of NPK fertilizers whether in conventional or soluble forms applied in combination with localized irrigation systems. Phosphorus plays a critical role in early plant development, especially in root formation, which enhances the plant’s ability to access water and nutrients during sensitive growth stages [57]. Higher phosphorus concentrations were observed in intensively cultivated plots, likely due to over-application of phosphate fertilizers. Soil moisture, particularly in areas near the valley, facilitates the diffusion of phosphorus toward the root zone, promoting uptake. This correlation between moist zones and higher phosphorus availability is evident in the spatial maps. In contrast, low phosphorus levels were recorded in fallow, uncultivated, or virgin plots, where the absence of fertilizer input and the natural leaching and erosion processes contribute to phosphorus depletion. Globally, phosphorus in natural soils originates solely from parent material weathering, making it a naturally limited and non-renewable resource [58].
Field observations also revealed considerable variation in farmers’ education levels, ranging from university-trained individuals to those with no formal education. This disparity contributes to inconsistent and sometimes unsustainable fertilizer application practices. In this context, it is crucial that agricultural policymakers and extension services strengthen on-site farmer training, focusing on the 4R nutrient stewardship principles. Raising awareness about the long-term environmental risks of phosphorus overuse, such as eutrophication of nearby rivers and groundwater contamination, is particularly important in the TIP region, which is characterized by sandy soils with low phosphorus retention capacity. As highlighted by [54], sustainable phosphorus management must be tailored to local socio-economic and agro-environmental contexts, especially in areas where land is privately owned by smallholder farmers. Empowering these landowners to adopt sustainable agricultural strategies—including precision fertilization, soil testing, and organic alternatives will be key to enhancing long-term soil fertility while protecting surrounding ecosystems.
Exchangeable potassium: The spatial distribution of exchangeable potassium (EP) in the TIP area reflects similar patterns to those observed for available phosphorus, as most farmers in the region apply NPK compound fertilizers, often without prior soil analysis. In fact, recent field data show that over 70% of farmers do not follow specific fertilizer recommendations [5], leading to an excessive accumulation of potassium in cultivated zones, particularly under fruit trees and near irrigation points. This practice is commonly driven by the perceived need to compensate for low potassium availability, often associated with the presence of calcareous soils, where calcium-rich environments reduce potassium uptake efficiency. While potassium is essential for plant resilience, supporting rapid growth, stomatal regulation, and resistance to pests and drought stress [59], over-application poses significant environmental risks. Excess potassium may accumulate in the soil profile and, through percolation or surface runoff, contribute to groundwater pollution. Moreover, it can disturb nutrient balance by antagonizing magnesium uptake, potentially leading to secondary magnesium deficiencies in crops.
Given the similarity between the spatial patterns of phosphorus and potassium, as confirmed by thematic maps, it is evident that these nutrients are being applied in tandem via NPK fertilizers, often without alignment to actual crops or soil needs. Therefore, it is essential to adopt the same sustainable agricultural management strategies previously mentioned for phosphorus. Adopting these strategies will be crucial to maintaining long-term soil fertility while minimizing the risk of nutrient leaching and groundwater contamination, especially in the TIP’s sandy and weakly structured soils. The integration of agronomic best practices with environmental stewardship will ensure that productivity gains do not come at the expense of ecological sustainability.
Organic Matter: In the semi-arid agroecosystem, low levels of soil organic matter (OM) are a common characteristic, largely influenced by the region’s limited rainfall, high evapotranspiration, and reduced microbial activity under dry conditions [60]. This situation is further exacerbated by the dominance of sandy loam soils, which inherently possess low water and nutrient retention capacities, accelerating the mineralization and leaching of organic compounds [45]. In several plots, excessive irrigation, especially in the absence of adequate soil cover, has contributed to downward drainage and loss of soluble organic fractions, ultimately diminishing soil fertility. From a long-term soil health perspective, persistently low OM levels of 1.46% pose several concerns. Reduced OM diminishes soil structure, lowers water-holding capacity, and weakens nutrient retention, collectively increasing vulnerability to erosion, compaction, and further fertility decline. Over time, such soils are less resilient to climatic stressors, including drought and heatwaves, and may experience declining crop yields, heightened reliance on chemical fertilizers, and reduced ecosystem service provision.
The measured OM levels in our study confirm this trend, with many fields falling into the “moderately poor soil” category. These findings are consistent with previous research conducted in a nearby, more established irrigated plain within the same region, where OM values ranged from 1.12% to 3.30% [61]. The relatively higher OM levels observed in certain fields within TIP are likely the result of localized applications of organic amendments, such as manure or compost [62], which remain limited and inconsistent across the perimeter. Although we did not directly measure total OM, it was estimated based on organic carbon values obtained via the Walkley & Black method, using the standard conversion factor of 1.72. This approach, while widely accepted, may slightly underestimate total organic matter in certain soil types with high charcoal or resistant fractions. Nevertheless, the results provide a reliable basis for spatial assessment and management recommendations.
From a sustainable agricultural management perspective, addressing organic matter deficiency is a priority action to restore soil structure, improve water holding capacity, and enhance nutrient cycling. Improving organic matter levels not only contributes to soil resilience under semi-arid stressors but also enhances long-term agricultural productivity and environmental sustainability objectives that are central to the Green Generation 2020–2030 vision.
5. Conclusions

This study offers a valuable contribution to the Green Generation 2020–2030 initiative by providing essential baseline data on the physicochemical status of soils in the TIP. The results indicate that most soils are slightly basic (76%), non-saline (76%), and moderately calcareous (87%), reflecting overall favorable conditions for agricultural development. However, the predominance of sandy loam textures (55%), coupled with a notable deficiency in organic matter (61%), poses significant constraints for nutrient and water retention. While available phosphorus and exchangeable potassium levels were found to be relatively high in 59% and 75% of the area, respectively, these concentrations, if not managed properly, may increase the risk of nutrient leaching, particularly due to the permeable nature of sandy soils. In this context, the application of chemical fertilizers should be carefully managed and complemented by organic amendments to enhance soil structure, promote nutrient retention, and mitigate the potential for groundwater contamination.
Methodologically, this study highlights the value of combining field observations, laboratory analyses, and spatial interpolation techniques to better capture soil variability at the regional scale. Although limited to a single season and spatial validation, the results confirm the relevance and applicability of this approach for supporting sustainable land and nutrient management in newly developed irrigated zones such as the TIP. Looking ahead, the adoption of precision fertilization, organic matter restoration, and adaptive management practices will be crucial to maintain agricultural productivity while preserving environmental quality. Future research should therefore focus on multi-season monitoring and investigate the integration of remote sensing, machine learning, and artificial intelligence tools to improve both the spatial and temporal resolution of soil assessments and to guide more efficient resource management.

Supplementary Materials

The following supporting information can be downloaded at: https://www.mdpi.com/article/10.3390/geographies5040066/s1, contains the physicochemical results for each parameter and for each sample, provided in an Excel file.

Author Contributions

Conceptualization, S.O. and R.M.; methodology, S.O. and A.N.; validation, S.O.; formal analysis, S.A.; data curation, S.S.; writing—original draft preparation, S.O.; writing—review and editing, S.O.; visualization, R.M.; supervision, F.B. and M.H.E.J.; project administration, A.N. All authors have read and agreed to the published version of the manuscript.

Funding

This research received no external funding.

Institutional Review Board Statement

Not applicable.

Informed Consent Statement

Not applicable.

Data Availability Statement

The sequence data supporting the findings of this study have been deposited and fully registered, along with all corresponding samples, at the Regional Center for Agronomic Research in Oujda, Morocco, and the Supplementary Materials are also available from the author upon request.

Acknowledgments

The authors sincerely thank all the staff at the Regional Center for Agronomic Research in Oujda (CRRAO/INRA), Morocco.

Conflicts of Interest

The authors declare no conflicts of interest.

References

  1. Parr, J.F.; Stewart, B.A.; Hornick, S.B.; Singh, R.P. Improving the Sustainability of Dryland Farming Systems: A Global Perspective. In Advances in Soil Science: Dryland Agriculture: Strategies for Sustainability Volume 13; Singh, R.P., Parr, J.F., Stewart, B.A., Eds.; Advances in Soil Science; Springer: New York, NY, USA, 1990; pp. 1–8. [Google Scholar] [CrossRef]
  2. FAO. The Food and Agriculture Organization of the United Nations, Food insecurity: When People Live with Hunger and Fear Starvation. The State of Food Insecurity in the World 2001; The Food and Agriculture Organization of the United Nations: Washington, DC, USA, 2001. [Google Scholar]
  3. Adghough, J. Economic Overview of Agriculture and Food in Morocco, 1st ed.; Cuvillier: Göttingen, Germany, 2018; Available online: https://cuvillier.de/de/shop/publications/7879 (accessed on 11 May 2025).
  4. Abbou, M.; Chabbi, M.; Benicha, M. Assessment of phytosanitary practices on the environment: Case study potato of Loukkos (northwest Morocco). Environ. Monit. Assess. 2023, 195, 352. [Google Scholar] [CrossRef] [PubMed]
  5. Bendra, B.; Fetouani, S.; Laffray, X.; Vanclooster, M.; Sbaa, M.; Aleya, L. Effects of Irrigation on Soil Physico-Chemistry: A Case Study of the Triffa Plain (morocco). Irrig. Drain. 2012, 61, 507–519. [Google Scholar] [CrossRef]
  6. Omrania, L.; Khodrani, N.E.; Zouahri, A.; Douaik, A.; Iaaich, H.; Lahmar, M.; Hajjaji, S.E. Physico-Chemical Characterization of Water and Soil of the M’nasra region in the Gharb plain (Northwest Morocco). Moroc. J. Chem. 2019, 7, 482–492. [Google Scholar] [CrossRef]
  7. Lahmar, M.; Khodrani, N.E.; Omrania, S.; Dakak, H.; Douaik, A.; Iaaich, H.; Yachou, H.; Ghanimi, A.; Moussadek, R.; Mekkaoui, M.; et al. GIS and Statistical Evaluation of Soil Quality of Sidi Yahya, Gharbplain (Morocco). J. Exp. Biol. Agric. Sci. 2021, 9, 881–893. [Google Scholar] [CrossRef]
  8. Kholaiq, M.; Benmessaoud, S.; Kara, M.; Assouguem, A.; Abbasi, A.M.; Al-Ghamdi, A.A.; Elshikh, M.S.; Rahimi, A.; Saber, N. Sustainability of Coastal Agriculture in the Face of Soil Degradation: The Influence of Water Salinization as an Example. Sustainability 2022, 14, 13641. [Google Scholar] [CrossRef]
  9. Bouslihim, Y.; Bouasria, A.; Jelloul, A.; Khiari, L.; Dahhani, S.; Mrabet, R.; Moussadek, R. Baseline high-resolution maps of soil nutrients in Morocco to support sustainable agriculture. Sci. Data 2025, 12, 1389. [Google Scholar] [CrossRef]
  10. Lagacherie, P.; Álvaro-Fuentes, J.; Annabi, M.; Bernoux, M.; Bouarfa, S.; Douaoui, A.; Grünberger, O.; Hammani, A.; Montanarella, L.; Mrabet, R.; et al. Managing Mediterranean soil resources under global change: Expected trends and mitigation strategies. Reg. Environ. Change 2018, 18, 663–675. [Google Scholar] [CrossRef]
  11. Eljebri, S.; Mounir, M.; Faroukh, A.T.; Zouahri, A.; Tellal, R. Application of geostatistical methods for the spatial distribution of soils in the irrigated plain of Doukkala, Morocco. Model. Earth Syst. Environ. 2019, 5, 669–687. [Google Scholar] [CrossRef]
  12. Mosaid, H.; Barakat, A.; John, K.; Faouzi, E.; Bustillo, V.; El Garnaoui, M.; Heung, B. Improved soil carbon stock spatial prediction in a Mediterranean soil erosion site through robust machine learning techniques. Environ. Monit. Assess. 2024, 196, 130. [Google Scholar] [CrossRef]
  13. Jalil, M.H.E.; Tarpaga, P.M.; Majdouline, C.; Doughmi, A.; Ajmani, S.; Oubdil, S.; Benradi, F.; Nounah, A. Organic Certification, Labeling, and Regulations in Africa. In Organic Food Production; CRC Press: Boca Raton, FL, USA, 2024. [Google Scholar]
  14. El Jalil, M.H.; Majdouline, C.; Tarpaga, P.M.; Doughmi, A.; Chamsseddine, M.; Khamar, M.; Cherkaoui, E. Organic Farming in Africa: A Pillar of Innovation and Transformation to Promote the Development of a Sustainable Agriculture Sector. In Organic Food Production; CRC Press: Boca Raton, FL, USA, 2024. [Google Scholar]
  15. Seghir, A.; Mazoz, L.; Idrissi, A.J. Cartographie de sol dans la zone méridional de la plaine de Tafrata au Maroc Centro-Oriental et évaluation de leur sensibilité à la désertification. Rev. Marocaine Sci. Agron. Vétérinaires 2019, 7, 371. Available online: https://agrimaroc.org/index.php/Actes_IAVH2/article/view/704 (accessed on 21 February 2025).
  16. IUSS Working Group WRB. World Reference Base for Soil Resources: International Soil Classification System for Naming Soils and Creating Legends for Soil Maps, 4th ed.; International Union of Soil Sciences (IUSS): Vienna, Austria, 2022; Available online: https://wrb.isric.org/documents/ (accessed on 17 September 2025).
  17. Wang, J.; Zhai, Z.; Xu, G.; Zhang, R.; Zhang, X.; Hu, R. Optimizing Sampling Points and Path Planning for Soil Monitoring in Agricultural Land. Agronomy 2024, 14, 2947. [Google Scholar] [CrossRef]
  18. Naili, S.; NAIT MERZOUG, A.; Denes, G.; Merazig, H.; Lakehal, A. Détermination des teneurs en éléments traces métalliques des sols cultives dans la région de Constantine par spectrométrie XRF. In Proceedings of the Third International Conference on Energy, Materials, Applied Energetics and Pollution ICEMAEP2016, Constantine, Algeria, 30–31 October 2016. [Google Scholar]
  19. Walkley, A.; Black, I.A. An Examination of the Degtjareff Method for Determining Soil Organic Matter, and a Proposed Modification of the Chromic Acid Titration Method. Soil Sci. 1934, 37, 29. [Google Scholar] [CrossRef]
  20. Aubert, G. Méthodes D’Analyses des Sols; Centre National de Documentation péDagogique, Centre régional de Documentation péDagogique de Marseille: Marseille, France, 1978. [Google Scholar]
  21. Pétard, J. Les méthodes d’analyse. Tome 1. Analyses de sols. Notes Tech. 1993, 5, 196. [Google Scholar]
  22. Van Ranst, E.; Verloo, M.; Demeyer, A.; Pauwels, J. Manual for the Soil Chemistry and Fertility Laboratory: Analytical Methods for Soils and Plants Equipment, and Management of Consumables; NUGI 835: Ghent, Belgium, 1999. [Google Scholar]
  23. USSLS, R.S. Diagnosis and Improvement of Saline and Alkali Soils, (United States Salinity Laboratory Staff); U.S. Government Printing Office: Washington, DC, USA, 1954.
  24. Olsen, S.R. Estimation of Available Phosphorus in Soils by Extraction with Sodium Bicarbonate; U.S. Department of Agriculture: Washington, DC, USA, 1954.
  25. Blok, C.; De Kreij, C.; Baas, R.; Wever, G. 7—ANALYTICAL METHODS USED IN SOILLESS CULTIVATION. In Soilless Culture; Raviv, M., Lieth, J.H., Eds.; Elsevier: Amsterdam, The Netherlands, 2008; pp. 245–289. [Google Scholar] [CrossRef]
  26. Bullock, P.; Newman, A.C.D.; Thomasson, A.J. Porosity aspects of the regeneration of soil structure after compaction. Soil Tillage Res. 1985, 5, 325–341. [Google Scholar] [CrossRef]
  27. Page-Dumroese, D.S.; Brown, R.E.; Jurgensen, M.F.; Mroz, G.D. Comparison of Methods for Determining Bulk Densities of Rocky Forest Soils. Soil Sci. Soc. Amer J. 1999, 63, 379–383. [Google Scholar] [CrossRef]
  28. Zakaria, Y.; Shaibu, A.-G.; Baatuuwie, B. Spatial analysis of soil physicochemical and hydraulic properties in the Libga irrigation scheme in northern Ghana using geostatistics and GIS approach. Soil Sci. Ann. 2022, 73, 149942. [Google Scholar] [CrossRef]
  29. Vomocil, J.A. Porosity. In Methods of Soil Analysis; John Wiley & Sons, Ltd.: Hoboken, NJ, USA, 1965; pp. 299–314. [Google Scholar] [CrossRef]
  30. Bouslihim, Y.; John, K.; Miftah, A.; Azmi, R.; Aboutayeb, R.; Bouasria, A.; Razouk, R.; Hssaini, L. The effect of covariates on Soil Organic Matter and pH variability: A digital soil mapping approach using random forest model. Ann. GIS 2024, 30, 215–232. [Google Scholar] [CrossRef]
  31. Najim, A.; Timoulali, Y.; El Hilali, M.; Diani, K. Geological mapping from satellite imagery and lineament detection in the Imilchil-Aghbala region (High Atlas central and Middle Atlas ridges zone, Morocco). Euro-Mediterr. J. Environ. Integr. 2024, 9, 875–889. [Google Scholar] [CrossRef]
  32. Souiri, S.; Hakkou, M.; Haddaoui, H.; Oubdil, S.; Lmrimed, N. Automatic Coastline Detection Using Coastsat Toolbox and GIS: A Case Study at Oued-Laou Beach, Morocco. E3S Web Conf. 2025, 607, 04024. [Google Scholar] [CrossRef]
  33. Durand, J.H. Les sols Irrigables, Étude Pédologique. Open Library. Available online: https://openlibrary.org/books/OL2617110M/Les_sols_irrigables (accessed on 28 February 2025).
  34. DIAEA/DRHA/SEEN. Direction de L’Irrigation et de L’Aménagement de L’Espace Agricole, Service des Expérimentations, des Essais et de la Nor-Malisation; Ministère de l’Agriculture: Rabat, Maroc, 2008. [Google Scholar]
  35. Omari, M.E.; Amziane, N.; Zerdeb, M.A.; Naoui, B.; Mekkaoui, A.E.; Akhlidej, N.; Ouministère de l’Agriculturehmid, O.; Zouahri, A. Physico-Chemical Characterization and Quality of Agricultural Soils in the Zaër Region (Morocco). Available online: https://www.ecoeet.com/Physico-Chemical-Characterization-and-Quality-of-Agricultural-Soils-in-the-Zaer-Region,171528,0,2.html (accessed on 28 June 2025).
  36. Baize, D. Guide des Analyses Courantes en Pédologie: Choix, Expression, Présentation, Interprétation; Institut National de la Recherche Agronomique, DL: Paris, France, 1989. [Google Scholar]
  37. Delaunois, A.; Ferrie, Y.; Bouche, M.; Colin, C.; Rionde, C. Guide pour la description et l’évaluation de la fertilité des sols. Chamb. D’Agriculture 2008, 81, 1–37. [Google Scholar]
  38. Osman, K.T. Plant Nutrients and Soil Fertility Management. In Soils: Principles, Properties and Management; Osman, K.T., Ed.; Springer: Dordrecht, The Netherlands, 2013; pp. 129–159. [Google Scholar] [CrossRef]
  39. Fetouani, S.; Sbaa, M.; Vanclooster, M.; Bendra, B. Assessing ground water quality in the irrigated plain of Triffa (north-east Morocco). Agric. Water Manag. 2008, 95, 133–142. [Google Scholar] [CrossRef]
  40. Bogunovic, I.; Mesic, M.; Zgorelec, Z.; Jurisic, A.; Bilandzija, D. Spatial variation of soil nutrients on sandy-loam soil. Soil Tillage Res. 2014, 144, 174–183. [Google Scholar] [CrossRef]
  41. Ismail, S.M.; Ozawa, K. Improvement of crop yield, soil moisture distribution and water use efficiency in sandy soils by clay application. Appl. Clay Sci. 2007, 37, 81–89. [Google Scholar] [CrossRef]
  42. Bronswijk, J.J.B.; Hamminga, W.; Oostindie, K. Rapid nutrient leaching to groundwater and surface water in clay soil areas. Eur. J. Agron. 1995, 4, 431–439. [Google Scholar] [CrossRef]
  43. Lipiec, J.; Stępniewski, W. Effects of soil compaction and tillage systems on uptake and losses of nutrients. Soil Tillage Res. 1995, 35, 37–52. [Google Scholar] [CrossRef]
  44. Horn, R.; Domżżał, H.; Słowińska-Jurkiewicz, A.; van Ouwerkerk, C. Soil compaction processes and their effects on the structure of arable soils and the environment. Soil Tillage Res. 1995, 35, 23–36. [Google Scholar] [CrossRef]
  45. Shwetha, P.; Varija, K. Soil Water Retention Curve from Saturated Hydraulic Conductivity for Sandy Loam and Loamy Sand Textured Soils. Aquat. Procedia 2015, 4, 1142–1149. [Google Scholar] [CrossRef]
  46. Benslama, A.; Khanchoul, K.; Benbrahim, F.; Boubehziz, S.; Chikhi, F.; Navarro-Pedreño, J. Monitoring the Variations of Soil Salinity in a Palm Grove in Southern Algeria. Sustainability 2020, 12, 6117. [Google Scholar] [CrossRef]
  47. McGeorge, W.T. Diagnosis and Improvement of Saline and Alkaline Soils. Soil Sci. Soc. Am. J. 1954, 18, 348. [Google Scholar] [CrossRef]
  48. Zouahri, A.; Hallam, J.; Dakak, H.; Douaik, A.; Halima, O.I. Soil Salinity: A Challenge for the Resilience of Ecosystems and the Sustainability of Moroccan Agriculture. Afr. Med. Agric. J. 2024, 143, 135–155. [Google Scholar] [CrossRef]
  49. Navarro-Torre, S.; Garcia-Caparrós, P.; Nogales, A.; Abreu, M.M.; Santos, E.; Cortinhas, A.L.; Caperta, A.D. Sustainable agricultural management of saline soils in arid and semi-arid Mediterranean regions through halophytes, microbial and soil-based technologies. Environ. Exp. Bot. 2023, 212, 105397. [Google Scholar] [CrossRef]
  50. Goulding, K.W.T. Soil acidification and the importance of liming agricultural soils with particular reference to the United Kingdom. Soil Use Manag. 2016, 32, 390–399. [Google Scholar] [CrossRef]
  51. Baize, D. Guide des Analyses en Pédologie: 2e Édition, Revue et Augmentée; Editions Quae: Versailles, France, 2000. [Google Scholar]
  52. Dhaliwal, S.S.; Naresh, R.K.; Mandal, A.; Singh, R.; Dhaliwal, M.K. Dynamics and transformations of micronutrients in agricultural soils as influenced by organic matter build-up: A review. Environ. Sustain. Indic. 2019, 1–2, 100007. [Google Scholar] [CrossRef]
  53. Simsek, C.; Gunduz, O. IWQ Index: A GIS-Integrated Technique to Assess Irrigation Water Quality. Environ. Monit. Assess. 2007, 128, 277–300. [Google Scholar] [CrossRef]
  54. Micabalo, K.; Gimena, J.A.F.; Biore, C.; Llamedo, E.E.; Abella, I.E.; Siaton, A.G.; Cano, J.B. Sustainable Agricultural Practices and Their Effects on Environmental Quality and Economic Viability in Central Visayas, Philippines. Asian J. Manag. Sci. 2024, 13, 38–46. [Google Scholar] [CrossRef]
  55. Agegnehu, G.; Amede, T.; Erkossa, T.; Yirga, C.; Henry, C.; Tyler, R.; Nosworthy, M.G.; Beyene, S.; Sileshi, G.W. Extent and management of acid soils for sustainable crop production system in the tropical agroecosystems: A review. Acta Agric. Scand. Sect. B—Soil Plant Sci. 2021, 71, 852–869. [Google Scholar] [CrossRef]
  56. Al-Omran, A.M.; Sheta, A.S.; Falatah, A.M.; Al-Harbi, A.R. Effet de l’irrigation goutte à goutte sur le rendement et l’efficacité de l’utilisation de l’eau des courges (Cucurbita pepo) dans les sols calcaires sableux amendés avec des dépôts d’argile. Agric. Water Manag. 2005, 73, 43–55. [Google Scholar] [CrossRef]
  57. Malhotra, H.; Vandana; Sharma, S.; Pandey, R. Phosphorus Nutrition: Plant Growth in Response to Deficiency and Excess. In Plant Nutrients and Abiotic Stress Tolerance; Hasanuzzaman, M., Fujita, M., Oku, H., Nahar, K., Hawrylak-Nowak, B., Eds.; Springer: Singapore, 2018; pp. 171–190. [Google Scholar] [CrossRef]
  58. Larsen, S. Soil Phosphorus. In Advances in Agronomy; Norman, A.G., Ed.; Academic Press: Cambridge, MA, USA, 1967; Volume 19, pp. 151–210. [Google Scholar] [CrossRef]
  59. Sardans, J.; Peñuelas, J. Potassium Control of Plant Functions: Ecological and Agricultural Implications. Plants 2021, 10, 419. [Google Scholar] [CrossRef] [PubMed]
  60. Condron, L.; Stark, C.; O’Callaghan, M.; Clinton, P.; Huang, Z. The Role of Microbial Communities in the Formation and Decomposition of Soil Organic Matter. In Soil Microbiology and Sustainable Crop Production; Dixon, G.R., Tilston, E.L., Eds.; Springer: Dordrecht, The Netherlands, 2010; pp. 81–118. [Google Scholar] [CrossRef]
  61. Lazaar, A.; Mouazen, A.M.; EL Hammouti, K.; Fullen, M.; Pradhan, B.; Memon, M.S.; Andich, K.; Monir, A. The application of proximal visible and near-infrared spectroscopy to estimate soil organic matter on the Triffa Plain of Morocco. Int. Soil Water Conserv. Res. 2020, 8, 195–204. [Google Scholar] [CrossRef]
  62. Ajmani, S.; Majdouline, C.; Kammou, L.; Oubdil, S.; Khamar, M.; El Jalil, M.H. Poultry manure management in morocco: Regulatory gaps, unsafe eid al-adha practices, and physico-chemical and microbiological risks for sustainable use. J. Mater. Cycles Waste Manag. 2025, 27, 3931–3951. [Google Scholar] [CrossRef]
Figure 1. Location of the study area (Tafrata Irrigated Perimeter, Morocco).
Geographies 05 00066 g001
Figure 2. Distribution of Soil Samples & Sampling Protocols.
Geographies 05 00066 g002
Figure 3. Boxplot of soil properties.
Geographies 05 00066 g003
Figure 4. Percentage distribution of soil texture classes in the TIP.
Geographies 05 00066 g004
Figure 5. Map showing the distribution of electrical conductivity of soils in the TIP.
Geographies 05 00066 g005
Figure 6. Map showing the distribution of soil pH in the TIP according to approved standards.
Geographies 05 00066 g006
Figure 10. Mapping of Soil Organic Matter Levels in the TIP Using Standardized Methods.
Geographies 05 00066 g010
Table 1. Descriptive Statistics of Soil Physico-Chemical Parameters in TIP.
VariableMinMaxMeanSTDEVKurtSkewS-W TestCV
pH7.017.787.410.14−0.3−0.060.582.45
EC (mS/cm)0.1035.570.530.4723.981.320.00164.65
P2O5 (mg∙kg−1)0.08147.2435.2315.467.452.070.0561.83
K2O (mg∙kg−1)35.18351.79166.0649.160.461.290.2138.12
OM (%)0.872.361.460.28−0.41.050.1523.38
TCC (%)11.1632.7419.083.770.550.130.7125.26
Salinity (g/kg)0.074.680.370.3429.461.990.01195.02
Bulk Density (g·cm−3)1.071.711.310.081.520.220.458.45
VMC0.00030.13870.020.023.742.560.00131.19
Porosity (%)34.3258.4649.323.151.520.030.248.49
VMC: Volumetric Moisture Content; STDEV: standard deviation; Kurt: kurtosis; Skew: skewness; and S-W test: Shapiro–Wilk test.
Table 2. Distribution of irrigation water or soil salinity classes in the TIP according to [33].
Soil ClassEC (mS/cm)Number of SitesPercentage Area (ha)
Non-saline0 to 0.66577%924.46
Slightly saline 0.6 to 1911%325.38
Saline1 to 278%90.75
Very saline2 to 411%19.46
Extremely saline>422%5.54
Table 3. Distribution of pH classes of the studied soils in the TIP according to DIAEA/DRHA/SEEN (2008) standards [34] cited in ref. [35].
Soil ClasspHNumber of SitesPercentageArea (ha)
AcidpH < 600%0
Weakly Acidic6 < pH < 6.500%0
Neutral6.5 < pH < 7.32024%145.25
Weakly Basic7.3 < pH < 7.86476%1220.35
Moderately Basic7.8 < pH < 8.500%0
Alkaline tendency8.5 < pH <900%0
Very AlkalinepH > 900%0
Table 4. Distribution of total carbonate classes in the studied soils of the TIP according to the standards [36].
Soil ClassCarbonate (%) Number of SitesPercentageArea (ha)
Non-calcareous soil<1%00%0
Slightly calcareous soil1–5%00%0
Moderately calcareous soil5–25%7387%1256.18
Strongly calcareous soil25–50%1113%109.43
Very strongly calcareous soil50–80%00%0
Excessively calcareous soil>80%00%0
Table 5. Spatial Distribution of Soil available phosphorus Classes in TIP Based on the Classification System of [37].
Soil ClassP2O5 (mg∙kg−1)Number of SitesPercentage Area (ha)
Very low<151315%35.86
Low15–302226%547.71
Medium30–452935%527.45
High45–1001923%245.31
Very high>10011%9.27
Table 6. Spatial Distribution of EP Classes in the TIP Soils Based on the Classification System of [37].
Soil ClassK2O (mg∙kg−1)Number of SitesPercentageArea (ha)
Very low<6011%2.83
Low60–100810%51.36
Medium100–1804958%819.35
High180–3002327%485.29
Very high>30034%6.76
Table 7. Distribution of OM classes in the studied soils of the TIP according to DIAEA/DRHA/SEEN standards (2008) [34].
InterpretationsOrganic Matter Content (%)Number of SitesPercentageArea (ha)
Very poor soil<0.700%0
Poor soil0.7–1.55161%809.65
Moderately poor soil1.5–33339%555.95
Rich soil3–600%0
Very rich soil>600%0
Disclaimer/Publisher’s Note: The statements, opinions and data contained in all publications are solely those of the individual author(s) and contributor(s) and not of MDPI and/or the editor(s). MDPI and/or the editor(s) disclaim responsibility for any injury to people or property resulting from any ideas, methods, instructions or products referred to in the content.