Article

A Framework for the Dynamic Mapping of Precipitations Using Open-Source 3D WebGIS Technology

by
Marcello La Guardia
*,
Antonio Angrisano
and
Giuseppe Mussumeci
Department of Engineering, University of Messina, 98158 Messina, Italy
*
Author to whom correspondence should be addressed.
Geographies 2025, 5(3), 40; https://doi.org/10.3390/geographies5030040
Submission received: 26 June 2025 / Revised: 26 July 2025 / Accepted: 28 July 2025 / Published: 4 August 2025

Abstract

Climate change represents one of the main challenges of this century. The hazards generated by this process are various and involve territorial assets all over the globe. Hydrogeological risk represents one of these aspects, and the violence of rain precipitations has led experts to focus their interest on the study of geotechnical assets in relation to these dangerous weather events. At the same time, geospatial representation in 3D WebGIS based on open-source solutions led specialists to employ this kind of technology to remotely analyze and monitor territorial events considering different sources of information. This study considers the construction of a 3D WebGIS framework for the real-time management of geospatial information developed with open-source technologies applied to the dynamic mapping of precipitation in the metropolitan area of Palermo (Italy) based on real-time weather station acquisitions. The structure considered is a WebGIS platform developed with Cesium.js JavaScript libraries, the Postgres database, Geoserver and Mapserver geospatial servers, and the Anaconda Python platform for activating real-time data connections using Python scripts. This framework represents a basic geospatial digital twin structure useful to municipalities, civil protection services, and firefighters for land management and for activating any preventive operations to ensure territorial safety. Furthermore, the open-source nature of the platform favors the free diffusion of this solution, avoiding expensive applications based on property software. The components of the framework are available and shared using GitHub.

1. Introduction

The last few decades have been characterized by the observation of evidence of climate change on all continents and most oceans, with a particular focus on the temperature increasing [1]. Changes have pertained to the behavior of natural systems where frozen ground, snow, and ice were involved. The diffusion and enlargement of glacial lakes [2], the growing presence of ground instability events in permafrost regions [3] or rock avalanches in mountains [4], and modifications in Artic and Antarctic ecosystems [5] are some of the main effects of climate change in these natural systems.
There is also growing evidence that climate change has led to dangerous effects on hydrological systems, such as increased run-off from many glaciers and snow rivers [6] and the warming of lakes, seas, and rivers in many regions [7].
The ground instability caused by climate change has led to territorial assets becoming more vulnerable to problems related to hydrogeological risk.
The economic impact of hydrogeological extremes such as floods, debris floods, and droughts has significantly increased in recent years [8]. The interaction between a territory with a natural hazard defines the risk [9]. The relationship between these two elements defines a mutual shaping action, where the occurrence of the natural hazard leads the territory to respond with actions aimed at preventing new disasters, as well as actions taken by humans to modify the frequency (e.g., construction of proper protective structures [10]), exposure (e.g., modification of urban territorial assets [11]), and vulnerability (e.g., design of early warning systems [12]) of flooding events. This interaction is of particular interest in Italian territorial assets, where hydrogeological risk represents a relevant challenge [13,14,15].
In the realm of hydrogeological extremes, landslides represent one of the most dangerous and frequent disasters. The risks associated with this kind of event depend on the geotechnical characteristics of the site [16].
The interaction between natural factors, represented by natural hazards, and human action, represented by territory, adds complexity to the prediction of landslides. For this reason, recent research has focused on the generation of susceptibility or hazard maps to prevent landslide events or reduce the risk of damage and loss of human lives [17].
In this context, geospatial analysis represents a fundamental tool for performing territorial analysis aimed at understanding environmental vulnerability. The combination of different sources of geospatial information (satellite images, orthophotos, land use maps, etc.) allows specialists to analyze all the factors that come into play for the identification of vulnerable areas. This kind of analysis is possible using GIS (geospatial information system) technologies [18,19,20] that have recently been combined with AI (artificial intelligence) processes [21,22,23].
In the field of geospatial analysis, the last few years have also been characterized by the spread of new ways to share complex 3D datasets based on WebGL JavaScript in several domains of research, employing web browser capabilities [24,25,26,27,28,29,30]. These systems allow for the exploration of complex 2D and 3D datasets (point clouds, meshes, maps, and orthophotos) on the web, employing open-source technology and avoiding the limitations that characterize property software solutions.
In recent years, the use of these technologies has been diffused using GIS platforms in order to provide 3D geospatial web dissemination on a 3D WebGIS system, with the possibility to share complex 3D data provided by local and remote servers [31,32,33]. The use of 3D WebGIS represents a precious tool in many fields of research, where the relationship with the territorial asset is fundamental. This kind of solution has been used for the real-time management of earthquake scenarios [34], seismic analysis before and after an earthquake event [35], the analysis of serious ground deformation caused by underground coal mining [36], the virtual exploration of cultural heritage sites [37], the monitoring of the coastal erosion risk in the Mediterranean area [38], the analysis and control of soil pollution [39], and dissemination purposes in high school education in the field of natural disasters [40].
In the field of hydrogeological risk management, the use of the WebGIS platform has recently been applied for the visualization and simulation of urban flooding events [41], particularly for the early warning of debris flows occurring in the rainy season [42]. Also in this field, the use of open-source solutions has allowed researchers to obtain interesting results from flood simulations inside a 3D urban environment [43].
Following the topic of hydrogeological risk management in WebGIS, our scientific contribution focused interest on the construction of a WebGIS framework based on open-source solutions for the real-time analysis of territorial assets. The case study used as a testbed application regards the dynamic mapping of precipitation in the urban context of Palermo (Italy). Previous studies focused interest on the monitoring of climatic assets of the Mediterranean city moving from the basis of weather acquisitions [44,45]. In this case we tested the dynamic raster generation and 3D WebGIS visualization of geospatial information elaborated in real time on the basis of the data source information provided on the web by eight weather stations.
The structure described in this paper combines different modules and can be considered as a reference framework for municipalities for the analysis and management of risk caused by this kind of natural hazard, avoiding the employment of property software solutions.
The structure of this article is as follows: Section 2, where the general framework is analyzed; Section 3, which shows in detail how the platform works inside a server machine; Section 4, which analyzes the strengths and weaknesses of our solution compared with similar examples present in the recent literature; and, finally, Section 5, where an overview of the filled research gap is explained, with the integration of possible future scenarios in this field of research.

2. Materials and Methods

The structure considered for the generation of the 3D WebGIS service is based on the remote management of geospatial data, allowing the analysis of the territorial asset based on real-time updates of geospatial information with the employment of open-source solutions only (Figure 1).
To achieve this goal, the framework is based on the use of a relational database management system for the storage of the input and output geospatial datasets. In fact, all the applications related to the study of hydrogeological risk require the integration of geospatial datasets at several levels, combining raster information provided by local GIS analyses with data acquired in real time by sensors distributed across the territory under study. In our case, we considered the Postgres database management system with the integration of PostGIS 17 extension.
PostGIS spatial extension for PostgreSQL is an open-source database implementation for geographic data, enabling spatial data to be managed within a relational database system. Based on the Simple Features Specification for SQL developed by the OGC, it provides a reliable platform for spatial analysis [46].
Processing of the necessary datasets requires a computation scripting environment connected to the database that can combine the information provided by raster and real-time sensor acquisitions. To achieve this goal, we employed the Python programming language (Python 3.11.10) inside the Anaconda open-source platform.
The Anaconda platform enables specialists to manage and deploy Python environments, offering a variety of libraries and tools that streamline the development of data science projects across different operating systems, including Windows, macOS, and Linux [47].
Designing a Python environment and generating a code to load the geospatial dataset and employ the Anaconda libraries makes it possible to run a routine that periodically uploads acquisitions from weather stations and processes precipitation maps as raster outputs at specific frequency intervals.
Once the structure for the remote processing and the storage of the territorial information is defined, this framework should be connected to the 3D WebGIS visualization in order to provide users in real time with the input and output geospatial dataset. To achieve this goal, it is necessary to activate a Web Map Service (WMS) to visualize and analyze the input and output levels of information on a browsing 3D WebGIS service. We considered the integration of two open-source geospatial server solutions, Geoserver and Mapserver. Both solutions are open-source platforms that support the standards developed by the OGC, allowing the publication of geospatial data on the web and the creation of web-based maps. Geoserver is a geospatial data server developed in Java that supports several data formats, including Shapefiles and rasters, with the possibility to share geospatial information providing web-based services as WMS and WFS for remote geospatial data visualization on the web [48].
Instead, Mapserver is an open-source platform written in C and developed for the publication of geospatial data on the web, with the possibility to render maps in several output formats via MapScript allowing the integration with different programming languages [49]. In the end, Geoserver represents a nice solution for the management of complex datasets and for the integration of several data sources; instead, Mapserver offers high performance in map rendering.
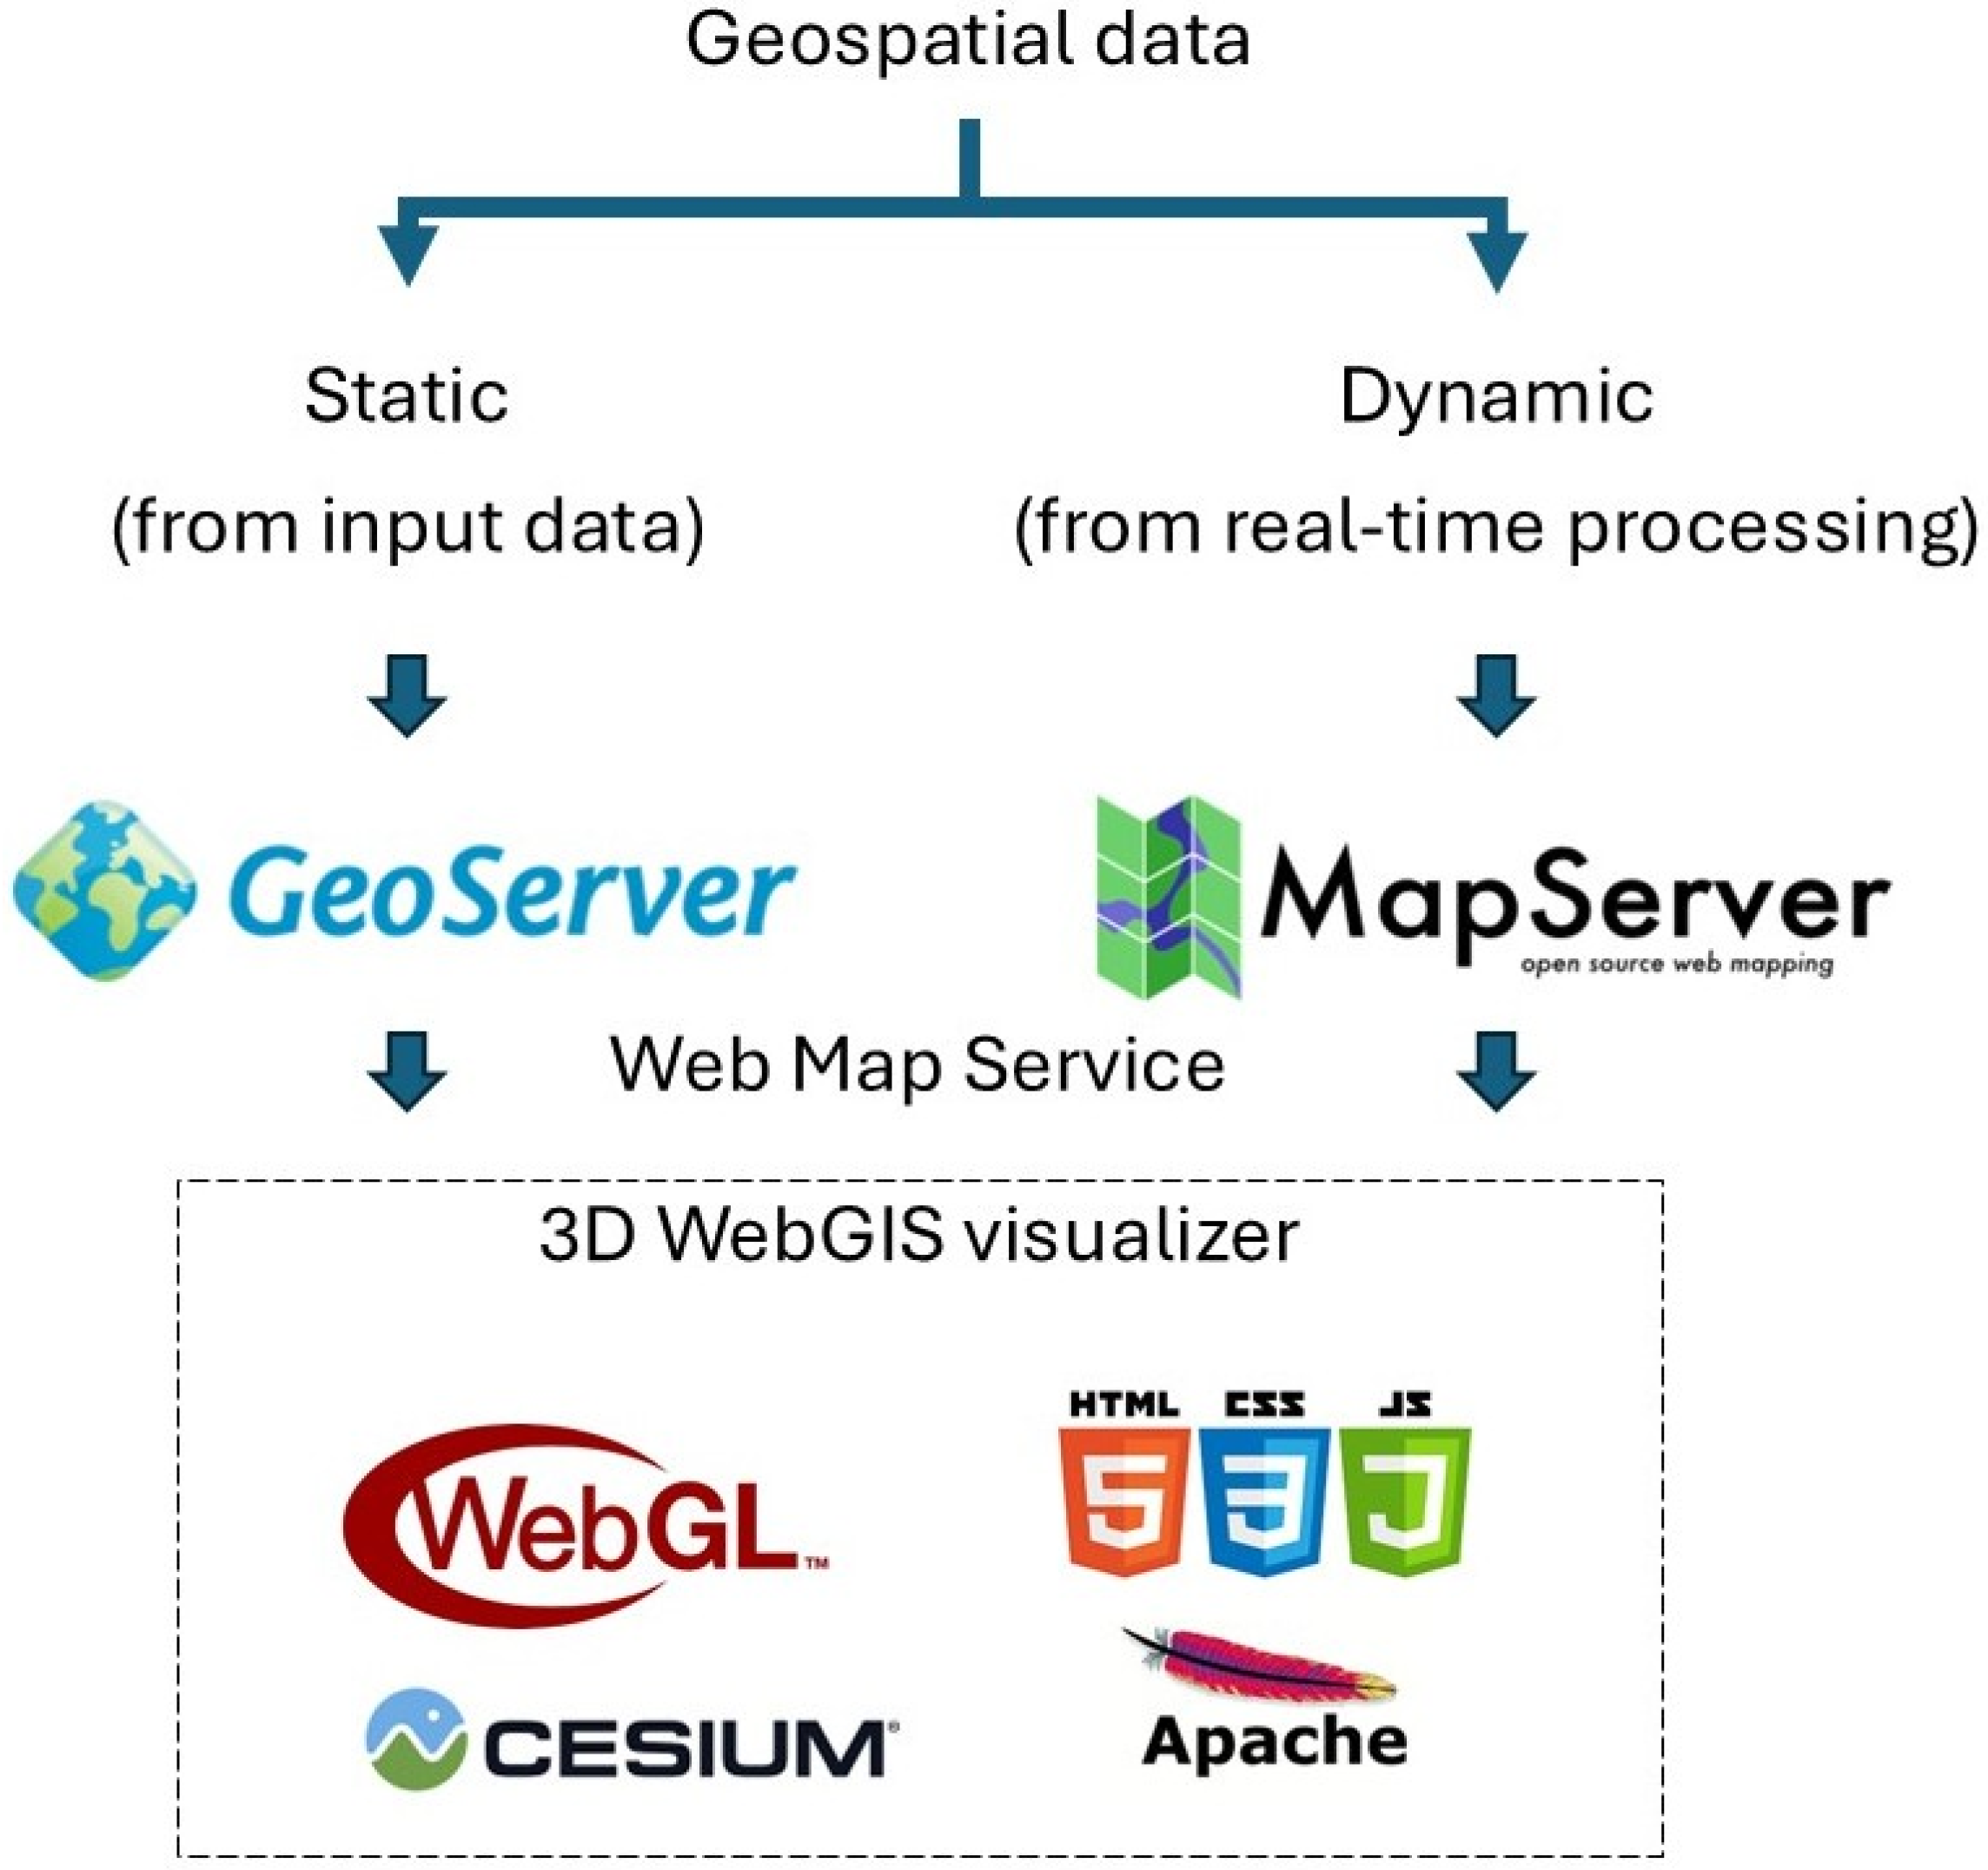
Considering this, we employed Geoserver for activating WMS visualization of static raster information and Mapserver for the real-time WMS visualization of the dataset stored in the database and involved in processing operations.
The last component of the framework is the WebGIS visualization, which consists of a globe-based open-source solution stored in Apache Webserver. In particular, we employed an html environment that includes Cesium.JS open-source JavaScript libraries based on WebGL technology.
Cesium.JS represents an open-source JavaScript library created for the generation of interactive and high-performance 3D globe-based applications to visualize on web browsers [50]. It is based on WebGL graphics libraries and allows specialists the development of dynamic geospatial applications without the need for browser plugin integration on the client side. Cesium.js supports a wide range of geospatial data formats, including WMS integrations, 3D tiles, GeoJSON, etc.
In this way, it is possible to visualize the input and output geospatial dataset in real time provided by the WMS service in a 3D geospatial Globe model.
The next section shows in detail the adopted solutions for the development of this framework.

3. Dynamic Mapping of Precipitations: The Case Study of Palermo (Italy)

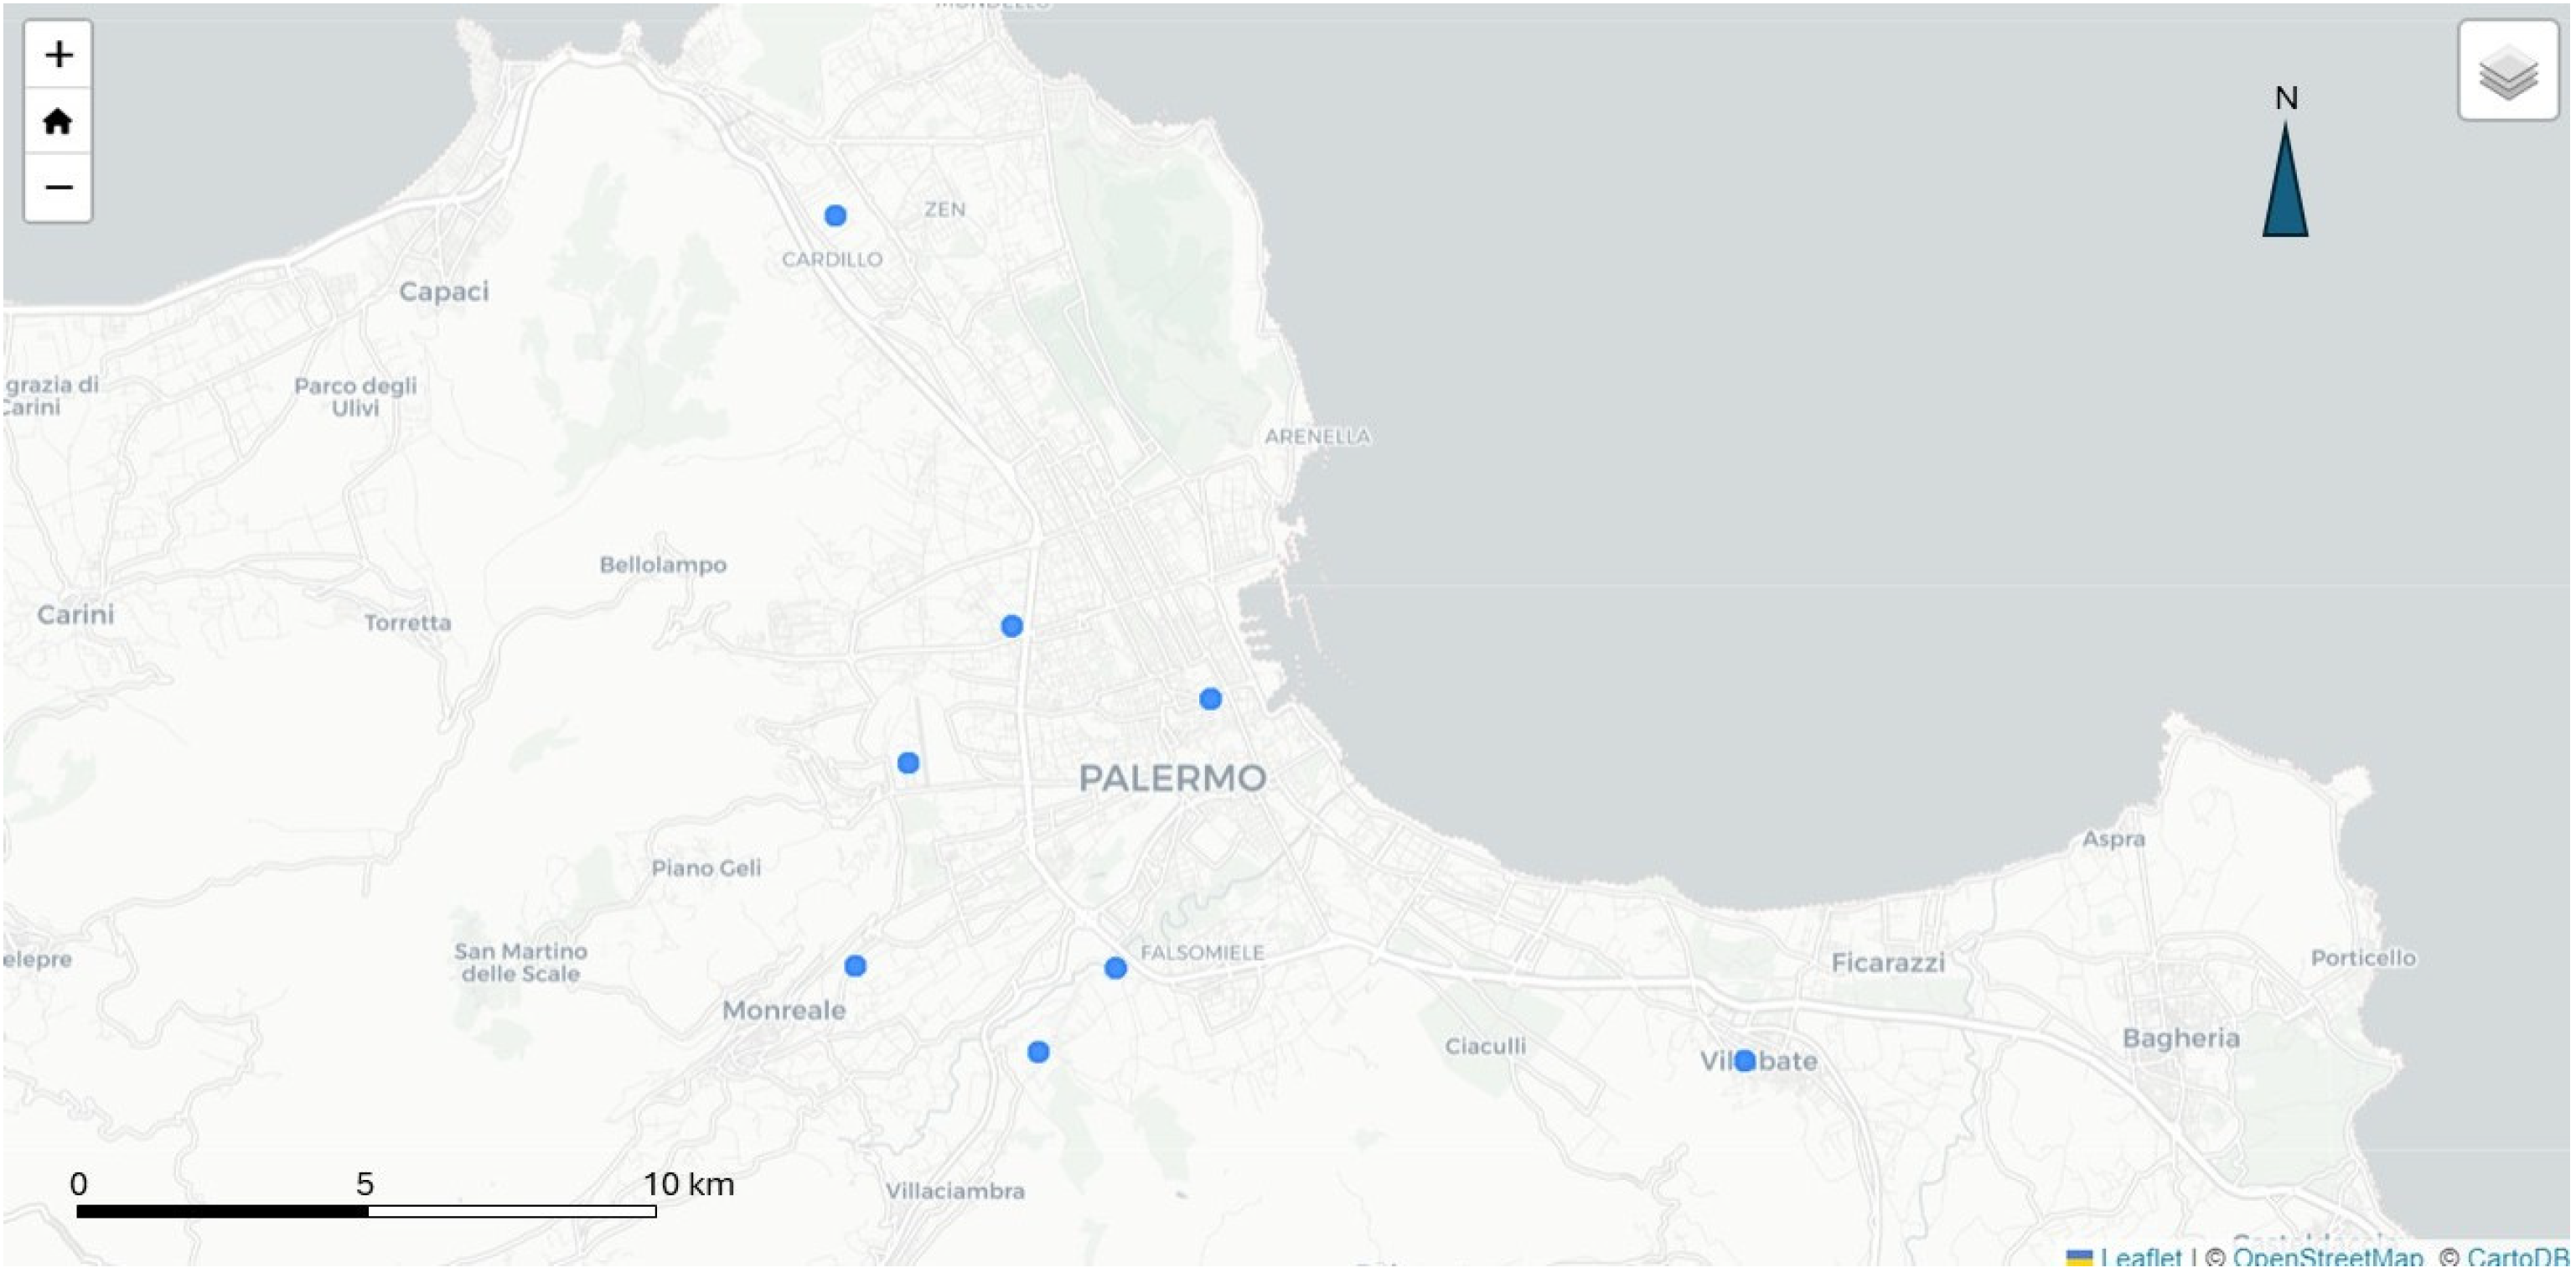
The integration of different open-source solutions generated a geospatial platform useful for the real-time analysis of weather events and terrain collapses related to hydrogeological risk. The case under study considered the real-time pluviometry acquisitions provided by eight weather stations in the urban context of Palermo (Italy) provided by ItaliaMeteo agency and selected as testbed of the platform [51] (Figure 2). To test the real-time functionalities of the platform, the goal of the experimentation was the dynamic generation and the real-time 3D WebGIS visualization of a raster pluviometry map involving the urban area of Palermo.
The main block of the framework is represented by the relational database management system Postgres (version 17 with pgAdmin 4 version 8.13) with the PostGIS extension. The employment of the database, combined with the use of Python scripts, allowed for remote storage and dynamic remote processing of geospatial data.
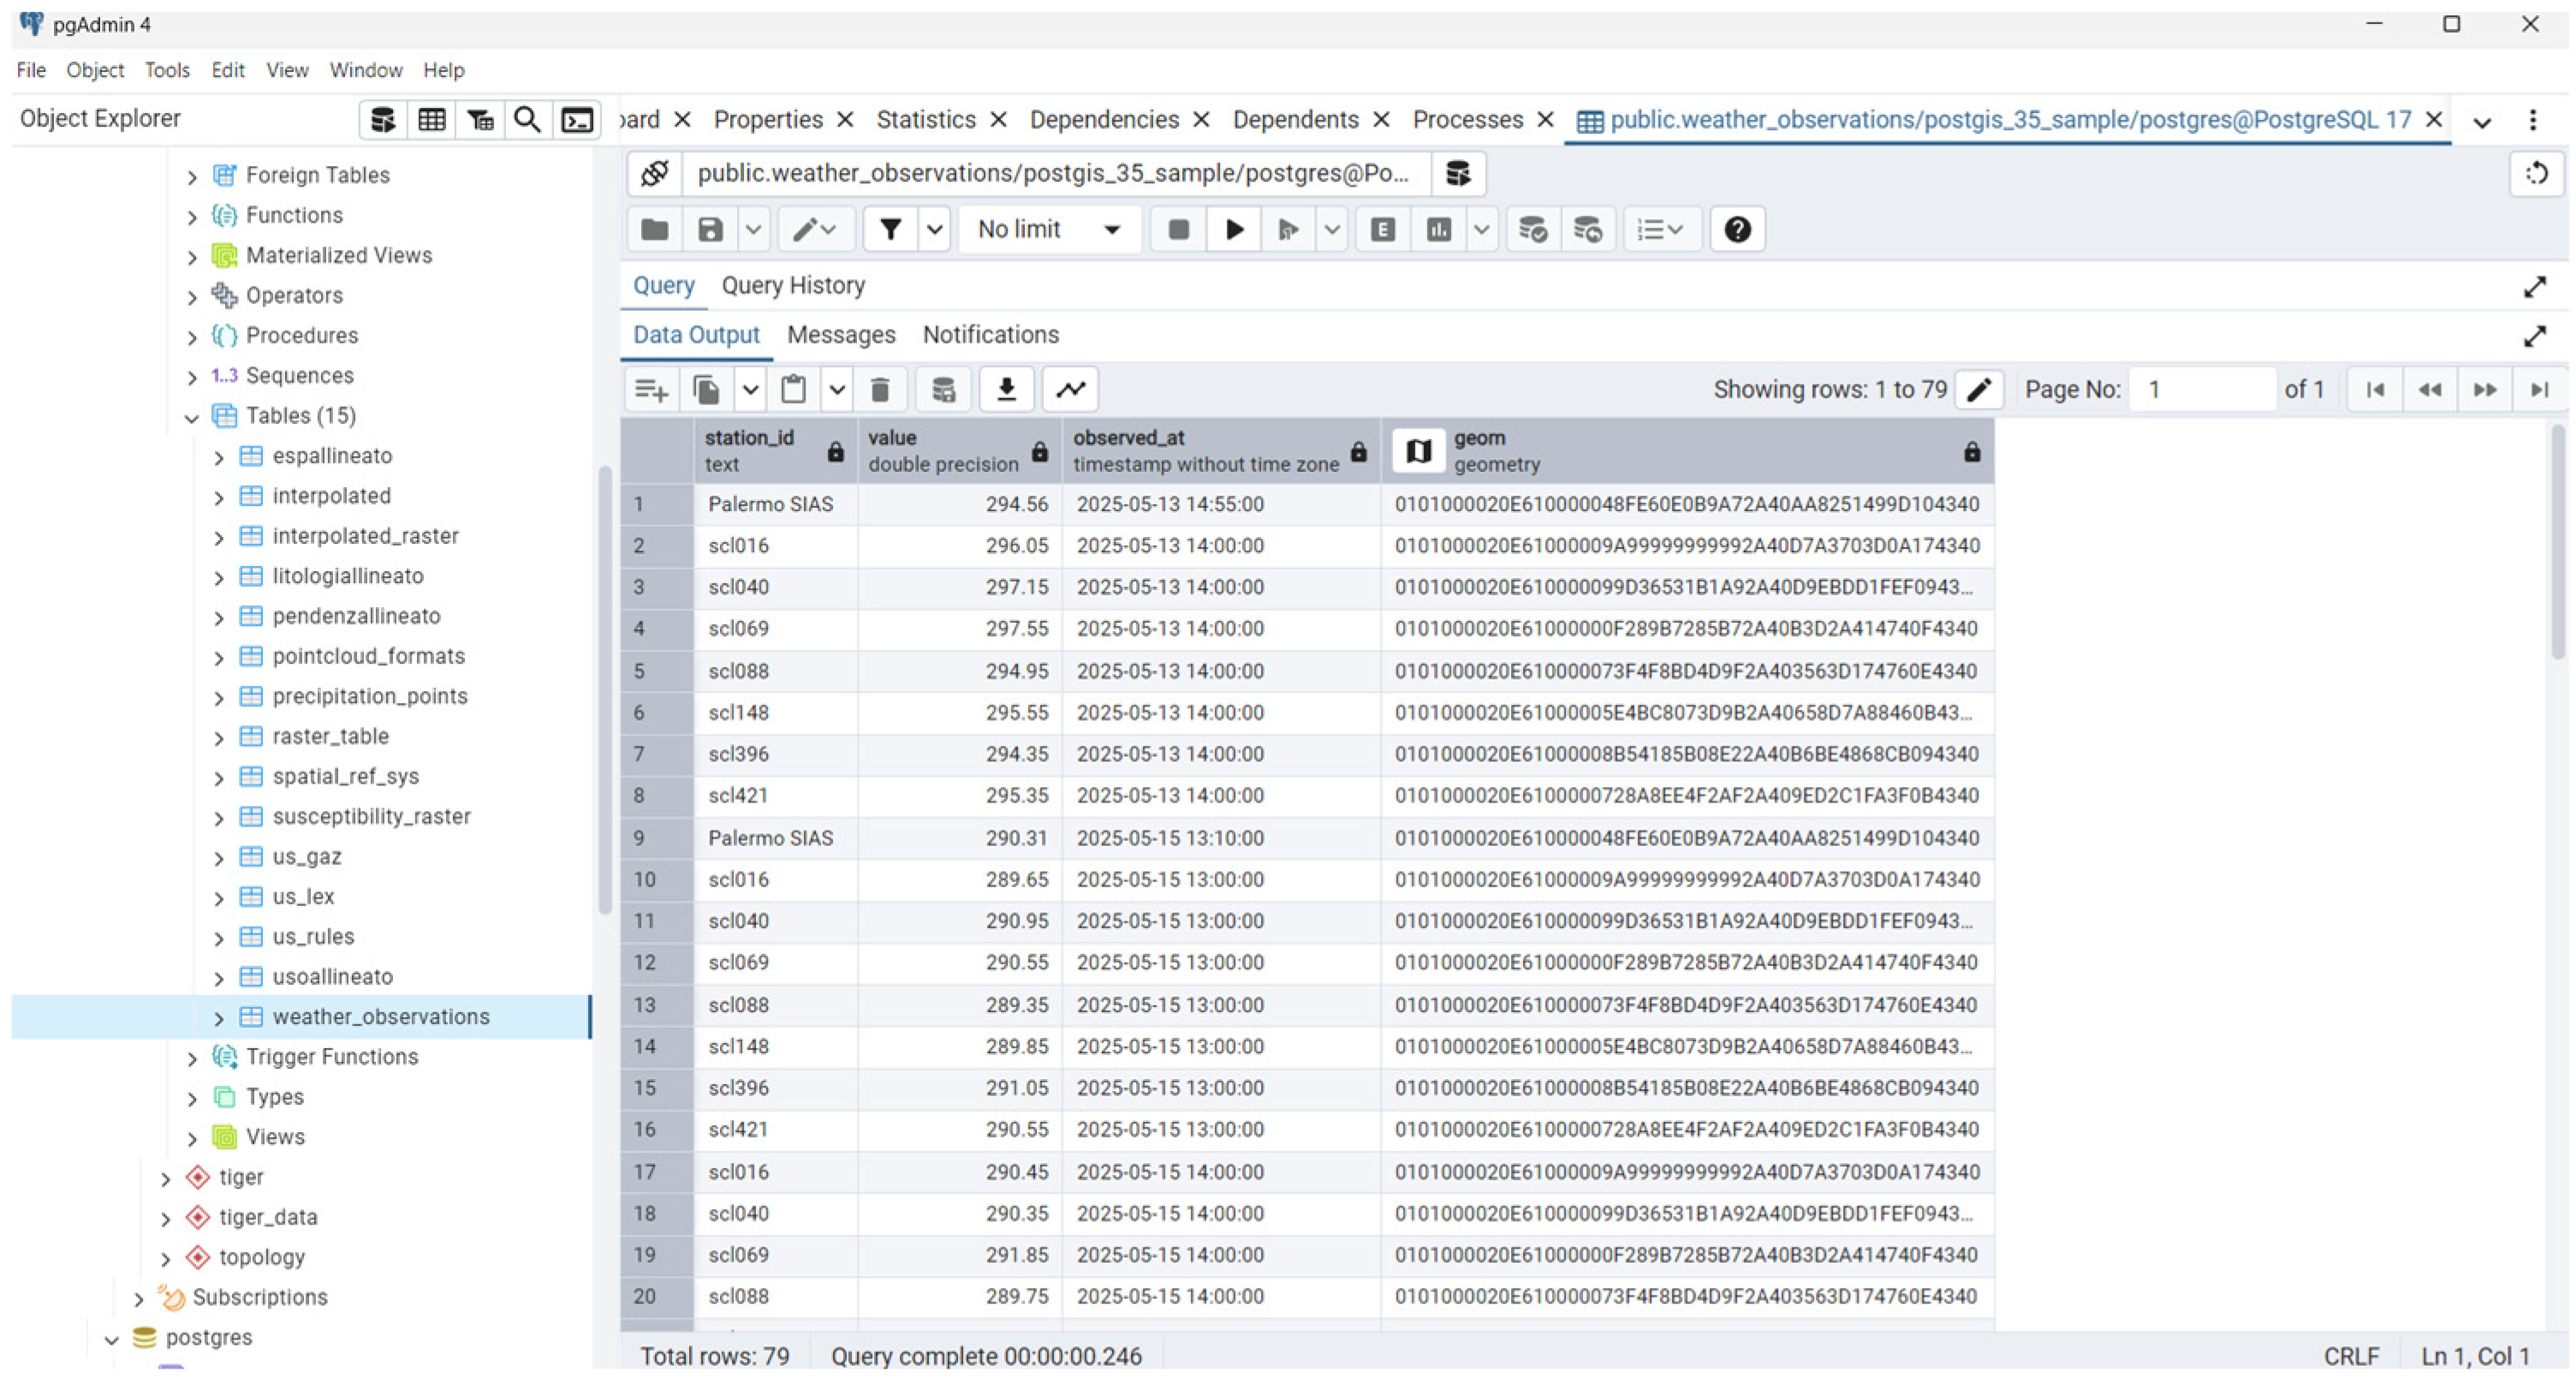
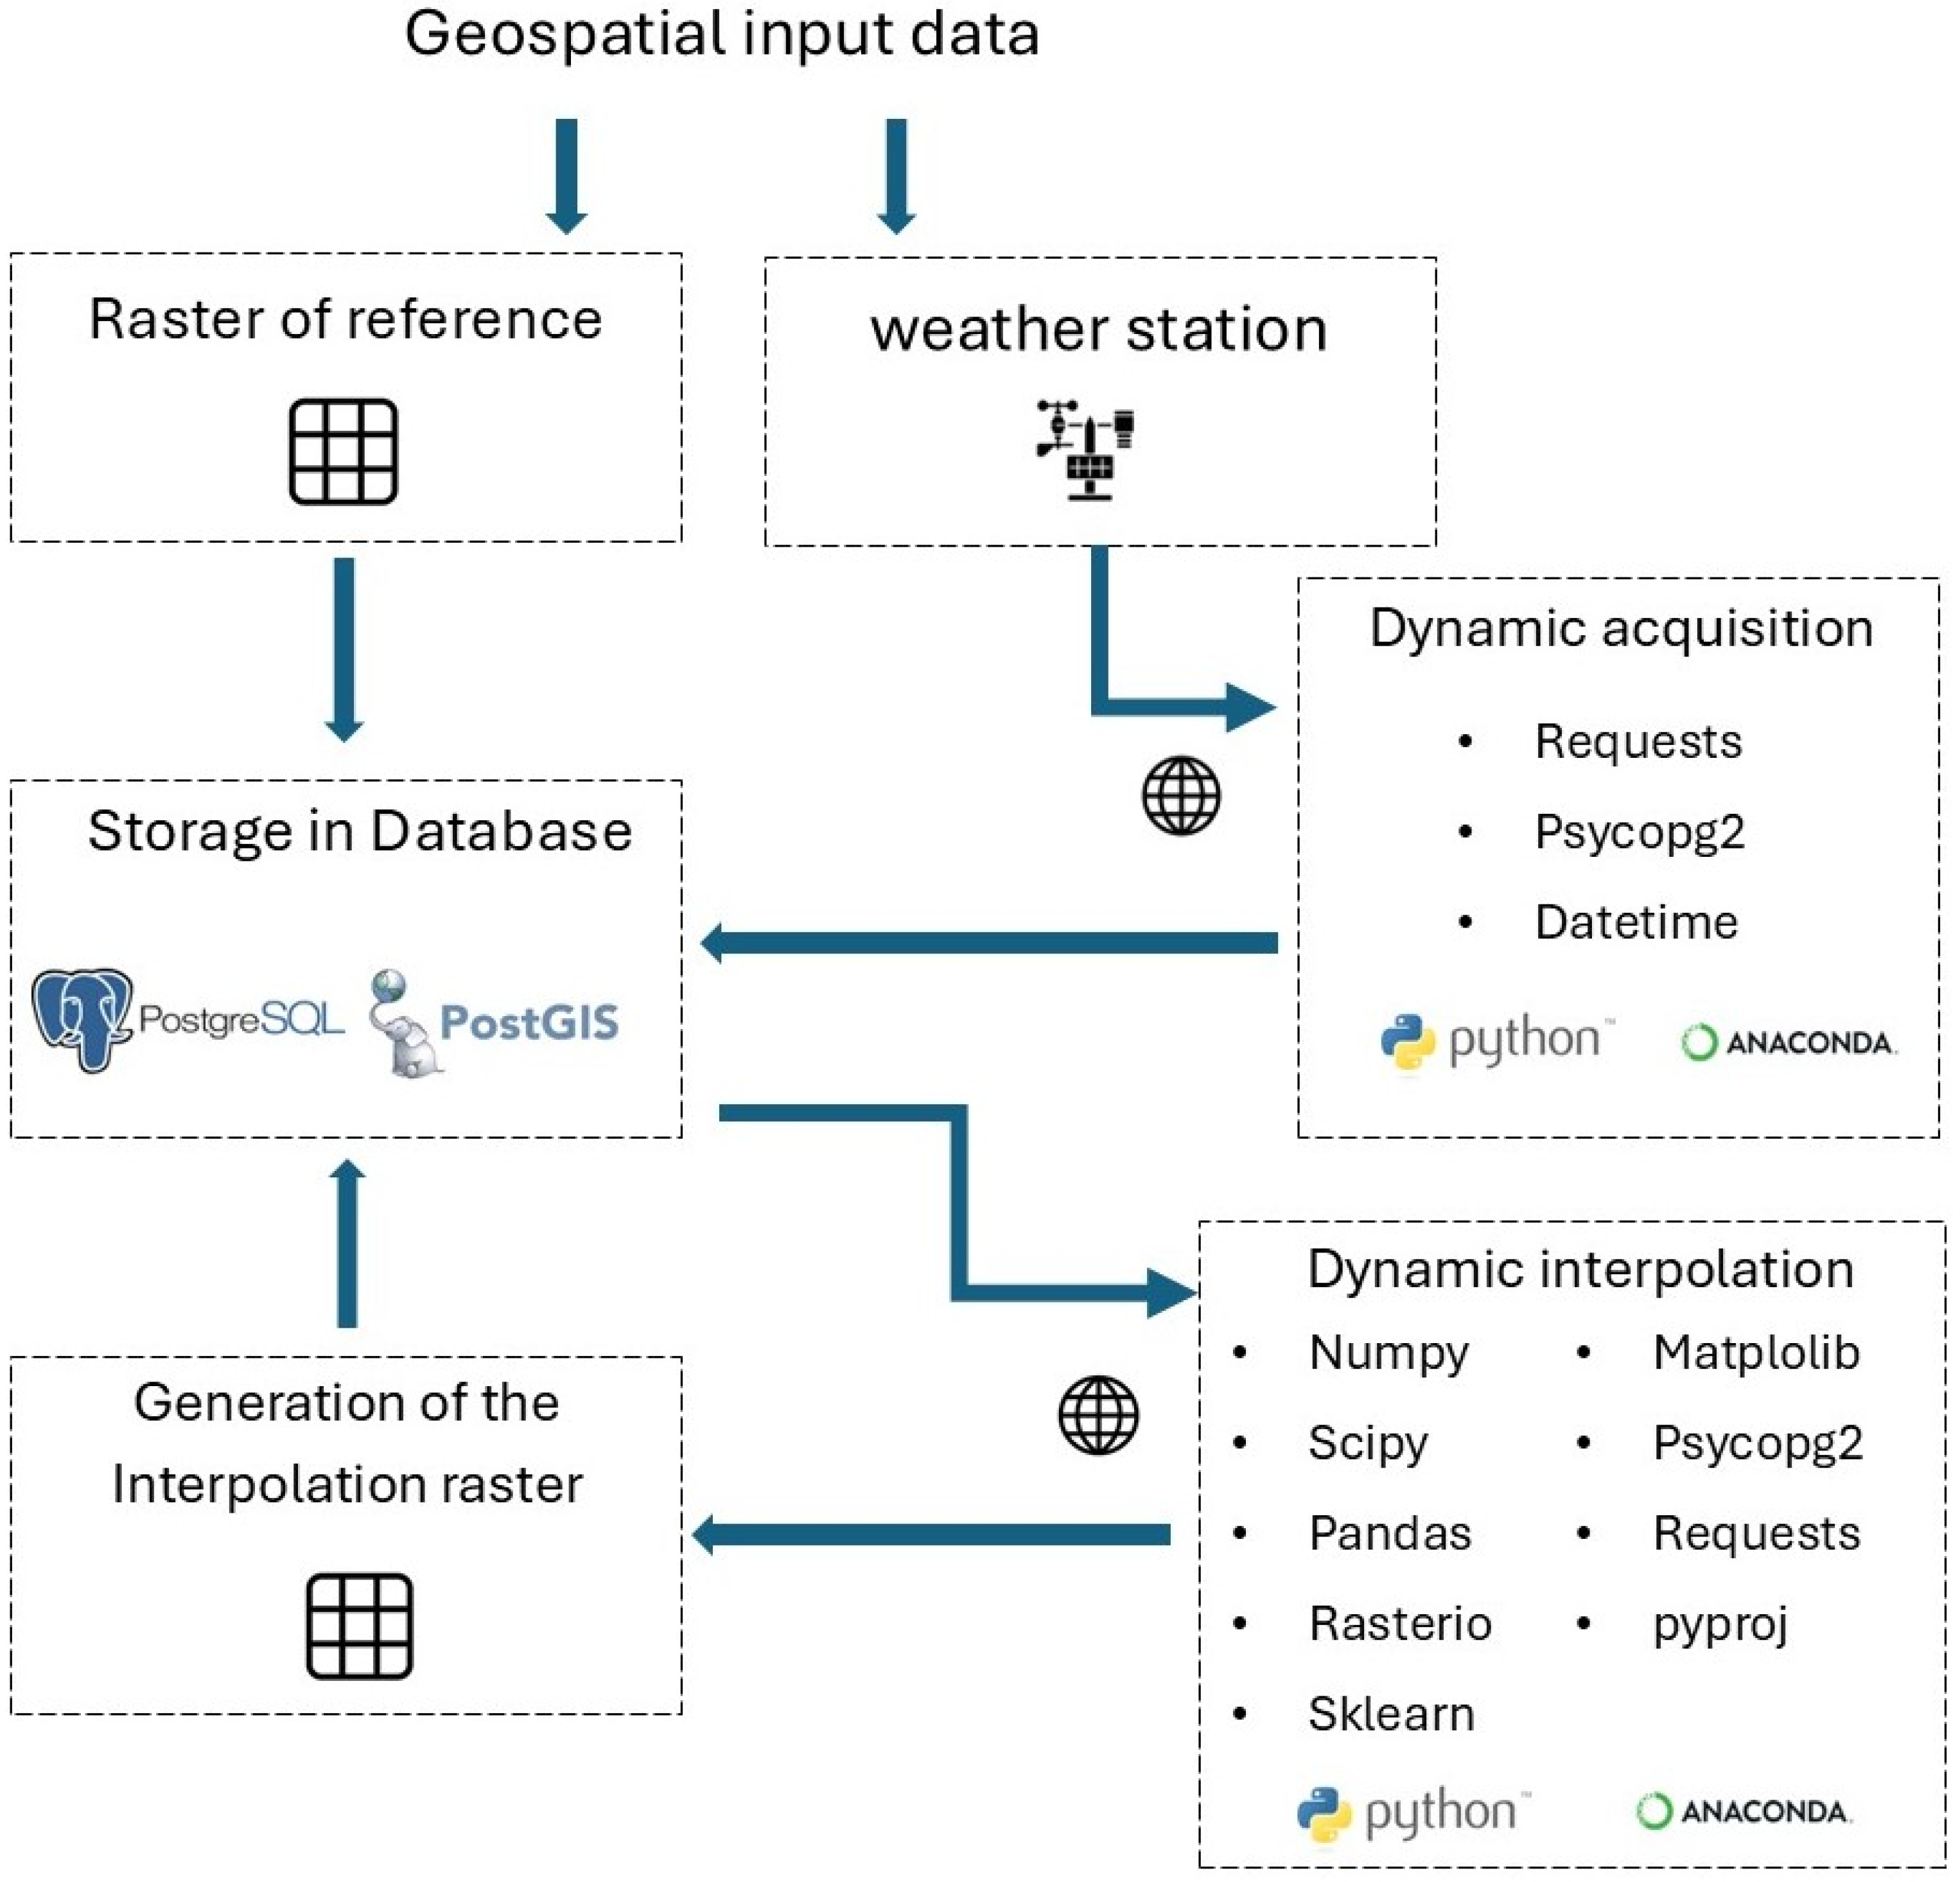
In detail, the real-time pluviometry acquisitions (provided by weather stations) were stored in the Postgres database using a Python script running on the Anaconda platform (version 3) that integrates Pandas, psycopg2, Datetime, and Requests libraries (Figure 3). This operation was designed following the INSPIRE indications [52], with a particular focus on the storage of geographic information. In fact, the python script, which allowed the real-time storage of information from the weather stations, uses the point as a geometric object and the EPSG:4326 as the Coordinate Reference System, following the INSPIRE indications. Also, the table ‘weather_observations’, used for the storage of the acquisitions, was designed according to the INSPIRE UML (Unified Modeling Language) for the MonitoringPoint class, considering the following for each acquisition:
  • Station id, a column that defines each weather station uniquely.
  • Observed_at, a column that defines the time of acquisition.
  • Value, a column that defines the double precision number indicating the single acquisition (mm) of A water column.
The processing operations involved the pluviometry acquisitions stored in the Postgres database. The interpolation process was projected on a reference raster that defined the boundaries, the resolution, and the CRS of the new interpolation raster. An interpolation based on IDW (Inverse Distance Weighting) processing was adopted in a Python script running on the Anaconda platform. This implementation contains two key parameters (power and k) that control how much influence nearby station points have on the interpolated value. The first parameter, power, is the exponent of the distance-weighting function and regulates the influence of the station points on the basis of the distance between them and the query points of the raster. Higher values of power make weights fall off more sharply with distance; instead, lower power values give a gentler fall off. In our case, we settled the power = 2.
The k parameter represents the number of nearest neighborhoods included in the weighting calculation. A small value of k generates only a local influence of the station points; instead, a large value of k generates an influence distributed on a larger neighborhood. In our case, we settled k = 4. The choice of the best values of power and k to adopt in the model strictly depends on the distribution (in terms of distance and number) of the station points.
The script was customized to generate a new raster based on the last simultaneous pluviometry acquisition that involved at least seven of the eight stations. This choice is linked to the non-uniform distribution of the station points in the area of study in order to achieve a balanced representation of the interpolation and avoiding a too-strong influence of isolated station points.
The output of the interpolation process was finally stored in the Postgres database as raster using the WGS 84 reference system. The process was integrated into a Python script in Anaconda including several open-source libraries (Figure 4):
  • Numpy and Scipy, open-source Python libraries for matrix operations, multidimentional arrays, and math functions.
  • Pandas, an open-source Python library for the management of tables and data frameworks.
  • Rasterio, an open-source Python library for accessing geospatial raster data in GIS environment.
  • Sklearn, an open-source Python library for classification, regression, clustering, and machines for vectorial support.
  • Matplotlib 3.10, an open-source Python library for creating static, animated, and interactive images from Python operations.
  • psycopg2, an open-source Python library for communication between Python scripts and the PostgreSQL database.
These operations allow specialists to extract raster data information from the PostgreSQL database, make the processing operations, and save the results in the database. The running of the script on the Anaconda platform allows the refreshing of the results in real time in raster format.
Considering the activation of the WMS service (as indicated in the ISPIRE guidelines), the adoption of Geoserver (version 2.26.2) should be preferred to host the static geospatial dataset due to the simple desktop interface for the management of raster information. In this example, it was not necessary to load further static raster information because the satellite map and the 3 DEM were provided by the Cesium server directly, but the .html file that defines the 3D WebGIS visualization is ready to host raster information from Geoserver.
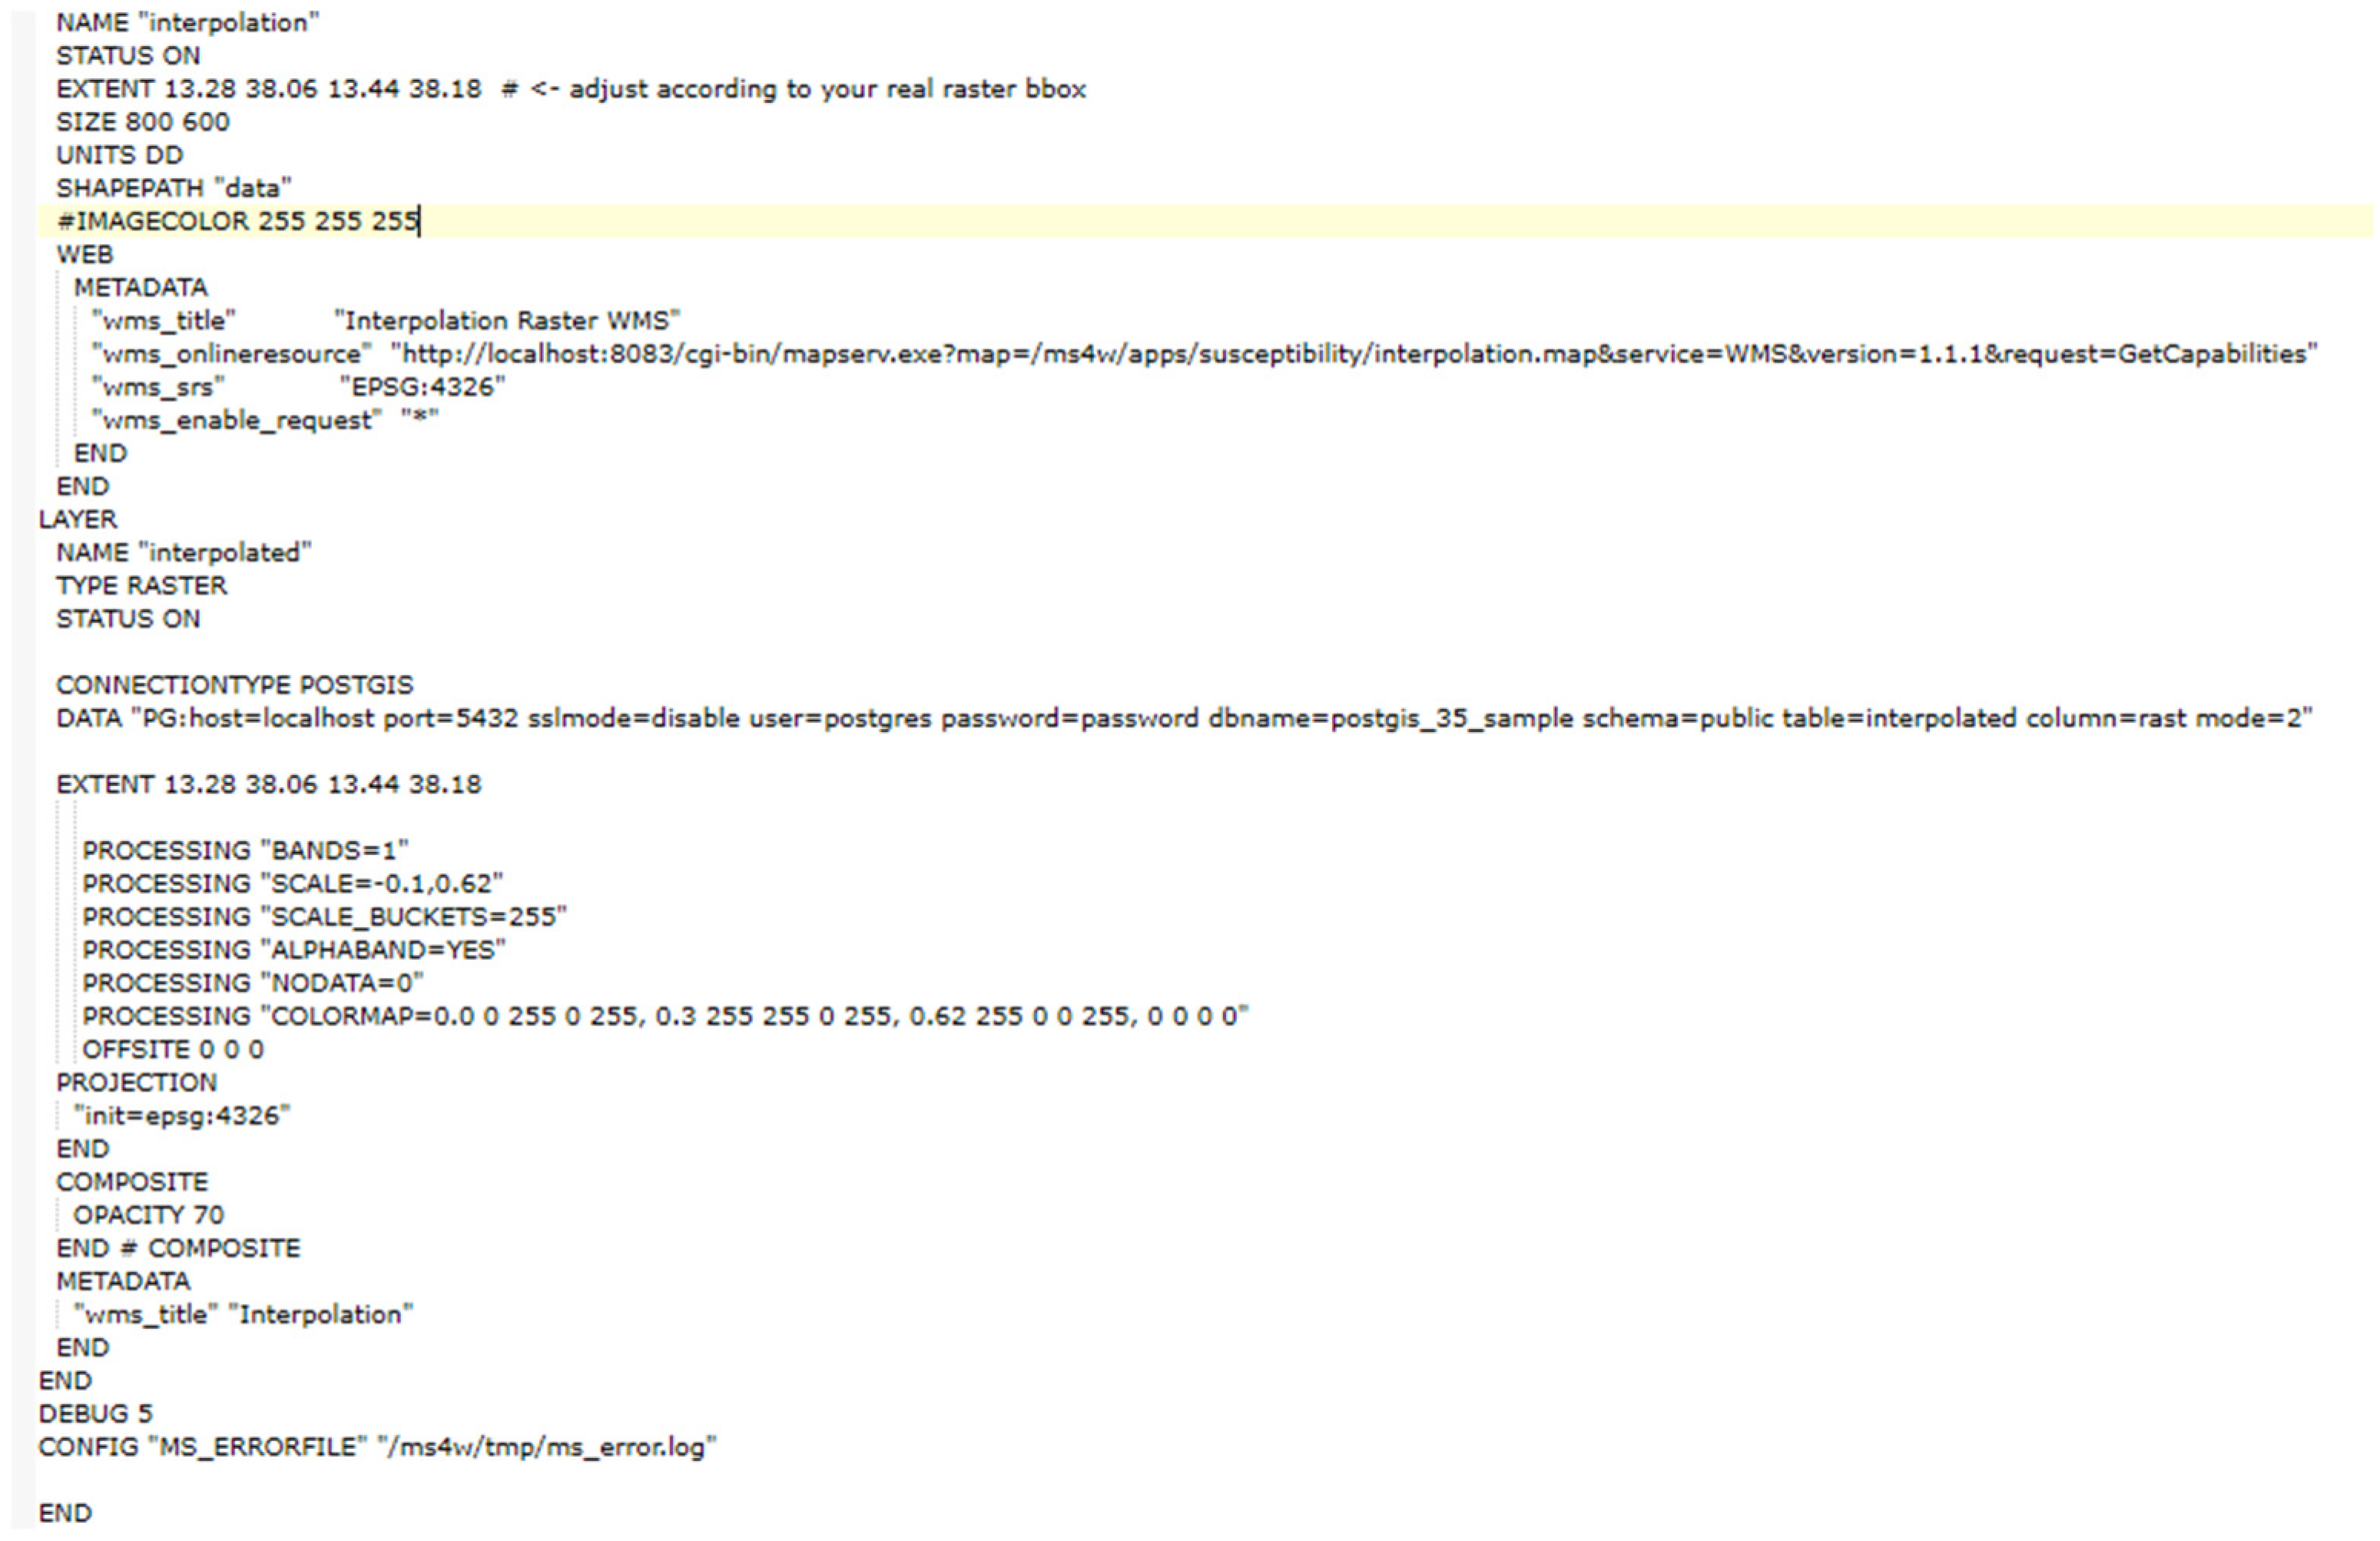
Instead, the dataset involved in geospatial processing needed a direct connection with the Postgres database. This requirement led us to the use of Mapserver (MS4W version 5.0.0), which guaranteed a real-time connection with the PostgreSQL database. For this reason, a .map file was customized and locally stored in the Mapserver directory. The strings inside the .map file enabled the WMS service necessary to visualize it in WebGIS. Even in the .map file, the visualization parameters, the projection properties, and the connection of the Postgres database with the PostGIS extension were defined (Figure 5). The WMS service was then activated in the .html file defining the 3D WebGIS visualization in some JavaScript strings (Figure 6).
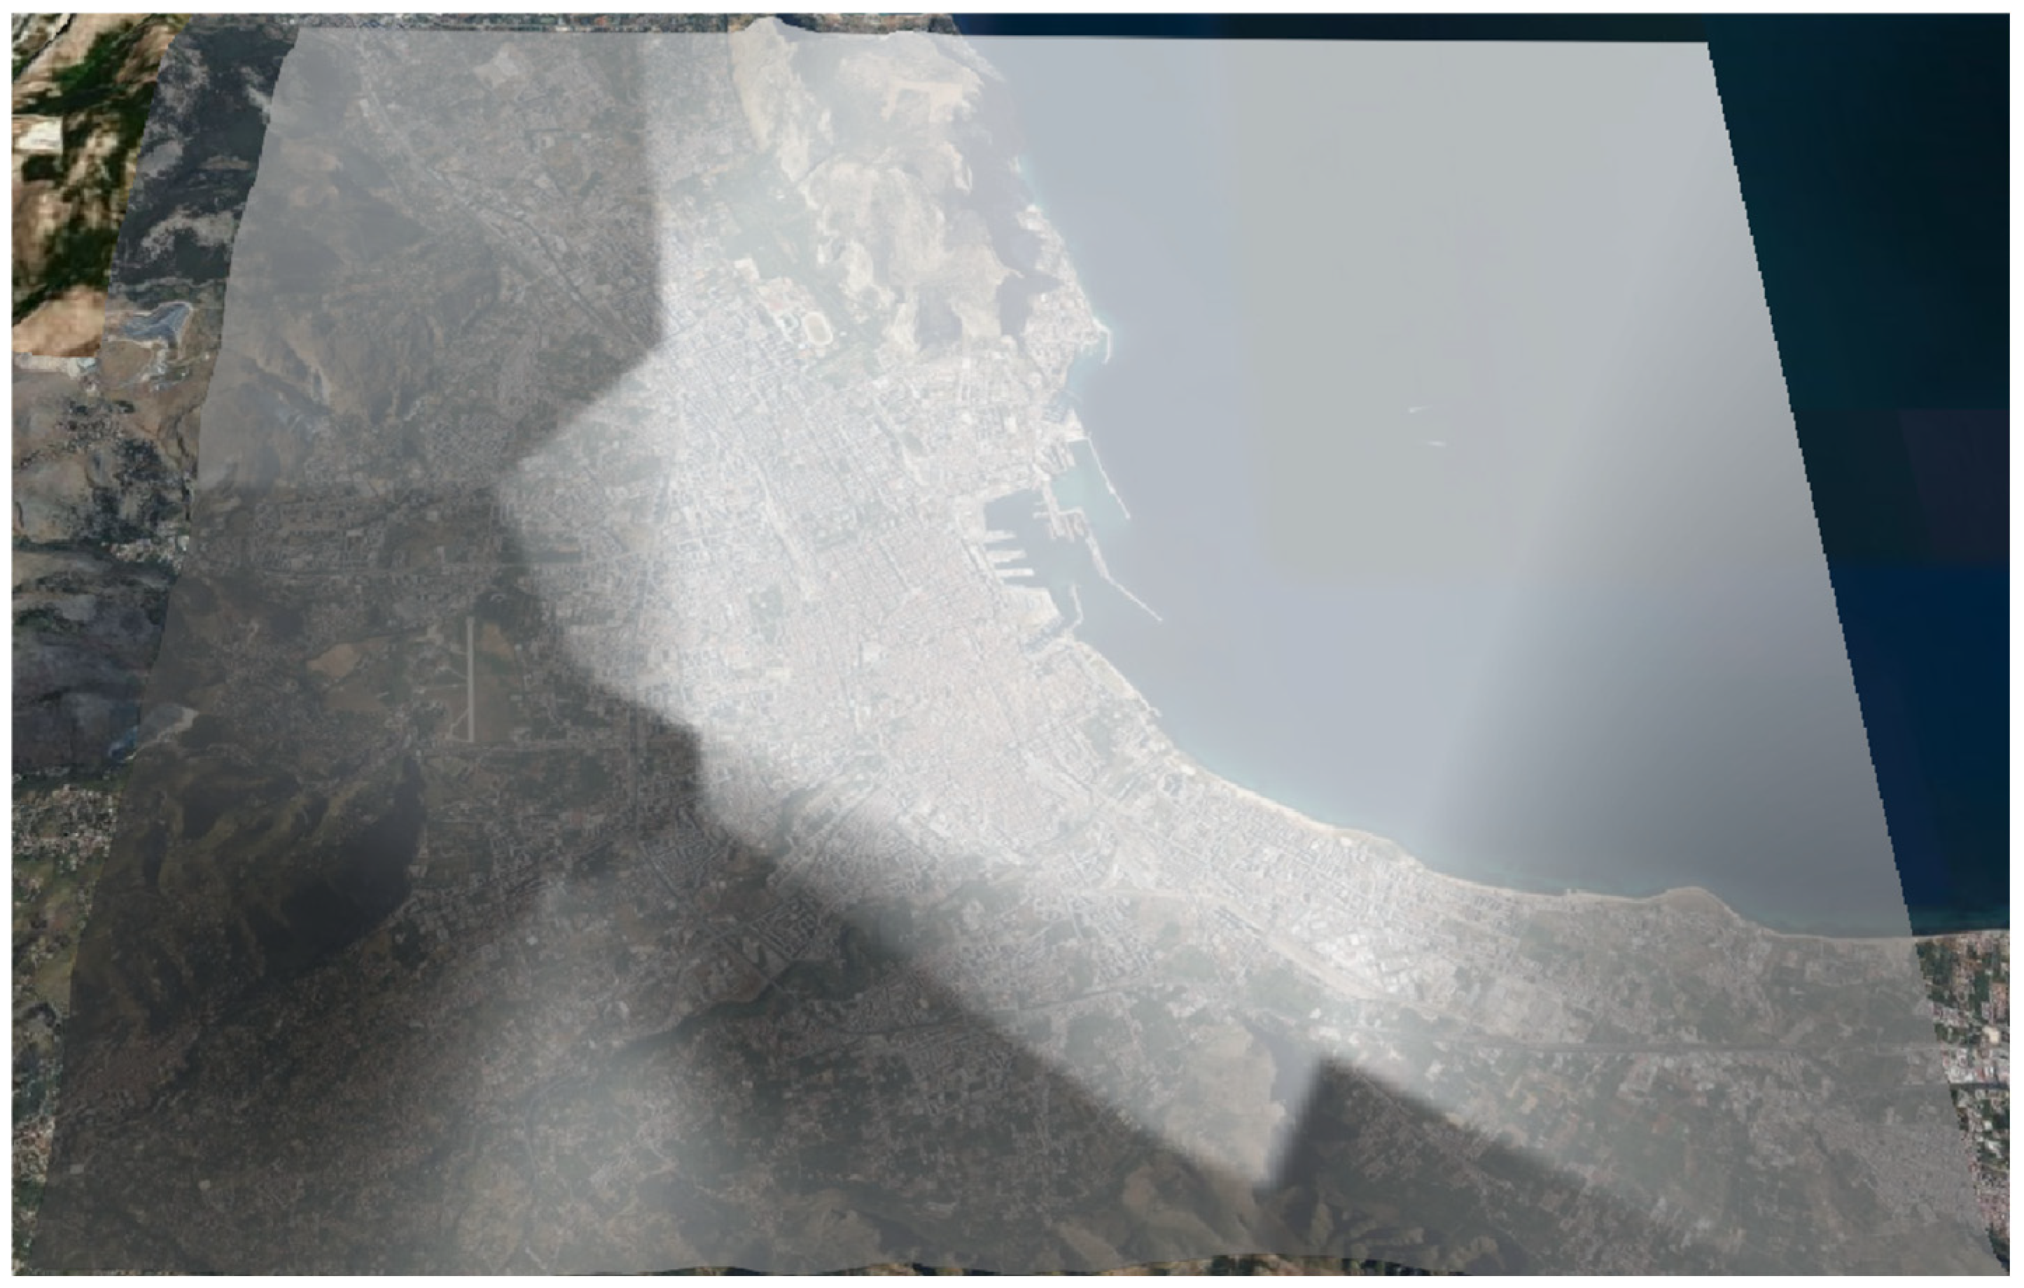
The 3D WebGIS visualization (Figure 7) was developed inside an .html file (as anticipated before) using Cesium.JS JavaScript libraries (version 1.89). The Apache webserver (wampstack version 8.1.2) hosted the file and the libraries in the same folder. The WebGIS visualization integrated geospatial data information provided by the Cesium server and the real-time processed dataset provided by the WMS connection to Mapserver (Figure 8). In the case of this study, the platform visualized the dynamic pluviometry map inside the urban area of Palermo (Italy), with a normalized scale from zero (in black) to one in (white), considering the dataset acquired during the precipitation of 13 May 2025.
In this way, the system is accessible on the web, allowing users the real-time remote visualization of geospatial processing. The system is supported by the most common web browsers that are WebGL-compliant for desktop and mobile devices.
If we want to host the entire system in the same workstation, we need to consider four different ports for guaranteeing all the functionalities of the service: one for the Postgres database, one for the Apache webserver, one for Geoserver, and one for Mapserver.

4. Discussion

The developed solution represents a framework for the real-time monitoring of territorial assets on the basis of geospatial data updated and hosted in a remote database with open-source technology. Although Decision Support Systems and Integrated Spatial Analysis represent two of the main literature contributions in WebGIS applications, a relevant scientific gap is highlighted in hazard studies [53]. In this scenario, our contribution can be strategic for low-cost applications in these fields of research, experimenting with dynamic pluviometry raster visualization on 3D WebGIS based on weather station acquisitions.
Today, similar WebGIS structures are adopted for web geospatial analysis regarding the monitoring of infrastructures [54]; for the study of hydrodynamic simulations on the basis of bathymetric, topographic, and land cover data [55]; for 3D flood simulations in watercourses in rainfall events [56]; or towards the creation of a simplified digital twin for the management of data related to hydrogeological hazards [57].
Considering the literature, WebGIS applications are usually limited to visualization and analysis regarding geospatial data previously locally elaborated, sometimes with the integration of dynamic information provided by real-time acquisition from remote servers and implemented in a platform in real time [57,58]. In particular, in [57], an architecture based on two levels is deployed, where the first level considers a local processing to build a GIS-based database and the second level consists of a web server that integrates a dynamic WebGIS map generation. In [58], instead, a first prototypal dynamic integration in a 3D WebGIS is proposed, integrating the real-time weather information automatically provided by remote public servers.
In our case, the developed framework suggests making a further step, with an automatic raster generation and real-time WebGIS visualization of geospatial data dynamically generated on the basis of sensor network acquisitions provided by public repositories. It represents further research improvement towards the development of dynamic digital twinning geospatial strategies. Our structure allows specialists to directly make dynamic raster elaborations and upload the results in a remote database in order to manage in real time the geospatial dataset and visualize the updated results in the WebGIS platform. All of this is achieved with the employment of open-source technologies. However, the disadvantage of this solution is the programming skills required from developers, which are essential to perform geospatial processing in Python.

5. Conclusions

This paper shows a framework for the dynamic management of geospatial raster dataset aimed at territorial monitoring and analysis activities. The manuscript shows a case of study based on the real-time raster generation of a pluviometry map, employing the dataset remotely provided by the urban weather stations of Palermo (Italy). The adoption of open-source technology spreads the diffusion of this application without the necessity of property software contributions. The platform, as it is conceived, is designed to host real-time information provided by sensor networks for a dynamic remote elaboration of the geospatial dataset and real-time visualization in a 3D WebGIS platform on the most common web browsers, enabling a digital twinning process. The employment of the Anaconda platform for the implementation of geospatial operations granted the use of automatic routines based on Python scripts with the possibility to dynamically store raster elaborations in the database. The platform can be hosted in a single workstation or can be configured to be distributed in different servers, because each module is independent and remotely connected to the others.
The next improvement of the research will consider case study applications that involve not only the dynamic monitoring of precipitations for the identification of possible hazard levels but a full hydrogeological risk management with the contribution of datasets provided by real-time sensor acquisitions in situ and dynamic geospatial raster elaborations.

Author Contributions

Conceptualization, M.L.G., G.M. and A.A.; methodology, M.L.G., G.M. and A.A.; validation, M.L.G., G.M. and A.A.; formal analysis, M.L.G., G.M. and A.A.; investigation, M.L.G., G.M. and A.A.; resources, M.L.G., G.M. and A.A.; data curation, M.L.G., G.M. and A.A.; writing—original draft preparation, M.L.G., G.M. and A.A.; writing—review and editing, M.L.G., G.M. and A.A.; visualization, M.L.G., G.M. and A.A.; supervision, M.L.G., G.M. and A.A.; project administration, M.L.G., G.M. and A.A.; funding acquisition, M.L.G., G.M. and A.A. All authors have read and agreed to the published version of the manuscript.

Funding

This study was carried out within the PRIN-PNRR 2022 funded by the Italian Ministry of University and Research (MUR) under Grant Assignment Decree n.1388 adopted on 1 September 2023—CUP J53D23019270001.

Data Availability Statement

A demo version of the source codes is available at this link: https://github.com/marcellolg1987/Real-Time-Precipitation-Interpolation-and-Mapping-Platform (accessed on 25 July 2025).

Acknowledgments

The authors acknowledge financial support under the National Recovery and Resilience Plan (NRRP), Mission 4, Component 2, Investment 1.1, Call for tender No. 1409 published on 14 September 2022 by the Italian Ministry of University and Research (MUR), funded by the European Union—NextGenerationEU–Project WebGIS 4D with DSS (Decision Support System) connotation for prediction of landslide susceptibility and hazard through innovative simulation systems with emerging properties such as 3D Cellular Automata, Neural Networks and SPH Fluids—CUP J53D23019270001—Grant Assignment Decree No. 1388 adopted on 1 September 2023 by the Italian Ministry of University and Research (MUR).

Conflicts of Interest

The authors declare no conflicts of interest.

References

  1. Broome, J. The ethics of climate change. Sci. Am. 2008, 298, 96–102. [Google Scholar] [CrossRef]
  2. Zhang, T.; Wang, W.; An, B.; Gao, T.; Yao, T. Ice thickness and morphological analysis reveal the future glacial lake distribution and formation probability in the Tibetan Plateau and its surroundings. Glob. Planet. Change 2022, 216, 103923. [Google Scholar] [CrossRef]
  3. Patton, A.I.; Rathburn, S.L.; Capps, D.M. Landslide response to climate change in permafrost regions. Geomorphology 2019, 340, 116–128. [Google Scholar] [CrossRef]
  4. Stoffel, M.; Huggel, C. Effects of climate change on mass movements in mountain environments. Prog. Phys. Geogr. 2012, 36, 421–439. [Google Scholar] [CrossRef]
  5. Turner, J.; Barrand, N.E.; Bracegirdle, T.J.; Convey, P.; Hodgson, D.A.; Jarvis, M.; Jenkins, A.; Marshall, G.; Meredith, M.P.; Roscoe, H. Antarctic climate change and the environment: An update. Polar Rec. 2014, 50, 237–259. [Google Scholar] [CrossRef]
  6. Escanilla-Minchel, R.; Alcayaga, H.; Soto-Alvarez, M.; Kinnard, C.; Urrutia, R. Evaluation of the Impact of Climate Change on Runoff Generation in an Andean Glacier Watershed. Water 2020, 12, 3547. [Google Scholar] [CrossRef]
  7. Jeppesen, E.; Brucet, S.; Naselli-Flores, L.; Papastergiadou, E.; Stefanidis, K.; Nõges, T.; Nõges, P.; Attayde, J.L.; Zohary, T.; Coppens, J.; et al. Ecological impacts of global warming and water abstraction on lakes and reservoirs due to change in water level and related changes in salinity. Hydrobiologia 2015, 750, 201–227. [Google Scholar] [CrossRef]
  8. Sawada, Y.; Takasaki, Y. Natural disaster poverty and development: An Introduction. World Dev. 2017, 94, 2–15. [Google Scholar] [CrossRef]
  9. Di Baldassarre, G.; Nohrstedt, D.; Mård, J.; Burchardt, S.; Albin, C.; Bondesson, S.; Breinl, K.; Deegan, F.M.; Fuentes, D.; Lopez, M.G.; et al. An Integrative Research Framework to Unravel the Interplay of Natural Hazards and Vulnerabilities. Earth’s Future 2018, 6, 305–310. [Google Scholar] [CrossRef]
  10. Jongman, B.; Winsemius, H.; Aerts, J.C.J.H.; Ward, P.J. Declining vulnerability to river floods and the global benefits of adaptation. Proc. Nat. Acad. Sci. USA 2015, 112, E2271–E2280. [Google Scholar] [CrossRef]
  11. Mård, J.; Di Baldassarre, G.; Mazzoleni, M. Nighttime light data reveal how flood protection shapes human proximity to rivers. Sci. Adv. 2018, 4, eaar5779. [Google Scholar] [CrossRef]
  12. Kreibich, H.; Di Baldassarre, G.; Vorogushyn, S.; Aerts, J.C.J.H.; Apel, H.; Aronica, G.T.; Arnbjerg-Nielsen, K.; Bouwer, L.M.; Bubeck, P.; Caloiero, T.; et al. Adaptation to flood risk: Results of international paired flood event studies. Earth’s Future 2017, 5, 953–965. [Google Scholar] [CrossRef]
  13. Mondino, E.; Scolobig, A.; Borga, M.; Albrecht, F.; Mård, J.; Weyrich, P.; Di Baldassarre, G. Exploring changes in hydrogeological risk awareness and preparedness over time: A case study in northeastern Italy. Hydrol. Sci. J. 2020, 65, 1049–1059. [Google Scholar] [CrossRef]
  14. Bernello, G.; Mondino, E.; Bortolini, L. People’s Perception of Nature-Based Solutions for Flood Mitigation: The Case of Veneto Region (Italy). Sustainability 2022, 14, 4621. [Google Scholar] [CrossRef]
  15. Ponziani, F.; Pandolfo, C.; Stelluti, M.; Berni, N.; Brocca, L.; Moramarco, T. Assessment of rainfall thresholds and soil moisture modeling for operational hydrogeological risk prevention in the Umbria region (central Italy). Landslides 2012, 9, 229–237. [Google Scholar] [CrossRef]
  16. Li, Y.; Mo, P. A unified landslide classification system for loess slopes: A critical review. Geomorphology 2019, 340, 67–83. [Google Scholar] [CrossRef]
  17. Barrile, V.; Genovese, E.; Cotroneo, F. Geomatics, soft computing, and innovative simulator: Prediction of susceptibility to landslide risk. AIMS Geosci. 2024, 10, 399–418. [Google Scholar] [CrossRef]
  18. Mangiameli, M.; Cappello, A.; Mussumeci, G. Spatial data and GIS for the assessment of the environmental impact at Mount Etna. Ann. Geophys. 2025, 68, V112. [Google Scholar] [CrossRef]
  19. Leoni, G.; Barchiesi, F.; Catallo, F.; Dramis, F.; Fubelli, G.; Lucifora, S.; Puglisi, C. GIS Methodology to Assess Landslide Susceptibility: Application to a River Catchment of Central Italy. J. Maps 2009, 5, 87–93. [Google Scholar] [CrossRef]
  20. Rossi, M.; Guzzetti, F.; Reichenbach, P.; Mondini, A.; Peruccacci, S. Optimal landslide susceptibility zonation based on multiple forecasts. Geomorphology 2010, 114, 129–142. [Google Scholar] [CrossRef]
  21. Shaoqiang, M.; Zhenming, S.; Gang, L.; Ming, P.; Liu, L.; Hongchao, Z.; Changshi, Z. A novel deep learning framework for landslide susceptibility assessment using improved deep belief networks with the intelligent optimization algorithm. Comput. Geotech. 2024, 167, 106106. [Google Scholar] [CrossRef]
  22. Gazali, A.; Leila, H.B.; Tamer, E.; Gary, T. Optimizing landslide susceptibility mapping using machine learning and geospatial techniques. Ecol. Inform. 2024, 81, 102583. [Google Scholar]
  23. Haoyuan, H. Landslide susceptibility assessment using locally weighted learning integrated with machine learning algorithms. Expert Syst. Appl. 2024, 237, 121678. [Google Scholar]
  24. Aricò, M.; La Guardia, M.; Lo Brutto, M. 3D Data Integration for Web Fruition of Underground Archaeological Sites: A Web Navigation System for the Hypogeum of Crispia salvia (Marsala, Italy). Heritage 2023, 6, 5899–5918. [Google Scholar] [CrossRef]
  25. La Guardia, M.; Koeva, M.; D’Ippolito, F.; Karam, S. 3D data integration for web based open source webgl interactive visualisation. Int. Arch. Photogramm. Remote Sens. Spatial Inf. Sci 2022, XLVIII-4/W4-2022, 89–94. [Google Scholar] [CrossRef]
  26. Gaspari, F.; Barbieri, F.; Fascia, R.; Ioli, F.; Pinto, L. An Open-Source Web Platform for 3D Documentation and Storytelling of Hidden Cultural Heritage. Heritage 2024, 7, 517–536. [Google Scholar] [CrossRef]
  27. Birr, S.; Mönch, J.; Sommerfeld, D.; Preim, U.; Preim, B. The LiverAnatomyExplorer: A WebGL-based surgical teaching tool. IEEE Comput. Graph. Appl. 2013, 33, 48–58. [Google Scholar] [CrossRef] [PubMed]
  28. Liu, D.; Peng, J.; Wang, Y.; Huang, M.; He, Q.; Yan, Y.; Ma, B.; Yue, C.; Xie, Y. Implementation of interactive three-dimensional visualization of air pollutants using WebGL. Environ. Model. Softw. 2019, 114, 188–194. [Google Scholar] [CrossRef]
  29. Gaspari, F.; Ioli, F.; Barbieri, F.; Rivieri, C.; Dondi, M.; Pinto, L. Rediscovering cultural heritage sites by interactive 3D exploration: A practical review of open-source WebGL tools. Int. Arch. Photogramm. Remote Sens. Spat. Inf. Sci. 2023, 48, 661–668. [Google Scholar] [CrossRef]
  30. Resch, B.; Wohlfahrt, R.; Wosniok, C. Web-Based 4D visualization of marine geo-data using WebGL. Cartogr. Geogr. Inf. Sci. 2014, 41, 235–247. [Google Scholar] [CrossRef]
  31. Feng, L.; Wang, C.; Li, C.; Li, Z. A research for 3D WebGIS based on WebGL. In Proceedings of the 2011 International Conference on Computer Science and Network Technology, Harbin, China, 24–26 December 2011; Volume 1, pp. 348–351. [Google Scholar]
  32. Li, W.; Wang, S. PolarGlobe: A web-wide virtual globe system for visualizing multidimensional, time-varying, big climate data. Int. J. Geogr. Inf. Sci. 2017, 31, 1562–1582. [Google Scholar] [CrossRef]
  33. Pispidikis, I.; Dimopoulou, E. Development of a 3D WebGIS System for Retrieving and Visualizing CityGML Data Based on Their Geometric and Semantic Characteristics by Using Free and Open Source Technology. ISPRS Ann. Photogramm. Remote Sens. Spatial Inf. Sci. 2016, IV-2/W1, 47–53. [Google Scholar] [CrossRef]
  34. Li, B.; Wu, J.; Pan, M.; Huang, J. Application of 3D WebGIS and real-time technique in earthquake information publishing and visualization. Earthq. Sci. 2015, 28, 223–231. [Google Scholar] [CrossRef]
  35. Atasoy, K.; Kocaman, S. Development of a Geo-Analytics Platform for Post-Disaster Ground Assessment. Int. Arch. Photogramm. Remote Sens. Spatial Inf. Sci. 2021, XLIII-B3-2021, 685–692. [Google Scholar] [CrossRef]
  36. Zhu, X.; Yang, H.; Bian, H.; Mei, Y.; Zhang, B.; Xue, P. Multi-Scalar Oblique Photogrammetry-Supported 3D webGIS Approach to Preventive Mining-Induced Deformation Analysis. Appl. Sci. 2023, 13, 13342. [Google Scholar] [CrossRef]
  37. Nishanbaev, I.; Champion, E.; McMeekin, D.A. A Web GIS-Based Integration of 3D Digital Models with Linked Open Data for Cultural Heritage Exploration. ISPRS Int. J. Geo-Inf. 2021, 10, 684. [Google Scholar] [CrossRef]
  38. Capolupo, A.; Monterisi, C.; Saponieri, A.; Addona, F.; Damiani, L.; Archetti, R.; Tarantino, E. An Interactive WebGIS Framework for Coastal Erosion Risk Management. J. Mar. Sci. Eng. 2021, 9, 567. [Google Scholar] [CrossRef]
  39. Derong, L.; Liang, H.; Gao, K. Design of Soil Pollution Prevention and Control Evaluation and Analysis Platform based on WebGIS. In Proceedings of the 2024 4th International Symposium on Computer Technology and Information Science (ISCTIS), Xi’an, China, 12–14 July 2024; pp. 275–281. [Google Scholar] [CrossRef]
  40. Li, J.; Xia, H.; Qin, Y.; Fu, P.; Guo, X.; Li, R.; Zhao, X. Web GIS for Sustainable Education: Towards Natural Disaster Education for High School Students. Sustainability 2022, 14, 2694. [Google Scholar] [CrossRef]
  41. Maguelva, N.M.; Mustapha, H.; Hubert, F. Towards A 3d Web Tool For Visualization And Simulation Of Urban Flooding: The Case Of Metropolitan Cities In Cameroon. Int. J. Appl. Sci. Eng. Rev. (IJASER) 2023, 4, 25–40. [Google Scholar] [CrossRef]
  42. Huang, J.; Huang, R.; Ju, N.; Xu, Q.; He, C. 3D WebGIS-based platform for debris flow early warning: A case study. Eng. Geol. 2015, 197, 57–66. [Google Scholar] [CrossRef]
  43. Kilsedar, C.E.; Fissore, F.; Pirotti, F.; Brovelli, M.A. Extraction and visualization of 3D building models in urban areas for flood simulation. ISPRS Int. Arch. Photogramm. Remote Sens. Spat. Inf. Sci. 2019, XLII-2/W11, 669–673. [Google Scholar] [CrossRef]
  44. Beccali, G.; Cellura, M.; Culotta, S.; Lo Brano, V.; Marvuglia, A. A Web-Based Autonomous Weather Monitoring System of the Town of Palermo and Its Utilization for Temperature Nowcasting. In Computational Science and Its Applications–ICCSA 2008; Gervasi, O., Murgante, B., Laganà, A., Taniar, D., Mun, Y., Gavrilova, M.L., Eds.; Lecture Notes in Computer Science; Springer: Berlin/Heidelberg, Germany, 2008; Volume 5072, pp. 65–78. [Google Scholar] [CrossRef]
  45. Cellura, M.; Culotta, S.; Lo Brano, V.; Marvuglia, A. Nonlinear Black-Box Models for Short-Term Forecasting of Air Temperature in the Town of Palermo. In Geocomputation, Sustainability and Environmental Planning; Murgante, B., Borruso, G., Lapucci, A., Eds.; Studies in Computational Intelligence; Springer: Berlin/Heidelberg, Germany, 2011; Volume 348, pp. 199–215. [Google Scholar] [CrossRef]
  46. About PostGIS. Available online: https://postgis.net/docs/ (accessed on 12 May 2025).
  47. Anaconda Documentation. Available online: https://www.anaconda.com/docs/main (accessed on 12 May 2025).
  48. GeoServer Overview. Available online: https://docs.geoserver.org/main/en/user/introduction/overview.html (accessed on 12 May 2025).
  49. An Introduction to MapServer. Available online: https://mapserver.org/introduction.html (accessed on 12 May 2025).
  50. CesiumJS. Available online: https://cesium.com/learn/cesiumjs-learn/ (accessed on 12 May 2025).
  51. Italia Meteo. Meteohub. Available online: https://meteohub.mistralportal.it/app/maps/observations (accessed on 19 May 2025).
  52. European Commission. INSPIRE Data Specification on Environmental Monitoring Facilities—Technical Guidelines; Publications Office of the European Union: Luxembourg, 2024; Available online: https://knowledge-base.inspire.ec.europa.eu/publications/inspire-data-specification-environmental-monitoring-facilities-technical-guidelines_en (accessed on 16 July 2025).
  53. Daud, M.; Ugliotti, F.M.; Osello, A. Comprehensive Analysis of the Use of Web-GIS for Natural Hazard Management: A Systematic Review. Sustainability 2024, 16, 4238. [Google Scholar] [CrossRef]
  54. Mazzei, M.; Quaroni, D. Development of a 3D WebGIS Application for the Visualization of Seismic Risk on Infrastructural Work. ISPRS Int. J. Geo-Inf. 2022, 11, 22. [Google Scholar] [CrossRef]
  55. Rodrigues da Silva, A.; Estima, J.; Marques, J.; Gamito, I.; Serra, A.; Moura, L.; Ricardo, A.M.; Mendes, L.; Ferreira, R.M.L. A Web GIS Platform to Modeling, Simulate and Analyze Flood Events: The RiverCure Portal. ISPRS Int. J. Geo-Inf. 2023, 12, 268. [Google Scholar] [CrossRef]
  56. Mazzei, M.; Quaroni, D. A System for Analysis and Simulating Hydraulic and Hydrogeological Risks Through WebGIS 3D Digital Platforms. ISPRS Int. J. Geo-Inf. 2025, 14, 73. [Google Scholar] [CrossRef]
  57. Aschieri, D.L.D.; Sobrino, N.; Macii, E. Web-GIS Application for Hydrogeological Risk Prevention: The Case Study of Cervo Valley. Sustainability 2024, 16, 9833. [Google Scholar] [CrossRef]
  58. La Guardia, M.; Koeva, M.; Díaz-Vilariño, L.; Nourian, P. Open-Source Solutions for Real-Time 3D Geospatial Web Integration. Int. Arch. Photogramm. Remote Sens. Spatial Inf. Sci. 2024, XLVIII-4-2024, 289–295. [Google Scholar] [CrossRef]
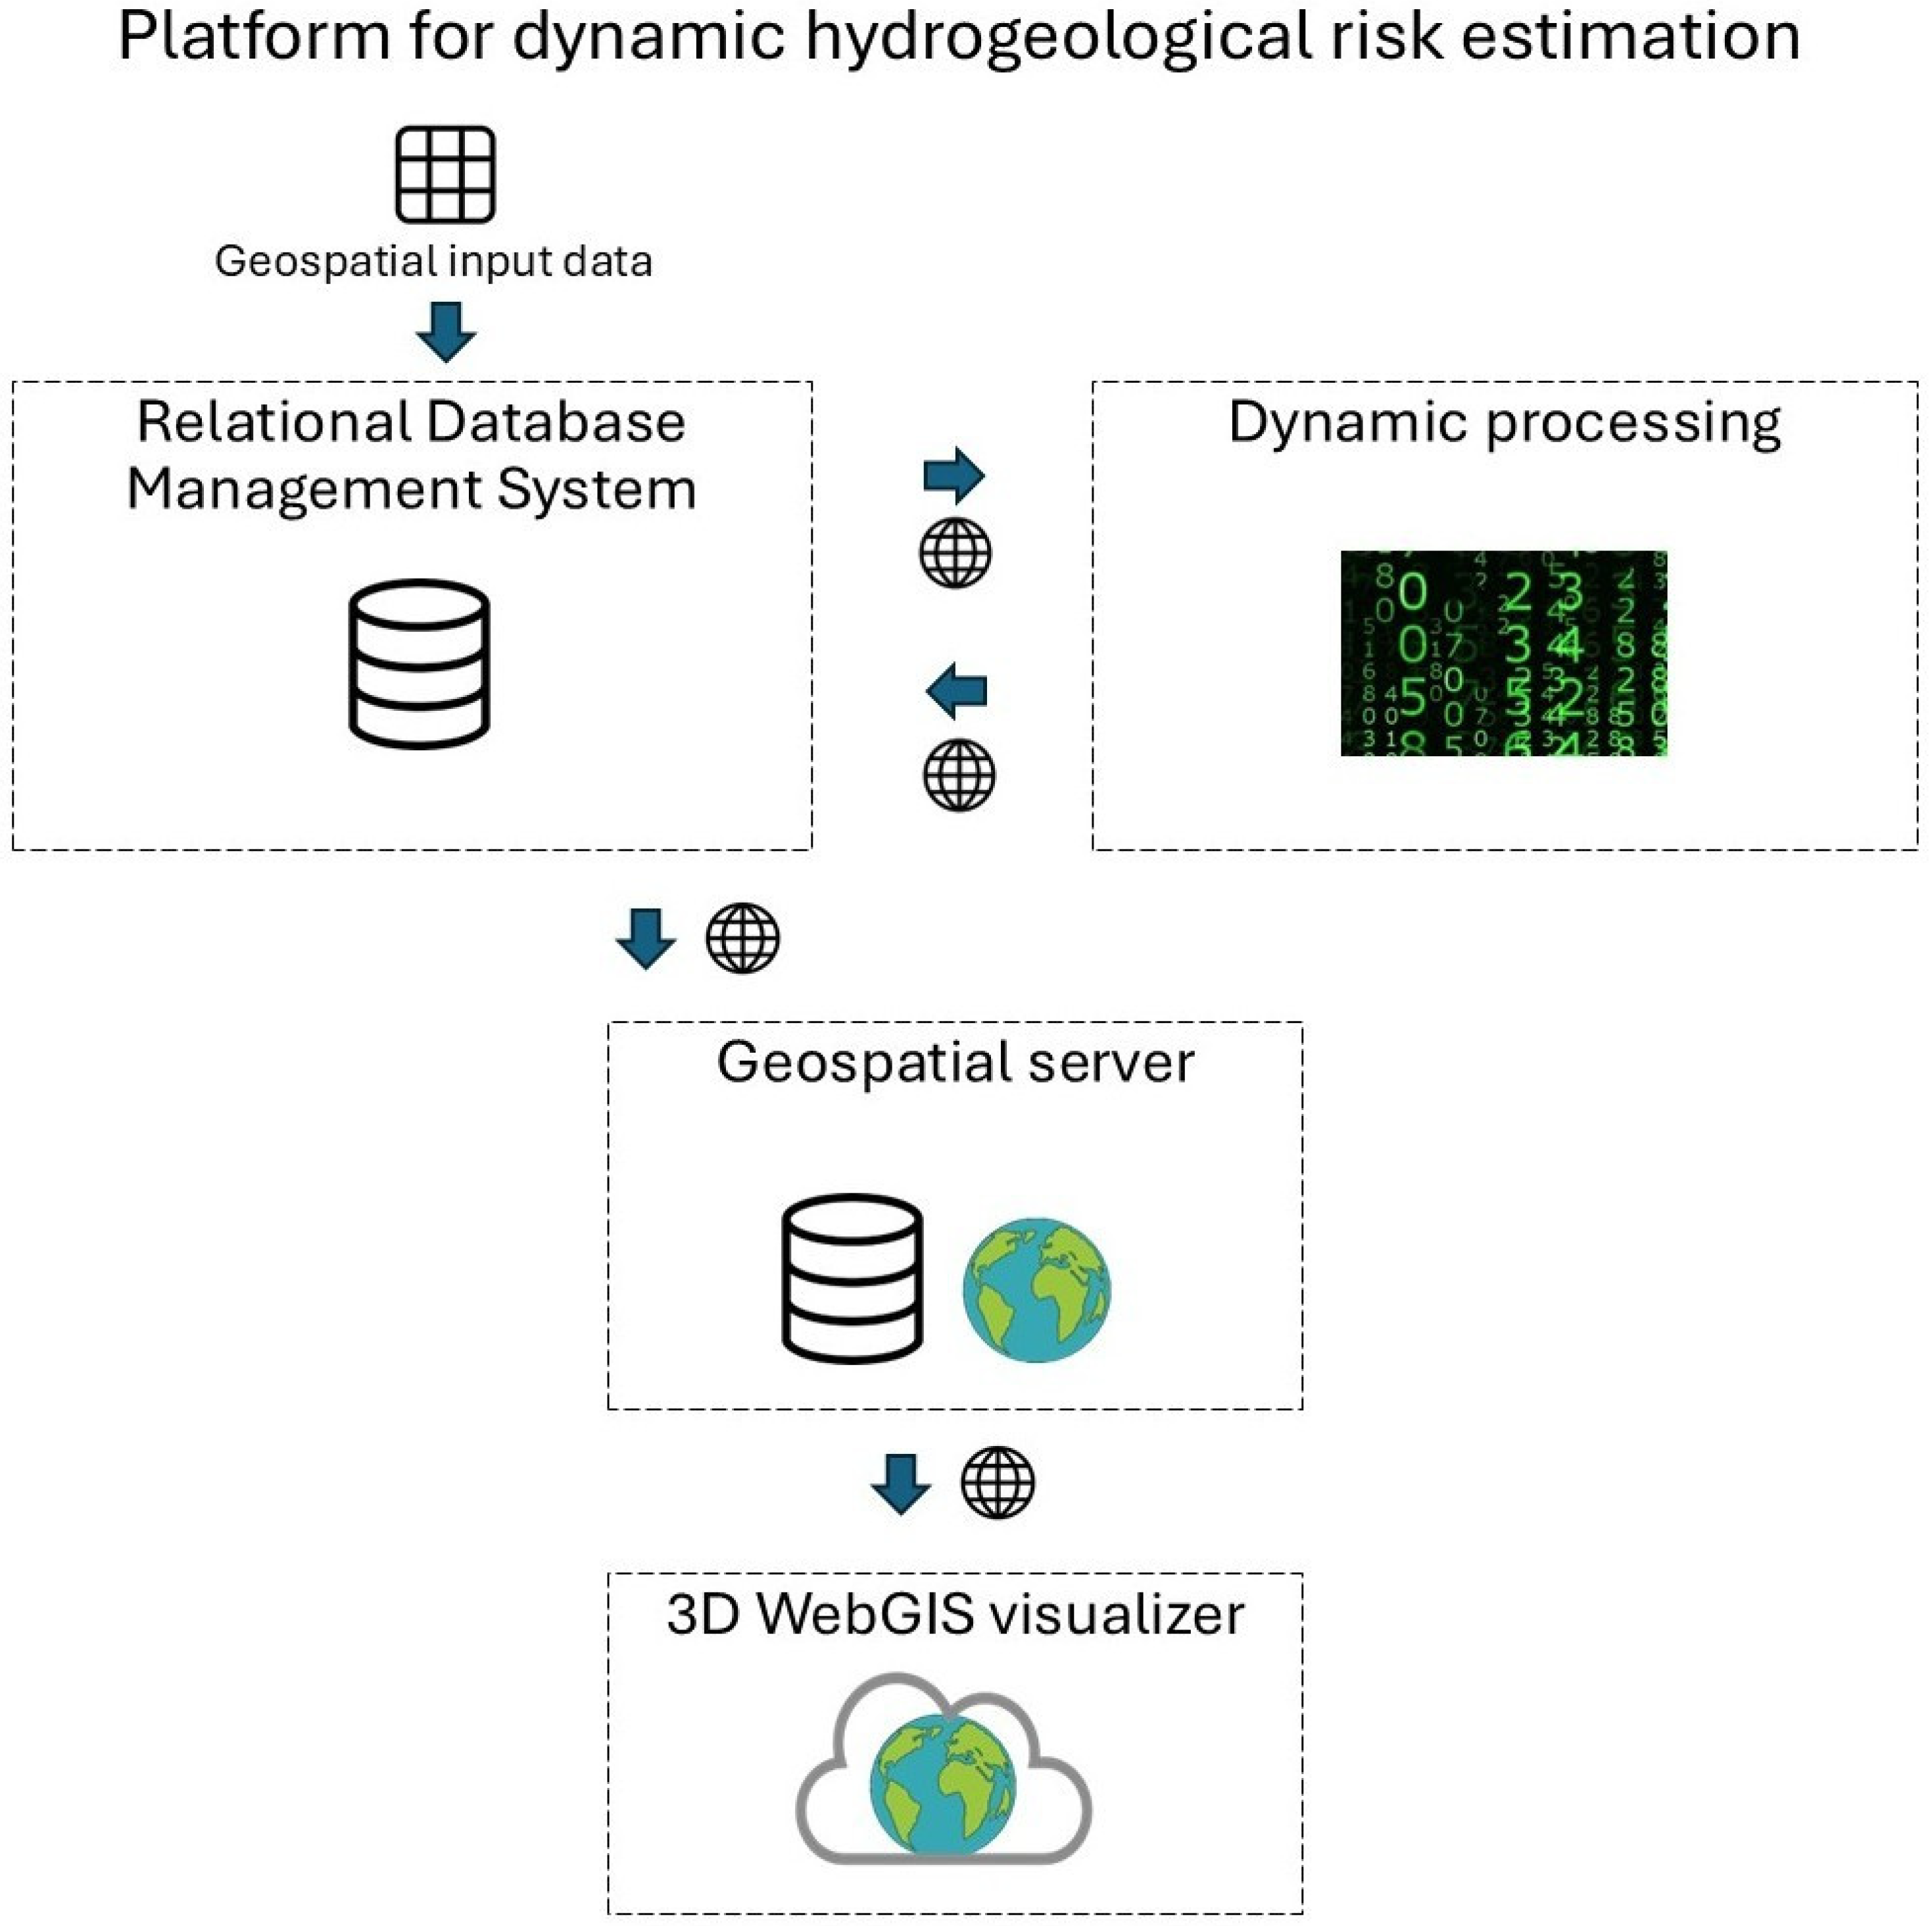
Figure 1. The general framework of the platform.
Geographies 05 00040 g001
Figure 2. The WebGIS visualization in Open Layers of the 8 selected weather stations (in blue) for the test of dynamic remote raster processing.
Geographies 05 00040 g002
Figure 3. The pluviometry acquisitions are stored in the Postgres database with PostGIS extension inside the ‘weather_observations’ table. It is possible to visualize the ‘station_id’ column with the name of the weather stations, the ‘value’ column that indicates the mm of water column observed for each acquisition, the ‘observed_at’ column with the indication of the time of acquisition, and the ‘geom’ column that indicates the georeferencing of each acquisition.
Geographies 05 00040 g003
Figure 4. The steps that involved the interpolation process.
Geographies 05 00040 g004
Figure 5. The .map file defines the necessary parameters for the activation of the WMS service. Starting with the general information about the raster file (extent, size, etc.), the file defines the WMS link to use in the WebGIS application necessary to call the service, the parameters that define the connection with the database, and, finally, the style of the raster visualization (colors, transparency, etc.).
Geographies 05 00040 g005
Figure 6. The JavaScript strings inside the .html page that activates the WMS service remotely provided by Mapserver. The same framework can be used also for external remote WMS services and also for WMS services activated in Geoserver.
Geographies 05 00040 g006
Figure 7. The web visualization of the dynamic pluviometry map in the urban area of Palermo (Italy) inside the 3D WebGIS platform developed with Cesium. JS libraries.
Geographies 05 00040 g007
Figure 8. The structure of the 3D WebGIS visualization.
Geographies 05 00040 g008
Disclaimer/Publisher’s Note: The statements, opinions and data contained in all publications are solely those of the individual author(s) and contributor(s) and not of MDPI and/or the editor(s). MDPI and/or the editor(s) disclaim responsibility for any injury to people or property resulting from any ideas, methods, instructions or products referred to in the content.