Article

Background Tests and Improvements at LAC-UFF Aiming at Sample Size Reduction in Foraminifera 14C Measurement

1
Radiocarbon Laboratory, Physics Institute, Fluminense Federal University, Niterói 24210-346, Brazil
2
Graduate Program in Geosciences (Environmental Geochemistry), Fluminense Federal University, Niterói 24020-141, Brazil
3
Higher Institute of Technologies and Applied Sciences, Habana University, Plaza de la Revolución, Havana 10400, Cuba
4
Radiocarbon Laboratory, Research School of Earth Sciences, The Australian National University, Canberra, ACT 2601, Australia
5
Keck Carbon Cycle AMS Facility, Department of Earth System Science, University of California, Irvine, CA 92697-3100, USA
6
Max-Planck-Institut für Biogeochemie, 07745 Jena, Germany
*
Author to whom correspondence should be addressed.
Geographies 2023, 3(3), 574-583; https://doi.org/10.3390/geographies3030030
Submission received: 27 June 2023 / Revised: 28 July 2023 / Accepted: 25 August 2023 / Published: 1 September 2023

Abstract

:
Foraminifera are widely used in paleoclimatic and paleoceanographic studies, providing information about past ocean conditions. However, in order to use these tracers, it is essential to obtain an accurate chronology. Radiocarbon has proven to be a powerful tool in developing robust chronologies. Sample sizes of a few milligrams of carbonate material are needed for precise radiocarbon determination using accelerator mass spectrometry (AMS). In the specific case of paleoceanographic and paleoenvironmental studies, Foraminifera microfossils are the most important indicator of oceanic conditions. However, for establishing the chronology of deposition, sample availability is often limited. In AMS facilities using solid ion sources, such as the Radiocarbon Laboratory of the Universidade Federal Fluminense (LAC-UFF), in Brazil, CO2 samples need to be converted to graphite after physical and chemical pre-treatment to remove contamination. Reducing the sample sizes increases the relative contribution of contamination and can favor increased background levels. In this work, we tested different amounts of 14C-free carbonate samples as a means to evaluate the pattern of contamination. For the sealed tube Zn/TiH2 graphitization method, we tested prebaking the graphitization tubes and compared storage procedures. As a result, the background for regular-sized samples was decreased, and accurate measurement of carbonate samples containing ca. 0.5 mg C could be performed. Prebaked graphitization tubes can safely be stored in desiccator cabinets for up to 4 weeks. Foraminifera samples with mass as low as 1 mg (ca. 0.1 mg C) can now be measured at the LAC-UFF AMS facility, provided that C contamination can be estimated and corrected. The developments presented in this work allowed for the study of species-specific Foraminifera and other small-sized carbonate samples.

1. Introduction

Part of the carbon stored in the oceans comes from the marine organisms that secrete calcium carbonate carapaces in the form of aragonite or calcite. Their size ranges from single-celled organisms (Foraminifera and coccolithophores) to massive reefs comprising several colonies of coral polyps. All of these structures can, in principle, be radiocarbon-dated [1,2]. However, there are important aspects that need to be taken into account, such as the relationship between the age of the carbonates and the time of deposition, the marine reservoir effect (MRE), carbon exchange due to dissolution and recrystallization of calcite, and finally, the amount of material that remains after sample preparation. All such issues depend on the organism’s species and on the specific environment in which they have grown. For large shells of short living mollusks, for example, not many difficulties are expected in sample preparation; however, for vermetids, calcite dissolution can be crucial [3]. For all marine organisms, local MRE has to be understood, since it can vary in depth, in time, or between different ocean dynamics [4].
Here, we focus on the limited size and weight of Foraminifera, tiny organisms that can live on the sea floor (so-called benthic forams) or float close to the surface (planktonic forams), incorporating carbon from different origins [5]. In paleoceanographic and paleoenvironmental studies, these carbonate (CaCO3) microfossils are excellent indicators of oceanic conditions and as chronological records of sediment deposition. They are used in biochronostratigraphic studies, where they allow for the identification of discontinuities in sedimentation, which often arise from the erosion of a layer due to submarine currents or from the lowering of the seabed [6,7,8]. Foraminifera are also essential to assess the geology of basins for petroleum exploitation [9], as they help in the identification of turbidite sandy bodies. The latter represent the reservoir bearing the most important accumulations of hydrocarbons in Brazil, such as Marlim and Albacora, in the Campos Basin. In paleoenvironmental studies, they are a highly applicable tool in re-establishing stratigraphic, paleoclimate, and hydrologic bottom conditions. Because of their morphological variability and their rapid evolution, the species of Foraminifera are present in all oceanic basins.
In those studies, Foraminifera shells (often only with a few micrograms) recovered from oceanic sediment were hand-picked under a microscope [10]. However, due to their reduced size and mass, hundreds of individuals are needed to comprise a sample of approximately 1 mg C in mass. Accelerator mass spectrometry (AMS) has greatly reduced the amount of sample material needed for analysis compared to conventional radiometric dating, enabling many applications based on small-sized samples.
During the past decades, many studies have been performed with the aim of decreasing sample mass requirements without losing accuracy, by lowering contamination and handling background corrections properly in 14C dating [11,12,13,14,15,16,17,18,19,20]. All these studies include changes in sample preparation protocols, especially in the graphitization step, where the largest fraction of the contamination is added to the sample. The use of a gas ion source such as the one used in the mini carbon dating system (MICADAS) [16,17,18,21,22,23,24,25,26,27] allows the exclusion of the graphitization step [17]. However, for dating older samples with high precision, graphite is still the better choice over gas, because it can be run for a much longer time and usually with higher currents in an AMS system, thus providing more counts of 14C atoms, which improves the counting statistics. In order to minimize contamination, extra care is necessary during the entire sample preparation procedure.
At the Radiocarbon Laboratory of the Universidade Federal Fluminense (LAC-UFF) Brazil, the current protocol considers 1 mg C as a regular sample size or ~20 mg untreated CaCO3. Decreasing the sample mass can generate one major obstacle: contamination, which becomes more relevant as the sample size decreases [28,29]. Contamination has approximately constant mass, which means that the system is correctable. It usually has a 14C content of ~half-dead; thus, it can be interpreted as having two components: a modern carbon part, due to present-day carbon sources, and a dead carbon part, coming from 14C-free reagents during sample processing [29]. The former would input 14C, while the latter would increase the amount of stable carbon, thus altering the final 14C/12C ratio. Generally, small samples have low currents, leading to problems in determining accurate 14C/12C ratios [29]. For these reasons, and with the aim of improving protocols for reduced sample sizes, we developed experiments using known-age secondary reference materials by varying the sample amount and changing storage protocols at LAC-UFF. We report in this manuscript the main results from these tests.

2. Materials and Methods
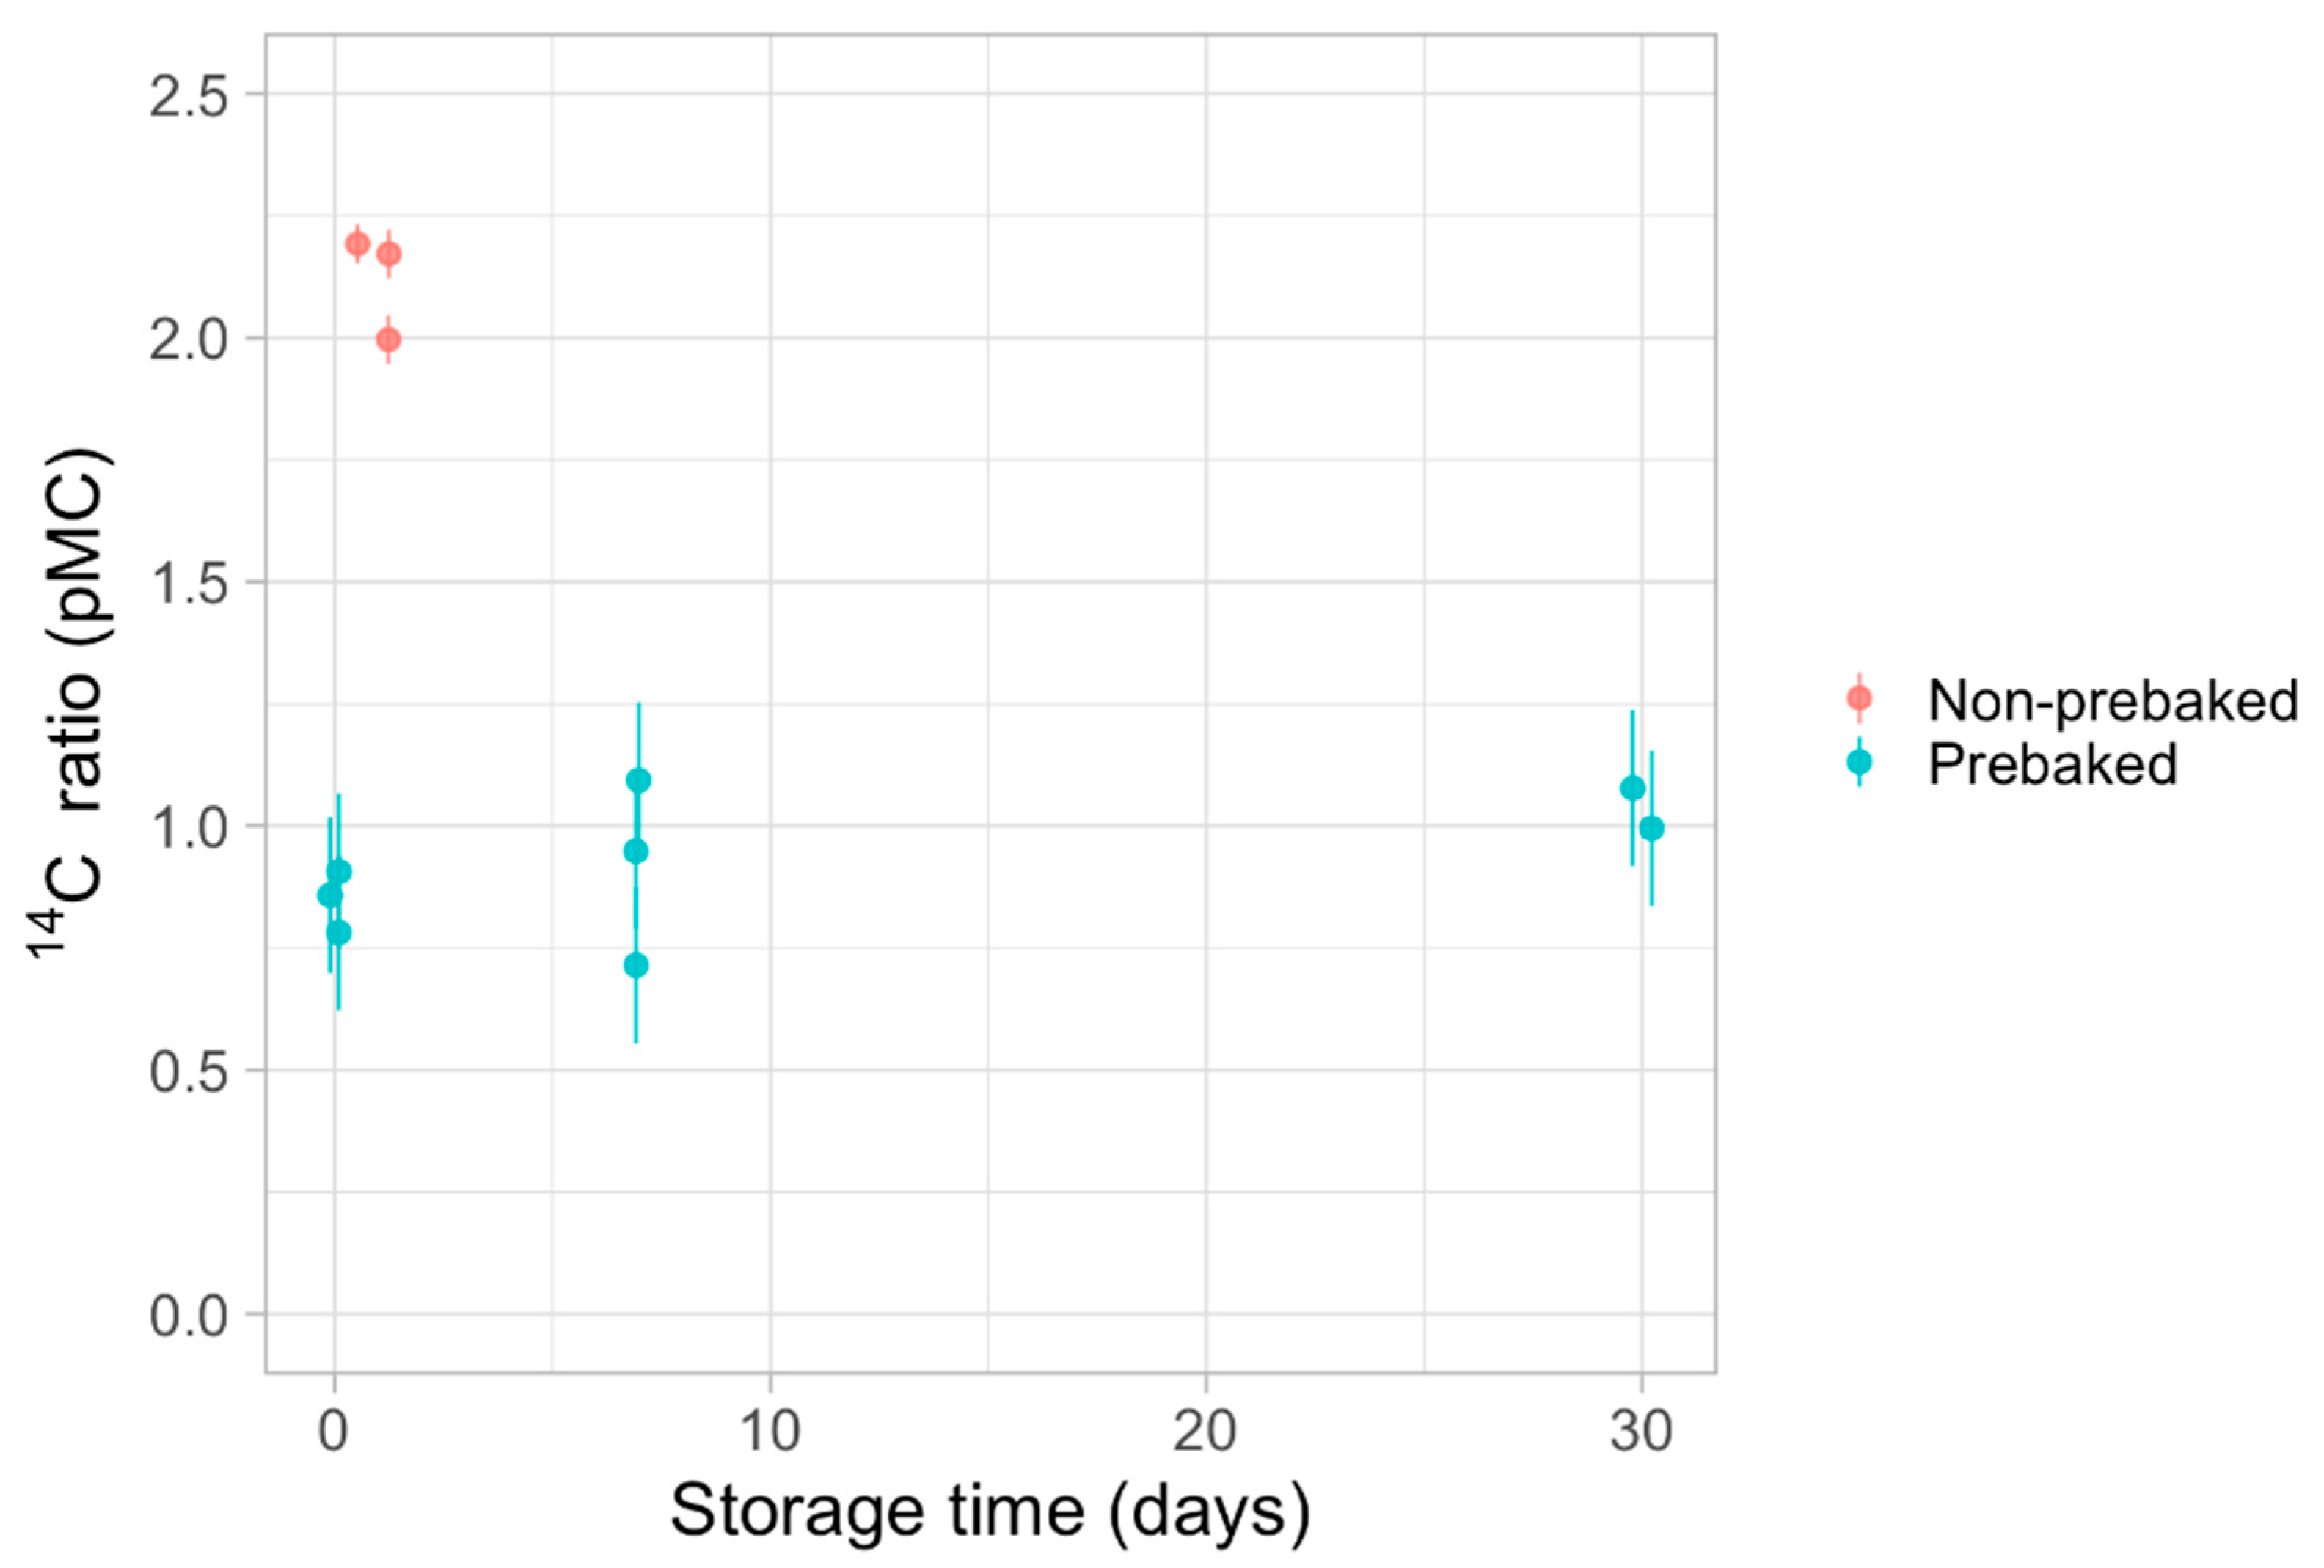
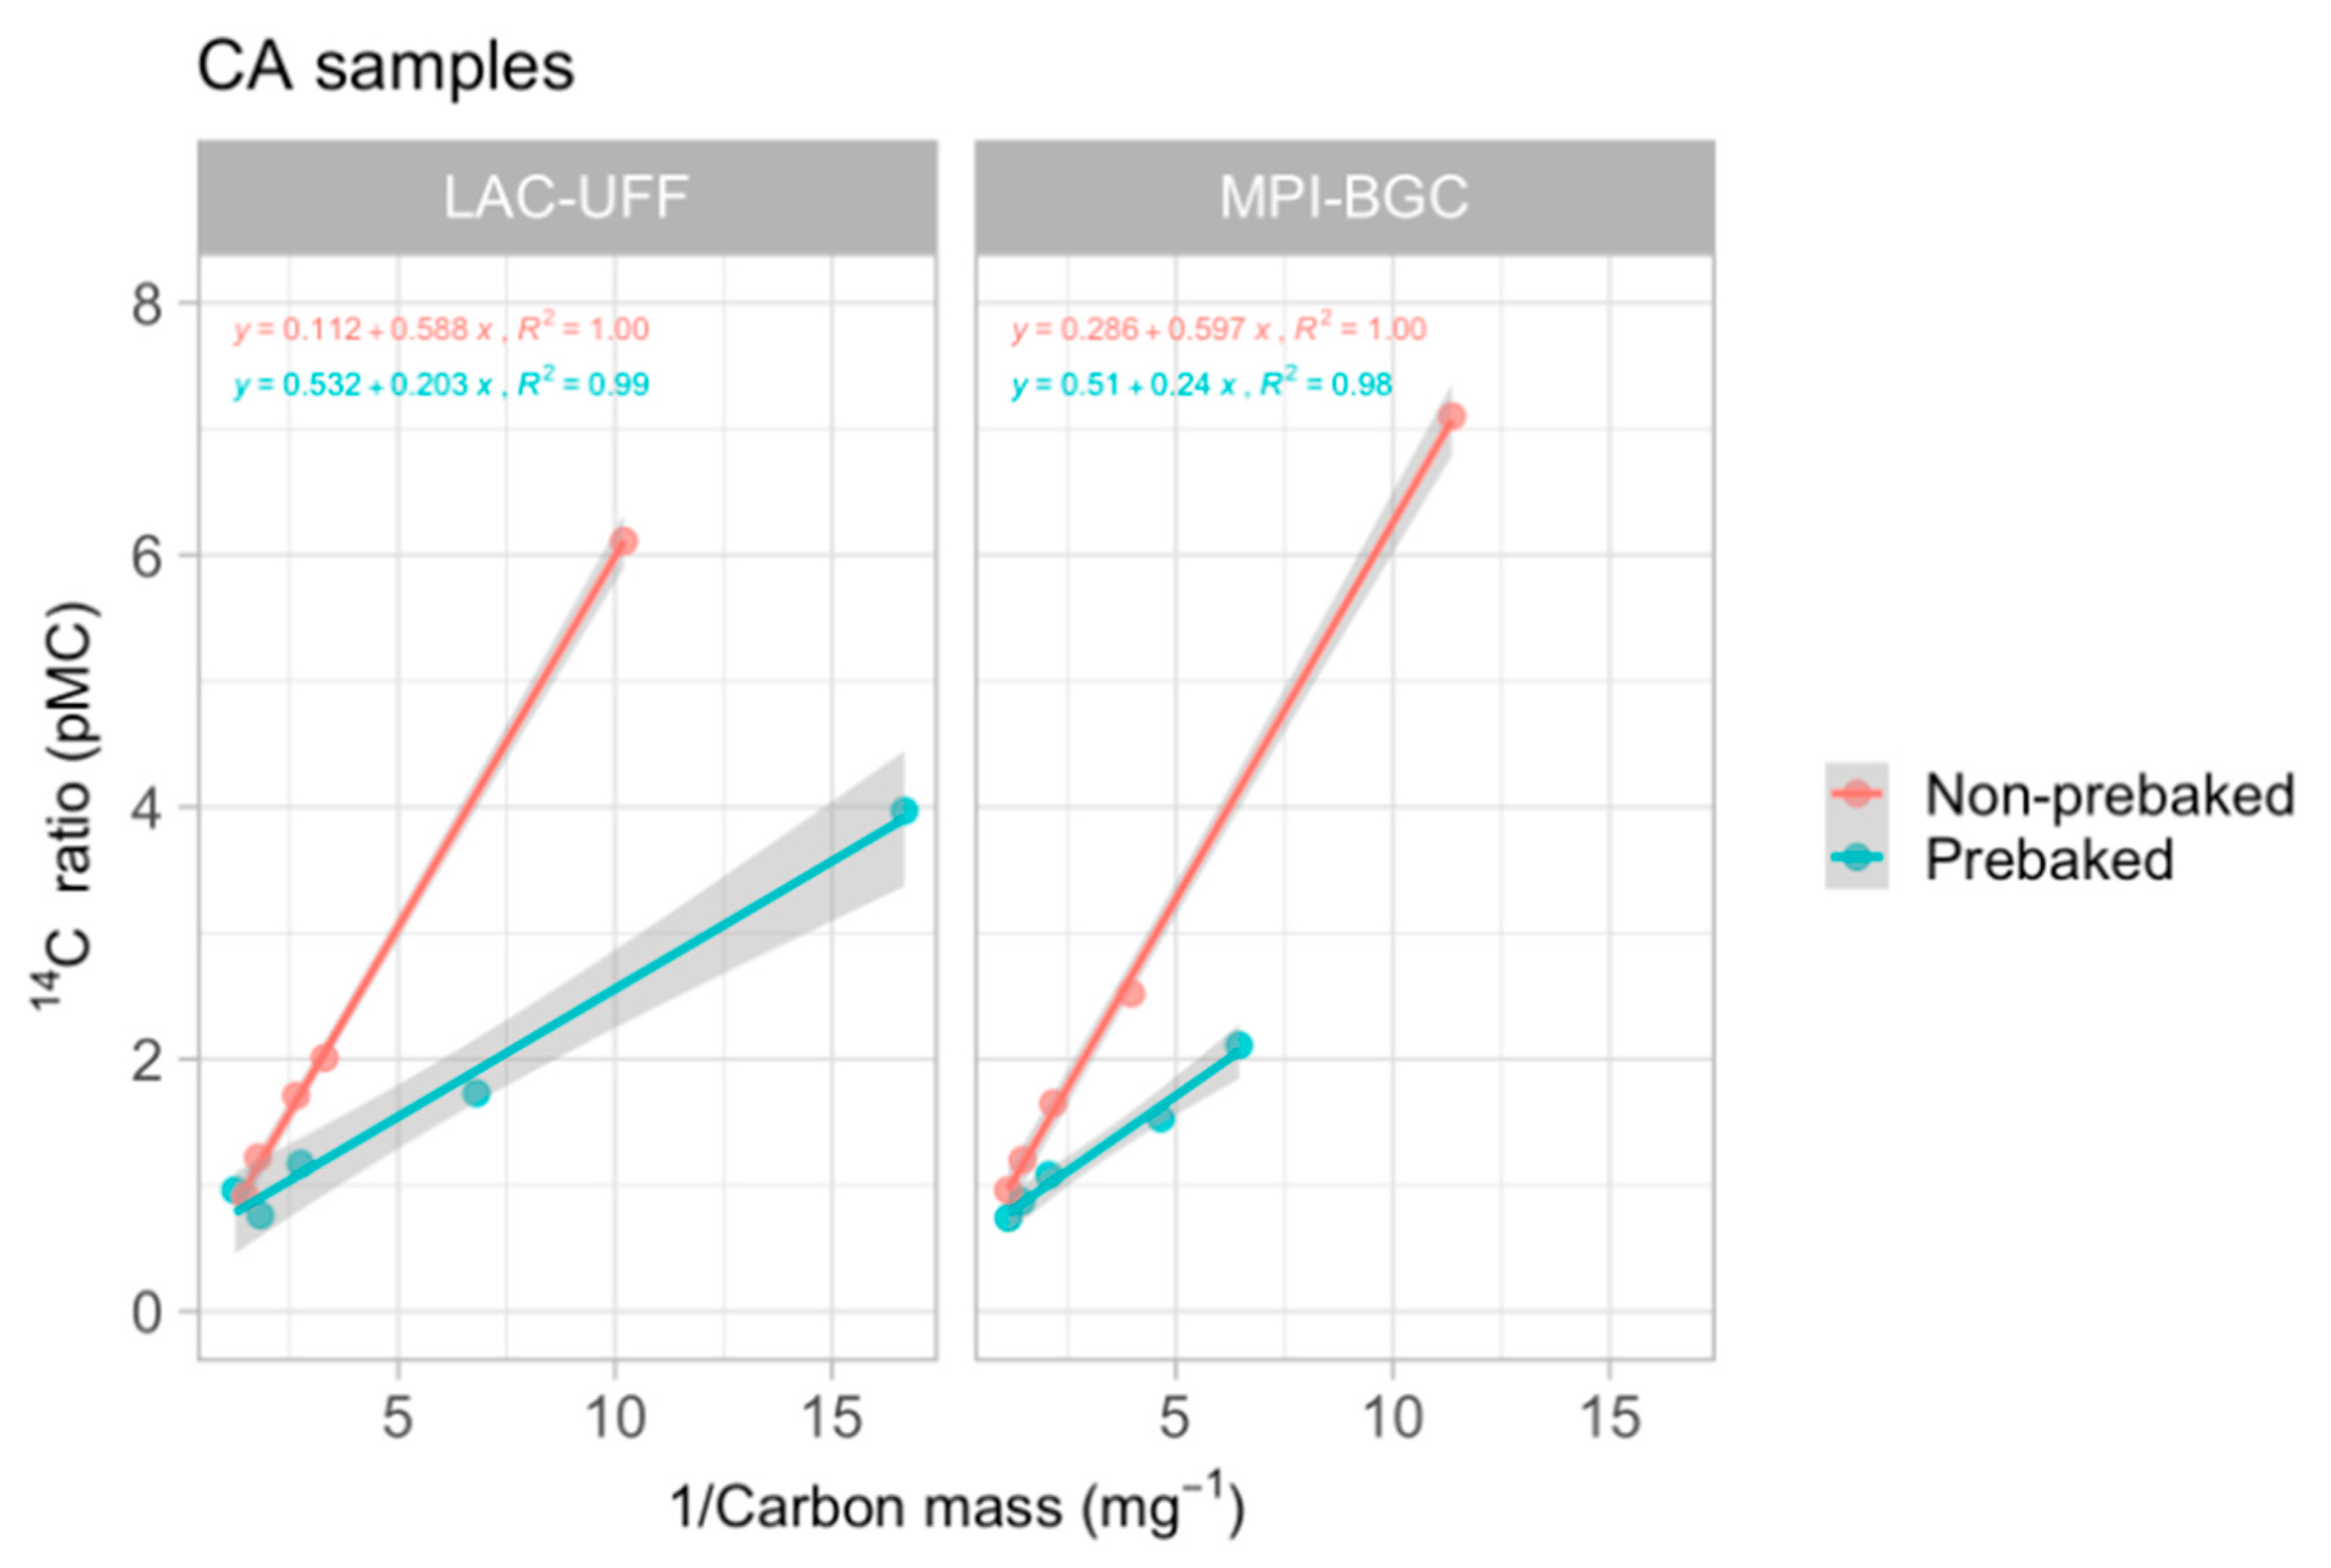
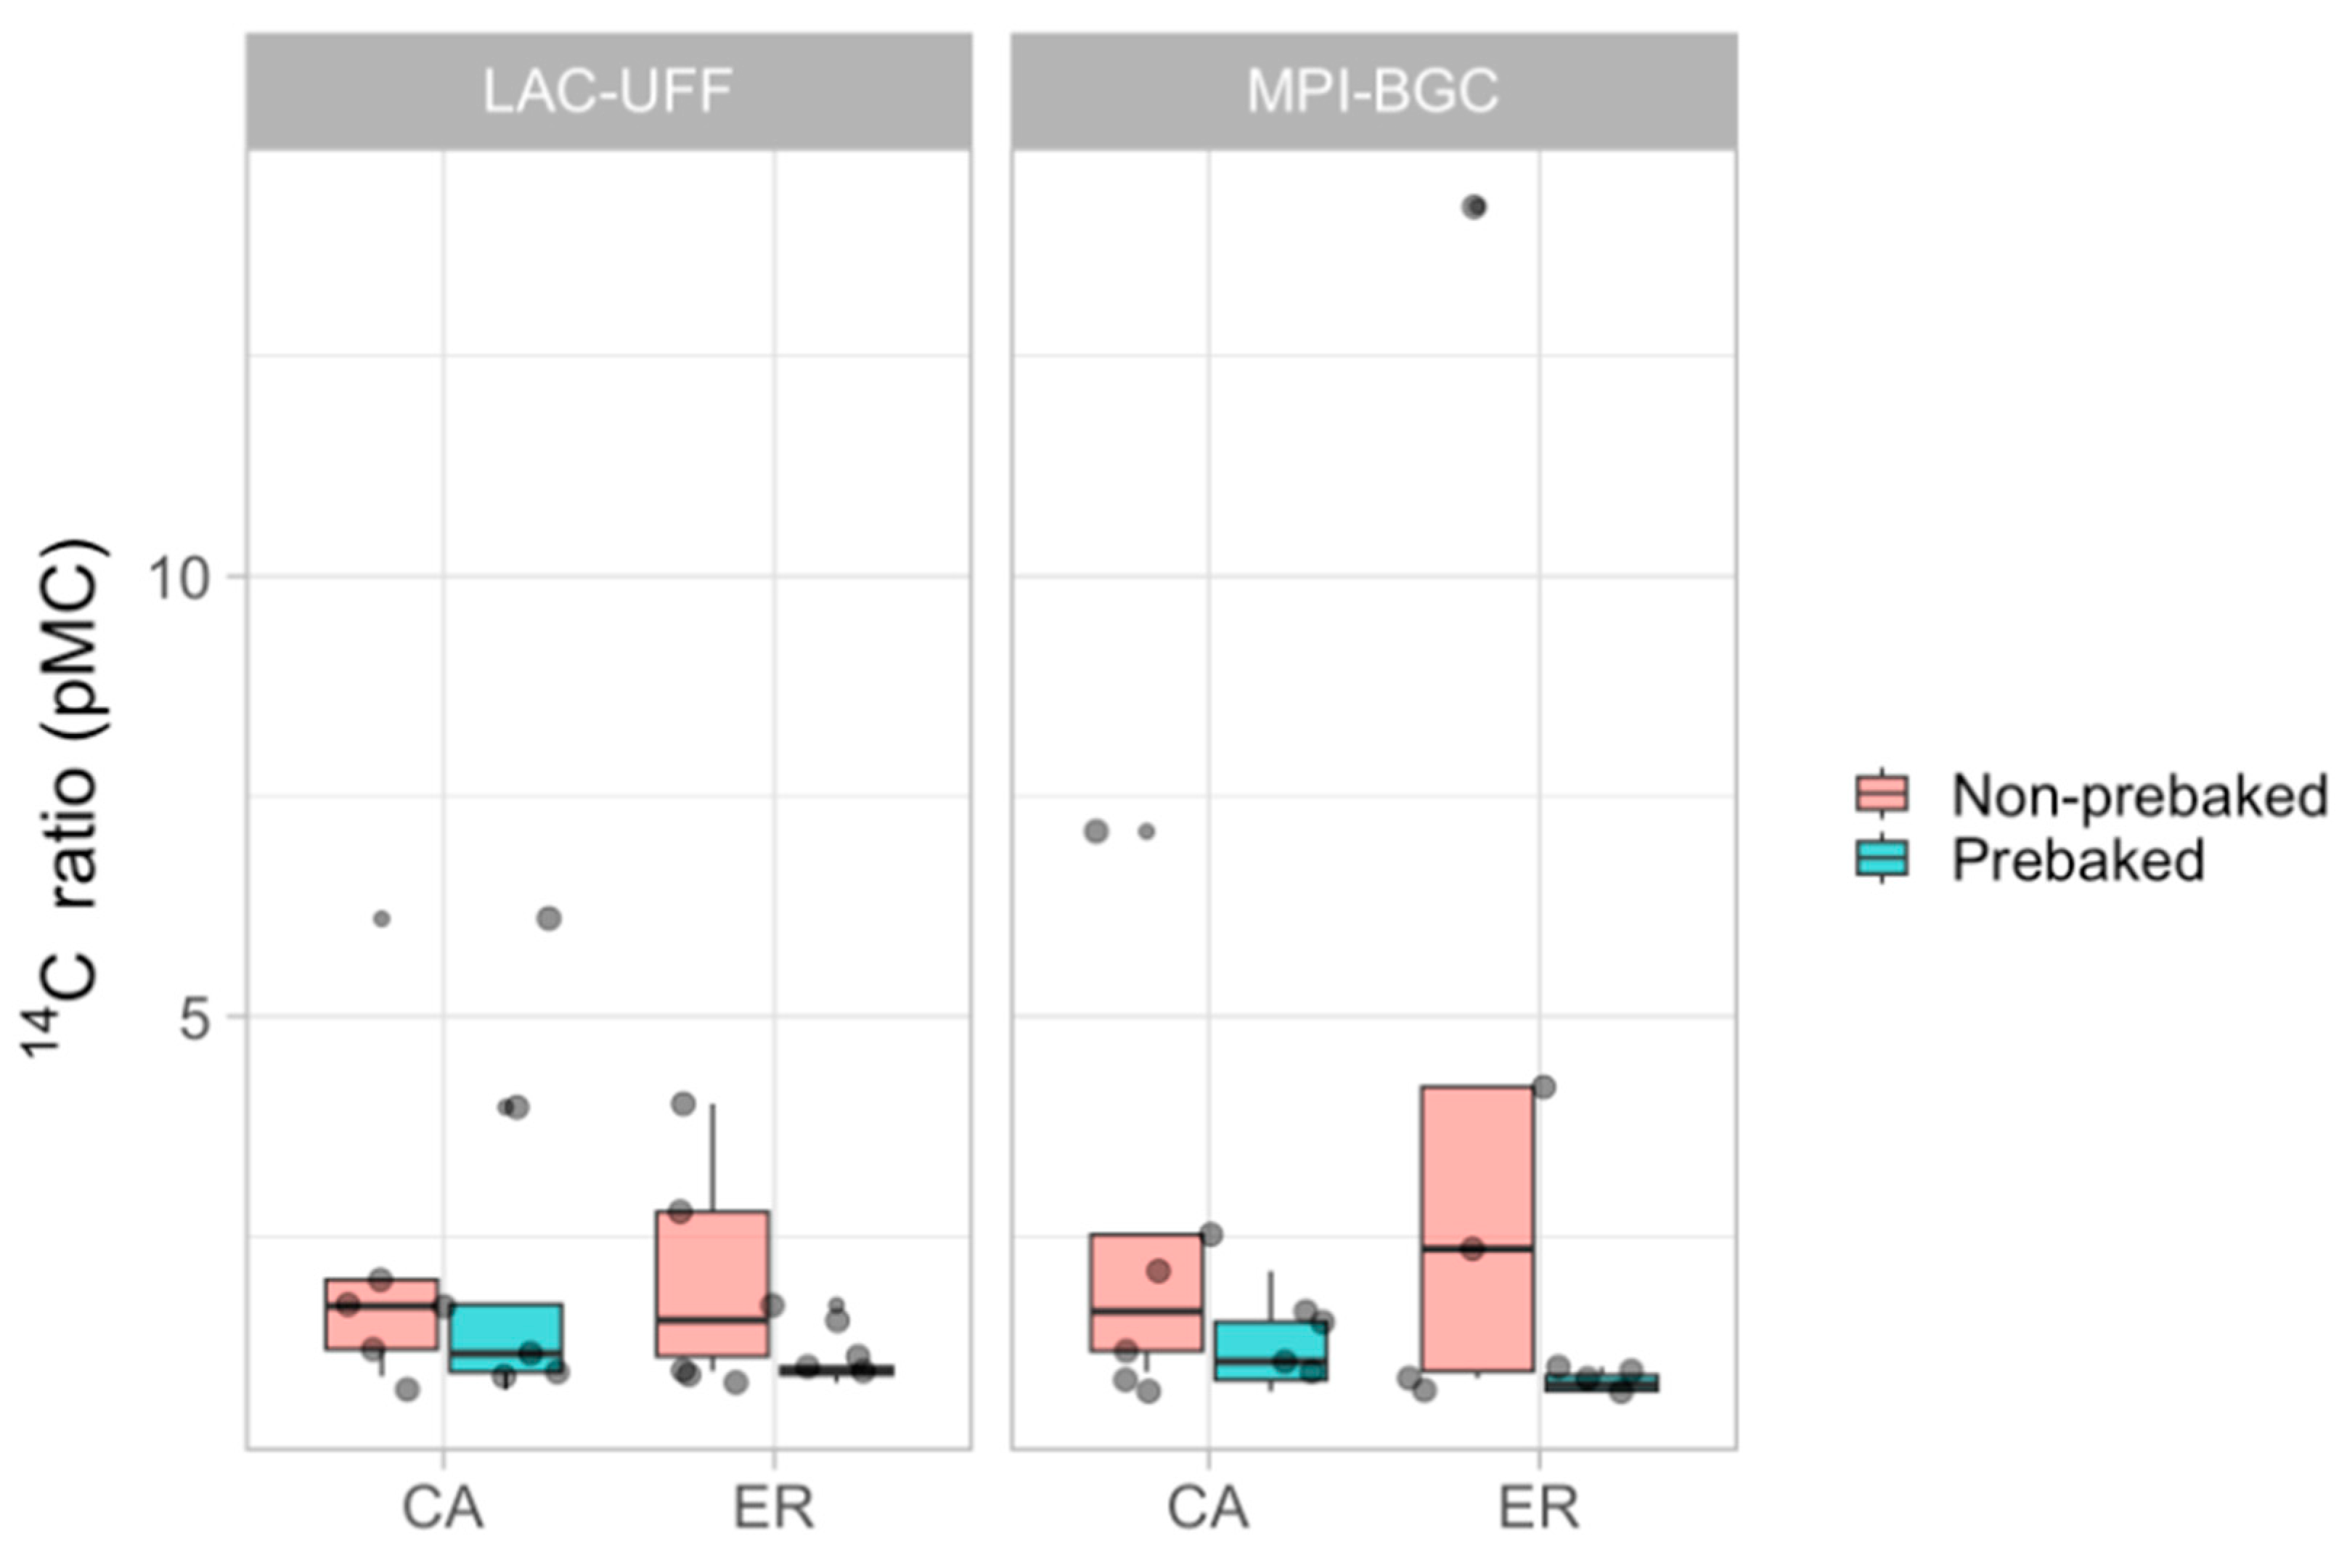
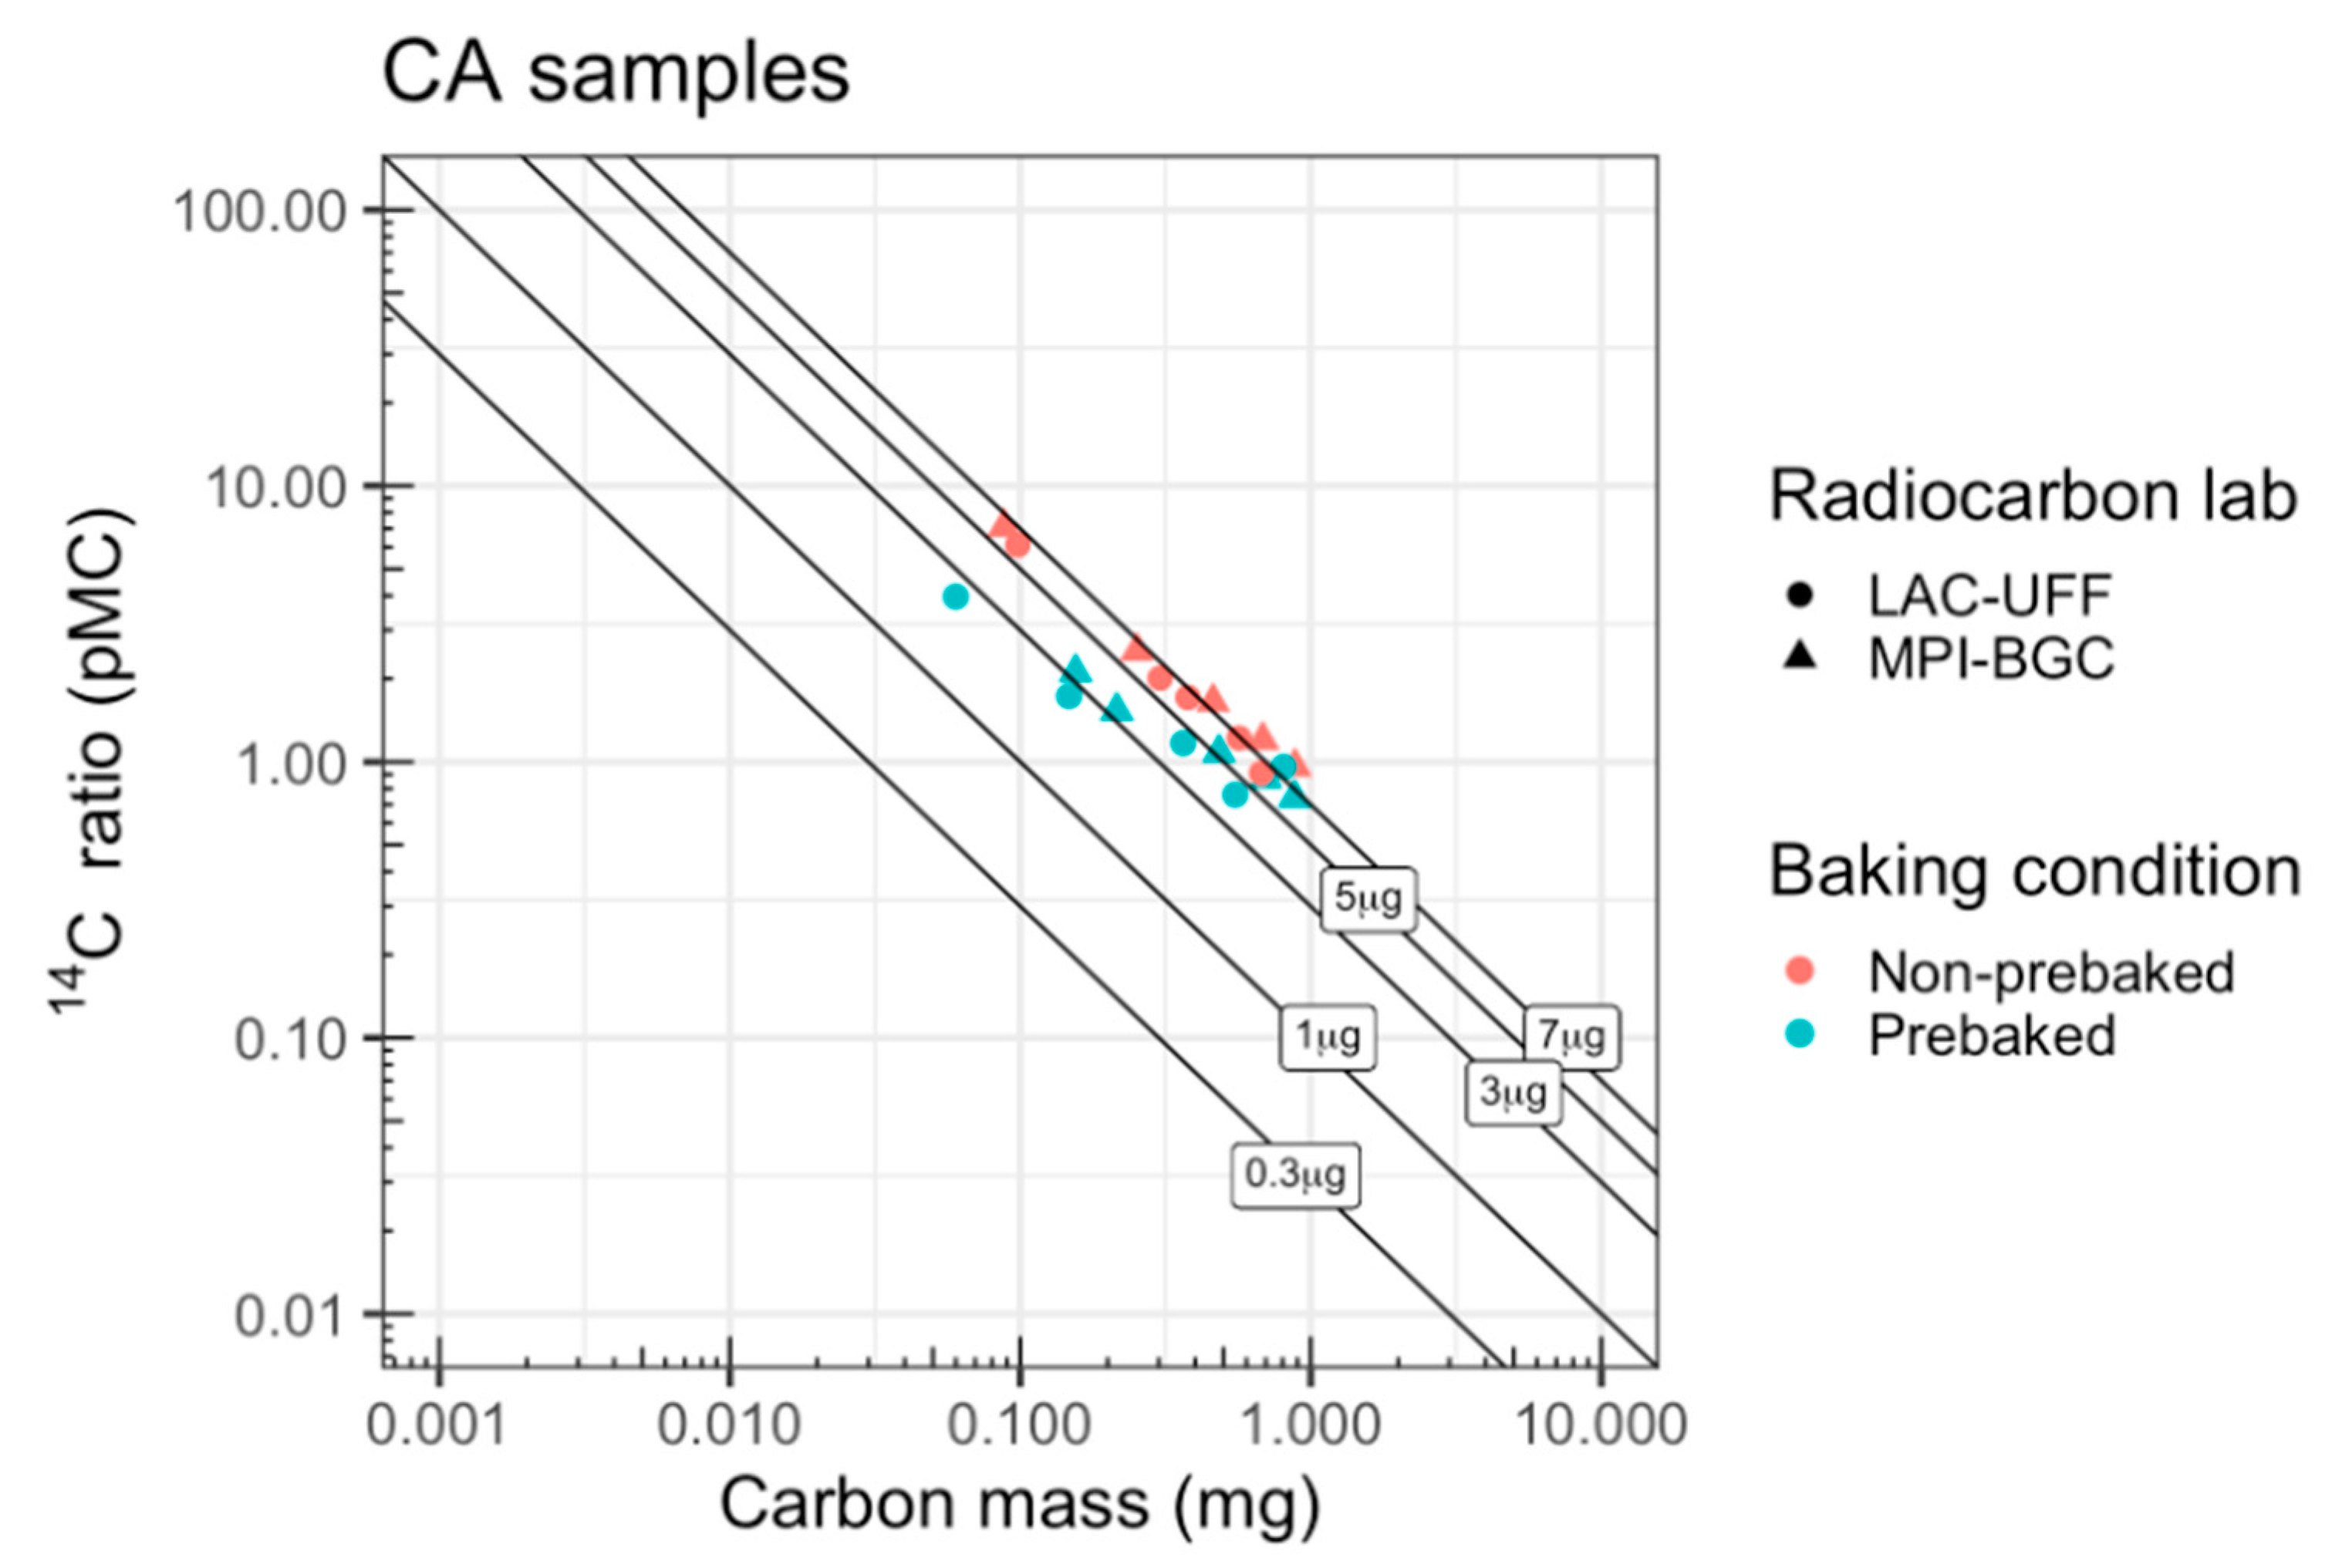
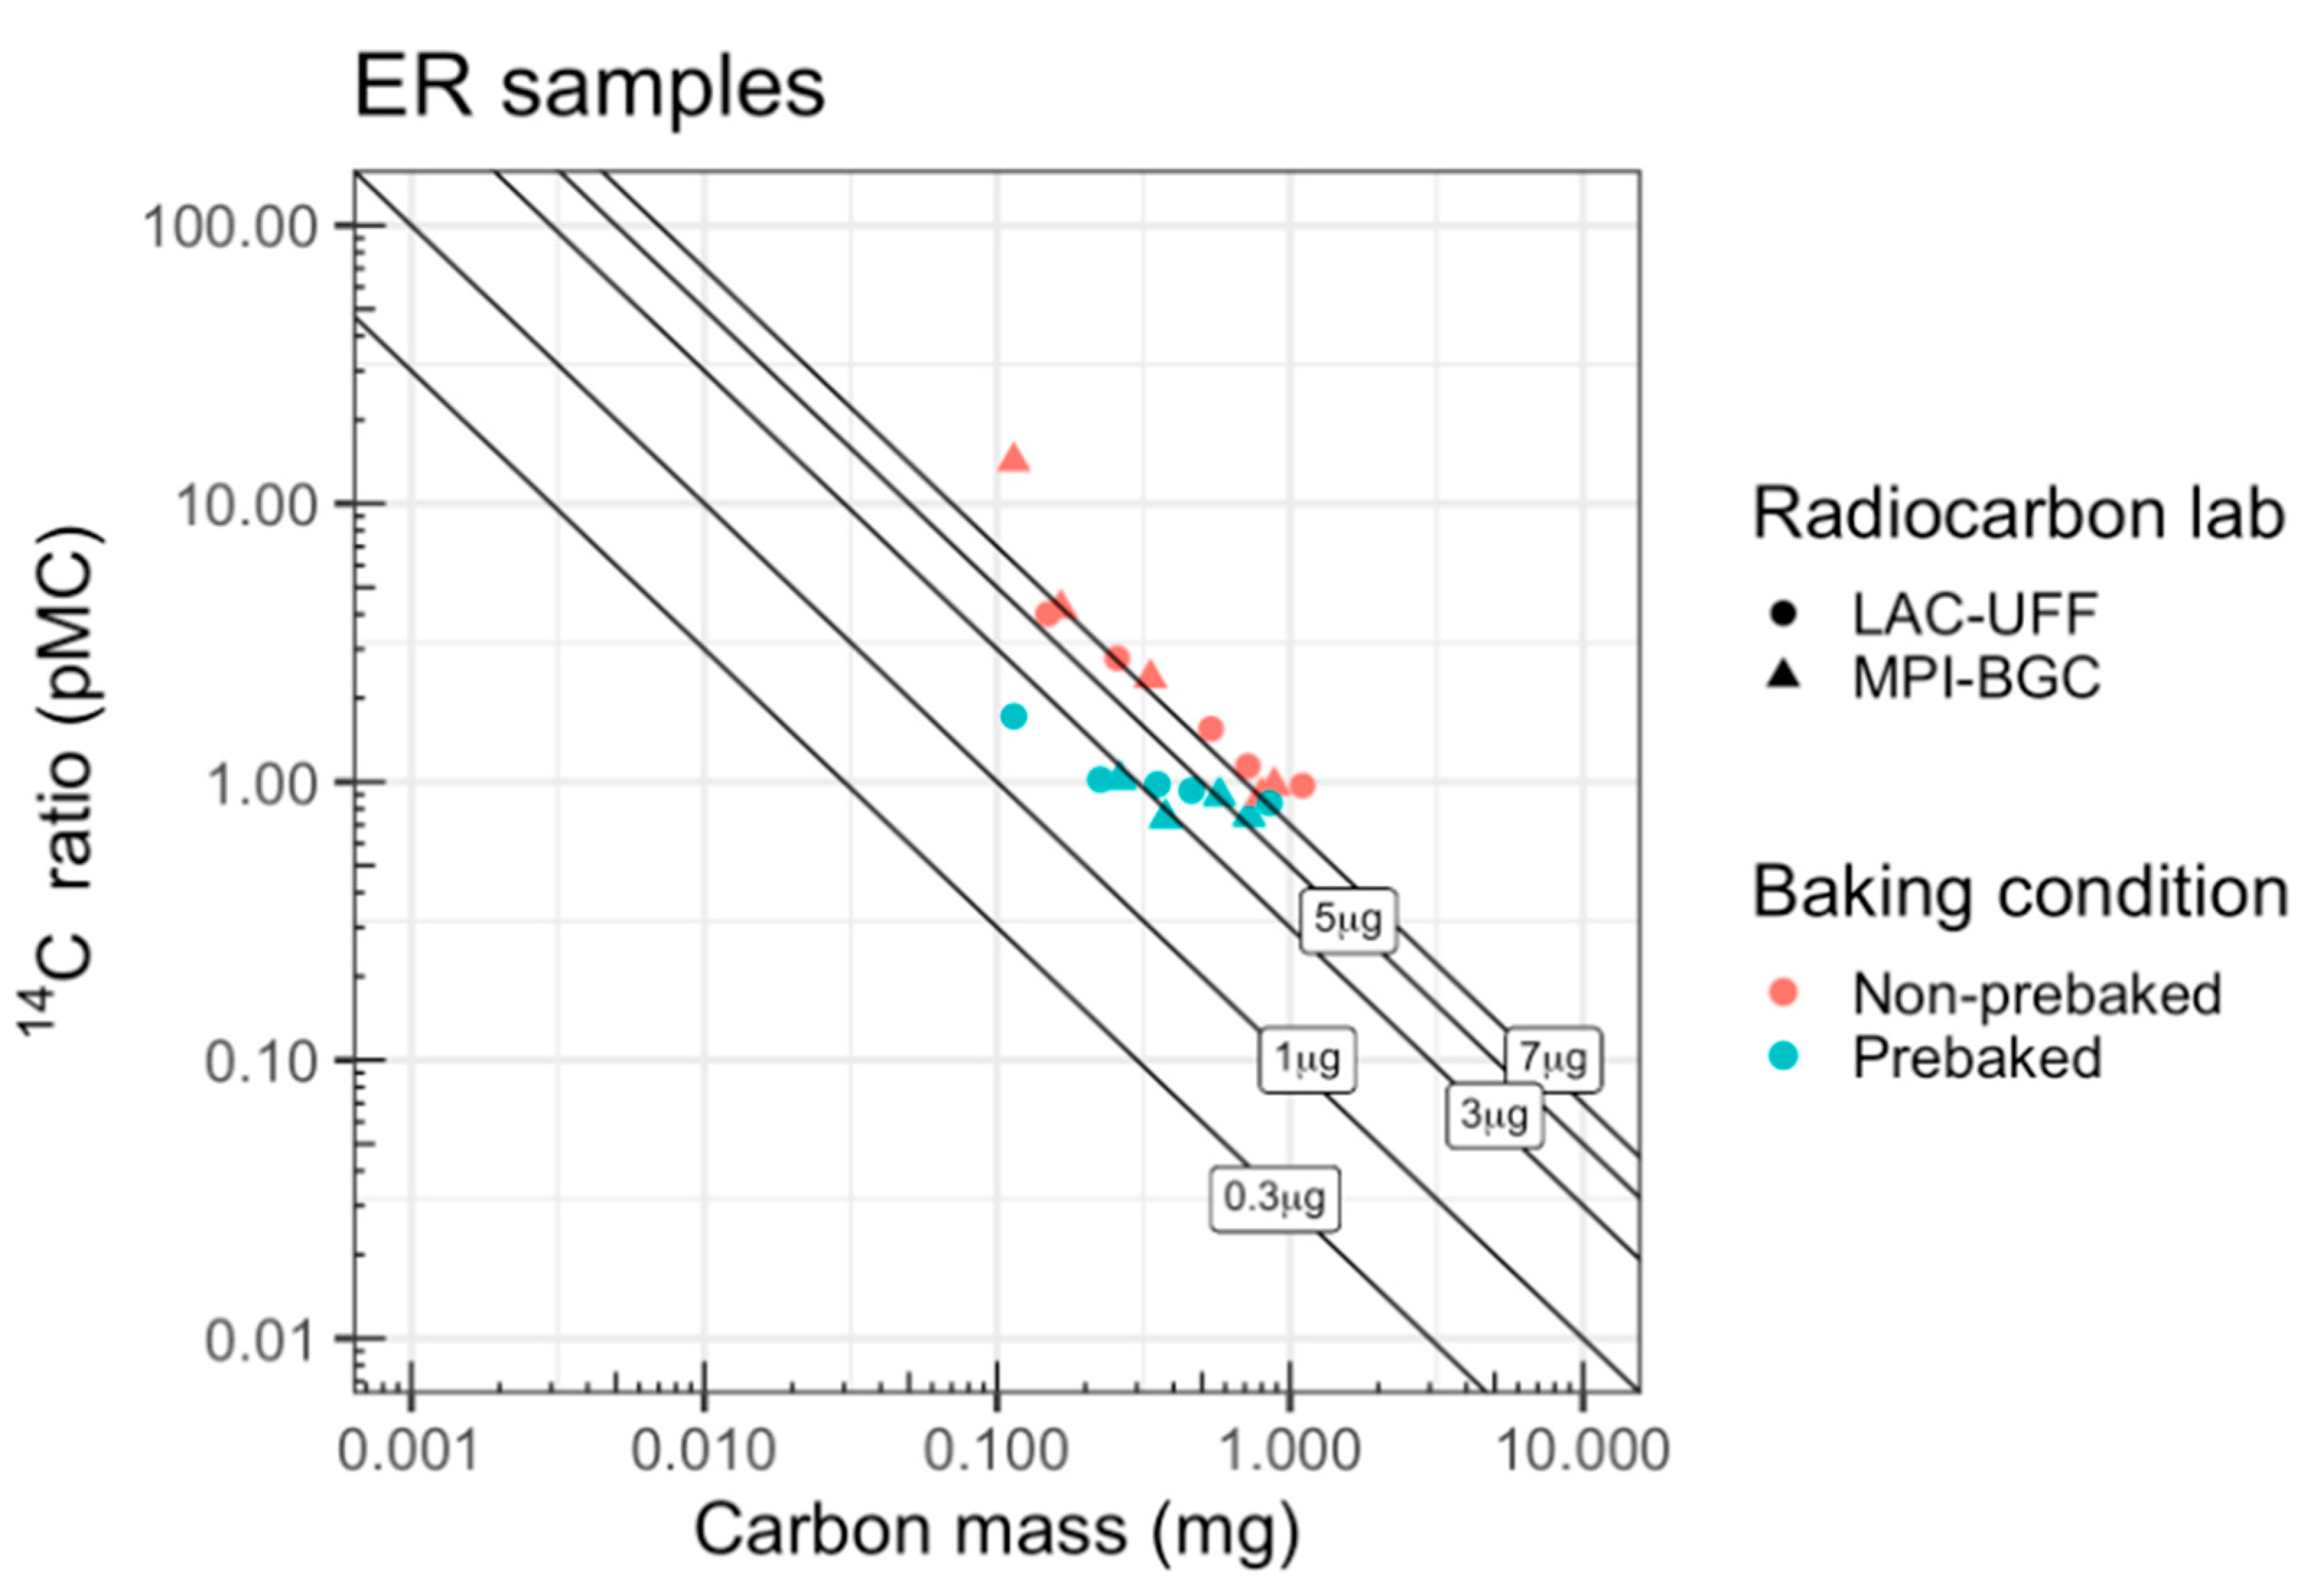
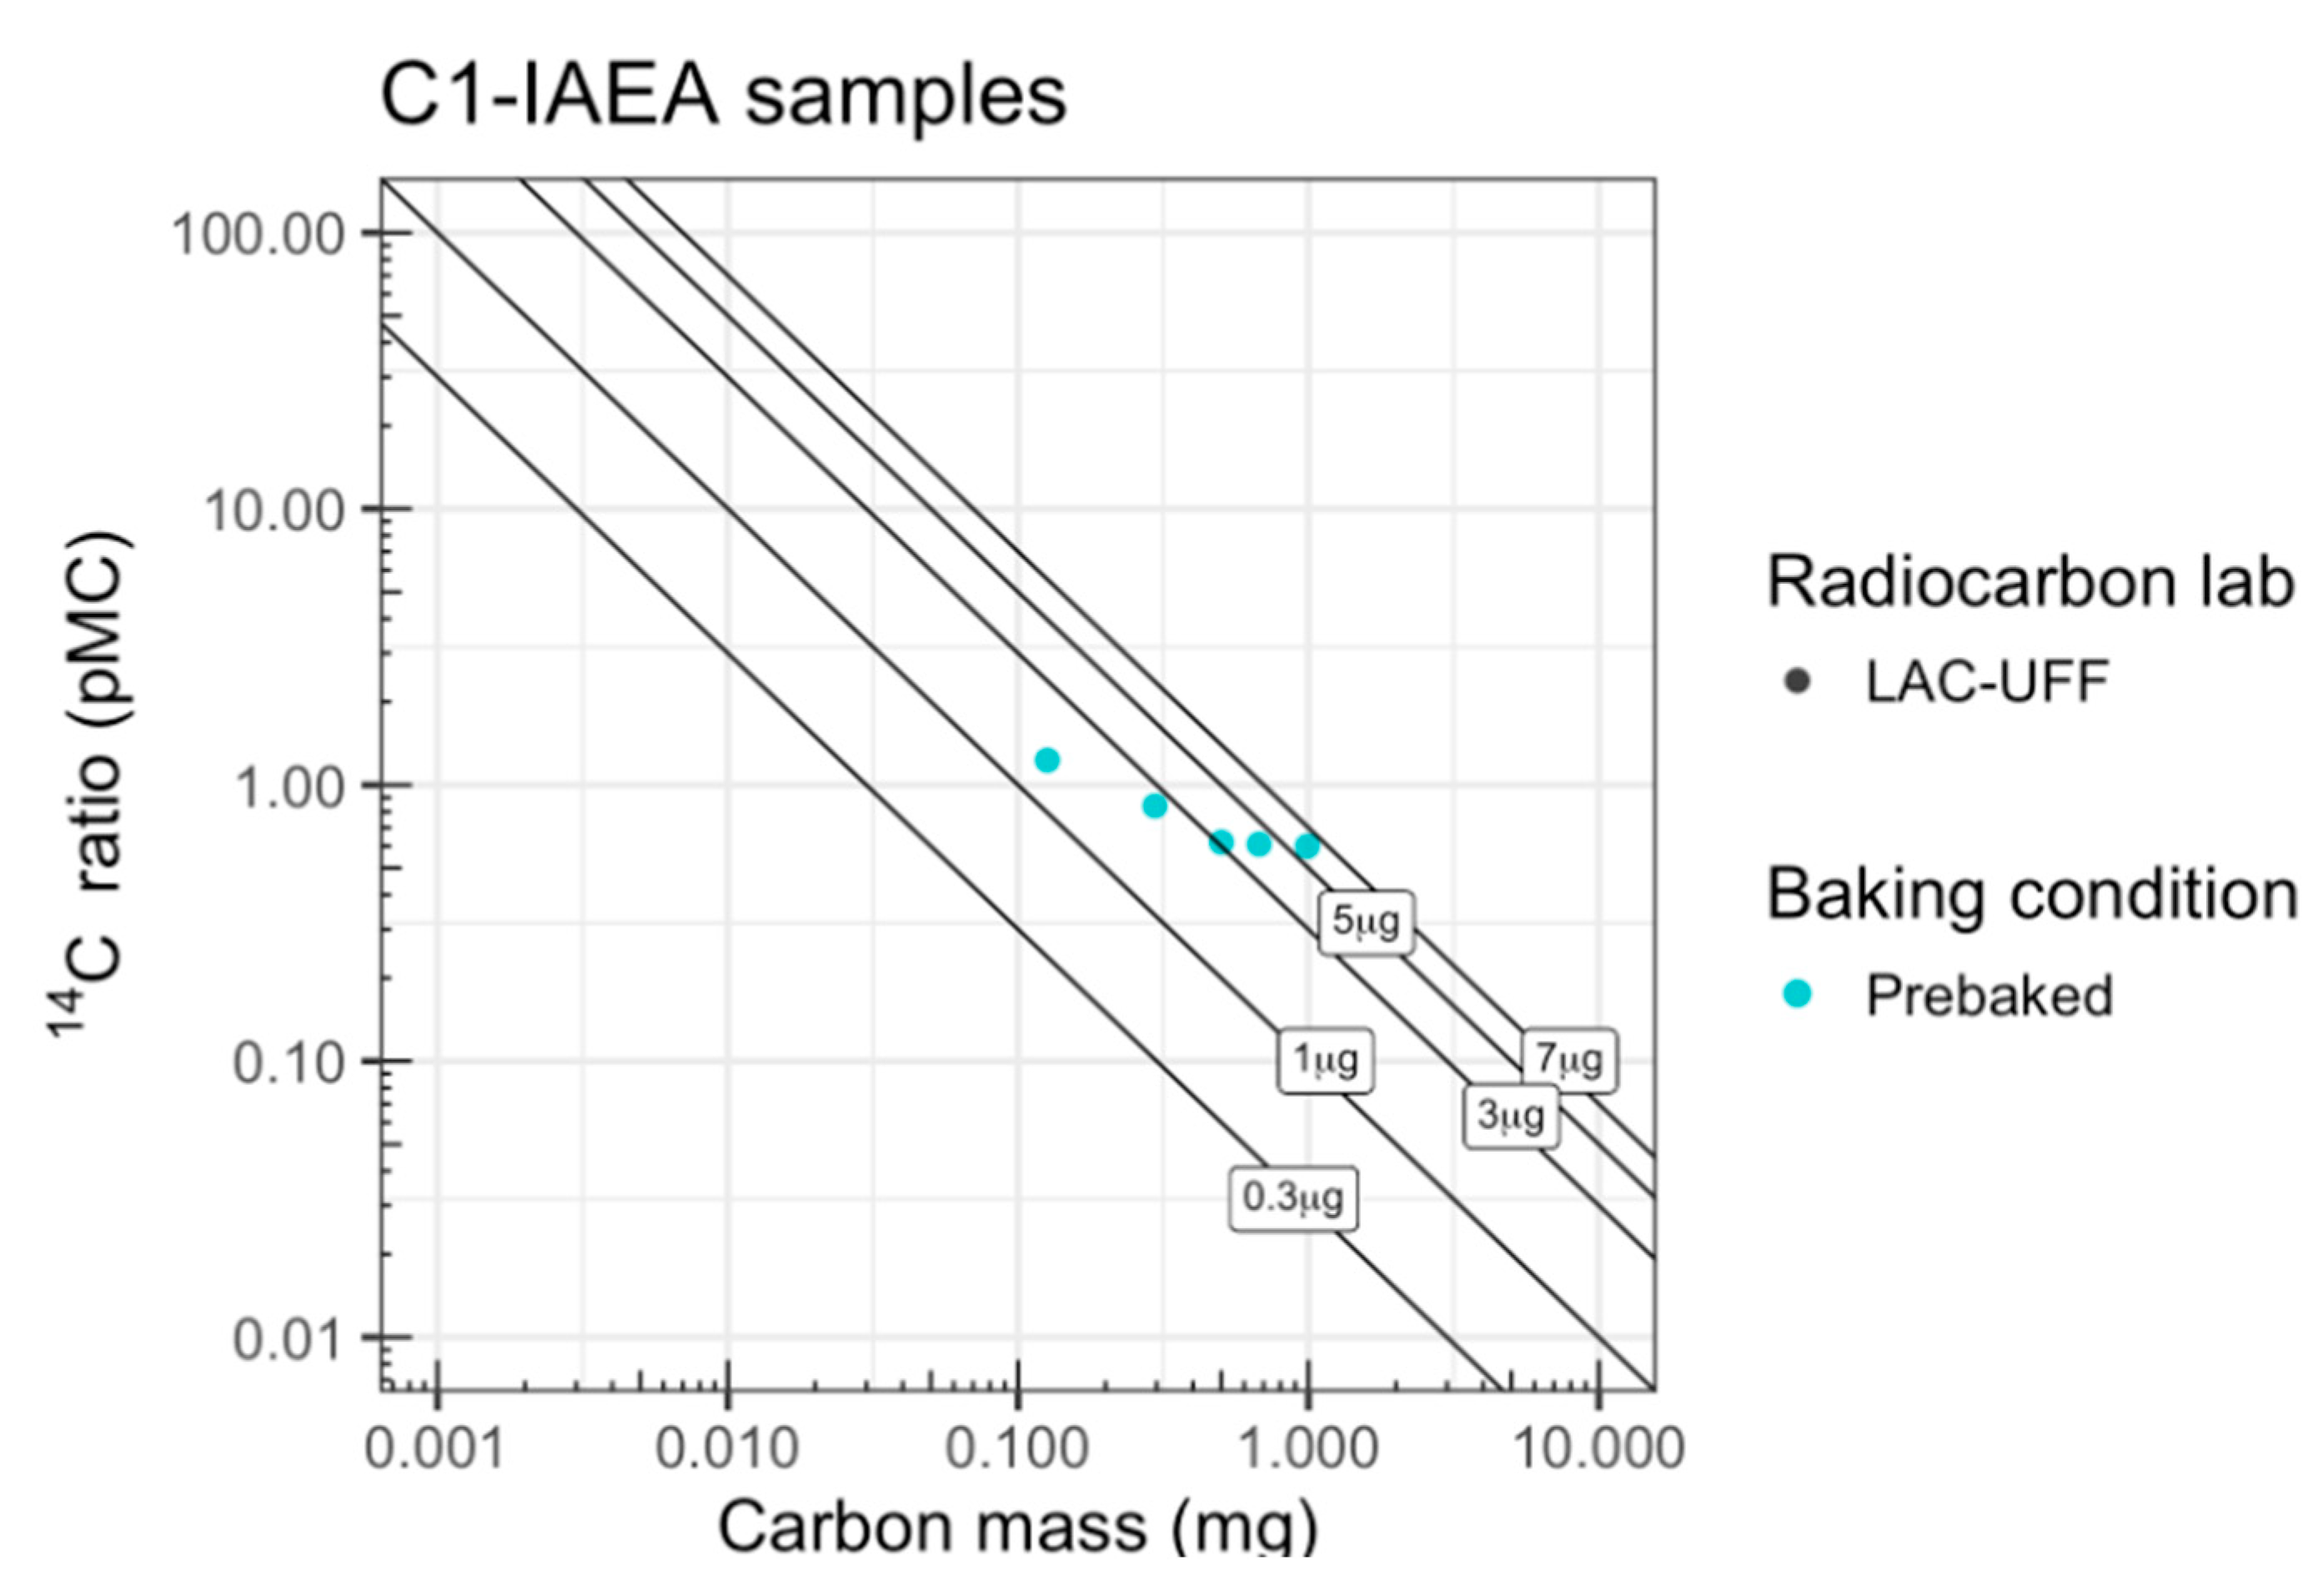
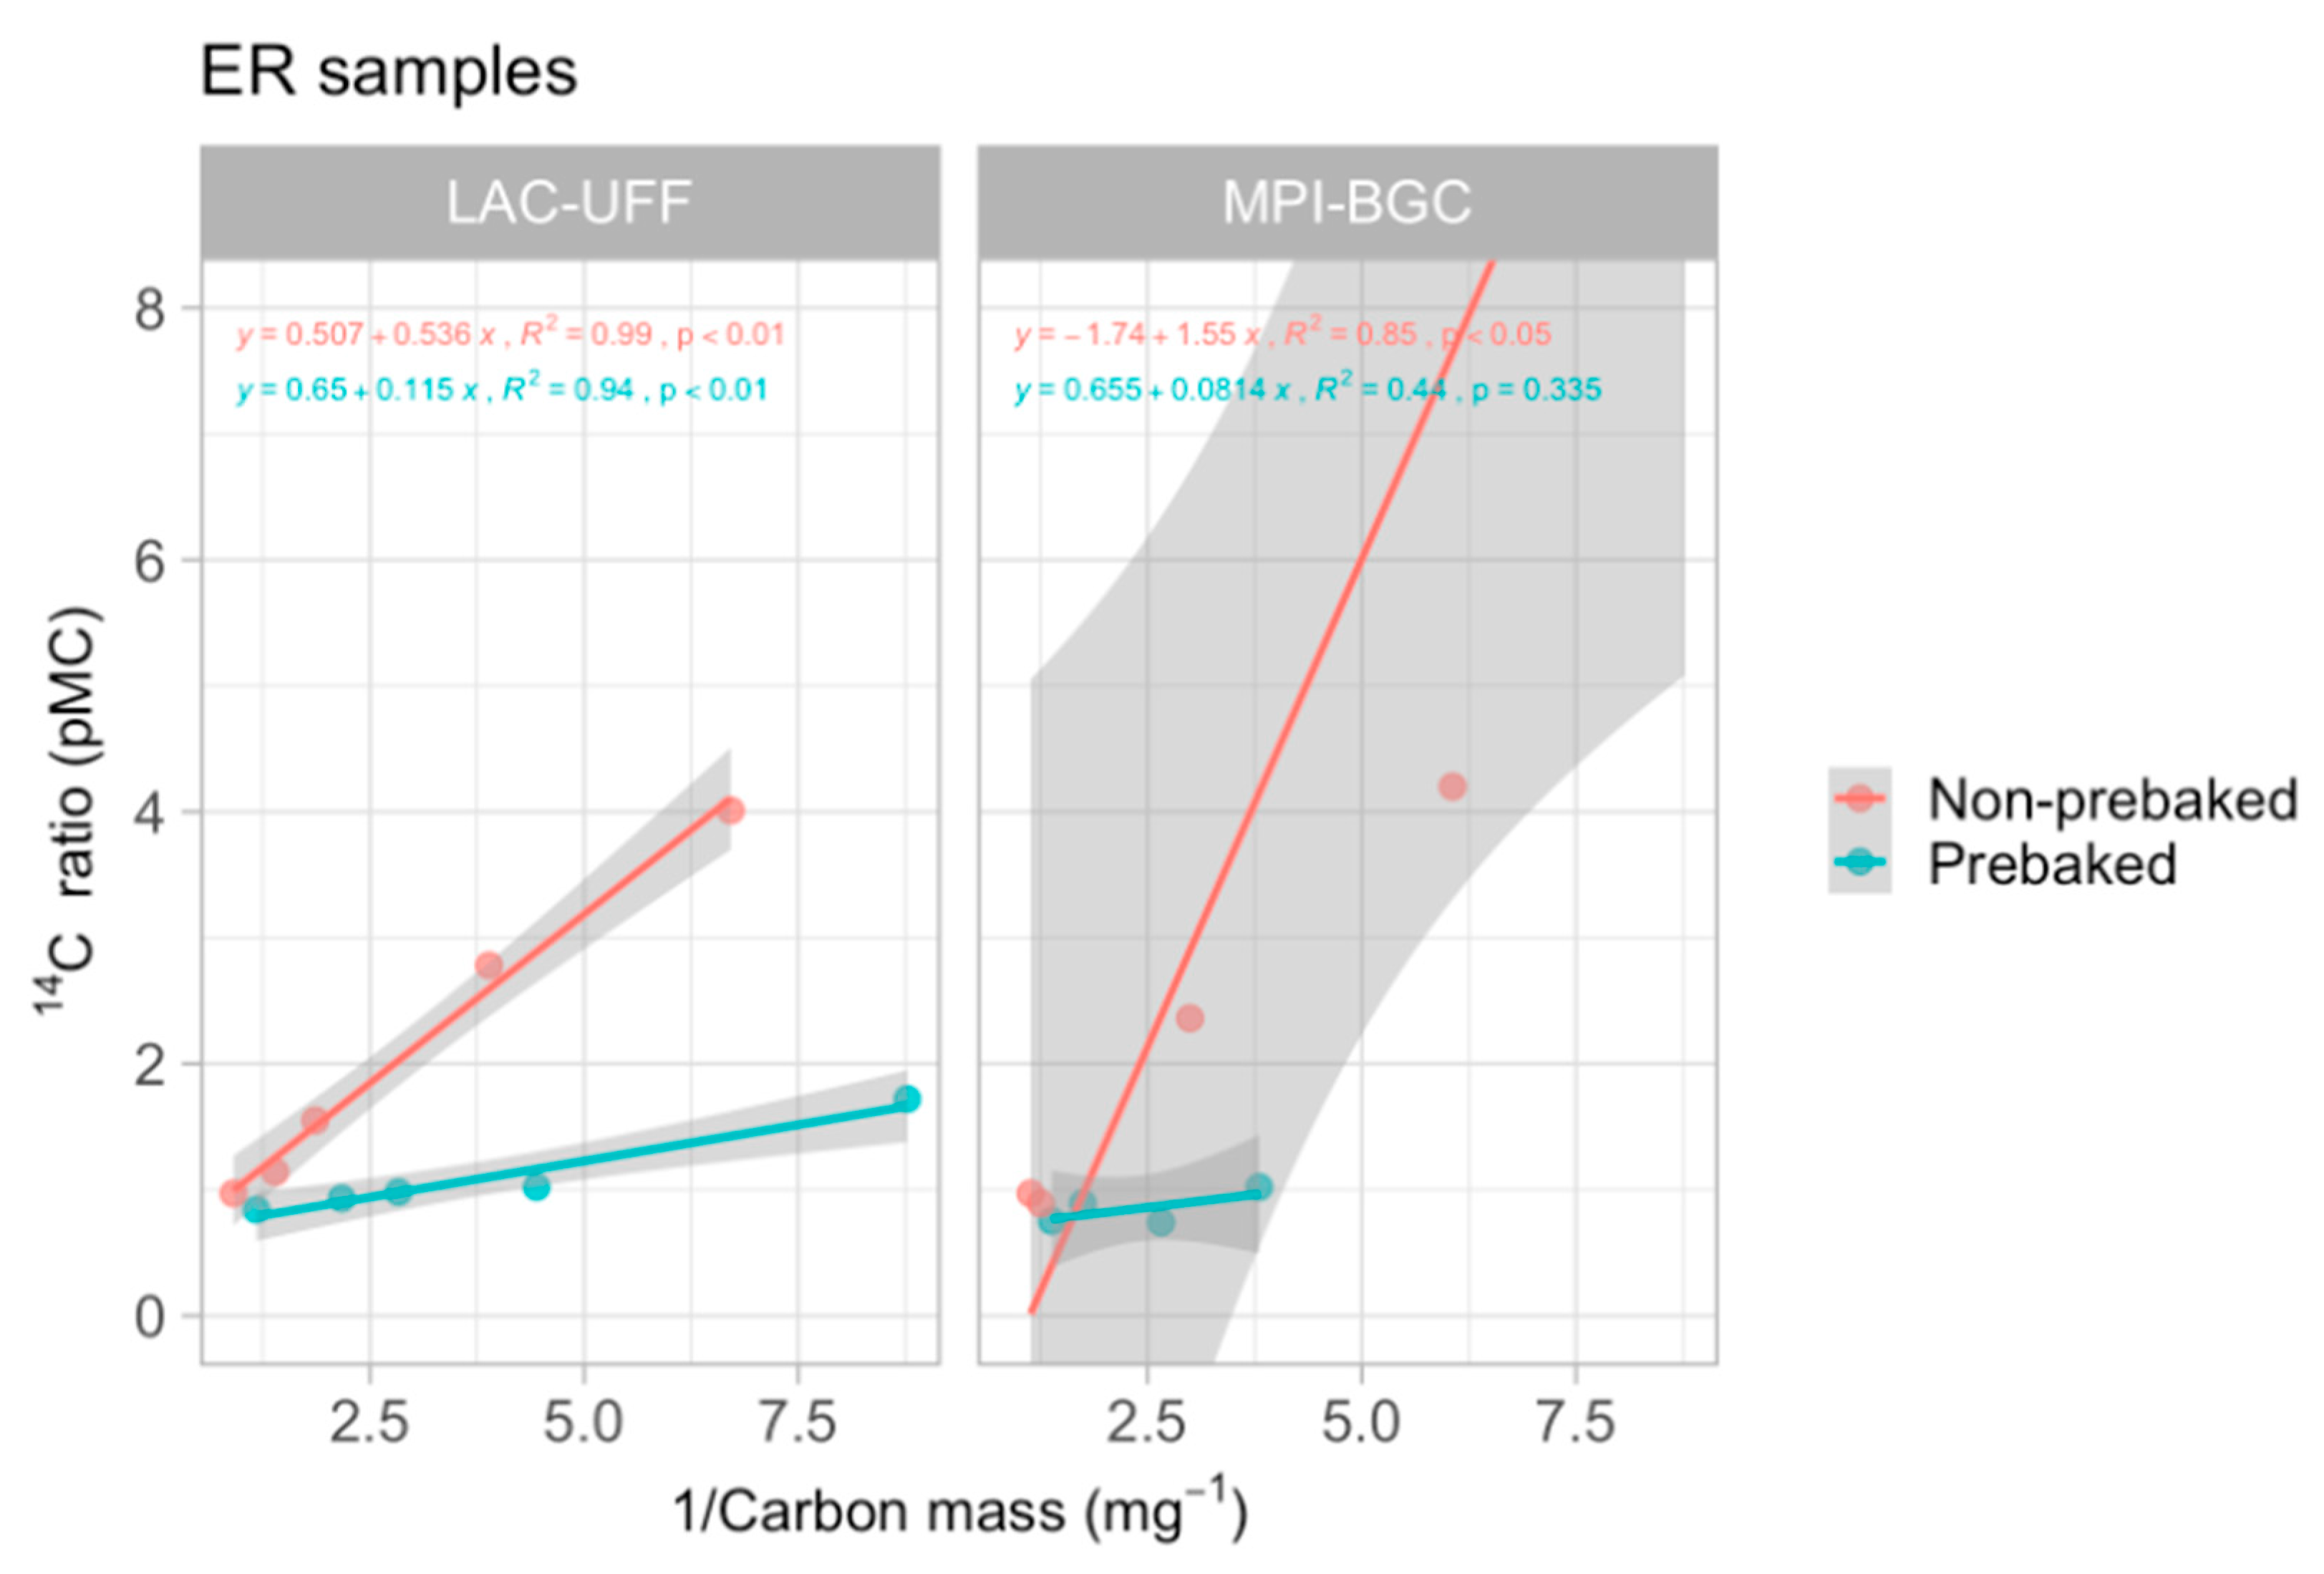
In order to estimate the lower mass limit for carbonate samples to be dated at LAC-UFF, we followed [30] and measured carbonate samples with different amounts of carbon, from our regular sample weight (10 mg of carbonate, if no etching was performed) down to 1 mg. For tracing modern contamination, we first selected two background (14C-free) reference materials: a calcite stone (CA), LAC-UFF background sample; an old calcite sample from Playa Giron, Cuba (ER), which was shown to be 14C-free in a previous study.
Five different initial weights of CA and ER samples were prepared: 1 mg, 3 mg, 5 mg, 7 mg, and 10 mg. Since no etching step was performed, these samples should respectively produce 0.12 mg C, 0.36 mg C, 0.6 mg C, 0.84 mg C, and the regular size of about 1.2 mg C. Samples were placed in septum-sealed 15 mL glass vial tubes and evacuated to below 3 millitorr. Acid hydrolysis was performed by adding 1 mL of 85% phosphoric acid (H3PO4) and left at room temperature overnight. The CO2 gas was purified and graphitized using the optimized method of zinc (Zn)/titanium hydride (TiH2) reduction catalyzed by iron for 7 h at 550 °C [31] in two different types of tubes: prebaked and non-prebaked graphitization tubes (GTs).
As for our earlier protocols, 9 mm OD Pyrex tubes were baked empty, and then reagents (20–25 mg of Zn, 10–15 mg of TiH2, and 3–5 mg of Fe) were added with no further baking. Nevertheless, with the aim of reducing background in the graphitization step, we followed another protocol [30] and baked the tubes after preparation, for 1 h at 300 °C. These tubes were used for CA and ER samples, as well as the current GTs.
Since relative humidity in Rio de Janeiro is quite high all year around (~80%), contamination of reagents during storage can be very relevant. In order to test how long tubes could be stored, four sets of graphitization tubes (GTs) were stored in different conditions: non-prebaked, prebaked and immediately used, prebaked and stored for 7 days, and prebaked and stored for 30 days. In the first group, reagents were added to the tubes and used right away. For the other three groups (different storage times), we prebaked the tubes and stored them in a desiccator containing NaOH pellets (periodically replaced) to minimize the amount of modern carbon to adhere to the reagents. For this test, ~1 mg C from CA samples was used.
After some preliminary results, we decided to try a different background reference material as the AMS result with these samples was still not satisfactory. We then tested IAEA C1 [32,33], which has a pMC value of 0.00. This material had never been used before at LAC-UFF. We prepared the same five initial weights and only used the prebaked GTs to evaluate contamination.
All the samples were prepared and graphitized at LAC-UFF. For the tests with reduced sizes, one set of graphite samples was sent as powder to the Max Planck Institute for Biogeochemistry (MPI-BGC) [34], Germany, to be measured at a MICADAS. Another set of pressed samples was measured using an NEC single-stage accelerator (SSAMS) at Fluminense Federal University. Samples from the desiccator test were pressed and sent to the Radiocarbon Laboratory using the SSAMS at the Australian National University (ANU). Results are given in percentage modern carbon (pMC) values [35].

3. Results

Since our aim was to evaluate the amount of modern contamination, 14C-free materials were used, and results were not corrected for processing background. Results for the regular-sized CA (1 mg C) samples graphitized in tubes with different preparation and storage times are presented in Figure 1 (data can be accessed in Table S1, Supplementary Materials). The red circles represent pMC values obtained for samples using non-prebaked graphitization tubes, while the blue circles represent the prebaked tubes that were stored for different periods of time, up to one month. It is easy to observe the discrepancy among the different protocols, as prebaked tubes showed much less contamination when used immediately after baking. However, baking tubes daily is not viable since it would require a dedicated furnace. For this reason, avoiding contamination during storage is also desirable. Figure 1 shows very little increase in contamination as the tubes were stored for up to a month. However, such results were obtained for regular-sized samples, and one of our most important objectives was to evaluate the effect of contamination for samples of reduced size.
Therefore, the pMC values obtained for different amounts of CA (Figure 2) and ER (Figure 3) samples are presented using prebaked (blue markers and line) and non-prebaked (red markers and line) graphitization tubes. The results are plotted versus the inverse of the carbon mass (m−1), as we expected relative contamination to increase with decreasing sample amount. Figure 2 and Figure 3 confirm this expectation and disclose the enhancement of such pattern for non-prebaked tubes. Figure 4 shows box plots for the distribution of both CA and ER samples measured at LAC-UFF and MPI-BGC, disclosing larger dispersion of results for non-prebaked tubes, in both laboratories.
Figure 5 and Figure 6 present the pMC results for the CA and ER samples, respectively, versus target size (mg), graphitized in prebaked and non-prebaked GTs, measured at LAC-UFF (circles) and MPI-BGC (triangles). Each of the lines represents the expected mass of the modern carbon contamination added to a background sample of variable size.
The pMC values for the IAEA background standard C1 versus sample size (mg) graphitized in prebaked GTs, measured at LAC-UFF, are presented in Figure 7.

4. Discussion

The results showed that the highest background values were obtained for the non-prebaked GTs (higher than 2.0 pMC), while all the prebaked tubes had a much lower background prebaked (lower than 1.1 pMC). For the prebaked GTs, up to one-month storage in the desiccator did not produce any significant changes to the background. Previously, the GTs were not baked with reagents and were stored in a plastic box, being susceptible to the presence of exogenous carbon in graphitization reagents and also to contamination adhered during storage. The baking step has proven to be very helpful for lowering backgrounds for regular-sized samples. For small-sized samples, contamination due to storage conditions was expected to be even more pronounced.
Results for pMC for each reference material using prebaked and non-prebaked GTs showed (Figure 2 and Figure 3), in both cases, increased background values for CA and ER samples with less than 0.5 mg C, as expected. Assuming a constant amount of exogenous material within each sample, for a smaller sample, contamination would result in a more relevant discrepancy. As expected, a linear relationship of increasing contamination with decreasing sample sizes can be observed in Figure 2 and Figure 3, where pMC is plotted against the mass−1 (data can be accessed in Tables S2 and S3, Supplementary Materials). For ER samples, the lower limit of detection was higher than that of CA samples.
The data for both CA and ER (Figure 4) presented a larger dispersion for non-prebaked GTs, evident in both laboratories. For prebaked GTs, the results of both laboratories were lower, with larger dispersion for those measured at LAC-UFF, but similar medium values. Comparing the measurements performed in MPI and LAC-UFF, the results showed no relevant difference.
In order to estimate the amount of contamination added to the sample in each situation and considering this contamination to be from 100% modern carbon, we plotted the results on a log–log scale and compared them to possible amounts of contamination added. In Figure 5, we show the measured pMC of the CA background standard vs. sample size (mg) graphitized in prebaked and non-prebaked GTs, measured by MPI-BGC. Each of the lines represents the mass of the modern carbon contamination added (from 0.3 μg to 7 μg) to a background sample of variable size, from the regular 1 mg C to approximately 0.1 mg C.
Figure 6 shows the same pattern for the pMC of background standard ER samples, vs. sample size (mg) graphitized in prebaked and non-prebaked GTs, measured at LAC-UFF and MPI-BGC. Figure 7 shows the pMC values for the test with IAEA C1 samples graphitized in prebaked GTs. Background levels were improved for both the regular-sized samples (0.5–1 mg C) and the small ones (<0.5 mg C). From the graph, we can infer that, provided that all the contamination was modern, its mass ranged from 7 μg, for non-prebaked GTs, to 3 μg, for pre-baked GTs. Although some unaccountable uncertainties may have originated from the inefficiency of mass measurements, the results showed that a large fraction of the contamination was removed by baking the graphitization tubes with the reagents. This means that part of the contamination introduced to the samples came from the reagents used for graphitization. To improve precision and lower the limit of detection, tests should be performed using the hydrogen graphitization method, where the reduction in carbon dioxide is achieved in the presence of hydrogen gas, instead of TiH2.
Measuring small samples is also a challenge within the accelerator system, since acceptable ion beam current intensities are on the order of 10−5A and targets with very low amounts of carbon may not produce enough current. Our results show that 0.1 mg C samples or 1 mg CaCO3 samples were successfully graphitized at LAC-UFF with the Zn/TiH2 reduction method and measured within the SSAMS system. Currents as low as 10−6A often resulted in larger age uncertainties due to poor statistics but were enough to generate reliable data.
However, it is extremely important that corresponding size background samples are measured in order to properly correct for background contamination [15,33,34]. Moreover, prebaking the GTs before use and storing them in a desiccator are imperative procedures for small-sized samples. Concerning the chemical pre-treatment, the necessity for the etching step and the strength of the acid to be used have to be evaluated on a case-by-case basis, taking into account the presence of contamination and the availability of Foraminifera specimens.
On the basis of the results of this work, it will be possible to date Foraminifera samples with a few mg, giving us the opportunity to choose individuals from specific species and study 14C incorporation by different taxa.

5. Conclusions

Baking prepared reaction tubes at 300 °C for one hour before use confirmed improvements in background achieved for graphite produced by the sealed tube Zn/TiH2 reduction method. Moreover, GT storage for up to one month in a desiccator with NaOH showed no relevant increase in backgrounds. The contamination tests with decreasing sample size pointed to the need for a purer 14C dead background standard. We then replaced our carbonate background reference with IAEA C1, achieving the lowest values. For 0.1 mg C samples, i.e., approximately 1 mg of CaCO3, in the case of Foraminifera samples, the LAC-UFF AMS system can produce high enough currents to allow accurate measurements, provided that C contaminations can be estimated and corrected. The developments presented in this work allow for the study of species-specific Foraminifera samples. For decreasing sample size and achieving more precise measurements, more tests should be performed using hydrogen for graphitization.

Supplementary Materials

The following supporting information can be downloaded at: https://www.mdpi.com/article/10.3390/geographies3030030/s1, Table S1: pMC values (uncorrected) for regular-sized CA background samples using graphitization tubes stored in different conditions; Table S2: Sample sizes and pMC results for all tested sample materials, using prebaked GT; Table S3: Sample sizes and pMC results for all tested sample materials, using non-prebaked GT.

Author Contributions

Conceptualization, B.M.N., K.D.M. and M.D.; methodology, B.M.N., A.A. and M.D.; software, M.D.; formal analysis, B.M.N.; resources, B.M.N., K.D.M. and I.C.; writing—original draft preparation, B.M.N., K.D.M., A.A., M.D. and I.C.; writing—review and editing, B.M.N., K.D.M., S.J.F., X.X. and C.C.; supervision, K.D.M.; project administration, K.D.M.; funding acquisition, K.D.M. and C.C. All authors have read and agreed to the published version of the manuscript.

Funding

This research was funded by CNPq (Conselho Nacional de Desenvolvimento Científico e Tecnológico grant number 305079/2014-0 and INCT-FNA grant number 464898/2014-5 and FAPERJ (Fundação Carlos Chagas Filho de Amparo à Pesquisa do Estado do Rio de Janeiro, grant number E-26/110.138/2014. This study was financed in part by the Coordenação de Aperfeiçoamento de Pessoal de Nível Superior—Brasil (CAPES)—Finance Code 001.

Data Availability Statement

All data are in Supplementary Material.

Acknowledgments

The authors are grateful for the comments and suggestions from Carlos Sierra and Axel Steinhof. The authors would like to thank the Australian National University, and the Max Plank Institute for Biogeochemistry for their support.

Conflicts of Interest

The authors declare no conflict of interest.

References

  1. Hedges, R.E. Progress in radiocarbon dating. Sci. Prog. 1933, 1985, 409–427. [Google Scholar]
  2. Hajdas, I.; Ascough, P.; Garnett, M.H.; Fallon, S.J.; Pearson, C.L.; Quarta, G.; Spalding, K.L.; Yamaguchi, H.; Yoneda, M. Radiocarbon dating. Nat. Rev. Methods Primers 2021, 1, 62. [Google Scholar]
  3. Moreira, V.; Macario, K.; Guimarães, R.; Dias, F.; Araujo, J.; Jesus, P.; Douka, K. Aragonite Fraction Dating of Vermetids in the Contex of Paleo Sea-Level Curves Reconstruction. Radiocarbon 2020, 62, 335–348. [Google Scholar] [CrossRef]
  4. Alves, E.Q.; Macario, K.; Ascough, P.; Ramsey, C.B. The Worldwide Marine Radiocarbon Reservoir Effect: Definitions, Mechanisms, and Prospects. Rev. Geophys. 2018, 56, 278–305. [Google Scholar] [CrossRef]
  5. Gupta, B.K. (Ed.) Modern Foraminifera; Kluwer Academic Publishers: Dordrecht, Germany, 1999. [Google Scholar]
  6. Dolman, A.M.; Groeneveld, J.; Mollenhauer, G.; Ho, S.L.; Laepple, T. Estimating Bioturbation from Replicated Small-Sample Radiocarbon Ages. Paleoceanogr. Paleoclimatol. 2021, 36, e2020PA004142. [Google Scholar] [CrossRef]
  7. Magana, A.L.; Southon, J.R.; Kennett, J.P.; Roark, E.B.; Sarnthein, M.; Stott, L.D. Resolving the cause of large differences between deglacial benthic foraminifera radiocarbon measurements in Santa Barbara Basin. Paleoceanography 2010, 25, PA4102. [Google Scholar] [CrossRef]
  8. Missiaen, L.; Wacker, L.; Lougheed, B.C.; Skinner, L.; Hajdas, I.; Nouet, J.; Pichat, S.; Waelbroeck, C. Radiocarbon Dating of Small-sized Foraminifer Samples: Insights into Marine sediment Mixing. Radiocarbon 2020, 62, 313–333. [Google Scholar] [CrossRef]
  9. Dias-Brito, D. A micropaleontologia na indústria do petróleo. Rev. Bras. Geociências 1989, 19, 256–259. [Google Scholar] [CrossRef]
  10. Petró, S.M.; Pivel, M.A.G.; Coimbra, J.C. Implicações da dissolução de carbonato de cálcio pelágico em reconstruções paleoceanográficas do Quaternário. Quat. Environ. Geosci. 2016, 7, 14–25. [Google Scholar]
  11. Pearson, A.; McNichol, A.P.; Schneider, R.J.; von Reden, K.F.; Zheng, Y. Microscale 14C AMS measurement at NOSAMS. Radicarbon 1998, 40, 61–75. [Google Scholar] [CrossRef]
  12. Schleicher, M.; Grootes, P.M.; Nadeau, M.-J.; Schoon, A. The Carbonate 14C Background and its Components at the Leibniz AMS Facility. Radiocarbon 1997, 40, 85–93. [Google Scholar] [CrossRef]
  13. Hua, Q.; Jacobsen, G.E.; Zoppi, U.; Lawson, E.M.; Williams, A.A.; Smith, A.M.; McGann, M.J. Progress in radiocarbon tar-get preparation at the ANTARES AMS Centre. Radiocarbon 2001, 43, 275–282. [Google Scholar] [CrossRef]
  14. Santos, G.M.; Moore, R.B.; Southon, J.R.; Griffin, S.; Hinger, E.; Zhang, D. AMS 14C Sample Preparation at the KCCAMS/UCI Facility: Status Report and Performance of Small Samples. Radiocarbon 2007, 49, 255–269. [Google Scholar] [CrossRef]
  15. Santos, G.M.; Southon, J.R.; Griffin, S.; Beaupre, S.R.; Druffel, E.R.M. Ultra small-mass AMS 14C sample preparation and analyses at KCCAMS/UCI facility. Nucl. Instrum. Methods Phys. Res. B 2007, 259, 293–302. [Google Scholar] [CrossRef]
  16. Ruff, M.; Szidat, S.; Gäggeler, H.W.; Suter, M.; Synal, H.; Wacker, L. Gaseous radiocarbon measurements of small samples. Nucl. Instrum. Methods Phys. Res. B 2010, 268, 790–794. [Google Scholar] [CrossRef]
  17. Smith, A.M.; Yang, B.; Hua, Q.; Mann, M. Laser-Heated Microfurnace: Gas Analysis and Graphite Morphology. Radiocarbon 2010, 52, 769–782. [Google Scholar] [CrossRef]
  18. Delqué-Količ, E.; Comby-Zerbino, C.; Ferkane, S.; Moreau, C.; Dumoulin, J.; Caffy, I.; Souprayen, C.; Quilès, A.; Bavay, D.; Hain, S.; et al. Preparing and measuring ultra-small radiocarbon samples with the ARTEMIS AMS facility in Saclay, France. Nucl. Instrum. Methods Phys. Res. Sect. B Beam Interact. Mater. At. 2013, 294, 189–193. [Google Scholar] [CrossRef]
  19. Yokoyama, Y.; Koizumi, M.; Matsuzaki, H.; Miyairi, Y.; Ohkouchi, N. Developing Ultra Small-Scale Radiocarbon Sample Measurement at the University of Tokyo. Radiocarbon 2010, 52, 310–318. [Google Scholar] [CrossRef]
  20. Uchida, M.; Shibata, Y.; Yoneda, M.; Kobayashi, T.; Morita, M. Technical progress in AMS microscale radiocarbon analysis. Nucl. Instrum. Methods Phys. Res. Sect. B Beam Interact. Mater. At. 2004, 223, 313–317. [Google Scholar] [CrossRef]
  21. Wacker, L.; Fahrni, S.; Hajdas, I.; Molnar, M.; Synal, H.-A.; Szidat, S.; Zhang, Y. A versatile gas interface for routine radiocarbon analysis with a gas ion source. Nucl. Instrum. Methods Phys. Res. Sect. B Beam Interact. Mater. At. 2013, 294, 315–319. [Google Scholar] [CrossRef]
  22. Szidat, S.; Vogel, E.; Gubler, R.; Lösch, S. Radiocarbon Dating of Bones at the LARA Laboratory in Bern, Switzerland. Radiocarbon 2014, 59, 831–842. [Google Scholar] [CrossRef]
  23. Walter, S.R.S.; Gagnon, A.R.; Roberts, M.L.; McNichol, A.P.; Gaylord, M.C.L.; Klein, E. Ultra-small graphitization reactors for ultra-microscale 14C analysis of the National Ocean Sciences Accelerator Mass Spectrometry (NOSAMS) facility. Radiocarbon 2015, 57, 109–122. [Google Scholar] [CrossRef]
  24. Wacker, L.; Bonani, G.; Friedrich, M.; Hajdas, I.; Kromer, B.; Němec, M.; Ruff, M.; Suter, M.; Synal, H.-A.; Vockenhuber, C. MICADAS: Routine and High-Precision Radiocarbon Dating. Radiocarbon 2010, 52, 252–262. [Google Scholar] [CrossRef]
  25. Ruff, M.; Fahrni, S.; Gäggeler, H.W.; Hajdas, I.; Suter, M.; Synal, H.A.; Szidat, S.; Wacker, L. On-line radiocarbon meas-urements of small samples using elemental analyzer and MICADAS gas ion source. Radiocarbon 2010, 52, 1645–1656. [Google Scholar] [CrossRef]
  26. Wacker, L.; Lippold, J.; Molnár, M.; Schulz, H. Towards radiocarbon dating of single foraminifera with a gas ion source. Nucl. Instrum. Methods Phys. Res. Sect. B Beam Interact. Mater. At. 2013, 294, 307–310. [Google Scholar] [CrossRef]
  27. Gottschalk, J.; Szidat, S.; Michel, E.; Mazaud, A.; Salazar, G.; Battaglia, M.; Lippold, J.; Jaccard, S.L. Radiocarbon Measurements of Small-Size Foraminiferal Samples with the Mini Carbon Dating System (MICADAS) at the University of Bern: Implications for Paleoclimate Reconstructions. Radiocarbon 2018, 60, 469–491. [Google Scholar] [CrossRef]
  28. Mueller, K.; Muzikar, P. Quantitative study of contamination effects in AMS 14C sample processing. Nucl. Instrum. Methods Phys. Res. Sect. B Beam Interact. Mater. At. 2002, 197, 128–133. [Google Scholar] [CrossRef]
  29. Von Reden, K.F.; McNichol, A.P.; Pearson, A.; Schneider, R.J. 14C measurements of <100 µg samples with a high-current system. Radiocarbon 1998, 40, 247–253. [Google Scholar]
  30. Khosh, M.S.; Xu, X.; Trumbore, S.E. Small-mass graphite preparation by sealed tube zinc reduction method for AMS 14C measurements. Nucl. Instrum. Methods Phys. Res. Sect. B Beam Interact. Mater. At. 2010, 268, 927–930. [Google Scholar] [CrossRef]
  31. Xu, X.; Trumbore, S.E.; Zheng, S.; Southon, J.R.; Mc Duffee, K.E.; Luttgen, M.; Liu, J.C. Modifying a sealed tube zinc reduction method for preparation of AMS graphite targets: Reducing background and attaining high precision. Nucl. Instrum. Methods Phys. Res. B 2007, 259, 320–329. [Google Scholar] [CrossRef]
  32. Rozanski, K. Consultants’ Group Meeting on 14C Reference Materials for Radiocarbon Laboratories, Vienna, Austria, 18–20 February 1991; Internal Report; IAEA: Vienna, Austria, 1991. [Google Scholar]
  33. Rozanski, K.; Stichler, W.; Gonfiantini, R.; Scott, E.M.; Beukens, R.P.; Kromer, B.; van der Plicht, J. Tha IAEA 14C intercomparison exercise. Radiocarbon 1992, 34, 506–519. [Google Scholar] [CrossRef]
  34. Steinhof, A.; Adamiec, G.; Gleixner, G.; Van Klinken, G.J.; Wagner, T. The new 14C analysis laboratory in Jena, Germany. Radiocarbon 2004, 46, 51–58. [Google Scholar] [CrossRef]
  35. Stuiver, M.; Polach, H.A. Discussion reporting of 14C data. Radiocarbon 1977, 19, 355–363. [Google Scholar] [CrossRef]
Figure 1. Comparison of pMC values obtained for regular-sized CA background samples using graphitization tubes non-prebaked (red circles) vs. prebaked (blue circles) that had been stored during different periods of time.
Geographies 03 00030 g001
Figure 2. pMC values obtained for different sizes of CA samples using prebaked (blue markers and line) and non−prebaked (red markers and line) graphitization tubes.
Geographies 03 00030 g002
Figure 3. pMC values obtained for different amounts of ER samples using prebaked and non−prebaked graphitization tubes.
Geographies 03 00030 g003
Figure 4. Box plots for the distribution of both CA and ER samples measured at LAC−UFF and MPI−BGC.
Geographies 03 00030 g004
Figure 5. pMC of background standard CA vs. sample size (mg) graphitized by prebaked and non-prebaked GTs, measured at LAC−UFF (circles) and MPI−BGC (triangles). Each of the lines represents the calculated mass of the modern carbon contamination added to a background sample of variable size.
Geographies 03 00030 g005
Figure 6. pMC of background standard ER vs. sample size (mg) graphitized in prebaked and non−prebaked GTs, measured at LAC−UFF (circles) and MPI−BGC (triangles). Each of the lines represents the mass of the modern carbon contamination added to a background sample of variable size.
Geographies 03 00030 g006
Figure 7. pMC of background standard C1 vs. sample size (mg) graphitized in prebaked GTs, measured at LAC−UFF.
Geographies 03 00030 g007
Disclaimer/Publisher’s Note: The statements, opinions and data contained in all publications are solely those of the individual author(s) and contributor(s) and not of MDPI and/or the editor(s). MDPI and/or the editor(s) disclaim responsibility for any injury to people or property resulting from any ideas, methods, instructions or products referred to in the content.

